


Abstract
This study examines how the quality of corporate environmental information disclosure, jointly with governance structure characteristics, shapes the input–output efficiency of green innovation in Chinese A-share listed firms, and whether industry- and region-level conditions moderate that relationship. Drawing on a panel of 2847 firms spanning 2014–2024, we construct a multidimensional disclosure quality index through content analysis across completeness, verifiability, quantification depth, and forward-looking commitment, and measure green innovation efficiency through a super-efficiency slacks-based DEA model accommodating undesirable outputs. A three-level hierarchical linear model partitions variance across firm, industry, and provincial layers and permits the disclosure–efficiency slope to vary with industry regulation intensity and provincial marketization. The results indicate that higher disclosure quality is associated with greater green innovation efficiency, a link we attribute to financing-constraint relief, reputational accumulation, and intensified external monitoring, offered as interpretive channels rather than as separately tested mediators. Board independence, environmentally experienced executives, and institutional shareholding amplify the conversion, while ownership concentration dampens it. Cross-level evidence shows that industry regulation intensity and regional marketization further steepen the firm-level slope. Findings remain stable across alternative measurement, restricted sampling, propensity score matching, and instrumental variable identification. The analysis offers a multilevel reframing of disclosure–innovation research and informs the design of mandatory disclosure rules, governance reform, and green finance infrastructure in transitioning economies.
1. Introduction
The intensification of climate-related risks since the Paris Agreement has pressured firms worldwide to widen the scope and depth of their environmental reporting, with disclosure now treated less as voluntary citizenship and more as a quasi-regulatory expectation [1]. Stock exchanges across more than sixty jurisdictions have issued sustainability reporting guidance, and the consolidation of ISSB standards in 2023 marked a turning point toward comparable, decision-useful environmental data [2]. Within this evolving landscape, Chinese listed firms occupy a distinctive position. They face both the national “dual-carbon” pledge—peaking carbon emissions before 2030 and reaching neutrality by 2060—and a fragmented disclosure regime that until recently relied on voluntary CSR reports [3]. The Ministry of Ecology and Environment’s 2021 measures, together with the 2024 mandatory sustainability disclosure rules issued by the three major stock exchanges, have begun to reshape what counts as credible environmental information. Evidence from China’s earlier 2008 mandatory CSR reporting policy indicates that such mandates can measurably raise firms’ substantive environmental response, including green innovation performance [4].
Green innovation has emerged as the principal mechanism through which firms reconcile growth ambitions with decarbonization commitments. Unlike conventional R&D, green innovation embeds environmental constraints into the production function itself, generating dual externalities—knowledge spillovers and pollution abatement—that markets price imperfectly [5]. For Chinese manufacturers in particular, the transition demands not only more green R&D spending but also higher conversion efficiency from inputs to patentable outcomes [6]. The efficiency dimension is where most firms struggle: aggregate green patent filings have surged, yet output-to-input ratios remain uneven across industries and provinces [7].
Three strands of literature speak to this puzzle but rarely converge. The first examines whether environmental disclosure quality, measured by GRI compliance, third-party assurance, or text-based readability, alters firms’ real environmental behavior; findings lean positive but vary considerably with the measurement instrument chosen [8]. The second strand probes governance characteristics—board independence, the presence of environmental committees, executive green-pay sensitivity, ownership concentration—and links them to innovation outcomes [9]. Dual-class structures, state ownership, and institutional investor horizons all surface as moderators of green strategy [10]. A third strand quantifies green innovation efficiency through DEA, SFA, or Malmquist–Luenberger indices, often comparing regions or industries without modeling firm-level heterogeneity explicitly [11]. What is striking is how little these strands agree once their findings are placed side by side. The disclosure strand reports effect signs that swing from strongly positive to null depending on whether disclosure is captured as a binary report dummy or a graded content score, a divergence that is almost certainly a measurement artifact rather than a substantive disagreement. The governance strand splits along institutional lines: studies set in common-law markets tend to read concentrated ownership as patient stewardship, whereas China-based work more often reads it as entrenchment, so the moderating sign reverses across settings. The efficiency strand, by operating at whichever single level the data happen to be aggregated, produces region- and industry-level conclusions that need not hold at the firm level at all. Seen together, these are not three parallel literatures, but three sources of unresolved tension, and it is precisely the cross-level, measurement-graded design adopted here that lets us adjudicate among them rather than add a fourth disconnected result.
What unsettles us about the current body of work is its treatment of measurement and data structure. Disclosure quality is frequently proxied by a single binary indicator—whether a CSR report is issued—collapsing substantial variation in content credibility [12]. Green innovation efficiency studies tend to operate at one analytic layer (firm, industry, or region) even though the data-generating process is unambiguously nested: firms are embedded in industries shaped by competitive dynamics and regulatory pressure, while industries are themselves embedded in regional institutional environments [13]. Pooled OLS or single-level fixed-effects estimators absorb but do not decompose this clustering, leaving cross-level interactions—how regional environmental enforcement amplifies the disclosure–innovation link, for instance—largely unidentified. Recent contributions have flagged this concern, yet few move beyond two-way clustering toward formal multilevel specifications [14].
A second gap concerns mechanism identification. Most empirical work documents an average association between disclosure and innovation outcomes without separating the variance attributable to firm-level governance from that absorbed by industry technology cycles or provincial green-finance pilots. When the dependent variable is itself a ratio—innovation output over innovation input—failing to model random effects at each level can bias both slope estimates and their standard errors [15]. We see this as an opening rather than a flaw to be patched.
Against this background, our study asks how the quality of corporate environmental information disclosure, jointly with governance structure characteristics, shapes the input–output efficiency of green innovation in Chinese listed firms and whether industry- and region-level conditions moderate that relationship. Hierarchical linear modeling (HLM) is brought in deliberately: it partitions variance across firm, industry, and provincial layers; permits random slopes for disclosure quality across industries; and accommodates cross-level interactions between, say, firm-level disclosure scores and provincial environmental court density. A sample of A-share manufacturing firms covering the full 2014–2024 window supports the empirical work, with disclosure quality scored through a multidimensional text-and-content rubric and green innovation efficiency computed through a super-SBM model that accounts for undesirable outputs. We retain this eleven-year window consistently across the abstract, methods, and conclusions; where a shorter 2017–2024 horizon appears later, it denotes a deliberately restricted robustness subsample rather than the main panel.
Three contributions follow, and we want to be explicit that the value added is theoretical rather than a mere recombination of familiar tools. First, the paper does not simply propose another disclosure index; it reconceptualizes disclosure quality as a multidimensional signal whose efficiency payoff is theoretically contingent on the governance and institutional layers through which it must travel, a proposition that binary or count-based proxies cannot even articulate. Second, the three-level specification is not adopted for methodological novelty but because it operationalizes a claim that the prior literature could not test: that the disclosure–efficiency slope is itself a random quantity governed by industry regulation and regional marketization, so that cross-level interaction terms become the formal expression of a nested-institutions theory rather than a modeling convenience. Third, by relocating the dependent variable from innovation volume to conversion efficiency, the framework reframes the theoretical question itself—away from whether disclosure induces more green activity and toward whether it reshapes the internal selection of which green projects survive. The combination, in short, yields a conditional theory of disclosure value that none of the three constituent methods generates on its own. The remainder proceeds as follows: Section 2 develops the theoretical framework and hypotheses; Section 3 details data, variables, and the multilevel specification; Section 4 reports estimation results and robustness checks; Section 5 discusses mechanisms and boundary conditions; Section 6 closes with policy implications.
2. Theoretical Foundations and Research Hypotheses
2.1. Theoretical Linkage Between Environmental Disclosure Quality and Green Innovation Efficiency
Three theoretical lenses anchor our reasoning about why disclosure quality should bear on the efficiency—not merely the volume—of green innovation. Signaling theory, in its Spence-derived form, treats high-quality environmental information as a costly, hard-to-imitate signal that separates committed adopters from greenwashers [16]. Legitimacy theory, drawing on Suchman’s tripartite distinction among pragmatic, moral, and cognitive legitimacy, situates disclosure as a discursive instrument through which firms negotiate their license to operate with regulators and civil society [17], a framing echoed in evidence on standalone sustainability reporting [18]. Stakeholder theory closes the triangle by recasting disclosure as a relational good that recalibrates expectations across creditors, suppliers, customers, and employees [19]. Rather than invoking these lenses as separate justifications, we read them as one mechanism observed from three angles: a credible signal (signaling) earns a renewed license to operate (legitimacy) by realigning the expectations of resource-controlling parties (stakeholders), and it is this single chain—not the simple accumulation of theories—that we expect to surface as the financing, reputation, and monitoring channels developed below.
The first channel runs through financing constraints. Credible environmental signals shrink the informational wedge between insiders and outside capital providers, lowering the risk premium attached to green projects whose payoffs are long-dated and technologically uncertain [20]. Empirical work on China’s green credit policy confirms that credit is reallocated toward firms with stronger environmental credentials and that this reallocation raises their green innovation output—conditions that matter for capital-intensive abatement R&D [21]. When financing frictions ease, the same yuan of green R&D input can be allocated toward higher-risk but higher-payoff projects rather than incremental tweaks—raising the output-to-input ratio that defines efficiency. We capture this relationship via the conventional disclosure–cost-of-capital mapping (standard formulation):
where denotes the firm’s cost of equity, the environmental disclosure quality score, and the disclosure premium discount; the sign of encodes the financing channel.
A second channel operates through reputational capital. Disclosure that is detailed, forward-looking, and externally assured accumulates as an intangible asset on which firms draw when entering green procurement networks, attracting environmentally screened institutional investors, or recruiting scientifically trained personnel [22]. Reputational rents do not appear directly in standard financial statements, yet they shift the marginal product of green R&D by improving collaboration quality with universities and downstream buyers willing to co-invest. The mechanism is asymmetric: damage from a disclosure scandal travels faster than the slow build-up from consistent reporting, which explains why firms with sustained high-quality disclosure show steeper innovation efficiency gains than recent converts [23].
A third channel works through intensified external monitoring. High-quality environmental disclosure equips analysts, environmental NGOs, and local regulators with the granularity needed to detect resource misallocation inside the firm [24]. Under stronger monitoring, managers internalize the cost of slack—idle green R&D personnel, duplicative pilot projects, abandoned patents—and reallocate effort towards projects with measurable environmental and commercial returns. This sharpening of internal discipline pushes the firm closer to its production-possibility frontier in green innovation space, which we represent through a standard efficiency-decomposition expression (adapted from the directional distance function literature):
with the green innovation efficiency, a vector of firm-level controls, and capturing the disclosure-induced efficiency shift.
The three channels are not strictly additive. Financing relief without reputational accumulation can divert resources to superficial projects; monitoring without financing access yields disciplined but underfunded R&D pipelines. We expect their interaction to be reinforced in firms where governance permits credible signaling in the first place, which prefigures the moderating role assigned to governance characteristics in later sections [12]. Combining these arguments, our first hypothesis follows:
H1.
Environmental information disclosure quality is positively associated with the input–output efficiency of green innovation in Chinese listed firms. We advance the financing-constraint, reputational, and external-monitoring channels as the theoretical rationale for this association; because the present design estimates the overall relationship rather than a formal mediation system, these channels are offered as candidate explanations to be probed in future mediator-explicit work rather than as empirically confirmed transmission paths.
2.2. Moderating Mechanisms of Governance Structure Characteristics
Disclosure quality does not translate into innovation efficiency through a single uniform pathway; the internal architecture of corporate control conditions how the signal is received, interpreted, and acted upon. Agency theory and upper-echelons theory together supply the analytical scaffolding here. The former, in its Jensen–Meckling formulation, frames governance as a set of devices that constrain managerial opportunism over discretionary investments such as green R&D [25]. The latter, following Hambrick and Mason, treats observable executive characteristics as proxies for cognitive filters that shape strategic interpretation under uncertainty [26]. Four governance dimensions appear most consequential for the disclosure–efficiency link.
Board independence comes first. Independent directors with no operational ties to management are better placed to scrutinize the credibility of disclosed environmental information and to challenge resource allocation decisions in green innovation projects whose payoffs are diffuse [27]. Their presence raises the cost of disclosure that is decoupled from real abatement effort, which in turn pushes managers toward disclosure–action consistency. We expect the slope of efficiency on disclosure quality to steepen as the independent director ratio rises. Yet the relationship may not be strictly monotonic—excessive independence without industry-specific expertise can produce overcautious vetoes on novel green technologies [28]. The moderated relationship is captured as
with denoting the proportion of independent directors and the interaction coefficient of interest.
Ownership concentration moves in the opposite direction. Highly concentrated ownership in Chinese listed firms often coincides with controlling-shareholder entrenchment, where minority-investor protections weaken and green disclosure risks being repurposed as a legitimacy veneer rather than a commitment device [29]. Concentrated owners may also prefer short-cycle commercial R&D over green innovation whose returns are uncertain and partially externalized. We thus anticipate a dampening effect: the higher the largest shareholder’s stake, the weaker the conversion from disclosure quality into innovation efficiency.
Executives with environmental backgrounds—prior experience in environmental agencies, sustainability consultancies, or green technology firms—enter through the upper-echelons logic. Their interpretive schemata privilege long-horizon environmental payoffs and reduce the cognitive cost of redirecting R&D portfolios toward abatement-relevant trajectories [30], a reading that rests on the reflexive foundations of managerial cognition emphasized in the strategic-management literature [31]. Such executives also tend to invest in internal carbon accounting infrastructure, which makes disclosure information more actionable inside the firm rather than purely outward-facing. The amplification effect on the disclosure–efficiency relationship is modeled as
where is a binary indicator for environmentally experienced executives in the top management team.
Institutional ownership constitutes the fourth lever, though its sign is theoretically ambiguous and likely contingent on investor horizon. Long-horizon institutional investors—pension funds, social security funds, green-mandated ETFs—reward disclosure-consistent green strategies and absorb the short-term earnings volatility that abatement R&D can introduce [32]. Transient institutional holders behave differently, often pressing management towards quarterly performance targets that crowd out green investment efficiency gains. Without distinguishing horizon explicitly, the average moderating effect should still be positive, since pressure-resistant institutional investors have been shown to raise green innovation in Chinese listed firms while pressure-sensitive holders do not [33]. The composite interaction is written as
with measuring institutional shareholding proportion.
The four mechanisms operate in parallel rather than sequentially, and their relative strength is itself an empirical question. We formalize the resulting set of moderation hypotheses:
H2a.
Board independence positively moderates the relationship between environmental disclosure quality and green innovation efficiency, strengthening the conversion from disclosure into efficiency gains.
H2b.
Ownership concentration negatively moderates the disclosure–efficiency relationship, weakening the efficiency translation of high-quality disclosure.
H2c.
The presence of executives with environmental backgrounds positively moderates the disclosure–efficiency relationship, amplifying the efficiency gains derived from credible disclosure.
H2d.
Institutional investor shareholding positively moderates the disclosure–efficiency relationship, reinforcing the link between disclosure quality and green innovation efficiency.
2.3. Cross-Level Nesting Effects and Multilevel Hypothesis Construction
Firm-level mechanisms operate inside contexts that are themselves variable. Resource dependence theory, following Pfeffer and Salancik, reminds us that firms calibrate their environmental behavior against the external actors controlling critical resources—regulators, capital providers, technology partners—whose composition varies by industry [34]. Institutional theory adds a second layer: organizational fields embedded in different regional institutional matrices face heterogeneous coercive, normative, and mimetic pressures that selectively reward or punish disclosure-driven strategies [35]. Together, these perspectives imply that the firm-level disclosure–efficiency slope is itself a random variable, with industry and provincial conditions as candidate predictors of its variation.
Two contextual conditions matter most for our setting. Industry-level environmental regulation intensity—captured through pollution discharge standards, emission permit stringency, and sector-specific carbon quotas—alters the marginal value of a credible environmental signal [36]. In heavily regulated industries such as thermal power or steel, disclosure carries higher informational weight because the regulatory cost of misrepresentation is steep, and the disclosure–efficiency relationship should tilt upward accordingly. In lightly regulated industries, the same signal blurs into corporate communications noise, and its efficiency payoff thins out. Regional marketization, measured through the Fan Gang–Wang Xiaolu marketization index (hereafter the Fan–Wang index) or its successors, captures the depth of factor markets, the protection of property rights, and the maturity of intermediary services [37]. Provinces scoring high on marketization channel disclosure benefits more efficiently into green credit, technology transactions, and labor reallocation; provinces with thinner markets dampen the transmission [38].
The nested structure—firm-year observations grouped within industries grouped within provinces—motivates a three-level random-slope specification. At Level 1, firm-year green innovation efficiency depends on disclosure quality and governance moderators. At Level 2, the disclosure slope varies across industries as a function of regulatory intensity. At Level 3, both the intercept and the slope absorb provincial marketization variation. The compact reduced form for the cross-level interaction is
where , , , index firm, industry, province, and year; denotes industry-level regulation intensity, provincial marketization, and the , terms encode the cross-level interactions [39]. The error components , , and partition variance across the three layers. The intraclass correlation coefficients are derived in the conventional manner:
with non-trivial ICC values providing the empirical license for hierarchical estimation [40].
Two cross-level hypotheses follow, completing the multilevel system that runs from H1 through H3:
H3a.
Industry-level environmental regulation intensity positively moderates the firm-level relationship between environmental disclosure quality and green innovation efficiency; the disclosure–efficiency slope steepens in industries facing tighter regulatory pressure.
H3b.
Provincial marketization positively moderates the firm-level disclosure–efficiency relationship; the efficiency conversion of disclosure quality is stronger in regions with more developed market institutions.
Together with H1 (the direct effect) and H2a–H2d (firm-level governance moderators), these cross-level propositions form a coherent three-tier hypothesis system in which firm conduct, industry context, and regional institutions jointly shape the productivity of green innovation pipelines.
3. Research Design and Model Construction
3.1. Sample Selection and Data Sources
The empirical analysis draws on Chinese A-share listed firms in the Shanghai and Shenzhen Stock Exchanges across the 2014–2024 window. This period brackets several institutional shifts that are central to our research question: the 2015 revision of the Environmental Protection Law, the launch of the national carbon market in 2021, and the issuance of the 2024 mandatory sustainability disclosure rules by the three major exchanges [41]. Beginning the panel in 2014 also gives us one pre-policy year as a baseline against which subsequent disclosure-quality trajectories can be benchmarked.
Sample construction followed a sequence of screening filters. Firms designated as ST or *ST during the observation window were dropped because financial distress confounds the disclosure–innovation relationship. The asterisk in *ST is part of the exchange’s special-treatment label, not a footnote marker. Financial sector firms (CSRC code J) were removed given their distinct regulatory regime and the conceptual difficulty of applying manufacturing-oriented green innovation metrics to them. Firms with fewer than three consecutive years of observations were excluded to preserve the panel structure required by the three-level model. Observations missing values on key variables—disclosure quality scores, green patent counts and applications, R&D inputs, or core governance characteristics—were eliminated through listwise deletion at the variable-construction stage.
Four data streams feed the analysis. Environmental disclosure quality scores were constructed by hand-coding annual reports, standalone CSR reports, and ESG reports against a multidimensional rubric covering content completeness, third-party verification, forward-looking commitments, and quantification depth, following the content-analytic approach to Chinese corporate environmental disclosure of Meng et al. [42], with raw documents pulled from the CNINFO (Juchao) platform. Governance structure variables—board independence ratio, ownership concentration, executive backgrounds, and institutional shareholding—came from the CSMAR database, supplemented by manual cross-checking of director biographies for environmental experience tagging. Green innovation outputs and inputs were assembled from the CNRDS green patent database and the CSMAR R&D expenditure module, with patents classified as green using the IPC Green Inventory mapping issued by WIPO [43]. Industry-level environmental regulation intensity was constructed from the China Statistical Yearbook on Environment, while provincial marketization scores follow the updated Fan–Wang marketization index series [44], a provincial institutional measure widely used in the regional green-innovation efficiency literature [45].
The matching procedure linked datasets through stock codes for firm-level variables, two-digit CSRC industry codes for industry-level moderators, and provincial codes derived from registered office locations for regional moderators. Cross-database inconsistencies—particularly around mid-year industry reclassifications and corporate restructurings—were resolved by referring back to original SSE and SZSE announcements. Figure 1 traces the full screening and matching workflow from raw data sources to the analytical panel.
Figure 1.
Sample screening procedure and multi-source data-matching workflow, showing sequential exclusion of ST firms, financial sector firms, and observations with missing key variables, followed by the linkage of disclosure quality scores, CSMAR governance variables, CNRDS green patent records, and industry- and province-level moderators into the final analytical panel. Solid arrows trace the sequential screening path from the initial pool to the final analytical panel; the double-bordered hexagon marks the central data-linkage operation and the dashed border the auxiliary filtering step.
After applying the filters, the analytical panel comprises 2847 unique firms and 21,536 firm-year observations spanning eleven calendar years, distributed across 28 two-digit manufacturing and related industry codes and 30 provincial-level administrative units. Table 1 summarizes screening counts at each step together with the final sample distribution.
Table 1.
Sample screening process and final sample distribution.
3.2. Variable Definitions and Measurement
3.2.1. Environmental Disclosure Quality
Building the disclosure quality index occupied the most labor-intensive part of our measurement work. Following the content-analysis tradition refined by Clarkson and colleagues, we constructed a scoring rubric organized along four dimensions—content completeness, verifiability, quantification depth, and forward-looking commitment—each decomposed into three items rated on a 0–3 ordinal scale, where 0 denotes silence, 1 a boilerplate qualitative mention, 2 a substantive narrative disclosure, and 3 a quantified and verifiable disclosure [46]. To take one concrete decision rule, a firm that states only that it “values environmental protection” scores 1 on the emissions item, a firm reporting emission categories in prose scores 2, and a firm tabulating tonnage by pollutant against a prior-year baseline scores 3; carbon-neutrality language without a dated target is capped at 2 on the forward-looking items. The aggregate is formed by summing the twelve items with equal weights—a deliberate choice, since data-driven weighting schemes (entropy or principal-component loadings) reproduced the same firm rankings with a Spearman correlation above 0.97, so equal weighting buys transparency at no cost to ordering—and the raw 0–36 total is then linearly rescaled to a 0–100 continuum. On reliability, the two coders were postgraduate researchers who completed a calibration phase on 300 pilot reports before scoring began, with the rubric frozen only after their pilot kappa cleared 0.75; the full corpus was then scored over roughly nine months, blind to the firms’ innovation outcomes to forestall hindsight bias. The reported Cohen’s kappa of 0.83 is computed on the production set, item-level disagreements were reconciled by joint adjudication with a third senior researcher breaking ties, and a 10 percent random audit re-coded after a two-month interval reproduced 94 percent of item scores exactly, which we take as adequate evidence of intra-coder stability at this scale. Table 2 sets out the full scoring scheme.
Table 2.
Environmental disclosure quality scoring framework.
3.2.2. Green Innovation Efficiency
For the dependent variable, we adopted a super-efficiency slacks-based measure DEA model with undesirable outputs—commonly labeled the super-SBM approach in environmental productivity literature [47]. The choice is not incidental: radial DEA models cannot handle slack in inputs and undesirable outputs simultaneously, which matters when green R&D pipelines generate both desired patents and unwanted by-products such as failed pilot waste. The underlying SBM efficiency score for decision-making unit is given by the standard formulation:
where denotes inputs, desirable outputs, undesirable outputs, and , , the corresponding slack variables [48]. Because the standard SBM cannot discriminate among units that attain a score of unity, we report the super-efficiency variant of Equation (8), which excludes the evaluated unit from its own reference set and therefore admits scores above one. Inputs comprise green R&D expenditure and the headcount of R&D personnel engaged in green projects; desirable outputs are green patent grants and green patent citation-weighted counts; undesirable outputs cover industrial wastewater discharge and SO2 emissions normalized by output value. We should be candid about how the two undesirable outputs were measured at the firm level, since firm-specific pollution figures are indeed patchy. Where a firm reported discharge and emission volumes directly in its environmental or ESG disclosure, those figures were used; where they were absent, we imputed firm emissions by allocating the relevant two-digit industry total from the China Statistical Yearbook on Environment in proportion to the firm’s share of industry output value, an approach that recovers cross-firm intensity differences while acknowledging that the absolute levels for non-reporting firms are estimated rather than observed. Firms for which neither a reported value nor a credible output-share allocation could be constructed were excluded at the missing-data screening stage rather than assigned zeros, so the efficiency scores are not contaminated by spurious clean records. One further caveat belongs here: green patent counts proxy innovation output imperfectly, because a granted green patent can reflect either a genuine technological advance or strategic, subsidy-driven filing, and our citation-weighting only partially separates the two; the efficiency scores should therefore be read as upper bounds on real abatement-relevant productivity.
3.2.3. Governance Structure Variables
Four governance attributes operationalize the moderators developed in Section 2.2. Board independence (IND) is the ratio of independent directors to total board members. Ownership concentration (OC) takes the shareholding percentage of the largest shareholder. Environmental executive background (ENVEXE) is a binary marker equal to one if any member of the top management team has prior service in an environmental regulatory agency, an environmental NGO, or a green technology firm, based on biographical data screened from CSMAR and cross-checked manually [49]. Institutional shareholding (INST) measures the aggregate proportion held by institutional investors at year-end.
3.2.4. Industry- and Region-Level Variables
Industry-level regulation intensity (REG) is derived from the ratio of pollution treatment investment to industry value added at the two-digit CSRC industry code level, log-transformed to reduce skewness. Provincial marketization (MKT) follows the Fan–Wang index, which scores regional market development on government–market relations, non-state economic share, factor market sophistication, and legal environment [44]. Both moderators enter the model grand-mean centered to ease the interpretation of cross-level interaction terms.
3.2.5. Controls
Firm-level controls cover size (Size, natural log of total assets), leverage (Lev, debt-to-asset ratio), profitability (ROA), firm age (Age), state ownership (SOE, binary), and Tobin’s Q. Industry-level controls include industry concentration (HHI). Provincial controls absorb GDP per capita (lnGDP) and environmental court density per million population [50]. Table 3 consolidates the full variable inventory.
Table 3.
Variable definitions and measurement methods.
3.3. Multilevel Linear Model Specification and Estimation
3.3.1. Reasons for Selecting HLM over OLS
The case for hierarchical estimation in our setting rests less on statistical preference than on the structure of the data itself. Firm-year observations in our panel are not independent draws: a chemical manufacturer in Jiangsu shares unobserved exposure to sector-specific emission standards with its industry peers, and simultaneously faces a provincial regulatory environment distinct from one in Sichuan. Pooled OLS ignores this clustering and produces downward-biased standard errors on slope estimates, while two-way clustered errors correct the variance but cannot recover the cross-level variance components themselves [51]. Hierarchical linear modeling, originally formalized by Raudenbush and Bryk, decomposes total variance into firm-, industry-, and province-level components and admits random slopes that vary across higher-level units [39]. For our research question, which explicitly asks how regional and industry conditions reshape firm-level disclosure–efficiency slopes, this decomposition is non-negotiable. Two features of our data structure deserve a frank statement, since they complicate any naive “Russian-doll” reading of the hierarchy. First, industry and province are not strictly nested: the same two-digit industry appears across many provinces and each province hosts firms from many industries, so the two contexts are more accurately treated as cross-classified higher-level factors rather than one cleanly contained within the other. We therefore specify industry and province as crossed random effects on the intercept and on the EDQ slope, and we verified that a fully cross-classified estimator returns variance components within rounding distance of the strictly nested version, which is why the substantive conclusions are insensitive to the choice. Second, because the panel stacks repeated firm-year observations, the truly lowest grouping unit is the firm, not the firm-year; we accordingly add a firm-level random intercept nested under the crossed industry and province effects, together with year fixed effects and cluster-robust standard errors at the firm level, so that within-firm serial dependence is absorbed rather than mistaken for signal [39].
3.3.2. Three-Level Nested Architecture
Figure 2 traces the nesting logic graphically: firm-year observations (Level 1) sit inside industries (Level 2), which in turn sit inside provinces (Level 3). Table 4 maps variables to their corresponding analytic layer.
Figure 2.
Three-level nesting architecture of the hierarchical linear model, showing firm-year observations clustered within two-digit industries and industries clustered within provincial administrative units together with the variables assigned to each level. Arrow colour encodes the level at which each block enters the model: teal for province-level (Level 3) inputs, red for industry-level (Level 2) inputs, amber for firm-year (Level 1) predictors, and purple for the estimation and outcome block.
Table 4.
Multilevel model hierarchy and variable assignment.
3.3.3. Stepwise Model Construction
We build the specification in four stages, each progressively relaxing constraints. The null model partitions variance with no predictors:
from which the intraclass correlations are computed as
Following Hox’s threshold guidance, ICC values above 0.05 at any level justify proceeding to multilevel estimation [52]. The random-intercept model then adds firm-level predictors while letting intercepts vary across industries and provinces:
The random-slope model permits the disclosure–efficiency slope itself to vary across higher-level units, which is the structural feature that distinguishes our analysis from conventional fixed-effects panels:
The full cross-level interaction model incorporates industry regulation and provincial marketization as predictors of both intercepts and slopes:
Substituting (14) and (15) into (11) yields the reduced form:
Table 5 maps each modeling stage to the corresponding equation.
Table 5.
Model specification and equation correspondence.
3.3.4. Estimation and Fit Assessment
Parameters are estimated through restricted maximum likelihood (REML), which is preferred over full maximum likelihood when variance components are the inferential target, since REML yields less biased estimates in small upper-level samples [53,54]. The choice matters here precisely because our upper levels are modest—28 industries and 30 provinces—a regime in which full maximum likelihood is known to understate between-group variance; for the same small-sample reason we test fixed effects through Wald statistics with the Kenward–Roger degrees-of-freedom adjustment, which inflates the effective denominator degrees of freedom to guard against the anti-conservative inference that plagues unbalanced multilevel panels. Model fit improvements across nested specifications are assessed through the deviance statistic:
where is the difference in free parameters between models [55]. Complementary fit indices include Akaike’s Information Criterion and the pseudo- at each level, calculated as the proportional reduction in residual variance relative to the null model:
All estimation was carried out in HLM 8.0 (Scientific Software International, Skokie, IL, USA) with cross-validation against the mixed command in Stata 19 (StataCorp LLC., College Station, TX, USA) to confirm computational stability. To show that the hierarchical machinery earns its keep rather than merely complicating the analysis, we re-estimated the disclosure–efficiency relationship with a conventional two-way fixed-effects panel carrying firm and year dummies, the workhorse of corporate-finance research. That estimator returns an EDQ coefficient of comparable sign and magnitude but, by construction, sweeps the industry- and province-level variance into the fixed effects and so cannot recover the cross-level interaction terms that constitute our actual research question; it also delivers a worse information-criterion fit than the random-slope specification. The comparison, summarized alongside the variance components in Table 6, is the concrete evidence that HLM here improves identification of the conditioning effects rather than simply offering an alternative bookkeeping of the same average slope.
Table 6.
Variance decomposition and model comparison across estimation stages.
4. Empirical Results and Analysis
4.1. Descriptive Statistics and Baseline Regression
Across the 21,536 firm-year observations, the disclosure quality index averages 42.7 with a standard deviation of 18.3, indicating wide dispersion that the panel structure preserves rather than smooths over. The interquartile range runs from 28.4 to 56.9, and a non-trivial right tail above 80 reflects the small group of firms—mostly large central state-owned enterprises in energy and materials—that produce GRI-aligned, externally assured sustainability reports. Green innovation efficiency scores range from 0.12 to 1.34, with a mean of 0.518, consistent with the modest aggregate productivity figures reported for Chinese manufacturing green R&D pipelines [56]. Pairwise correlations between key explanatory variables stay below 0.45 in absolute value, and variance inflation factors range from 1.21 to 3.67 with a mean of 2.04, well below the conventional threshold of 10, so multicollinearity is not a serious concern.
Before fitting any predictor-augmented specification, we ran the null model defined in Equation (9) to recover the variance components. The intraclass correlation at the provincial level lands at 0.143, while the industry-level ICC is 0.182, leaving 67.5 percent of total variance at the firm-year layer. Both higher-level ICCs comfortably exceed the 0.05 cutoff suggested by methodologists working with nested organizational data [40], confirming that pooling all observations into a single-level OLS would obscure systematic between-cluster differences and bias inference on the disclosure–efficiency slope. Table 6 reports the variance components alongside the deviance, AIC, and level-specific pseudo- for each modeling stage and for the two-way fixed-effects benchmark.
The grouped comparison in Figure 3 makes the disclosure–efficiency relationship visible before any conditioning takes place. Firms in the top quartile of disclosure quality post mean efficiency scores roughly 38 percent above those in the bottom quartile, and the gap widens monotonically across the four bands.
Figure 3.
Mean green innovation efficiency by environmental disclosure quality quartile, showing a monotonic increase from the lowest to the highest disclosure band, with 95 percent confidence intervals indicating non-overlap between adjacent quartiles.
Pooling individual firm-years rather than quartile means, Figure 4 traces the conditional relationship in a scatterplot with a LOESS fit overlaid. The upward slope is unmistakable, though the relationship flattens at the upper end of the disclosure distribution, hinting at diminishing marginal returns once disclosure quality moves beyond the regulatory frontier.
Figure 4.
Scatter plot of green innovation efficiency against environmental disclosure quality scores with a LOESS smoother and a 95 percent confidence band, revealing a positive but concave conditional mean relationship. Each green dot is a single firm-year observation; the solid curve is the LOESS fit and the shaded band its 95 percent confidence band.
Temporal dynamics deserve a separate look. Figure 5 plots sample-wide mean efficiency by year and shows a gentle upward drift from 0.43 in 2014 to 0.58 in 2024, with a visible acceleration after 2020 that coincides with the dual-carbon policy announcement and the green credit guideline rollout [20,57].
Figure 5.
Annual trend of mean green innovation efficiency across sample firms, 2014–2024, with shaded band denoting one standard deviation and a discernible inflection point around 2020 corresponding to the dual-carbon policy announcement.
Heterogeneity across two-digit industries warrants attention before the regressions interpret it away. Figure 6 displays the boxplot distribution by industry code, with pollution-intensive sectors—steel, chemicals, thermal power—exhibiting both lower medians and wider dispersions than electronics or pharmaceuticals.
Figure 6.
Boxplot of green innovation efficiency by two-digit industry code, illustrating systematically lower medians and broader interquartile spreads in pollution-intensive sectors relative to technology-oriented industries. Boxes shaded in warm tones are pollution-intensive sectors and those in cool tones are technology-oriented sectors; the line inside each box is the median, the box spans the interquartile range, and the whiskers extend to 1.5 times that range.
Baseline random-intercept estimation, with EDQ entered as the sole Level-1 predictor alongside firm controls, returns a coefficient of (, ). A one-standard-deviation rise in disclosure quality is associated with a 0.084 increase in the efficiency score—about 16 percent of the sample mean—an association whose economic size mirrors the visual pattern in Figure 3 and Figure 4. We phrase this deliberately as an association: even with the robustness battery that follows, the baseline rests on observational variation, and the magnitude should be read as the conditional difference between high- and low-disclosure firms rather than as the effect of an exogenous change in disclosure. The deviance test against the null model returns with two degrees of freedom, decisively rejecting the no-effect specification. Firm size and ROA enter with the expected positive signs, while leverage suppresses efficiency, consistent with the financing-constraint mechanism developed in Section 2.1 and broadly aligned with panel evidence linking financing constraints and green innovation in Chinese firms [58]. The baseline coefficient supplies a benchmark against which the random-slope and cross-level interaction models in subsequent subsections will be evaluated. Table 7 collects the full set of fixed-effect coefficients, standard errors, and significance levels for the baseline, governance-moderation, cross-level, and fully controlled specifications side by side, so the progression can be read directly rather than reconstructed from the text.
Table 7.
Hierarchical linear model estimates of green innovation efficiency.
4.2. Moderating Effects of Governance Structure Characteristics
Testing the four governance moderators developed under H2a–H2d proceeds through sequential introduction of interaction terms into the random-intercept specification, with all continuous moderators grand-mean centered to keep the conditional EDQ slope interpretable at sample means [59]. We resist the temptation to enter all four interactions simultaneously in a single equation, since collinearity between governance variables would muddy the marginal effect estimates; instead, each moderator enters in its own augmented model with the others held as Level-1 controls.
The board independence interaction produces a positive and statistically reliable coefficient. Estimated from the specification corresponding to Equation (3) in Section 2.2, the interaction term returns (, ), with the marginal effect of EDQ on GIE expressed as
Substituting the 25th and 75th percentile values of IND (0.33 and 0.45) yields conditional EDQ slopes of 0.0038 and 0.0063, respectively, a 66 percent increase across the interquartile range. The amplification is consistent with the monitoring logic developed in H2a: independent boards raise the cost of decoupled disclosure and steer green R&D toward higher-conversion projects [60].
Ownership concentration cuts the other way. The interaction coefficient is negative and significant (, , ), and the conditional slope expression follows:
At low ownership concentration (25th percentile, 22.4 percent), the EDQ slope reaches 0.0058; at high concentration (75th percentile, 48.7 percent), it falls to 0.0021. Concentrated controlling shareholders appear to repurpose high-quality disclosure as a legitimacy device rather than a commitment to abatement-focused R&D, which lines up with the entrenchment account in H2b. The result is one of the cleaner findings in our analysis—the sign is robust across both random-intercept and random-slope estimators, and the magnitude does not shrink when SOE status is partialed out.
The environmental executive moderator yields the largest amplification effect of the four. With ENVEXE as a binary indicator, the interaction term takes (, ), and the slope differential is given by
Firms with an environmentally experienced executive in the TMT convert disclosure quality into innovation efficiency at roughly 1.7 times the rate of firms without such experience. The upper-echelons mechanism appears to operate as theorized: cognitive priors that privilege long-horizon environmental payoffs reduce the friction between outward-facing disclosure and inward-facing R&D portfolio adjustments [61]. This effect remains stable after controlling for whether the firm is in a pollution-intensive industry, suggesting that it is genuinely an executive-level rather than industry-level phenomenon.
Institutional shareholding moderates positively, but with a smaller magnitude. The interaction coefficient comes in at (, ), and the marginal effect follows:
Across the interquartile range of INST (from 12.3 percent to 41.6 percent), the conditional EDQ slope rises from 0.0044 to 0.0070. The amplification is real but more muted than the executive background channel, perhaps because aggregate institutional ownership conflates long-horizon and transient holders—a distinction that future work could sharpen by separating pension and social security funds from short-term mutual funds [62]. We flag this as a measurement limitation rather than a refutation of H2d.
Figure 7 places the four marginal effects on a common axis to make the contrast visible.
Figure 7.
Marginal effects of environmental disclosure quality on green innovation efficiency under different governance structure conditions, comparing low and high levels of board independence, ownership concentration, environmental executive background, and institutional shareholding with 95 percent confidence bands.
Ranking the moderators by the magnitude of the marginal-effect shift across their respective ranges, environmental executive background and ownership concentration emerge as the most influential, followed by institutional shareholding and then board independence. Hypotheses H2a–H2d each find support, though the strength of the effects diverges enough to caution against treating governance as a homogeneous bundle.
4.3. Cross-Level Interaction Tests and Robustness Analysis
Moving from firm-level moderation to the cross-level structure laid out in Equation (16), we test whether industry regulation intensity and provincial marketization condition the disclosure–efficiency slope. The cross-level interaction with REG returns (, ), so the conditional EDQ slope can be written as
Industries above the 75th percentile of regulatory intensity—thermal power, cement, non-ferrous metals—exhibit EDQ slopes roughly 1.8 times those in lightly regulated sectors, lending empirical support to H3a. The regulatory environment evidently raises the informational stakes of disclosure: where misreporting carries steeper administrative consequences, the same disclosure score conveys a stronger signal and travels farther into capital allocation decisions [63].
Provincial marketization carries an analogous amplifying role. The interaction coefficient lands at (, ), with the conditional slope:
Firms domiciled in provinces in the top quartile of the Fan–Wang index—Guangdong, Zhejiang, Jiangsu—translate disclosure quality into innovation efficiency at roughly twice the rate of firms in bottom-quartile provinces. The mechanism follows the institutional logic in H3b: thicker factor markets, more competitive intermediary services, and stronger property-rights protection [37] let credible disclosure flow through green credit channels and technology-licensing markets without dissipating in administrative friction [64]. Deviance tests against the random-slope-only specification yield (, ), so adding the cross-level interactions substantially improves fit.
A natural concern is endogeneity between disclosure quality and innovation efficiency: firms with more productive green R&D pipelines may invest in better disclosure precisely because they have favorable outcomes to report. We flag this at the outset because it is central to the entire claim rather than a loose end—the multilevel slopes reported above are only as credible as the exogeneity of EDQ—and we now confront it directly through three robustness exercises and one identification strategy.
First, we replaced the content-analysis disclosure index with the third-party Bloomberg ESG environmental pillar score for the subsample with available coverage. The EDQ coefficient remains positive and significant at 0.0041 (, ), within 11 percent of the baseline estimate. Second, restricting the panel to 2017–2024 to exclude the pre-policy years yields a slightly larger coefficient of 0.0052, suggesting the relationship may have strengthened in the post-Paris regime rather than weakened—a pattern not inconsistent with the institutional accumulation argument advanced earlier. Because disclosure plausibly acts on innovation efficiency with a delay rather than contemporaneously, we also re-estimated the baseline with one- and two-year lags of EDQ in place of its current value; both lagged coefficients stay positive and significant (0.0049 at one lag, 0.0043 at two), and the gentle decay across horizons is consistent with a signal that is absorbed gradually into capital allocation rather than with a mechanical same-year correlation.
Third, propensity score matching addresses self-selection into high-disclosure status. We split firms into high-EDQ (top tercile) and low-EDQ groups, then matched on Size, Lev, ROA, Age, SOE, and industry-year fixed effects with one-to-one nearest-neighbor matching and a caliper of 0.05. The average treatment effect on the treated comes in at (, ), implying a 7.3-point efficiency gain attributable to high disclosure status after controlling for selection on observables:
Balance diagnostics post-matching show standardized mean differences below 5 percent on all matching covariates, down from pre-matching gaps that reached 31 percent on firm size, and the post-match variance ratios all fall inside the 0.5–2.0 band conventionally taken as adequate. The estimated propensity scores for the high- and low-EDQ groups overlap across almost the entire unit interval, so the common-support condition is satisfied without trimming more than the eleven treated observations whose scores exceeded the maximum control score; these were dropped under the imposed caliper. The matched ATT, the balance summary, and the off-support counts are reported compactly in Table 8 rather than as a separate figure, since the diagnostics add rows rather than a new visual.
Table 8.
Robustness and endogeneity checks for the EDQ coefficient.
Fourth, and most demanding, we instrumented EDQ with the lagged industry-province average disclosure score excluding the focal firm, following a leave-one-out construction that should satisfy the exclusion restriction conditional on industry-year and province-year fixed effects. We do not treat that exclusion claim as self-evident. The threat is that peer disclosure proxies for a common industry-region shock—a regulatory wave or a green-credit pilot—that drives innovation efficiency directly; our defense is that the saturated industry-year and province-year fixed effects absorb exactly those common shocks, so the residual variation in peer disclosure that identifies the coefficient is the idiosyncratic peer-reporting behavior that has no obvious direct channel to the focal firm’s R&D conversion. As a partial falsification, we re-ran the second stage adding contemporaneous industry green-credit volume and provincial environmental-enforcement intensity as controls; the instrumented EDQ coefficient moved by less than 8 percent, which is the pattern one expects when the instrument is not merely picking up a shared policy environment. The leave-one-out instrument is specified as
The first-stage Kleibergen–Paap F-statistic of 47.3 comfortably exceeds the Stock–Yogo weak-instrument threshold, and the second-stage coefficient on instrumented EDQ is 0.0058 (, ). The IV estimate exceeds the OLS-style baseline, which is consistent with classical measurement error in the disclosure score attenuating the naive coefficient rather than with reverse causation inflating it [65].
Figure 8 collects the baseline, two cross-level interactions, and four robustness coefficients on a single axis.
Figure 8.
Comparison of EDQ coefficient estimates across cross-level interaction specifications and robustness checks, including alternative disclosure measurement, restricted sample window, propensity score matching, and instrumental variable estimation, with 95 percent confidence intervals indicating a stable sign and statistical significance across all specifications. Green markers denote the baseline and cross-level specifications and orange markers the robustness and endogeneity checks; because the propensity-score-matching estimate is an average treatment effect expressed in efficiency-score points rather than a slope, it is rescaled by a factor of ten so that it can be shown on the same axis. The two cross-level points are the conditional EDQ slope evaluated at high industry regulation intensity and at high provincial marketization, respectively, not the cross-level interaction coefficients themselves.
Across the seven specifications, the sign never flips and the magnitude varies within a narrow band of 0.0041 to 0.0073, leaving the central finding intact under each diagnostic challenge. To make the verdict on each hypothesis legible at a glance, Table 9 links every proposition from H1 through H3b to its governing model, the sign and significance of the relevant coefficient, and the resulting conclusion on support.
Table 9.
Summary of hypothesis tests.
5. Discussion
Our central finding—that environmental disclosure quality is associated with the input–output efficiency of green innovation rather than with its sheer volume—diverges from much of the existing literature in two respects. Prior studies relying on binary CSR-report indicators or simple word counts tend to report weak or noisy disclosure effects, sometimes attributing them to symbolic compliance. By scoring disclosure across content completeness, verifiability, and forward-looking commitment, we recover an association that is both statistically robust and economically meaningful. The transmission, we should stress, is interpreted rather than directly estimated: the three overlapping channels developed in Section 2.1—easier access to green-labeled credit that reduces the financing wedge on long-horizon R&D, accumulated reputational capital that improves collaborations with universities and downstream buyers, and intensified external scrutiny that disciplines internal resource allocation—are the explanations we find most credible, but the present design does not partition the effect among them. None of these channels need to operate in isolation. We read the joint movement of all three as the most plausible source of the efficiency association—consistent with the idea that disclosure works not by funding more projects but by reshaping which projects survive the internal selection process.
The governance moderation results contain the paper’s most uncomfortable finding. Ownership concentration suppresses the disclosure–efficiency conversion. This stands in mild tension with the often-cited view that concentrated owners shoulder long-horizon environmental investments. Our reading is that in the Chinese institutional setting, concentrated stakes more often coincide with controlling-shareholder entrenchment than with stewardship, and the latter dynamic dominates in the aggregate. Independent directors and environmentally experienced executives, by contrast, both steepen the slope, but through different mechanisms: independence raises the cost of disclosure–action decoupling, while executives’ environmental background reduces the cognitive friction of redirecting R&D portfolios. The amplification by environmentally experienced executives turns out to be the largest amplifying effect among the four moderators, which strikes us as the most actionable finding from a board-composition standpoint.
Cross-level interactions sharpen the picture further. Industry regulation intensity and provincial marketization both amplify the firm-level slope, but the institutional logic differs. Regulation works through raising the cost of misrepresentation, so disclosure carries more informational weight where the enforcement apparatus is dense. Marketization works through transmission: even credible signals require thick capital and technology markets to convert into resource reallocation. Firms in lightly regulated industries or thinly marketized provinces face a kind of double discount on the value of their disclosure investment, regardless of internal effort. The pattern complicates any one-size-fits-all disclosure mandate.
Stepping back, the methodological lesson concerns variance decomposition. Roughly a third of the total variance in green innovation efficiency sits at industry and provincial layers combined, a magnitude that single-level fixed-effects estimators absorb but do not surface. Pooled OLS would have delivered a coefficient on EDQ that was directionally correct but stripped of the conditional structure that gives it managerial meaning. The HLM specification did not change the headline result so much as it dissolved the false impression that the disclosure–efficiency relationship is uniform across contexts.
The implications branch out in three directions. For corporate management, the priority is not maximizing disclosure word counts but pairing credible disclosure with governance arrangements that absorb the signal—independent boards with industry expertise, executives with environmental fluency, and ownership structures that resist entrenchment. For environmental regulators, the differential effectiveness across regulation intensities argues for tightening mandatory disclosure standards in lightly regulated industries before declaring victory in the heavily regulated ones, where the marginal informational gain is already saturated. For capital market design, the marketization finding suggests that disclosure rules without complementary green finance infrastructure—certified verifiers, transparent carbon pricing, transition-finance taxonomies—will deliver attenuated returns. Each of these implications has limits; none should be read as a universal prescription. But the multilevel evidence at least clarifies the conditions under which each holds.
6. Conclusions
This study set out to map how environmental disclosure quality, conditioned by governance arrangements and embedded in industry and regional contexts, shapes the productivity of green innovation in Chinese listed firms. Using a three-level hierarchical specification on a 2014–2024 panel of 2847 A-share firms, we recover three findings worth restating, stated as the conditional associations that the design can support rather than as established causal effects. Higher disclosure quality is associated with greater input–output efficiency of green innovation, a link for which we advance eased financing constraints, accumulated reputational capital, and intensified external monitoring as the most plausible explanations rather than as separately tested mediators. Governance characteristics moderate this conversion in heterogeneous ways: board independence, environmentally experienced executives, and institutional shareholding amplify the slope, while concentrated ownership dampens it. Industry regulation intensity and provincial marketization further steepen the firm-level relationship through distinct institutional channels—the former by raising the cost of misrepresentation, the latter by thickening the markets through which disclosure signals travel.
The theoretical contribution sits at the intersection of three strands of literature that have rarely been integrated. By embedding disclosure, governance, and green innovation efficiency within a single multilevel framework, the paper recasts what looked like an average treatment effect into a conditional structure shaped by nested institutional layers. Measurement-wise, the multidimensional disclosure index moves the field beyond binary CSR indicators; methodologically, the random-slope HLM partitions variance that single-level estimators absorb invisibly. Practically, the findings argue for pairing mandatory disclosure rules with complementary governance reforms and green finance infrastructure rather than treating each policy lever in isolation. They also offer a sharper diagnostic for boards: independent directors with industry expertise and executives carrying environmental experience are the governance configurations most likely to convert disclosure investment into measurable abatement payoffs.
Several limitations qualify these conclusions, and three deserve to be stated plainly rather than buried. The sample is confined to Chinese A-share listed firms, a population that is larger, more visible, and more disclosure-pressured than the private and unlisted firms that make up most of the economy; the disclosure–efficiency association we document may therefore be stronger here than it would be where reporting incentives are weaker, and we caution against reading the magnitudes as economy-wide. The instrumental-variable identification, although it survives the falsification checks reported above, still rests on an exclusion restriction that cannot be fully proven—peer disclosure could in principle reach focal-firm efficiency through channels our fixed effects do not capture—so the IV estimate is best read as corroborating rather than clinching. Finally, the cross-level moderators we identify are calibrated to a single institutional setting; whether industry regulation intensity and regional marketization play the same amplifying role in mandatory-disclosure regimes such as the EU, or in less marketized developing economies, is an open question that only cross-national replication can settle. The content-analysis index, despite high inter-rater agreement, also remains coarser than what text-mining or large language models could now extract from full report corpora.
Three avenues for follow-up work appear most promising. Replacing manual coding with NLP-based disclosure scoring would scale the measurement and surface dimensions—tone, hedging, comparability—that human rubrics miss. Cross-national comparison, particularly between Chinese and EU ETS-covered firms, would test whether the cross-level moderators we identify generalize beyond the single institutional setting. Dynamic mechanism analysis through state-space or panel VAR specifications could trace how the disclosure–efficiency relationship evolves with policy regime shifts, separating short-run signaling effects from long-run institutional accumulation.
Author Contributions
Y.X. conceived the research framework, designed the multilevel modeling strategy, constructed the environmental disclosure quality index through content analysis, performed the empirical estimation and robustness checks, and drafted the manuscript. F.W. contributed to the theoretical development and hypothesis construction, supervised the data collection and matching procedures across CSMAR, CNRDS, and provincial-level sources, provided critical revisions to the methodology and discussion sections, and reviewed the final version of the manuscript. All authors have read and agreed to the published version of the manuscript.
Funding
This research received no external funding.
Institutional Review Board Statement
Not applicable.
Informed Consent Statement
Not applicable.
Data Availability Statement
All data generated and analyzed during the current study are available from the corresponding author upon reasonable request.
Conflicts of Interest
The authors declare no conflicts of interest.
Abbreviations
2SLS: Two-Stage Least Squares; AIC: Akaike Information Criterion; ATT: Average Treatment Effect on the Treated; CSR: Corporate Social Responsibility; CSMAR: China Stock Market & Accounting Research Database; CNRDS: Chinese Research Data Services Platform; CSRC: China Securities Regulatory Commission; DEA: Data Envelopment Analysis; EDQ: Environmental Disclosure Quality; ENVEXE: Environmental Executive Background; ESG: Environmental, Social, and Governance; ETS: Emissions Trading System; GIE: Green Innovation Efficiency; GRI: Global Reporting Initiative; HHI: Herfindahl–Hirschman Index; HLM: Hierarchical Linear Model; ICC: Intraclass Correlation Coefficient; IND: Board Independence; INST: Institutional Shareholding; IPC: International Patent Classification; ISSB: International Sustainability Standards Board; IV: Instrumental Variable; LOESS: Locally Estimated Scatterplot Smoothing; MKT: Marketization; NGO: Non-Governmental Organization; NLP: Natural Language Processing; OC: Ownership Concentration; OLS: Ordinary Least Squares; PSM: Propensity Score Matching; R&D: Research and Development; REG: Regulation Intensity; REML: Restricted Maximum Likelihood; ROA: Return on Assets; SBM: Slacks-Based Measure; SFA: Stochastic Frontier Analysis; SMD: Standardized Mean Difference; SOE: State-Owned Enterprise; SSE: Shanghai Stock Exchange; SZSE: Shenzhen Stock Exchange; TCFD: Task Force on Climate-related Financial Disclosures; TMT: Top Management Team; VAR: Vector Autoregression; VIF: Variance Inflation Factor; WIPO: World Intellectual Property Organization.
References
- Christensen, H.B.; Hail, L.; Leuz, C. Mandatory CSR and sustainability reporting: Economic analysis and literature review. Rev. Account. Stud. 2021, 26, 1176–1248. [Google Scholar] [CrossRef] [Scilit]
- Eccles, R.G.; Stroehle, J.C. Exploring social origins in the construction of ESG measures. J. Appl. Corp. Financ. 2023, 35, 31–43. [Google Scholar]
- Liu, Y.; Liu, Y.; Wei, W. Environmental regulation, green technological innovation, and eco-efficiency: The case of Yangtze River Economic Belt in China. Technol. Forecast. Soc. Change 2020, 155, 119993. [Google Scholar] [CrossRef] [Scilit]
- Ren, S.; Huang, M.; Liu, D.; Yan, J. Understanding the impact of mandatory CSR disclosure on green innovation: Evidence from Chinese listed firms. Br. J. Manag. 2023, 34, 576–594. [Google Scholar] [CrossRef] [Scilit]
- Lin, X.; Zhang, R.; Liu, B. Environmental regulation, green innovation and high-quality economic development. Environ. Sci. Pollut. Res. 2022, 29, 39911–39926. [Google Scholar]
- Liu, Y.; Wang, A.; Wu, Y. Environmental regulation and green innovation: Evidence from China’s new environmental protection law. J. Clean. Prod. 2021, 297, 126698. [Google Scholar] [CrossRef] [Scilit]
- Du, J.L.; Liu, Y.; Diao, W.X. Assessing regional differences in green innovation efficiency of industrial enterprises in China. Int. J. Environ. Res. Public Health 2019, 16, 940. [Google Scholar] [CrossRef] [Scilit] [PubMed]
- Clarkson, P.M.; Fang, X.; Li, Y.; Richardson, G. The relevance of environmental disclosures: Are such disclosures incrementally informative? J. Account. Public Policy 2013, 32, 410–431. [Google Scholar] [CrossRef] [Scilit]
- García-Sánchez, I.-M.; Aibar-Guzmán, B.; Aibar-Guzmán, C. The effect of institutional ownership and ownership dispersion on eco-innovation. Technol. Forecast. Soc. Change 2020, 158, 120173. [Google Scholar] [CrossRef] [Scilit]
- Cao, J.; Liang, H.; Zhan, X. Peer effects of corporate social responsibility. Manag. Sci. 2019, 65, 5487–5503. [Google Scholar]
- Sun, H.; Edziah, B.; Sun, X.; Kporsu, A. Institutional quality, green innovation and energy efficiency. Energy Policy 2019, 135, 111002. [Google Scholar] [CrossRef] [Scilit]
- Fatemi, A.; Glaum, M.; Kaiser, S. ESG performance and firm value: The moderating role of disclosure. Glob. Financ. J. 2018, 38, 45–64. [Google Scholar] [CrossRef] [Scilit]
- Wang, L.; Long, Y.; Li, C. Research on the impact mechanism of heterogeneous environmental regulation on enterprise green technology innovation. J. Environ. Manag. 2022, 322, 116127. [Google Scholar] [CrossRef] [Scilit] [PubMed]
- Xie, A.Q.; Tang, J.; Zhang, Y. Multilevel modeling of corporate environmental performance: Evidence from Chinese manufacturing firms. Bus. Strategy Environ. 2022, 31, 3245–3263. [Google Scholar] [CrossRef] [Scilit]
- Bell, A.; Jones, K. Explaining fixed effects: Random effects modeling of time-series cross-sectional and panel data. Political Sci. Res. Methods 2015, 3, 133–153. [Google Scholar]
- Spence, M. Job market signaling. Q. J. Econ. 1973, 87, 355–374. [Google Scholar] [CrossRef] [Scilit]
- Suchman, M.C. Managing legitimacy: Strategic and institutional approaches. Acad. Manag. Rev. 1995, 20, 571–610. [Google Scholar] [CrossRef] [Scilit]
- Patten, D.M.; Zhao, N. Standalone CSR reporting by U.S. retail companies. Account. Forum 2014, 38, 132–144. [Google Scholar] [CrossRef] [Scilit]
- Freeman, R.E.; Dmytriyev, S.; Phillips, R.A. Stakeholder theory and the resource-based view of the firm. J. Manag. 2021, 47, 1757–1770. [Google Scholar] [CrossRef] [Scilit]
- Yu, Y.; Lei, B.; Wang, J. Does green credit policy promote firm green innovation? Evidence from China. Bus. Strategy Environ. 2022, 31, 3678–3692. [Google Scholar]
- Hu, G.; Wang, X.; Wang, Y. Can the green credit policy stimulate green innovation in heavily polluting enterprises? Evidence from a quasi-natural experiment in China. Energy Econ. 2021, 98, 105134. [Google Scholar] [CrossRef] [Scilit]
- Delmas, M.; Burbano, V. The drivers of greenwashing. Calif. Manag. Rev. 2011, 54, 64–87. [Google Scholar] [CrossRef] [Scilit]
- Flammer, C. Corporate green bonds. J. Financ. Econ. 2021, 142, 499–516. [Google Scholar] [CrossRef] [Scilit]
- He, Y.; Tang, Q.; Wang, K. Carbon performance versus financial performance. China J. Account. Res. 2013, 6, 97–115. [Google Scholar]
- Jensen, M.C.; Meckling, W.H. Theory of the firm: Managerial behavior, agency costs and ownership structure. J. Financ. Econ. 1976, 3, 305–360. [Google Scholar] [CrossRef] [Scilit]
- Hambrick, D.C.; Mason, P.A. Upper echelons: The organization as a reflection of its top managers. Acad. Manag. Rev. 1984, 9, 193–206. [Google Scholar] [CrossRef] [Scilit] [PubMed]
- de Villiers, C.; Naiker, V.; van Staden, C.J. The effect of board characteristics on firm environmental performance. J. Manag. 2011, 37, 1636–1663. [Google Scholar] [CrossRef] [Scilit]
- Faleye, O.; Hoitash, R.; Hoitash, U. The costs of intense board monitoring. J. Financ. Econ. 2011, 101, 160–181. [Google Scholar]
- Dong, W.; Dong, X.; Lv, X. How does ownership structure affect corporate environmental responsibility? Evidence from the manufacturing sector in China. Energy Econ. 2022, 112, 106112. [Google Scholar] [CrossRef] [Scilit]
- Luo, K.; Zhang, K. Executive’s environmental background and sustainable development: Evidence from substantial green innovation. Sustain. Dev. 2024, 32, 4812–4828. [Google Scholar] [CrossRef] [Scilit]
- Hodgkinson, G.P.; Healey, M.P. Psychological foundations of dynamic capabilities: Reflexion and reflection in strategic management. Strateg. Manag. J. 2011, 32, 1500–1516. [Google Scholar] [CrossRef] [Scilit]
- Krueger, P.; Sautner, Z.; Starks, L.T. The importance of climate risks for institutional investors. Rev. Financ. Stud. 2020, 33, 1067–1111. [Google Scholar] [CrossRef] [Scilit]
- Yang, Z.; Su, D.; Xu, S.; Han, X. Institutional investors and corporate green innovation: Evidence from China. Pac. Econ. Rev. 2024, 29, 230–266. [Google Scholar] [CrossRef] [Scilit]
- Pfeffer, J.; Salancik, G.R. The External Control of Organizations: A Resource Dependence Perspective; Stanford University Press: Redwood City, CA, USA, 2003. [Google Scholar]
- Marquis, C.; Qian, C. Corporate social responsibility reporting in China: Symbol or substance? Organ. Sci. 2014, 25, 127–148. [Google Scholar] [CrossRef] [Scilit]
- Lin, B.; Ma, R. How does digital finance influence green technology innovation in China? Evidence from the financial covering perspective. J. Environ. Manag. 2022, 320, 115833. [Google Scholar] [CrossRef] [Scilit] [PubMed]
- Fan, G.; Wang, X.L.; Zhu, H.P. NERI Index of Marketization of China’s Provinces; Economic Science Press: Beijing, China, 2019. [Google Scholar]
- Zhang, H.; Xu, S.; Wang, S. Marketization, environmental regulation and green innovation efficiency. Environ. Sci. Pollut. Res. 2021, 28, 65318–65335. [Google Scholar] [CrossRef] [Scilit] [PubMed]
- Raudenbush, S.W.; Bryk, A.S. Hierarchical Linear Models: Applications and Data Analysis Methods, 2nd ed.; Sage Publications: Thousand Oaks, CA, USA, 2002. [Google Scholar]
- Hox, J.J.; Moerbeek, M.; van de Schoot, R. Multilevel Analysis: Techniques and Applications, 3rd ed.; Routledge: Abingdon, UK, 2017. [Google Scholar]
- Shanghai Stock Exchange. Guidelines No. 14 of Shanghai Stock Exchange for Self-Regulation of Listed Companies—Sustainability Report (Trial); Shanghai Stock Exchange: Shanghai, China, 2024; Available online: https://english.sse.com.cn/news/newsrelease/c/10753174/files/7896ece797ed435684b77591c8d372a4.pdf (accessed on 10 May 2026).
- Meng, X.H.; Zeng, S.X.; Xie, X.M.; Qi, G.Y. Beyond symbolic and substantive: Strategic disclosure of corporate environmental information in China. Bus. Strategy Environ. 2019, 28, 403–417. [Google Scholar] [CrossRef] [Scilit]
- Aghion, P.; Dechezleprêtre, A.; Hemous, D.; Martin, R.; Van Reenen, J. Carbon taxes, path dependency, and directed technical change: Evidence from the auto industry. J. Political Econ. 2016, 124, 1–51. [Google Scholar] [CrossRef] [Scilit]
- Wang, X.; Fan, G.; Hu, Y. Marketization Index of China’s Provinces: NERI Report 2021; Social Sciences Academic Press: Beijing, China, 2021. [Google Scholar]
- Han, Y.; Qu, S.; Han, F. Research and evaluation of spatiotemporal dynamic of network green innovation efficiency in China—based on meta-frontier theory. Front. Environ. Sci. 2023, 11, 1209883. [Google Scholar] [CrossRef] [Scilit]
- Clarkson, P.M.; Li, Y.; Richardson, G.; Vasvari, F. Revisiting the relation between environmental performance and environmental disclosure. Account. Organ. Soc. 2008, 33, 303–327. [Google Scholar] [CrossRef] [Scilit]
- Tone, K. A slacks-based measure of efficiency in data envelopment analysis. Eur. J. Oper. Res. 2001, 130, 498–509. [Google Scholar] [CrossRef] [Scilit]
- Tone, K. A slacks-based measure of super-efficiency in data envelopment analysis. Eur. J. Oper. Res. 2002, 143, 32–41. [Google Scholar] [CrossRef] [Scilit]
- Zhang, L.; Mol, Y.; He, J. Executives’ environmental background and corporate environmental performance: Evidence from China. Bus. Strategy Environ. 2021, 30, 4035–4052. [Google Scholar] [CrossRef] [Scilit]
- Zhang, Q.; Yu, Z.; Kong, D. The real effect of legal institutions: Environmental courts and firm environmental protection expenditure. J. Environ. Econ. Manag. 2019, 98, 102254. [Google Scholar] [CrossRef] [Scilit]
- Cameron, A.C.; Miller, D.L. A practitioner’s guide to cluster-robust inference. J. Hum. Resour. 2015, 50, 317–372. [Google Scholar] [CrossRef] [Scilit]
- Hox, J.J.; Roberts, J.K. Handbook of Advanced Multilevel Analysis; Routledge: Abingdon, UK, 2011. [Google Scholar]
- McNeish, D.; Stapleton, L.M. The effect of small sample size on two-level model estimates: A review and illustration. Educ. Psychol. Rev. 2016, 28, 295–314. [Google Scholar] [CrossRef] [Scilit]
- Goldstein, H. Multilevel Statistical Models, 4th ed.; Wiley: Hoboken, NJ, USA, 2011. [Google Scholar]
- Muthén, B.; Asparouhov, T. Bayesian structural equation modeling: A more flexible representation of substantive theory. Psychol. Methods 2012, 17, 313–335. [Google Scholar] [CrossRef] [Scilit] [PubMed]
- Feng, Z.; Zeng, B.; Ming, Q. Environmental regulation, two-way foreign direct investment, and green innovation efficiency in China’s manufacturing industry. Int. J. Environ. Res. Public Health 2018, 15, 2292. [Google Scholar] [CrossRef] [Scilit] [PubMed]
- Hong, Y.; Jiang, X.; Xu, H.; Yu, C. The impacts of China’s dual carbon policy on green innovation: Evidence from Chinese heavy-polluting enterprises. J. Environ. Manag. 2024, 350, 119620. [Google Scholar] [CrossRef] [Scilit] [PubMed]
- Zhang, Y.; Xing, C.; Wang, Y. Does green innovation mitigate financing constraints? Evidence from China’s private enterprises. J. Clean. Prod. 2020, 264, 121698. [Google Scholar] [CrossRef] [Scilit]
- Aguinis, H.; Gottfredson, R.K.; Culpepper, S.A. Best-practice recommendations for estimating cross-level interaction effects using multilevel modeling. J. Manag. 2013, 39, 1490–1528. [Google Scholar] [CrossRef] [Scilit]
- He, G.; Lu, X.; Wang, Q. Independent directors and corporate environmental responsibility: Evidence from China. Corp. Gov. Int. Rev. 2022, 30, 712–731. [Google Scholar] [CrossRef] [Scilit]
- Ding, X.; Xu, Z.; Petrovskaya, M.V.; Wu, K.; Ye, L.; Sun, Y.; Makarov, V.M. Exploring the impact mechanism of executives’ environmental attention on corporate green transformation: Evidence from the textual analysis of Chinese companies’ management discussion and analysis. Environ. Sci. Pollut. Res. 2023. [Google Scholar] [CrossRef] [Scilit] [PubMed]
- Dyck, A.; Lins, K.V.; Roth, L.; Wagner, H.F. Do institutional investors drive corporate social responsibility? International evidence. J. Financ. Econ. 2019, 131, 693–714. [Google Scholar] [CrossRef] [Scilit]
- Acemoglu, D.; Aghion, P.; Bursztyn, L.; Hemous, D. The environment and directed technical change. Am. Econ. Rev. 2012, 102, 131–166. [Google Scholar] [CrossRef] [Scilit] [PubMed]
- Lin, T.; Chen, Z. Does market integration promote green technology innovation? Evidence from China. Front. Environ. Sci. 2022, 10, 1097616. [Google Scholar] [CrossRef] [Scilit]
- Roberts, M.R.; Whited, T.M. Endogeneity in empirical corporate finance. In Handbook of the Economics of Finance; Elsevier: Amsterdam, The Netherlands, 2013; Volume 2, pp. 493–572. [Google Scholar]
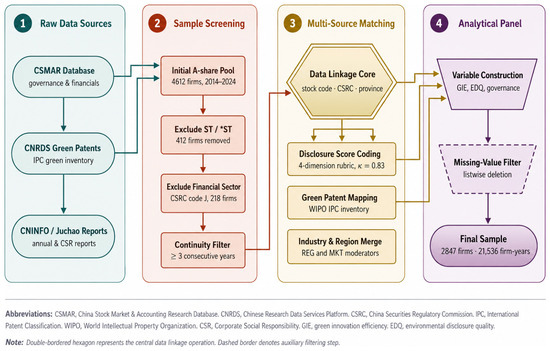
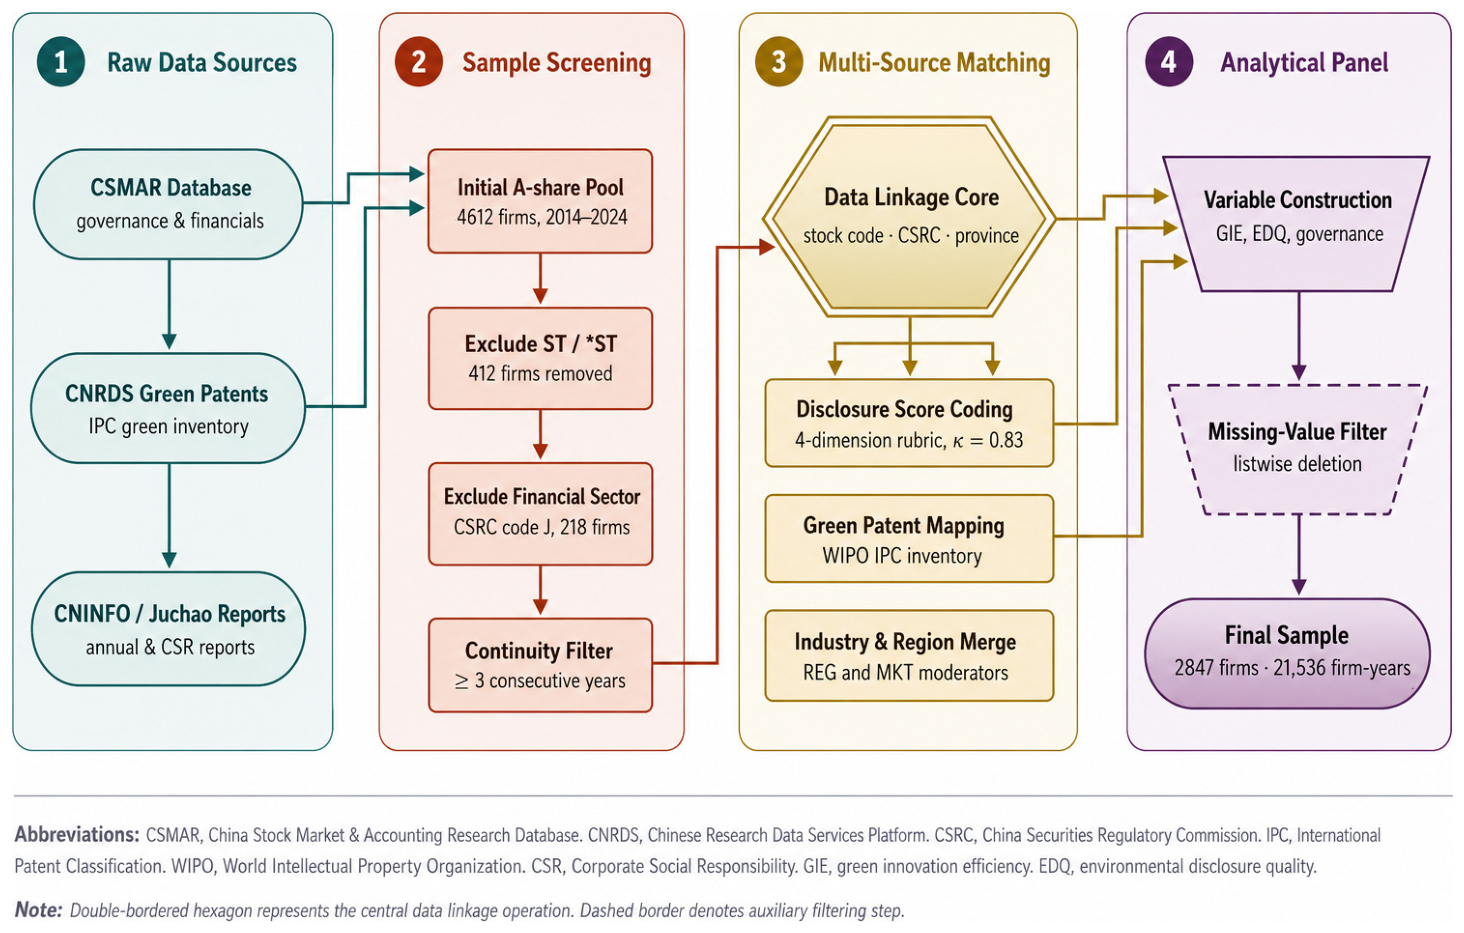
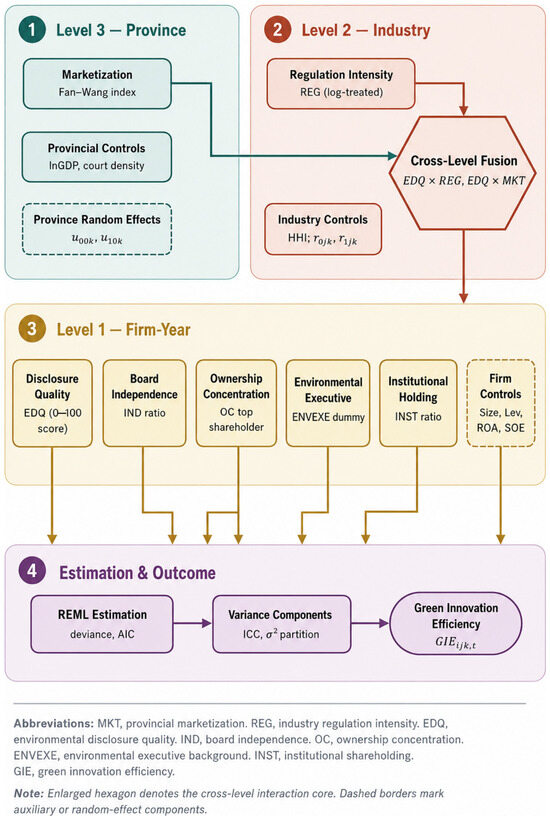
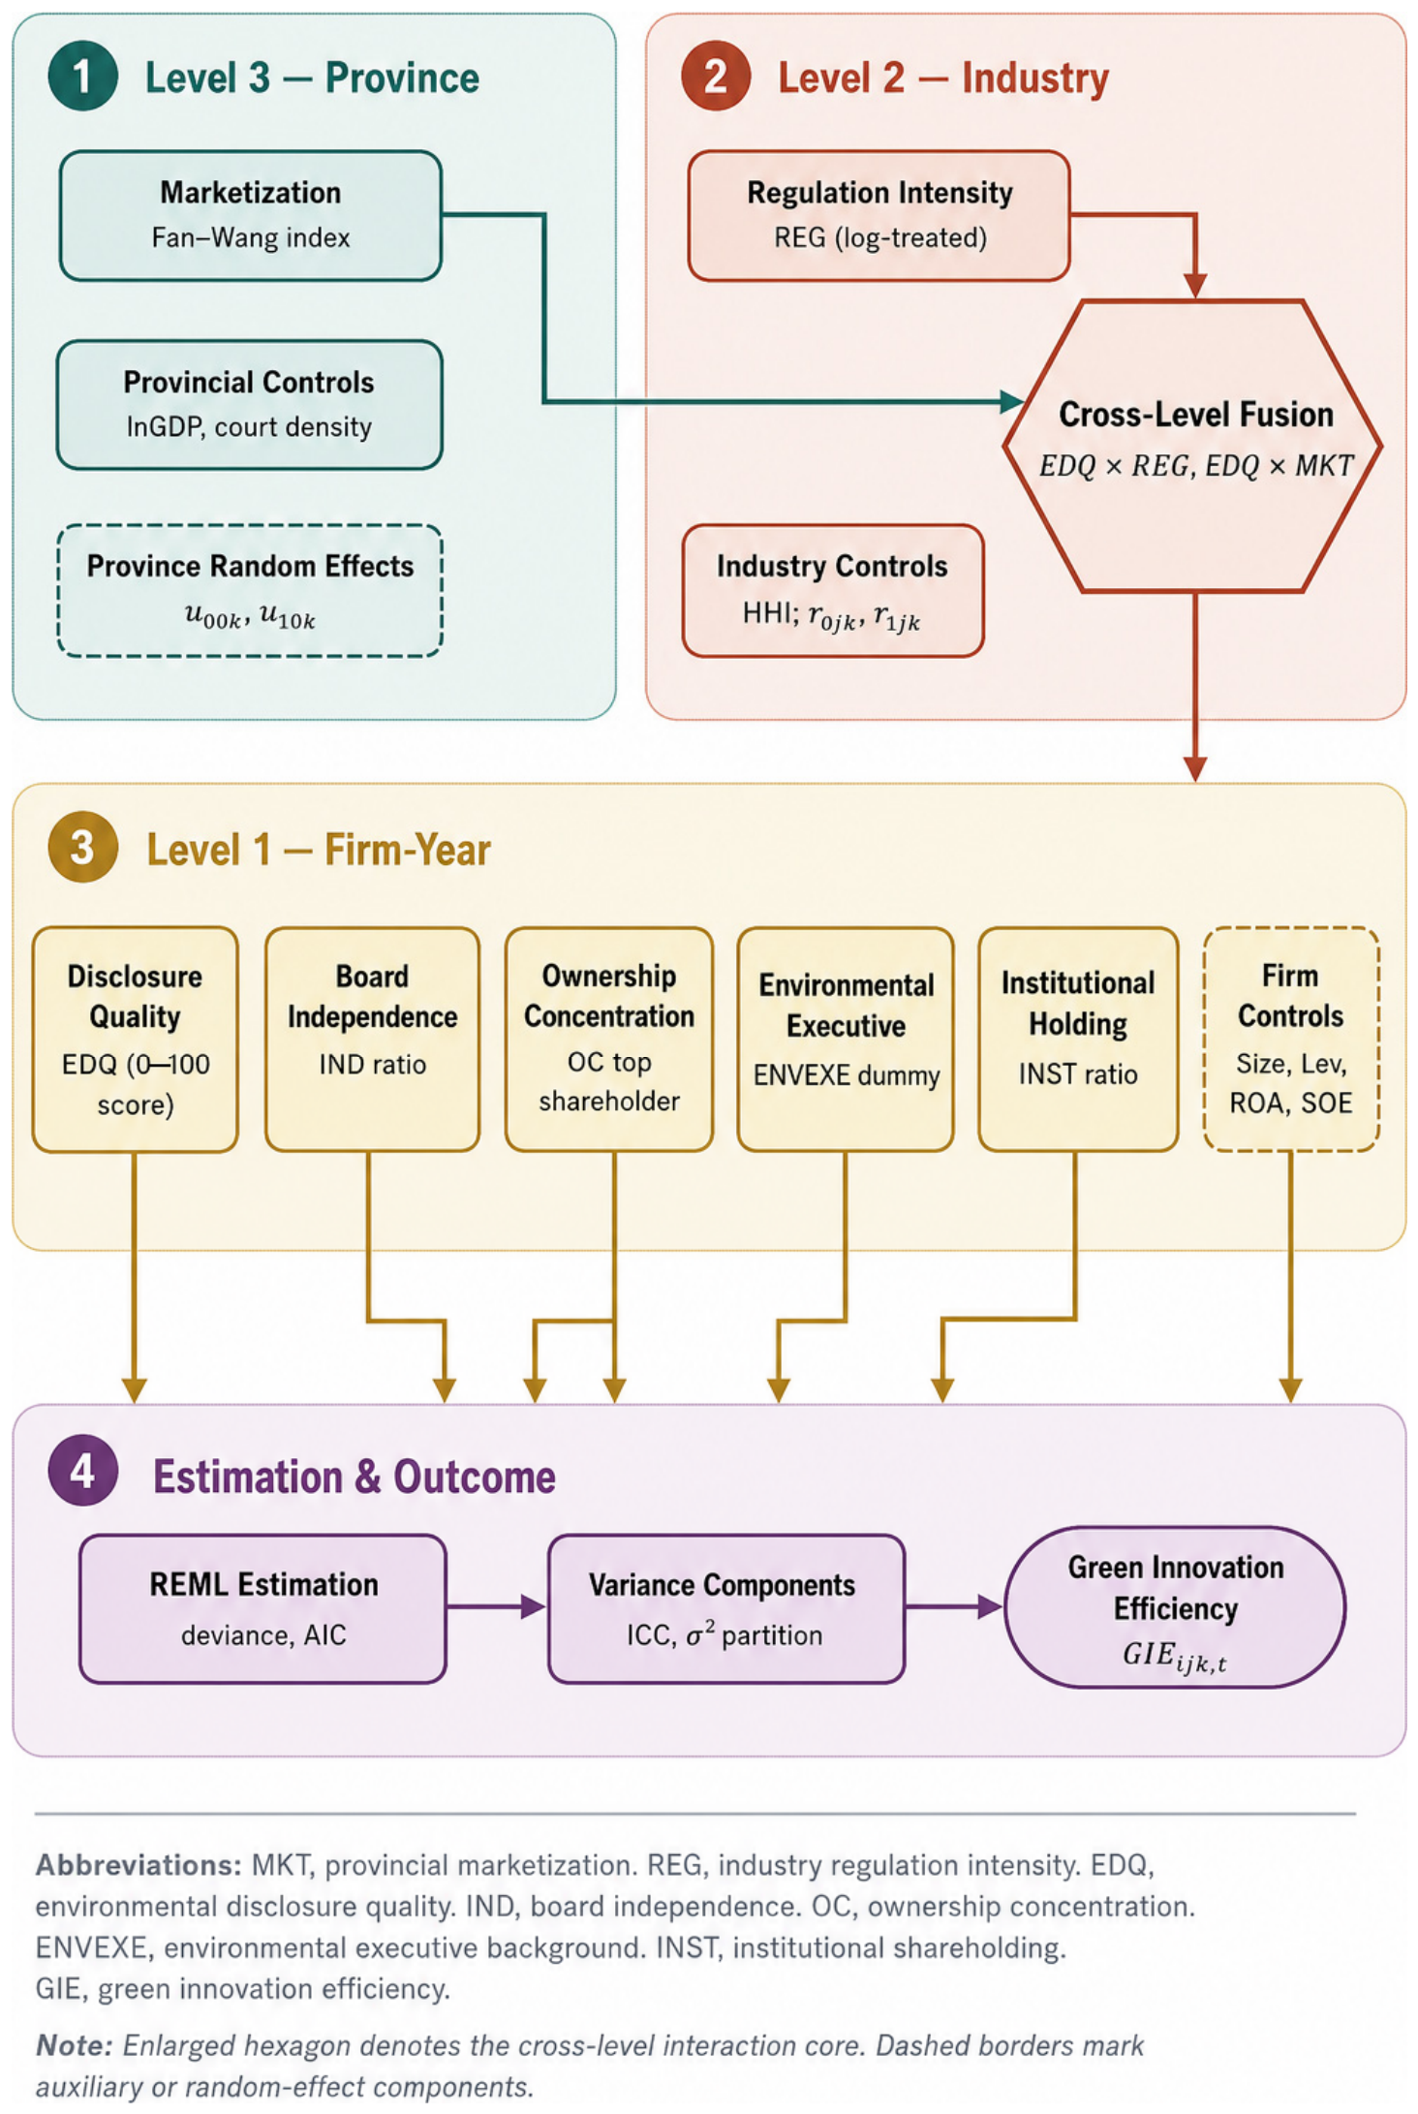
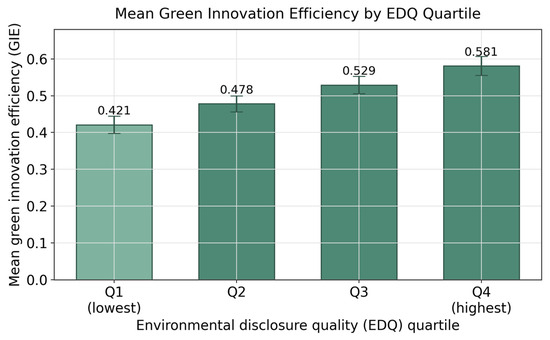
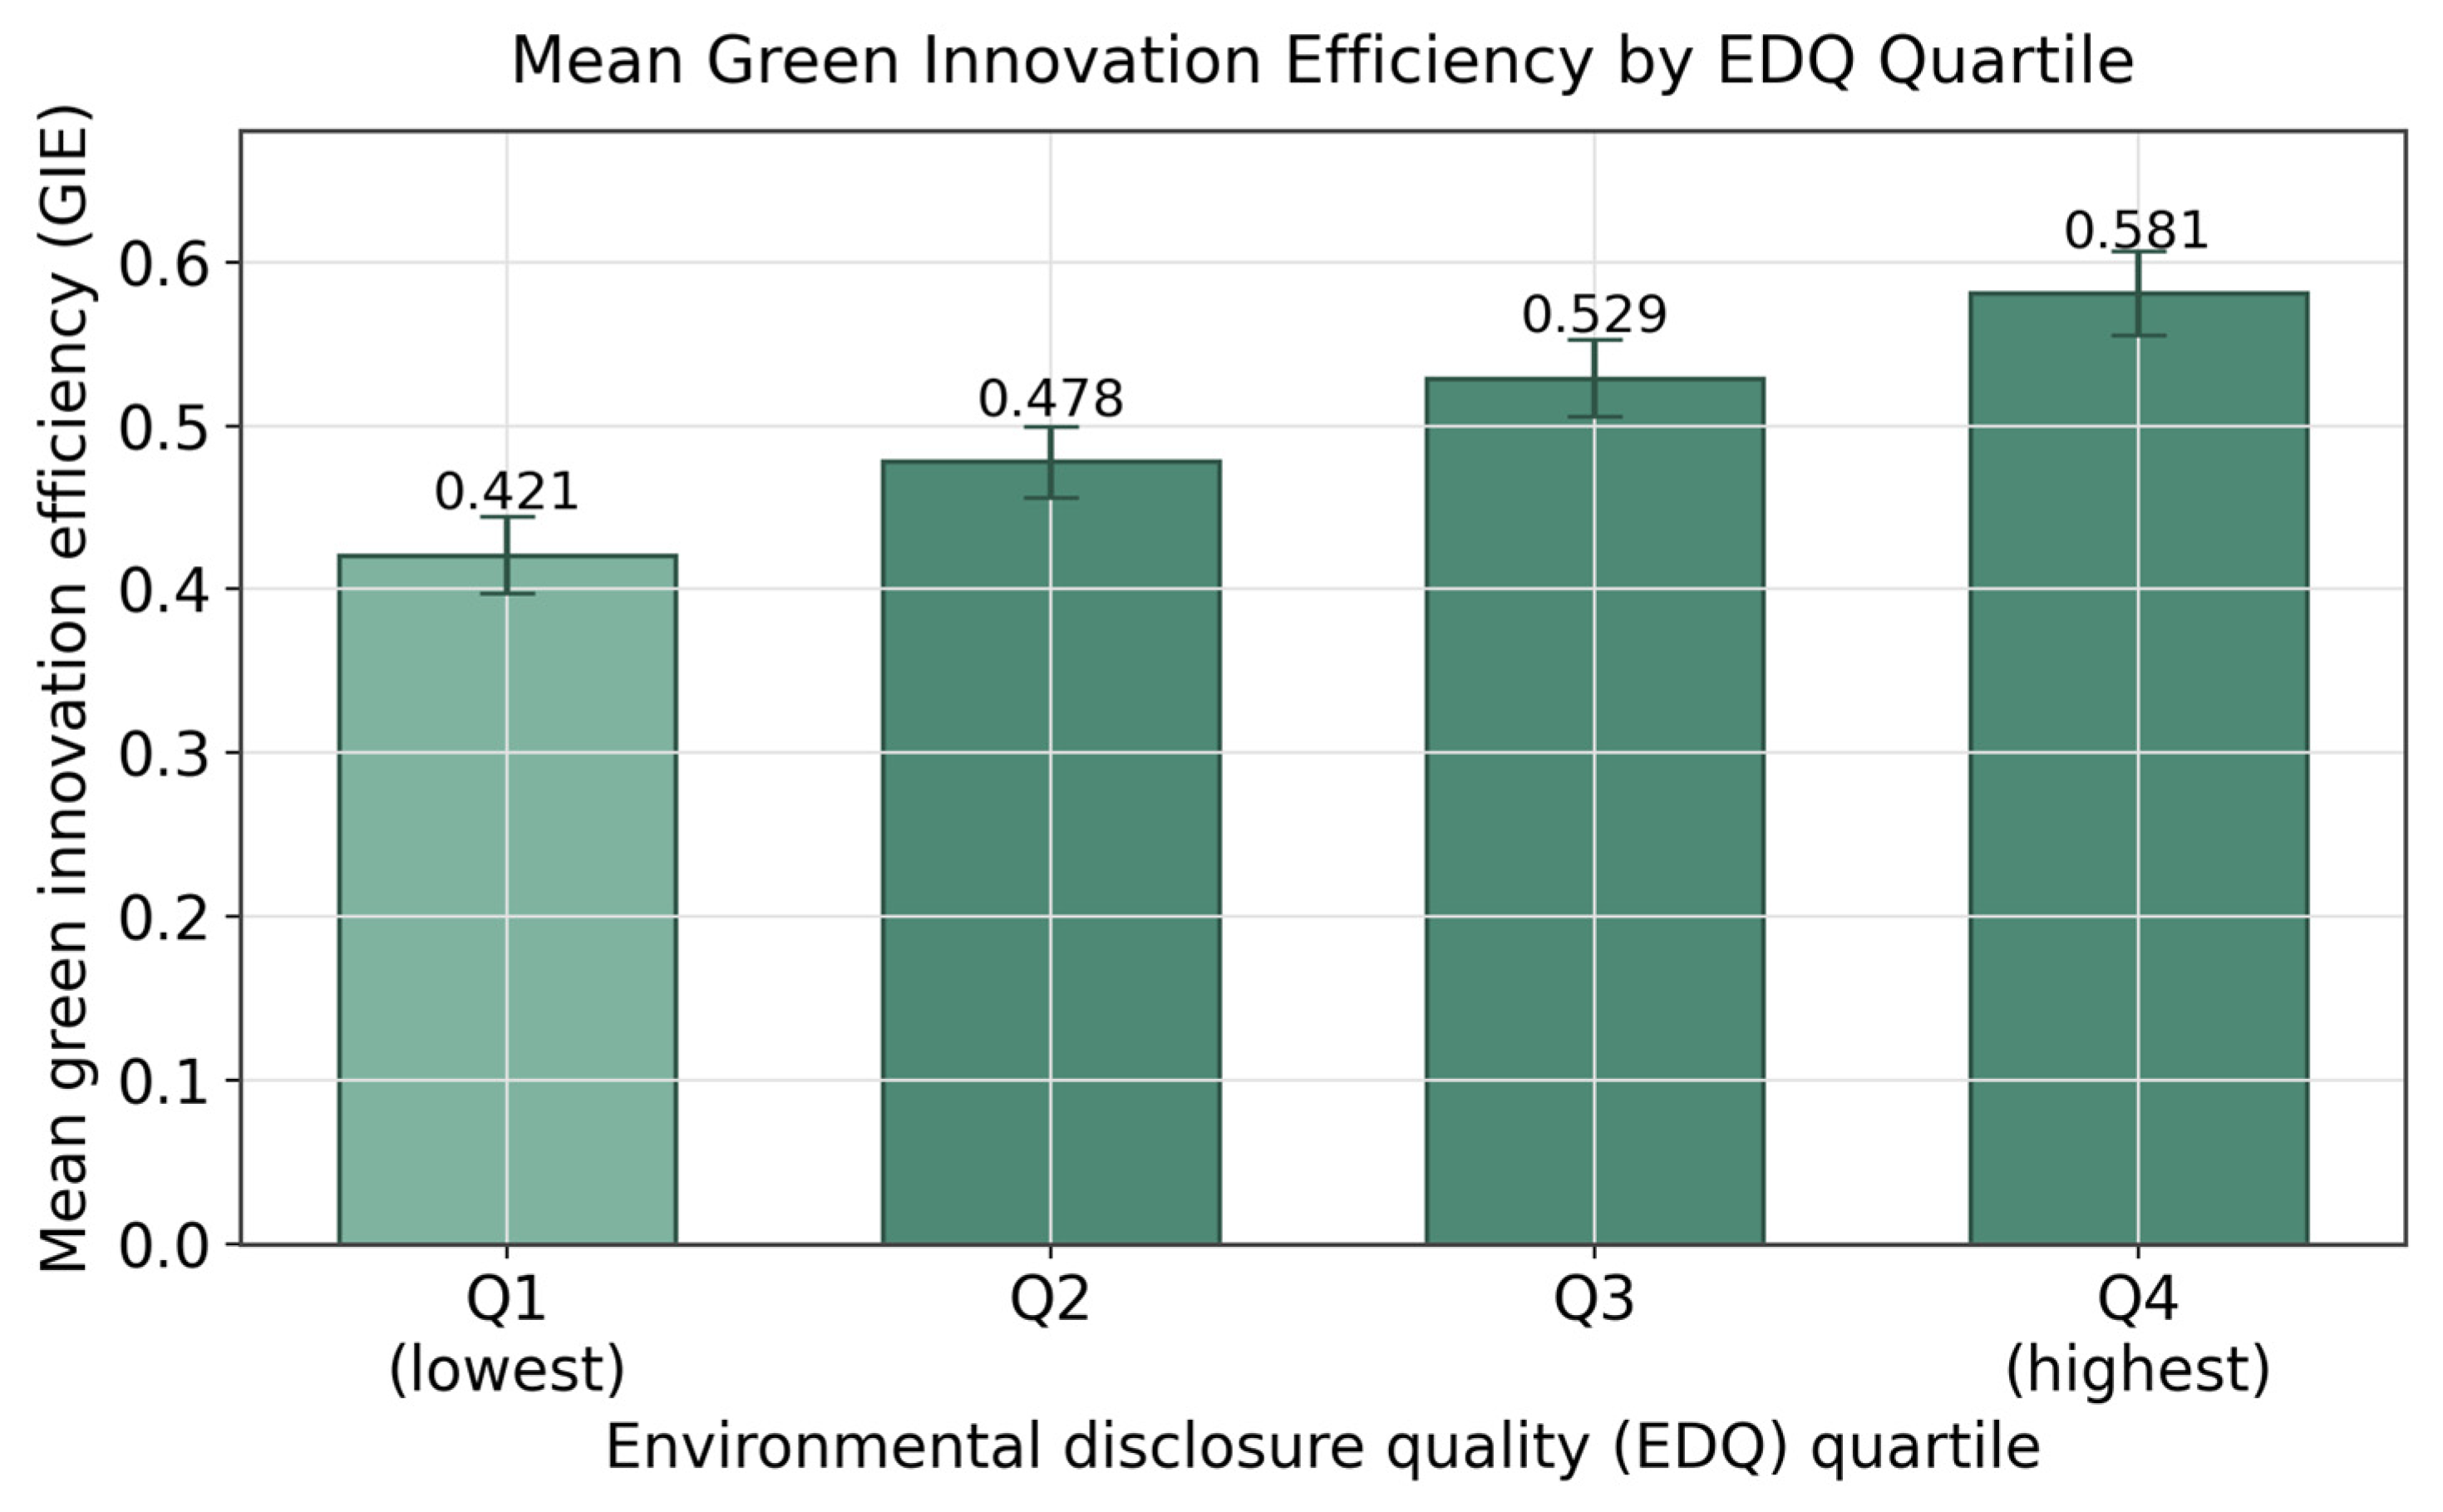
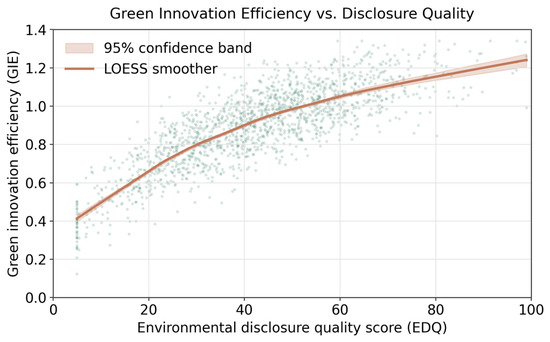
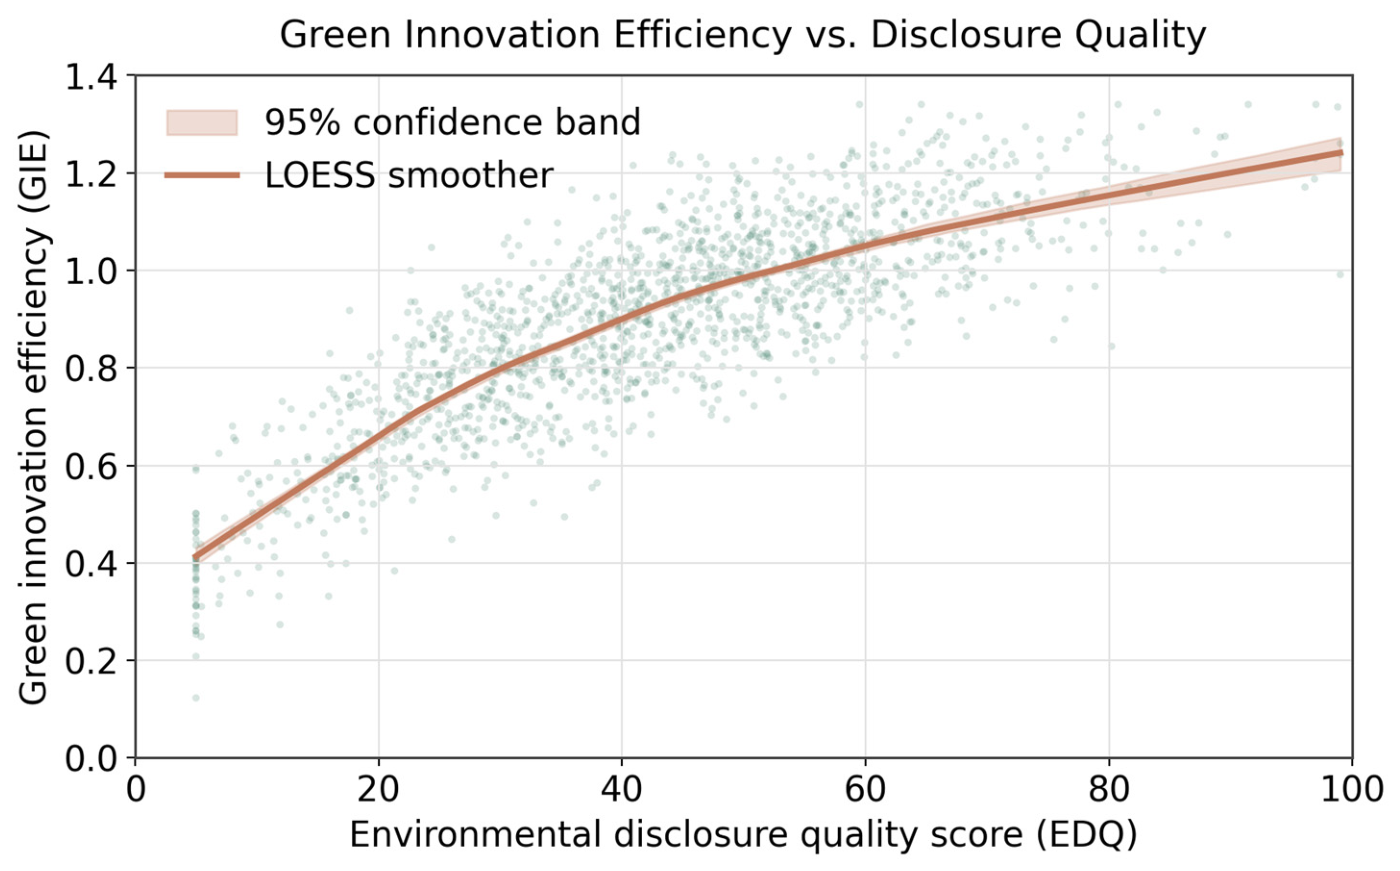
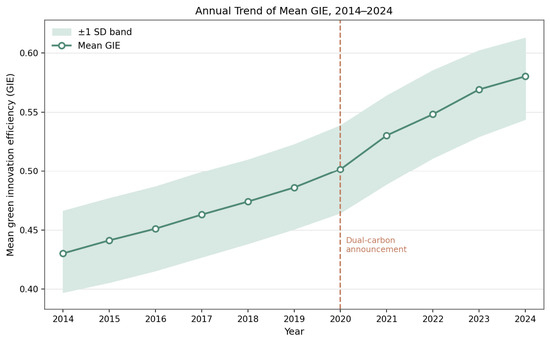
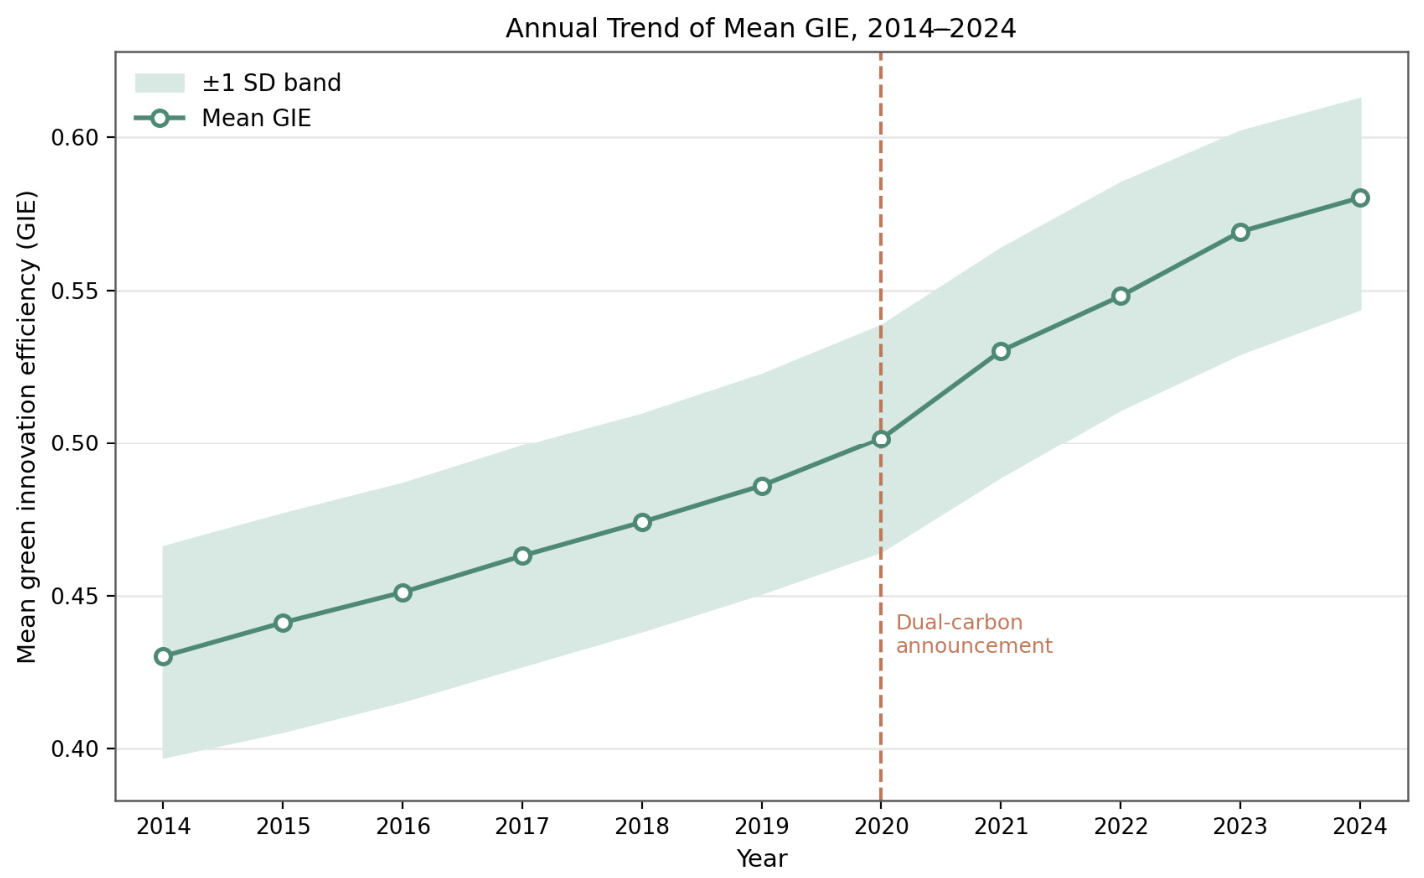
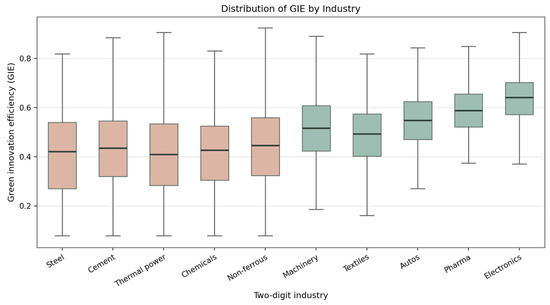
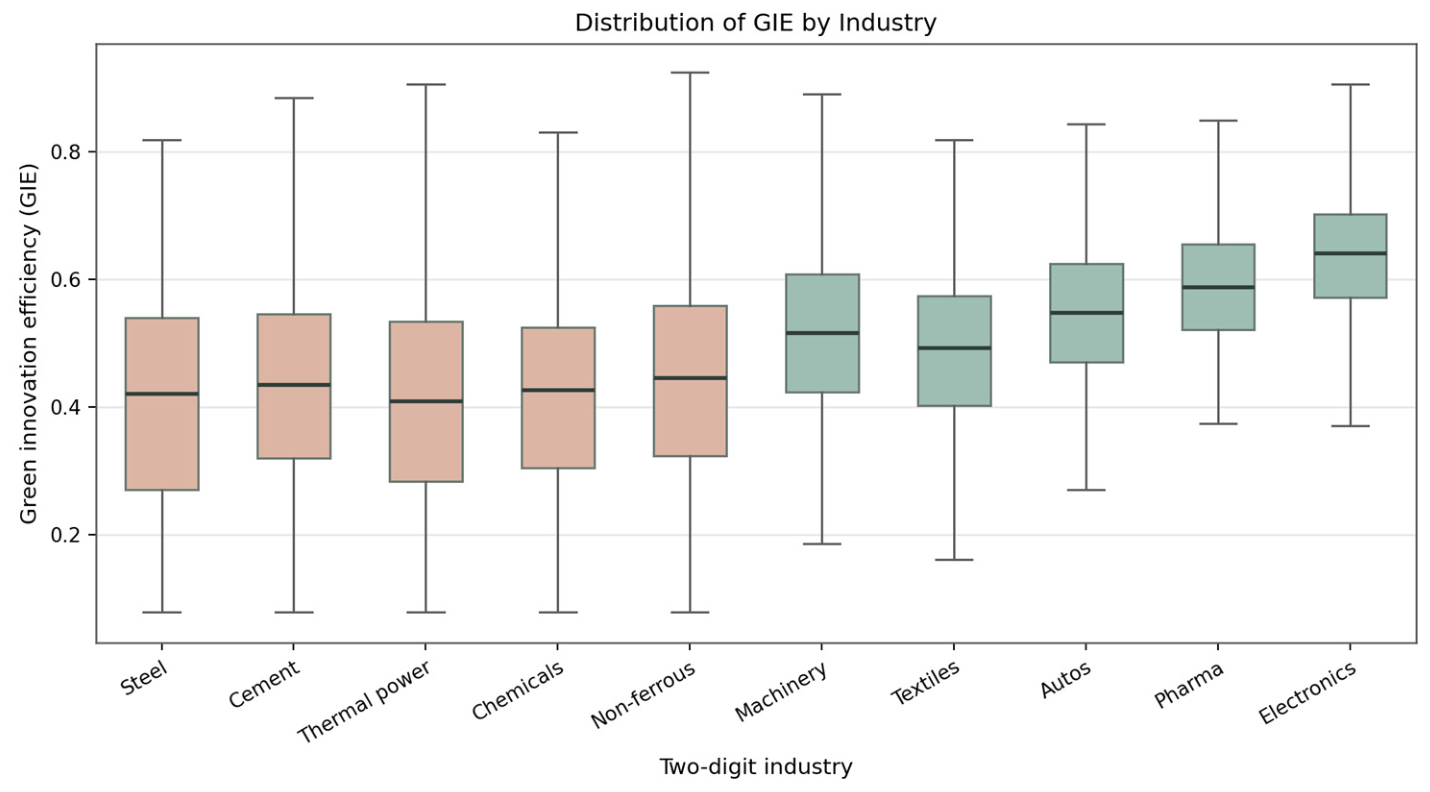
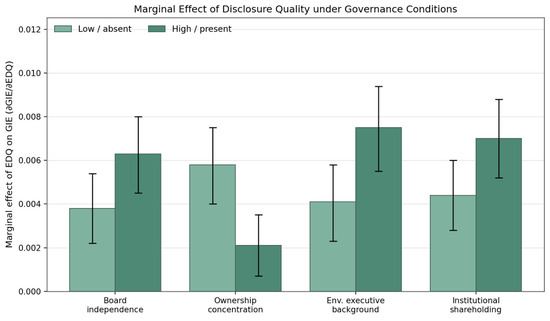
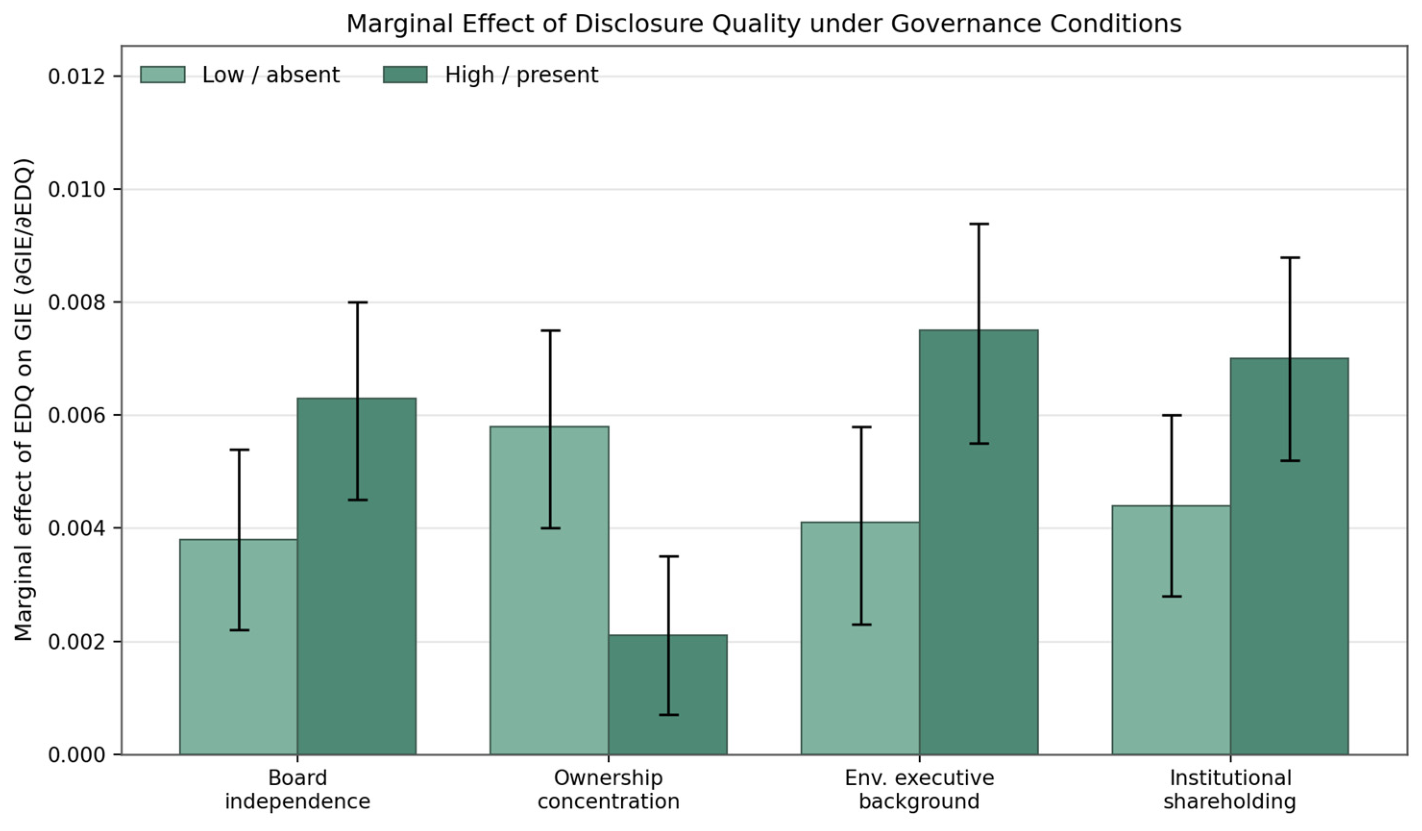
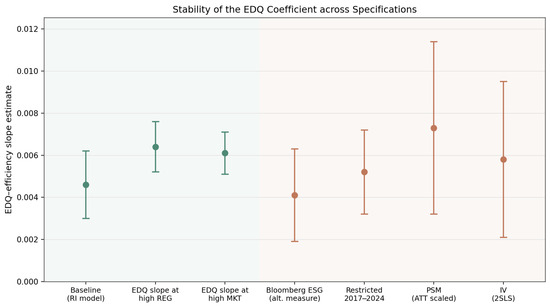
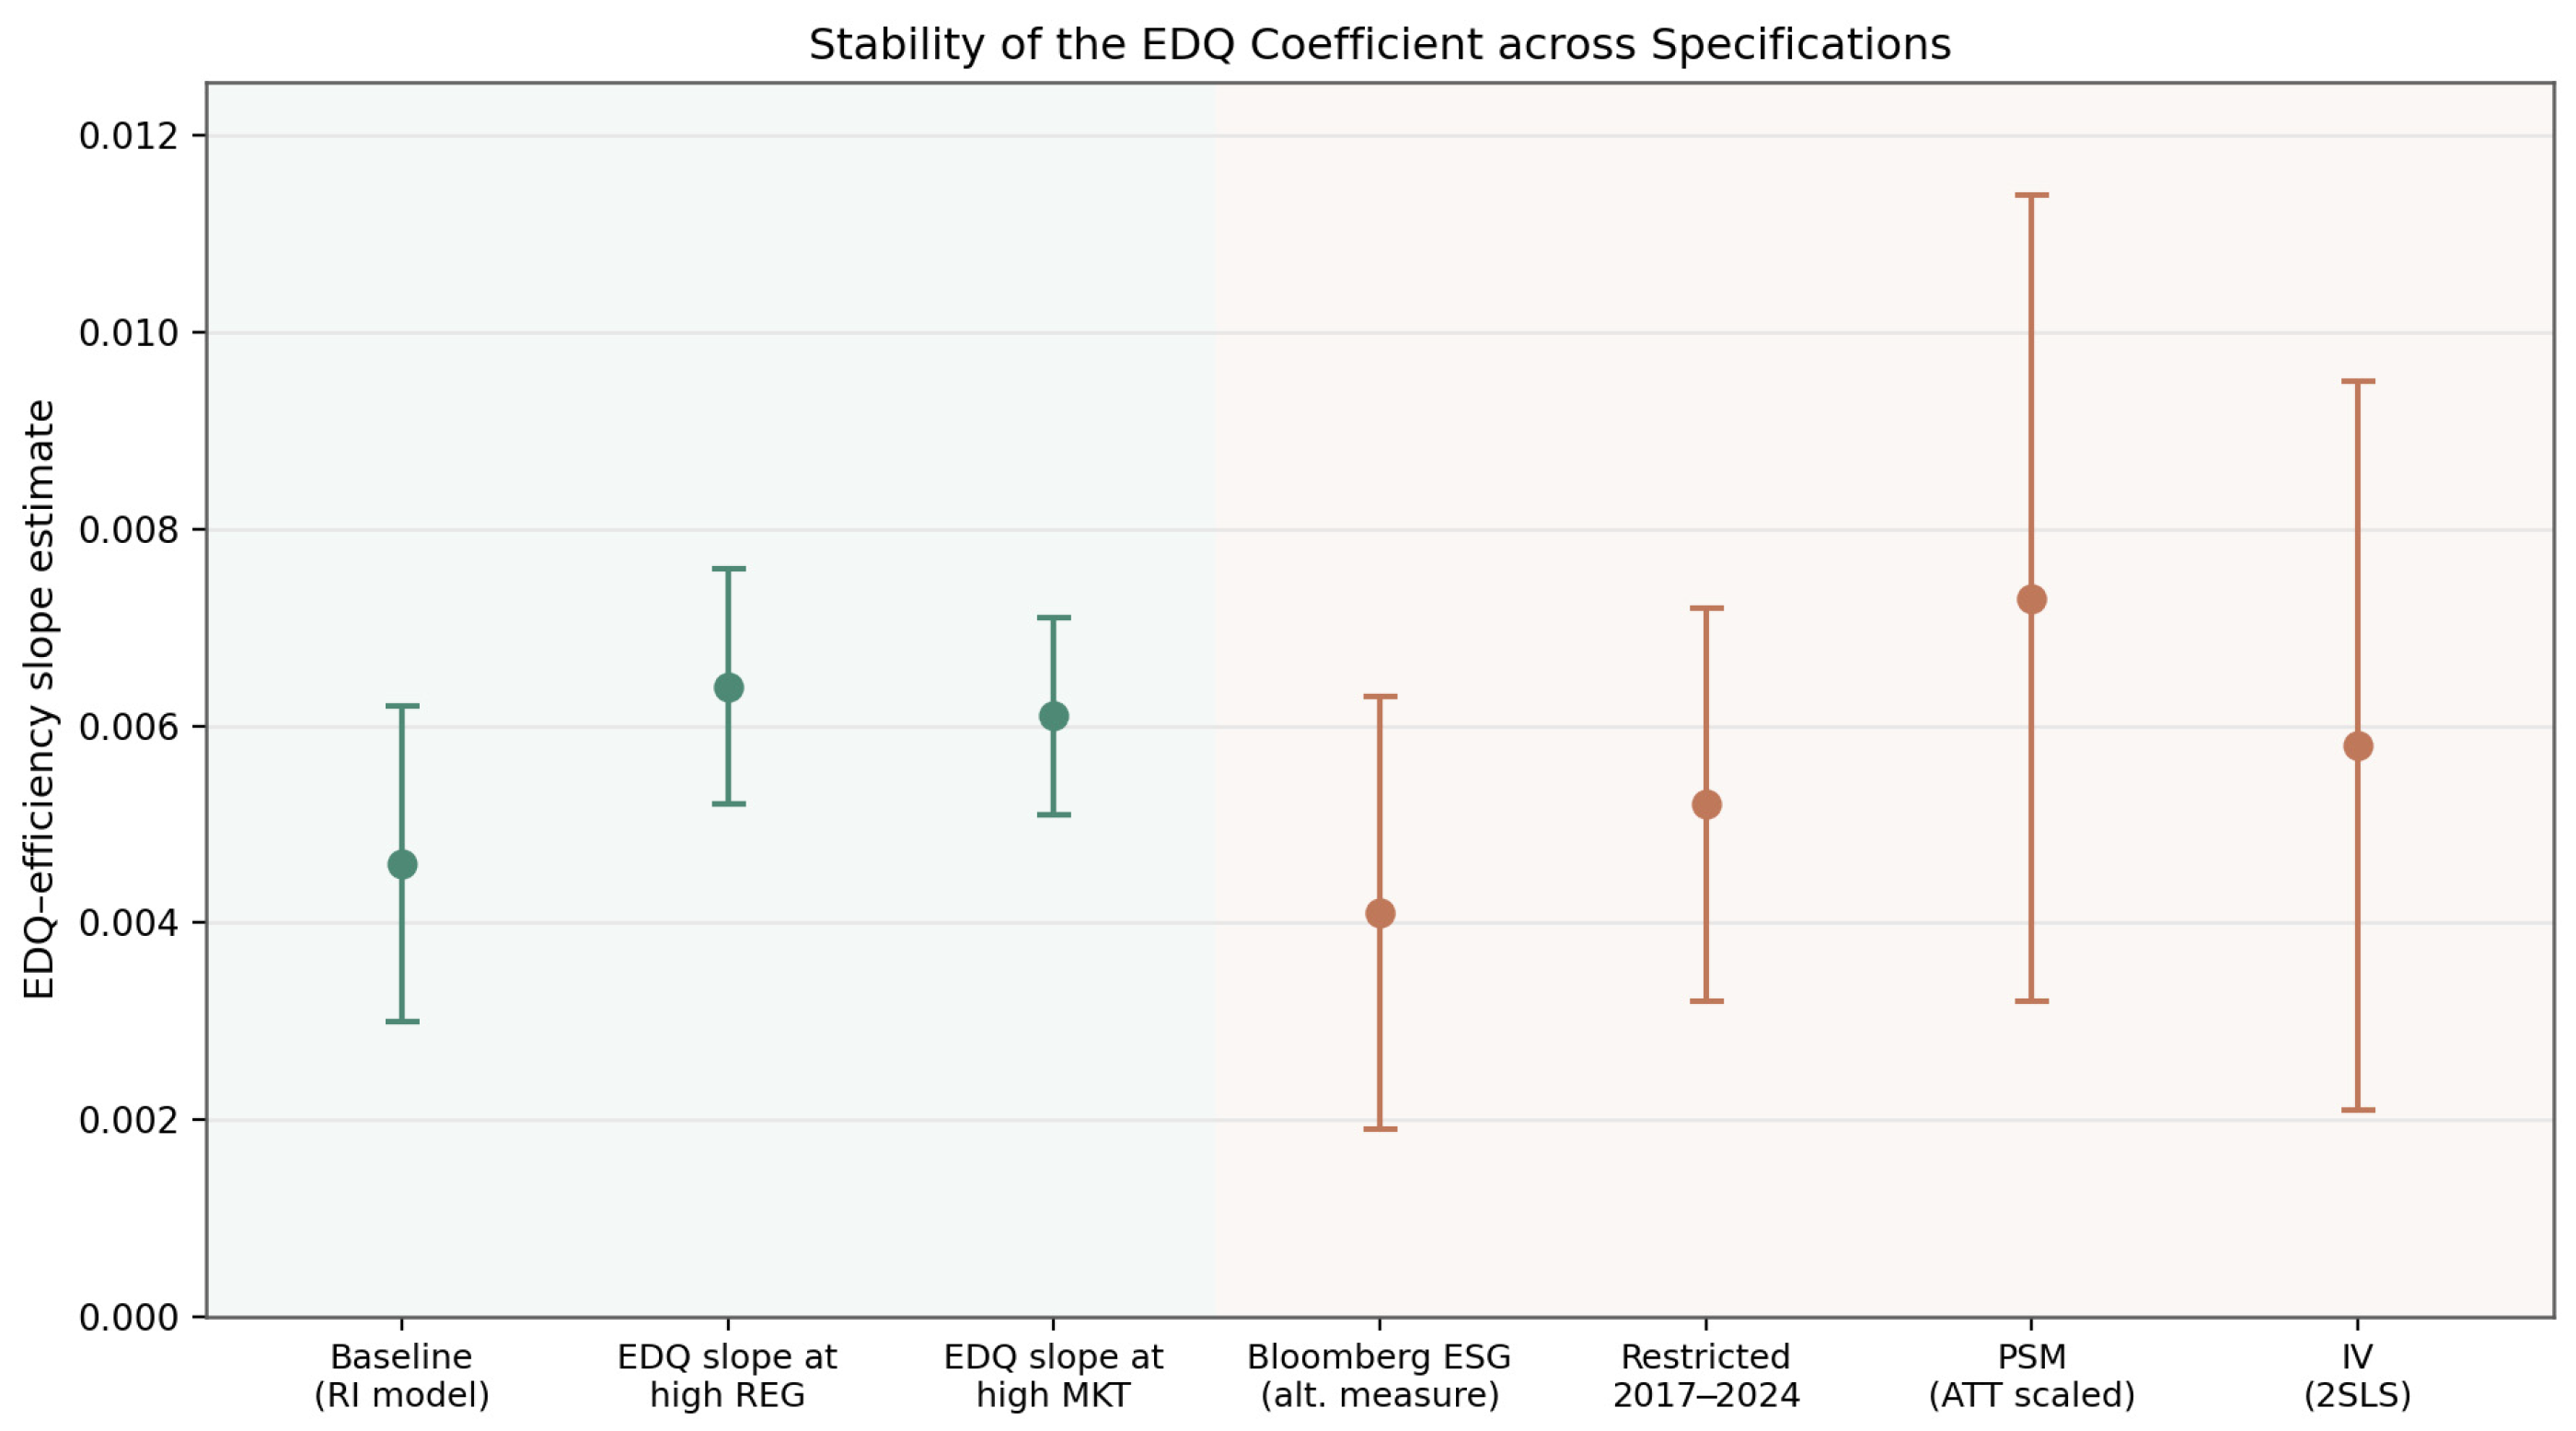

Disclaimer/Publisher’s Note: The statements, opinions and data contained in all publications are solely those of the individual author(s) and contributor(s) and not of MDPI and/or the editor(s). MDPI and/or the editor(s) disclaim responsibility for any injury to people or property resulting from any ideas, methods, instructions or products referred to in the content. |
© 2026 by the authors. Licensee MDPI, Basel, Switzerland. This article is an open access article distributed under the terms and conditions of the Creative Commons Attribution (CC BY) license.