Article

Floating Versus Stranded Macro-Litter in an Urban Adriatic Coastal System: A One-Year Comparison of Two Litter Compartments in Dubrovnik (Croatia)


Institute for Marine and Coastal Research, University of Dubrovnik, 20000 Dubrovnik, Croatia
*
Author to whom correspondence should be addressed.
Sustainability 2026, 18(16), 8239; https://doi.org/10.3390/su18168239
Submission received: 30 June 2026 / Revised: 31 July 2026 / Accepted: 9 August 2026 / Published: 11 August 2026
(This article belongs to the Section Pollution Prevention, Mitigation and Sustainability)

Abstract

Coastal litter accumulates along urban shorelines, yet the floating and stranded litter compartments of tourism-intensive coastal cities are rarely characterised side by side. We conducted monthly macro-litter surveys over one year (April 2023–March 2024) at two Dubrovnik sites less than 200 m apart, each representing a different litter compartment: Porat harbour, a semi-enclosed basin retaining floating litter, and Posat, an urban beach collecting stranded debris. Surveys followed the updated European MSFD marine litter monitoring guidance. In total, 1325 items were recorded at Porat and 1768 at Posat. The harbour was far more variable month to month (coefficient of variation 135% versus 77%), consistent with episodic basin retention. Artificial polymers dominated both compartments (84.9% at Porat; 79.2% at Posat), but the leading category differed: plastic fragments in the harbour and expanded polystyrene on the beach. Composition differed significantly between the two compartments (PERMANOVA, p = 0.038), though the separation was modest. Because each compartment requires a different sampling method, compartment and sampling method are fully confounded; absolute magnitudes are therefore reported separately and not compared. At Posat, where cleaning was suspended, the Clean Coast Index averaged 7.1 (moderate) but ranged from 1.5 to 21.9 between months, spanning all five cleanliness classes. These distinct signatures indicate that single-compartment monitoring may overlook urban coastal heterogeneity, and that mitigation requires compartment-specific measures.

1. Introduction

Plastic pollution is increasingly recognised as one of the most significant anthropogenic pressures on marine ecosystems and coastal environments worldwide [1,2,3]. Since the onset of large-scale plastic production in the 1950s, annual global output has risen from approximately 1.5 million tonnes to more than 430 million tonnes [4]. Owing to their durability, resistance to degradation, and widespread use, plastics persist for long periods and accumulate in terrestrial and marine habitats, where they threaten biodiversity through ingestion, entanglement, and habitat disturbance. Marine litter is commonly defined as any persistent, manufactured or processed solid material discarded, disposed of, or abandoned in marine and coastal environments [5,6]. Once at sea, it may remain afloat, accumulate on beaches, or sink to the seabed, with its distribution governed by hydrodynamic conditions, riverine inputs, and human activities [6,7,8]. Plastics are the principal component of marine litter worldwide and, owing to their buoyancy and persistence, may be transported over considerable distances before fragmenting, sinking, or accumulating in specific depositional areas [9,10]. In tourism-dependent coastal regions, litter accumulation also represents an economic concern, as polluted beaches diminish the aesthetic and recreational value of the coast [5].
Among global marine regions, the Mediterranean Sea is considered particularly vulnerable to marine litter pollution [11]. Its geographic confinement limits water renewal and maintains elevated pollutant concentrations, while dense coastal settlement, year-round maritime operations, and a pronounced summer tourism peak generate persistent, multiscalar litter inputs [3,11]. Reported plastic concentrations in the basin are comparable with those in major oceanic accumulation zones [12].
Within the Mediterranean, the Adriatic Sea is among the most sensitive sub-basins, with litter documented on beaches, at the sea surface, in seabed sediments, and within marine organisms [13,14,15]. It is a semi-enclosed basin of approximately 138,600 km2, extending some 800 km from the Gulf of Venice to the narrow Strait of Otranto [16]. Its surface circulation is predominantly cyclonic and is shaped by freshwater inflows, seasonal gyres, and the Bora and Sirocco winds [17,18,19]. Rivers are a principal pathway for land-based litter: the Po, Adige, and Isonzo in the north, and the Neretva and Buna–Bojana in the south-east, are major conduits for transboundary debris [13]. Numerous studies have documented floating debris, seabed litter, and beach litter throughout the Adriatic [15,19,20,21,22,23,24]. These studies consistently report a predominance of anthropogenic polymers, typically accounting for 90–95% of recorded items, particularly plastic fragments, bottle caps, and polystyrene pieces [13,21,22]. Croatia is particularly exposed, given the complexity and length of its coastline, which extends over 6278 km and includes 1246 islands [25]. This archipelagic configuration traps debris transported by regional currents, so that much litter originates from transboundary sources and intensifies during autumn and winter storms [13,19,24,26]. The deeply indented Croatian coast acts as a natural retention system for debris carried by prevailing currents and winds [13], particularly under the extremely unfavourable meteorological and hydrological conditions of autumn and early winter storms [13,26]. The problem is particularly acute on the southern Dalmatian islands. Under the prevailing circulation regime and during prolonged strong southerly winds, there is a markedly increased accumulation potential for the accumulation of transboundary debris on the exposed southern shores of Mljet, Vis, Korčula, and Lastovo, and on the Pelješac peninsula, where steep, funnel-shaped bays concentrate incoming debris and south-, south-east-, and south-west-facing beaches receive disproportionately large litter loads [8,13,23,26,27]. Within the EU Marine Strategy Framework Directive [28], urban coastal environments recognised as key entry points for litter [29], and harbours and urban beaches may show distinct accumulation patterns, as semi-enclosed harbour basins retain floating debris more efficiently than open, wave-exposed beaches [20,30]. However, data on the quantities, distribution, sources, and pathways of Adriatic litter remain limited and methodologically heterogeneous [26], and comparative, year-round studies contrasting functionally distinct urban coastal environments within the same city are still scarce.
This study addresses that gap by investigating marine litter dynamics at two functionally distinct urban sites in Dubrovnik: the Porat harbour, a semi-enclosed basin within the UNESCO World Heritage Site; and Posat, an urban beach beneath the historic city walls. Although both experience intense seasonal tourism, they contain different litter compartments (floating versus stranded litter) and differ in exposure and hydrodynamic conditions; each compartment therefore requires its own sampling method, so compartment and method are inseparable in any such comparison. Following the monitoring methodology recommended under the MSFD [31], for the stranded compartment and an adapted surface-skimming protocol for the floating compartment, the study aimed to (i) quantify and characterise macro-litter abundance and composition within each compartment; (ii) identify temporal accumulation patterns at monthly resolution and test whether the monthly fluctuations of the two compartments are correlated; (iii) contrast the floating (harbour) and stranded (beach) compartments using metrics that are independent of sampling geometry; (iv) assess beach cleanliness and (v) derive management implications specific to each compartment.
Three hypotheses were tested:
(i)
The floating compartment (harbour) exhibits greater month-to-month variability than the stranded compartment (beach), and their monthly fluctuations follow independent temporal trajectories;
(ii)
The floating and stranded compartments carry distinct material signatures;
(iii)
Litter accumulation increases during the tourist season, more strongly in the floating compartment than in the stranded compartment.

2. Materials and Methods

2.1. Study Area

The study was conducted at two adjacent sites in Dubrovnik, Croatia, representing functionally distinct coastal environments: the Porat harbour and Posat urban beach (Figure 1).
Porat harbour is a semi-enclosed harbour basin located within Dubrovnik’s historic Old Town. The survey site extended 326 m along the harbour shoreline. It experiences intense maritime traffic, including recreational vessels, tourist boats and service craft, and lies close to urban infrastructure and tourism activities.
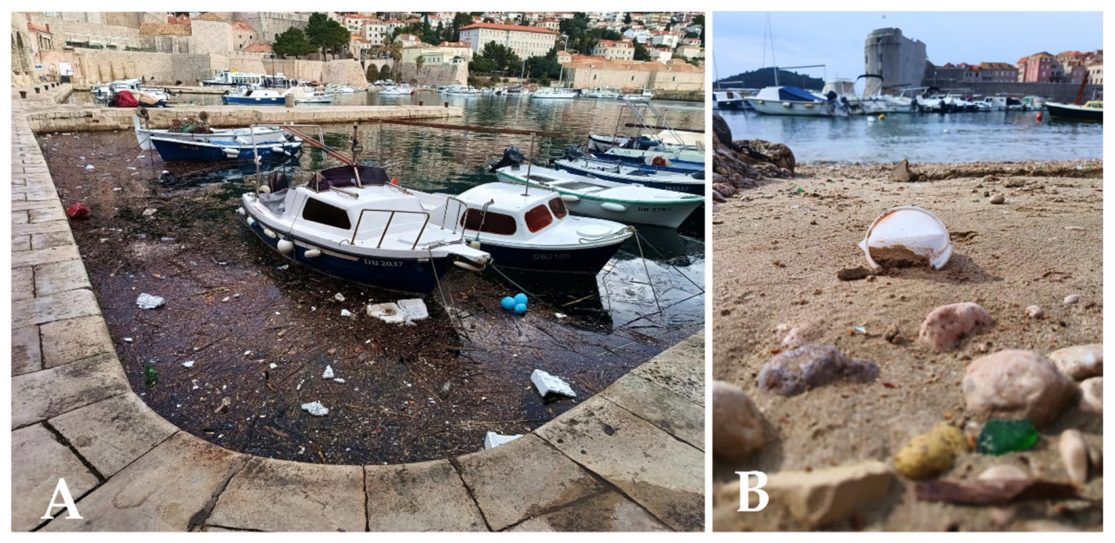
Posat is an urban beach directly beneath the city walls, less than 200 m from the harbour. It was surveyed over its full length (104 m) and width (approximately 4 m, widening to about 6.5 m at its broadest sections). The beach lies behind the Kaše breakwater and the small-craft berths and is subject to similar urban and tourism pressures (Figure 2).
Dubrovnik is a tourism-dominated coastal city, and both study sites lie within its most intensively visited area. At the 2021 census, the administrative area of the City of Dubrovnik had 41,562 permanent residents [32]. In 2023 the city recorded 1,246,178 tourist arrivals and 3,889,475 overnight stays, and in 2024 a further 1,356,136 arrivals and 4,270,230 overnight stays [33,34]; of these, 1,173,114 arrivals and 3,738,098 overnight stays occurred during the April–December 2023 part of our survey, and 74,512 arrivals and 162,504 overnight stays during the January–March 2024 part. Port traffic is concentrated in the passenger port of Gruž, north-west of the Old Town, which recorded 10,989 vessel arrivals in 2023 and 11,541 in 2024; for Dubrovnik city harbour (Porat), official data are available only for cruise-ship and yacht arrivals, totalling 332 in 2023 and 333 in 2024 [34].

2.2. Sampling

Monitoring was conducted monthly over a full annual cycle (April 2023–March 2024), with both compartments surveyed during the same period each month to capture seasonal variability. Beach surveys followed the Marine Strategy Framework Directive 2008/56/EC (MSFD) macro-litter monitoring methodology [31], keeping the beach data comparable with other MSFD-compliant programmes across the Adriatic and wider Mediterranean, while the harbour was monitored using an adapted surface-skimming approach.
At Porat harbour, floating surface litter was skimmed along the 326 m transect using a telescopic scoop net (Carp Zoom BETA-N2, 50 × 40 × 50 cm, 7 mm mesh; Energofish Ltd., Budapest, Hungary); no towed or trawled gear was used at any point. At Posat, a full standing-stock collection of all stranded litter was carried out over the entire beach, covering its full length (104 m) and width (approximately 4 m, widening to about 6.5 m at its broadest sections). Litter density is expressed per metre of shoreline; the Posat survey area of 416 m2 is used only for the Clean Coast Index. The beach met the MSFD length and accessibility criteria, although its semi-sheltered position behind the Kaše breakwater should be considered when interpreting stranding dynamics (Figure 1). All visible litter was collected manually during each monthly survey.
At our request, Čistoća Dubrovnik (the municipal utility responsible for cleaning the sea and coastline) suspended cleaning of both Posat beach and Porat harbour for the duration of the study, so that the litter recorded at each survey represents an unmanaged standing stock rather than the residue of a cleaning cycle.
Because surface skimming and whole-area stranding capture different components of the litter, the compartment and sampling method are fully confounded by design: the floating fraction of a harbour basin cannot be recovered by standing-stock collection, nor a beach by surface skimming, so method cannot be varied within a compartment or fitted as a covariate. All contrasts between the two compartments reported below are consequently descriptive, and absolute magnitudes (abundance, mass, density) are reported separately for each compartment rather than compared.
Items from both sites were processed identically. Each item was counted, weighed (Vox KW2700 digital scale, 5 kg capacity, 1 g resolution; Vox Electronics, Guangzhou, China), and assigned to a material category following MSFD guidelines [31]: artificial polymer materials (plastic), processed wood, textile, rubber, paper/cardboard, metal, glass/ceramics, and other materials. Where an item comprised several materials, it was classified by its predominant component. Items were weighed in their wet state after excess surface water had been removed, so recorded masses represent wet mass. Each item was then assigned to a specific litter category (e.g., plastic fragments, cigarette butts, bottle caps, food wrappers) to identify the most prevalent item types and potential pollution sources. Atmospheric pressure, wind speed and wind direction were obtained from the Croatian Meteorological and Hydrological Service [35] to describe the conditions during sampling. These records refer to the sampling dates themselves, not to cumulative antecedent conditions; because it is the rainfall, wind and wave energy of the preceding days rather than the state of the atmosphere on the survey morning that mobilise litter, the meteorological data are used only descriptively, and no statistical test relating litter to meteorological variables was performed.

2.3. Data Analysis

For each compartment, monthly litter abundance was recorded as total item count and total mass. Litter density was calculated as the number of items per metre of shoreline (items/m). Density is expressed per metre rather than per 100 m or per kilometre, as recommended for MSFD beach-litter reporting, because the surveyed beach is only 104 m long and the harbour transect 326 m; reporting per 100 m would require extrapolation beyond the surveyed extent. Values are directly convertible for comparison with MSFD-based studies by multiplying by 100 (mean 142 items/100 m at Posat and 34 items/100 m at Porat). Material composition was expressed as the percentage contribution of each category to the total item count and total mass. Beach cleanliness was assessed using the Clean Coast Index [36], calculated as:
C C I = T o t a l   n u m b e r   o f   l i t t e r   i t e m s S u r v e y   a r e a   i n   m 2 × 20
Following the formulation adopted in Adriatic and Mediterranean beach-litter assessments, all macro-litter items >= 2.5 cm were included in the numerator, rather than plastic items alone as in the original formulation of Alkalay et al. [36]. This ensures comparability with regional values reported for other Adriatic and Mediterranean beaches, most of which were derived on the same basis. Areal normalisation was applied only to the CCI; litter density was otherwise normalised to shoreline length. A representative width of 4 m was adopted, yielding a survey area of 416 m2 (104 m × 4 m). In the CCI calculation, the scaling constant of 20 [36] proposed by the original authors was applied. Because several sections of the site were locally wider, including them would raise the surveyed area and lower the per-area values; the resulting density and CCI values should therefore be regarded as conservative upper-bound estimates. CCI values were interpreted as very clean (<2), clean (2–5), moderate (5–10), dirty (10–20), and very dirty (>20).
Temporal patterns were analysed at monthly resolution. A single grouping into the tourist season (May–September) and the off-season (October–April) was applied to address the third hypothesis directly; no aggregation into calendar seasons was used in the descriptive analyses. Season was retained only as a grouping factor in the multivariate test of compositional structure, to verify that no seasonal signal was present that would require a coarser temporal level. Meteorological conditions on the sampling day are described qualitatively only.
For each compartment, temporal stability was summarised by total annual abundance (items and kg), monthly mean ± standard deviation (mass and density), and for monthly abundance, the minimum, maximum range, and the coefficient of variation (CV). Month-to-month synchronicity between the two compartments was tested with Pearson’s r and Spearman’s ρ across the twelve monthly surveys (n = 12), with significance set at p < 0.05 (two-tailed). No statistical test involving meteorological variables was performed, for the reason set out in Section 2.2.
Because the two compartments were sampled by different methods, absolute magnitudes—total abundance, total mass, and density—are not directly comparable between them and are reported separately for each compartment. The principal cross-compartment comparison was restricted to dimensionless, geometry-independent metrics: (i) material composition (percentage by count and by mass); (ii) the rank order of dominant item categories; (iii) the relative temporal structure of accumulation (CV, timing of monthly maxima, seasonal distribution as a percentage of the annual total, and the tourist- to off-season ratio); and (iv) the month-to-month correlation in abundance and mass between the two compartments.
Items smaller than 2.5 cm were excluded from the analysis because 2.5 cm is the lower size limit of the macro-litter fraction under the MSFD monitoring guidance [31]; the 5 mm threshold in that guidance separates micro-litter (<5 mm) from meso-litter (5 mm–2.5 cm), neither of which was addressed here. One exceptionally large item was retained in all totals and analyses.
Descriptive statistics were computed in Microsoft Excel (Microsoft Corporation, Redmond, WA, USA). In a separate exploratory analysis, differences between the two compartments were examined using Bray–Curtis dissimilarities [37] calculated from the raw monthly counts of each material group. This analysis therefore reflects combined differences in material composition and total abundance. Because litter compartment, sampling method and environmental setting are fully confounded, the multivariate analysis cannot isolate an independent environmental site effect. Compositional patterns were visualised by non-metric multidimensional scaling (NMDS) and tested with permutational multivariate analysis of variance (PERMANOVA, 9999 permutations) [38] and analysis of similarities (ANOSIM) [39]. Homogeneity of multivariate dispersion was assessed with permutational analysis of multivariate dispersions (PERMDISP) [40], and the contribution of individual material groups to between-compartment dissimilarity was quantified with similarity percentage analysis (SIMPER) [39]. Shannon and Simpson diversity indices were calculated for each monthly sample and compared between compartments using Mann–Whitney U tests. Seasonal structure in composition was also tested with PERMANOVA to establish whether season needed to be retained as an analytical level. Analyses were performed in R (version 4.5.3; R Foundation for Statistical Computing, Vienna, Austria) [41] with the vegan package (version 2.7-5) [42].

3. Results

3.1. Litter Abundance

3.1.1. Temporal Patterns at Porat Harbour

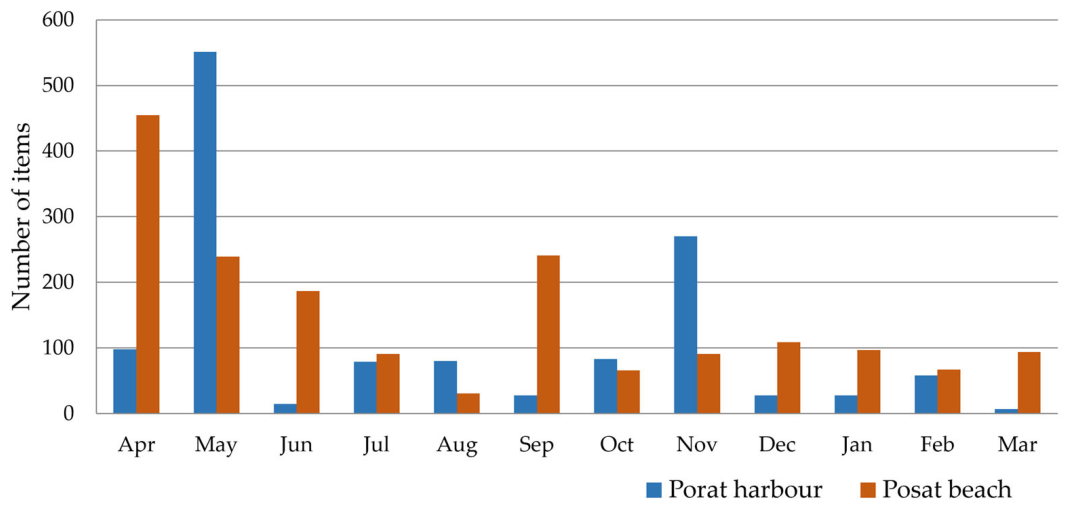
Over the 12-month monitoring period (April 2023 to March 2024), a total of 1325 items with a combined mass of 30.46 kg was recorded at Porat harbour. Monthly abundance showed pronounced temporal variability, ranging from a minimum of 7 items in March 2024 to a maximum of 551 items in May 2023 (Figure 3). This 79-fold difference between the minimum and the maximum indicates highly episodic accumulation, and the coefficient of variation for monthly item counts reached 135%, reflecting substantial month-to-month fluctuation within the basin. Accumulation was concentrated in individual months rather than spread evenly through the year: the May 2023 survey alone accounted for 41.6% of all items collected at Porat during the year, indicating a concentrated pulse of debris input. A single, unusually long plastic sheet (57 m; ~0.69 kg) was recorded in the harbour in December 2023, the longest individual item found during the study and an illustration of the large floating debris that the basin can trap.
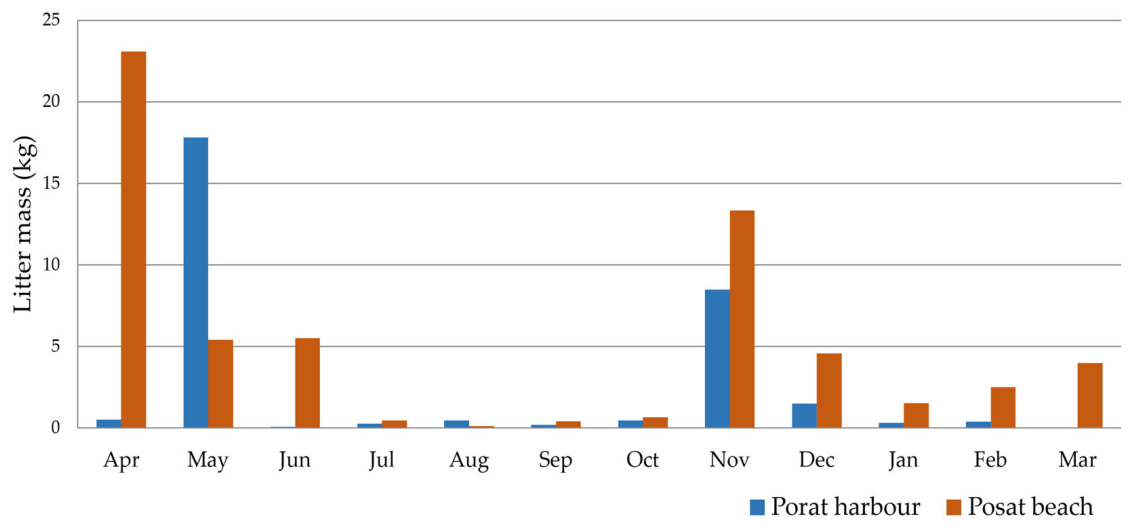
Monthly litter mass at Porat varied even more than item counts, reaching a maximum of 17.82 kg in May 2023 (Figure 3). The lightest months were March (0.01 kg, 7 items) and June (0.06 kg, 15 items), while the summer and early-autumn months (July–October) yielded only 0.19–0.47 kg despite containing 28–83 items. The mean monthly mass was 2.54 ± 5.13 kg, with a coefficient of variation of 202%. The mean density of floating litter density across the 326 m transect was 0.34 ± 0.46 items/m; this annual mean conceals the extreme month-to-month range of the compartment, which spanned approximately 0.02 items/m in March 2024 to 1.69 items/m in May 2023.
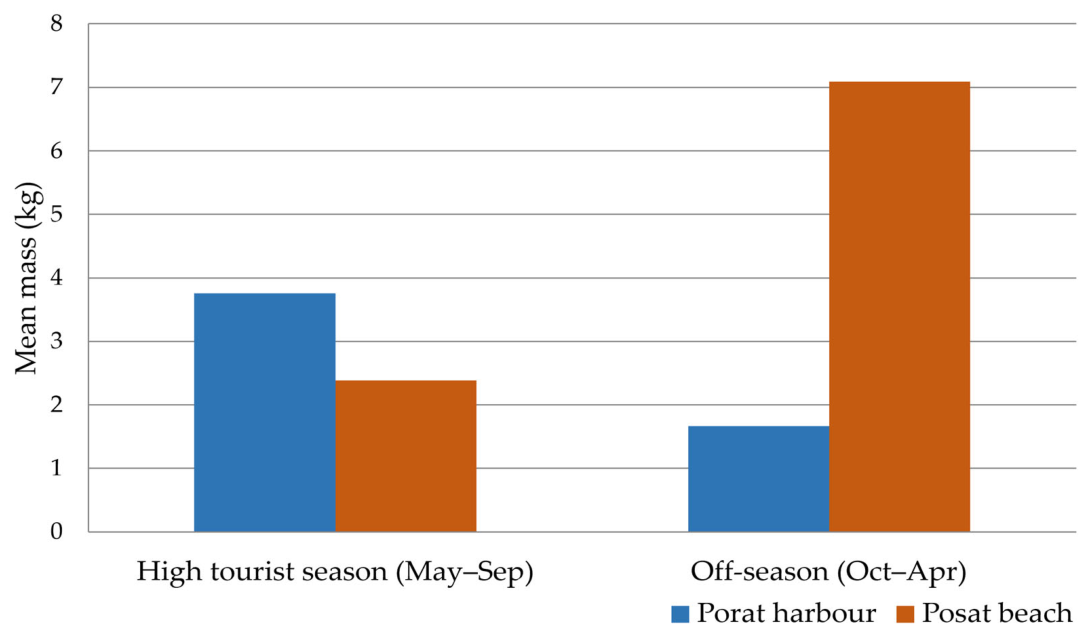
Grouped by tourism intensity, mean monthly abundance at Porat was 84% higher during the tourist season (May–September) than in the off-season (151 versus 82 items per month). Litter mass showed the same pattern, at 3.76 kg per month during the tourist season versus 1.67 kg per month in the off-season, a contrast that largely reflects the exceptional May load (Figure 4).

3.1.2. Temporal Patterns at Posat Beach

Over the same 12-month period, a total of 1768 items with a combined mass of 61.54 kg was recorded at Posat beach. Monthly abundance ranged from 31 items in August 2023 to 455 items in April 2023 (Figure 3), a 15-fold range, and the coefficient of variation for monthly item counts was 77%, indicating more consistent deposition than in the harbour basin. Monthly mass reached a maximum of 23.09 kg in April 2023 and fell to a minimum of 0.12 kg in August (31 items), with September the next lightest at 0.42 kg despite 241 items, and remained below 0.66 kg across July–October; the mean monthly mass was 5.13 ± 6.46 kg, with a coefficient of variation of 126% (Figure 4). Mean density was 1.42 ± 1.09 items/m. Because this value derives from whole-area standing-stock collection along the 104 m beach, whereas the Porat value reflects surface skimming along a 326 m transect, the two densities sample different litter compartments and are not directly comparable; each is reported only to characterise its own compartment.
As at Porat, accumulation was concentrated in individual months: the April 2023 survey accounted for 25.7% of the annual total at Posat. Grouped by tourism intensity, however, the beach behaved differently from the harbour. Mean monthly abundance was almost uniform between the tourist season and the off-season, whereas mass showed the opposite pattern to that recorded at Porat: off-season mass averaged 7.09 kg per month, roughly three times the tourist-season value of 2.38 kg per month (Figure 5).
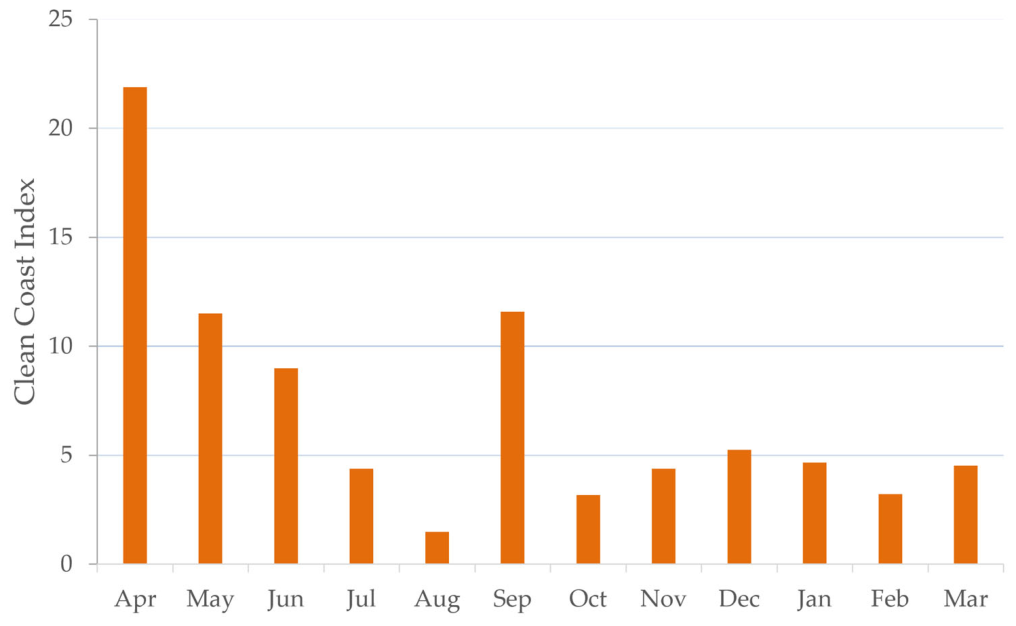
The mean annual CCI at Posat beach was 7.1, indicating a moderate level of pollution (Figure 6). Monthly values varied widely (coefficient of variation in the monthly CCI (77%), ranging from very clean in August 2023 (1.5) to very dirty in April 2023 (21.9), with the maximum roughly fifteen times the minimum. May and September were dirty (11.5 and 11.6, respectively), and June and December were moderate (8.9 and 5.2). July, October, November, January, February, and March were clean, and August was very clean. The index therefore spanned from very clean to very dirty within a single survey year.

3.2. Material Composition

3.2.1. Floating Litter at Porat Harbour

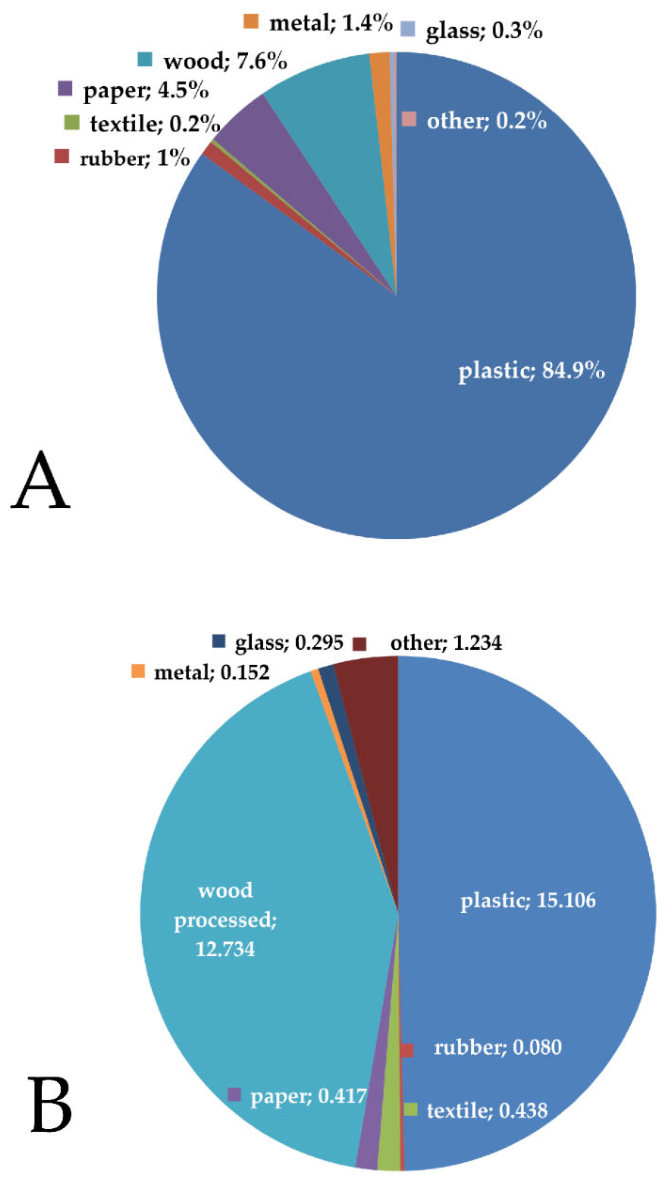
At Porat harbour, plastic items overwhelmingly dominated the litter assemblage, accounting for 84.9% of all items by count (Figure 7A). Wooden items formed the second most abundant category (7.6% of items), followed by paper and cardboard, metal, rubber, glass, textiles, and a residual ‘other’ category. The material composition by mass, however, showed a different pattern (Figure 7B). By mass, plastic remained the largest single fraction (49.6%), but wood contributed almost as much (41.8%), and the residual ‘other’ category accounted for 4.1%; the remaining categories each contributed very little.
Paper and cardboard items, although present, contributed little by mass (1.4%). Metal items, despite comprising only 1.4% of counts, represented 0.5% by mass.

3.2.2. Stranded Litter at Posat Beach

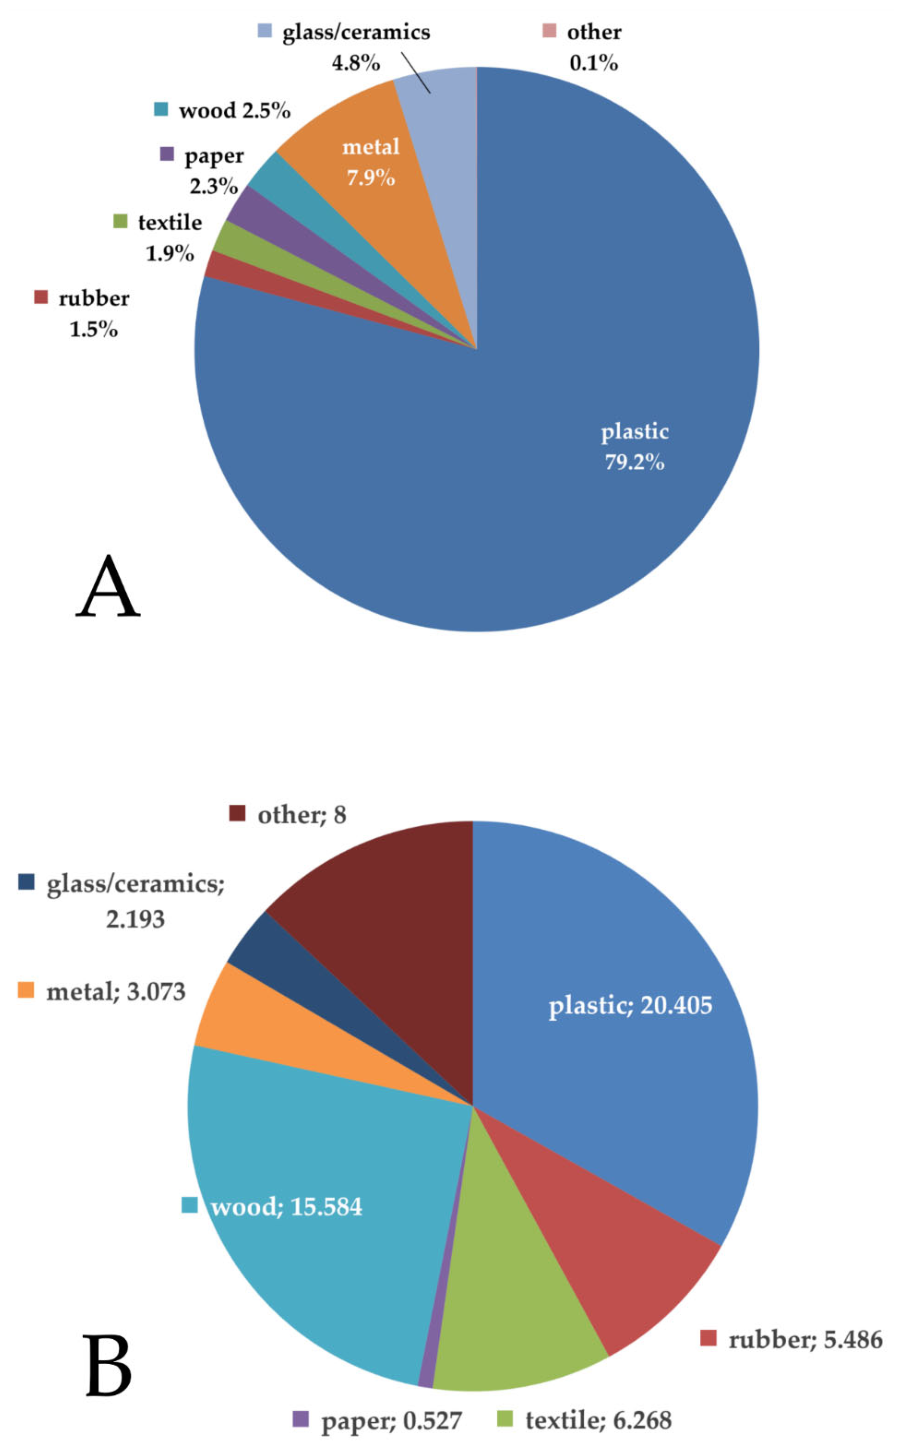
At Posat, plastic likewise dominated the assemblage by count (79.2%), followed by smaller contributions from metal, glass and other materials (Figure 8A). The composition by mass was distributed more evenly across material types (Figure 8B). Plastic accounted for only 33.2% by mass, markedly lower than its numerical dominance. Wood contributed 25.3%, the second-largest fraction by mass, while the residual ‘other’ category, textiles, rubber and metal all represented non-trivial proportions.

3.2.3. Dominant Item Categories

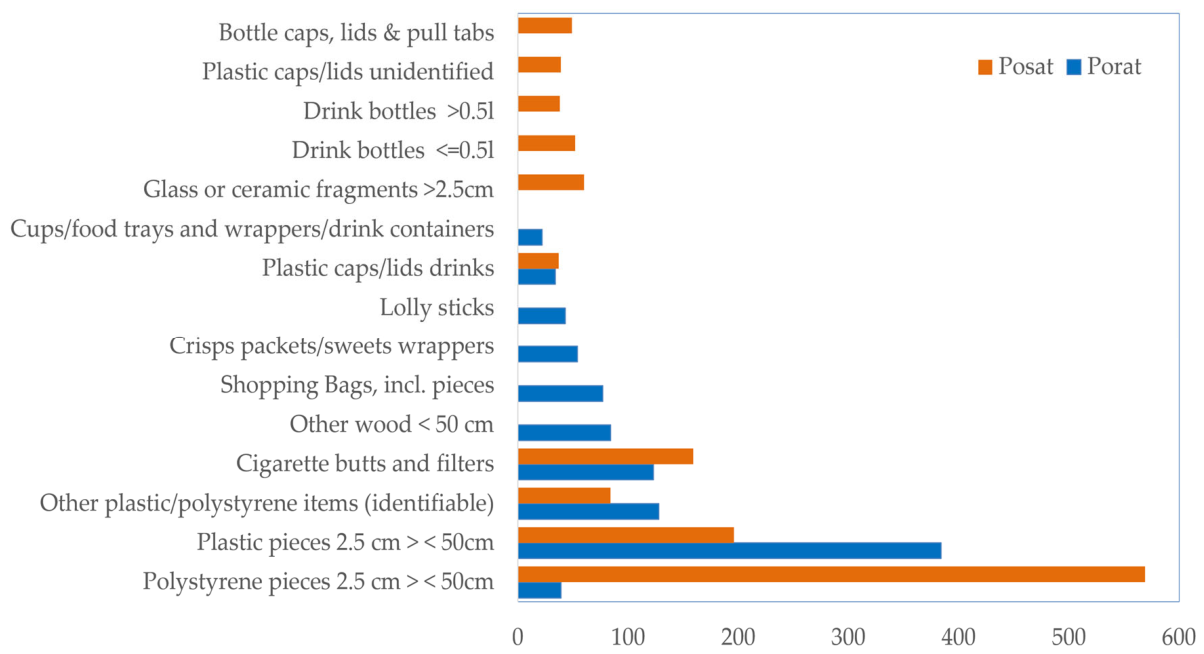
At the level of individual item types, the harbour assemblage was overwhelmingly dominated by plastic pieces of 2.5–50 cm, which alone accounted for 384 items, far more than any other category (Figure 9). Other identifiable plastic and polystyrene items, and cigarette butts with filters, formed a clear secondary group, followed by other wood smaller than 50 cm and shopping bags, including fragments. Crisps and sweet wrappers, lolly sticks, polystyrene pieces of 2.5–50 cm, plastic drinks caps and lids, and cups, food trays, food wrappers and drink containers completed the ten most frequent categories.
At Posat, the ranking was even more strongly dominated by a single category: polystyrene pieces of 2.5–50 cm reached 569 items, almost three times the next most frequent type, reflecting the prevalence of fragmented expanded polystyrene on the beach (Figure 9). Next in the ranking were plastic pieces of 2.5–50 cm; cigarette butts and filters ranked next, followed by other identifiable plastic and polystyrene items and glass and ceramic fragments larger than 2.5 cm. Drinks bottles of 0.5 L or less, bottle caps, lids and pull tabs, unidentified plastic caps and lids, drinks bottles larger than 0.5 L, and plastic drinks caps and lids comprised the remainder of the top ten.

3.3. Multivariate Composition Analysis

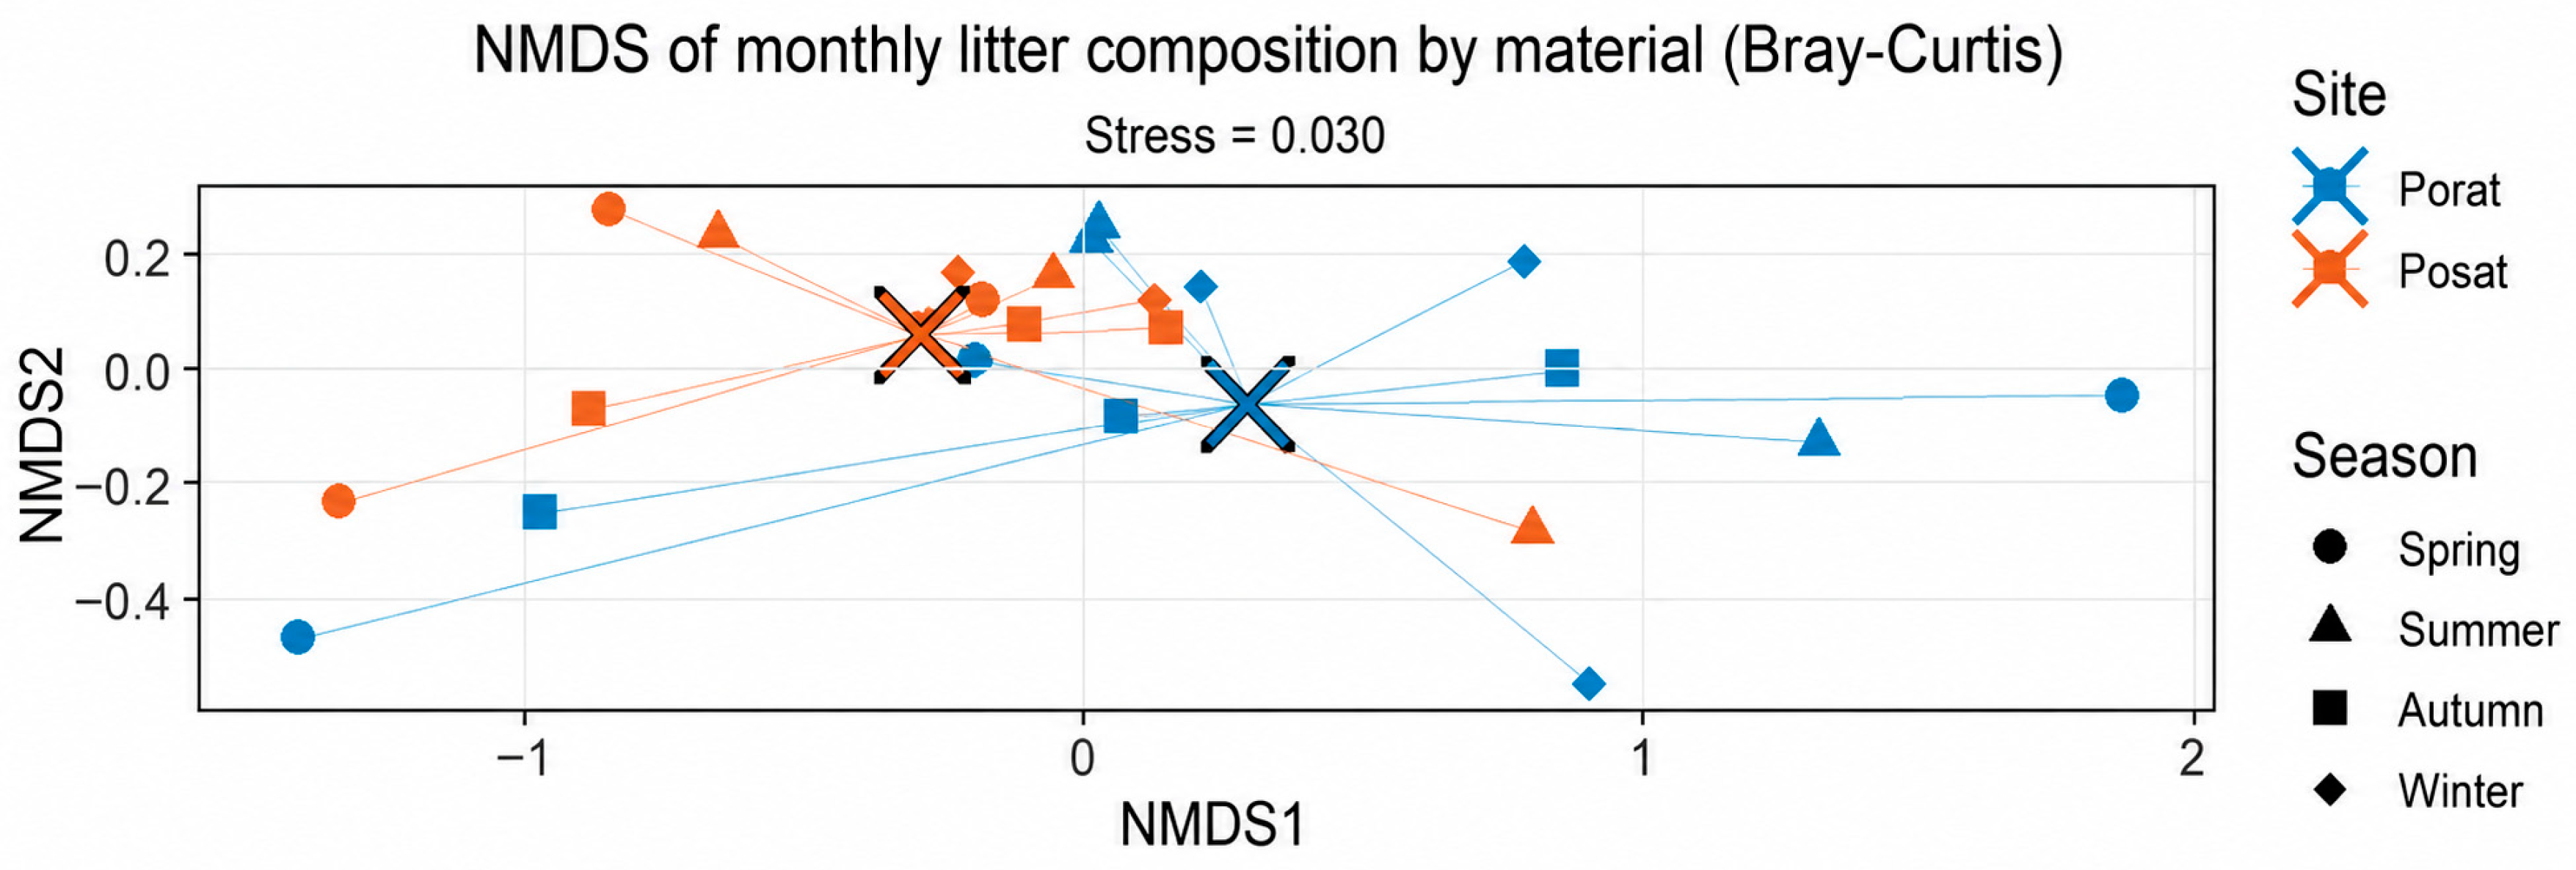
Multivariate analysis of monthly composition by material group reinforced the contrast between the two compartments. Non-metric multidimensional scaling provided an excellent two-dimensional representation of the Bray–Curtis dissimilarities (stress = 0.030; Figure 10), and PERMANOVA detected a modest difference in the monthly material-group assemblages recorded at Porat and Posat (pseudo-F = 3.02, R2 = 0.12, p = 0.038), with a comparable result from ANOSIM (R = 0.11, p = 0.044). The separation was nonetheless limited, and the harbour samples were considerably more variable from month to month than those from the beach (numerically greater multivariate dispersion; mean distance-to-centroid 0.39 versus 0.27), mirroring the higher coefficient of variation reported above. Multivariate dispersion did not differ significantly between compartments (PERMDISP, F = 2.94, p = 0.11). SIMPER attributed 73.5% of the average between-site dissimilarity (53.7%) to plastic, with metal (6.7%) and wood (6.1%) the next most influential groups, confirming that the contrast reflects the relative weighting of plastic against heavier materials rather than the presence of exotic categories. Season, tested as a grouping factor within the same multivariate framework, produced no significant compositional structure (PERMANOVA, p = 0.37). This null result is the basis for analysing the twelve surveys at monthly resolution rather than aggregating them into calendar seasons, and it identifies the contrast between compartments rather than season, the only factor tested that produced a detectable compositional signal, although it accounts for a small proportion of the total variation (R2 = 0.12). Material diversity was marginally higher at Posat than at Porat (Shannon 0.75 vs. 0.55; Simpson 0.34 vs. 0.28), consistent with the broader range of sources feeding the beach, although this difference was not statistically significant (Mann–Whitney, p = 0.078).

3.4. Comparison of the Two Compartments

Because the harbour was sampled by surface skimming and the beach by whole-area standing-stock collection, the two datasets represent different fractions of the litter field; the cross-compartment differences described below are therefore interpreted as process-level contrasts (retention versus stranding) rather than strictly equivalent measurements. Although both sites are located within the Dubrovnik urban coastal zone and subjected to intense seasonal tourism, they exhibited distinct litter accumulation dynamics. The floating compartment at Porat was far less stable over time than the stranded compartment at Posat, with a coefficient of variation in monthly counts well above that of the beach (135% versus 77%). Absolute totals are not restated here, as they are not method-equivalent. Beyond this difference in variability, the monthly fluctuations of the two compartments were unrelated, whether measured by item count (Pearson r = 0.20, p = 0.53; Spearman ρ = −0.10, p = 0.76) or by mass (r = 0.19, p = 0.56; ρ = 0.38, p = 0.22); no significant temporal correlation was therefore detected between the harbour and beach compartments across the twelve months, despite the two sites lying barely 200 m apart. The metrics that are directly comparable between the two compartments, together with those that are method-dependent and reported for context only, are summarised in Table 1.

3.5. Meteorological Conditions During the Survey

The meteorological conditions recorded on each survey date are described below. They are reported as context for the surveys and are not analysed statistically: a single same-day reading is a coarse proxy for the antecedent wind, wave and rainfall conditions that mobilise litter in the days preceding a survey. The highest litter counts at Porat were recorded on dates with reduced atmospheric pressure (highest at 551 items in May 2023 and 270 items in November 2023), while the lowest counts coincided with high-pressure anticyclonic conditions (28 items in January 2024, 1028 hPa; 7 items in March 2024). At Posat, the seasonal pattern differed markedly, with peak abundance in April 2023 (455 items) preceding the main tourist influx. Consistent with this, the winds recorded on the survey mornings were predominantly from the northern quadrant (N–NE), and no southeasterly (Jugo) event coincided with a sampling date.

4. Discussion

4.1. The Floating Compartment: Porat Harbour

Porat’s litter was predominantly plastic by count, consistent with the overwhelming predominance of artificial polymers reported across Adriatic and Mediterranean beach surveys [13,22]. Plastic also remained the largest single fraction by mass, although wood contributed almost as much. This composition is characteristic of a basin influenced by food and beverage consumption, small-scale maritime activity and limited inputs of heavier materials.
Two caveats qualify the mass figures. Because items were weighed wet, the mass contribution of water-retaining materials such as wood and textiles is likely overestimated relative to plastic, so the wood–plastic mass parity should be interpreted with that in mind. In addition, because the harbour was sampled by surface skimming, denser items that had already sunk below the surface layer were not captured, so the plastic share by mass may be inflated relative to a whole-water-column inventory. The low mass contribution of paper and cardboard (1.4%), despite their presence in the counts, likewise suggests rapid degradation or preferential loss of sodden cellulosic material during collection. The harbour profile, dominated by fragmented hard plastic alongside food- and drink-related packaging, is consistent with consumption-related littering and recreational maritime activity within the enclosed basin.
The physical setting accounts for much of this signature. Porat is a semi-enclosed basin with restricted exchange, weak wave energy and limited flushing, so debris entering from vessels, harbour-side restaurants or wind-blown terrestrial sources tends to be retained, sometimes for extended periods. This retention, combined with episodic inputs and the absence of any cleaning of the basin during the survey year, explains the pronounced temporal variability of the compartment, with the basin acting as a slow accumulation zone for lightweight floating debris such as wrappers, fragments, films and bottle caps. Heavier materials followed a different trajectory, sinking below the surface layer and beyond the reach of a skimming survey. Because no cleaning took place during the study, the repeated near-zero litter mass in several summer months, despite numerous visible items, points to loss from the surface layer rather than to removal. Sheltered conditions also allowed lightweight plastics to persist relatively intact until manual removal, so the harbour assemblage was less weathered than that of the exposed beach. The most distinctive feature of the compartment was not the quantity of litter but the magnitude of its month-to-month variation. Porat showed pronounced temporal instability (CV = 135%), with relatively clean surveys followed within weeks by markedly higher loads, and a single survey in May 2023 accounted for 41.6% of the annual total. Surveys that followed unsettled weather or periods of increased maritime activity tended to yield higher counts, indicating that the timing of sampling strongly influenced the observed conditions; because meteorological records were available only for the sampling dates themselves, this association is presented as a qualitative observation and was not tested statistically. The May 2023 peak was probably driven by several overlapping factors rather than a single cause: it coincided with the start of the tourist season and increased maritime activity, yet tourism alone is unlikely to explain its magnitude. The preceding winter had been unusually wet, so spring runoff may have mobilised terrestrial debris through stormwater systems into the basin. A secondary peak occurred in November 2023 (270 items; 8.48 kg); although no south-easterly winds were recorded during that sampling event itself, the increase may reflect the cumulative effect of autumn storm conditions and Jugo episodes in the preceding days, which can transport floating debris into sheltered coastal environments. A comparable late-spring maximum has been documented in Mediterranean port environments [43], while autumn increases in sheltered settings are consistent with rainfall-driven reactivation of watercourses that deliver previously deposited waste to the sea [23]. These findings raise a methodological concern for monitoring programmes that rely on infrequent single surveys, as isolated observations may represent longer-term conditions in a compartment of this kind poorly.
Quantifying the anthropogenic pressures behind these inputs remains difficult. Dubrovnik received 1,246,178 tourist arrivals and 3,889,475 overnight stays in 2023, and 1,356,136 arrivals and 4,270,230 overnight stays in 2024 [33,34], so the seasonal pressure on the urban coast is substantial by any measure, and mean monthly abundance at Porat was 84% higher during the tourist season than during the off-season. These are annual totals, however, and could not be matched to the monthly resolution of the surveys, so the tourism signal rests on the tourist- versus off-season contrast rather than on a month-by-month comparison with visitor numbers. Recorded port traffic is similarly unresolved in time: Dubrovnik city harbour accounted for 332 arrivals in 2023 and 333 in 2024, against 10,989 and 11,541 at the nearby passenger port of Gruž [34], so Porat receives only a small share of the city’s recorded vessel movements. The craft that dominate the basin, namely excursion and taxi boats and small recreational vessels, are not captured by these statistics, and maritime activity within Porat therefore remains a plausible but unquantified contributor to the litter recorded there. Carlson et al. [20] showed that floating debris in the Adriatic is largely transported by basin-scale circulation and identified the Dubrovnik–Montenegro–Albania coastline as an important source region for the southern Adriatic, which suggests that the basin may retain not only locally generated litter but also material advected from the wider region.

4.2. The Stranded Compartment: Posat Beach

The stranded compartment contained a broader and more heterogeneous mix of materials. Plastic dominated by count (79.2%) but accounted for only 33.2% of the mass, while wood contributed 25.3%, and the residual ‘other’ category, textiles, rubber and metal all represented non-trivial proportions. This distribution is consistent with a wide range of inputs, likely including urban runoff, municipal waste and terrestrial materials delivered during storm events, the latter being a recognised pathway for litter accumulation on exposed southern Adriatic shores during autumn and early-winter storms [22,23]. The higher prevalence of metal and glass supports inputs from municipal waste streams rather than direct littering alone, and glass and ceramic fragments, which were among the beach’s leading categories, are consistent with a weathered, storm- and runoff-influenced signature. The single dominant item type was expanded polystyrene of 2.5–50 cm, which reached 569 items, almost three times the next most frequent category. Although plastics were numerically dominant, bulkier materials such as wood, rubber and textiles contributed disproportionately to total mass, indicating that a visually plastic-dominated assemblage does not necessarily equate to mass-dominated plastic pollution, a pattern rarely highlighted in Mediterranean beach studies that rely on item counts rather than mass [13,22].
The physical setting of the beach differs fundamentally from that of the basin. Although partially sheltered by the Kaše breakwater, Posat remains exposed to waves, longshore currents and seasonal storms, and functions as a shoreline receptor for stranded debris. Its location beneath Dubrovnik’s city walls is visually striking but hydrologically problematic, as several urban drainage channels terminate near the beach and deliver stormwater and entrained debris directly onto the shoreline. The dominance of expanded polystyrene reflects its very low density and high surface-area-to-volume ratio, which make it exceptionally buoyant and wind-driven, so that it is readily stranded high on the shoreline where it fragments under UV exposure and abrasion. The energetic environment of the beach, with wetting and drying cycles, sand and stone abrasion and UV exposure, accelerates fragmentation, so that larger objects break into brittle fragments that remain visually abundant while contributing little mass. Ceramics illustrate the same process: dense ceramics rarely drift into a sheltered basin, but high-energy waves transport them efficiently onto exposed shores. Wave action, wetting–drying cycles and shoreline abrasion accelerate this fragmentation irrespective of substrate, consistent with the weathered, fragment- and ceramic-bearing assemblage recorded here.
Temporally, the stranded compartment behaved quite differently from the floating one. Monthly abundance was less variable (CV = 77%): the maximum occurred in April 2023, a month before the harbour maximum and before the main tourist influx, and mean monthly abundance was almost uniform between the tourist season and the off-season. Mass followed the opposite pattern to abundance, with off-season values roughly three times those of the tourist season, a distribution driven by heavy, storm-related debris delivered outside the peak visitor period. Taken together, these patterns suggest that recreational beach use during peak tourism months does not strongly determine litter accumulation at this site, and that local morphology, runoff dynamics, hydrodynamic processes and waste infrastructure may be at least as influential as visitor numbers. The April maximum is broadly consistent with Mediterranean patterns in which post-winter runoff and increasing boating activity coincide, although at Posat it clearly preceded rather than accompanied the tourist season.

4.3. Comparisons Enabled by the Study Design

Given the sampling design, only a limited set of comparisons is defensible. Absolute abundance, mass, and density are not method-equivalent and are therefore not compared. The analysis is instead restricted to dimensionless or relative metrics that are independent of sampling geometry, including plastic share by count and by mass, the rank order of dominant categories, the relative temporal variability within each compartment, and the correlation between compartments (Table 1). Within these methodological constraints, several consistent differences between compartments nevertheless emerged.
Across these metrics, the two compartments showed distinct patterns. Both compartments contained plastic fragments, cigarette butts, and identifiable plastic items among their dominant categories, consistent with the top-ranked litter types reported across the wider Adriatic–Ionian region [13]. However, they differed in their most abundant category: fragmented hard plastic dominated the basin, whereas expanded polystyrene dominated the stranded compartment. This morphotype sorting has a plausible physical basis. Buoyant film and foam polymers such as polyethylene and expanded polystyrene remain at the surface and are transported by wind and currents, whereas denser items are more readily deposited on the shore or seabed [14]. This interpretation is also consistent with evidence that semi-enclosed channel waters promote litter retention and longer residence times [15].
Multivariate analysis indicated a significant compositional difference between compartments (PERMANOVA, p = 0.038; ANOSIM, p = 0.044), although the effect size was small (R2 = 0.12) and separation in ordination space remained modest. Importantly, this difference cannot be attributed solely to environmental variation because compartment and sampling method are fully confounded (Section 4.6). Consequently, the observed compositional differences should be interpreted as describing the sampled compartments rather than as providing a formal test of environmental effects.
Monthly fluctuations in abundance and mass were statistically decoupled between compartments, indicating that two compartments separated by less than 200 m followed largely independent temporal trajectories throughout the survey year. Season, tested within the same multivariate framework, had no significant effect on composition. Within the limitations imposed by the sampling design, compositional differences between the sampled compartments was the only tested factor associated with compositional structure, though most compositional variation remained unexplained. Material diversity was slightly higher in the stranded compartment (Shannon index 0.75 versus 0.55), but this difference was not statistically significant.

4.4. Comparison with Mediterranean and Adriatic Studies

At the broadest scale, the harbour compartment reflects patterns reported for the wider Mediterranean. The Porat profile—fragmented hard plastic together with cigarette butts, food and drink packaging, and expanded polystyrene—closely matches the floating-litter composition reported for small Mediterranean ports on Mallorca, where unidentified soft and hard plastic fragments, cigarette butts and foamed polystyrene also predominated [43]. Notably, that study recorded its highest litter loads in late spring (May–June) rather than at the height of summer, mirroring the pronounced May peak at Porat and reinforcing the conclusion that peak-season visitor numbers alone do not govern harbour litter accumulation.
Focusing on the Adriatic, the Dubrovnik results align with the region’s pervasive plastic dominance. Plastics accounted for 84.9% of items at Porat and 79.2% at Posat, with Porat approaching and Posat falling somewhat below the 90–95% artificial polymer share reported from central Adriatic sites [21,22]. At the regional scale, DeFishGear data indicate that approximately 92% of marine litter on the Croatian coast consists of anthropogenic polymeric material [23]. Dominant item categories were likewise consistent: plastic fragments, bottle caps and polystyrene pieces—among the most common on Croatian beaches [22]—predominated here too, particularly at Posat. The most directly comparable Croatian study [15] simultaneously assessed floating macro-litter (mean 175 items/km2), floating micro-litter (127,000 particles/km2) and seabed micro-litter (36 particles/100 g dry mass) in the central Adriatic, showing that surface and seabed dynamics are governed by different processes and do not co-vary. This supports treating the floating and stranded fractions here as functionally distinct compartments rather than interchangeable proxies. These distinctions are relevant for management, because measures effective in one compartment may not be equally effective in the other, a point taken up in Section 4.5.
In the southern Croatian Adriatic, surveys of the semi-enclosed coves of Mljet Island similarly found plastics accounting for more than 80% of stranded litter, with more than 70% attributed to transboundary sources (Albania, Italy, Greece, Montenegro) and the heaviest loads in coves facing south-east [27], consistent with the current- and Jugo-driven delivery proposed for the study region. The pronounced variability of the floating compartment also illustrates a broader methodological point: regional studies that aggregate data across many sites—for example, densities averaged across 31 beaches [13]—can obscure such variability. Source attribution is further complicated by fragmentation: Mokos et al. [22] reported that 43.77% of collected items could not be assigned to any source category, and DeFishGear data indicate an even larger undetermined fraction of 57.7%, again dominated by 2.5–50 cm plastic fragments [23]. The same limitation applies here, particularly for the residual ‘other’ category at the harbour (4.1% by mass).
Placing the Posat result in a wider context is less straightforward than it appears, because published Clean Coast Index values span more than two orders of magnitude and are reported with varying temporal resolution (Table 2). The annual mean of 7.1 recorded here falls between the clean annual means reported for northern Adriatic beaches near Ferrara [44] and the very dirty conditions at Vodenjak Cove on Iž Island in the central Adriatic [22]. For reference, the plastic-only index yields an annual mean of 5.6 (range 0.9–16.7); artificial polymer materials accounted for 79.2% of items by count, so the two versions are directly interconvertible. The annual mean of 7.1 recorded here lies within the range reported for northern Adriatic beaches and is somewhat higher than values reported for other southern Adriatic sites, including Neum, Igalo, Albanian beaches and the Neretva estuary. At the opposite end of the spectrum, heavily polluted sites such as Vodenjak Cove, Sakarun and Zaglav beach illustrate the large spatial variability of beach litter accumulation across the Adriatic. Similar temporal variability was also evident at Posat. Although the annual mean CCI indicated moderate cleanliness, monthly values ranged from very clean conditions in August 2023 to very dirty conditions in April 2023, spanning from very clean to very dirty categories within a single year. This substantial variability demonstrates that annual averages or infrequent surveys may obscure the episodic, process-driven nature of litter accumulation.
Two features of the comparison deserve emphasis. First, the annual mean is a poor summary statistic for an urban beach of this kind: the monthly values at Posat span 1.5 to 21.9, so the same beach could be classified anywhere from very clean to very dirty depending on the month in which a single survey happened to be conducted. Studies reporting a single index value, or a value derived from one or two surveys, are therefore not strictly comparable with year-round monitoring. Moreover, seasonal comparisons among CCI studies remain difficult because many publications report only annual or study-wide average values without resolving seasonal variability. Even multi-season monitoring can mask this variability once reduced to an annual figure: on the Ferrara coast, all four sites returned annual means within the ‘Clean’ band, yet Volano rose to ‘Moderately clean’ in spring [44]. Second, the cleaning regime is a first-order confounder that is rarely reported. Low summer CCI values elsewhere have been attributed to mechanical and manual cleaning concentrated in the bathing season rather than to reduced input [44]. During the present study, however, beach cleaning at Posat was suspended by agreement with Čistoća Dubrovnik, so the reported values reflect natural litter accumulation rather than the effects of routine maintenance. Because cleaning was suspended at Posat for the duration of this study, the values reported here describe accumulation directly, and are in that respect more conservative than indices measured on managed beaches. The seasonal structure of the index reinforces this: at the more exposed central Adriatic cove of Vodenjak, the highest CCI values were recorded in winter, attributed to Sirocco (Jugo) episodes and surface circulation that transports litter from the southern Adriatic [22]—consistent with the characteristic occurrence of Jugo winds before winter surveys reported by Mokos et al. [22]—the same delivery invoked above—whereas Posat’s much lower annual mean (7.1 versus 48.4) is consistent with its comparatively sheltered position beneath the city walls.
Finally, the extreme CCI values reported for Zaglav beach on Vis and Sakarun show that exceptionally high litter accumulation can occur on beaches with contrasting geomorphological characteristics (Table 2). Although shoreline type may influence litter retention and fragmentation, hydrodynamic exposure appears to be the dominant control. Rocky shores may enhance fragmentation of larger plastic items into smaller pieces, whereas sandy beaches may accumulate transported litter across broad depositional areas. The occurrence of extremely high CCI values at both beach types therefore suggests that exposure to prevailing currents and storm-driven transport, rather than substrate alone, governs the highest litter accumulations.

4.5. Management and Monitoring Implications of Compartment-Specific Litter Dynamics

Porat harbour lies within the UNESCO World Heritage Site of the Old City of Dubrovnik, whose 2021–2026 Management Plan identifies improved waste management and separate collection in the harbour and its buffer zone as a priority action and designates the Institute for the Restoration of Dubrovnik as the coordinating body [50]. Responsibility for coastal cleanliness in Dubrovnik is shared between several bodies. Cleaning of the sea surface and shoreline within the city is carried out by the municipal utility Čistoća Dubrovnik, whereas the harbour area itself falls under the county port authority, and marine litter monitoring in Croatian waters is framed by the Marine Strategy Framework Directive [28] and its national implementation. During the present study, in agreement with Čistoća Dubrovnik, no cleaning activities were carried out in the study area to ensure that the observed quantities of marine litter reflected natural accumulation patterns and were not influenced by routine maintenance. No monitoring programme specific to either of the two compartments studied here was in place during the survey year. The results argue against a single coastal strategy, because the two compartments differ in the timing of their inputs, in the dominant item type and in the processes that retain the material. For the floating compartment, the pronounced periodicity argues against a fixed cleaning calendar. Because a single survey recovered 41.6% of the annual load, removal efforts triggered by events, following periods of heavy rainfall or sustained south-easterly winds, would intercept a disproportionate share of the material, while passive collection devices positioned in the retention corner of the basin would capture lightweight floating debris continuously between such events. For the stranded compartment, the single dominant item type was expanded polystyrene, which fragments rapidly once ashore and becomes progressively harder to recover; intercepting it before it reaches the shoreline, by screening of the urban drainage channels that terminate near the beach and through source control on expanded polystyrene packaging used in the harbour area, is likely to be more effective than repeated removal of fragments from the sand. In both compartments, the finding that one survey can represent a large fraction of the annual load implies that the effectiveness of any measure can only be judged against sustained, year-round monitoring rather than seasonal snapshots.

4.6. Limitations and Future Research

Three limitations constrain the inferences drawn above. First, litter compartment and sampling method are completely confounded. Method does not vary within a compartment and cannot be fitted as a covariate, so the compositional contrast reported here (PERMANOVA, ANOSIM, SIMPER) necessarily reflects both the environmental difference between a retention basin and a stranding shoreline and the differential capture efficiency of surface skimming and standing-stock collection. In particular, the under-representation of dense, sunken items at Porat and of buoyant items that never strand at Posat is as much a consequence of the sampling methods as of the environmental characteristics of the two compartments. The contrast is therefore presented as a description of two compartments, not as a test of an environmental effect. Second, meteorological data were available only for the sampling dates; cumulative antecedent rainfall, wind and wave energy over the preceding days were not, so no relationship between weather and litter accumulation could be tested, and the meteorological patterns noted above remain qualitative. Third, the available tourism and port statistics are annual totals for 2023 and 2024, whereas the surveys ran monthly from April 2023 to March 2024; visitor pressure and vessel movements could therefore be quantified in magnitude but not resolved in time, so neither could be tested directly against monthly litter abundance. Resolving these limitations would require a design in which both compartments are sampled at each site, in which continuous antecedent meteorological and hydrodynamic records are available, and in which visitor and vessel counts are obtained at the same monthly resolution as the litter surveys. A further constraint is one of scale rather than method: both compartments lie within a single harbour area, so the study describes the compartment structure of one urban coastal system and is not spatially replicated. Whether the same contrast between retention and stranding holds elsewhere can only be established with comparable year-round data from additional cities.

5. Conclusions

This year-round study characterised two litter compartments that coexist within a single urban coastal setting: the floating litter retained in the semi-enclosed basin of Porat harbour and litter stranded on the adjacent Posat beach. The floating compartment accumulated litter in episodic pulses and was far more variable from month to month than the stranded compartment (coefficient of variation in monthly abundance 135% versus 77%), with a single survey accounting for 41.6% of its annual total. The two compartments showed no significant temporal correlation in their monthly patterns, consistent with the greater variability predicted for the floating compartment (H1). They carried distinguishable, though modestly separated, compositional signatures (H2); because compartment and sampling method are inseparable, these differences are reported descriptively rather than as evidence of an environmental effect, and their attribution to distinct sources and transport pathways is discussed as interpretation only. H3 was only partially supported: abundance in the harbour did rise during the tourist season (an 84% increase in mean monthly abundance), but the tourist contribution could not be separated from hydro-meteorological forcing, which the present data cannot quantify, and no seasonal signal in abundance was evident on the beach. Plastic dominated numerically in both compartments, yet the weight-based analysis showed that non-plastic materials contributed substantially to total mass, wood alone rivalling plastic in the harbour and plastic accounting for only a third of the mass on the beach, which qualifies the conventional plastic-centred view of coastal litter.
Beach cleanliness at Posat averaged a moderate Clean Coast Index of 7.1, but individual months spanned all five cleanliness categories within a single year, from very clean in August to very dirty in April. Because cleaning was suspended for the duration of the study, these values reflect direct accumulation rather than the residue of a cleaning cycle, and they show that single-survey or annual-mean assessments can mask the episodic, process-driven nature of urban litter accumulation. Because two sites barely 200 m apart followed largely independent monthly patterns, effective monitoring in tourism-dominated coastal cities requires sustained, year-round, multi-site observation rather than infrequent snapshots.
Dubrovnik’s marine litter problem cannot be attributed solely to tourism pressure. It appears instead to be shaped by the interaction of urban infrastructure, waste management, coastal hydrodynamics and patterns of human activity, whose relative contributions could not be disentangled in this exploratory comparison of two compartments. The contrast between them is nonetheless instructive for management: the semi-enclosed basin retained lightweight floating debris in episodic pulses, largely linked to consumption and vessels, whereas the semi-sheltered beach acted as a receptor for runoff, storm transport and debris washed ashore by the sea. Effective mitigation therefore calls for compartment-specific measures, event-triggered removal and passive interception in the basin, and upstream interception of expanded polystyrene and drainage-borne debris at the beach, rather than a single coastal strategy. Because a substantial fraction of the debris was of unresolved and partly transboundary origin, local action must be paired with a better understanding of the regional circulation and terrestrial pathways that link distant sources to the Dubrovnik coast.

Author Contributions

Conceptualisation, B.G.Z. and I.O.; methodology, B.G.Z. and I.O.; software, B.G.Z. and M.H.; validation, I.O. and M.H.; formal analysis, B.G.Z.; investigation, B.G.Z. and I.O.; resources, I.O.; data curation, I.O. and M.H.; writing—original draft preparation, B.G.Z. and I.O.; writing—review and editing, I.O. and M.H.; visualisation, I.O.; supervision, M.H.; project administration, M.H.; funding acquisition, B.G.Z. All authors have read and agreed to the published version of the manuscript.

Funding

This research was funded by Dubrovnik-Neretva County; no grant number was assigned.

Institutional Review Board Statement

Not applicable.

Informed Consent Statement

Not applicable.

Data Availability Statement

The original data presented in the study are openly available in Zenodo at https://doi.org/10.5281/zenodo.21096802.

Acknowledgments

The authors sincerely thank field team member Ivana Violić for her valuable assistance with litter collection and Igor Brautović for generously providing the photograph used in this study. They also gratefully acknowledge the support of the Čistoća Dubrovnik, County Port Authority of Dubrovnik and Dubrovnik Tourist Board for valuable collaboration. During the preparation of this manuscript, AI-assisted writing tools (InstaText, version 1.3.9, and Claude Opus 4.8) were used exclusively for language editing and proofreading. The authors carefully reviewed and revised all AI-generated suggestions and assume full responsibility for the content of this publication.

Conflicts of Interest

The authors declare no conflicts of interest. The funders had no role in the design of the study; in the collection, analyses, or interpretation of data; in the writing of the manuscript; or in the decision to publish the results.

Abbreviations

The following abbreviations are used in this manuscript:
CCIClean Coast Index
CVCoefficient of variation
EUEuropean Union
MSFDMarine Strategy Framework Directive [28]
UNESCOUnited Nations Educational, Scientific and Cultural Organization

References

  1. UNEP. Marine Litter: An Analytical Overview; United Nations Environment Programme: Nairobi, Kenya, 2005; Available online: https://wedocs.unep.org/handle/20.500.11822/13140 (accessed on 29 May 2026).
  2. Rochman, C.M.; Browne, M.A.; Halpern, B.S.; Hentschel, B.T.; Hoh, E.; Karapanagioti, H.K.; Rios-Mendoza, L.M.; Takada, H.; Teh, S.; Thompson, R.C. Policy: Classify plastic waste as hazardous. Nature 2013, 494, 169–171. [Google Scholar] [CrossRef] [PubMed]
  3. Galgani, F.; Hanke, G.; Maes, T. Global distribution, composition and abundance of marine litter. In Marine Anthropogenic Litter; Bergmann, M., Gutow, L., Klages, M., Eds.; Springer: Cham, Switzerland, 2015; pp. 29–56. [Google Scholar] [CrossRef]
  4. PlasticsEurope. Plastics—the Fast Facts 2025; PlasticsEurope: Brussels, Belgium, 2025; Available online: https://plasticseurope.org/knowledge-hub/plastics-the-fast-facts-2025/ (accessed on 17 June 2026).
  5. UNEP. Marine Litter: A Global Challenge; United Nations Environment Programme: Nairobi, Kenya, 2009. [Google Scholar]
  6. Galgani, F.; Hanke, G.; Werner, S.; de Vrees, L.; Piha, H.; Abaza, V.; Alcaro, L.; Belchior, C.; Brooks, C.; Budziak, A.; et al. Marine Litter, Technical Recommendations for the Implementation of MSFD Requirements, MSFD GES Technical Subgroup on Marine Litter; Publications Office of the European Union: Luxembourg, 2011; p. 91. [Google Scholar]
  7. Galgani, F.; Leaute, J.P.; Moguedet, P.; Souplet, A.; Verin, Y.; Carpentier, A.; Goraguer, H.; Latrouite, D.; Andral, B.; Cadiou, Y.; et al. Litter on the sea floor along European coasts. Mar. Pollut. Bull. 2000, 40, 516–527. [Google Scholar] [CrossRef]
  8. Mordecai, G.; Tyler, P.A.; Masson, D.G.; Huvenne, V.A.I. Litter in submarine canyons off the west coast of Portugal. Deep Sea Res. Part II Top. Stud. Oceanogr. 2011, 58, 2489–2496. [Google Scholar] [CrossRef]
  9. Aliani, S.; Griffa, A.; Molcard, A. Floating debris in the Ligurian Sea, north-western Mediterranean. Mar. Pollut. Bull. 2003, 46, 1142–1149. [Google Scholar] [CrossRef] [PubMed]
  10. Barnes, D.K.A.; Fraser, K.P.P. Rafting by five phyla on manmade flotsam in the Southern Ocean. Mar. Ecol. Prog. Ser. 2003, 262, 289–291. [Google Scholar] [CrossRef]
  11. Deudero, S.; Alomar, C. Mediterranean marine biodiversity under threat: Reviewing influence of marine litter on species. Mar. Pollut. Bull. 2015, 98, 58–68. [Google Scholar] [CrossRef] [PubMed]
  12. Cózar, A.; Sanz-Martín, M.; Martí, E.; González-Gordillo, J.I.; Ubeda, B.; Gálvez, J.Á.; Irigoien, X.; Duarte, C.M. Plastic accumulation in the Mediterranean Sea. PLoS ONE 2015, 10, e0121762. [Google Scholar] [CrossRef] [PubMed]
  13. Vlachogianni, T.; Fortibuoni, T.; Ronchi, F.; Zeri, C.; Mazziotti, C.; Tutman, P.; Bojanić Varezić, D.; Palatinus, A.; Trdan, Š.; Peterlin, M.; et al. Marine litter on the beaches of the Adriatic and Ionian Seas: An assessment of their abundance, composition and sources. Mar. Pollut. Bull. 2018, 131, 745–756. [Google Scholar] [CrossRef] [PubMed]
  14. Zeri, C.; Adamopoulou, A.; Bojanić Varezić, D.; Fortibuoni, T.; Kovač Viršek, M.; Kržan, A.; Mandić, M.; Mazziotti, C.; Palatinus, A.; Peterlin, M.; et al. Floating plastics in Adriatic waters (Mediterranean Sea): From the macro- to the micro-scale. Mar. Pollut. Bull. 2018, 136, 341–350. [Google Scholar] [CrossRef] [PubMed]
  15. Palatinus, A.; Kovač Viršek, M.; Robič, U.; Grego, M.; Bajt, O.; Šiljić, J.; Suaria, G.; Liubartseva, S.; Coppini, G.; Peterlin, M. Marine litter in the Croatian part of the middle Adriatic Sea: Simultaneous assessment of floating and seabed macro and micro litter abundance and composition. Mar. Pollut. Bull. 2019, 139, 427–439. [Google Scholar] [CrossRef] [PubMed]
  16. Cushman-Roisin, B.; Gačić, M.; Poulain, P.-M.; Artegiani, A. Physical Oceanography of the Adriatic Sea: Past, Present and Future; Kluwer Academic Publishers: Dordrecht, The Netherlands, 2001. [Google Scholar]
  17. Orlić, M.; Gačić, M.; La Violette, P.E. The currents and circulation of the Adriatic Sea. Oceanol. Acta 1992, 15, 109–124. Available online: https://archimer.ifremer.fr/doc/00100/21145/18764.pdf (accessed on 29 May 2026). [CrossRef]
  18. Orlić, M.; Kuzmić, M.; Pasarić, Z. Response of the Adriatic Sea to the bora and sirocco forcing. Cont. Shelf Res. 1994, 14, 91–116. [Google Scholar] [CrossRef]
  19. Liubartseva, S.; Coppini, G.; Lecci, R.; Creti, S. Regional approach to modeling the transport of floating plastic debris in the Adriatic Sea. Mar. Pollut. Bull. 2016, 103, 115–127. [Google Scholar] [CrossRef] [PubMed]
  20. Carlson, D.F.; Suaria, G.; Aliani, S.; Fredj, E.; Fortibuoni, T.; Griffa, A.; Russo, A.; Melli, V. Combining litter observations with a regional ocean model to identify sources and sinks of floating debris in a semi-enclosed basin: The Adriatic Sea. Front. Mar. Sci. 2017, 4, 78. [Google Scholar] [CrossRef]
  21. Mokos, M.; Zamora Martinez, I.; Zubak, I. Is central Croatian Adriatic Sea under plastic attack? Preliminary results of composition, abundance and sources of marine litter on three beaches. Rend. Fis. Acc. Lincei 2019, 30, 797–806. [Google Scholar] [CrossRef]
  22. Mokos, M.; Rokov, T.; Zubak Čižmek, I. Monitoring and analysis of marine litter in Vodenjak cove on Iž Island, central Croatian Adriatic Sea. Rend. Fis. Acc. Lincei 2020, 31, 905–912. [Google Scholar] [CrossRef]
  23. Funduk, M.; Tutman, P.; Farkaš, A.; Tišma, S.; Boromisa, A.-M. Marine Litter in Croatian Adriatic: Sources, Quantities and Stakeholders’ Perspectives. Sustainability 2021, 13, 4691. [Google Scholar] [CrossRef]
  24. Schmid, C.; Cozzarini, L.; Zambello, E. A critical review on marine litter in the Adriatic Sea: Focus on plastic pollution. Environ. Pollut. 2021, 273, 116430. [Google Scholar] [CrossRef] [PubMed]
  25. Duplančić Leder, T.; Ujević, T.; Čala, M. Coastline lengths and areas of islands in the Croatian part of the Adriatic Sea determined from the topographic maps at the scale of 1:25,000. Geoadria 2004, 9, 5–32. [Google Scholar] [CrossRef]
  26. Tutman, P.; Kapiris, K.; Kirinčić, M.; Pallaoro, A. Floating marine litter as a raft for drifting voyages for Planes minutus (Crustacea: Decapoda: Grapsidae) and Liocarcinus navigator (Crustacea: Decapoda: Polybiidae). Mar. Pollut. Bull. 2017, 120, 217–221. [Google Scholar] [CrossRef] [PubMed]
  27. Kwokal, Ž.; Štefanović, B. Floating marine litter without boundaries: A threat to the coves of Mljet Island (Croatia). In Days of Branimir Gušić, Proceedings of the Symposium “Days of Branimir Gušić”, Mljet, Croatia, 3–7 October 2010; Durbešić, P., Benović, A., Eds.; LaserPrint: Zagreb, Croatia, 2011; pp. 349–362. [Google Scholar]
  28. MSFD. Directive 2008/56/EC of the European Parliament and of the Council establishing a framework for community action in the field of marine environmental policy (Marine Strategy Framework Directive). Off. J. Eur. Union 2008, L 164, 19–40. Available online: https://eur-lex.europa.eu/eli/dir/2008/56/oj (accessed on 29 May 2026).
  29. Galgani, F.; Hanke, G.; Werner, S.; De Vrees, L. Marine Litter Within the European Marine Strategy Framework Directive. ICES J. Mar. Sci. 2013, 70, 1055–1064. [Google Scholar] [CrossRef]
  30. Prevenios, M.; Tsangaris, C.; Lazăr, L.; Alegria, H.; Fernandez-Palacios, Y.; Ioakeimidis, C. Beach litter dynamics on Mediterranean coasts: Distinguishing sources and pathways. Mar. Pollut. Bull. 2018, 129, 448–457. [Google Scholar] [CrossRef] [PubMed]
  31. Galgani, F.; Ruiz-Orejon, L.F.; Ronchi, F.; Tallec, K.; Fischer, E.; Matiddi, M.; Anastasopoulou, A.; Andresmaa, E.; Angiolillo, M.; Bakker, M.P.; et al. Guidance on the Monitoring of Marine Litter in European Seas. An Update to Improve the Harmonised Monitoring of Marine Litter Under the Marine Strategy Framework Directive; EUR 31539 EN, JRC133594; Publications Office of the European Union: Luxembourg, 2023. [Google Scholar] [CrossRef]
  32. Državni zavod za statistiku (DZS). Popis Stanovništva, Kućanstava i Stanova 2021.: Stanovništvo Prema Naseljima [Census of Population, Households and Dwellings 2021: Population by Settlements]; Croatian Bureau of Statistics: Zagreb, Croatia, 2022. Available online: https://podaci.dzs.hr/media/rqybclnx/popis_2021-stanovnistvo_po_naseljima.xlsx (accessed on 25 July 2026).
  33. Državni zavod za statistiku (DZS). Dolasci i Noćenja Turista u Komercijalnom Smještaju u 2023. Godini; Priopćenje TUR-2023-1-2. Available online: https://podaci.dzs.hr/2023/hr/58169 (accessed on 29 May 2026).
  34. Turistička zajednica grada Dubrovnika (Tourist Board of the City of Dubrovnik). Tourist Arrivals and Overnight Stays in the City of Dubrovnik, and Vessel Arrivals by Port, 2023–2024. Experience Dubrovnik Data Portal. Available online: https://www.evisitor.hr (accessed on 20 July 2026).
  35. DHMZ (Croatian Meteorological and Hydrological Service). Meteorological Data: Atmospheric Pressure, Wind Speed and Wind Direction. Available online: https://meteo.hr (accessed on 19 March 2024).
  36. Alkalay, R.; Pasternak, G.; Zask, A. Clean-coast index—A new approach for beach cleanliness assessment. Ocean Coast. Manag. 2007, 50, 352–362. [Google Scholar] [CrossRef]
  37. Bray, J.R.; Curtis, J.T. An ordination of the upland forest communities of southern Wisconsin. Ecol. Monogr. 1957, 27, 325–349. [Google Scholar] [CrossRef] [PubMed]
  38. Anderson, M.J. A new method for non-parametric multivariate analysis of variance. Austral Ecol. 2001, 26, 32–46. [Google Scholar] [CrossRef]
  39. Clarke, K.R. Non-parametric multivariate analyses of changes in community structure. Aust. J. Ecol. 1993, 18, 117–143. [Google Scholar] [CrossRef]
  40. Anderson, M.J. Distance-based tests for homogeneity of multivariate dispersions. Biometrics 2006, 62, 245–253. [Google Scholar] [CrossRef] [PubMed]
  41. R Core Team. R: A Language and Environment for Statistical Computing; R Foundation for Statistical Computing: Vienna, Austria, 2026; Available online: https://www.R-project.org/ (accessed on 29 May 2026).
  42. Oksanen, J.; Simpson, G.; Blanchet, F.; Kindt, R.; Legendre, P.; Minchin, P.; O’Hara, R.; Solymos, P.; Stevens, M.; Szoecs, E.; et al. Vegan: Community Ecology Package, R Package Version 2.7-5; CRAN (Comprehensive R Archive Network), R Foundation for Statistical Computing: Vienna, Austria, 2026; Available online: https://CRAN.R-project.org/package=vegan (accessed on 1 June 2026).
  43. Maglić, L.; Maglić, L.; Grbčić, A.; Gulić, M. Composition of Floating Marine Litter in Port Areas of the Island of Mallorca. J. Mar. Sci. Eng. 2022, 10, 1079. [Google Scholar] [CrossRef]
  44. Buoninsegni, J.; Anfuso, G.; Asensio-Montesinos, F.; Marrocchino, E.; Vaccaro, C. The seasonal and cross-shore distribution of beach litter along four sites on the northern Adriatic coast (Ferrara, Italy). Water 2025, 17, 2173. [Google Scholar] [CrossRef]
  45. Munari, C.; Corbau, C.; Simeoni, U.; Mistri, M. Marine litter on Mediterranean shores: Analysis of composition, spatial distribution and sources in north-western Adriatic beaches. Waste Manag. 2016, 49, 483–490. [Google Scholar] [CrossRef] [PubMed]
  46. Buoninsegni, J.; Olivo, E.; Paletta, M.G.; Vaccaro, C.; Corbau, C. Marine Litter Surveys on Boccasette Beach (Rovigo, Italy). In Ninth International Symposium “Monitoring of Mediterranean Coastal Areas: Problems and Measurement Techniques”; Bonora, L., Carboni, D., De Vincenzi, M., Matteucci, G., Eds.; Firenze University Press: Florence, Italy, 2022; pp. 156–164. [Google Scholar]
  47. Laglbauer, B.J.L.; Melo Franco-Santos, R.; Andreu-Cazenave, M.; Brunelli, L.; Papadatou, M.; Palatinus, A.; Grego, M.; Deprez, T. Macrodebris and microplastics from beaches in Slovenia. Mar. Pollut. Bull. 2014, 89, 356–366. [Google Scholar] [CrossRef] [PubMed]
  48. Giovacchini, A.; Merlino, S.; Locritani, M.; Stroobant, M. Spatial distribution of marine litter along Italian coastal areas in the Pelagos sanctuary (Ligurian Sea—NW Mediterranean Sea): A focus on natural and urban beaches. Mar. Pollut. Bull. 2018, 130, 140–152. [Google Scholar] [CrossRef] [PubMed]
  49. Vlachogianni, T.; Anastasopoulou, A.; Fortibuoni, T.; Ronchi, F.; Zeri, C. Marine Litter Assessment in the Adriatic and Ionian Seas; IPA-Adriatic DeFishGear Project; MIO-ECSDE, HCMR and ISPRA: Athens, Greece, 2017; p. 168. [Google Scholar]
  50. Zavod za obnovu Dubrovnika (Institute for the Restoration of Dubrovnik). Management Plan for the UNESCO World Heritage Site of the Old City of Dubrovnik 2021–2026; Institute for the Restoration of Dubrovnik: Dubrovnik, Croatia, 2021. [Google Scholar]
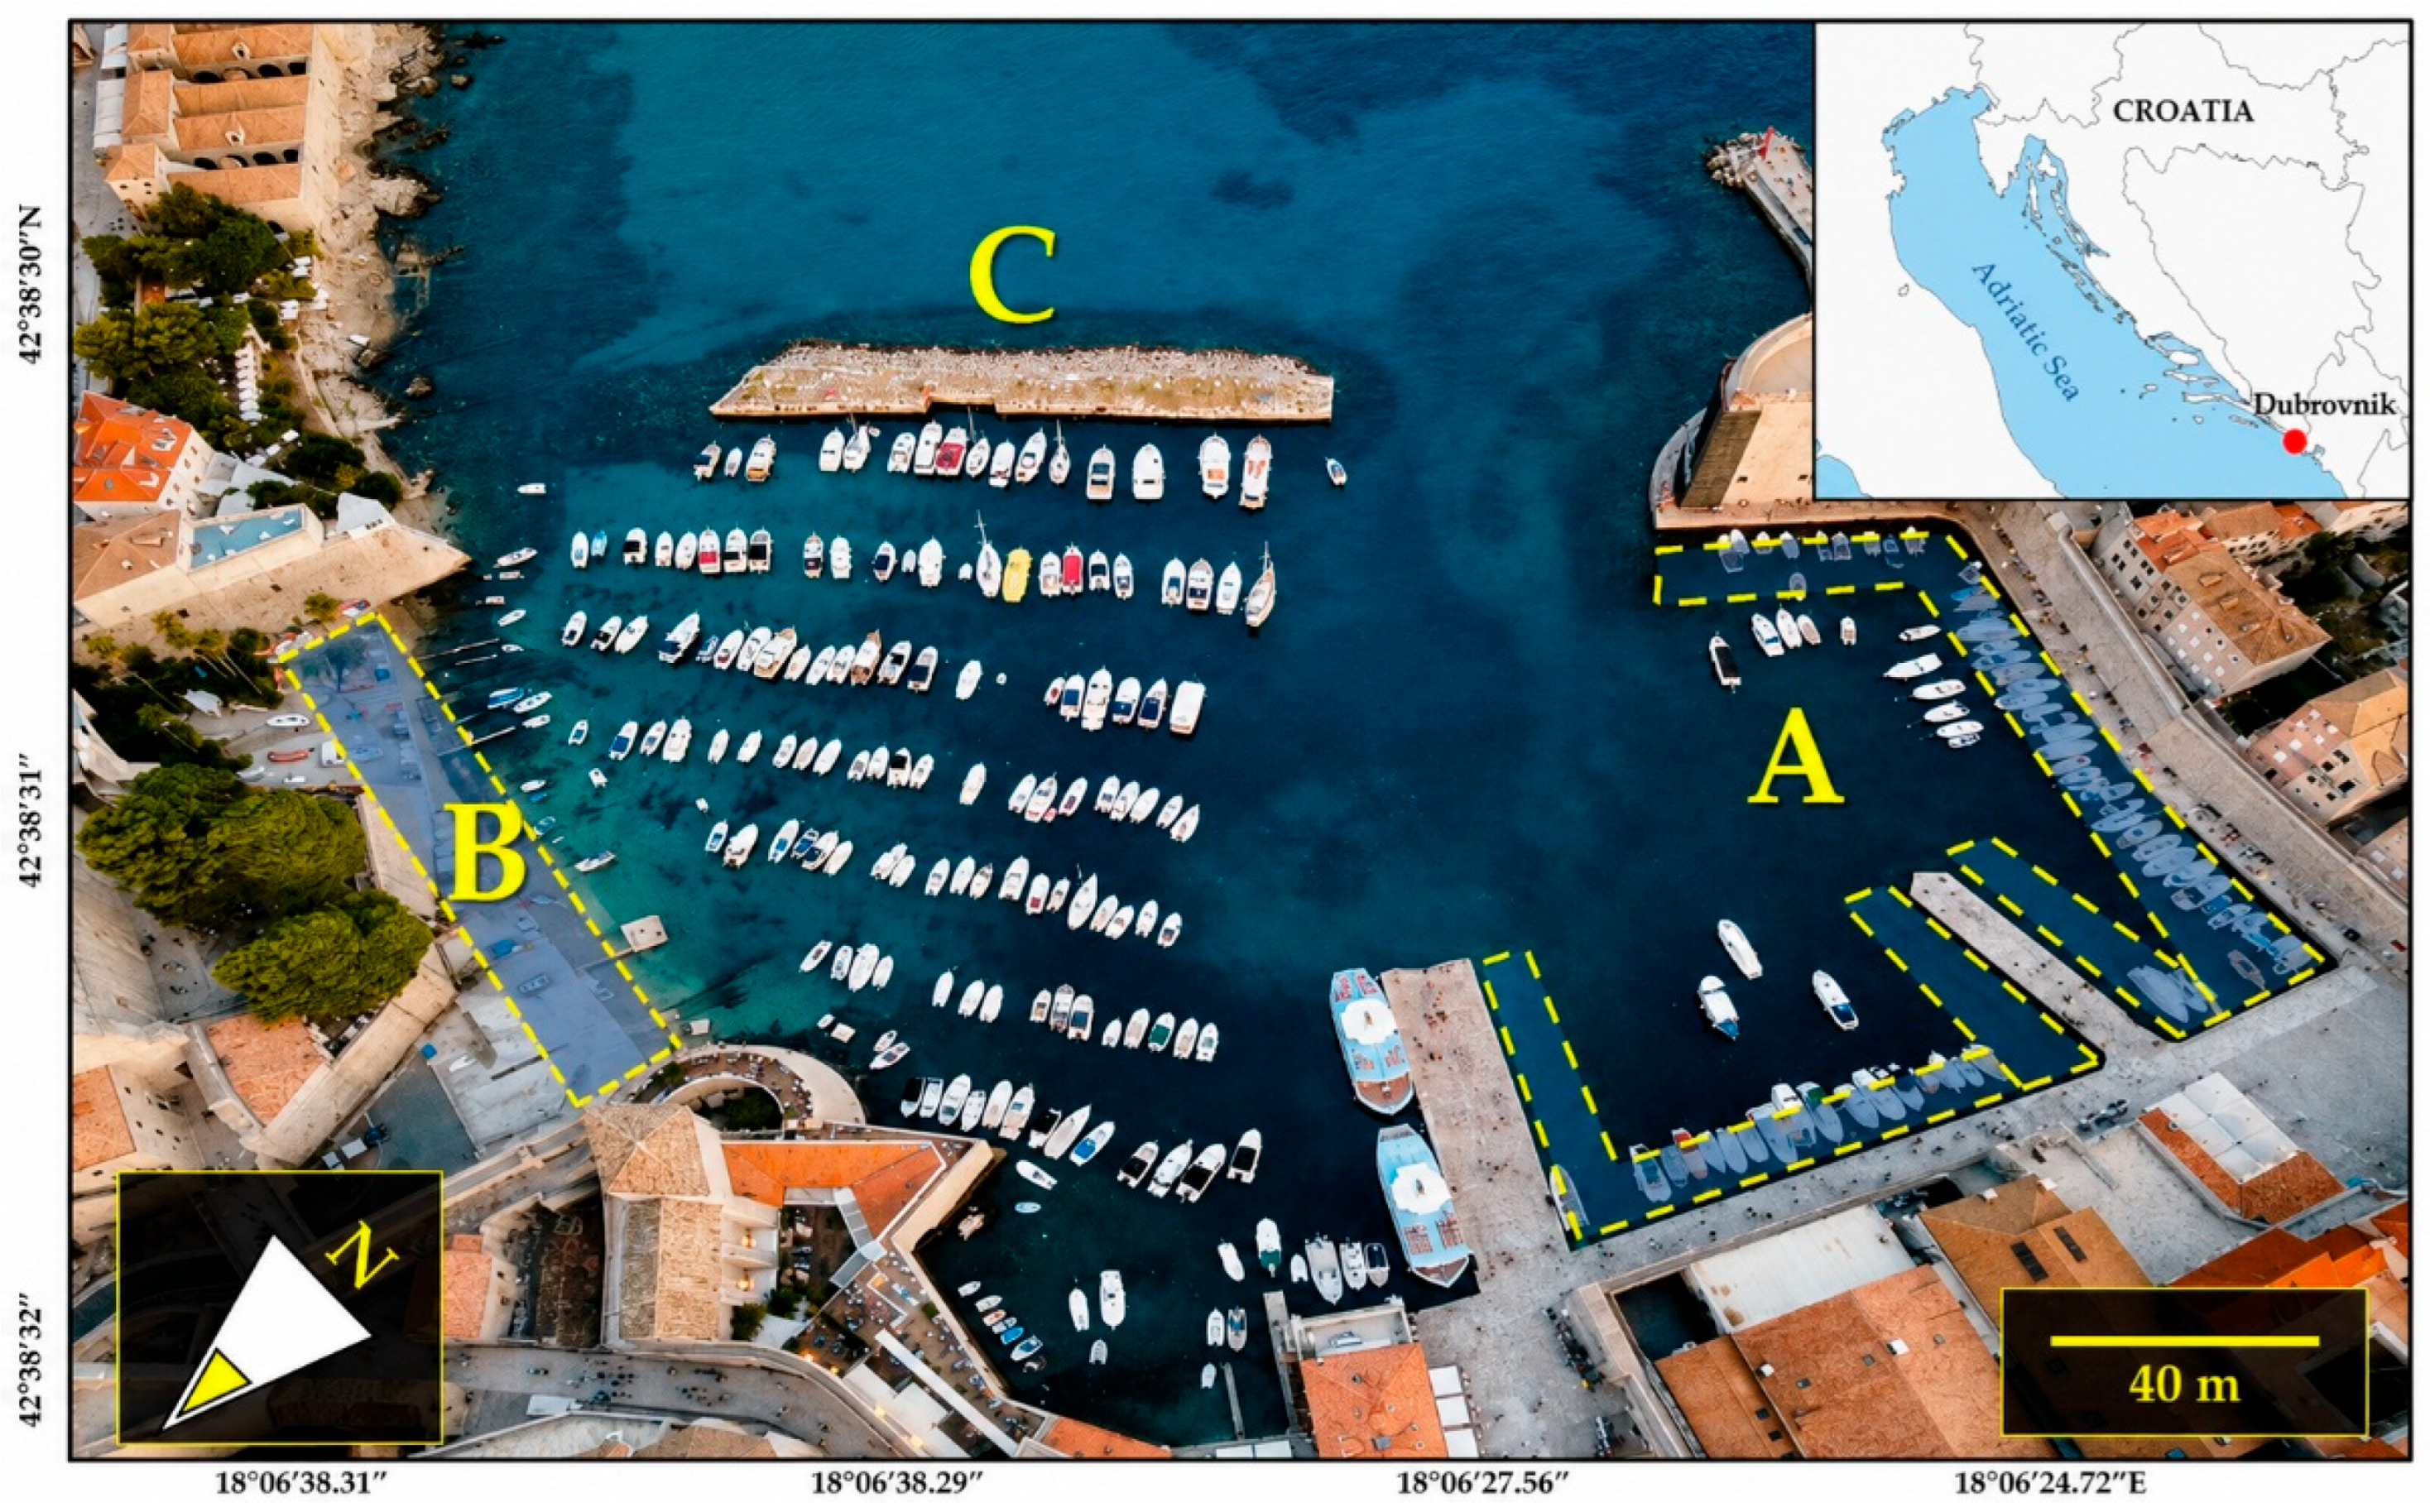
Figure 1. Location of the sampling sites: Porat harbour (A) and Posat beach (B). The Kaše breakwater (C) is included as a reference feature. Photo courtesy of Igor Brautović.
Sustainability 18 08239 g001
Figure 2. Representative photographs of the two study sites in Dubrovnik, Croatia. (A) Porat harbour; (B) Posat beach. Photographs by B. Gangai Zovko.
Sustainability 18 08239 g002
Figure 3. Monthly litter abundance (total item count) at Porat harbour and Posat beach (April 2023–March 2024).
Sustainability 18 08239 g003
Figure 4. Monthly litter mass at Porat harbour and Posat beach (April 2023–March 2024).
Sustainability 18 08239 g004
Figure 5. Mean monthly litter mass (kg) during high tourist season vs. off-season at Porat harbour and Posat beach.
Sustainability 18 08239 g005
Figure 6. Monthly Clean Coast Index (CCI) at Posat beach, April 2023–March 2024, based on all litter items.
Sustainability 18 08239 g006
Figure 7. Material composition of litter recorded at Porat harbour over the full survey year (April 2023–March 2024): (A) relative composition by item count (n = 1325) and (B) relative composition by mass (total = 30.46 kg). Percentages are rounded to one decimal place and may not sum to exactly 100%.
Sustainability 18 08239 g007
Figure 8. Material composition of litter recorded at Posat beach over the full survey year (April 2023–March 2024): (A) relative composition by item count (n = 1768) and (B) relative composition by mass (total = 61.54 kg). Percentages are rounded to one decimal place and may not sum to exactly 100%.
Sustainability 18 08239 g008
Figure 9. Top 10 litter item categories at Porat harbour and Posat beach by total item count (April 2023–March 2024).
Sustainability 18 08239 g009
Figure 10. Non-metric multidimensional scaling (NMDS) ordination of monthly litter composition by material group (Bray–Curtis dissimilarity; stress = 0.030). Each point represents one monthly survey, coloured by compartment and shaped by season; crosses mark compartment centroids. The wider scatter of the Porat samples reflects the greater month-to-month variability in harbour litter composition.
Sustainability 18 08239 g010
Table 1. Comparison of the two litter compartments, the floating litter of Porat harbour and the stranded litter of Posat beach, grouped by comparability. Metrics in the upper block are dimensionless or relative and are independent of sampling geometry; values in the lower block derive from different sampling geometries (linear surface skimming vs. areal standing-stock collection) and are reported for context only, not as equivalent measurements. Monthly dynamics in the two compartments were effectively decoupled (Spearman’s ρ = −0.10 for abundance and 0.38 for mass; both non-significant).
MetricPorat (Harbour)Posat (Beach)Comparable?
Directly comparable metrics (dimensionless or relative; independent of sampling geometry)
Plastic share by count (%)84.979.2Yes
Plastic share by mass (%)49.633.2Yes
Leading item categoryplastic fragments 2.5–50 cmEPS fragments 2.5–50 cmYes (qualitative)
Coefficient of variation, monthly abundance (%)13577Yes
Month of peak abundanceMayAprilYes
Tourist- vs. off-season abundance+84% (151 vs. 82 per month)Nearly flat between tourist season and off-seasonYes
Indicative only (different sampling geometry and litter compartment—not method-equivalent)
Sampling methodsurface skimming (floating litter)standing-stock (stranded litter)
Spatial unit of normalisationlinear transect; density per metre of shoreline whole-area collection; density per metre of shoreline (m2 used only for CCI)
Total abundance (items)13251768Indicative only
Total mass (kg)30.4661.54Indicative only
Density (items/m)0.341.42Indicative only
Mean Clean Coast Indexnot applicable (linear skimming)7.1 (moderate)Site-specific
Table 2. Comparative overview of the Clean Coast Index (CCI) reported for beaches in different regions of the Adriatic Sea and the wider Mediterranean. * indicates CCI values calculated using only plastic and polystyrene, whereas all other values were calculated using the “all items” formula.
RegionSiteCCISource
North AdriaticFerrara (ITA)1.55–10.25[44]
NW Adriatic beaches (ITA)2.5–11.4[45]
Boccasette beach (ITA)3.36–9.67[46]
Slovenian beaches (Debeli Rtič, Simonov Zaliv, Portorož, Jadranska, Bele Skale, Seča) (SLO)5.67–49.29[47]
Slovenian beaches (Bele Skale, Fiesa (Piran), Strunjan) (SLO)3.3–9.8[13]
Central AdriaticVodenjak cove, Iž Island (CRO)48.4[22]
Puntamika (CRO)22[21]
Omiš (CRO)4.3[13]
Sakarun (CRO)150[21]
Lojišće (CRO)29[21]
Zaglav beach (CRO)211[13]
South AdriaticNeretva (CRO)9.6[13]
Neum (BIH)3.1–4[13]
Saplunara (CRO)8.2[13]
Posat beach, Dubrovnik (CRO)7.1This study
Kamenovo (MON)11[13]
Igalo (MON)4.5[13]
Albanian beaches (ALB)3.1–5.9[13]
NW MediterraneanPelagos sanctuary (ITA)1–36 *[48]
SW MediterraneanMorocco beaches (MAR)0.86–1[44]
Ionian SeaIpsos (GRE)18.2[49]
Arillas (GRE)8.5[49]
Chalikounas (GRE)1.7[49]
Sea of MarmaraIstanbul (TR)>20[44]
Disclaimer/Publisher’s Note: The statements, opinions and data contained in all publications are solely those of the individual author(s) and contributor(s) and not of MDPI and/or the editor(s). MDPI and/or the editor(s) disclaim responsibility for any injury to people or property resulting from any ideas, methods, instructions or products referred to in the content.