


Abstract
In the context of an increasingly tense relationship between environmental and economic goals, green innovation is of crucial importance for the global green transformation. However, its dual external effects often render a single policy tool ineffective, which makes the implementation of a policy mix necessary. In this study, according to a three-dimensional policy mix framework, four pilot policies in the fields of environment, innovation, and finance were selected and combined in pairs. Panel data from 276 Chinese cities (from 2006 to 2021) were used to compare the differences in the effects of different types of policy mixes on green innovation using the difference-in-differences method and to verify the mediating effects of green finance and university–industry collaboration. The synergy test results show that the cross-domain mix with the differentiation of tool types and the compatibility of mechanisms is the best. The policy effects were more evident in cities outside the Yangtze River Economic Belt and in non-central cities. These findings provide theoretical and practical insights for designing an effective policy mix to promote green transformation.
1. Introduction
Against the backdrop of global low-carbon transition and sustainable development, urban green innovation has become the core institutional and technological driver for reconciling ecological protection and high-quality economic growth worldwide [1]. Unlike conventional innovation, green innovation suffers from inherent dual externalities of environmental spillover and knowledge spillover, resulting in market failure and insufficient private R&D incentives [2,3]. Accordingly, policy governance has long been regarded as the critical solution to stimulate urban green technological progress. The extant literature has extensively examined the innovation effects of single policy instruments, including environmental regulation, green subsidies, and innovation incentives, and reached a consensus that targeted policy intervention can effectively mitigate green innovation market failures [4,5]. However, governance rarely relies on isolated policies. Governments typically adopt overlapping and complementary policy portfolios covering regulation, fiscal incentives, and technological support to promote urban green transformation [6,7]. Given the prevalent multi-policy governance practice, the conventional single-policy analytical paradigm is increasingly inadequate to explain the complex institutional driving logic of urban green innovation.
A growing body of research has begun to investigate the governance value of policy mix in green innovation, confirming that coordinated policy tools can generate synergistic gains superior to individual policies [8,9]. Existing studies have preliminarily documented that policy portfolios facilitate green innovation by optimizing factor allocation, promoting talent aggregation, and upgrading industrial structures [10,11]. Despite these fruitful findings, two critical theoretical gaps remain underexplored. First, prior work largely focuses on the incremental effect of a single policy portfolio, lacking systematic comparative analysis of heterogeneous synergies and interactive tensions across different mix types [12]. It remains unclear whether environment–innovation, environment–finance, and tech–finance policy mixes exert equivalent innovation effects, neglecting potential complementarity, substitution, or friction among policy tools [13]. Second, extant research overlooks the contextual contingency of policy portfolio effectiveness. Most empirical studies adopt a homogeneous effect assumption, failing to explain why identical national policy frameworks yield divergent green innovation performance across cities with different resource endowments and institutional conditions [14]. The fragmented mechanism analysis and neglected boundary conditions lead to inconsistent empirical conclusions, restricting theoretical development in policy mix and green innovation governance.
Distinct policy types undertake differentiated but complementary governance functions: regulatory policies constrain corporate high-carbon behaviors and expand green technology market demand [15], while incentive and supportive policies optimize innovation resource allocation and compensate for green R&D costs [16]. More importantly, the substantial cross-city heterogeneity in industrial structure, innovation foundation, and institutional environment in China offers unique contextual variations to identify the contingent effects of policy mix. Based on this typical setting, this study addresses two core research questions: How do different types of policy mixes heterogeneously shape urban green innovation performance? What are the core transmission mechanisms and contextual boundary conditions of policy portfolio governance effects?
Our study makes three major contributions. First, it goes beyond the extant research that focuses primarily on policy mix theory and the institution-based view [17]. Based on prefecture-level city panel data, we classify mainstream green governance policies into environmental, financial, and innovation domains, and propose an analytical framework integrating three dimensions—policy instrument type, functional domain, and mechanism compatibility—to compare the effects of different policy mixes. We further verify the mediating roles of green finance optimization and university–industry cooperation, as well as the moderating effects of urban contextual characteristics. Second, our study also transcends the single-policy paradigm by comparatively unpacking heterogeneous synergies and tensions across policy portfolios through isolation sample testing. It clarifies the multi-path transmission mechanisms and contextual boundary conditions of the policy mix, resolving empirical inconsistencies in prior studies. Third, it provides differentiated governance strategies for optimizing the green policy mix within China’s transitional economy, which may offer lessons for other transitional economies with similar institutional features. China’s transitional institutional context provides an ideal quasi-experimental setting to address the above theoretical puzzles [18]. As a typical policy-driven economy facing dual pressures of economic upgrading and carbon mitigation, China has established a comprehensive multi-layered policy system integrating mandatory environmental regulations, fiscal and financial incentives, and technological innovation support to empower urban green transformation [19,20].
2. Literature Review and Hypotheses
This section reviews existing studies on green innovation determinants and analyzes the impact mechanisms of several pilots on green innovation. Based on this, it constructs a theoretical framework using the policy mix theory and proposes research hypotheses.
2.1. Influencing Factors and Policy Mechanisms of Green Innovation
Green innovation refers to innovative activities that can effectively reduce environmental risks and resource consumption and achieve coordinated development of the economy, society, and environment [21]. These activities include technological innovation, management innovation, market innovation, and other means. Currently, there are numerous studies on the influencing factors and policy mechanisms of green innovation, which can be classified into aspects such as institutions, markets, and society [22]. Among them, at the institutional level, the early “Porter Hypothesis” pointed out that environmental regulations can prompt enterprises to generate an “innovation compensation” effect, forcing enterprises to increase their green innovation efforts [23]. In practice, the intensity of environmental regulations should not be too high, otherwise it may reduce the R&D investment of enterprises due to its impact on their profit expectations [24]. At the market level, the effective allocation of innovation factors such as knowledge, human resources, and capital is conducive to improving the R&D efficiency of innovation entities and enhancing the level of green innovation [25]. Additionally, certain market competition may stimulate enterprises’ enthusiasm for occupying market share, promoting their exploration of new technologies [26]. At the social level, the green attention of the government, interest groups, the media, and institutional investors may put pressure on innovation entities such as enterprises, promoting the improvement of their environmental information disclosure levels [27], and strengthening their investment in green innovation to improve environmental performance [28].
China has introduced a series of policies regarding green innovation. Firstly, the carbon emission rights trading pilot policy (CETP) transforms carbon emission quotas into a tradable commodity in the market by implementing a carbon emission quota system and granting enterprises trading rights [29]. In 2013, seven provinces, including Beijing and Tianjin, were selected for policy pilot programs [30]. It forms carbon prices through the quota allocation mechanism and internalizes the cost of carbon emissions [31], enabling emerging low-carbon and green technologies to have tangible economic benefits [32]. The pilot policy of low-carbon cities (LCCP), originated in 2010, emphasizes the use of a mix of administrative orders and market mechanisms to reduce the carbon emissions of cities, thereby forcing enterprises to conduct green technology research and process improvements, providing regulatory pressure for urban green innovation. In addition, the Tech-Finance Integration Pilot (TFIP) policy aims to alleviate the financing constraints faced by innovative enterprises by promoting the development of science and finance. From 2011, it was implemented in three batches with 41 cities selected [33]. TFIP proposed to explore diverse financial support channels and specifically address the financing difficulties of innovative enterprises through tax incentives and subsidies [34]. Finally, the pilot policy of the innovative city (ICP) began in 2008 under the impetus of the Ministry of Science and Technology [35]. Its main objective was to enhance the overall innovation capacity and core competitiveness of cities by concentrating on scientific and technological resources and improving the regional innovation system. Therefore, all these policies have effectively facilitated the transformation of cities toward innovative and green cities.
2.2. Policy Mix and Green Innovation
The policy mix requires that various policies have consistency in goals and complementarity in effects, thereby achieving policy synergy [36]. To systematically analyze the heterogeneous synergies across the policy mixes, this study draws upon Policy Integration Theory [37] and proposes an analytical framework integrating three dimensions: policy instrument type, functional domain, and mechanism compatibility.
First, regarding instrument types, the four pilot policies can be classified into three categories: market-based regulatory instruments (CETP), compulsory regulatory instruments (LCCP), and incentive-based instruments (TFIP and ICP). Second, regarding functional domains, environmental policies (CETP and LCCP) primarily operate on the demand side of green innovation by creating compliance pressure and market demand for low-carbon technologies [26]. In contrast, financial and innovation policies (TFIP and ICP) operate on the supply side by optimizing capital allocation and technological inputs [16]. Third, the synergy of policy mixes depends critically on mechanism compatibility—whether the core transmission logics of the paired policies are mutually reinforcing or generating institutional friction. We identify four distinct mechanism categories among the four pilot policies: price-signaling (CETP), quota-mandating (LCCP), risk-pricing and capital-allocating (TFIP), and resource-aggregating (ICP) [37]. Based on the three-dimensional policy mix framework in Table 1, we speculate that a policy mix featuring different types of tools, complementarity between the supply and demand sides, and compatibility of mechanisms is the most effective for promoting green innovation [38].
Table 1.
Three-dimensional policy classification.
Based on this framework, we hypothesize that the strongest synergy mix is CETP and TFIP. This mix involves both the supply and demand domains and has compatible implementation mechanisms. The price signal of CETP internalizes the cost of carbon emissions, creating economic value for green technologies [39]. While TFIP can utilize the price signal to identify, price, and fund low-carbon projects. Since the carbon price provides an objective value benchmark for green financial products, the information asymmetry problem between lenders and innovators has been significantly alleviated [40]. On the contrary, the weakest synergy effect is that of CETP and LCCP. This mix integrates two demand-side policies, but the mechanisms are incompatible. Both policies target high-polluting enterprises through environmental constraints, but CETP uses market prices to incentivize emission reduction, while LCCP enforces compliance through political accountability. When both are implemented simultaneously, enterprises face dual regulatory pressure but lack an incentive mechanism [41]. Therefore, they may prioritize meeting compliance targets rather than participating in the complex carbon market [10].
Therefore, we propose Hypothesis 1:
H1.
The policy mixes are positively associated with urban green innovation.
H1a.
Due to the differences in tool types, application fields, and action mechanisms, the effects of different policy mixes vary significantly in terms of synergy.
2.3. Policy Mix, University–Industry Collaboration, and Green Innovation
University–industry collaboration (UIC) serves as a core mechanism for translating academic knowledge into commercial green technologies, integrating complementary resources and capabilities across sectors to address the persistent knowledge in green innovation, where academic research often remains disconnected from industrial decarbonization needs [42,43]. By integrating resources from enterprises, universities, and research institutions, UIC provides substantial support for green innovation, facilitates the sharing and integration of knowledge and technology, and thereby accelerates the green innovation process. Under the UIC framework, complementary assets—such as financial support and commercialization platforms from firms, as well as knowledge-technology spillovers from universities and research institutes—work in concert to expedite the development, translation, and application of green technologies [42].
Under the policy mix, UIC is significantly enhanced across multiple dimensions. In terms of funding support and resource integration, policies in the fields of finance and innovation shape the methods of fiscal investment in science and technology and mobilize private capital, thereby providing diversified funding sources for UIC and effectively alleviating financial bottlenecks in collaborative projects. Simultaneously, by improving the sci-tech finance organizational system and establishing collaborative innovation platforms, they strengthen resource sharing and synergistic innovation among the involved parties, which accelerates the translation and application of scientific and technological achievements [43]. Meanwhile, environmental policies also exert a promotive effect on knowledge sharing and resource pooling within UIC. Many local policy documents emphasize the importance of deeply integrating industry, universities, research, and application for low-carbon, zero-carbon, and negative-carbon technologies, providing directional guidance for basic and frontier research related to carbon reduction in key sectors. A stronger UIC, in turn, accelerates green innovation by facilitating seamless knowledge sharing, technology transfer, and resource pooling, enabling firms to access cutting-edge academic knowledge while universities benefit from industrial resources and real-world feedback to refine research directions—creating a virtuous cycle of innovation that drives both technological advancement and commercialization [22,42]. Empirical evidence confirms that regions with coordinated environmental–innovation policies exhibit higher UIC intensity and greater green patent output, validating the mediating role of UIC in translating the policy mix into green innovation gains [10].
H2a.
University–industry collaboration mediates the positive relationship between the policy mix and urban green innovation.
2.4. Policy Mix, Green Finance, and Green Innovation
Green finance refers to providing financial support for specific economic activities to achieve environmental optimization, improve climate conditions, and enhance resource utilization efficiency, etc. [44]. By providing financial support, it effectively alleviated the shortage of project funds in areas such as clean energy, green transportation, and green buildings, thereby promoting the research and large-scale application of green technologies. Through systematically quantifying the environmental benefits of enterprises and other organizations, green finance can guide social capital to converge toward the green sector, optimize resource allocation, and promote the formation and development of a green innovation ecosystem [20]. During the process of innovating financial products and service models, the financing costs and risks of green innovation projects have been reduced, and the feasibility and sustainability of green innovation have been guaranteed.
The policy mix provides a favorable development environment for the green finance industry, thereby further enhancing the urban green innovation level [45]. The policy mix fosters the development of green finance through complementary institutional enabling and market creation pathways, laying the foundation for a robust green financial ecosystem. Complementarily, financial and innovation policies drive market creation by nurturing green financial infrastructure, including green banks, digital finance platforms, and green bond markets, which expand the supply of specialized green financial products and services [33]. Mature green finance, in turn, optimizes resource allocation by directing capital toward clean energy, green transportation, and sustainable manufacturing sectors, accelerating the development, demonstration, and large-scale deployment of green technologies and fueling the growth of vibrant green innovation ecosystems [20,44]. Under the implementation of these policies, fintech continued to develop, and digital platforms were gradually established. Green loans and other businesses could achieve intelligent identification and online real-time processing, effectively improving the accessibility and convenience of green finance.
H2b.
The policy mix promotes urban green innovation by fostering the development of green finance.
2.5. Heterogeneity in the Effects of the Policy Mix
Existing literature extensively examines policy heterogeneity in green innovation, with a consensus that urban location factors, infrastructure, and industrial base differences yield varied outcomes from pilot policies [46]. From a geographical and environmental perspective, cities in coastal or ecologically fragile areas often face stricter environmental regulations and greater societal oversight, resulting in a more urgent demand for green transformation. Consequently, policy dividends in these regions are more readily converted into innovation momentum. In contrast, inland and resource-based cities, constrained by traditional “path dependency” and a scarcity of innovation factors, tend to experience policy implementation that focuses more on promoting the green retrofitting of traditional industries and facilitating the transfer of green technologies [47].
Furthermore, from the perspective of the city level, cities with higher administrative status or higher economic development levels have well-established digital infrastructure and green municipal facilities, which significantly reduces the barriers to the application and transaction costs of green technologies. Therefore, they can more effectively utilize policy resources, thereby achieving large-scale application and iterative development [48]. In contrast, cities with inadequate infrastructure struggle to translate policy support into substantive innovation outputs due to a lack of supporting conditions [19].
H3.
The effect of the policy mix on green innovation is heterogeneous across cities with different urban hierarchy and urban location.
3. Research Design
For studies aiming to measure the impact of a policy shock, the Difference-in-Differences (DID) method can effectively identify the “net effect” of the policy. We paired the four pilot policies in pairs to form different types of policy mixes, and then conducted the test using the DID method.
3.1. Data
Regarding patent data related to green innovation, we collect information from the official website of the China National Intellectual Property Administration and the Patsnap patent database. Data for other variables are sourced from the China Statistical Yearbook, annual statistical bulletins of individual cities, and the CNRDS data platform. To ensure data availability and completeness, among the more than three hundred prefecture-level administrative regions nationwide, we exclude city samples with severe data deficiencies, such as Bijie and Changdu. After handling missing values, a panel dataset comprising 276 cities spanning the period from 2006 to 2021 is retained for analysis.
3.2. Variable Measurement
The dependent variable in this study is urban green innovation, which is measured by the per capita number of green invention patents (GIP). Specifically, the research first adopts the International Patent Classification (IPC) codes listed in the “IPC Green Inventory” proposed by the World Intellectual Property Organization in 2010 as the criterion for determining whether a patent qualifies as “green.” Subsequently, patent application data are downloaded from the China National Intellectual Property Administration. City-level patent application totals are aggregated and merged into the panel dataset. Per capita patent applications—calculated by dividing each city’s annual patent count by its population (in ten thousand)—serve as the urban green innovation measure. We acknowledge that using only green invention patents as proxy variables for urban green innovation has limitations as it cannot reflect the commercialization and environmental benefits of technology. Nevertheless, green patents remain the most widely accepted and feasible proxy variable for green innovation at the city level. Patent data is objectively recorded, and the classification criteria in the IPC list ensure cross-regional comparability. In addition, we used two alternative metrics for robustness testing: the Green Utility Model Patent (GUP) and the sum of Green Invention Patent and Utility Model Patent (GTP).
The core explanatory variable is constructed as a dummy interaction term. Cities implementing the certain policy mix are coded as 1 (treat = 1), others as 0. In a certain city, it was coded as 1 (post = 1) during the period when the corresponding policy mix was implemented (the implementation time of the policy mix starts from the later of the two), and 0 before that. The interaction term (treat × post) serves as the key explanatory variable (DID). The annual data of treated cities of each pilot policy and policy mix are shown in part 1 of Table S1.
Mechanism variables include green finance (GF) and university–industry collaboration (UIC). GF is measured using an index derived via entropy weighting, incorporating sub-indicators: green credit, investment, insurance, bonds, support, funds, and equity [49]. The calculation formula of green finance indicators is shown in part 2 of Table S1. For UIC, patents are sourced from the China National Intellectual Property Administration data. A patent is classified as a university–industry-research collaboration if co-inventor institutions contain keywords like “university,” “school,” or “research institute” [50]. Specifically, patents whose applicants include both a listed company and a university or research institution are defined as UIC patents. Given the dominant role of enterprises in resource allocation and technological innovation, patents are aggregated according to the location of the affiliated enterprises to obtain the city-level count of UIC patents, which is then logarithmically transformed for measurement.
Furthermore, we primarily select the following control variables: (1) Economic Development Level (ED), measured as the logarithm of per capita GDP; (2) Fiscal Level (FL), measured as the ratio of the general public budget to GDP; (3) Financial Development Level (FD), measured as the ratio of total loans from financial institutions at year-end to GDP; (4) Education Expenditure (EDU), measured as the ratio of education expenditure to the fiscal budget; (5) Social Consumption Level (SC), measured by scaling the total retail sales of consumer goods according to regional GDP; (6) Trade Openness (TO), measured as the ratio of the city’s total international trade volume to its regional GDP; (7) Research and Development Expenditure (RD), measured as the ratio of fiscal expenditure on science and technology to the fiscal budget [51].
The descriptive statistics of the main variables are presented in Table 2 below.
Table 2.
Descriptive Statistics.
3.3. Model Specification
Due to the different implementation times of each pilot policy, we employed a multi-period difference-in-differences model. For each policy mix, the first year when the later policy among the two pilot policies was implemented was taken as the year of policy implementation to examine the impact of the policy mix. The regression equation is as follows:
In Equation (1), the subscript t denotes the year, and i denotes each city. is the dependent variable, representing the level of green innovation. is the core explanatory variable, assigned a value of 1 for cities that have implemented this policy mix, and 0 for all other observations. includes a series of control variables that may influence the urban green innovation level. In addition, it also includes two other policies that were not included in this policy mix. and denote city fixed effects and year fixed effects, respectively. Furthermore, this model employs clustered robust standard errors, with cities as the clustering unit. is the intercept term, and is the random error term.
4. Empirical Test
4.1. Benchmark Regression
Table 3 presents the regression results of the impact of five policy mixes on green innovation. Columns (1) to (5) correspond, respectively, to the mixes of CETP and TFIP, LCCP and TFIP, CETP and ICP, CETP and LCCP, and TFIP and ICP. The estimated coefficients of each core explanatory variable are all significantly positive at the 5% statistical level. This indicates that various policy mixes of environmental, financial, and innovation policies have all had a significant positive promoting effect on green innovation, verifying the H1 proposed in this paper, that is, policy mixes significantly promote the level of green innovation. However, the parallel trend test of LCCP × ICP failed, mainly because the pilot list of the two cities was announced by the National Development and Reform Commission in the same year, and the selection of the dual pilot cities was clearly based on existing urban attributes, mainly including fiscal capacity and innovation endowment, and had non-randomness. In addition, the attributes of these cities themselves can affect the growth of green innovation, resulting in a clear pre trend. Therefore, we do not make a main effect statement for this mix and only keep its regression results and parallel trend test in Table S2 and Figure S1 for reference.
Table 3.
Benchmark Regression.
Further examination of the coefficient values reveals that the promotion effects of different policy mixes exhibit significant heterogeneity. Specifically, the coefficient for the CETP and TFIP mix (column 1) is the largest (2.247), and it is statistically significant at the 1% level, indicating that the mix of market-oriented environmental policies and financial policies has the strongest effect. The CETP and ICP policy mix ranks second, with a coefficient of 1.600. In contrast, the coefficient for the CETP and LCCP policy mix is the smallest (0.431), and it has the weakest effect among the mixes. This might imply that the two environmental policies have certain functional overlaps or target substitution effects when combined, resulting in relatively limited synergy effects. However, the cross-domain mix of environmental policies with technology finance or innovation policies has a greater marginal effect due to stronger functional complementarity.
4.2. Parallel Trend Test
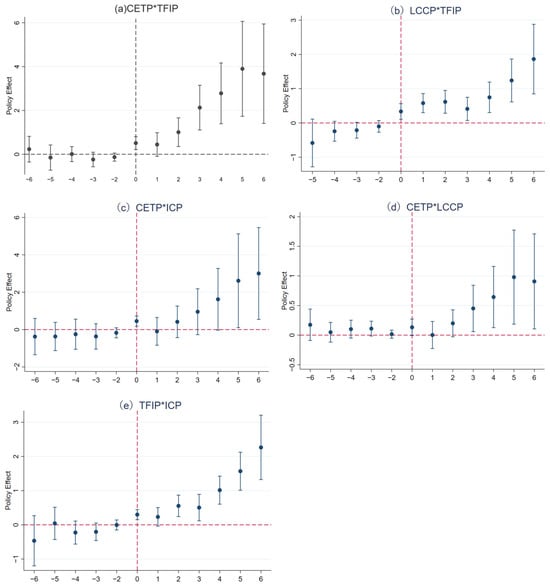
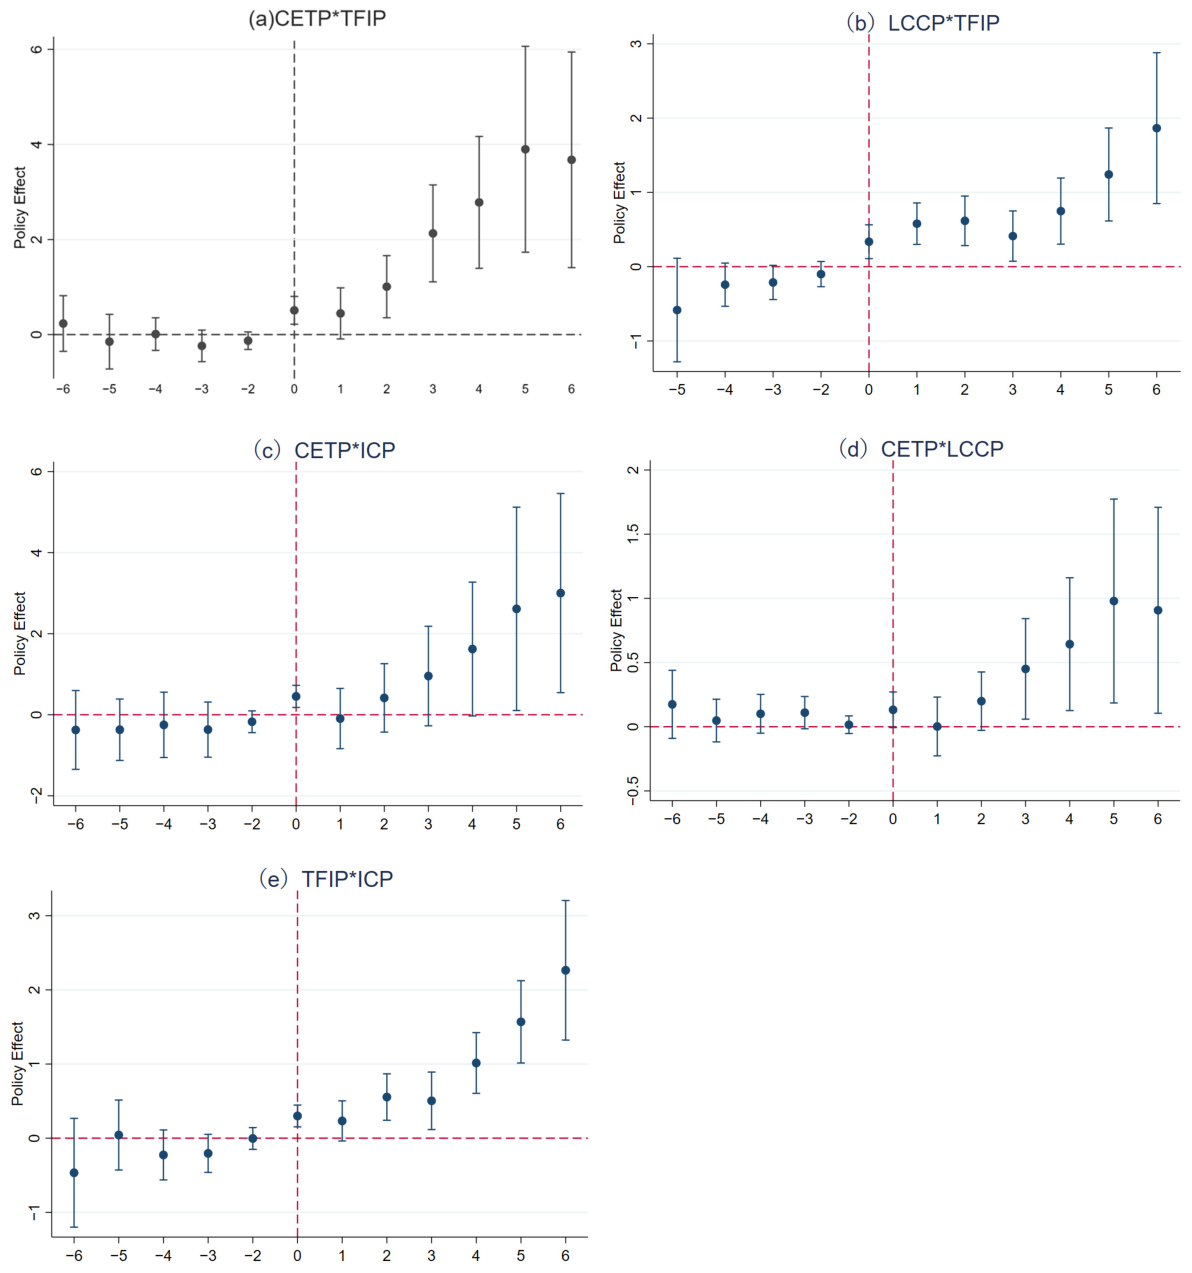
In the Difference-in-Differences (DID) framework, the credibility of quasi-experimental analysis hinges on the foundational premise of parallel trends between treatment and control groups before policy enactment. To rigorously validate this condition, we anchor our trend analysis in the year immediately preceding the policy mix implementation. Figure 1 shows the estimated treatment effects for each period before and after the implementation of the policy mixes.
Figure 1.
Parallel Trend Test.
According to Figure 1, before the implementation of policy mixes, there was a negligible difference between the control group and the treatment group, and the confidence interval always covered the zero line. Therefore, before the implementation of the policy mixes, there was no significant difference in the trend of green innovation levels between the treatment group and the control group. After policy implementation, a significant treatment effect gradually emerged (p < 0.05), and the regression coefficient also gradually increased, verifying the core parallel trend assumption in the difference-in-differences framework.
4.3. Placebo Test
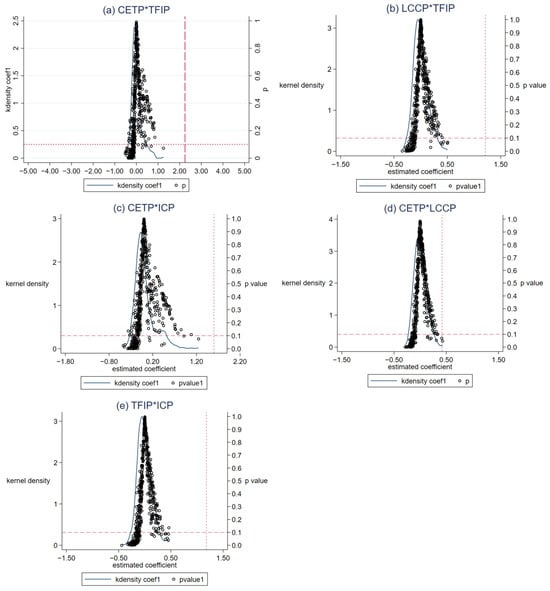
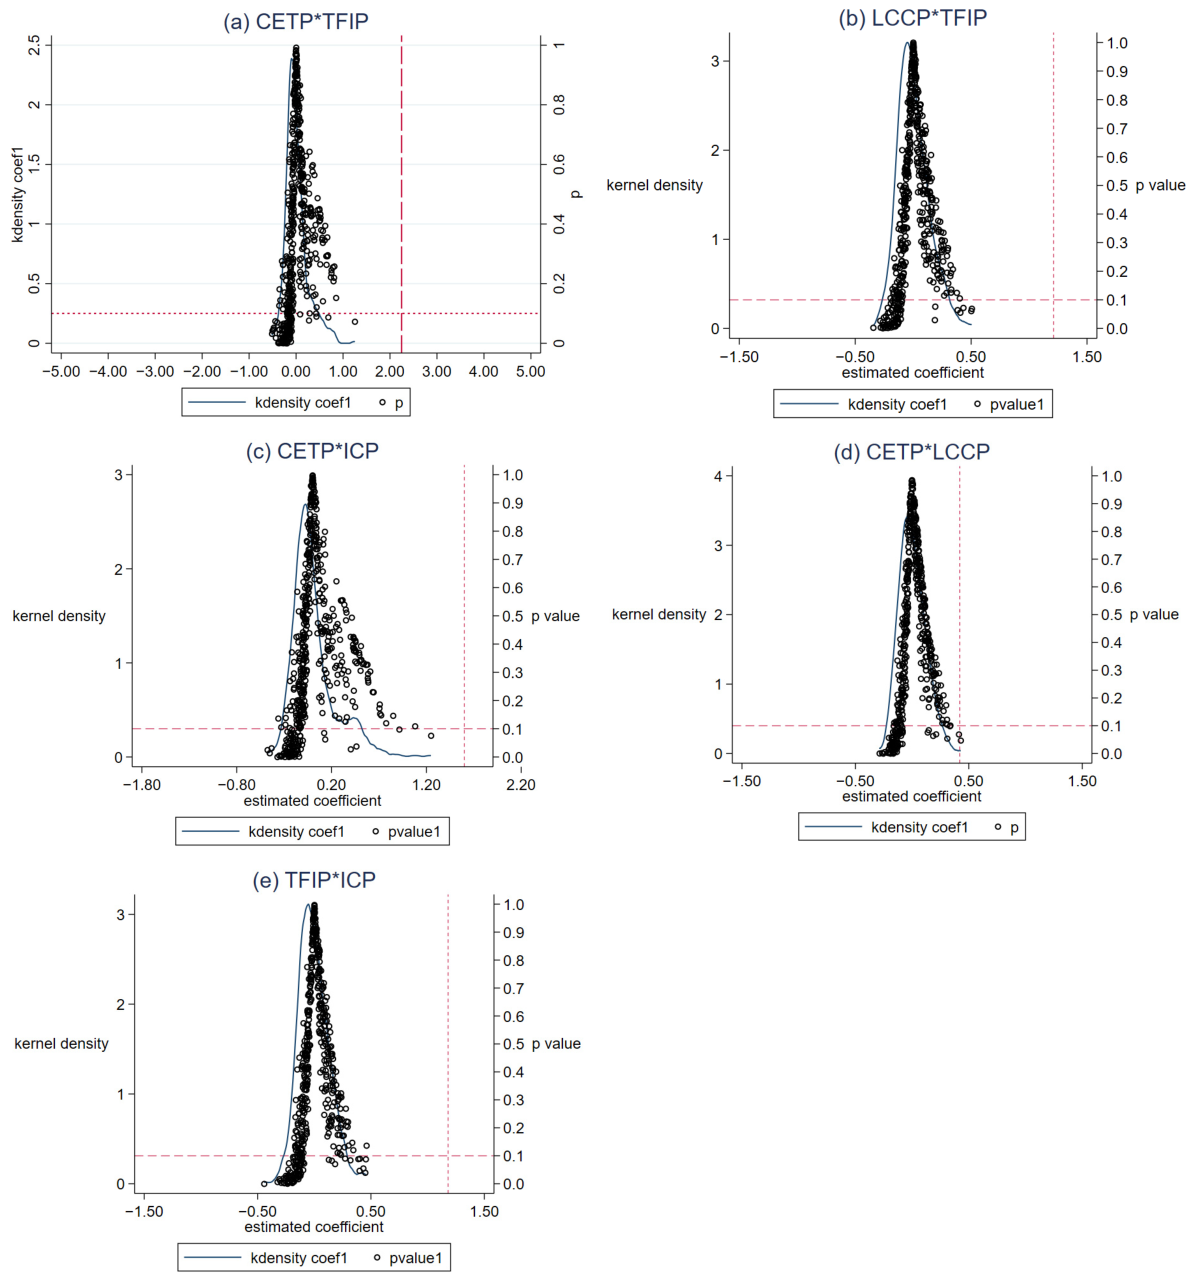
To rigorously validate the robustness of the benchmark regression findings and eliminate potential spurious correlations arising from stochastic disturbances, we implement a Monte Carlo placebo test through synthetic treatment group construction. Specifically, we probabilistically allocate the corresponding number of municipalities from the 276-city sample as artificial treatment cohorts, generating synthetic policy dummies via interaction between the stochastic group assignment and temporal indicators. The interaction term is incorporated into the original Model (1) specification for iterative regression analysis. This stochastic assignment process is iterated 500 times to establish empirical distributions under null hypotheses. Figure 2 presents the results of the placebo test for the policy mixes, illustrated through kernel density plots of the p-values and the distribution of the estimated coefficients obtained from the repeated sampling.
Figure 2.
Placebo Test.
Figure 2 shows that the scatter plot of the estimated coefficients largely conforms to a normal distribution, with the vast majority of the p-values associated with these coefficients exceeding 10%. The fictitious regression coefficients are predominantly clustered around zero, which stands in marked contrast to the actual estimated coefficient (The red vertical dashed line in the picture) for the policy variable (did) obtained in the benchmark regression. This outcome suggests that the benchmark regression result is unlikely to have occurred by chance, effectively reflecting the genuine policy effect.
4.4. Robustness Test
Heterogeneous treatment effect. Among the five policy mixes, three are multi-period pilot projects that involve the issue of heterogeneity treatment effects. To further rule out the concern of heterogeneous treatment effect bias, we apply the Goodman-Bacon decomposition. As shown in Table 4, the ‘treated versus never-treated’ comparisons account for over 97% of the total weight for all policy variables, while the weights of problematic ‘early versus late’ comparisons are negligible (all below 4%).
Table 4.
Goodman-Bacon decomposition.
Entropy Balancing. The selection of pilot cities mainly takes into account factors such as the practical foundation of energy trading (CETP), technological resources and financial development (TFIP), carbon emission industry intensity (LCCP), and innovation environment (ICP). Therefore, the measurement of policy impact may be affected by the existing advantages of the cities. To alleviate potential estimation biases arising from sample self-selection, this study further employs entropy balancing as a robustness check. Specifically, all control variables are used, with the balancing constraint imposed only on the first moments of the covariates between the treatment and control groups. The results in Table S3 show that the estimated coefficients for most of the policy mixes remain statistically significant at the 5% level. The results show that the core conclusion remains generally robust.
Replace the key variables. The regression was conducted using the per capita application volume of the green utility model patent (GUP) and the combined per capita application volume of the two types of patents (GTP) instead of GIP.
Shortening the time window. During the period from the end of 2019 to 2021, some cities in the sample experienced prolonged shutdowns and production halts at different times due to epidemic control measures, which might have caused certain disruptions to innovation activities. Therefore, the sample period was shortened from 2006 to 2019 for a new regression analysis to conduct a robustness test.
Trimming the sample. The results of the main effect regression capture the policy impact for cities transitioning from non-pilot status to implementing the policy mix, as well as for those transitioning from implementing a single pilot policy to the policy mix. However, the control group includes cities that implemented only one of the pilot policies, which may introduce some interference in identifying the effect of the policy mix. Therefore, for the robustness check, cities that implemented only a single pilot policy are excluded from the sample before re-running the regression. Other robustness results are shown in Table S4.
4.5. Policy Coordination
The above results suggest that different policy mixes are associated with higher levels of green innovation, but there are differences between various policy mixes. Therefore, more in-depth tests are needed to verify the synergy between the policies. Identifying policy synergy requires separating the independent effects of a single policy. If cities that are completely unaffected by policies are included in the control group, the estimated total effect is “policy mix vs. no policy and single policy,” rather than the net synergistic effect of “policy mix vs. single policy.” Therefore, we limit the sample to cities affected by at least one policy, making the control group a ‘single policy treatment group’ in order to more accurately identify additional synergies. Excluding non-pilot cities may shift the estimated results towards’ high policy response ‘as their institutional foundation may be weaker. However, given that the core concern of this part is the synergy between policies rather than policy effects, it is still reasonable to limit the sample based on past practices [10]. Table 5 reports the regression results under this condition.
Table 5.
Policy coordination.
The results show that, after excluding the samples that were completely unaffected by the policies, four policy mixes still had a significant positive effect on green innovation. Specifically, the estimated coefficients for CETP*TFIP is 1.290, which indicates that a policy mix with complementary supply and demand sides and compatible mechanisms has the most advantageous synergy. The market-oriented pricing of CETP is in line with the allocation of incentive policies, achieving additional policy benefits. CETP*ICP (1.113) and LCCP*TFIP (0.922) both achieve cross domain supply-demand complementarity, but there are differences in mechanism compatibility. CETP*ICP pairs market-oriented price signals with resource aggregation, but price signals effectively guide innovative resources towards green technology development. LCCP*TFIP combines administrative quota enforcement with market-oriented risk pricing, but there is a slight mechanism friction between political accountability and commercial risk return calculation. The coefficient of TFIP * ICP (column 5) is 0.579, indicating that mechanism-compatible supply-side policies can aggregate innovative elements but lack guidance in resource flow, reflecting a moderate level of synergy.
However, the estimated coefficient for the mix of CETP and LCCP (column 4) is 0.132, and it is not statistically significant. This result once again indicates that when two policies in the category of environmental regulation are combined, there may be strong functional overlap. Both the two policies are centered around binding emission reduction targets as their core tools. When they act on the same policy receptor, it is difficult to form complementarity through differentiated mechanisms, and thus no significant synergistic benefits have been achieved.
4.6. Heterogeneity Analysis
First, we divide the sample into cities within the Yangtze River Economic Belt (YREB) and those outside it (NYREB) based on geographical location, following the Yangtze River Economic Belt Urban Agglomeration Development Plan, and conduct separate regressions. From Table 6a, it can be seen that, except for column (2), policy mixes exhibit significant regional differences: in non-Yangtze River Economic Belt regions, the estimated coefficients of policy mixes are all significant, with values much higher than those in the Yangtze River Economic Belt region. This indicates that for non-Yangtze River Economic Belt cities with relatively weak industrial foundations, policy mixes may have promoted stronger “catch-up effects”. The significant results of the LCCP*TFIP mix may be due to the higher environmental compliance standards set by LCCP in the Yangtze River Economic Belt region, reflecting the targeting of cities in different regions.
Table 6.
Heterogeneity analysis. (a) Location Heterogeneity; (b) Level Heterogeneity; (c) Industrial structure.
Next, we categorize the sample into central cities (CC) and non-central cities (NCC) based on city administrative rank for further examination. Central cities include provincial capitals, sub-provincial cities, and the four directly controlled municipalities. The results presented in Table 6b indicate that the promotional effect of the policy mix is primarily concentrated in non-central cities. The regression results for the NCC group exhibit high statistical significance, whereas in the CC group, both the significance levels and the magnitude of the coefficients are comparatively lower.
To explore the underlying reasons, we use the industrial structure (the proportion of added value of the secondary industry in each city) to conduct a moderation effect test. The test results are shown in Table 6c. The results show that the interaction terms between the policy mixes and the industrial structure are significantly negative, and the industrial structure itself is significantly positive. This shows that there is a negative adjustment in the policy effect of industrial proportion: the green innovation promotion effect of the policy mix is stronger in cities with weak industrial foundations. The existing innovation foundation and environmental regulation of industrial cities make the marginal income low, and the path dependence and asset lock-in of some heavy chemical industries also further dilute the policy effect.
Therefore, the effect of the policy mix on promoting green innovation displays a distinct structural characteristic: policy dividends appear to be more inclined to flow toward regions that are policy lowlands and in the period of industrial structure transformation, such as those outside the Yangtze River Economic Belt and non-central cities.
4.7. Mechanism Verification
Since existing literature has demonstrated that green finance (GF) and university–industry collaboration (UIC) are important pathways for achieving green innovation [5,52,53], we employ the “two-step approach” to test the mediating effects of two mechanism variables. In addition, the bootstrap test was added to verify the mediation effect, and the results are disclosed in Table S5.
The results of Panel A of Table 7 show that all policy mixes are positively associated with UIC. Specifically, the estimated coefficients for the CETP*TFIP mix (column 1), CETP*ICP mix (column 3), are 0.657 and 0.528, which are significant at the 5% level; the coefficients for the LCCP*TFIP mix (column 2), and TFIP*ICP mix (column 5) are 0.401 and 0.446, which are highly significant at least at the 1% level. The bootstrap test in part 1 of Table S5 shows that the 95% deviation correction confidence interval of the indirect effect and direct effect of the policy interaction terms through the patent logarithm of UIC does not include 0, indicating that the partial intermediary effect of the patent logarithm of UIC is significant under all policy mixes. This is consistent with the interpretation that policy mixes are associated with stronger platform-building for cooperation between the government, enterprises, and research institutions, which may serve as a potential channel for knowledge spillover and technology transfer for green innovation.
Table 7.
Mechanism Verification.
Panel B of Table 7 presents the regression results of the policy mixes on green finance. According to the results, the estimated coefficients of the mixes are positive and are significant at least at the 5% level. In addition, the bootstrap test in part 2 of Table S5 shows that the partial intermediary effect of green finance is significant under all policy mixes. Overall, the policy mixes appear to be associated with green innovation gains alongside expanded green financing channels and a reallocation of financial resources toward the green sector.
5. Conclusions and Policy Implications
5.1. Conclusions
Green innovation inherently generates positive environmental externalities and knowledge spillovers, consequently, policy mix strategies are indispensable. Although prior research has confirmed the incremental effect of a single policy mix on the promotion of green innovation, there are still deficiencies in the comparison of policy synergy differences among different types of mixes and the systematic analysis of policy interaction tensions. Drawing upon the three-dimensional policy mix framework of instrument type, functional domain, and mechanism compatibility, we select four pilot policies spanning environmental, financial, and technological domains to construct quasi-natural experiments for policy mixes. Our results demonstrate that most of the policy mixes significantly promote green innovation. This finding is consistent with existing research conclusions on policies promoting green innovation [39,54]. However, by conducting sample isolation to compare the effects and synergy differences of mixes, we find that policy mixes characterized by differentiated instrument types, supply-demand complementarity, and mechanism compatibility yields better synergistic effects. Among them, the mix of market-based environmental policies and financial policies has the strongest effect. Through a unified market-oriented mechanism, it achieves the functional complementarity of demand-side carbon cost internalization and supply-side capital precise allocation. The mix of environmental policies and incentive policies comes second. However, the policy mix belonging to the demand side has produced no additional synergistic effect, which confirms the weakening effect of tool homogeneity and mechanism friction on policy synergy.
The mediating effect of green finance development (GF) and university–industry cooperation (UIC) is consistent with the proposed mechanism through which policy mixes may facilitate urban green innovation, namely by alleviating the two major issues of financing difficulties in innovation and knowledge isolation. Firstly, green finance alleviates the financing pressure on green innovation entities through preferential funding and risk sharing. Our findings suggest that policy mixes provide support for green finance development through measures such as environmental regulations and the cultivation of financial institutions. Market-based policies and financial policies play a major role in this process. Secondly, UIC enhances the level of green innovation from the perspectives of resource sharing and knowledge mutual assistance. We found that policy mix provides market impetus for emission reduction technologies, prompting enterprises to seek external knowledge sources to address technical challenges. On the other hand, by providing stable research funds and a cooperative innovation platform, they lay the foundation for multi-party cooperation. Through these two different paths of GF and UIC, we have enhanced the validity of the conclusion logic and also deepened the understanding dimension of the issue of policy mixes promoting green innovation.
In addition, the level of cities and their geographical features exhibit significant heterogeneity in the effectiveness of policy mixes. Our research findings indicate that policy mixes have a more significant impact on non-YREB cities and non-central cities. This difference is highly correlated with the urban industrial structure and conforms to the economic principles of diminishing marginal returns and latecomer advantages of policies. Most non-YREB regions and non-central cities in China have weak industrial foundations, facing more urgent transformation pressures and a greater gap in green technology. The implementation of policy mixes provides them with a key opportunity to make up for the deficiencies in their industrial foundation and institutional framework, effectively unleashing their innovation potential. Therefore, we not only confirm the significant heterogeneity of policy effects, but also deepen our understanding of how policy resources interact with regional initial endowments to shape innovation outcomes. This result suggests a potential policy priority for considering the development of green innovation capacity in underdeveloped areas within the Chinese urban policy context.
5.2. Policy Implications
Based on the research findings, we synthesize the following policy implications grounded in the three-dimensional policy mix framework, aiming to provide decision-making references for optimizing the environmental governance system and achieving the strategic goal of innovation-driven green development.
Firstly, for Chinese cities, the design of policy mixes may benefit from following the core logic observed in our three-dimensional framework: differentiation of tool types, cross-domain complementarity of functional domains, and maximization of mechanism compatibility. The mix should integrate different types of tools to avoid resource competition caused by simple stacking of similar tools. In addition, the mix should span both the demand side and the supply side. Environmental policies can create market demand and compliance pressure for low-carbon technologies, while supply-side policies provide capital allocation and technological support, forming a policy synergy. Finally, the core mechanisms of the mix should be compatible with each other, such as the alignment between market-oriented price signals and risk pricing logic. Overall, the superposition of policies of the same type often leads to marginal diminishing or even institutional friction, and cross-domain but mechanism-compatible mixes can have a more synergistic effect.
Secondly, the synergistic effect of the policy mix needs to be transmitted through two supporting mechanisms: green finance and UIC. On the one hand, the linkage mechanism between environmental signals and financial pricing should be optimized. Further develop green bonds and green insurance products linked to environmental indicators, so that the constraint strength of environmental policies directly translates into differences in financing costs. On the other hand, building a demand-driven industry–university research collaboration platform. Organize universities, institutions, and enterprises to jointly tackle market opportunities or compliance requirements created by policy mixes, and focus on the industrialization rate of green technologies.
Thirdly, within the Chinese urban context, the choice of policy mix should match the resource endowment and institutional carrying capacity of individual cities, with attention to a moderate tilt toward policy depressions. For cities with weak green innovation foundations and prominent financial constraints, a mix of “market-oriented environmental policies + financial policies” can be prioritized to form an external driving force for catch-up development. The marginal effect of policies in cities with a heavy emphasis on industrial structure is relatively low, and policy implementation should be accompanied by industrial transformation to alleviate the dilution of policy effects caused by asset lock-in.
5.3. Research Limitations and Future Directions
Our research findings have provided some new directions for future studies.
Firstly, this study focuses on comparing the differences in the synergy of environmental, financial, and innovation policies in terms of green innovation across various fields. Although the findings are strongly supportive of our hypotheses, the conclusion still needs to be cautious when extending it to other types of policies such as those related to big data platform construction or intellectual property protection. Therefore, future research can expand the range of policy types and enrich the discussion on the interrelationships of different policies.
Secondly, although the heterogeneity of the impact of different policy mixes on green innovation has been examined in this study, the sequence in which the policies are implemented also merits exploration. For instance, when the implementation of environmental policies precedes that of financial policies, compared to the reverse situation, will the level of urban green innovation be more significantly promoted? Therefore, future research can compare cities with different policy implementation sequences to examine the differences in green innovation outcomes, thereby further deepening our understanding of how the sequence of policy implementation affects the outcome of this mechanism.
Supplementary Materials
The following supporting information can be downloaded at: https://www.mdpi.com/article/10.3390/su18168181/s1, Figure S1. Parallel Trend Test of LCCP × ICP; Table S1. Variable Measurement; Table S2. LCCP × ICP Regression; Table S3. Entropy Balancing; Table S4. Other Robustness Checks; Table S5. Bootstrap Test.
Author Contributions
Conceptualization, K.W.; Methodology, K.W.; Formal analysis, K.W.; Investigation, K.W.; Resources, K.W.; Data curation, K.W.; Writing—original draft, K.W., G.D. and Y.M.; Writing—review & editing, X.P.; Supervision, X.P.; Funding acquisition, X.P. All authors have read and agreed to the published version of the manuscript.
Funding
The National Natural Science Foundation of China, The Mechanism of Blended Value Co-creation of Social Enterprises: Model Evolution and Policy Combinations (72474204).
Institutional Review Board Statement
Not applicable.
Informed Consent Statement
Not applicable.
Data Availability Statement
The data presented in this study are available on request from the corresponding author.
Conflicts of Interest
The authors declare no conflicts of interest.
References
- Aghion, P.; Hémous, D.; Veugelers, R. No Green Growth Without Innovation; Policy Brief 2009/07; Bruegel: Brussels, Belgium, 2009. [Google Scholar]
- Du, W.; He, Q.; Wu, J. Intellectual property protection, green technology innovation, and energy transition: An evolutionary game analysis. Energy Econ. 2025, 151, 108901. [Google Scholar] [CrossRef] [Scilit]
- Tian, X.; Liu, J.; Mai, Q. Exploring the impact mechanisms of the green innovation policy instruments system: A system dynamics approach. Int. J. Environ. Sci. Technol. 2025, 22, 9949–9970. [Google Scholar]
- Popp, D. Induced innovation and energy prices. Am. Econ. Rev. 2002, 92, 160–180. [Google Scholar] [CrossRef] [Scilit]
- Zhang, D.; Mohsin, M.; Taghizadeh-Hesary, F. Does green finance counteract climate change mitigation: Asymmetric effect of renewable energy investment and R&D. Energy Econ. 2022, 113, 106183. [Google Scholar] [CrossRef] [Scilit]
- Howlett, M.; Rayner, J. Patching vs packaging in policy formulation: Assessing policy portfolio design. Politics Gov. 2013, 1, 170–182. [Google Scholar] [CrossRef] [Scilit]
- Rogge, K.S.; Reichardt, K. Policy mixes for sustainability transitions: An extended concept and framework for analysis. Res. Policy 2016, 45, 1620–1635. [Google Scholar] [CrossRef] [Scilit]
- Ma, Y.; Sha, Y.; Wang, Z.; Zhang, W. The effect of the policy mix of green credit and government subsidy on environmental innovation. Energy Econ. 2023, 118, 106512. [Google Scholar] [CrossRef] [Scilit]
- Chu, Z.; Li, W.; Chen, X.; Huang, G. Indirect eco-innovation effects of smart cities: A look across policy mix. Cities 2025, 169, 106549. [Google Scholar]
- Hou, G.; Shi, G.; Guifen, S. Green finance and innovative cities: Dual-pilot policies and collaborative green innovation. Int. Rev. Financ. Anal. 2024, 96, 103673. [Google Scholar] [CrossRef] [Scilit]
- Wang, H.; Shen, Y.; Luo, T.; Wang, F.; Liu, Y. The chain reaction of carbon emission trading policy in efficiency and rebound: Evidence from spatial perspective in China. Humanit. Soc. Sci. Commun. 2025, 12, 36. [Google Scholar] [CrossRef] [Scilit]
- Zhang, P.; Zhou, D.; Guo, J. Policy complementary or policy crowding-out? Effects of cross-instrumental policy mix on green innovation. Technol. Forecast. Soc. Change 2023, 192, 122530. [Google Scholar] [CrossRef] [Scilit]
- Skjærseth, J.B. Towards a European Green Deal: The evolution of EU climate and energy policy mixes. Int. Environ. Agreem. Polit. Law Econ. 2021, 21, 25–41. [Google Scholar] [CrossRef] [Scilit]
- Teece, D.J. Explicating dynamic capabilities: The nature and microfoundations of (sustainable) enterprise performance. Strateg. Manag. J. 2007, 28, 1319–1350. [Google Scholar] [CrossRef] [Scilit]
- An, X.; Deng, H.; Chao, L.; Bai, W. Knowledge management in supporting collaborative innovation community capacity building. J. Knowl. Manag. 2014, 18, 574–590. [Google Scholar] [CrossRef] [Scilit]
- Reichardt, K.; Rogge, K.S. How the policy mix impacts innovation: Findings from company case studies on offshore wind in Germany. Environ. Innov. Soc. Transit. 2016, 18, 62–81. [Google Scholar] [CrossRef] [Scilit]
- Peng, M.W.; Wang, D.Y.L.; Jiang, Y. An institution-based view of international business strategy: A focus on emerging economies. J. Int. Bus. Stud. 2008, 39, 920–936. [Google Scholar] [CrossRef] [Scilit]
- Marquis, C.; Zhang, J.; Zhou, Y. Institutional complexity and organizational responses in transitional economies: Evidence from China. Organ. Sci. 2017, 28, 996–1012. [Google Scholar]
- Zhao, X.; Ma, X.; Chen, B.; Shang, Y.; Song, M. Challenges toward carbon neutrality in China: Strategies and countermeasures. Resour. Conserv. Recycl. 2022, 176, 105959. [Google Scholar] [CrossRef] [Scilit]
- Zhang, T. Can green finance policies affect corporate financing? Evidence from China’s green finance innovation and reform pilot zones. J. Clean. Prod. 2023, 419, 138289. [Google Scholar] [CrossRef] [Scilit]
- Irfan, M.; Razzaq, A.; Sharif, A.; Yang, X. Influence mechanism between green finance and green innovation: Exploring regional policy intervention effects in China. Technol. Forecast. Soc. Change 2022, 182, 121882. [Google Scholar] [CrossRef] [Scilit]
- Chen, Z.; Liang, M. How do external and internal factors drive green innovation practices under the influence of big data analytics capability: Evidence from China. J. Clean. Prod. 2023, 404, 136862. [Google Scholar] [CrossRef] [Scilit]
- Du, K.; Cheng, Y.; Yao, X. Environmental regulation, green technology innovation, and industrial structure upgrading: The road to the green transformation of Chinese cities. Energy Econ. 2021, 98, 105247. [Google Scholar] [CrossRef] [Scilit]
- Lv, C.; Shao, C.; Lee, C.-C. Green technology innovation and financial development: Do environmental regulation and innovation output matter? Energy Econ. 2021, 98, 102237. [Google Scholar] [CrossRef] [Scilit]
- Lin, B.; Ma, R. Green technology innovations, urban innovation environment and CO2 emission reduction in China: Fresh evidence from a partially linear functional-coefficient panel model. Technol. Forecast. Soc. Change 2022, 176, 121434. [Google Scholar] [CrossRef] [Scilit]
- Zhou, F.; Wang, X. The carbon emissions trading scheme and green technology innovation in China: A new structural economics perspective. Econ. Anal. Policy 2022, 74, 365–381. [Google Scholar] [CrossRef] [Scilit]
- Yuan, B.; Cao, X. Do corporate social responsibility practices contribute to green innovation? The mediating role of green dynamic capability. Technol. Soc. 2022, 68, 101868. [Google Scholar] [CrossRef] [Scilit]
- Wang, J.; Ma, M.; Dong, T.; Zhang, Z. Do ESG ratings promote corporate green innovation? A quasi-natural experiment based on SynTao Green Finance’s ESG ratings. Int. Rev. Financ. Anal. 2023, 87, 102623. [Google Scholar] [CrossRef] [Scilit]
- Yang, Y.; Ren, H.; Liu, Y.; Yang, Y. Integration of technology and finance, digital transformation, and corporate green innovation. Financ. Res. Lett. 2025, 71, 106444. [Google Scholar] [CrossRef] [Scilit]
- Wang, Y. Green finance and urban innovation: Evidence from Chinese cities. J. Clean. Prod. 2025, 437, 140892. [Google Scholar]
- Li, Y. Research on the innovation effect of China’s carbon trading pilot. Manag. World 2019, 35, 95–109. [Google Scholar]
- Zhang, J.; Wang, X.; Zhang, W.; Wang, L. Can the carbon emissions trading policy promote the development of new quality productive forces in manufacturing enterprises? Financ. Res. Lett. 2025, 83, 107617. [Google Scholar] [CrossRef] [Scilit]
- Huang, J.; Guo, C.; Yan, S. The integration of technology and finance and corporate innovation boundary. Financ. Res. Lett. 2025, 78, 107135. [Google Scholar] [CrossRef] [Scilit]
- Li, L.; Gan, Y.; Bi, S.; Fu, H. Substantive or strategic? Unveiling the green innovation effects of pilot policy promoting the integration of technology and finance. Int. Rev. Financ. Anal. 2025, 97, 103781. [Google Scholar] [CrossRef] [Scilit]
- Zhang, M.; Hong, Y.; Zhu, B. Does national innovative city pilot policy promote green technology progress? Evidence from China. J. Clean. Prod. 2022, 363, 132461. [Google Scholar] [CrossRef] [Scilit]
- Van den Bergh, J.; Castro, J.; Drews, S.; Exadaktylos, F.; Foramitti, J.; Klein, F.; Konc, T.; Savin, I. Designing an effective climate-policy mix: Accounting for instrument synergy. Clim. Change 2021, 164, 745–764. [Google Scholar] [CrossRef] [Scilit]
- Weng, Z.; Ma, Z.; Xie, Y.; Cheng, C. Effect of China’s carbon market on the promotion of green technological innovation. J. Clean. Prod. 2022, 373, 133820. [Google Scholar] [CrossRef] [Scilit]
- Chen, Z.; Zhang, X.; Chen, F. Do carbon emission trading schemes stimulate green innovation in enterprises? Evidence from China. Technol. Forecast. Soc. Change 2021, 168, 120744. [Google Scholar] [CrossRef] [Scilit]
- Liu, M.; Li, Y. Environmental regulation and green innovation: Evidence from China’s carbon emissions trading policy. Financ. Res. Lett. 2022, 48, 103051. [Google Scholar] [CrossRef] [Scilit]
- Zhou, D.; Lu, Z.; Qiu, Y. Do carbon emission trading schemes enhance enterprise green innovation efficiency? Evidence from China’s listed firms. J. Clean. Prod. 2023, 414, 137668. [Google Scholar] [CrossRef] [Scilit]
- Li, C.; Lei, T.; Wang, L. Examining the emission reduction effect of carbon emission trading and carbon tax synergism and their impact mechanisms to reduce the carbon emission of company: Based on 247 listed companies of China. Technol. Anal. Strateg. Manag. 2024, 37, 2205–2220. [Google Scholar] [CrossRef] [Scilit]
- Xin, X.; Miao, X.; Cui, R. Enhancing sustainable development: Innovation ecosystem cooperation, environmental resource orchestration, and disruptive green innovation. Bus. Strategy Environ. 2023, 32, 1388–1402. [Google Scholar] [CrossRef] [Scilit]
- Jing, L.; Chao, L. How does university–industry collaboration drive green innovation? SAGE Open 2024, 14, 21582440241274500. [Google Scholar] [CrossRef] [Scilit]
- Lin, Y.; Song, Q.; He, L. Can the green finance reform and innovation pilot policy promote green technology innovation?—A novelty evidence from both polluting companies and city commercial banks in China. Environ. Dev. Sustain. 2025, 27, 8403–8431. [Google Scholar]
- Peng, H.; Duan, Y. Green finance, environmental regulation and green innovation: Evidence from China. J. Clean. Prod. 2023, 421, 138458. [Google Scholar]
- Zeng, J.; Yang, M. Digital technology and carbon emissions: Evidence from China. J. Clean. Prod. 2023, 430, 139765. [Google Scholar] [CrossRef] [Scilit]
- Long, S.; Shan, X.; Liao, Z. Influence of the carbon emissions trading policy on green patent transfers: A difference-in-differences design. Emerg. Mark. Financ. Trade 2025, 61, 2658–2677. [Google Scholar] [CrossRef] [Scilit]
- Yu, H.; Jiang, Y.; Zhang, Z.; Shang, W.-L.; Hon, C. The impact of carbon emission trading policy on firms’ green innovation in China. Financ. Innov. 2022, 8, 55. [Google Scholar] [CrossRef] [Scilit]
- Chen, C.; Xie, X. Digital economy development, industrial structure development, and green finance. Financ. Res. Lett. 2025, 85, 108152. [Google Scholar] [CrossRef] [Scilit]
- Liu, F.R.; Hu, L.J.; Fan, X.Q. Research on the influence of industry–university–research cooperation on enterprise innovation quality. Bus. Manag. J. 2020, 42, 120–136. [Google Scholar]
- Hou, C. Analysis of the factors promoting urban green productivity using a system dynamics simulation. Sci. Rep. 2025, 15, 27928. [Google Scholar] [CrossRef] [Scilit] [PubMed]
- Brown, J.R.; Fazzari, S.M.; Petersen, B.C. Financing innovation and growth: Cash flow, external equity, and the 1990s R&D boom. J. Financ. 2009, 64, 151–185. [Google Scholar] [CrossRef] [Scilit]
- Perkmann, M.; Tartari, V.; McKelvey, M.; Autio, E.; Broström, A.; D’Este, P.; Fini, R.; Geuna, A.; Grimaldi, R.; Hughes, A.; et al. Academic engagement and commercialization: A review of the literature on university–industry relations. Res. Policy 2013, 42, 423–442. [Google Scholar] [CrossRef] [Scilit]
- Costantini, V.; Crespi, F.; Palma, A. Characterizing the policy mix and its impact on eco-innovation: A patent analysis of energy-efficient technologies. Res. Policy 2017, 46, 799–819. [Google Scholar] [CrossRef] [Scilit]

Disclaimer/Publisher’s Note: The statements, opinions and data contained in all publications are solely those of the individual author(s) and contributor(s) and not of MDPI and/or the editor(s). MDPI and/or the editor(s) disclaim responsibility for any injury to people or property resulting from any ideas, methods, instructions or products referred to in the content. |
© 2026 by the authors. Licensee MDPI, Basel, Switzerland. This article is an open access article distributed under the terms and conditions of the Creative Commons Attribution (CC BY) license.