


Abstract
When planning 30 km/h zones within a selected urban street network in a city centre, the effectiveness of applicable traffic-calming measures (TCMs) is analysed to support sustainable urban mobility and the design of safer urban streets. One of the possible TCMs is the mid-block narrowing (MBN), which has been reported in previous studies as having limited effectiveness. However, those studies were constrained by several limitations, including the lack of speed v85 analyses at different distances from the MBN and the absence of assessments of other contextual variables affecting speed. To address these gaps, speed measurements were conducted within an urban street network in the city centre of Szczecin, Poland, where several MBNs had been implemented. Speeds were recorded using SR4 sensors at nine measurement points along 12 study areas during three weekdays under dry weather conditions. The collected data were analysed and speed profiles were developed for each study area. Free-flow speed was the dependent variable, while independent variables included junction spacing, different types of entrance and exit junctions, and other contextual factors. The main objective was not only to estimate the operating speed and zone of influence of MBNs but also to identify other factors determining speed profiles between junctions. The analyses showed that speeds depend on junction spacing, street type, the type of entrance and exit junctions together with their traffic arrangement, and the streetscape elements located at the MBN. The outcome of the study was the development of a comparative framework for assessing the speed-related effectiveness of MBNs under specific contextual conditions, providing a basis for the sustainable redevelopment of selected city-centre street networks. This framework may support the implementation of 30 km/h zones in city-centre street networks when planning new interventions, comparing designs, or aiding decision-making.
1. Introduction
Previous studies on the effects of traffic-calming measures (TCMs) on vehicle speed under real-world conditions have mainly analysed either individual measures or their sequences in different locations and environmental contexts. Experimental investigations of the effects of various types of flat-topped speed tables on vehicle speed were conducted at the Transport Research Laboratory (TRL) in the UK [1,2,3,4]. The results of these studies formed the basis for design recommendations included in numerous traffic calming guidelines [5,6,7,8,9,10,11,12,13,14,15,16].
Based on these guidelines, speed tables were typically implemented on residential roads within 30 km/h zones or home zones. Webster [17] analysed the application of speed tables on distributor roads in four selected real-world locations with higher speed limits and higher hourly traffic volumes. His research was linked to the need to maintain capacity following the implementation of traffic-calming measures. He demonstrated that flat-topped road humps could be used on distributor/collector roads and could reduce 85th percentile speeds by up to 11 mph (17.7 km/h).
Over the last three decades, 30 km/h zones have become one of the fundamental instruments of sustainable urban mobility policies implemented in many European cities [18,19,20,21,22]. Their implementation is driven not only by the need to reduce vehicle speeds and improve road safety, but also by broader sustainability objectives, including noise reduction, mitigation of the environmental impacts of road transport, enhancement of public spaces, and promotion of walking and cycling as sustainable modes of transport [23,24,25,26]. Consequently, 30 km/h zones are increasingly regarded as an important component of urban sustainability strategies that aim to improve the quality of life while maintaining the accessibility and functionality of urban transport systems.
Such solutions have been implemented for many years in countries including Austria, Germany, Belgium, France, Spain, and the Netherlands, where urban streets have gradually been transformed into spaces that prioritise pedestrians and cyclists while preserving the necessary level of transport accessibility. Similar measures have also been implemented in many Polish cities, including Szczecin, most often as part of comprehensive programmes involving paid parking zones, traffic-calming measures, and sustainable urban mobility principles [27,28,29,30]. Therefore, the effectiveness of individual traffic-calming measures should be evaluated not only in terms of their local impact on vehicle speed reduction but also within the broader context of sustainable street design, urban mobility management, and the overall performance of 30 km/h zones.
A large number of studies, including those on mid-block narrowings, have primarily focused on pedestrian safety [31,32,33,34,35,36,37,38,39,40,41,42,43,44]. Recent road safety statistics are presented in the WHO report [45] and other relevant publications [46,47,48]. Several previous studies have addressed changes in urban traffic management associated with the implementation of traffic calming (TC) zones and paid parking zones [49,50,51]. Other analyses have examined the effects on vehicle speed of combining mid-block narrowings with various types of additional road infrastructure [52,53,54,55,56] or green infrastructure [57,58,59]. Further research has addressed the environmental impacts of traffic-calming measures [44,60,61,62]. Hall and Jurewicz [34] estimated that painted mid-block treatments contribute to a 15–20% reduction in casualty crash risk; whereas, raised mid-block narrowings (MBNs) can reduce it by up to 45%.
Studies on the influence of traffic-calming measures on free-flow speed v85 have also been conducted on longer street sections by Zito and Taylor [63] (up to 800 m), Ewing [64,65] (up to 1000 m), and Brindle [66,67,68,69,70] on shorter street sections. Their speed profile models indicate that free-flow speed decreases by up to approximately 15 km/h upstream of a traffic calming device and then increases downstream, returning to approximately 40 km/h [63,71]. Entry speed was approximately 25 km/h [63,64], while exit speed varied; for example, in [63] it returned to 0 km/h; whereas, in [61] it was approximately 25 km/h. This suggests that the spatial influence of TCMs on free-flow speed is relatively short.
Other research teams in different countries have recently conducted studies on modelling speed profiles in 30 km/h zones [60,62,71,72,73], demonstrating a variety of speed profile models closely linked to specific contextual conditions of individual streets. In studies [60,71], contextual data were organised into matrices, which were then used as independent variables in the models. The aim of these studies was to develop highly detailed models relying on extensive statistical analysis, which in practice cannot be easily applied by traffic engineers during the design of traffic calming schemes due to limited time available for decision-making. Instead, engineers require an applicable decision-support framework that enables them, after a short analysis, to select appropriate TCMs while accounting for contextual conditions, in line with recommendations formulated by Brindle [70]. In the study by Pazzini et al. [72], the models referred to traffic calming in several streets within 30 km/h zones with different functions, lengths, geometric characteristics, and, in particular, varying daily traffic volumes (from approximately 2000 Veh/24 h to 24,000 Veh/24 h). However, these models were mainly related to three vehicle types: motorcycles, passenger cars, and buses/heavy vehicles. Consequently, they did not provide sufficient guidance for selecting appropriate TCMs in specific street design contexts.
Furthermore, according to [64,65,74,75], in order to maintain a 30 km/h speed limit within a 30 km/h zone, spacing between consecutive TCMs should be in the range of 70–100 m. However, design guidelines [5,6,8] clearly recommend shorter distances of 40–60 m between TCMs to ensure compliance with the speed limit along the entire street length. This discrepancy reflects the significant influence of cultural context and physical environmental factors on vehicle speeds. However, these aspects have not been sufficiently addressed in previous studies.
Based on Brindle [70] (p. 6, Figure 3), a speed profile model was developed defining: street speed, device operating speed (hereafter referred to as “operating speed”), and speed differential (i.e., the difference between street speed and operating speed). This was a significant contribution, as previous studies [1,2,3,4,5,6,7,8,9,10,11,12,13] generally assumed that the reduction in free-flow speed (Δv85) is expressed as the difference between speeds measured before and after a traffic calming device in the direction of travel (Δv85 = v85before TCM − v85after TCM). However, in Brindle’s model, the spatial influence of a TCM is limited, and free-flow speed downstream returns to its previous value. Brindle also introduced, for the first time, a diagram showing ranges of operating speeds for selected horizontal and vertical deflection devices [69,70], which provides a practical decision-support tool for selecting appropriate TCMs in traffic calming design.
Barbosa et al. [76] also investigated the effects of sequences of different TCMs on speed across six case studies in a 30 km/h zone in York, UK. Their study areas were located in suburban environments characterised by discontinuous residential frontage, i.e., low-density detached housing separated from the street by front gardens (see Figure 1a). Two streets were one-way and four were two-way. Road widths ranged from 6 m on one-way streets to between 6.25 m and 7 m on two-way streets. Based on their findings, Barbosa et al. [76] developed a speed profile model incorporating additional parameters and different TCM types, which explained approximately 55% of the variance. They concluded that the model was highly dependent on entry speed and could be further developed. This implies that additional independent variables could be introduced into the model, such as street classification (e.g., arterial, secondary, residential), represented using dummy variables or other contextual parameters [76]. However, the model placed excessive emphasis on measurement spacing and overestimated the effect of speed tables on free-flow speed. Comparative calculations based on this model indicate substantial discrepancies between observed v85 values and modelled estimates under different contextual conditions.
Figure 1.
Example locations analysed in previous studies: (a) a two-lane speed table on Fourth Avenue, York, UK (speed limit: 30 km/h); (b) a one-lane flush mid-block narrowing on Stratford Street, Christchurch, New Zealand (speed limit: 50 km/h). Source: Google Earth Pro 7.3.7.1155.
Similar studies resulting in speed profile models are described in [60,63,71,72]. Do Duy and Hisashi [71] also demonstrated relationships between speed and several contextual factors characterising urban streets, which should be considered by urban planners and traffic calming designers. Although their models achieved high coefficients of determination, the explanatory variables differed significantly from those used in Schepers et al. [60] and Barbosa et al. [76]. This indicates that developing a universal model describing speed variation along street sections is a highly complex issue, interpreted differently across studies. Moreover, the use of complex data-driven modelling frameworks, heavily dependent on advanced software capabilities, limits their practical applicability in traffic calming design.
Mao et al. [53] and Daniel et al. [77] conducted similar studies. Daniel et al. [77] examined the influence of various TCMs (including speed tables, speed humps, angled slow points, and mid-block narrowings—raised or flush) on free-flow speed across seventeen study sections on two-way residential streets in Christchurch, New Zealand, with speed limits of 40 km/h and 50 km/h (Figure 1b). Street widths ranged from 8.0 m to 13.5 m. All study sites were characterised by low-density residential frontage, wide sidewalks, and large front gardens with driveways. Based on their results, they were the first to define the concept of the zone of influence of a TCM on free-flow speed [77] (p. 5, Figure 1). One of their key findings [77] (p. 11, Figure 3) was that mid-block narrowings were relatively ineffective on 50 km/h roads compared with speed humps, speed tables, and angled slow points. All study locations in [53,70,77] were through streets with on-street parking on both sides.
According to [60,76,77,78], the most commonly used traffic-calming measures in 30 km/h zones include speed tables, speed humps, raised junctions, and chicanes. Among these, vertical deflection measures are historically the most widespread. Mid-block narrowings (MBNs) represent a link between speed tables and lateral narrowing treatments and can be applied on both one-way and two-way streets. The effects of raised and flush MBNs on Δv85 were analysed by Daniels et al. [77] in several locations in Christchurch, New Zealand. Majer and Sołowczuk [28] and Sołowczuk [79] investigated the impact of raised mid-block narrowings on speed reduction (Δv85) under different hourly traffic volumes in 30 km/h zones in three study areas in the city centre of Szczecin, Poland.
The literature review indicates that there is still a lack of a comparative framework for designers of 30 km/h zones on short urban street section in city centres that would support informed design decisions regarding expected speed reductions (Δv85) achieved by mid-block narrowings under different entrance and exit junction configurations. The analysis of previous studies shows that, for traffic calming design, it is important not only to consider suggested Δv85 reductions and recommended spacing between TCMs, but also street type (arterial, secondary, collector, residential), its functional importance (reflected in traffic volume and number of lanes), and the location of the 30 km/h zone (suburban or city centre). The arbitrary placement of TCMs along a street may lead to unsatisfactory outcomes, such as:
- A purely local reduction in speed (Δv85), which may be insufficient to meaningfully alter free-flow speed (v85) along the street;
- Higher free-flow speeds (v85) along the street exceeding the applicable speed limit.
A more appropriate approach is therefore to treat the street section as a whole rather than as a sequence of isolated TCMs. This principle is consistent with the fundamental definition of traffic calming formulated in 1996 at an international congress by representatives from 44 countries [80]. Accordingly, in order to achieve the intended design objective of a limited-speed street, traffic calming designers should have access to a comparative framework describing the effects of different TCMs on speed profiles along urban street segments. This framework should incorporate both general design guidelines and documented empirical findings from various studies conducted under different contextual conditions.
Many researchers have investigated the selection of appropriate traffic-calming measures (TCMs) for 30 km/h zones, particularly in suburban residential areas [53,60,63,70,76,77]. However, little attention has been paid to the effectiveness of TCMs, especially mid-block narrowings (MBNs), on narrow streets in European city centre characterised by a dense, continuous urban fabric and frequent accesses to internal courtyards.
This type of urban fabric is typical and characteristic of the centres of many European cities. The development of the present-day city centre of Szczecin began in the late nineteenth century following the abolition of the city’s fortress status in 1873 [81,82,83], when the former fortress—an integral part of the fortification system of the German Empire due to Szczecin’s strategic location—ceased to constrain urban expansion [81,84]. The new urban district was developed according to the master plan prepared by the German urban planner James Hobrecht [82]. It consisted of rectangular urban blocks with multi-family residential buildings inspired by contemporary English urban planning and architectural concepts [82]. At the same time, the irregular street network, incorporating a system of squares of various shapes connected by radial streets, was influenced by the urban layouts of Paris and Berlin [82,85,86].
The streets in this district are characterised by continuous Art Nouveau frontage development, which precludes the implementation of horizontal deflection measures. These urban conditions differ fundamentally from those found in suburban single-family housing areas or modern residential estates with wide streets and detached apartment buildings, where a broad range of traffic-calming measures can be implemented. Consequently, evaluating the effectiveness of traffic-calming measures, particularly mid-block narrowings, under the spatial constraints of historic European city centres represents an important research gap. The limited application of traffic-calming measures in these street layouts, particularly mid-block narrowings (MBNs), despite their demonstrated effectiveness, represents a research gap that this study seeks to address.
The main objective of this study was not only to evaluate the speed-related effectiveness of mid-block narrowings by estimating their operating speed and zone of influence, but also to identify the contextual factors determining vehicle speed profiles between junctions through analyses conducted along representative 30 km/h street sections located in the city centre of Szczecin, Poland. The outcome of these analyses was the development of the above-mentioned comparative framework for assessing the speed-related effectiveness of mid-block narrowings under specific contextual conditions. This framework provides practical support for the sustainable planning and redesign of city-centre street networks and may assist in comparing alternative traffic-calming solutions and supporting planning decisions. The following research questions were formulated:
- ①
- Does the operating speed of a mid-block narrowing depend on its distance from the entrance junction (d)?
- ②
- Does the operating speed of a mid-block narrowing depend on hourly traffic volume (Ni)?
- ③
- Does the entry speed into a 30 km/h zone depend on the type of entrance junction and the associated traffic arrangement?
- ④
- Does the exit speed from a 30 km/h zone depend on the type of exit junction and the associated traffic arrangement?
- ⑤
- Which street environment features are associated with lower vehicle speeds along the analysed streets?
The article is structured as follows. The introduction presents a literature review of studies analysing the effects of traffic calming devices, with particular emphasis on speed tables and mid-block narrowings. This is followed by the methodology used in the study. Section 3 presents the results together with data analysis, Section 4 discusses the findings, and Section 5 provides validation. Finally, conclusions and recommendations for further research are presented.
2. Traffic-Calming Measure and Research Methods
2.1. Criteria for the Selection of Study Areas
The following research assumptions were adopted when selecting the study areas, which should:
- −
- Be located on residential streets in the city centre, with multi-storey residential buildings forming a continuous urban frontage, narrow streets with on-street parking lanes, low pedestrian cross-traffic, and similar street landscaping;
- −
- Represent a distinctive residential urban fabric, substantially different from the low-density detached housing typical of suburban areas and from modern residential estates with freestanding multi-storey buildings or high-rise apartment blocks separated by extensive green spaces;
- −
- Be situated on relatively flat terrain, with only minor differences in elevation;
- −
- Be characterised by high on-street parking demand and numerous vehicle access points to internal courtyards;
- −
- Differ in junction spacing (distance between adjacent junctions);
- −
- Differ slightly in hourly traffic volume, while referring to streets with a daily traffic volume of up to 1500 Veh/24 h;
- −
- Differ in the type of entrance and exit junctions and the applied traffic arrangement at these locations;
- −
- Include mid-block narrowing applied either as one-lane or two-lane configurations.
Since the primary objective of the study was to assess the impact of MBNs on vehicle speed, the selected street sections should exhibit a high level of traffic safety. This ensures a reliable and robust evaluation of the effect of MBNs on speed along the study streets, without introducing factors related to crash occurrence or severity. Therefore, only those street sections should be selected where no crashes have been recorded during the three years preceding and the three years following the introduction of the 30 km/h zone.
Furthermore, considering the basic criteria typically adopted in traffic calming studies, the analyses in this paper were limited to free-flow speed (v85).
2.2. Selected Study Areas and Traffic-Calming Measures
The study was conducted in 30 km/h zones located in the city centre of Szczecin, Poland (Figure 2). The selected street network is characterised by continuous and dense 19th-century perimeter-block development (frontage development) [82,83,85,86]. The streets are narrow and include on-street parking on both sides, with a combination of parallel and perpendicular parking layouts. The study area is surrounded by major collector and arterial roads. In contrast to the suburban street environments analysed in previous studies, the present research focuses on a dense inner-city street network with 19th-century perimeter-block development. The streets selected for the study were reconstructed into 30 km/h zones in two stages, as part of a comprehensive urban street redesign associated with the implementation of paid parking schemes (Appendix A—Figure A1). During the first stage (2017–2019), Study Areas 1–3 were reconstructed. The second stage, carried out between 2020 and 2022, included the reconstruction of Study Areas 4–8 [87]. Prior to reconstruction, vehicles were commonly parked partially on the footways, obstructing pedestrian movement and limiting access to nearby shops, boutiques, and other local businesses. As a result, two-way traffic on the remaining carriageway was heavily constrained by parked vehicles (Appendix B—Figure A2).
Figure 2.
Selected study areas: (a) location of Szczecin and the study street layout in the city centre; (b) selected study areas before the traffic arrangement change (2020). Source: author’s study. Designation: Areas 1–3—pre-change traffic arrangement; Areas 1*–3*—post-change traffic arrangement; Areas 4–8—selected for validation. The intervention involved a one-way direction change in Study Area 2 only.
The implementation of paid parking schemes primarily requires the systematic organisation and formal designation of parking spaces. Addressing urban transport problems, including parking-related issues, relies on comprehensive traffic management measures, such as the designation of through routes, the implementation of traffic-calming zones, and, in particular, the introduction of paid parking schemes [88,89,90,91]. Paid parking schemes are typically introduced in street networks characterised by a shortage of parking spaces to increase parking turnover. This approach is also dictated by legal and operational requirements, as parking fees may only be charged for formally designated parking spaces marked by both horizontal and vertical traffic signs. Consequently, the successful implementation of a paid parking scheme requires the coordinated integration of traffic-calming measures, carefully planned parking layouts, and a comprehensive strategy for improving pedestrian and cycling conditions [88,89,90,91].
In accordance with the research assumptions, road safety conditions were analysed in Study Areas 1–3 for the pre-reconstruction period (2012–2015) and the post-reconstruction period (2020–2022). For Section 1, Section 2 and Section 3, the analysis covered the pre-reconstruction period (2012–2015) and the post-implementation period following changes in traffic organisation (2021–2024). For Study Areas 4–8, the pre-reconstruction period (2012–2015) was compared with the post-reconstruction period (2023–2025). The criterion for selecting the study sections was based on data obtained from the Polish Traffic Accident and Collision Record System (SEWiK), maintained by the General Police Headquarters [92].
All entrance and exit junctions as well as intermediate junctions were raised. All approaches at junctions (except Study Area 5) were narrowed to one lane. Three study areas involved one-way streets and access from a signalised intersection with a major collector street (Figure 2b—Study Areas 1, 1*) and from an arterial road (Figure 2b—Study Area 6). Two access points were from a dual carriageway arterial road with a central reservation containing tram tracks. One access point was from a three-leg junction (Figure 2b—Study Area 2), and another from a four-leg junction (Figure 2b—Study Areas 5 (W–E)).
Study Areas 2*, 5(E–W) and 8 began at an intermediate junction and ended at a junction with a dual carriageway arterial road. The remaining selected study areas started and ended at intermediate junctions within the 30 km/h zone (Figure 2b—Study Areas 4 and 7). Intermediate junctions were defined as minor junctions located within the analysed 30 km/h zone.
Initially, the intermediate junction between Study Areas 1–4 operated under a different traffic arrangement (Figure 2b and Appendix C—Figure A3a), which resulted in persistent vehicle queueing on the minor approach at the exit junction in Study Area 3 [28,79]. Consequently, after several months of operation, the traffic arrangement was modified, as shown in Appendix C—Figure A3b. The revised arrangement was implemented solely through changes to mandatory directional signing, without any geometric modifications to the junction. The change appeared to redistribute traffic movements and reduce queueing in Study Area 3, based on field observations conducted during the study period. However, these observations also indicated an increase in vehicle speeds, which became one of the main motivations for undertaking the present study.
Therefore, traffic measurements in Study Areas 1–3 were conducted twice under two different traffic arrangements and labelled as 1*–3*. Study Areas 1–3 were selected for developing speed profile models and are marked in green in Figure 2b. The remaining Study Areas 4–8 were used to validate the obtained speed profile models (Figure 2b—red). Additionally, Figure 2b shows a collector street within the 30 km/h zone, whose traffic arrangement significantly influenced egress from Study Area 3 and indirectly affected exits from Study Areas 1, 1*, 2, 2*, and 4 (Figure 2b—blue). Red arrows in Figure 2b indicate traffic direction.
Daily traffic volumes on the analysed streets ranged from 500 Veh/24 h to 1500 Veh/24 h. Hourly traffic volumes on the analysed streets were up to 30 vehicles per hour at night and ranged from 30 Veh/h to more than 100 Veh/h during the day, depending on the location and traffic arrangement.
All analysed study areas included raised mid-block narrowings together with pedestrian crossings (Figure 3). To ensure uniformity of the analysis, all mid-block narrowings had identical geometric parameters: width of 3 m, length of 10 m, height of 14 cm, and were located at the midpoint of each street section. The surface of the narrowings included protective bollards, pedestrian crossings, concrete planters with shrubs/trees, and benches (Figure 3).
Figure 3.
Raised mid-block narrowings: (a) one-way street section in Study Area 1, bollards followed by a concrete planter; (b) one-way street section in Study Area 3, a concrete planter followed by bollards. Source: photos by the authors.
The selected street sections differed in junction spacing, types of junctions and their traffic arrangement, as well as in the location of parking spaces on both sides of the street.
2.3. Assumptions for Free-Flow Speed Measurements
Since traffic calming analyses primarily consider the 85th percentile of free-flow speed v85, only free-flow conditions were adopted in accordance with the Highway Capacity Manual (HCM) [93]. In such conditions, there is no interaction between vehicles, and speed is influenced only by the analysed traffic-calming measure (TCM), rather than by the lead vehicle. Taking the above into account, the time headway between successive measurements should be greater than 7 s, in line with [93]. This means that on a given road section there should be no preceding vehicle within the following distances from the measured vehicle:
- −
- Up to 10 km/h: within 20 m of the measured vehicle;
- −
- From 10 km/h to 20 km/h: within 40 m of the measured vehicle;
- −
- From 20 km/h to 30 km/h: within 58 m.
The above assumptions concern speed in particular, as it is the parameter that best defines drivers’ behaviour. Considering that the results of this study are intended to provide designers with a comparative framework for the application of mid-block narrowing in 30 km/h zones, it was justified to analyse free-flow speed, i.e., behaviour in situations where drivers have full control over decisions regarding their driving style, without pressure from other vehicles.
All field measurements were conducted under good weather conditions in order to avoid variations in drivers’ behaviour caused by different weather conditions.
2.4. Data Collection System
Taking the above assumptions into account, speed measurements were carried out using synchronised SR4 devices with automatic speed and traffic volume detection. The devices also recorded the date, time of measurement with an accuracy of 0.01 s, time headway between consecutive vehicles, and vehicle category.
The devices were installed at nine measurement points along each study area (Figure 4). Each study area is defined as a homogeneous road segment between two consecutive intersections, representing a consistent traffic environment along a single street corridor. A similar measurement system was used in [33,34,70,76,77]. However, unlike those studies, the study areas presented in this paper were significantly shorter (junction spacing ranged from 100 to 180 m), and therefore only nine measurement points were adopted, located at characteristic locations (Figure 4).
Figure 4.
Layout of nine SR4 sensors in a sample study area. Source: own study.
Considering urban traffic conditions in the city centre, traffic data were collected continuously for three consecutive days, providing robust temporal coverage of traffic conditions. All devices within a given study area were activated simultaneously to ensure time synchronisation of measurements. Before each measurement campaign, the internal clocks of all sensors were synchronised using the mobile application. Measurements in Study Areas 1–3 were carried out in 2020, while those in Study Areas 1*–3* and 4–8 were conducted in 2026. Although the measurements were conducted in two different years, the study focused on relative changes in speed profiles associated with traffic arrangement and contextual factors rather than on temporal trends in driver behaviour. Consequently, the analyses were based on comparative relationships between speed profiles under different contextual conditions rather than on direct comparisons of absolute speed values between years. The devices did not record vehicle registration plates; therefore, they did not track the same vehicle across different measurement points at the same time. This was due, among other reasons, to the fact that a vehicle measured at one sensor could have parked in the meantime, or that a vehicle recorded at the entry to a study area was not necessarily the same vehicle exiting it at the same time.
In total, the measurements covered between 60 and 75 h of observation. Thanks to the software used in the devices and precise time stamping of each measurement, only free-flow traffic could be selected. The analysis of the obtained data allowed the classification of speed results under hourly traffic volumes ranging from approximately 3–5 Veh/h to 100 Veh/h.
Considering the location of the study areas in the city centre and the high fluctuation of vehicles parking or leaving parking spaces, special procedures were applied using the capabilities of the SR4 device software. These procedures were introduced after a detailed analysis of preliminary speed measurements of vehicles parking and departing from parking spaces, synchronised with video recordings. Based on the analysis of traffic conditions related to parking behaviour in the preliminary measurements, it was determined that speeds below 8 km/h could be excluded from the final dataset used in further analyses.
2.5. Data Selection and Speed Estimation
The obtained datasets required additional assumptions regarding the analysis of free-flow speed v85 across different ranges of hourly traffic volume (Ni). In order to determine the operating speed of a given mid-block narrowing, as defined by Brindle [70] and Daniel et al. [77], the analysis adopted an initial classification of results into several hourly traffic volume categories under free-flow conditions: at night, up to 10 V/h, 10–20 V/h, and 20–30 V/h, and during the day, into two ranges varying in 10 V/h increments: 30–70 V/h and 70–100 V/h (Appendix D—Table A1 and Figure A3). The unit V/h (vehicles per hour) refers to the number of individual free-flow speed observations recorded within one hour and is used throughout the manuscript as a short notation for hourly free-flow traffic volume.
Although the number of observations differed between daytime and nighttime due to natural variations in traffic demand, this did not affect the estimation of v85 because only free-flow vehicles were included, and the sample sizes in all analysed groups were sufficient for reliable 85% percentile free-flow speed estimation.
Considering the very large and highly heterogeneous datasets of individual speed observations collected over three days (from 300 measurements at night and up to 1900 during the day), a statistically validated special procedure for estimating v85 had to be applied. An example of the dispersion of nighttime data in Study Area 1, along with the v85 estimation procedure used in further analyses, is presented in Appendix D—Figure A4. Several observations with hourly traffic volumes exceeding 100 V/h were excluded due to vehicle queuing occurring under such conditions, particularly on the section between the mid-block narrowing and the exit junction. Figure 5 presents a step-by-step scheme of the applied analytical methodology.
Figure 5.
Step-by-step scheme of the applied analytical methodology. Source: own study.
First, all analysed speed populations were subjected to standard statistical analyses. In total, for each measurement point and for each hourly observation period, Kolmogorov–Smirnov goodness-of-fit tests (Equation (1)) were conducted to verify whether a given population followed a normal distribution (Appendix D).
where F(v)—empirical cumulative frequency curve; F0(v)—theoretical cumulative frequency curve; λ—Kolmogorov–Smirnov Goodness-of-fit test; D—maximum absolute value; n—number of results; λα—critical values; α—adopted significance level.
Null Hypothesis—H0: F(v) = F0(v) and Alternative Hypothesis—H1: F(v) ≠ F0(v), λα = 1.36, α = 0.05
If λ < λα, then the population of speeds follows a normal distribution.
| (1) |
Subsequently, statistical analyses were performed to assess the possibility of combining the data into three datasets: nighttime results up to 30 V/h, and daytime results of 30–70 V/h and 70–100 V/h, using the two-sample Kolmogorov–Smirnov test (Equation (2)), the significance test for two means (Equation (3)), and the two-variance test (Equation (4)). All three tests were performed in accordance with established traffic engineering and statistical analysis procedures to provide robust confirmation of the validity of the proposed hourly traffic volume classification adopted for the subsequent analyses. Example results of these statistical tests are summarised in Appendix D.
where F(vi)—speed cumulative distribution function for hourly traffic volume i; F(vi+1)—speed cumulative distribution function for hourly traffic volume i + 1; λ—Two-sample Kolmogorov–Smirnov test; D*—maximum absolute value; n—number of results; ni—number of results for hourly traffic volume i; ni+1 —number of results for hourly traffic volume i + 1; λα—critical values; α—adopted significance level.
where μi—average speed for hourly traffic volume i; μi+1—average speed for hourly traffic volume i + 1; u—significance test for two means; si—standard deviation for hourly traffic volume i; si+1—standard deviation for hourly traffic volume i + 1; ni—number of results for hourly traffic volume i; ni+1—number of results for hourly traffic volume i + 1; uα—critical values; α—adopted significance level.
where si—standard deviation for hourly traffic volume i; si+1—standard deviation for hourly traffic volume i + 1; F—two-variance test; Fα—critical values; α—adopted significance level.
Null Hypothesis—H0: F(vi) = F(vi+1); and Alternative Hypothesis—H1: F(vi) ≠ F(vi+1), λα = 1.36, α = 0.05
If λ ≥ λα, it means that these are two different speed populations.
| (2) |
Null Hypothesis—H0: μi = μi+1; and Alternative Hypothesis—H1: μi ≠ μi+1, uα = 1.96, α = 0.05
| (3) |
Null Hypothesis—H0: si = si+1; and Alternative Hypothesis—H1: si > si+1, Fα, at α = 0.05
Test: F = si 2/si+12
If F > Fα, it means that the variances in both populations are different.
| (4) |
Based on the positive outcomes of the preliminary analyses (Appendix D), the v85 values were further analysed within three hourly free-flow traffic volume categories: up to 30 V/h, 30–70 V/h, and 70–100 V/h (hereafter referred to in figures and tables as night, day*, and day**). These categories covered on average 17–25 h of nighttime observations and approximately 30–40 h of daytime observations. The 85th percentile of speed in nighttime conditions included from 130 to 300 individual free-flow speed observations, while daytime conditions included from 1000 to over 1900 individual free-flow speed observations.
In this paper, the development of speed profiles was based on the studies [53,63,70,76,77]. The definitions of individual parameters in the speed profile presented in Figure 6 were adopted in accordance with those introduced by Brindle [70].
Figure 6.
Predicted speed profile models and associated research questions ①–⑤. Source: own study.
The symbols of the analysed research questions ①–⑤ (see Figure 6) were linked to families of speed profiles, which depended on various considered factors (e.g., the type of junction and the traffic arrangement at these locations, the distance of the measurement point from the entry to a given study area (l), the distance of the measurement point from the axis of the mid-block narrowing on the approach to it or departure from it (d), as well as the three adopted ranges of hourly traffic volume (Ni).
Figure 6 illustrates the characteristic deflection of the speed profile at the location of a TCM, in this case a mid-block narrowing. Differences in how this phenomenon is described can be found in numerous studies by other researchers. For example, Zito and Taylor [63] and Brindle [70] described the V-shaped deflection of the speed profile as symmetrical on both sides of the TCM, i.e., they assumed that the speeds before and after the V-shaped deflection were equal. In contrast, Barbosa et al. [76] and Daniel et al. [77] showed that these speeds are not necessarily equal, and that the speed downstream of the TCM may be higher, equal to, or lower than the speed observed before the deflection. Figure 6 presents the V-shaped speed profile deflection with a lower downstream speed after the MBN, as street sections with lengths of 100–180 m were analysed. In addition, the figure also shows the basic parameters of this deflection as defined by Brindle [70] and Daniel et al. [77].
With respect to research question ⑤, the potential influence of parking orientation (parallel or perpendicular) on speed v85 was also analysed. Additionally, the influence of the sequence of elements on the approach to the mid-block narrowing was considered, including protective bollards, pedestrian crossings, and concrete planters located on the surface of the mid-block narrowing, assessed on the approach to the narrowing. This additional sequence factor may significantly influence driver perception by more or less restrictively reducing forward visibility and contributing to possible vehicle trajectories through the mid-block narrowing.
3. Results and Data Analysis
The selected streets were redeveloped primarily to introduce paid parking zones, as parking availability was the main issue reported by local residents and owners of boutiques, shops, and other businesses (Appendix B—Figure A2). Considering the above, this paper evaluates the effectiveness of mid-block narrowings through a detailed analysis of vehicle speed profiles and the contextual factors affecting driver behaviour, following analytical approaches similar to those presented in [70,76,77].
The data analysis revealed that the obtained speed profiles were also strongly influenced by the types of entrance and exit junctions. These observations are consistent with the findings of Barbosa et al. [76]; however, they indicate that a single target entry speed should not be pursued, as it depends on both the type of entrance junction and the hourly traffic volume.
The speed profiles were complex functions, primarily dependent on:
- −
- Entry speed;
- −
- Type of entrance junction;
- −
- Traffic arrangement at the entrance and exit junctions;
- −
- Time of measurement (daytime or nighttime);
- −
- Junction spacing;
- −
- Distance of the measurement point from the axis of the mid-block narrowing, and
- −
- Type of exit junction.
As mentioned earlier, the traffic arrangement was modified during the study period (Appendix C—Figure A3), which significantly affected the resulting speed profiles. Therefore, a total of six study areas were used for the speed-profile analyses, as Study Areas 1, 2, and 3 were analysed twice (see designations in Figure 2b). The remaining five Study Areas (4–8) were used to validate the obtained speed profiles. All measured and estimated values of entry speeds, operating speeds, speed differences, and the zone of influence for the selected study areas are presented in Appendix E (Table A2).
3.1. Study Areas 1 and 1*: Access from Signalised Junction (Before and After Traffic Arrangement Changes
Considering that the developed speed profiles primarily concerned one-way streets, the analyses focused on drivers’ behaviour when they had full control over their driving style, without being pressured by other vehicles. However, on short street sections in the city centre, within a 30 km/h zone with numerous parking spaces, speed profiles are also affected by pedestrian movements and by vehicles parking or leaving parking spaces.
Therefore, speeds measured at night were used to determine the operating speeds associated with the mid-block narrowing (Figure 7). However, this value was not assumed a priori as the final value for estimating speed differences, as drivers tend to behave differently at night than during the day, even under similar hourly traffic volumes. Daytime measurements were used primarily to assess the influence of entrance and exit junction types on vehicle speeds.
Figure 7.
Speed profile: (a) in Study Area 1 (before the traffic arrangement change) with the original traffic arrangement at the exit junction; (b) in Study Area 1* (after the traffic arrangement change) with the modified traffic arrangement at the exit junction. Source: own work.
The speed difference was approximately 8–10 km/h, while the length of the zone of influence was approximately 25 m (Figure 7a). The daytime entry speed was approximately 26–28 km/h; whereas, the exit speed was approximately 23–25 km/h (Figure 7a). Departure speeds towards the intermediate junction varied and depended on traffic conditions on the remaining approaches as well as on pedestrian activity.
The speed profile also differed for the same street section before and after the traffic organisation was modified at the exit junction. Before the modification, a gradual reduction in speed with a characteristic V-shaped deflection of the speed profile (2–3 km/h) was observed, but only during the nighttime period. During the daytime, only minimal deflections of the speed profiles were recorded, and the speeds at the end of the section varied. In contrast, after the traffic signs at the exit junction had been modified (Figure 7b—Study Area 1*), no V-shaped deflection of the speed profile was observed.
The traffic arrangement change at the exit junction resulted in different speed profiles (Figure 7b). Entry speeds and operating speeds were higher; whereas, speed differences were substantially reduced. A particularly pronounced difference in the speed profiles was observed downstream of the mid-block narrowing. Departure speeds towards the intermediate junction were considerably lower.
This indicates that on short street sections of up to 100 m, departure speeds are influenced more strongly by the traffic arrangement at the exit junction than by the mid-block narrowing itself. This is because drivers must decide on their subsequent direction of travel after observing the C-8 road sign (“turn left or right”), while also taking into account the corresponding restriction on the opposite approach (Figure 7b). Under the previous traffic arrangement (Figure 7a), drivers had no such choice because the C-2 road sign (“turn right only”) prevented any alternative manoeuvre.
Based on the above findings, it can be concluded that, when implementing traffic-calming measures in 30 km/h zones, mid-block narrowings may be planned in conjunction with traffic arrangements at intermediate junctions that impose different route-direction requirements.
3.2. Study Area 2*: Access from a Three-Arm Junction on a Dual Carriageway Arterial Road (Before Traffic Arrangement Changes)
The speed difference in Study Area 2 was only approximately 4 km/h, while the length of the zone of influence was approximately 30 m (Figure 8). The daytime entry speed was approximately 30–32 km/h; whereas, the exit speed was approximately 22 km/h. In the vicinity of the side gate to the school grounds (i.e., from −20 m to +15 m), speeds were approximately 22–26 km/h.
Figure 8.
Speed profile in Study Area 2 (before the traffic arrangement change). Source: own work.
A characteristic symmetrical V-shaped deflection of the speed profile was also observed during both the nighttime and daytime periods. In Study Area 2, the speed difference was similar to that observed in Study Area 1. However, after the mid-block narrowing, speeds were more stable and lower than those recorded in Study Area 1. This may have been related to the perpendicular parking spaces located along the right-hand side of the street.
3.3. Study Area 2*: Access from an Intermediate Junction Within a 30 km/h Zone (After Traffic Arrangement Changes)
Following the traffic arrangement change and the reversal of the traffic direction in Study Area 2*, markedly different speed profiles were obtained. Both entry and exit speeds were substantially lower than those observed in Study Area 2; whereas, speeds both before and after of the mid-block narrowing were considerably higher (Figure 9).
Figure 9.
Speed profile in Study Area 2* (after the traffic arrangement change). Source: own work.
The deflection of the speed profile was symmetrical on both sides of the mid-block narrowing only during the nighttime period and asymmetrical during the daytime. A major difference between Study Areas 2 and 2* was the considerably higher vehicle speeds observed in Study Area 2*. As a result, the operating speed at the same mid-block narrowing increased from 22 km/h in Study Area 2 to 28 km/h in Study Area 2* (Figure 8). The daytime and nighttime speed profiles also differed from those observed in Study Area 2. In contrast, speed differences in the vicinity of the mid-block narrowing were approximately twice as large (Figure 9).
Analysis of the obtained results indicates that vehicle speeds in a 30 km/h zone on one-way streets, particularly operating speeds, depend on the length of the street section, the types of entrance and exit junctions, and the traffic arrangement at those junctions. The higher speeds observed in Study Area 2* were probably associated with the parallel parking spaces located along the right-hand side in the direction of travel.
3.4. Study Areas 3 and 3*: Access from an Intermediate Junction Within a 30 km/h Zone (Before and After Traffic Arrangement Changes)
In Study Area 3, speed differences were approximately 8–10 km/h, while the length of the zone of influence was approximately 20 m (Figure 10a). Entry speeds were approximately 26–29 km/h; whereas, exit speeds were approximately 21–24 km/h. A characteristic feature in this case was the substantial increase in speed along the approach section leading to the mid-block narrowing. This was probably related to the longer approach distance, the different surrounding land-use characteristics along this street section, and the considerably lower turnover of parked vehicles along the approach. In both Study Areas 3 and 3*, a very distinct V-shaped deflection of the speed profiles was observed, confirming the positive effect of the implemented mid-block narrowing. However, this effect was limited to a relatively short section of the street, extending only from approximately −13 m upstream to +30 m downstream of the traffic-calming measure. Departure speeds towards the minor approach of the junction with the two-way collector street varied and depended on traffic conditions on the collector street, as well as on the high volume of pedestrian traffic at the exit junction. In Study Area 3, the speed difference was substantially greater than that observed in Study Area 2, which was probably associated with the different surrounding land-use characteristics and the lower turnover of parked vehicles. Following the traffic arrangement change, similar but less variable speed profiles were obtained (Figure 10b). Analysis of the speed profiles indicates that, on a longer street section, the mid-block narrowing effectively reduces speeds, but only in its immediate vicinity. The entrance and exit junctions had a greater influence on vehicle speeds.
Figure 10.
Speed profile: (a) in Study Area 3 (before the traffic arrangement change); (b) in Study Area 3* (after the traffic arrangement change). Source: own work.
Based on the above findings, similarly to the previous subsection, it can be concluded that, when implementing traffic-calming measures in 30 km/h zones, mid-block narrowings may be planned while simultaneously considering the traffic arrangement at both junctions. The presented speed-profile models confirm previous general findings reported in the literature [45,60,66,75], indicating that drivers frequently exceed the posted speed limit in 30 km/h zones.
4. Discussion
4.1. Comparison with and Extension of the Mid-Block Narrowing Speed Profile Models of Daniel et al.
In order to address research questions ① and ②, it was necessary to analyse both the influence of the distance of the measurement point from the mid-block narrowing on speed difference and operating speed, as well as hourly traffic volume. A similar analytical approach was presented by Daniel et al. [77]; however, their study concerned residential streets with speed limits of 40 km/h and 50 km/h, located in suburban areas. They demonstrated a very limited effectiveness of mid-block narrowings on such streets.
The present analyses extend their work primarily by incorporating the urban and functional context of streets within a 30 km/h zone located in the city centre. In addition, the study includes a broader set of contextual variables, i.e., junction spacing, types of entrance and exit junctions together with their traffic arrangements, as well as different configurations of on-street parking on both sides of the street. The results of this study indicate that mid-block narrowings in 30 km/h zones are effective (see Section 3).
Given that a rapid assessment of the effectiveness of traffic-calming measures (TCMs), based on evidence from multiple studies or design guidelines, should form the basis for selecting appropriate measures in 30 km/h zones, this study proposes an extension of the speed difference models developed by Daniel et al. [77] with analogous relationships presented in Figure 11. Figure 11 provides a practical comparative tool for the design process, supplemented with essential contextual data describing different street sections and enriched with photographs facilitating the interpretation and comparison of various urban form configurations. With regard to the obtained relationships between speed differences and distance from the mid-block narrowing within the 30 km/h zone, regression analyses were performed, yielding high correlation coefficients (Table 1). The data presented in Figure 11 show Δv85 achieved between characteristic points and the mid-block narrowing within the influence zone, representing the difference in speed Δv85 between a point within the influence zone and the mid-block narrowing. The origin of the relationship corresponds to the mid-block narrowing axis (Figure 11—abscissa equal to 0 m). The end of the relationship corresponds to the point (Figure 11—abscissa equal to −di), where the zone of influence begins, i.e., the point at which drivers start to reduce their speed. To ensure clarity given the large volume of data, Figure 11 presents selected results for low night-time traffic volumes (up to 30 V/h) and daytime traffic volumes of 30–70 V/h only.
Figure 11.
Relationships between speed differences and distance from a mid-block narrowing. Source: own study based on data presented in Daniel et al. (2011) [77].
Table 1.
Correlation coefficients (R) between speed differences and distance from the mid-block narrowing axis in study areas located within 30 km/h zones. Source: own study.
Additionally, for comparison of different urban form configurations of study areas analysed by Daniel et al. [77] and those examined in the present study, the upper part of Figure 11 presents three photographs of Study Areas 1–3 within a 30 km/h zone before traffic arrangement changes. The lower part shows three photographs of study areas considered in Daniel et al. [77], located on wide residential streets with a 50 km/h speed limit and low-density detached suburban housing in Christchurch, New Zealand. The compared study areas differ not only in speed limit but also, and more importantly, in the surrounding urban context and other contextual variables. In all cases, high correlation coefficients were obtained, both for the study areas of Daniel et al. [77] and for those analysed in the present study.
Since the analysed relationships vary considerably and depend on additional parameters characterising the surrounding street environment, regression equations showing only dependence on distance (d) were not included in Figure 11. The substantial differences in the observed relationships arise not only from variations in the length of the zone of influence, but also from differences in the surrounding land use and street environment.
Study Area 1 is the shortest and is located on a street with numerous shops, boutiques, and small public facilities, resulting in increased pedestrian activity and high parking turnover. Consequently, the zone of influence effectively begins at the signalised junction providing access to the area.
In Study Area 2, along the approach to the mid-block narrowing, there are also shops, boutiques, and a school. The entry to Study Area 2 is from a junction connected to a dual carriageway arterial road with a 50 km/h speed limit, one of the main city arterials. Therefore, entry speeds were higher (approximately 33 km/h). In addition, delivery vehicles were frequently parked in front of shops. These factors collectively resulted in a considerably longer zone of influence and a markedly different speed profile (see Figure 8).
In Study Area 3, despite a similar approach length to Study Area 2, the speed profile was fundamentally different and the zone of influence was significantly shorter (see Figure 10). These differences result from the fact that access to Study Area 3 is via intermediate junctions, and the street is bordered on both sides only by mid-rise residential buildings. There are no shops or driveway accesses to internal courtyards. Therefore, from the moment of entry into Study Area 3, an increase in speed was observed (see Figure 10), and the zone of influence was more than twice as short.
These findings were also confirmed in the validation of other study areas considered (see Section 5).
In summary, the answers to research questions ① and ② are affirmative: operating speed at the mid-block narrowing depends on entry speed, the type of entrance junction, the length of the street section, and hourly traffic volume.
Taking this into account may have limited applicability across different urban contexts, as proposed by other researchers [60,63,68,69,70,71,76,77], since such a model would be inherently dependent on factors specific to individual street sections (i.e., street length, type of entrance junction and its traffic arrangement, and hourly traffic volume). These factors may therefore differ from those observed in street sections studied by other authors.
However, the analysis presented in Figure 11 demonstrates the effectiveness of mid-block narrowings in 30 km/h zones located in city centres. The analysed mid-block narrowings contributed to speed reductions ranging from 5 km/h to 10 km/h, which is significantly greater than that reported by Daniel et al. [77]. Although the present study focuses on the effectiveness of mid-block narrowings rather than on the design spacing between traffic calming devices, the obtained results may also be interpreted in the context of previous spacing recommendations for other TCMs. Pérez-Acebo et al. [94] demonstrated that the effectiveness of successive vertical deflections depends strongly on the spacing between devices, while Yeo et al. [95] recommended a maximum spacing of approximately 70 m between consecutive speed humps to maintain operating speeds close to 30 km/h. Although vertical deflections and mid-block narrowings operate through different physical mechanisms, both studies confirm that the spacing between successive traffic-calming measures is one of the key factors affecting operating speed and speed consistency along urban street sections.
4.2. Speed Differences Considering Entrance Junction Type and Traffic Arrangement
In order to address research question ③, further analyses were conducted on speed changes along street sections equipped with mid-block narrowings under different types of entrance junctions. However, speed changes depended not only on the length of the analysed street section (l) and the type of entrance junctions, but also on the applied traffic arrangement and the surrounding street environment. In all cases, the geometric and vertical parameters of the mid-block narrowings were identical (Section 2.2).
In the case of a short street section with entry from a signalised junction and a high density of shops, boutiques, and service facilities, lower speeds were recorded before the change in traffic arrangement (Figure 12). For this purpose, appropriate junction schemes are presented in Figure 12. The observed speed changes were related to modifications in available route choices. Before the change in traffic arrangement, the driver was required to follow traffic sign C-2 (“right turn only”), which resulted in lower speeds, as the driver also had to account for traffic conditions on the two remaining approaches. After the change in traffic arrangement, the driver had a choice of travel direction (traffic sign C-8: “mandatory left or right turn”) and therefore only needed to consider turning movements at the opposing approach.
Figure 12.
Speed difference on the approach to the mid-block narrowing in Study Areas 1 and 1*, at the signalised junction approach. Source: own study.
In Study Areas 2 and 2*, the change in traffic arrangement at the exit junction was also associated with a change in traffic direction in Study Area 2* (Figure 13). A comparison of entry speeds in Figure 12 and Figure 13 indicates that speeds were dependent on the type of entrance junctions. Significantly lower speeds were recorded along the street section at the entry from a three-leg junction connected to a dual carriageway arterial road (Study Area 2) than at the entry from a signalised junction (Figure 12—Study Areas 1 and 1*).
Figure 13.
Speed difference on the approach to the mid-block narrowing in Study Areas 2 and 2*. Source: own study.
In contrast, significantly higher speeds on the approach to the mid-block narrowing were recorded in Study Area 2*, where entry was from an intermediate junction, with parallel on-street parking arranged along the right side of the approach, compared to the previous study areas with perpendicular parking configuration (see Section 3).
Similar observations regarding the influence of entrance junction type, traffic arrangement, and street section length were made in Study Areas 3 and 3* (Figure 14). In this case as well, higher speeds were recorded. Figure 14 also presents the corresponding entrance junction schemes together with traffic arrangements. Turning movements were possible in Study Areas 2* and 3* only from minor approaches. In Study Area 3, the main contributor to higher entry speeds was the availability of through movement. Differences between speeds amounted to approximately 8 km/h on average. In all study areas, a noticeable increase in speed was also observed in the vicinity of the mid-block narrowing. This was likely related to the length of the approach both to the mid-block narrowing and to the exit junction.
Figure 14.
Speed difference on the approach to the mid-block narrowing in Study Areas 2*, 3 and 3*, at the intermediate junction. Source: own study.
In summary, the above analyses allow a positive answer to research question ③, confirming a significant influence of the entrance junction type together with traffic arrangement on speed. A second important observation was the recording of higher speeds exceeding the 30 km/h limit at larger junction spacing. This was particularly concerning in Study Area 2*, near a school. However, it should be emphasised that, in accordance with the Vienna Convention [96], the observed speeds fall within the permissible range indicated by the 30 km/h traffic sign.
4.3. Speed Differences Considering Exit Junction Type and Traffic Arrangement
Similar analyses to those presented in Section 4.2 were conducted with respect to exit junctions in order to address research question ④. In this case as well, appropriate junction schematics were included in the figures to facilitate clearer interpretation of speed profiles. In the analysed study areas, speed changes depended not only on their length, but also on the type of exit junctions, the possible turning movements at these junctions, and the surrounding street environment.
In the case of a short street section with entry from a signalised junction (Study Areas 1 and 1*), and a high density of shops, boutiques, and service facilities, lower speeds were recorded after the traffic arrangement change (Figure 15). This was likely associated with a change in traffic signage from a mandatory turn instruction to a sign allowing a choice of travel direction (left or right). As a result, after the traffic arrangement change, the driver approaching the exit junction had to make a decision regarding the further direction of travel; whereas, previously only a right turn was permitted.
Figure 15.
Speed difference on the approach to the exit junction in Study Areas 1 and 1*. Source: own study.
In the case of a longer street section with fewer service facilities and the presence of a school gate located nearby (Study Areas 2 and 2*), lower speeds were recorded before the traffic arrangement change (Figure 16), although entry speeds were similar in both study areas (see Figure 13). After the traffic arrangement change and the change in travel direction, higher speeds were observed after the mid-block narrowing, by approximately 10–12 km/h. This phenomenon indicates that in Study Area 2* it would be necessary to implement an additional traffic-calming measure in order to maintain speeds below 30 km/h along the entire street section.
Figure 16.
Speed difference on the approach to the exit junction in Study Areas 2 and 2*. Source: own study.
Similar conclusions can also be drawn from the analysis of speed profiles in Study Areas 3 and 3* (Figure 17). Along the approach to the mid-block narrowing, only compact 19th-century multi-storey tenement buildings were present. At ground level, there were only a few service points (e.g., shoemaker, legal office, etc.), contributing to very low parking turnover. After passing the mid-block narrowing, an increase in speed was also observed (Figure 17). In this case as well, the implementation of an additional traffic-calming measure would be necessary. According to the authors, an angled mid-block narrowing combined with alternating parking configurations (parallel and perpendicular parking) or the use of horizontal deflection measures, as shown in Figure 18 and Figure 19, would be appropriate.
Figure 17.
Speed difference on the approach to the exit junction in Study Areas 3 and 3*. Source: own study.
Figure 18.
Examples of variable parking space patterns on one-way Taczaka Street in Poznań, Poland, preventing drivers from travelling in a straight line: (a) horizontal deflection; (b) staggered parking bays combining parallel and angled parking. Source: Google Earth Pro 7.3.7.1155.
Figure 19.
Examples of horizontal deflection measures preventing drivers from travelling in a straight line: (a) two-way Penley’s Grove Street, York, UK; (b) one-way Townend Street and Del Pyke, York, UK; (c,d) Shakespeare Street, Mount Hawthorn, Perth, Australia. Source: Google Earth Pro 7.3.7.1155.
In early attempts to model speed profiles [52,70,76,97,98], speed was assumed to depend on the distance of the measurement point from the entrance junction. However, these models did not fully explain the range of speed variations and also did not account for the influence of junction type, traffic organisation at junctions, parking configuration, and the surrounding street environment.
Taking this into account, data from the analysed study areas were used in further analyses. Barbosa et al. [76] assumed in their study that entry speed was equal to the UK speed limit of 20 mph (33 km/h). However, this assumption was not confirmed in the present study, where entry speeds were highly variable (see Section 4.2), depending on the type of entrance junction, traffic arrangement at these junctions, and several other factors (see Figure 13, Figure 14, Figure 15, Figure 16 and Figure 17).
In line with findings from other researchers [63,70,76,97], low-order polynomial models with the best visual fit to all data should be applied. However, visual analysis of the speed profiles presented in Figure 7, Figure 8, Figure 9 and Figure 10 indicated the need to use higher-order polynomial models incorporating multiple independent factors. In some cases, only higher-order models (describing speed solely as a function of distance) yielded higher coefficients of determination, but this resulted in poorer visual fit to the data.
The intention of the analyses presented in Section 4 was to obtain simple and practical guidelines for planning 30 km/h zones and helping maintain this speed limit on short city-centre street sections (100–180 m in length). Taking this into account, the development of a single multivariable model incorporating numerous measurable and difficult-to-quantify contextual factors, such as junction type, parking conditions, and street environment characteristics, was deliberately not pursued. Instead, the relationships identified in Figure 7, Figure 8, Figure 9 and Figure 10 were validated using data from the remaining study areas.
4.4. Analysis of the Influence of Selected Street Environment Features on Speed
The final analysis focused on the influence of parking space orientation on the approach to the mid-block narrowing and the sequence of streetscape elements located at the narrowing itself, i.e., addressing research question ⑤. Considering the different orientation of parking spaces (parallel or perpendicular on the right-hand side of the approach), four study areas were selected for comparative analyses. Only speeds at two measurement points located directly before the mid-block narrowing were compared.
Field observations showed that changes in speed were significantly influenced by parking orientation, or more precisely, by the visibility of potential lateral obstacles, such as a vehicle indicating departure from a parking space. In the case of parallel parking, a departing driver typically assesses the possibility of exiting and traffic conditions by looking in the side mirror before moving off. In contrast, with perpendicular parking, the driver must slightly pull out of the parking space in order to assess whether it is safe to exit. This manoeuvre may temporarily reduce forward visibility for a driver approaching the mid-block narrowing and consequently affect free-flow speed v85.
In a 30 km/h zone, drivers are expected to travel at approximately 20–30 km/h; therefore, they should have a clear, unobstructed roadway ahead for a distance of about 40–58 m (see Section 2.3), i.e., also free from vehicles exiting parking spaces.
For comparative analyses, Study Area 2 and 2* (before and after the traffic arrangement change) and Study Area 8 were selected due to identical street section length and similar surrounding land use. In all three study areas, the street was one-way.
First, Study Areas 2* and 8 were analysed due to identical street section length, identical entrance junctions within the 30 km/h zone, and three-leg exit junctions connecting to a dual carriageway arterial road (Figure 20). The comparative analysis of results from Study Areas 2* and 8 showed that, with different parking orientations, significantly lower speeds were recorded where perpendicular parking was present on the right-hand side of the approach to the mid-block narrowing. The difference in speeds within the 30 km/h range reached 30% in both night-time and daytime conditions (Figure 20b). This indicates a strong influence of parking orientation on speed.
Figure 20.
Comparison of results for different parking orientation layouts in Study Areas 2* and 8: (a) box plot; (b) percentage distribution; (c) cumulative distribution functions. Source: own study. Designation: arrows indicate the direction of traffic.
The next analysis examined the influence of the sequence of streetscape elements located at the mid-block narrowing on speed in Study Areas 2 and 8, both with identical perpendicular parking on the right-hand side of the approach and similar street section length. In Study Area 2, the sequence of elements on the narrowing consisted first of concrete planters with a tree, followed by a pedestrian crossing, and then two protective bollards. In Study Area 8, the sequence was reversed.
Comparative analysis of speed distributions, percentage shares, and cumulative distribution functions showed (Figure 21) that speed differences were negligible (less than 3%) across all traffic volume ranges.
Figure 21.
Comparison of results for different streetscape elements at the mid-block narrowing in Study Areas 2 and 8: (a) box plot; (b) percentage distribution; (c) cumulative distribution functions. Source: own study. Designation as in Figure 20.
Third, Study Areas 2 and 2* were compared, i.e., the same street before and after a change in traffic direction. Consequently, both parking orientation and the sequence of streetscape elements differed. Analysis of the data presented in Figure 22 showed substantial speed differences across all traffic volume ranges at both measurement points on the approach to the mid-block narrowing.
Figure 22.
Comparison of results for different parking orientations on the approach to the mid-block narrowing in Study Areas 2 and 2*: (a) box plot; (b) percentage distribution; (c) cumulative distribution functions. Source: own study. Designation as in Figure 20.
With parallel parking on the right-hand side of the approach and bollards placed first at the mid-block narrowing (Study Area 2*), more than 30% of drivers exceeded the 30 km/h limit, 3–7% exceeded 40 km/h, and a few even exceeded 50 km/h (Figure 22b). This indicates that, in addition to the existing mid-block narrowing, additional traffic-calming measures such as horizontal deflection are required.
In contrast, in Study Area 2, with perpendicular parking on the right-hand side of the approach and concrete planters placed first, significantly lower speeds were recorded (Figure 22). At night, 90% of drivers did not exceed 30 km/h, while during the day 97–100% complied with the speed limit. These results confirm the combined influence of parking orientation and the sequence of streetscape elements at mid-block narrowings in 30 km/h zones located in city centres.
The results described above characterise driver behaviour in 30 km/h zones located in dense continuous frontage development with short junction spacing, where mid-block narrowings with different parking orientations and sequences of streetscape elements are applied. This study highlights, provides a novel contribution, that parking orientation significantly influences driver behaviour through perceptual narrowing effects, reducing the field of view and increasing the perception of pedestrian presence. In this way, the findings address a research gap in the literature and extend previous studies with new analyses based on specific contextual data.
Previous research has mainly focused on mid-block narrowings in residential streets located in suburban areas, with sparse parallel parking on both sides and open-layout residential development. These differing conditions result in different driver behaviour, reduced perception of street width, weak perception of potential pedestrian presence, and consequently limited effectiveness of mid-block narrowings in traffic calming (see Section 4.1 and Figure 11).
4.5. Synthesis of Research Findings and Answers to the Research Questions
The analysis of the speed profiles and the discussion of the obtained results indicate that no single, universal answer can be given to the research questions addressed in this study. Free-flow operating speed is not determined by a single independent variable but rather by the combined influence of multiple factors examined in the individual research questions, together with several contextual characteristics describing the surrounding street environment and the functional role of the street. A synthesis of the analyses and the principal findings is presented in Table 2.
Table 2.
Relationship between research questions, analysed variables, methods and principal findings. Source: own study.
The novelty of this study lies not merely in evaluating the effectiveness of mid-block narrowings, but in identifying the contextual factors governing their performance in compact city-centre 30 km/h zones, thereby providing new evidence for the sustainable planning and design of traffic-calmed urban streets.
5. Validation of the Developed Speed Profile Models
The objective of the validation was not to validate a predictive mathematical model, but rather to verify whether the relationships identified in the model study areas were reproducible under similar contextual conditions. Considering the large number of factors affecting speed profiles within 30 km/h zones located in city-centre environments, speed measurements were conducted in the remaining study areas (see Figure 2b). The obtained results were used to verify the relationships identified in Section 4.1, Section 4.2, Section 4.3 and Section 4.4. Individual analyses were performed in study areas characterised by similar types of entrance and exit junctions. To facilitate interpretation of their influence on speed profiles, all figures presented in this section additionally include schematic layouts of the exit junctions together with their traffic arrangements. All measured and estimated values of entry speeds, operating speeds, speed differences, and the zone of influence for the selected study areas are presented in Appendix E (Table A2).
5.1. Study Areas with Access from a Signalised Junction on a Major Collector Road and Exit to an Intermediate Junction Within a 30 km/h Zone
To validate the speed profile relationships identified for Study Areas 1 and 1* (see Section 3.1), Study Area 6 was selected (Figure 23). Entry speeds ranged from 26 km/h to 31 km/h. Analysis of the speed profiles presented in Figure 23 demonstrated that speeds recorded after the mid-block narrowing depended on the traffic arrangement at the exit junction. As previously observed in Study Areas 1 and 1*, exit speed was determined by whether drivers had to choose a downstream movement at the exit junction or could continue without making such a choice. The speed profile obtained for Study Area 6 (Figure 23, green lines) confirmed these findings. At the exit from Study Area 6, approximately 80% of drivers continued straight through the exit junction, while only up to 20% selected a turning movement. Consequently, exit speeds were slightly higher than those observed in Study Areas 1 and 1*.
Figure 23.
Speed profiles along street sections with access from a signalised junction and exit to an intermediate junction, located within a 30 km/h zone. Source: own study.
In summary, the analysis indicates that the application of a mid-block narrowing is effective on street sections beginning at a signalised junction and ending at intermediate junctions with different traffic arrangements. The operating speed depends on both the length of the street section and the traffic arrangement at the exit junction. In contrast, the zone of influence is approximately 13–15 m and remains unaffected by the traffic arrangement at the exit junction.
5.2. Study Areas with Access from a Junction on a Dual Carriageway Arterial Road and Exit to an Intermediate Junction Within a 30 km/h Zone
To validate the speed profiles, two study areas, Study Areas 2 and 5 (W–E), were selected, one being a one-way street and the other a two-way street (Figure 24). In both cases, operating speeds were comparable; whereas, the speeds recorded on the approach to and departure from the mid-block narrowing depended on the street type. On the one-way street, entry speeds were higher than those observed on the two-way street. In contrast, exit speeds were lower.
Figure 24.
Speed profiles along street sections with access from a junction on a dual carriageway arterial road and exit to an intermediate junction within a 30 km/h zone. Source: own study.
Considering that both study areas were of similar length, straight road alignments should not be applied along such street sections, as they encourage drivers to travel at higher speeds. According to the guidelines [5,6,7,8,9,10,11,12], in order to maintain the speed limit of up to 30 km/h, the spacing between consecutive traffic-calming measures (TCMs) should not exceed 40–60 m. In the present case, the street sections located before and after the mid-block narrowing were longer (approximately 80–90 m). Therefore, horizontal deflection should be introduced at least twice along the route. The purpose of such measures is to physically restrict drivers’ forward visibility and discourage travel speeds exceeding the posted 30 km/h limit.
On the one-way street, horizontal deflection should be achieved through the use of staggered parking arrangements, created by alternating perpendicular and parallel parking bays before the narrowing (see Figure 18 and Figure 19a). On the two-way street, parking spaces should be arranged in a staggered pattern both before and after the mid-block narrowing, while the narrowing itself should be designed as an angled mid-block narrowing (see Figure 19b).
5.3. Study Areas with Access from an Intermediate Junction Within a 30 km/h Zone and Exit to a Dual Carriageway Arterial Road
Three study areas of almost identical length were selected for validation: Study Areas 2*, 5 (E–W), and 8 (Figure 25). The general shape of the speed profiles was similar in all study areas; however, the recorded speeds varied considerably.
Figure 25.
Speed profiles along street sections with access from an intermediate junction within a 30 km/h zone and exit to a dual carriageway arterial road. Source: own study.
For the one-way Study Areas 2* and 8, speeds differed substantially and were influenced by the orientation of parking spaces (parallel parking in Study Area 2* and perpendicular parking on the right-hand side of the street in Study Area 8). Owing to the use of perpendicular parking spaces in Study Area 8, speeds below 30 km/h were recorded along the entire street section. In contrast, Study Area 2* exhibited substantial exceedances of the posted speed limit both before and after the mid-block narrowing. This indicates that additional horizontal deflection should be introduced at least twice along the route, for example by modifying the orientation of parking spaces and applying an angled mid-block narrowing.
On the narrow two-way street, horizontal deflection is particularly needed on the approach to the mid-block narrowing, together with the application of an angled mid-block narrowing. Such measures would reduce drivers’ forward visibility and consequently contribute to lower travel speeds.
5.4. Study Areas with Access from and Exit to Intermediate Junction Within a 30 km/h Zone
To validate the results obtained for Study Areas 3 and 3* (see Section 3.4), Study Areas 4 and 7 were selected. All study areas were one-way streets. Figure 26 presents the resulting speed profiles together with schematic layouts of the junctions. The traffic arrangements at the entrance and exit junctions differed between the study areas.
Figure 26.
Speed profiles along street sections with access from and exit to an intermediate junction located within a 30 km/h zone. Source: own work.
Only in Study Area 3 was the dominant entry movement a through movement (approximately 80%). In the remaining study areas, the predominant entry movements were turning movements. A longer zone of influence (approximately 40 m) was observed only in Study Area 7; whereas, in the other cases its length was almost identical (approximately 20 m).
In contrast, speed reductions and operating speeds varied considerably. The mid-block narrowing contributed to an average reduction in speed, expressed as Δv85, of approximately 6–10 km/h. A notable feature was the higher speeds recorded both before and after the mid-block narrowing on street sections longer than 120 m. As in the previous cases, additional horizontal deflections should therefore be introduced in such situations (see Figure 19).
5.5. Summary and Practical Design Recommendations
In summary, the analyses presented above indicate that the application of mid-block narrowings in short 30 km/h zones located in city centres is an effective traffic-calming measure. Operating speeds recorded in all analysed study areas were below 30 km/h (Figure 27), although they varied considerably, ranging from 18 km/h to 27 km/h. In most study areas, the zone of influence was approximately 15–20 m. This finding also confirms the conclusions of previous studies [99,100] regarding characteristic V-shaped deflection of the speed profile associated with the presence of a traffic-calming device.
Figure 27.
Comparative framework showing operating-speed ranges and contextual characteristics of selected mid-block narrowings. Source: own study.
Furthermore, the study demonstrated that both free-flow speed and operating speed depend on:
- −
- The length of the street section (i.e., junction spacing);
- −
- The type of entrance and exit junctions and the traffic arrangements applied at them;
- −
- The orientation of parking spaces along the street section;
- −
- The sequence of streetscape elements located at the mid-block narrowing.
Based on the conducted research, it was demonstrated that on two-way streets it is necessary to apply not only staggered approaches at all intermediate junctions (Figure 28a), but also an angled mid-block narrowing combined with horizontal deflection. Such horizontal deflection should primarily be achieved through an alternating arrangement of parking bays (a perpendicular parking bay before the narrowing and a parallel parking bay after the narrowing, or vice versa) (Figure 28a).
Figure 28.
Recommended layouts for staggered approaches at intermediate junctions and complementary traffic-calming measures: (a) horizontal deflections (chicane) created by staggered on-street parking on two-way streets; (b) horizontal deflection beyond a mid-block narrowing on one-way streets. Source: own study. Designation: arrows indicate the direction of traffic.
For one-way streets longer than 120 m, horizontal deflections (lateral shifts in the roadway creating non-linear driving paths) should be provided immediately before the mid-block narrowing or both before and after it (Figure 28b).
The findings addressing Research Question ⑤ also indicate that the design of the mid-block narrowing surface is important. According to the analysis results (Figure 23 and Figure 24), concrete planters fitted with a U-6 delineator board (“marker indicating a roadside obstacle”) should be installed first, in the direction of travel, followed by the pedestrian crossing and protection bollards. The board alerts drivers to the presence of a physical roadside obstruction. It is recommended that the boards use red-and-white colouring, consistent with international roadside-clearance practices; however, the final colour scheme should comply with the standards adopted in a given country.
Another observation from the field studies concerns the use of side islands with tree plantings within parking lanes. Where such islands are planned, they should be slightly shorter than the parking lane itself and should incorporate mountable kerbs on the rounded side facing the carriageway. The use of mountable kerbs at these locations enables drivers to manoeuvre into parking spaces more safely, avoiding the impacts against full-height kerbs or very close contact with kerbs that were observed during the field surveys (Figure 3a and Figure 29a, tyre marks visible on the kerbs).
Figure 29.
Examples from field observations: (a) side island constructed within a parking lane; (b) unauthorised parking on a hatched area near an access to an internal courtyard. Source: photos by the authors.
Where side islands are provided within parking lanes, their use should also be considered on both sides of accesses to internal courtyards. In such cases, the islands serve as a physical measure preventing illegal parking on hatched areas. This solution helps eliminate the improper parking behaviour illustrated in Figure 29b.
The application of side islands with tree plantings at accesses to internal courtyards facilitates vehicle access while preventing illegal parking. Within parking lanes, such islands also allow parking spaces to be organised more efficiently. In both applications, side islands incorporating shrubs or trees improve the visual quality of the street environment while contributing to environmental sustainability.
6. Conclusions
The results obtained indicate that speed profiles can be a useful tool for assessing the effectiveness of mid-block narrowings in reducing free-flow speeds within 30 km/h zones located in city centres. However, speed profiles along a street section are also influenced by several determinants, regardless of whether the street operates as a one-way or two-way facility. The most important determinants were found to be the type of entrance and exit junctions together with their traffic arrangements, junction spacing, and the orientation of parking spaces (parallel or perpendicular), not only on the approach to the mid-block narrowing but also along the entire street section. The relationships identified across the six selected study areas were subsequently confirmed through validation using six additional study areas.
Compared with the findings of Daniel et al. [77], who reported limited effectiveness of mid-block narrowings on long street sections between junctions along wide suburban streets with a 50 km/h speed limit, the results presented in this study confirm the effectiveness of mid-block narrowings within 30 km/h zones located in dense city-centre environments characterised by short junction spacing (Figure 11). This comparison indicates the urban-form configuration in which mid-block narrowings operate as effective traffic-calming devices. Consequently, the present study provides both a novel contribution and an important extension of the existing research gap. Furthermore, the inclusion of numerous contextual variables summarised in Figure 27 provides a comparative framework for road designers, substantially supporting the design of 30 km/h zones in city-centre environments. The practical contribution of the study is reflected in the example design recommendations presented in Figure 28, as well as in the findings concerning the influence of parking-space orientation on the right-hand side of the direction of travel and the sequence of streetscape elements at the mid-block narrowing. Additional recommendations concern the placement of lateral islands within parking lanes and on both sides of accesses to internal courtyards in dense city-centre environments. These recommendations are closely related to environmental considerations, street aesthetics, and the principles of sustainable traffic-calming design in urban centres.
This study substantially extends previous research on the effective application of mid-block narrowings and, unlike earlier studies that focused primarily on isolated traffic-calming devices, demonstrates the strong influence of the surrounding urban context and junction spacing on the operational effectiveness of mid-block narrowings.
The measurement results obtained from the twelve study areas confirm the conclusions of Barbosa et al. [76] that higher entry speeds are associated with smaller speed reductions produced by a traffic-calming device, in this case a mid-block narrowing. However, the assumption that entry speed within a 30 km/h zone can always be taken as 20 mph (approximately 33 km/h) was not confirmed. On the contrary, the present study demonstrated, and the validation analyses confirmed, that entry speed depends on the type of entrance junction, its traffic arrangement, and its location within the urban street network, rather than being consistently equal to 20 mph (approximately 33 km/h).
With regard to the definition of the zone of influence proposed by Daniel et al. [77] and the concept of V-shaped speed profile deflections introduced by Zito and Taylor [63] and subsequently developed by Brindle [70], and De Pauw ed al. [100], the present study confirms the existence of both phenomena. However, when the objective is to ensure speed consistency along street sections, that is, to avoid abrupt speed changes associated with rapid braking and acceleration, speed differentials should not be excessive and should preferably remain below 10 km/h. Consequently, the definition of the zone of influence proposed by Daniel et al., which includes only the approach area to a traffic-calming measure (TCM), should be expanded in accordance with the findings of [63,70,76,77,100], and the results presented in this study to also include the downstream area beyond the TCM. Accordingly, the zone of influence should be defined as the area between the locations of two consecutive maximum speeds, encompassing both the deceleration and acceleration processes associated with a given traffic-calming device. The findings further indicate that, within dense city-centre environments, the zone of influence of a mid-block narrowing is strongly affected by the types of entrance and exit junctions, their traffic arrangements, and junction spacing.
In summary, this study is the first to introduce a context-based reinterpretation of the effectiveness of mid-block narrowings and to integrate multiple factors and urban-design elements that contribute to the development of speed profiles within 30 km/h zones located in city centres. These factors include:
- −
- Maintaining compliance with the speed limit along the entire analysed street section rather than focusing solely on point-based speed reductions;
- −
- Giving substantial consideration to junction spacing when planning 30 km/h zones, including the application of mid-block narrowings alone on street sections up to 100 m in length and the introduction of additional horizontal deflections on longer street sections;
- −
- Incorporating broader urban-context considerations, particularly the highly influential orientation of parking spaces on the right-hand side of the direction of travel and the presence of numerous accesses to internal courtyards, thereby providing greater opportunities to control geometric conditions and introduce additional horizontal deflections during the design process;
- −
- Applying offset junction approaches at all internal junctions through the coordinated placement of parking spaces on opposite sides of consecutive approaches, combined with appropriate parking-space orientation (parallel or perpendicular), to create horizontal deflection and discourage straight-line vehicle trajectories through the junction (Figure 19b and Figure 28).
Author Contributions
Conceptualization, A.S.; methodology, A.S.; validation, S.M. and A.S.; formal analysis, S.M. and A.S.; data curation, S.M.; writing—original draft preparation, S.M. and A.S.; writing—review and editing, S.M. and A.S.; visualisation, A.S. All authors have read and agreed to the published version of the manuscript.
Funding
This research received no external funding.
Institutional Review Board Statement
Not applicable.
Informed Consent Statement
Not applicable.
Data Availability Statement
The data presented in this study are available on request from the corresponding author.
Acknowledgments
The authors would like to thank Maciej Sochanowski of Maciej Sochanowski Design and Engineering of Szczecin for providing details of upgrading of the analysed city district.
Conflicts of Interest
The authors declare no conflicts of interest.
Abbreviations
The following abbreviations are used in this manuscript:
| MBN | Mid-block narrowing |
| TCM | Traffic-calming measure |
| V/h | number of individual free-flow speed observations recorded within one hour |
| v85 | free-flow speed refers to the 85th-percentile speed (v85) measured under unconstrained traffic conditions |
| di | distance of the i-th measurement point from the centreline of the mid-block narrowing (i = 1, 2, …, n) |
| l | entrance and exit junctions length of the street section measured between the entry and exit junctions |
Appendix A
Figure A1.
Study area No. 1: (a) before—two-lane way 2010; (b) after—one-lane way 2025. Source: Google Earth Pro 7.3.7.1155.
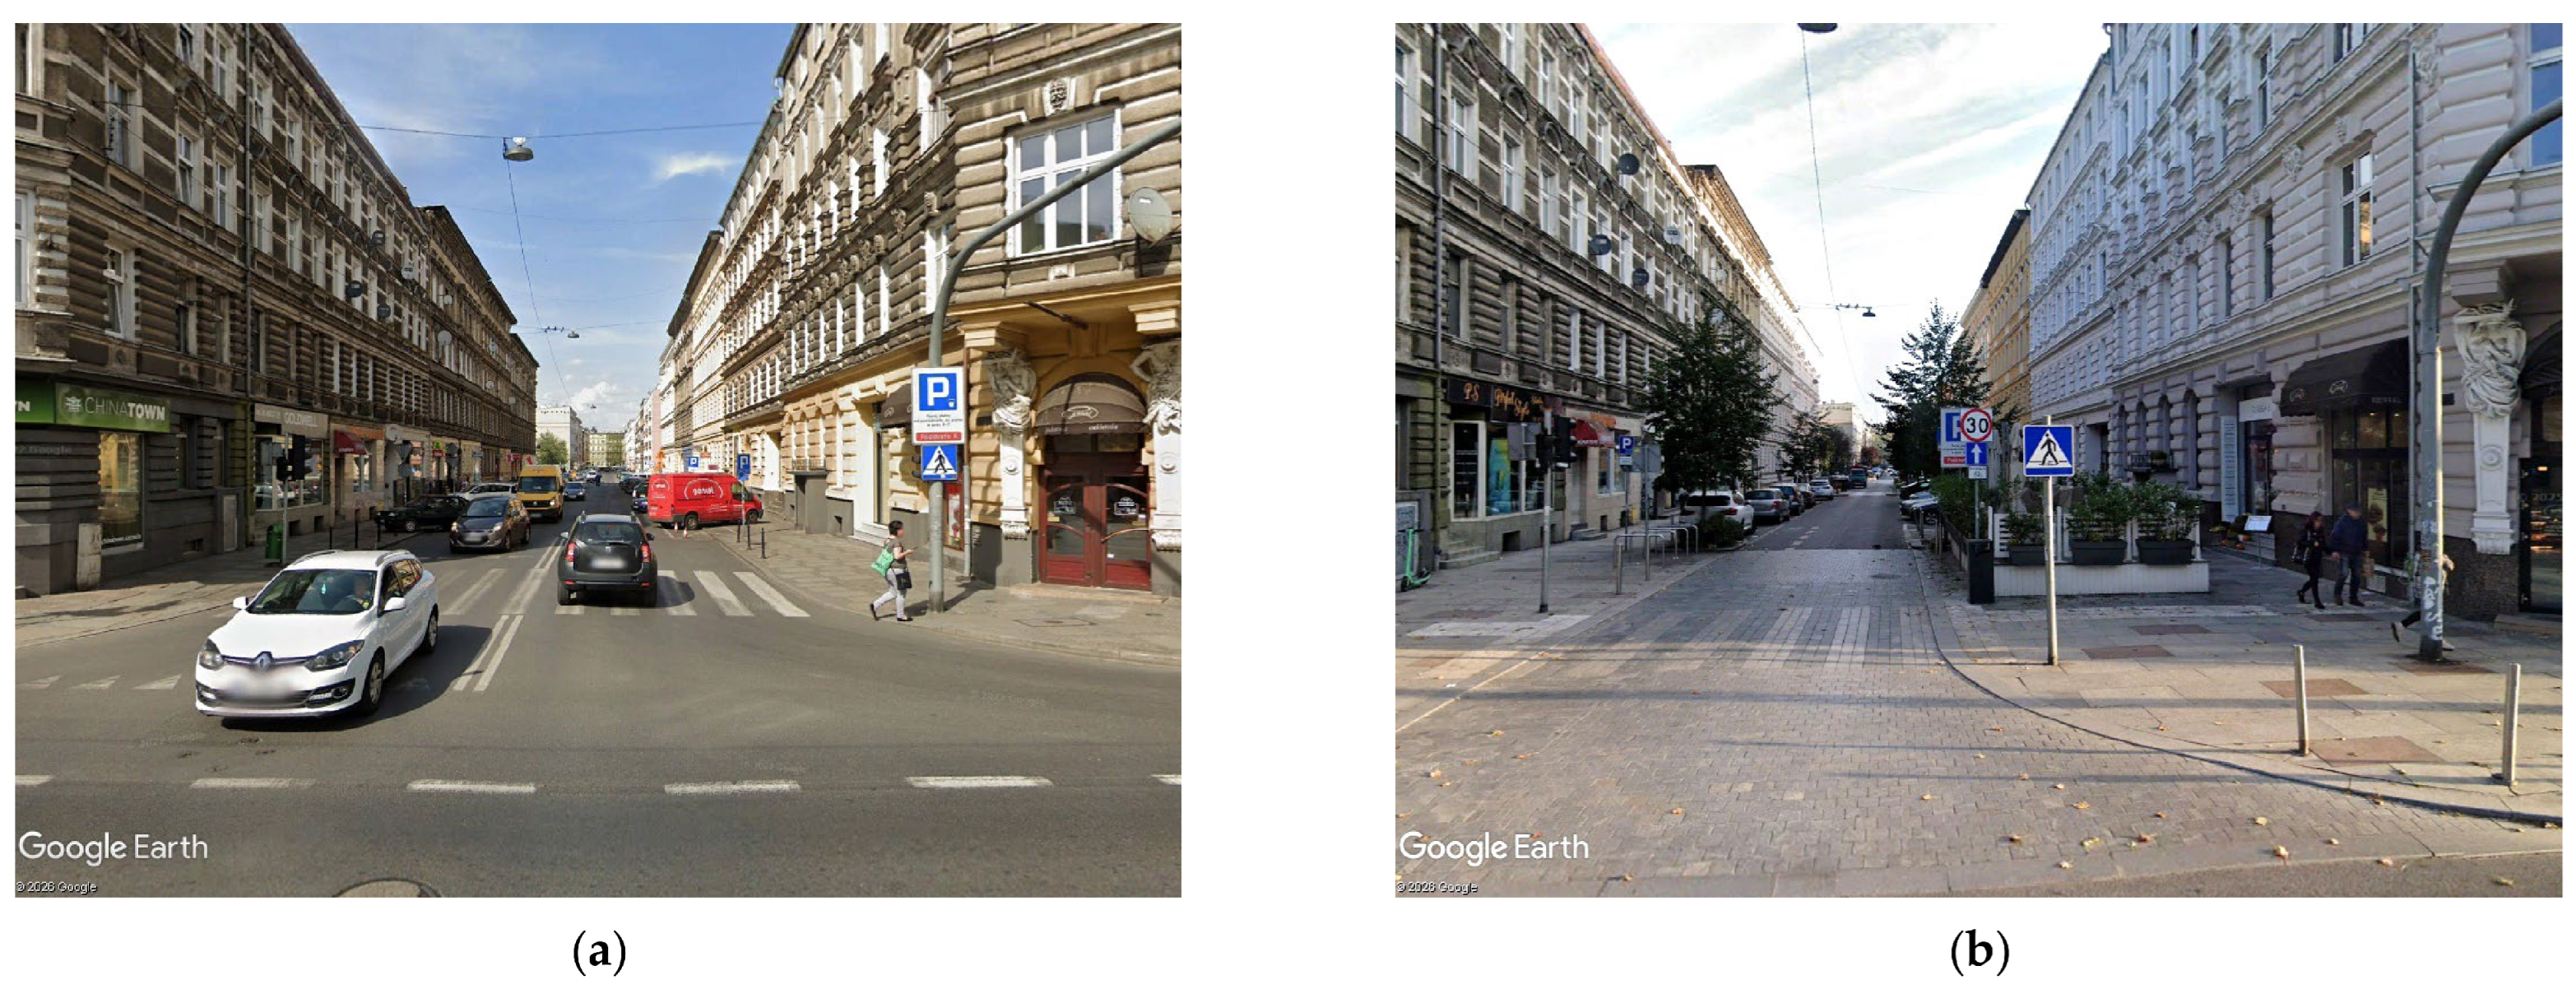
Appendix B
Figure A2.
Existing traffic and parking conditions prior to reconstruction: (a) Study Area 1 in 2010; (b) Study Area 8 in 2014. Source: Google Earth Pro 7.3.7.1155.
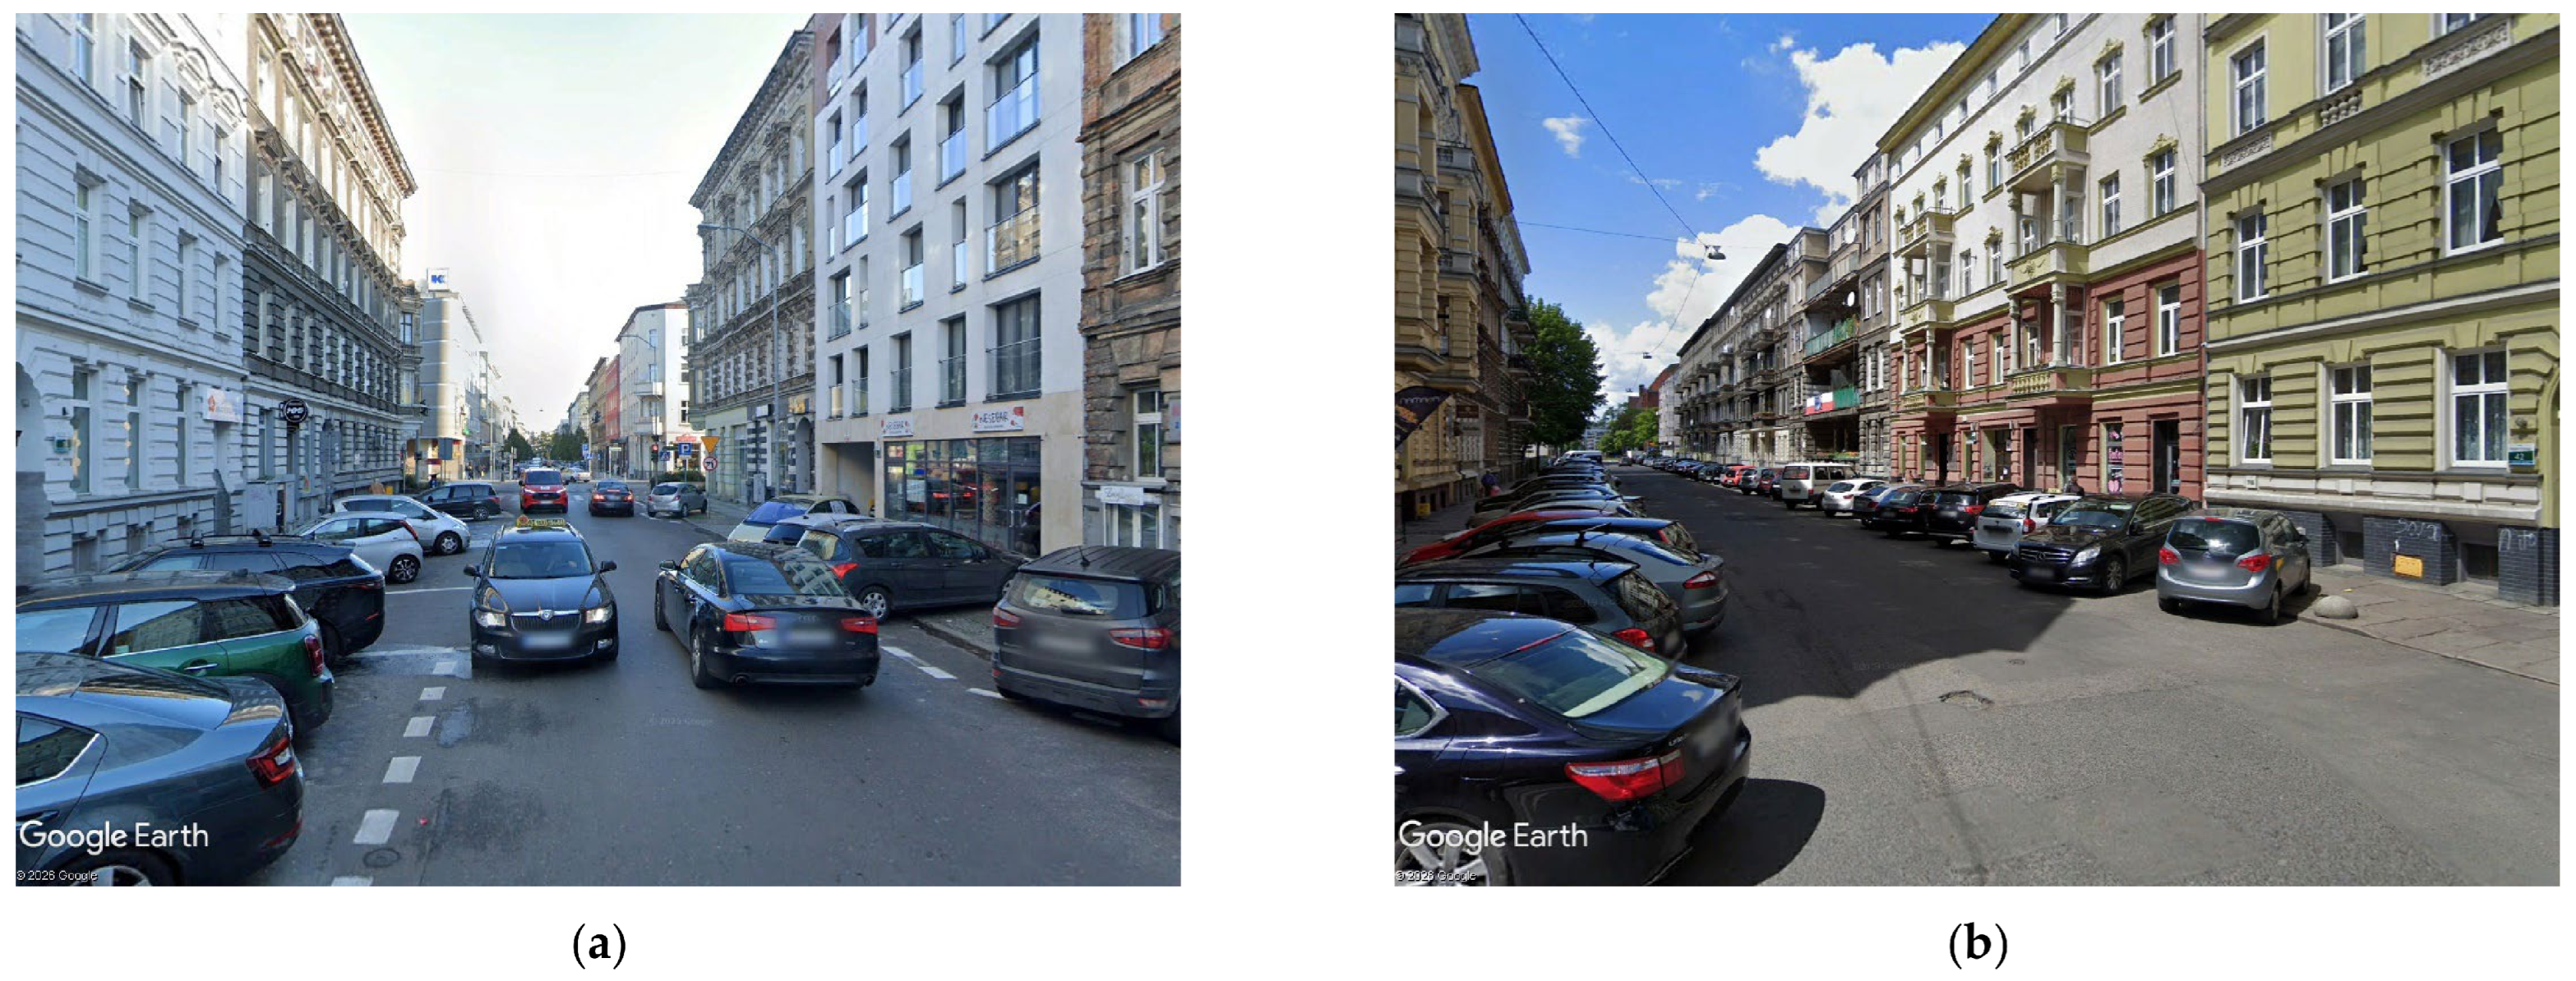
Appendix C
Figure A3.
Traffic arrangement at the intermediate junction: (a) before the modifications; (b) after the modifications. Source: own study.
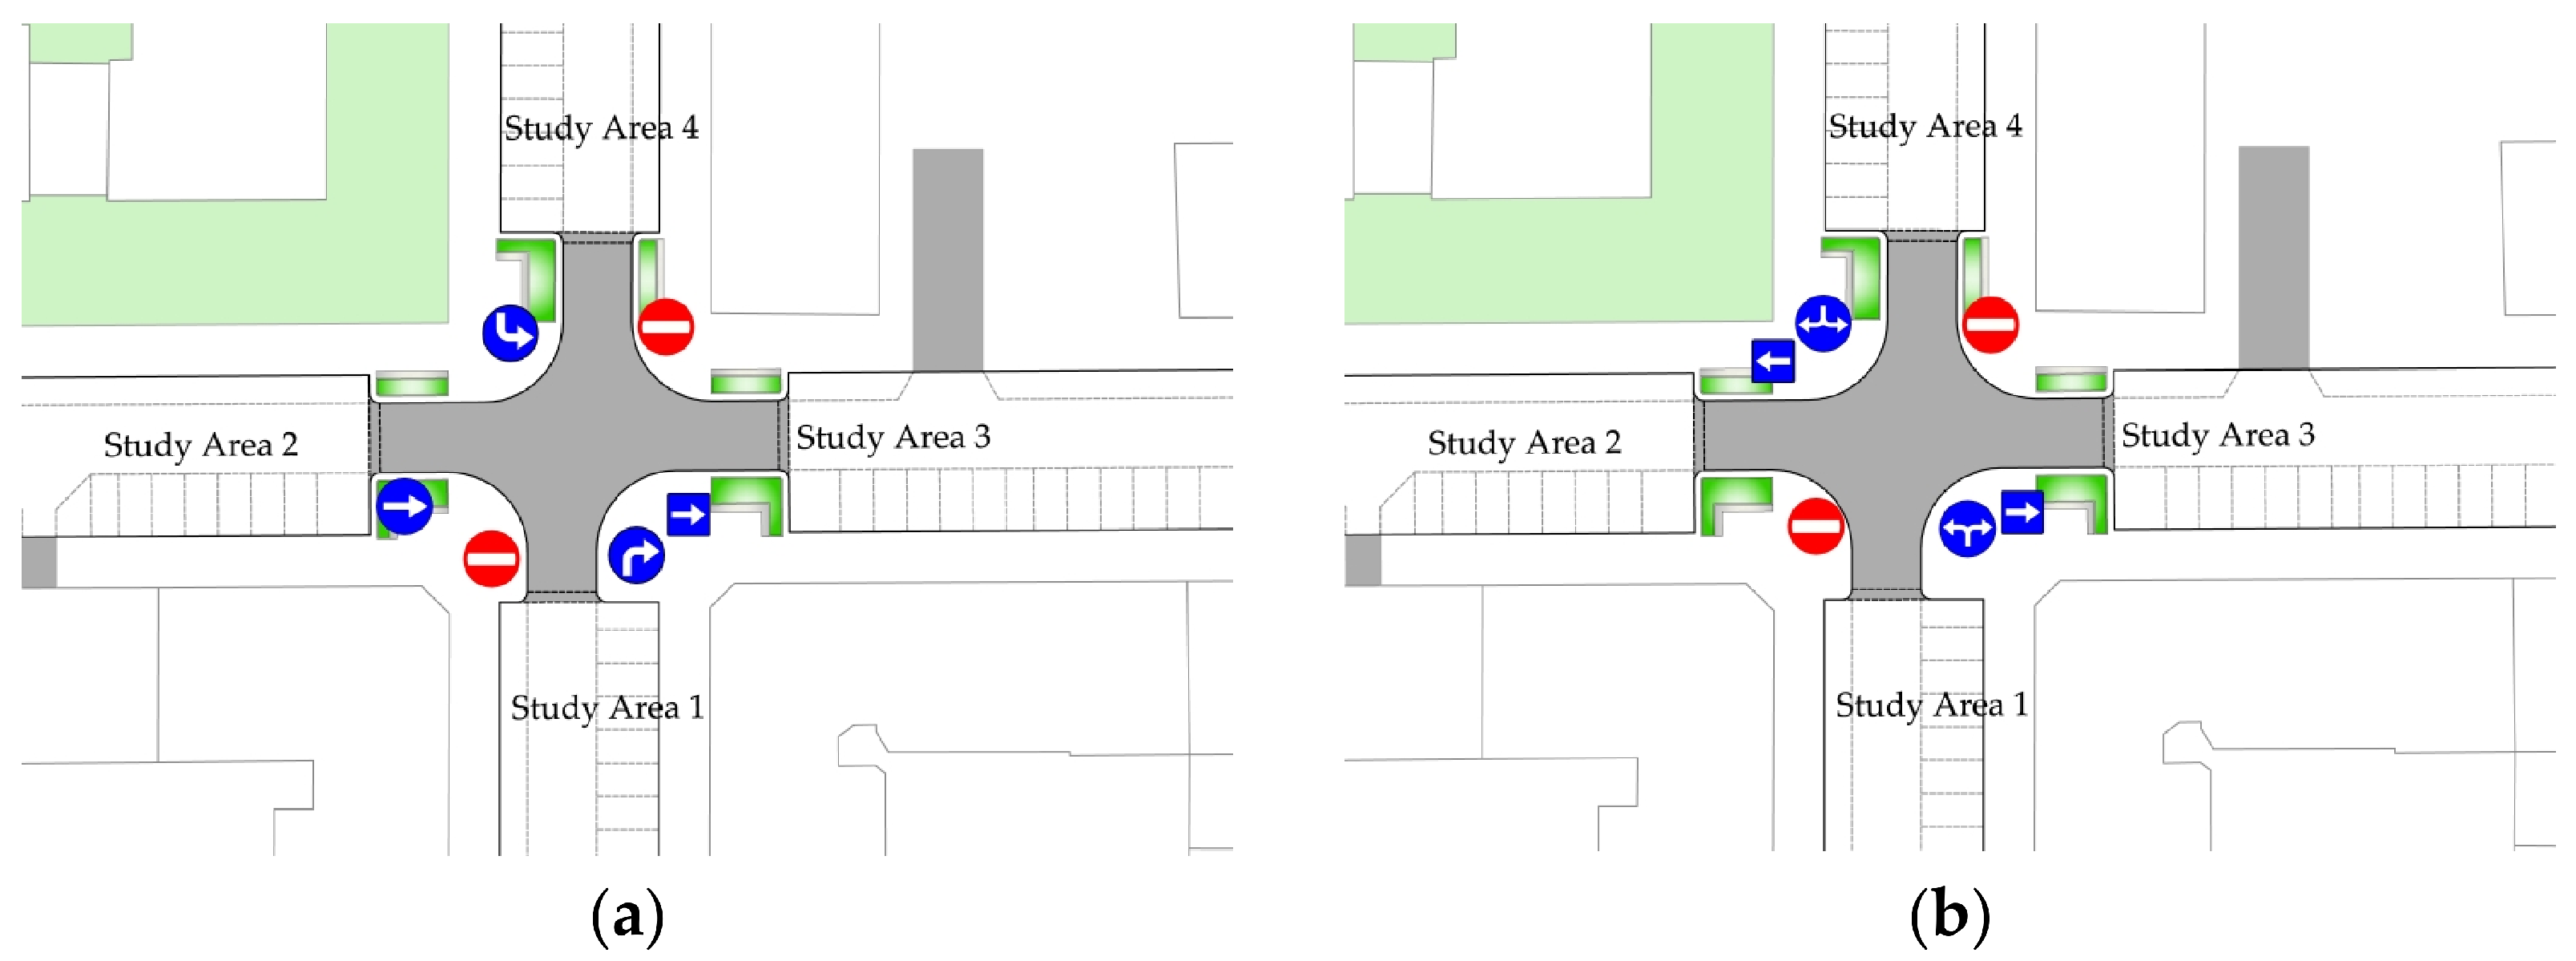
Appendix D
Table A1.
Summary statistics for preliminary analyses examining whether speed distributions measured under different hourly traffic volumes could be pooled (entry to Study Area 1 before the traffic arrangement change). Source: own study.
Example of a positive test result (no grounds to reject the Null Hypothesis H0): The populations of v85 speeds under the analysed traffic flow rates from 10 V/h to 20 V/h and from 20 V/h to 30 V/h do not differ statistically significantly, and these datasets may be combined in further analyses.
Examples of negative test results (the Null Hypothesis H0 should be rejected): The populations of v85 speeds under the analysed traffic flow rates from 20 V/h to 30 V/h and from 30 V/h to 40 V/h, as well as from 60 to 70 V/h and 70–80 V/h, are statistically different, and these datasets should not be combined in further analyses.
Conclusion 1: The populations of v85 speeds at traffic volumes up to 30 V/h and from 30 to 70 V/h are different and should be analysed separately.
Conclusion 2: The populations of v85 speeds at traffic volumes from 30 to 70 V/h and from 70 to 100 V/h do not differ significantly and may be analysed jointly.
Combined data within hourly traffic volume groups Ni:
- −
- Up to 30 V/h included 21 night-time hours and 225 individual free-flow speed measurements;
- −
- From 30 V/h to 70 V/h included 18 daytime hours and 600 individual free-flow speed measurements;
- −
- From 70 V/h to 100 V/h included 12 daytime hours and 525 individual free-flow speed measurements.
Based on the statistical analysis of speed distributions, three hourly traffic-volume categories were adopted for further analyses: up to 30 V/h, from 30 to 70 V/h, and from 70 V/h to 100 V/h. Within each category, the free-flow speed was estimated as the 85th percentile of speeds obtained from all measurement hours classified into the respective traffic-volume category (Figure A4 and Figure A5).
Figure A4.
Example cumulative distribution functions (CDFs) of entry flows into Study Area 1 for different hourly traffic volume categories: (a) ≤30 V/h; (b) 30–70 V/h; (c) 70–100 V/h. Source: own study.
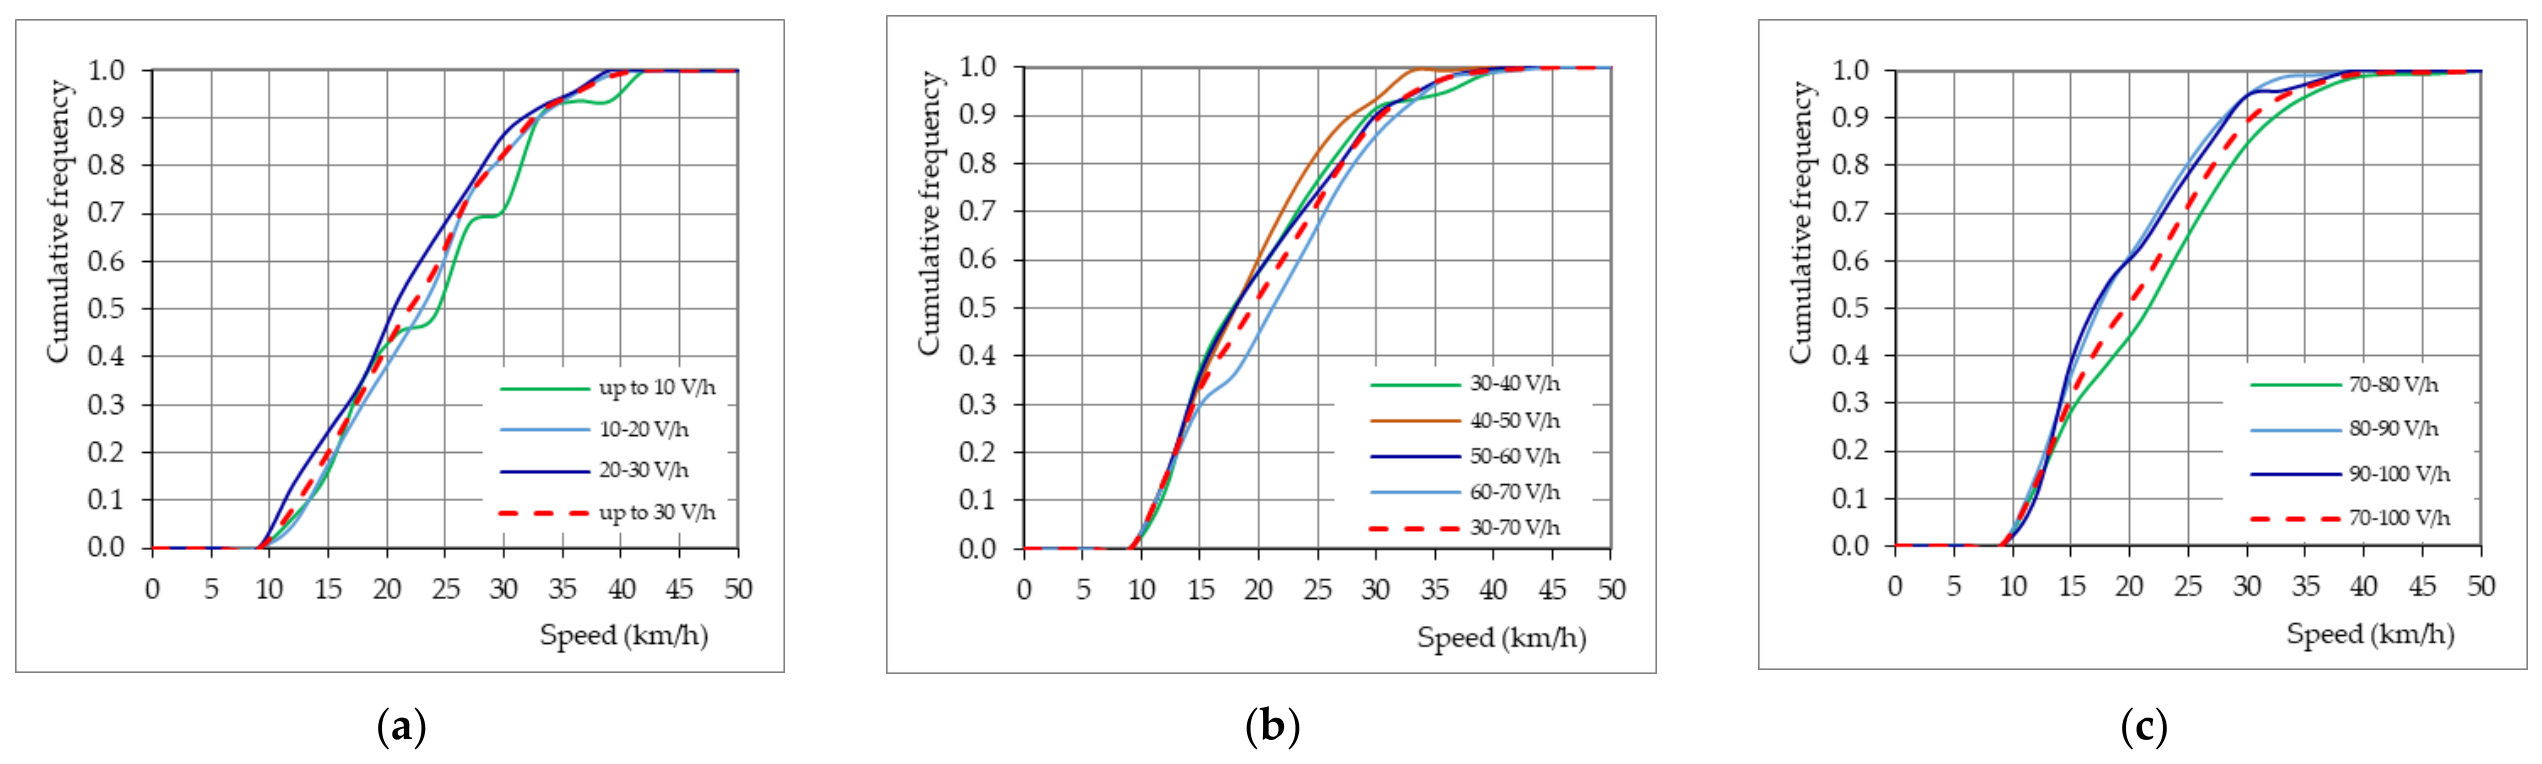
Figure A5.
Example cumulative distribution functions (CDFs) for selected hourly traffic volume categories used in the subsequent analyses at entries from signalised junctions to: (a) Study Area 1; (b) Study Area 1*; (c) Study Area 6. Source: own study.
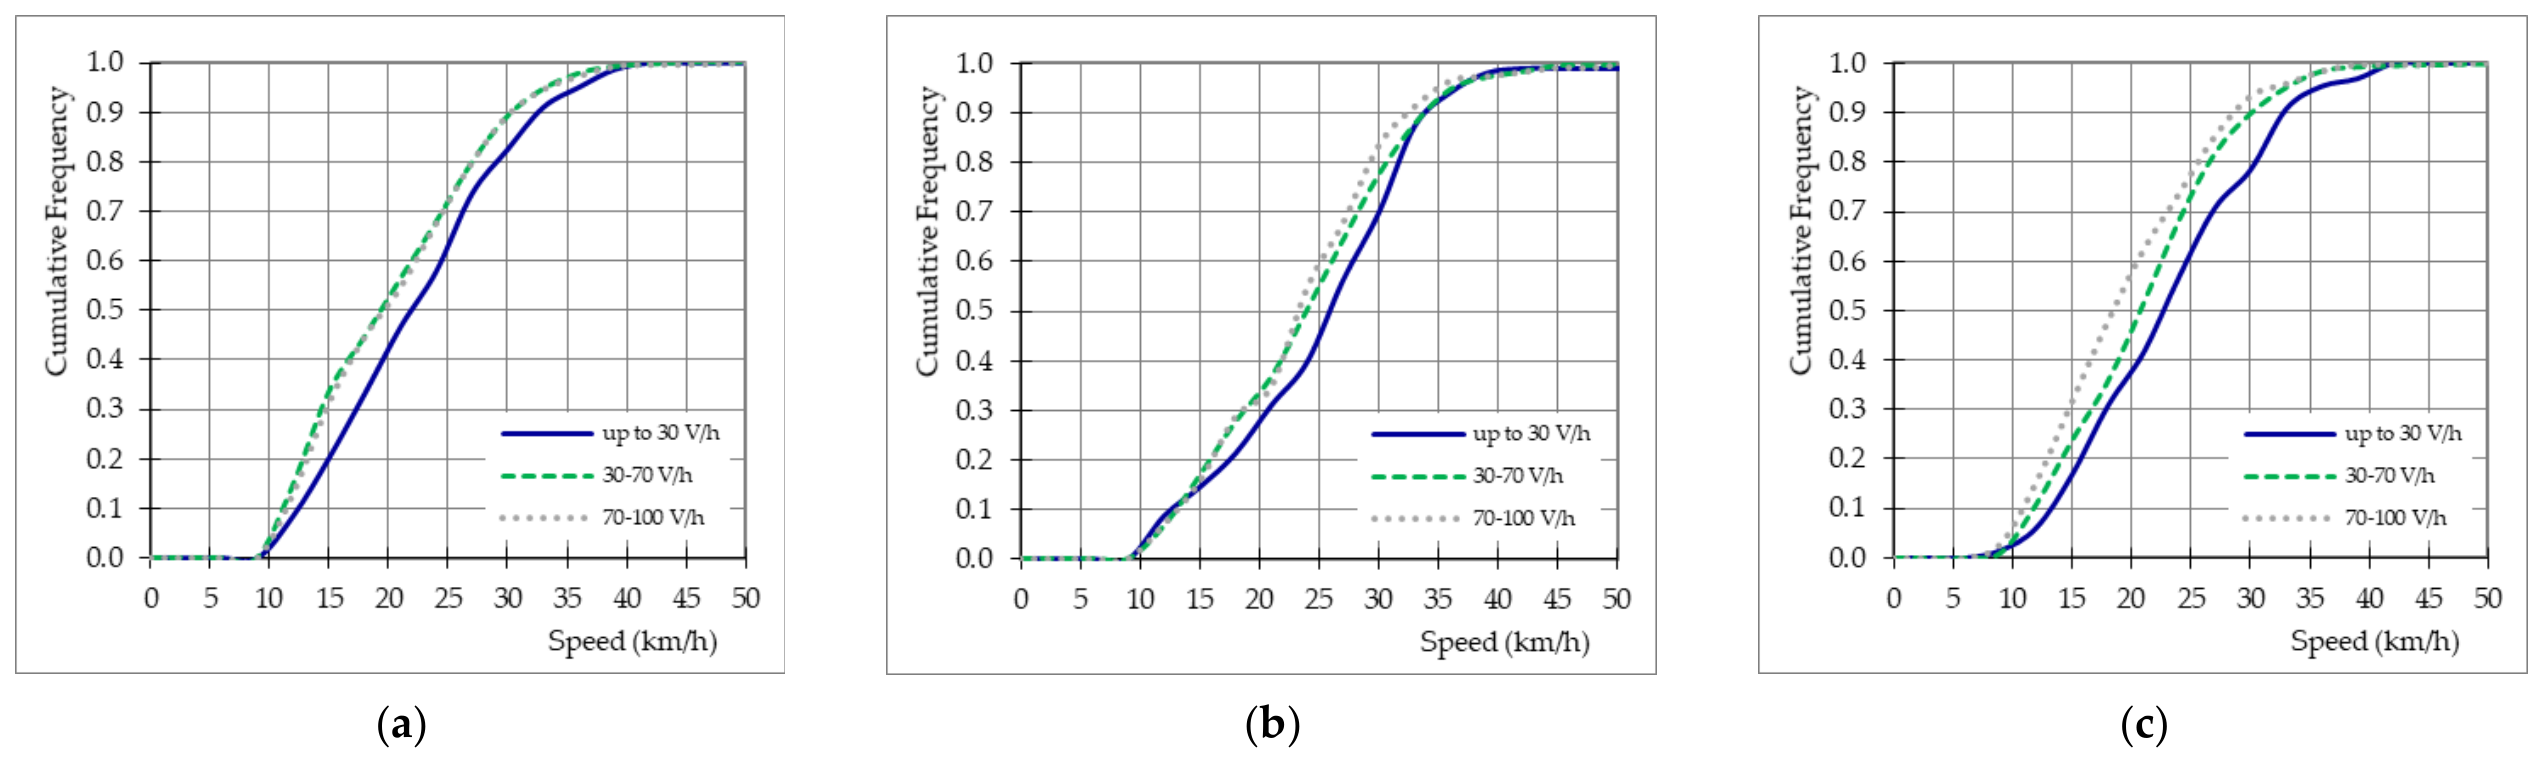
Appendix E
Table A2.
Junction spacing, entry speed, operating speed, speed difference, parking space orientation, and zone of influence for selected study areas. Source: own study.
References
- Sayer, I.A.; Nicholls, D.A.; Layfield, R.E. Traffic Calming: Passenger and Rider Discomfort at Sinusoidal, Round-Top and Flat-Top Humps—A Track Trial at TRL; TRL Report 417; Transport Research Laboratory: Crowthorne, UK, 1999. [Google Scholar]
- Watts, G.R. Road Humps for the Control of Vehicle Speeds; TRRL Laboratory Report 597; Transport Research Laboratory: Crowthorne, UK, 1973. [Google Scholar]
- Watts, G.R.; Harris, G.J. Traffic Calming: Vehicle Generated Ground-Borne Vibration Alongside Speed Control Cushions and Road Humps; TRL Report 235; Transport Research Laboratory: Crowthorne, UK, 1996. [Google Scholar]
- Webster, D.C. Road Humps for Controlling Vehicle Speeds; TRL Project Report 18; Transport Research Laboratory: Crowthorne, UK, 1993. [Google Scholar]
- Roads Development Guide; East Ayrshire Strathclyde Regional Council: Glasgow, UK, 1995. Available online: https://www.ayrshireroadsalliance.org/Resources/pdf/Permit-application-forms/East-Ayrshire/RoadsDevelopmentGuideEAC.pdf (accessed on 10 May 2026).
- Department for Transport (DfT). Traffic Calming; Local Transport Note 1/07; DfT: London, UK, 2007.
- Recommendations for Urban Traffic Facilities, 3rd ed.; CROW Centre for Legislation and Research in Geotechnical, Civil and Traffic Engineering: Ede, The Netherlands, 1988.
- Urban Traffic Areas—Part 7—Speed Reducers; Vejdirektoratet–Vejregeludvalget: Copenhagen, Denmark, 1991.
- Hummel, T.; Mackie, A.; Wells, P. Traffic Calming Measures in Built-Up Areas Literature Review; Unpublished Project Report PR/SE/622/02; Swedish National Road Administration: Borlänge, Sweden, 2002.
- Traffic Management Guidelines; Fhoilsiú ag Oifig an Tsoláthair: Dublin, Ireland, 2019.
- Guide des Chicanes et Ecluses sur Voiries Urbaines; CERTU: Lyon, France, 2012.
- Directives for the Design of Urban Roads RASt 06; Road and Transportation Research Association: Köln, Germany, 2006.
- Federal Highway Administration University. Course on Bicycle and Pedestrian Transportation, Lesson 12: Midblock Crossings; No. FHWA-HRT-05-107 HRDS-05/07-06(WEB)E; Research, Development, and Technology Turner-Fairbank Highway Research Center: Georgetown Pike, VA, USA, 2006.
- Davis, G.; Damen, P.; Brindle, R.; Rueda, M. Guide to Traffic Management Part 8: Local Area Traffic Management, 2nd ed.; Austroads Ltd.: Sydney, Australia, 2016. [Google Scholar]
- Code or Practice for Land Development and Subdivision Infrastructure; Napier City Council—Te Kaunihera o Ahuriri: Napier, New Zealand, 2021.
- Kancelaria Prezesa Rady Ministrów. Załącznik do Dziennika Ustaw nr 220 poz. 2181 z dnia 23.12.2003, Szczegółowe Warunki Techniczne dla Znaków i Sygnałów Drogowych oraz Urządzeń Bezpieczeństwa Ruchu Drogowego i Warunki ich Umieszczania na Drogach; Kancelaria Prezesa Rady Ministrów: Warszawa, Poland, 2023. (In Polish)
- Webster, D.C. Traffic Calming—Four Schemes on Distributor Roads; TRL Report 182; Transport Research Laboratory: Crowthorne, UK, 1995. [Google Scholar]
- European Commission. Guidelines for Developing and Implementing a Sustainable Urban Mobility Plan (SUMP), 2nd ed.; Publications Office of the European Union: Luxembourg, 2019. [Google Scholar]
- European Commission. Sustainable Urban Mobility Indicators (SUMI); Publications Office of the European Union: Luxembourg, 2019. [Google Scholar]
- European Commission. The New EU Urban Mobility Framework; COM(2021) 811 final; Communication from the Commission: Brussels, Belgium, 2021. [Google Scholar]
- OECD. ITF Transport Outlook 2023; OECD Publishing: Paris, France, 2023. [Google Scholar]
- United Nations. Transforming Our World: The 2030 Agenda for Sustainable Development; United Nations: New York, NY, USA, 2015. [Google Scholar]
- European Commission. EU Road Safety Policy Framework 2021–2030—Next Steps Towards “Vision Zero”; Commission Staff Working Document, SWD(2019) 283 final; Communication from the Commission: Brussels, Belgium, 2019. [Google Scholar]
- WHO Regional Office for Europe. Walking and Cycling: Latest Evidence to Support Policy-Making and Practice; WHO Regional Office for Europe: Copenhagen, Denmark, 2023. [Google Scholar]
- World Health Organization. Global Status Report on Road Safety 2023; WHO: Geneva, Switzerland, 2023. [Google Scholar]
- OECD/International Transport Forum. Speed and Crash Risk; OECD Publishing: Paris, France, 2018. [Google Scholar]
- Obwieszczenie Marszałka Sejmu Rzeczypospolitej Polskiej z dnia 26 Czerwca 2025 r. w Sprawie Ogłoszenia Jednolitego Tekstu Ustawy o Drogach Publicznych, Art. 13b Opłaty za Postój w Strefie Płatnego Parkowania i Śródmiejskiej Strefie Płatnego Parkowania. Dziennik Ustaw 4 July 2025, poz. 889. Available online: https://isap.sejm.gov.pl/isap.nsf/DocDetails.xsp?id=WDU20250000889 (accessed on 7 July 2026).
- Sołowczuk, A.; Majer, S. Lesson learned from the effect of traffic calming in a downtown district of Szczecin, Poland for congested urban center. Sci. Technol. Recent Updates Future Prospects 2024, 2, 1–35. [Google Scholar] [CrossRef] [Scilit]
- Majer, S.; Sołowczuk, A. Estimation of Operating Speeds at Road Humps on Short Street Sections with a 30 km/h Speed Limit. Sustainability 2026, 18, 5355. [Google Scholar] [CrossRef] [Scilit]
- Majer, S.; Sołowczuk, A. Traffic Calming Measures and Their Slowing Effect on the Pedestrian Refuge Approach Sections. Sustainability 2023, 15, 15265. [Google Scholar] [CrossRef] [Scilit]
- Angulo, A.V.; Robartes, E.; Guo, X.; Chen, T.D.; Heydarian, A.; Smith, B.L. Evaluating current and future pedestrian mid-block crossing safety treatments using virtual reality simulation. Accid. Anal. Prev. 2024, 206, 107715. [Google Scholar] [CrossRef] [Scilit] [PubMed]
- Szagala, P.; Brzezinski, A.; Kiec, M.; Budzynski, M.; Wachnicka, J.; Pazdan, S. Pedestrian safety at midblock crossings on dual carriageway roads in polish cities. Sustainability 2022, 14, 5703. [Google Scholar] [CrossRef] [Scilit]
- Jurewicz, C. Impact of LATM Treatments on Speed and Safety. Road Transp. Res. 2009, 18, 14–22. [Google Scholar]
- Hall, K.; Jurewicz, C. Impact of LATM Treatments on Speed and Safety, Project No. ST 1392, 1st ed.; Austroads Inc.: Sydney, Australia, 2009. [Google Scholar]
- Brenac, T.; Perrin, C.; Canu, B.; Magnin, J.; Canu, A. Influence of travelling speed on the risk of injury accident: A matched case-control study. Period. Polytech. Transp. Eng. 2015, 43, 129–137. [Google Scholar] [CrossRef] [Scilit]
- Torres, C.; Sobreira, L.; Castro-Neto, M.; Cunto, F.; Vecino-Ortiz, A.; Allen, K.; Hyder, A.; Bachani, A. Evaluation of pedestrian behavior on mid-block crosswalks: A case study in Fortaleza—Brazil. Front. Sustain. Cities 2020, 2, 3. [Google Scholar] [CrossRef] [Scilit]
- Chen, P.; Zhai, X.; Xu, C.; Liu, X. Evaluating pedestrian safety at mid-block crossings considering traffic calming measures. Accid. Anal. Prev. 2019, 132, 105271. [Google Scholar] [CrossRef] [Scilit] [PubMed]
- Gitelman, V.; Doveh, E.; Hakkert, S. The impact of traffic calming measures on road safety: A meta-analysis. Accid. Anal. Prev. 2021, 157, 106162. [Google Scholar] [CrossRef] [Scilit] [PubMed]
- Guío-Burgos, F.A.; Combariza-Pinzón, M.J.; Cerquera-Escobar, F.A. Pedestrian gaps and walking speed at uncontrolled midblock crosswalks. Redin Rev. Fac. Ing. Univ. Antioq. 2020, 107, 26–38. [Google Scholar] [CrossRef] [Scilit]
- Pechteep, P.; Luathep, P.; Jaensirisak, S.; Kronprasert, N. Analysis of Factors Influencing Driver Yielding Behavior at Midblock Crosswalks on Urban Arterial Roads in Thailand. Sustainability 2024, 16, 4118. [Google Scholar] [CrossRef] [Scilit]
- Apardian, R.; Alam, B.M. A Study of Effectiveness of Midblock Pedestrian Crossings: Analyzing a Selection of High-Visibility Warning Signs. Interdiscip. J. Signage Wayfinding 2017, 1, 26. [Google Scholar] [CrossRef] [Scilit]
- Iowa DOT. Iowa Department of Transportation Pedestrian Safety Measures at Crossings. In Design Manual Chapter 12—Pedestrian and Bicycle Facilities 12A—Pedestrian Facilities, Sudas 2024 ed.; Iowa DOT: Ames, IA, USA, 2023. [Google Scholar]
- Jamroz, K.; Mackun, T. Wytyczne projektowania infrastruktury dla pieszych. Wybrane zagadnienia. In Proceedings of the XXIV Ogólnopolskie Kongres Zarządców Dróg Powiatowych: Wzorce i Standardy Najczęściej Stosowane w Drogownictwie Przez Zarządców Dróg, Wałbrzych, Poland, 21–24 May 2024; Available online: https://drogipowiatowe.pl/images/prezentacje/2024/01.pdf (accessed on 18 May 2026). (In Polish)
- Yannis, G.; Michelaraki, E. Effectiveness of 30 km/h speed limit—A literature review. J. Saf. Res. 2025, 92, 490–503. [Google Scholar] [CrossRef] [Scilit] [PubMed]
- World Health Organization (WHO). Streets for Life Campaign Calls for 30 km/h Urban Streets to Ensure Safe, Healthy, Green and Liveable Cities, 17 May 2021, Departmental Update Geneva. Available online: https://www.who.int/news/item/17-05-2021-streets-for-life-campaign-calls-for-30-km-h-urban-streets-to-ensure-safe-healthy-green-and-liveable-cities (accessed on 18 May 2026).
- Yannis, G.; Michelaraki, E. Review of city-wide 30 km/h speed limit benefits in Europe. Sustainability 2024, 16, 4382. [Google Scholar] [CrossRef] [Scilit]
- Safer Roads, Safer Cities: How to Improve Urban Road Safety in the EU; PIN Flash Report 37; European Transport Safety Council: Brussels, Belgium, 2019.
- ITF. Best Practice for Urban Road Safety Case Studies; International Transport Forum Policy Papers, No. 76; OECD Publishing: Paris, France, 2020; Available online: https://www.itf-oecd.org/sites/default/files/docs/best-practice-urban-road-safety.pdf (accessed on 10 June 2026).
- López, I.; Ortega, J.; Pardo, M. Mobility infrastructures in cities and climate change: An analysis through the superblocks in Barcelona. Atmosphere 2020, 11, 410. [Google Scholar] [CrossRef] [Scilit]
- Mingardo, G.; Vermeulen, S.; Bornioli, A. Parking pricing strategies and behaviour: Evidence from the Netherlands. Transp. Res. Part A Policy Pract. 2022, 157, 185–197. [Google Scholar] [CrossRef] [Scilit]
- Urban ITS Expert Group. Guidelines for Its Deployment in Urban Areas Traffic Management; Transport for London: London, UK, 2013. [Google Scholar]
- Yu, C.; Ma, W.; Lo, H.K.; Yang, X. Optimization of mid-block pedestrian crossing network with discrete demands. Transp. Res. Part B Methodol. 2015, 73, 103–121. [Google Scholar] [CrossRef] [Scilit]
- Mao, J.E.; Koorey, G. Investigating and modeling the effects of traffic calming devices. In Proceedings of the IPENZ Transportation Group Technical Conference, Christchurch, New Zealand, 15 March 2010. [Google Scholar]
- Chaudhari, A.; Gore, N.; Arkatkar, S.; Joshi, G.; Pulugurtha, S. Pedestrian crossing warrants for urban midblock crossings under mixed-traffic environment. J. Transp. Eng. Part A Syst. 2020, 146, 04020031. [Google Scholar] [CrossRef] [Scilit]
- Zhang, Y.; Li, Z.; Wang, W. Effectiveness of traffic calming measures on urban streets: A before–after study. Sustainability 2021, 13, 11987. [Google Scholar] [CrossRef] [Scilit]
- Park, E.S.; Jang, K.; Kim, D.K. Effects of lane narrowing on vehicle speed and pedestrian safety in urban streets. Transp. Res. Part F 2020, 71, 275–286. [Google Scholar] [CrossRef] [Scilit]
- Muse, A.A.; Farah, A.A.; Hassan, A.M. Traffic calming measures and crash reduction: A systematic review and meta-analysis of global evidence. Civ. Eng. Archit. 2025, 13, 3546–3560. [Google Scholar] [CrossRef] [Scilit]
- Dumbaugh, E.; Saha, D.; Merlin, L. Toward Safe Systems: Traffic Safety, Cognition, and the Built Environment. J. Plan. Educ. Res. 2024, 44, 36–49. [Google Scholar] [CrossRef] [Scilit]
- Comte, S. Speed management. In Engineering Psychology and Cognitive Ergonomics; Routledge: Abingdon, UK, 2020. [Google Scholar] [CrossRef] [Scilit]
- Schepers, P.; van Loo, W.; Mieras, W.; Drolenga, H.; de Waard, D.; Helbich, M. Built environment characteristics and driving speed in 30 km/h zones: A dutch national analysis. Traffic Saf. Res. 2025, 9, e000091. [Google Scholar] [CrossRef] [Scilit]
- Karndacharuk, A.; McTiernan, D. Implementation Principles for 30 km/h speed limits and zones. J. Australas. Coll. Road Saf. 2019, 30, 45–54. [Google Scholar] [CrossRef] [Scilit]
- Gonzalo-Orden, H.; Arce, M.R.; Unamunzaga, A.L.; Nadia Aponte, N.; Pérez-Acebo, H. Why is necessary to reduce the speed in urban areas to 30 km/h? Transp. Res. Procedia 2021, 58, 209–216. [Google Scholar] [CrossRef] [Scilit]
- Zito, R.; Taylor, M. Speed profiles and vehicle fuel consumption at LATM devices. In Proceedings of the 18th ARRB Transport Research Conference and Transit New Zealand Land Transport Symposium, Christchurch, New Zealand, 2–6 September 1996; Volume 18, pp. 391–406. [Google Scholar]
- Ewing, R. Impacts of traffic calming. In TRB Circular E-C019: Urban Street Symposium Conference Proceedings, Dallas, TX, USA, 28–30 June 1999; TRB: Washington, DC, USA, 1999; pp. I/1–I/14. [Google Scholar]
- Ewing, R.; Hodder, R. Best Development Practices: A Primer for Smart Growth; American Planning Association (in Cooperation with the Urban Land Institute): Chicago, IL, USA, 1996. [Google Scholar]
- Brindle, R.E. Traffic calming in Australia: A definition and commentary. Aust. Road Res. 1991, 21, 37–54. [Google Scholar]
- Brindle, R.E. Local street speed management in Australia—Is it “traffic calming”? Accid. Anal. Prev. 1992, 24, 29–38. [Google Scholar] [CrossRef] [Scilit] [PubMed]
- Brindle, R.E. Living with Traffic: Twenty-Seven Contributions to the Art and Science of Traffic Calming; Special Report SR 53; ARRB Transport Research: Vermont South, VIC, Australia, 1996. [Google Scholar]
- Brindle, R.E. Towards guidelines for LATM in different speed environments. Road Transp. Res. 1999, 8, 95. [Google Scholar]
- Brindle, R.E. Speed-based design of traffic calming schemes. In Proceedings of the 75th ITE Annual Meeting and Exhibit, Melbourne, VIC, Australia, 7–10 August 2005. [Google Scholar]
- Do Duy, D.; Hisashi, K. Profile-Speed Data-Based Models to Estimate Operating Speeds for Urban Residential Streets with a 30 km/h Speed Limit. J. Int. Assoc. Traffic Saf. Sci. IATSS Res. 2013, 36, 115–122. Available online: https://trid.trb.org/View/1247920 (accessed on 12 April 2026). [CrossRef] [Scilit]
- Pazzini, M.; Lantieri, C.; Vignali, V.; Dondi, G.; Giovannini, A.; Mora, A. Road users’ behaviour in the “30 km/h zones”. The case study of Bologna. Transp. Res. Procedia 2023, 69, 504–511. [Google Scholar] [CrossRef] [Scilit]
- Main Roads Department, Guidelines for Local Area Traffic Management, East Perth, Western Australia, 1990. Available online: https://www.legislation.wa.gov.au/legislation/prod/gazettestore.nsf/FileURL/gg1990_005.pdf/$FILE/Gg1990_005.pdf?OpenElement (accessed on 10 May 2026).
- Noble, J.; Elvin, K.; Whitaker, R. Residential roads and footpaths. In Layout Considerations; Design Bulletin 32; Transport and Road Research Laboratory (TRRL): Wokingham, UK, 1977; Available online: https://trid.trb.org/View/60065 (accessed on 12 April 2026).
- Herrstedt, L.; Kjemtrup, K.; Borges, P.; Anderson, P.B. An Improved Traffic Environment—A Catalogue of Ideas. Engineering, Environmental Science, Copenhagen, Denmark, 1993, Corpus ID: 106897140. Available online: https://api.semanticscholar.org/CorpusID:106897140 (accessed on 18 May 2026).
- Barbosa, H.M.; Tight, M.R.; May, A.D. A model of speed profiles for traffic calmed roads. Transp. Res. Part A Policy Pract. 2000, 34, 103–123. [Google Scholar] [CrossRef] [Scilit]
- Daniel, B.D.; Nicholson, A.; Koorey, G. Analysing speed profiles for the estimation of speed on traffic-calmed streets. Road Transp. Res. A J. Aust. N. Zeal. Res. Pract. 2011, 20, 57–70. [Google Scholar]
- Hodge, A.R. A review of the 20 mile/h speed zones: 1991. Traffic Eng. Control 1992, 33, 545–547. [Google Scholar]
- Sołowczuk, A. Effect of traffic calming in a downtown district of Szczecin, Poland. Energies 2021, 14, 5838. [Google Scholar] [CrossRef] [Scilit]
- Lockwood, L.M. Traffic calming definition. Inst. Transp. Eng. J. 1997, 67, 22–24. [Google Scholar]
- Twiedza Szczecin. Available online: https://pl.wikipedia.org/wiki/Twierdza_Szczecin (accessed on 3 July 2026).
- Plan von Stettin—Plan Szczecina 1880 rok. Available online: https://bppm.szczecin.pl/wystawy/plany-historyczne-rozwoju-przestrzennego-szczecina/rok-1880 (accessed on 3 July 2026).
- Kozłowska, I.; Rek-Lipczyńska, A. Modele rewitalizacji XIX-wiecznych obszarów miejskich na przykładzie Szczecina The models of the revitalization of the 19th urban space on the example of Szczecin. Przestrz. Urban. Archit. 2017, 1, 115–128. [Google Scholar] [CrossRef] [Scilit]
- Plan von Stettin und Umgegend—Plan Szczecina z końca XIX w. z projektowanym przebiegiem lini kolei obwodowej 1894 rok. Available online: https://bppm.szczecin.pl/wystawy/plany-historyczne-rozwoju-przestrzennego-szczecina/rok-1894 (accessed on 3 July 2026).
- Cymer, A. Szczecińska architektura opowiada historię, Culture artykuł z dnia Article from 4 April 2024. Available online: https://culture.pl/pl/artykul/szczecinska-architektura-opowiada-historie (accessed on 3 July 2026).
- Kostrzewska, M. Miasto europejskie na przestrzeni dziejów, wybrane przykłady Akapit-DTP, Gdańsk 2013. Available online: https://arch.pg.edu.pl/documents/174968/51761959/skrypt%206.pdf (accessed on 3 July 2026).
- Sochanowski, M. Kompleksowa modernizacja chodników, miejsc postojowych i nawierzchni jezdni w kwartale ulic: Królowej Jadwigi, Małkowskiego, Bogusława X, Bohaterów Getta Warszawskiego, Ściegiennego; Pracownia Projektowa Macieja Sochanowskiego: Szczecin, Poland, 2016. [Google Scholar]
- Jones, P.; Hervik, A. Restraining car traffic in European cities: An emerging role for road pricing. Transp. Res. Part A Policy Pract. 1992, 26, 133–145. [Google Scholar] [CrossRef] [Scilit]
- Mei, Z.Y.; Feng, C.; Kong, L.; Zhang, L.H.; Chen, J. Assessment of different parking pricing strategies: A simulation-based analysis. Sustainability 2020, 12, 2056. [Google Scholar] [CrossRef] [Scilit]
- Mingardo, G.; van Wee, B.; Rye, T. Urban parking policy in Europe: A conceptualization of past and possible future trends. Transp. Res. Part A Policy Pract. 2015, 74, 268–281. [Google Scholar] [CrossRef] [Scilit]
- VanHoose, K.; de Gante, A.R.; Bertolini, L.; Kinigadner, J.; Büttner, B. From temporary arrangements to permanent change: Assessing the transitional capacity of city street experiments. J. Urban Mobil. 2022, 2, 100015. [Google Scholar] [CrossRef] [Scilit]
- SEWiK, System ewidencji wypadków i kolizji. Available online: https://sewik.pl/search (accessed on 1 March 2026). (In Polish)
- Highway Capacity Manual HCM; Transportation Research Board: Washington, DC, USA, 2000.
- Pérez-Acebo, H.; Ziółkowski, R.; Linares-Unamunzaga, A.; Gonzalo-Orden, H. A Series of Vertical Deflections, a Promising Traffic Calming Measure: Analysis and Recommendations for Spacing. Appl. Sci. 2020, 10, 3368. [Google Scholar] [CrossRef] [Scilit]
- Yeo, I.; Baek, J.-G.; Choi, J.-W.; Kim, Y.S. The Optimal Spacing of Speed Humps in Traffic Calming Areas. Int. J. Highw. Eng. 2013, 15, 151–157. [Google Scholar] [CrossRef] [Scilit]
- Konferencja Wiedeńska o ruchu drogowym sporządzona z dnia 8 listopada 1968 r., Dziennik Ustaw 1988, poz. 5, Nr 40. Available online: https://sip.lex.pl/akty-prawne/dzu-dziennik-ustaw/konwencja-o-ruchu-drogowym-wieden-1968-11-08-16792648 (accessed on 18 May 2026). (In Polish)
- Jarvis, J.R. Acceleration Lane Design; Internal Report AIR 281-1; Australian Road Research Board: Vermont South, VIC, Australia, 1987. [Google Scholar]
- Pitcher, I.K. Speed profiles of isolated vehicles in residential streets. In Proceedings of the 15th Australian Road Research Board ARRB Conference, Darwin, NT, Australia, 26–31 August 1990. [Google Scholar]
- Santiago-Chaparro, K.R.; Chitturi, M.; Bill, A.; Noyce, D.A. Spatial effectiveness of speed feedback signs. Transp. Res. Rec. J. Transp. Res. Board 2012, 2281, 8–15. [Google Scholar] [CrossRef] [Scilit]
- De Pauw, E.; Daniels, S.; Brijs, T.; Hermans, E.; Wets, G. Behavioural effects of fixed speed cameras on motorways: Overall improved speed compliance or kangaroo jumps? Accid. Anal. Prev. 2014, 73, 132–140. [Google Scholar] [CrossRef] [Scilit] [PubMed]
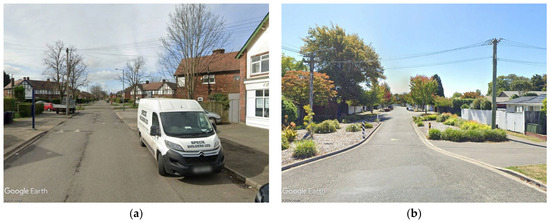
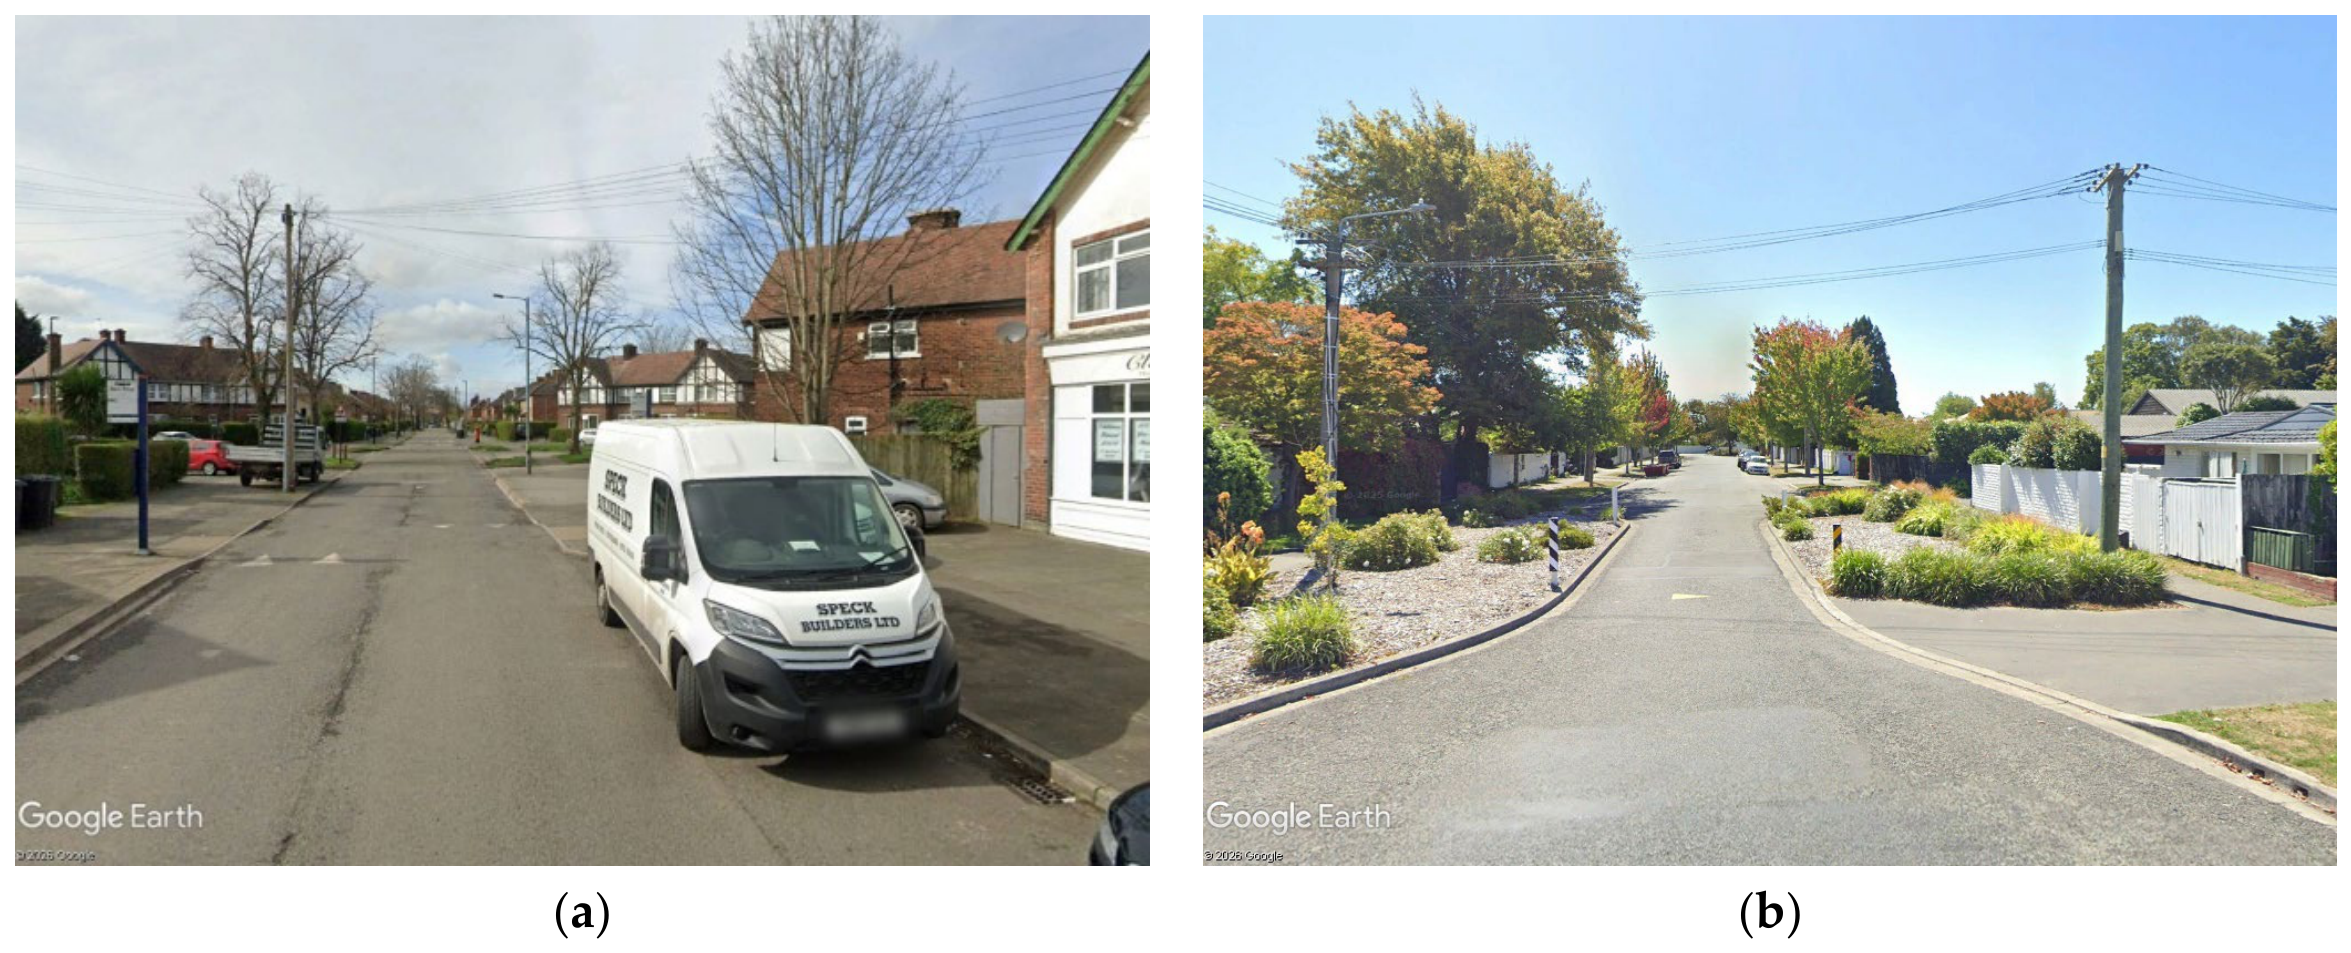
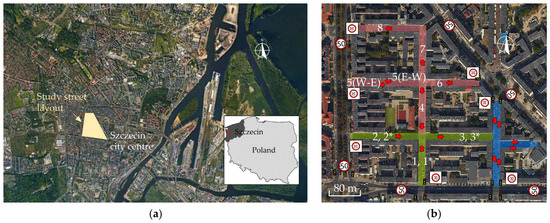
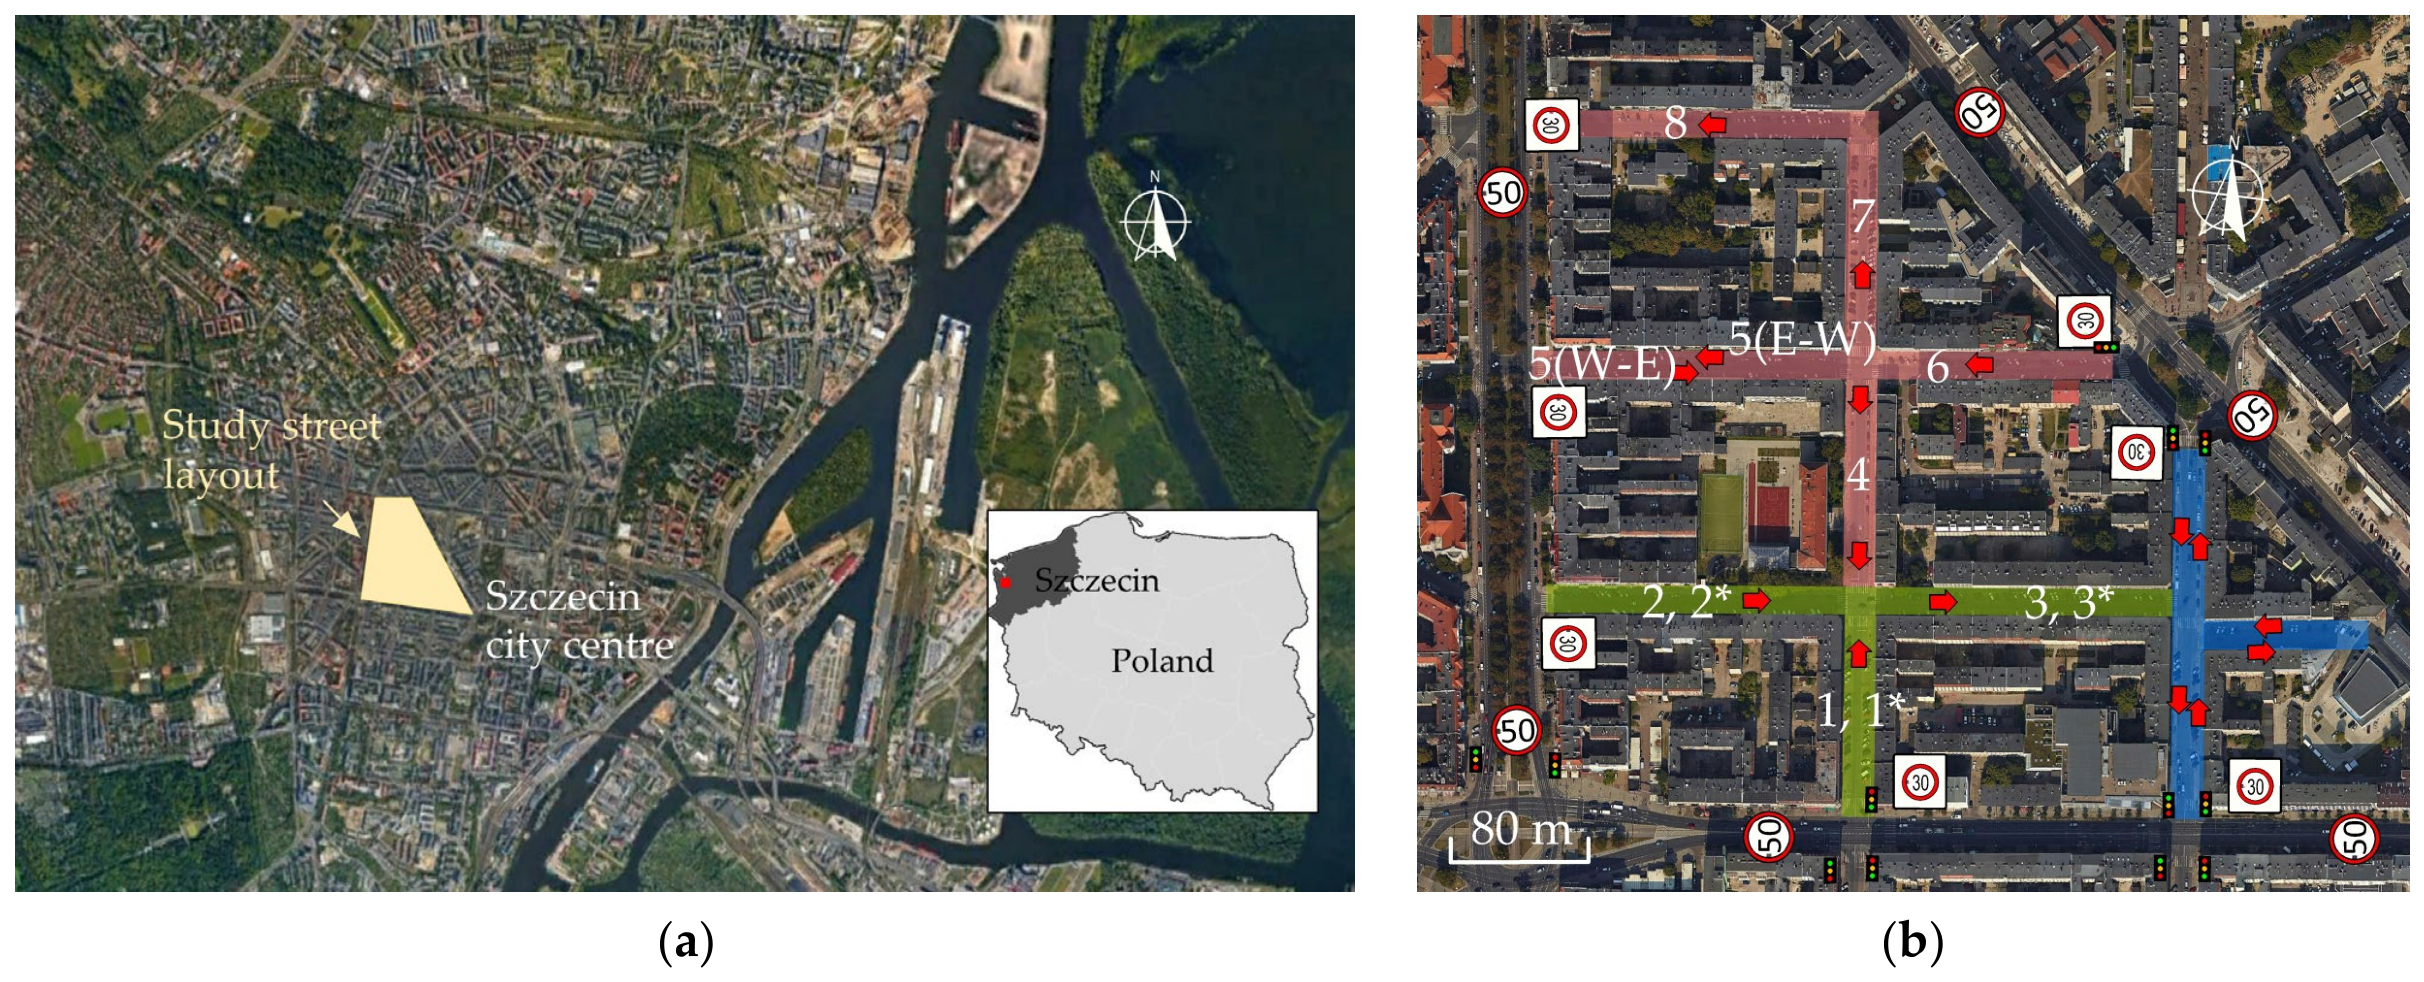
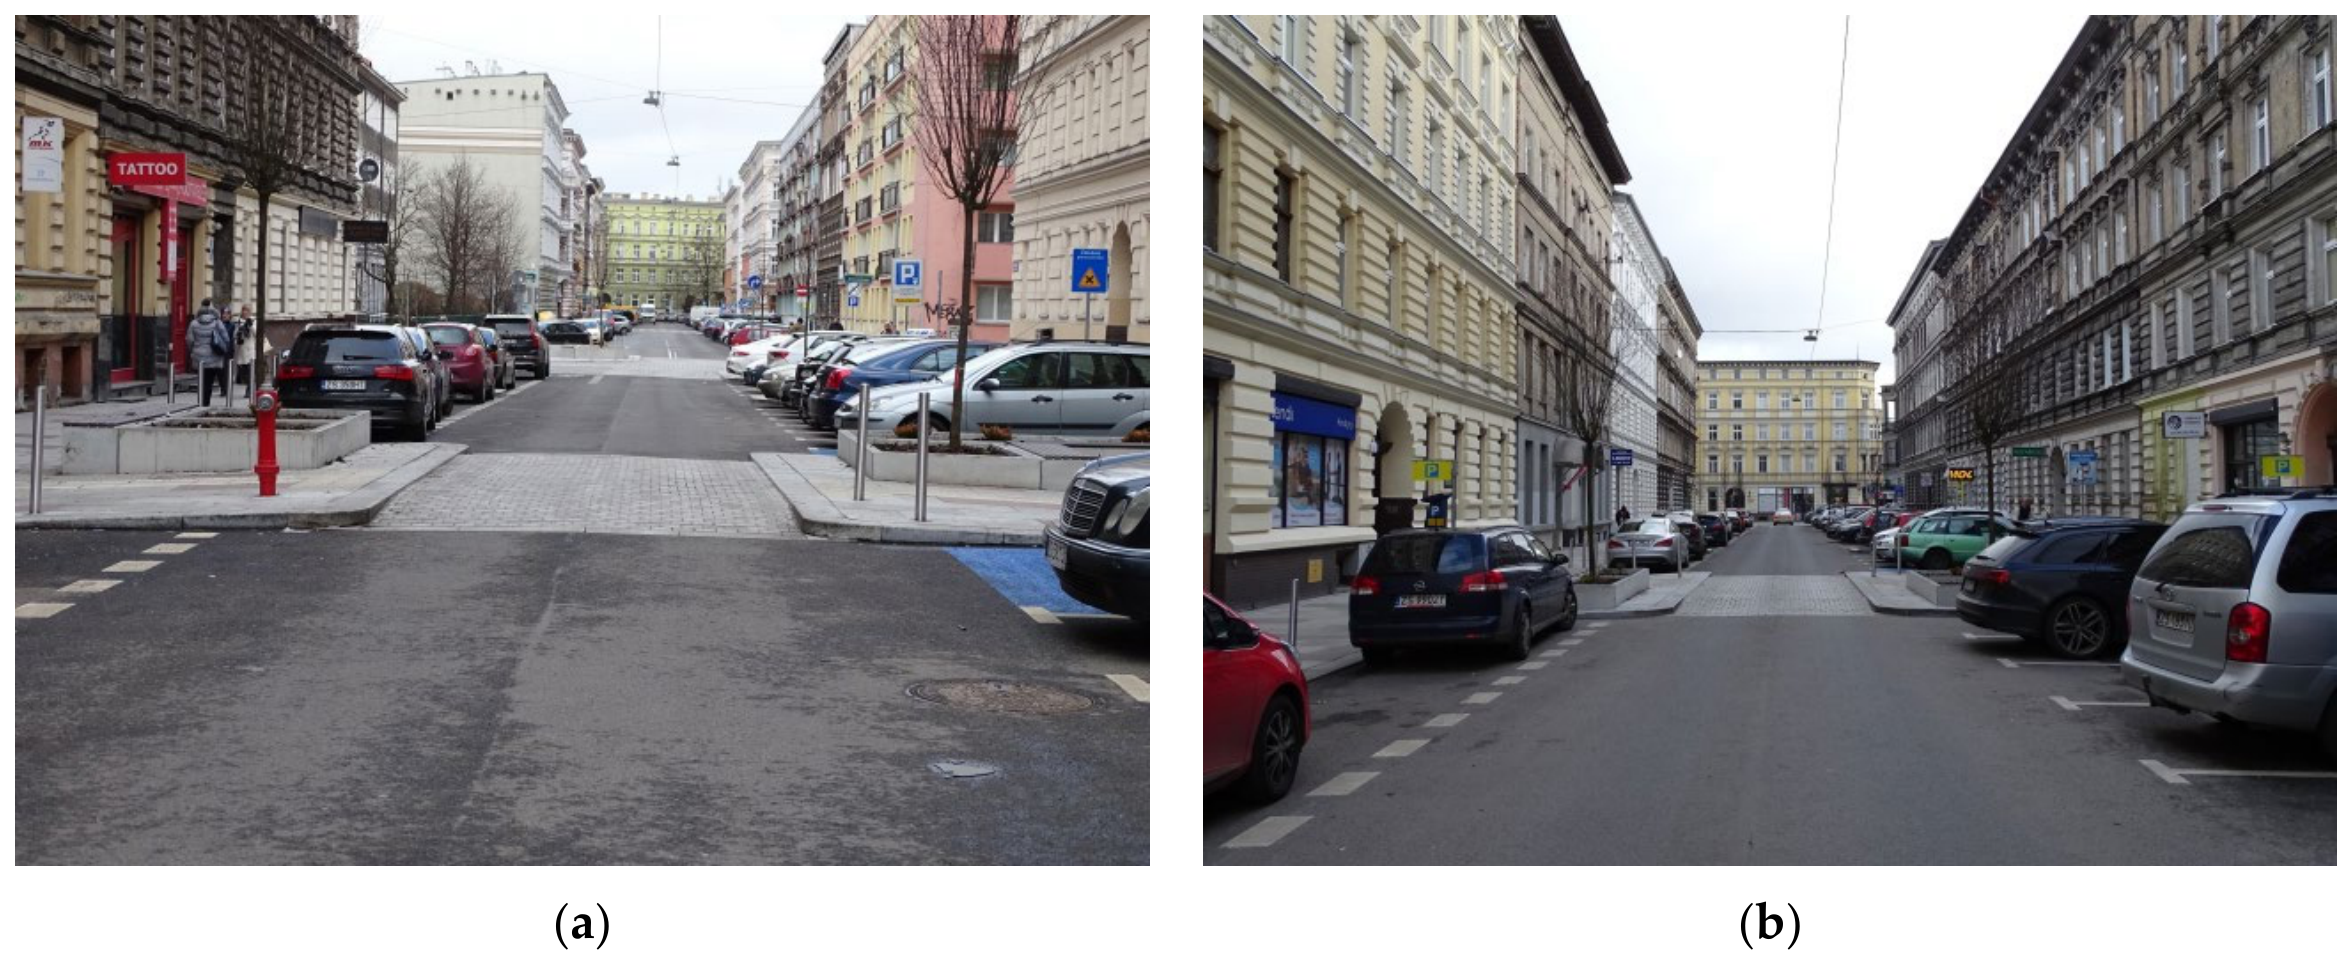
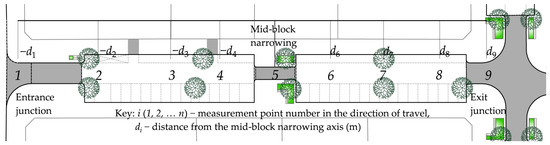
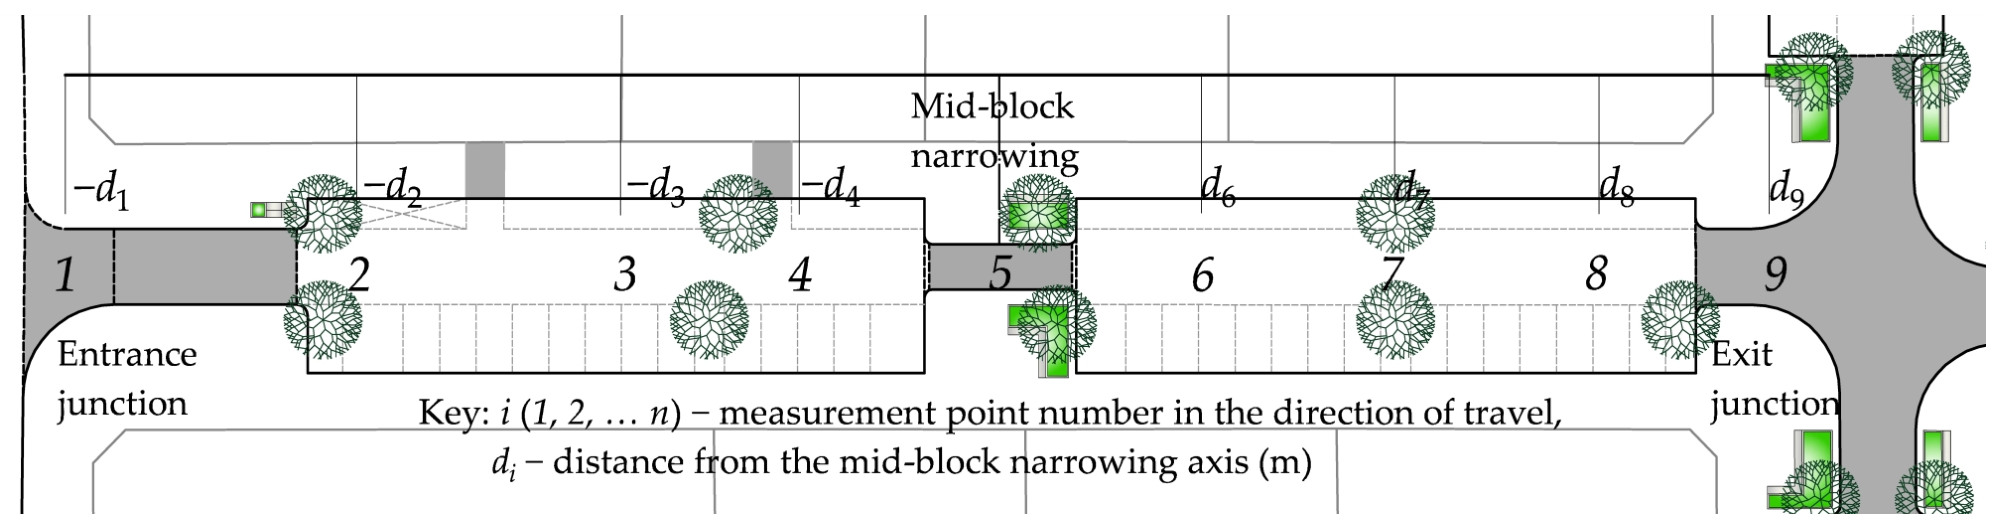
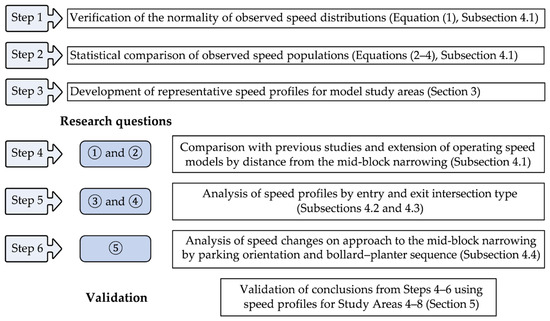
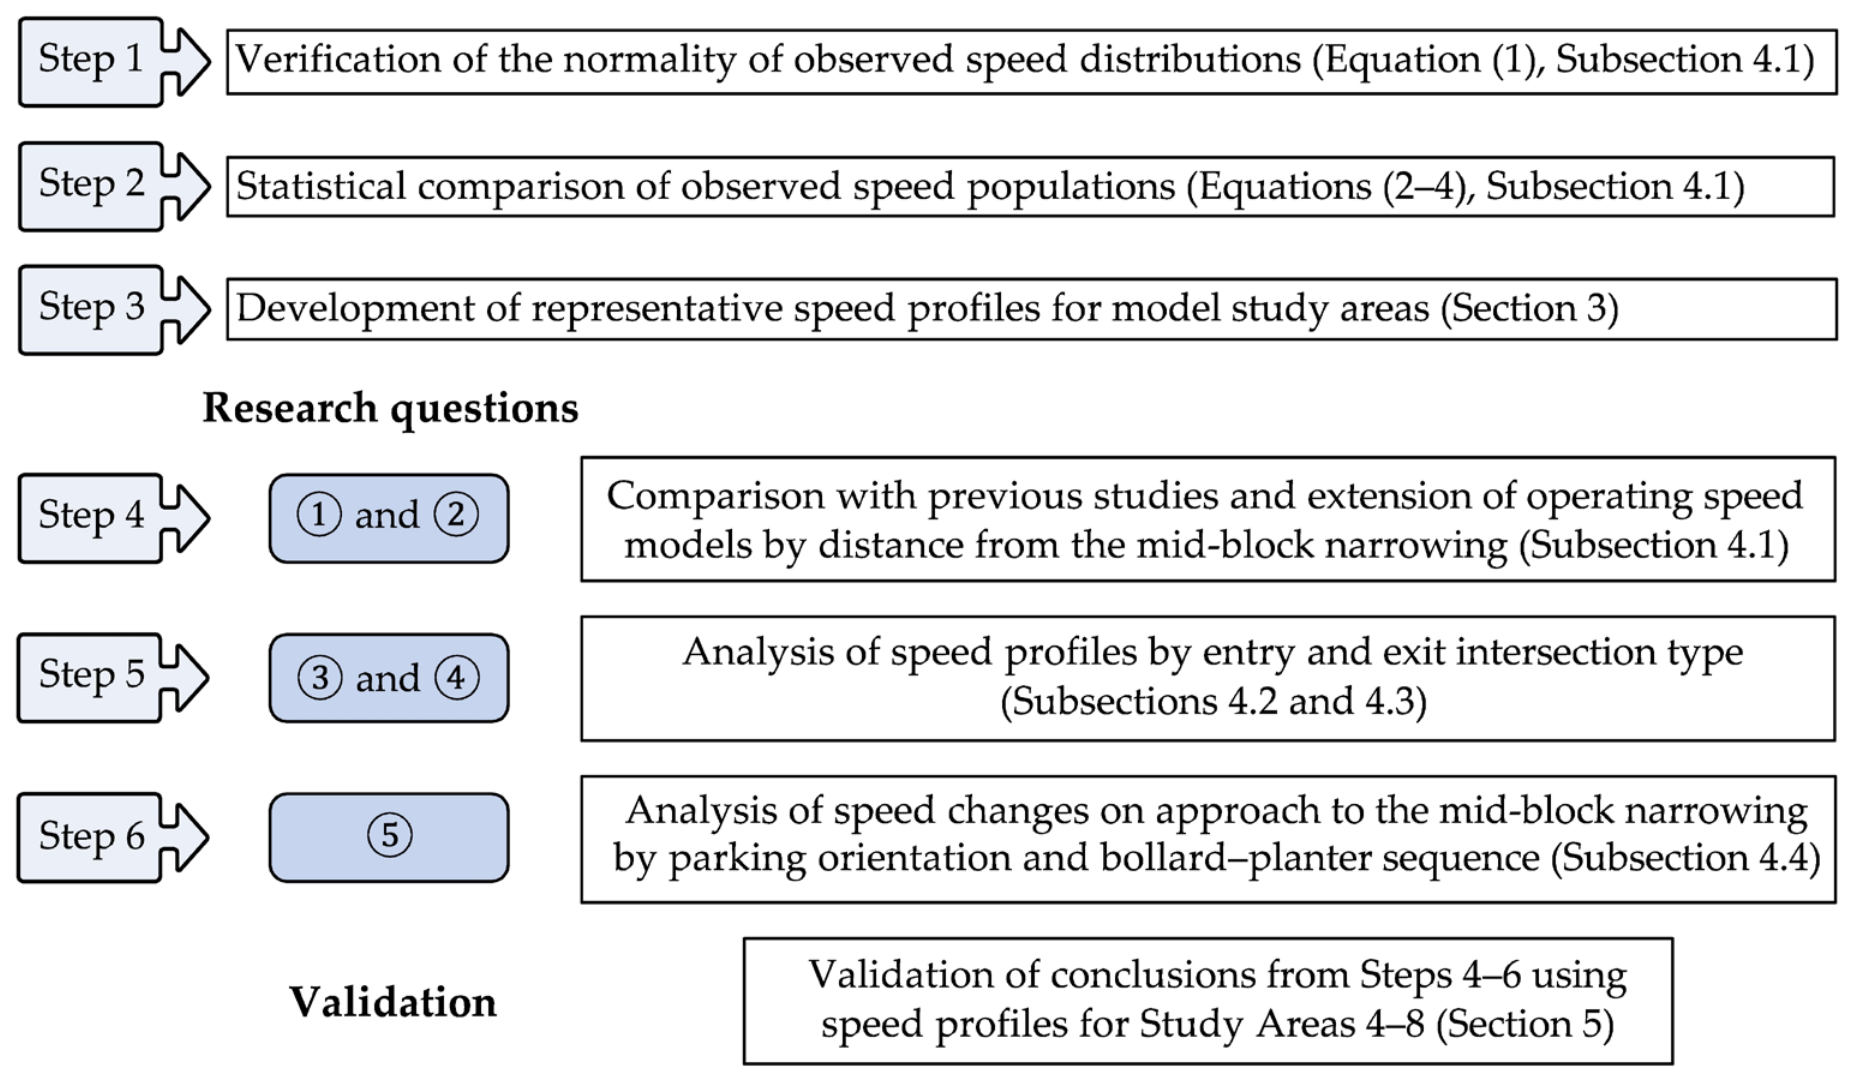
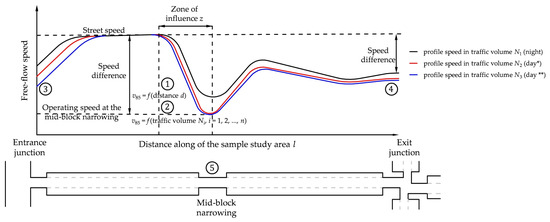
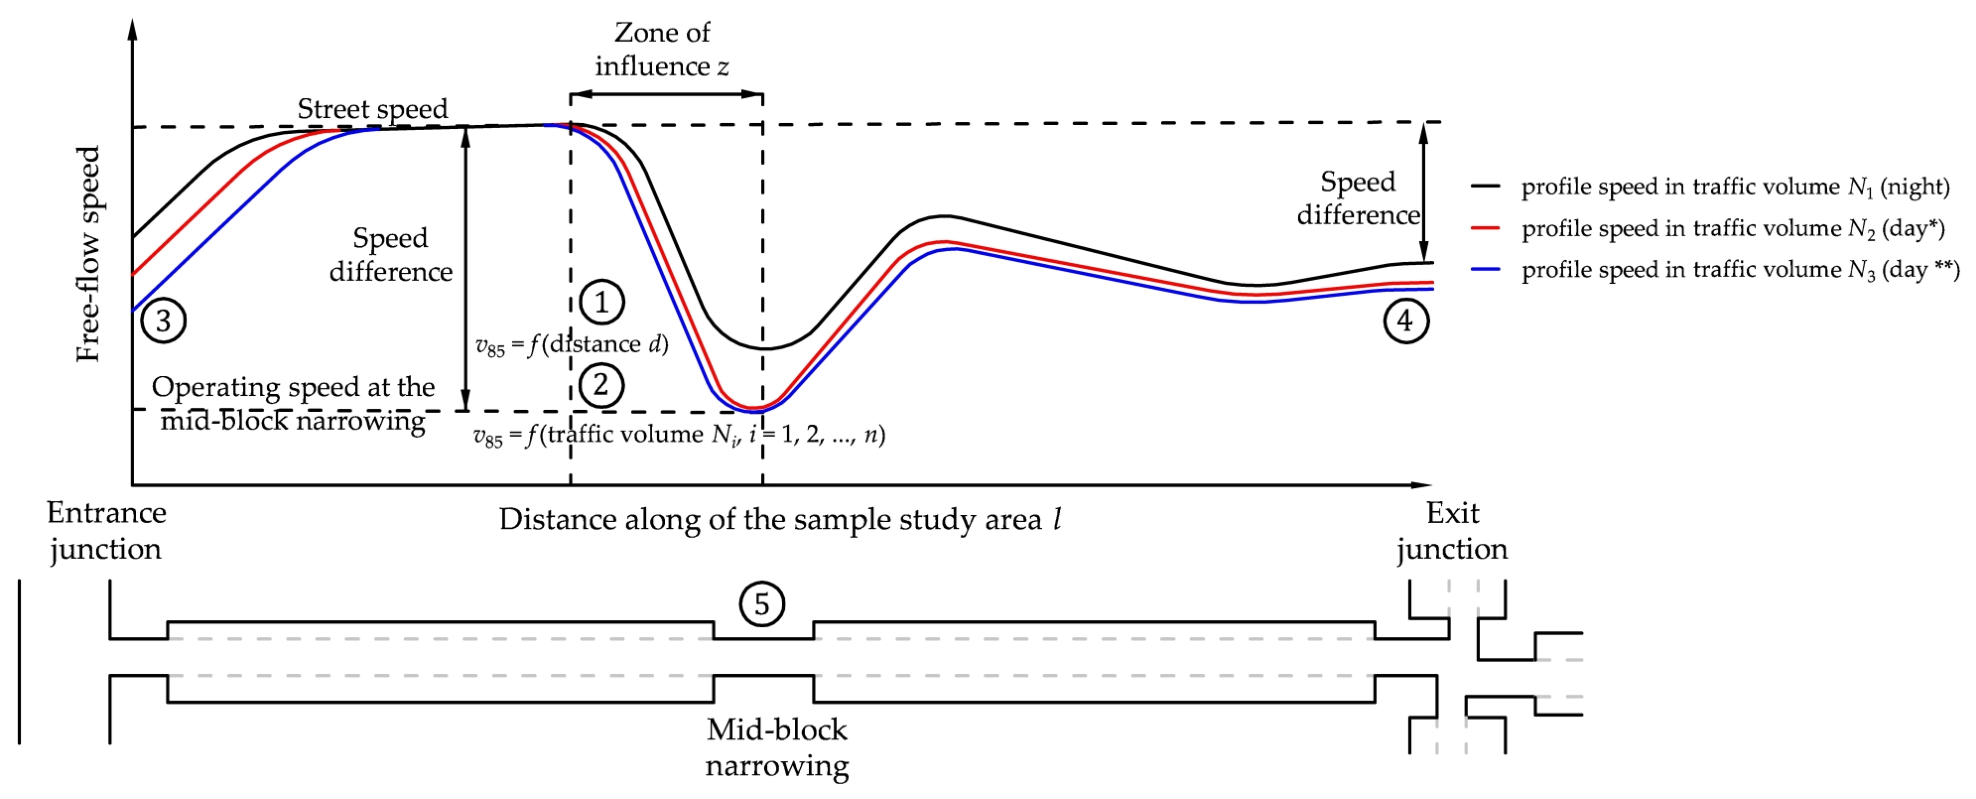
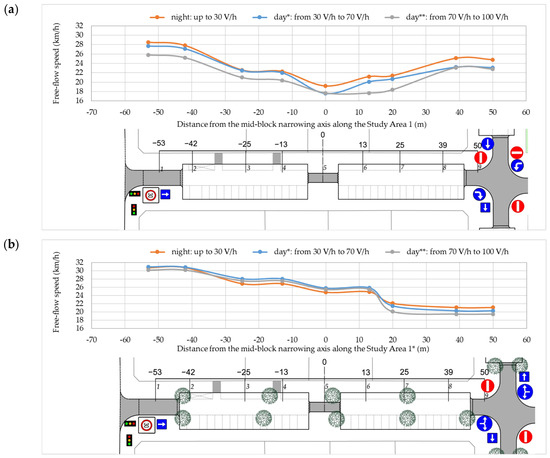
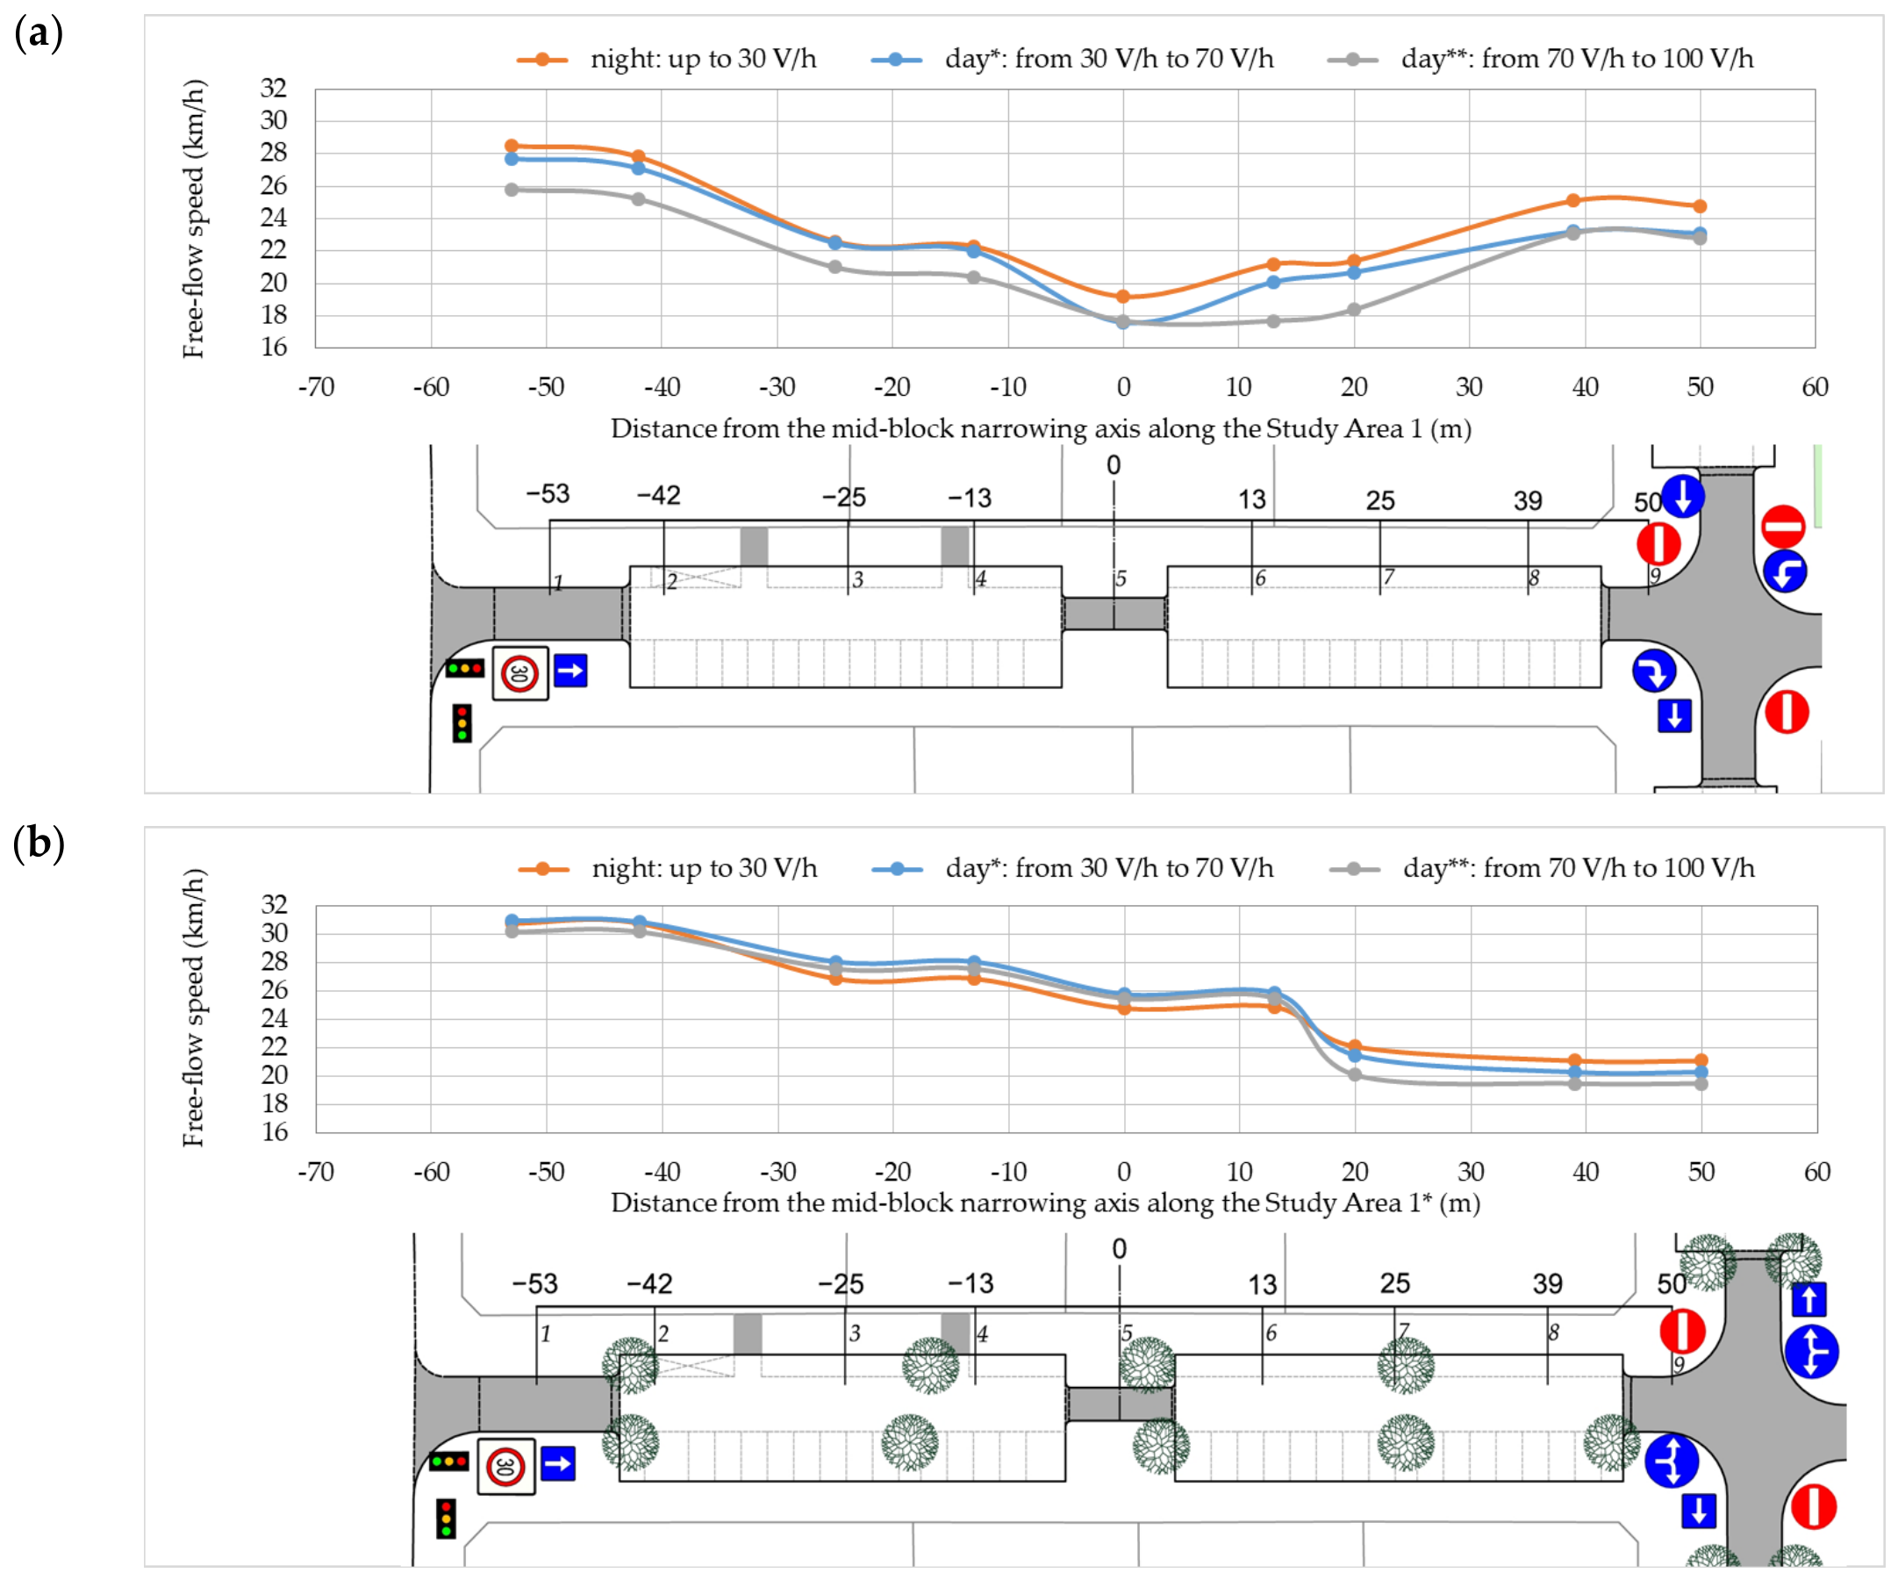
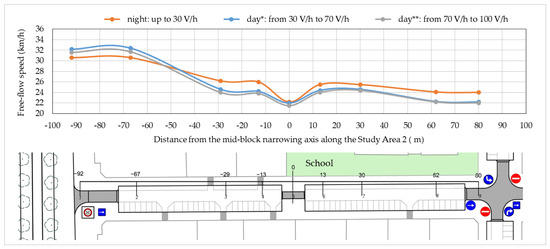
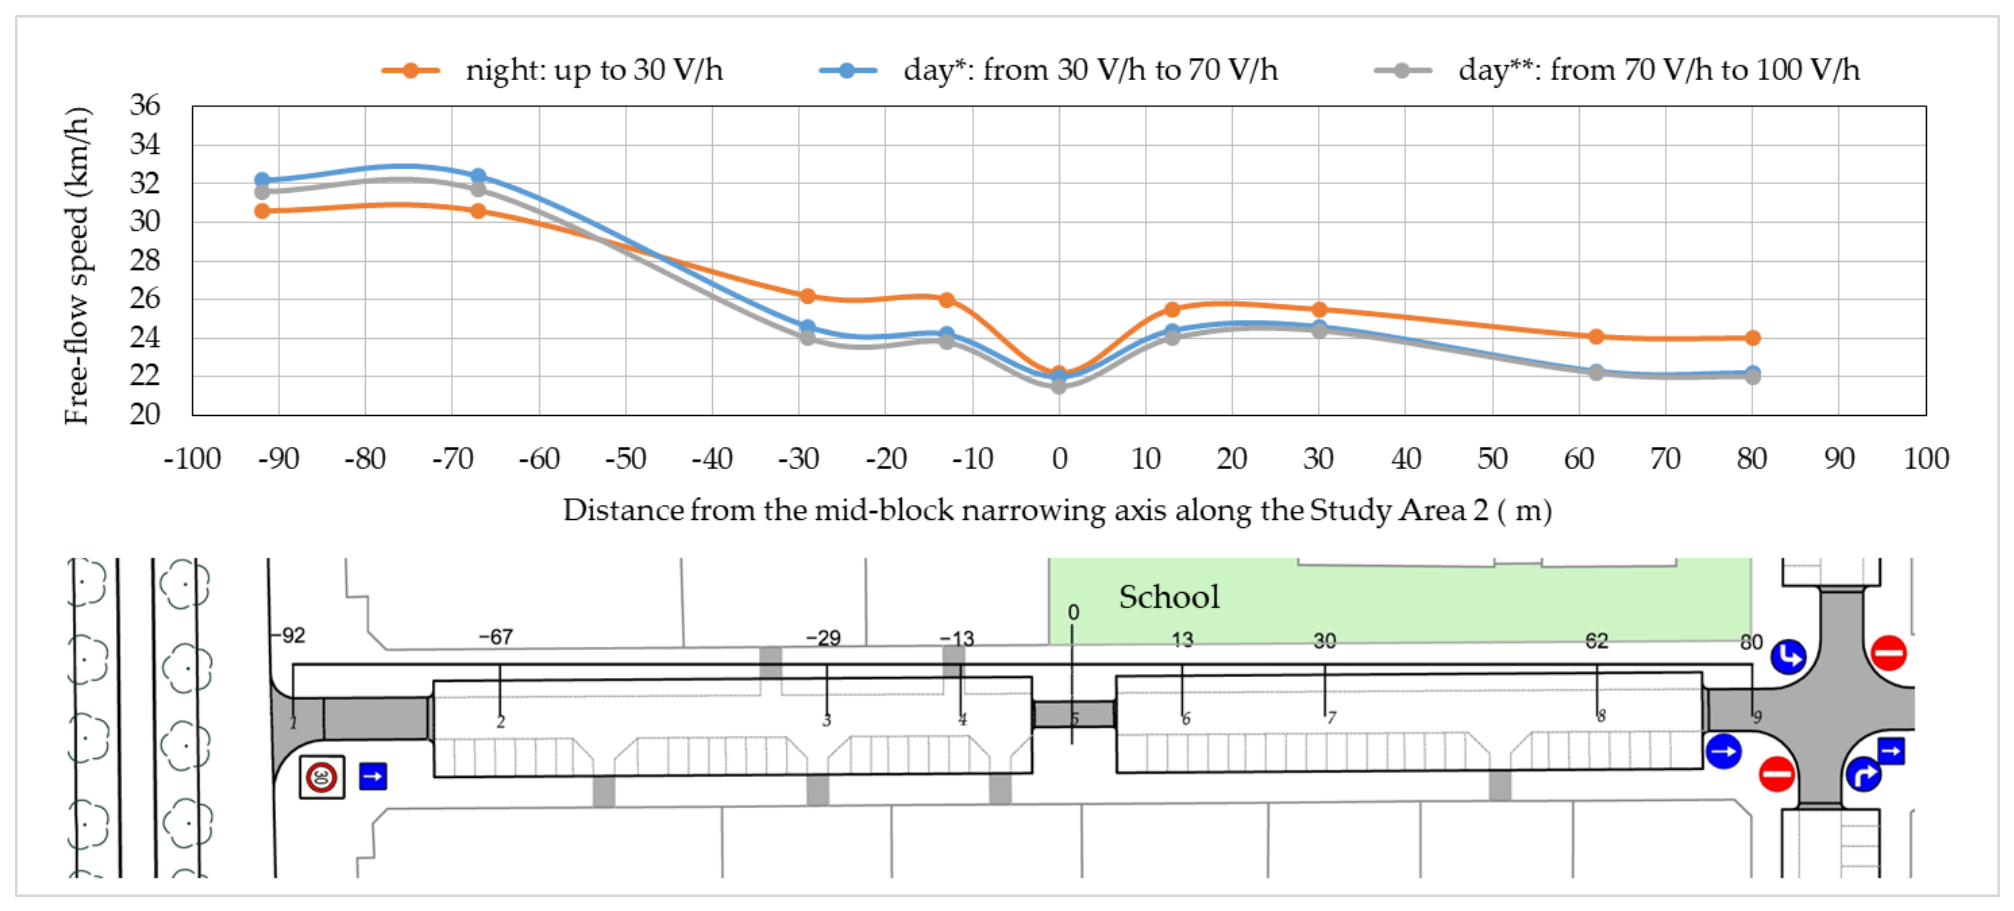
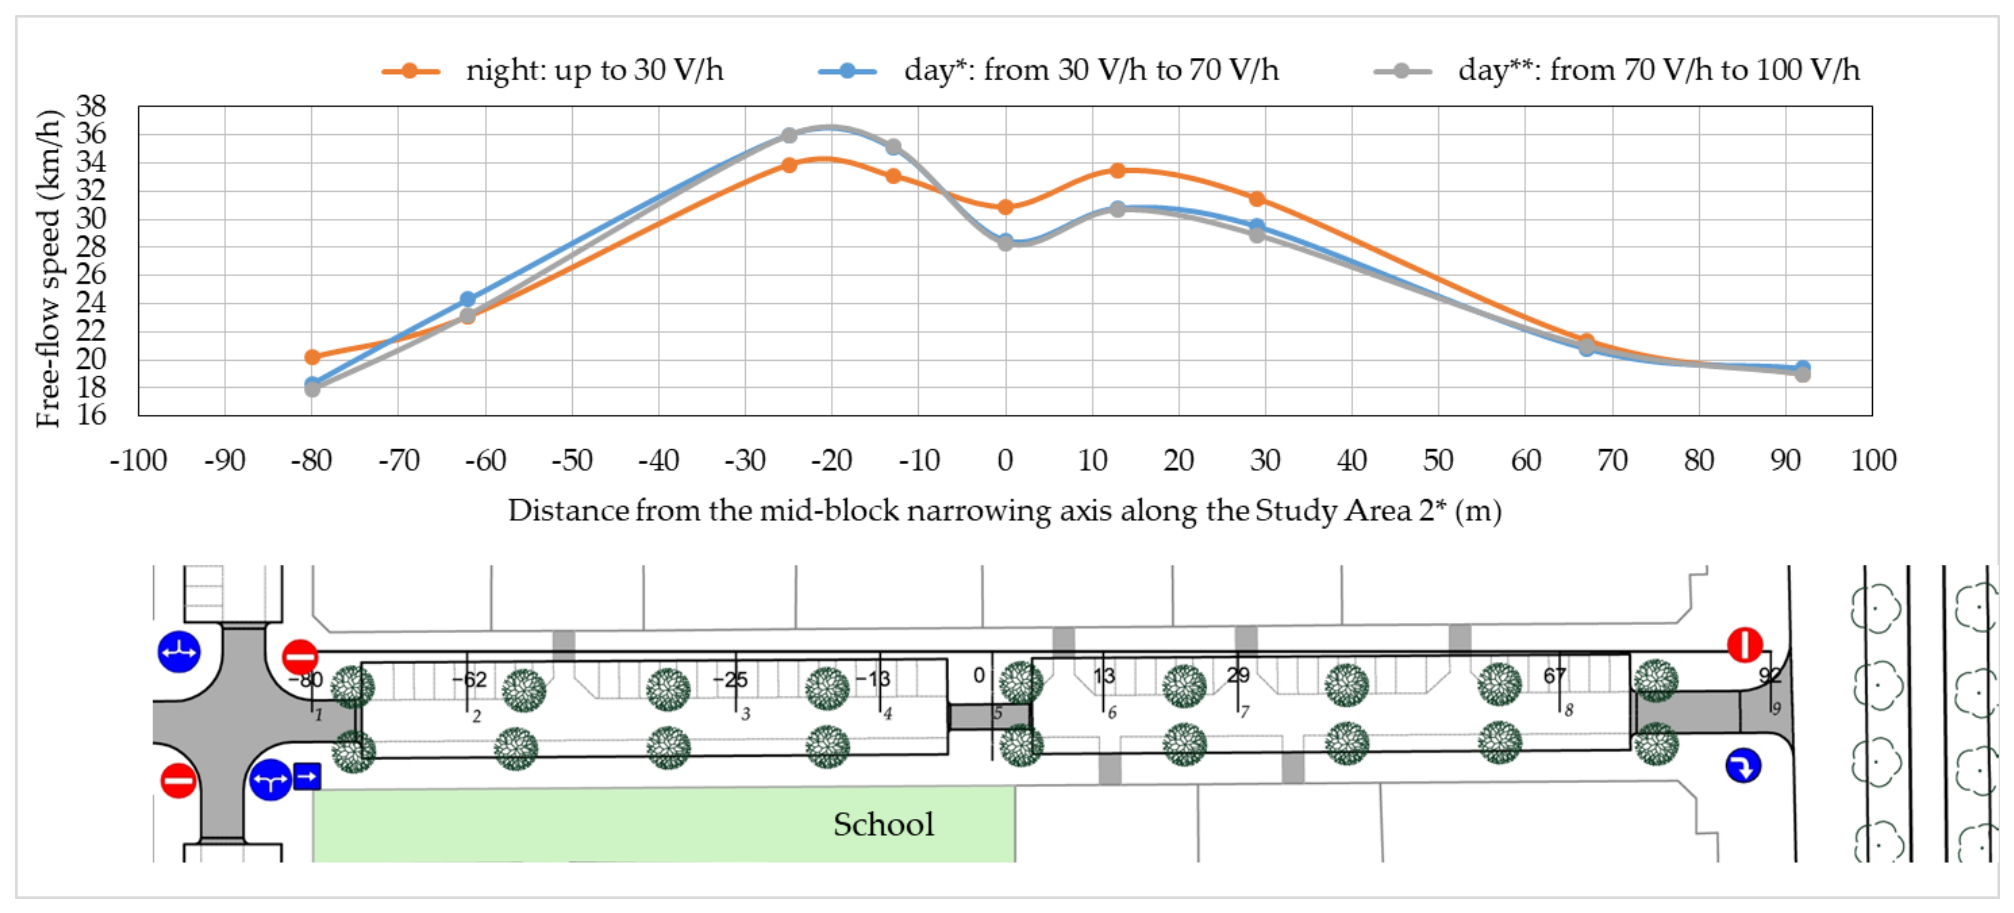
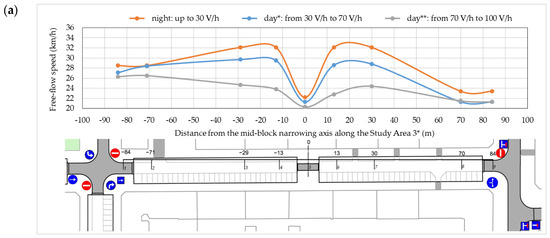
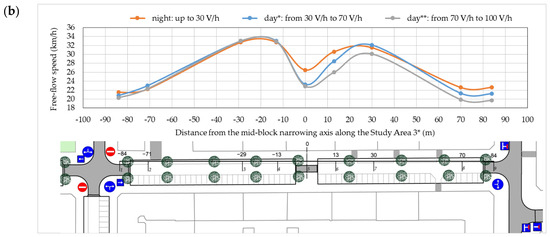
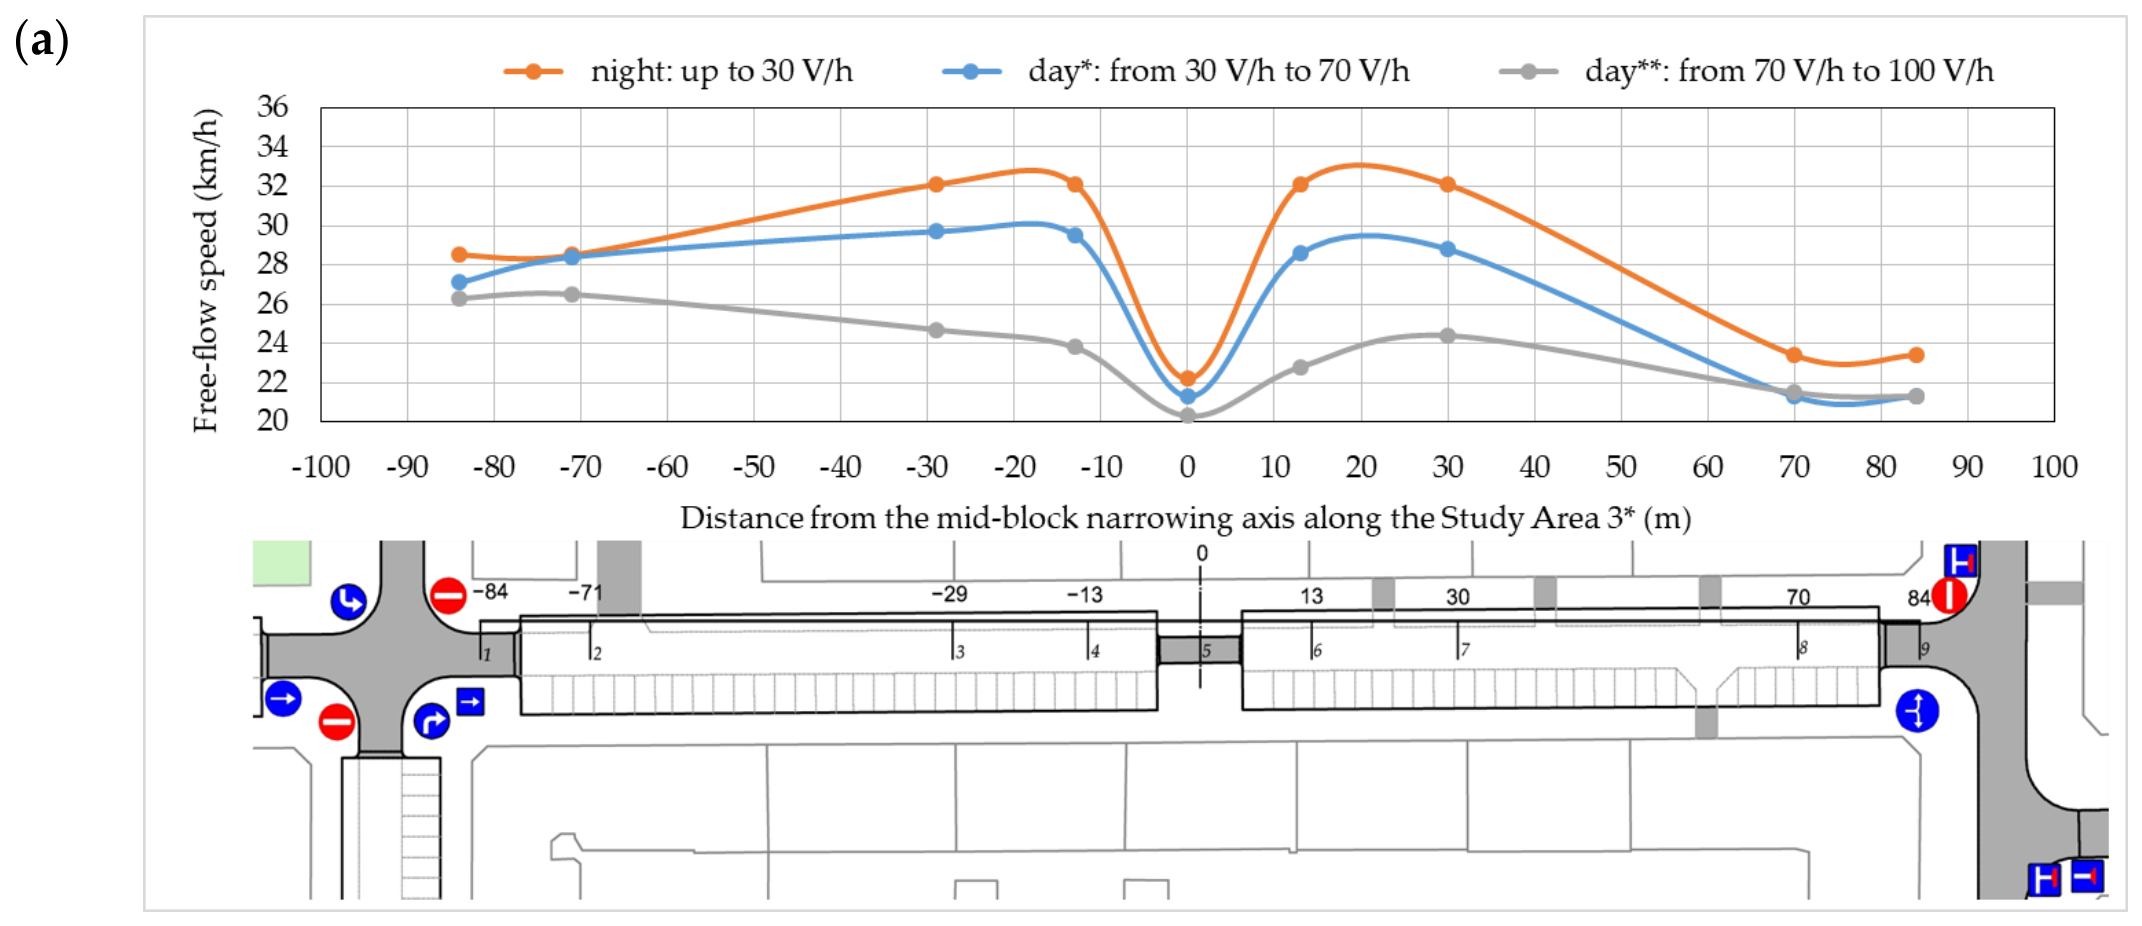
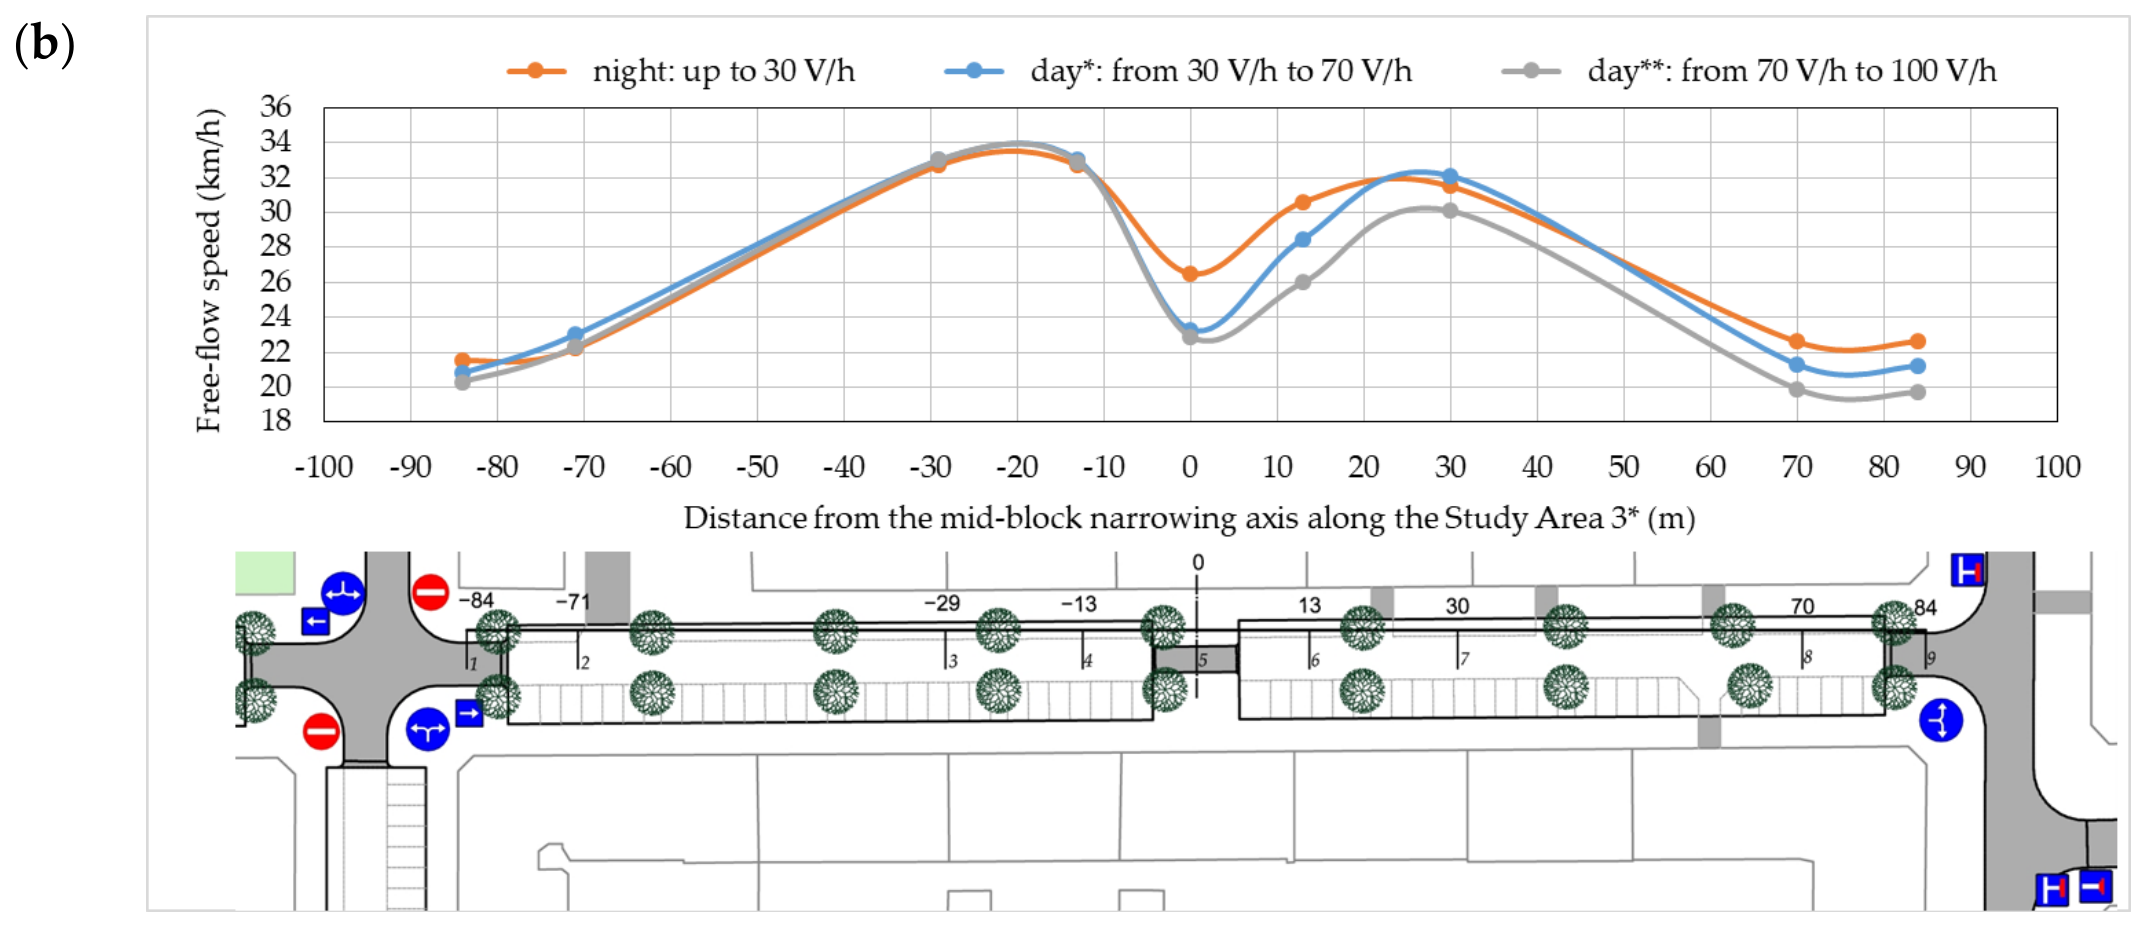
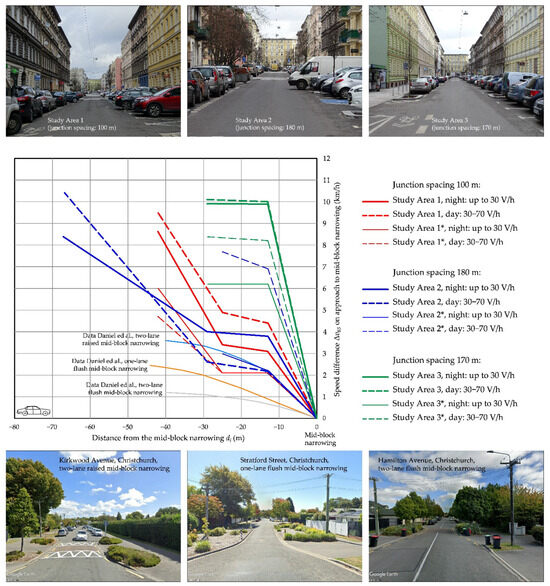
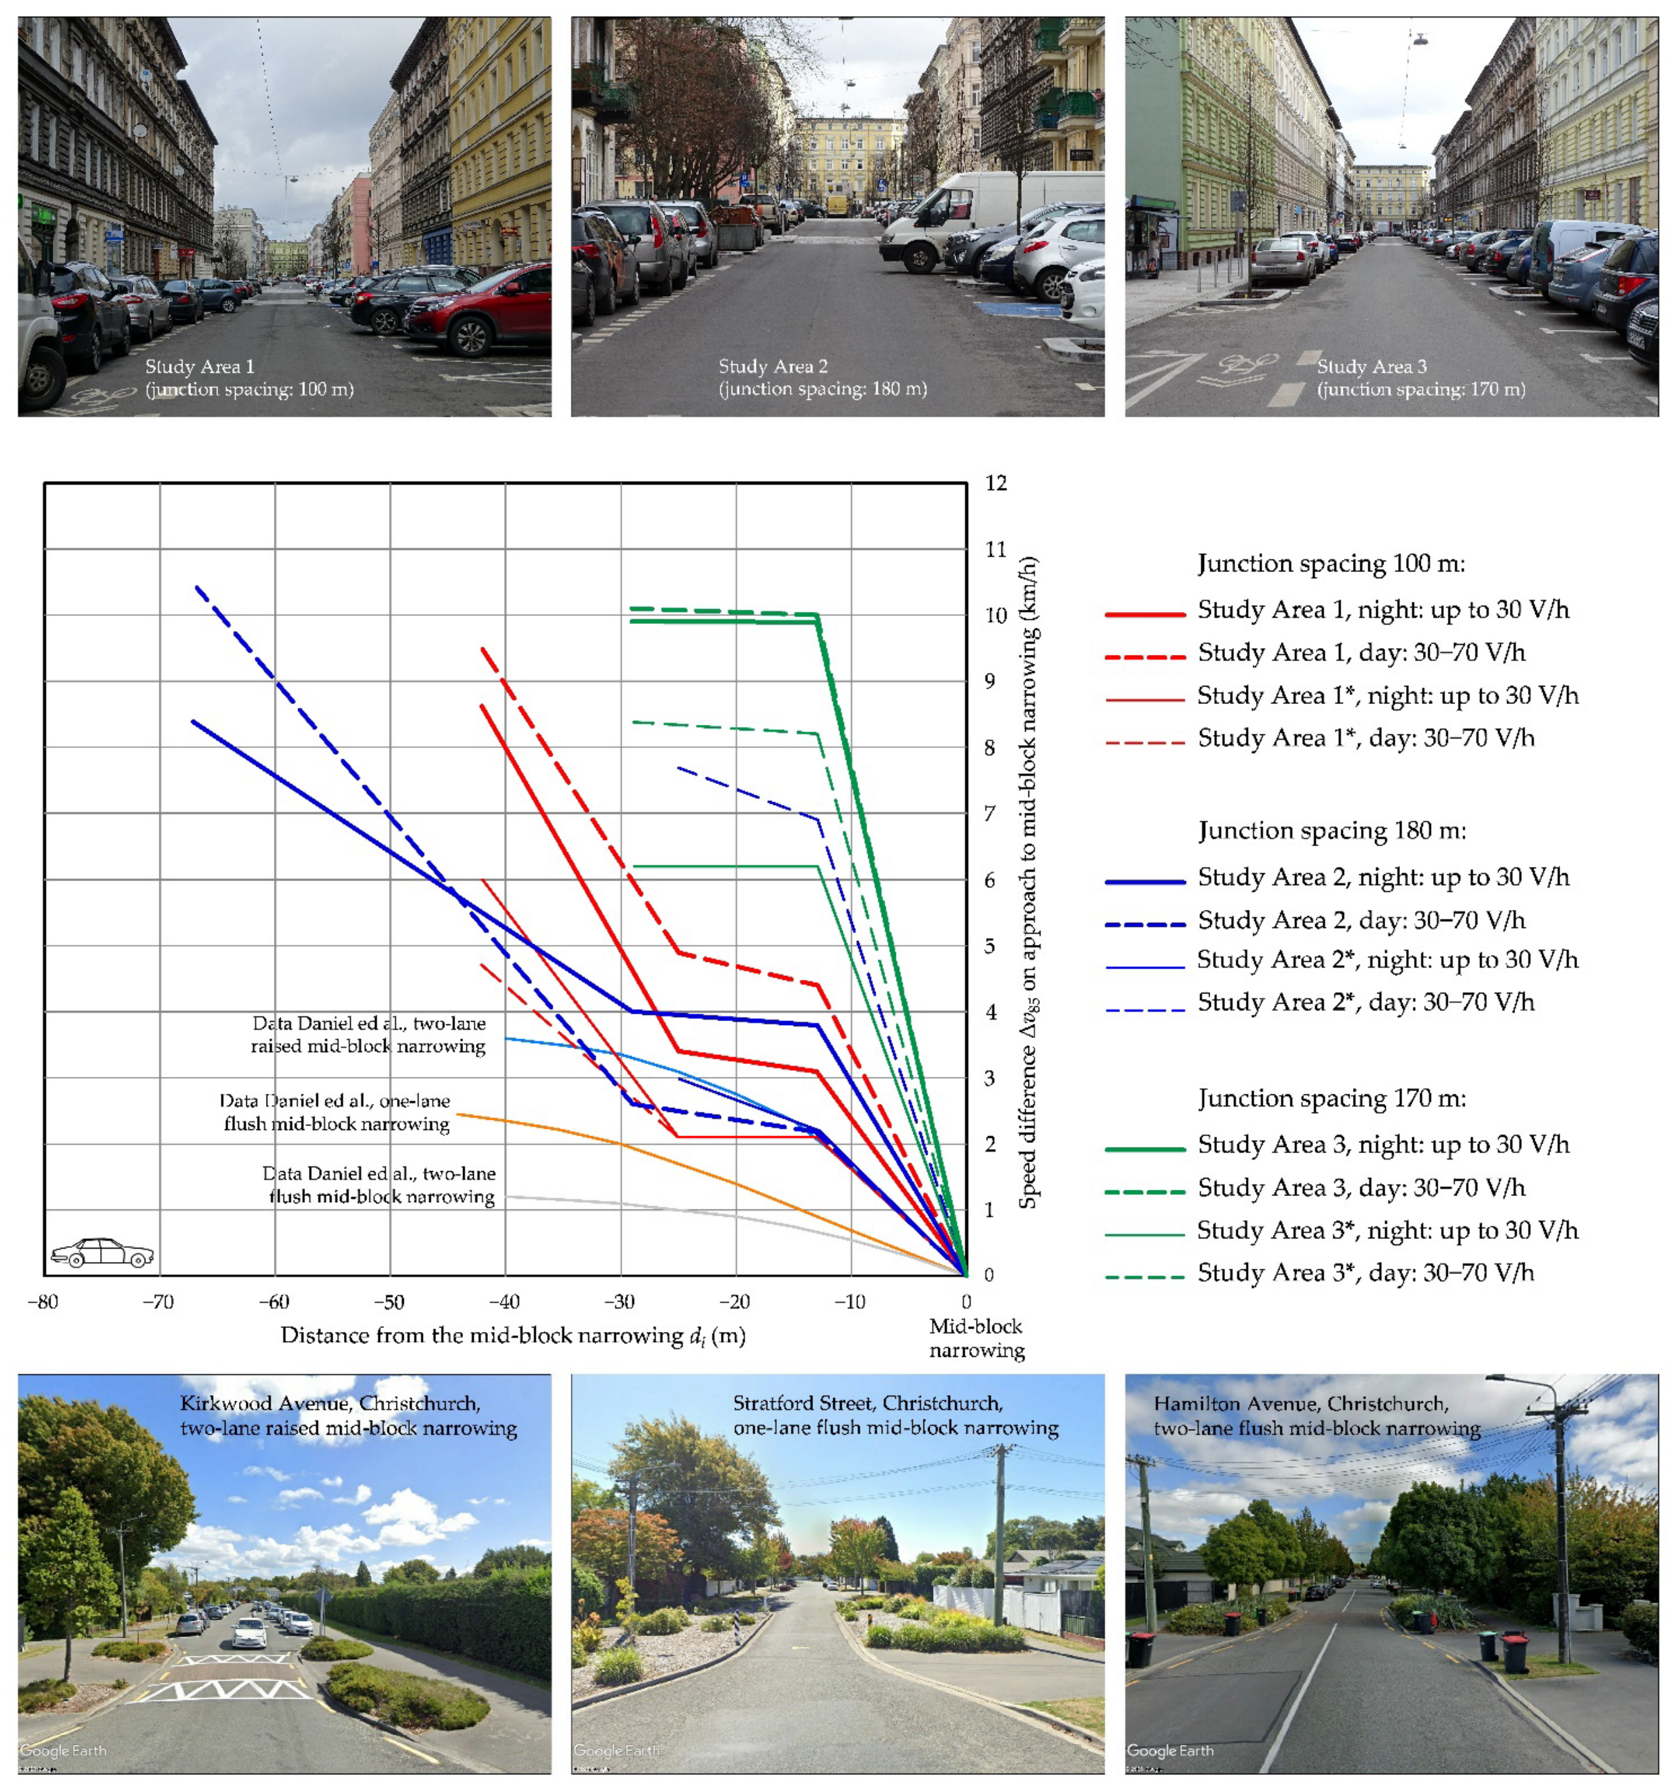
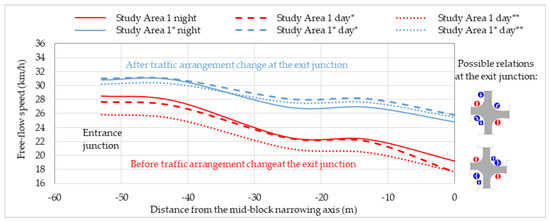
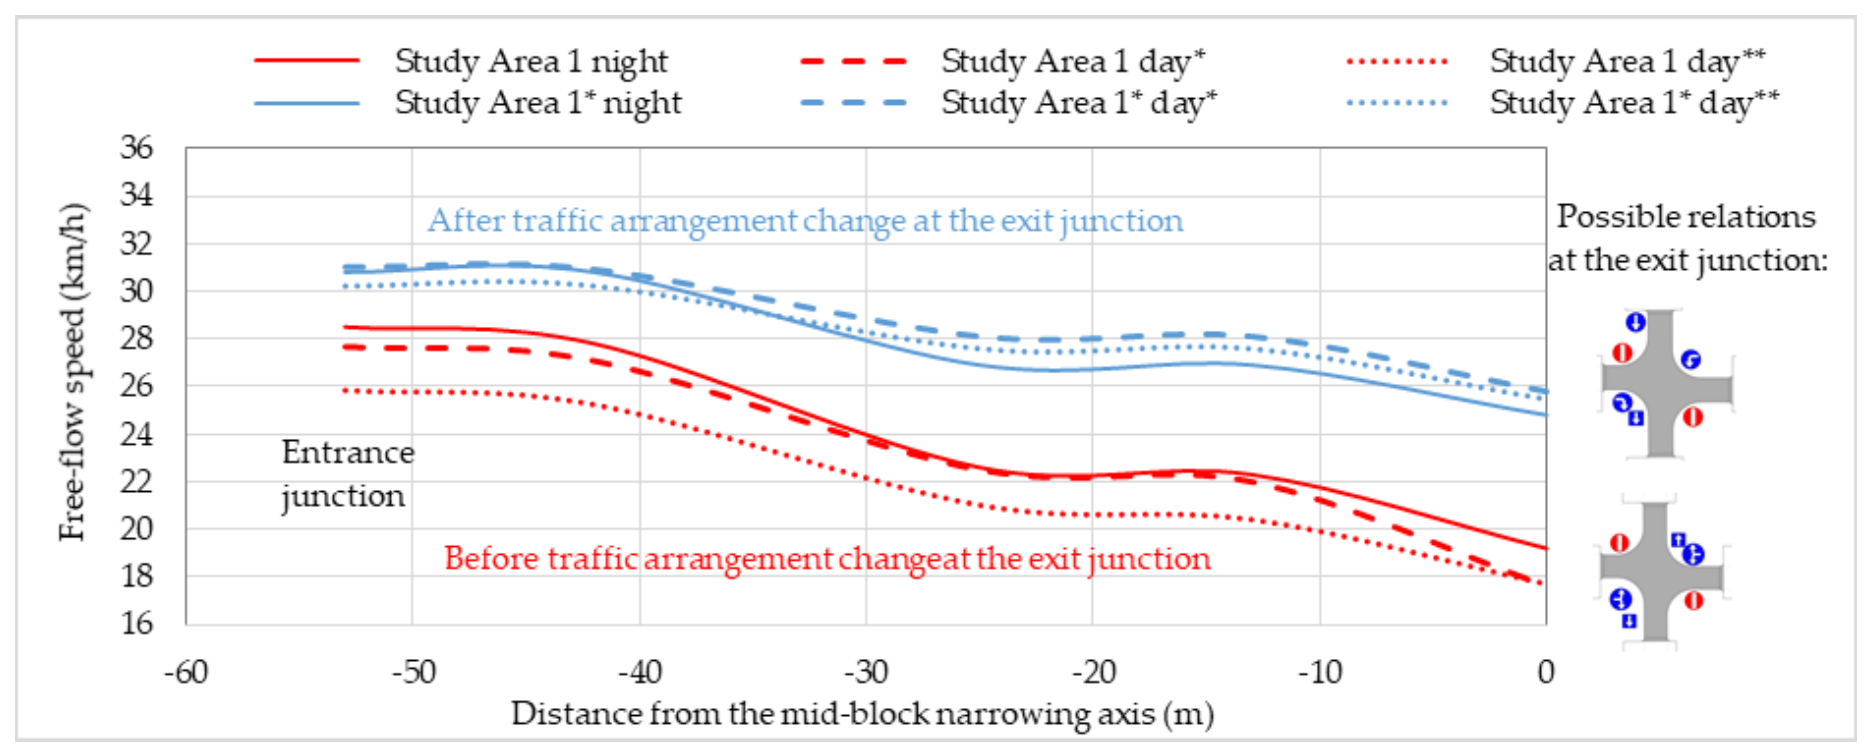
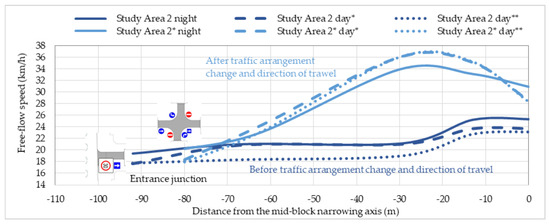
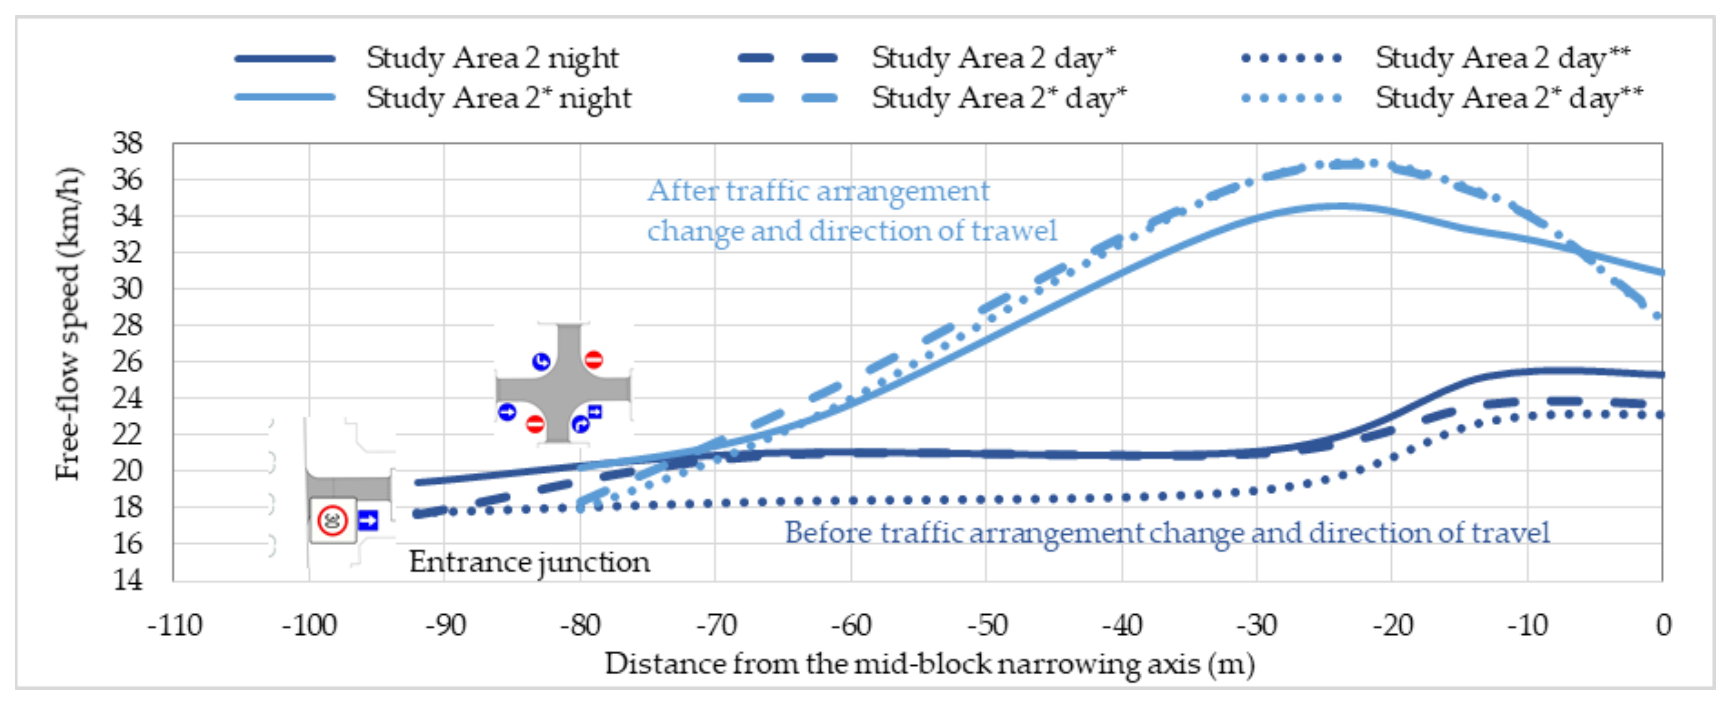
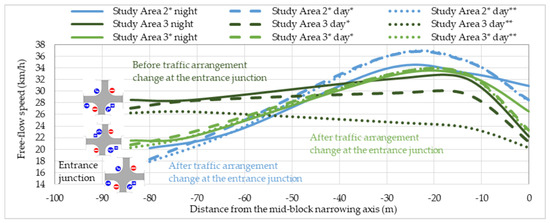
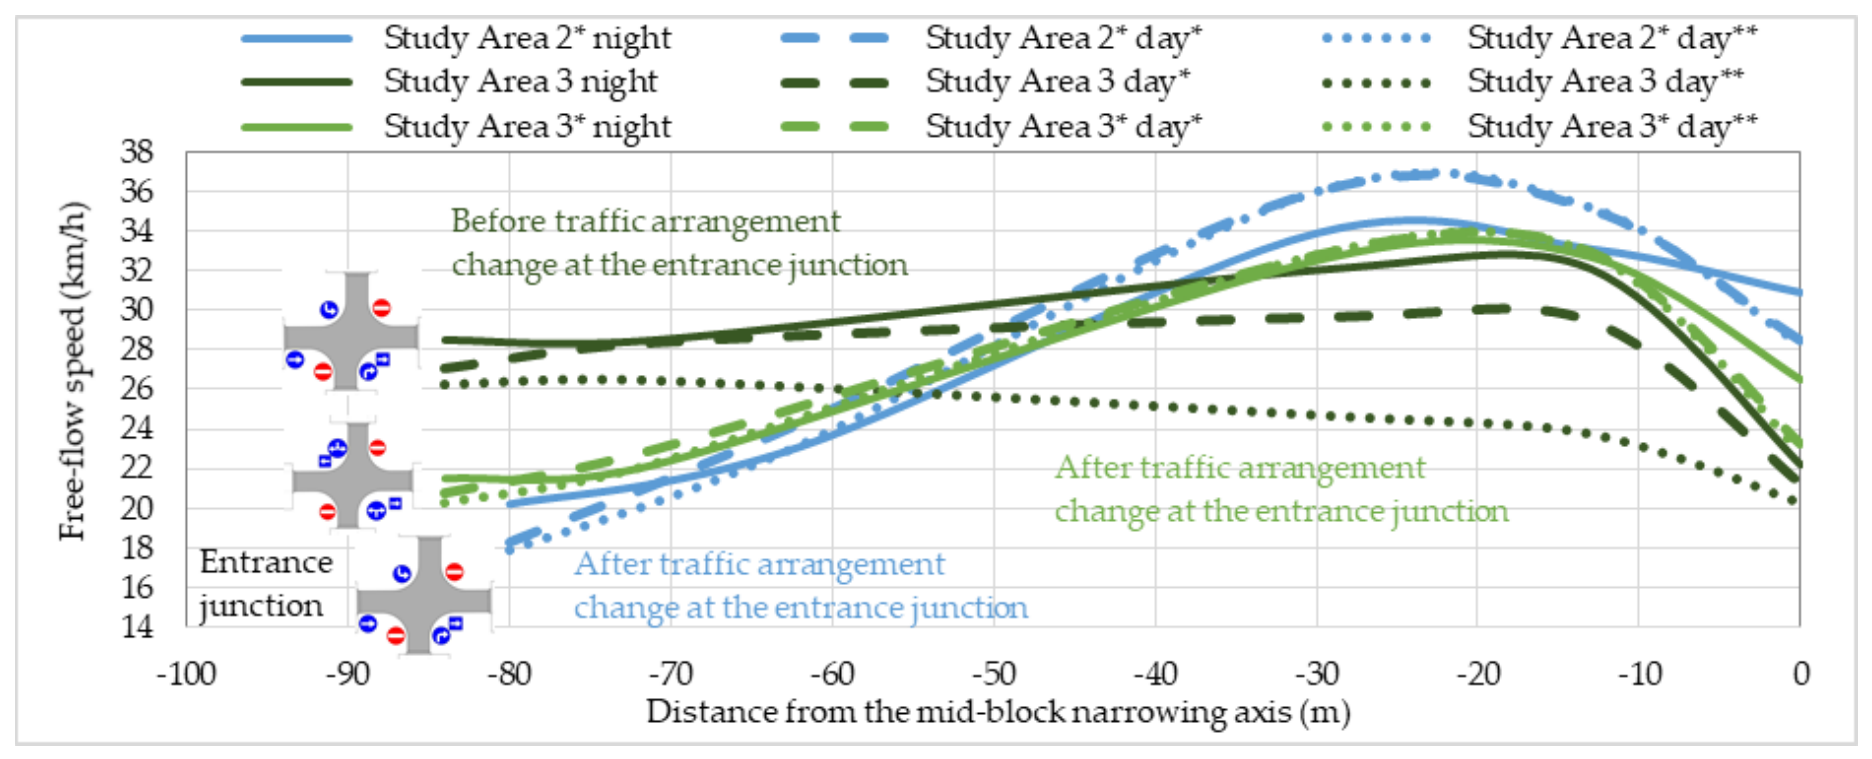
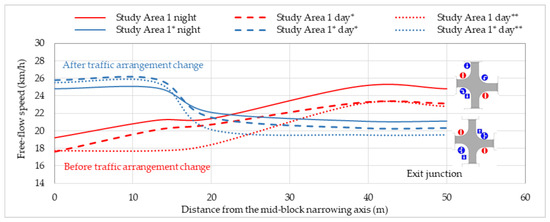
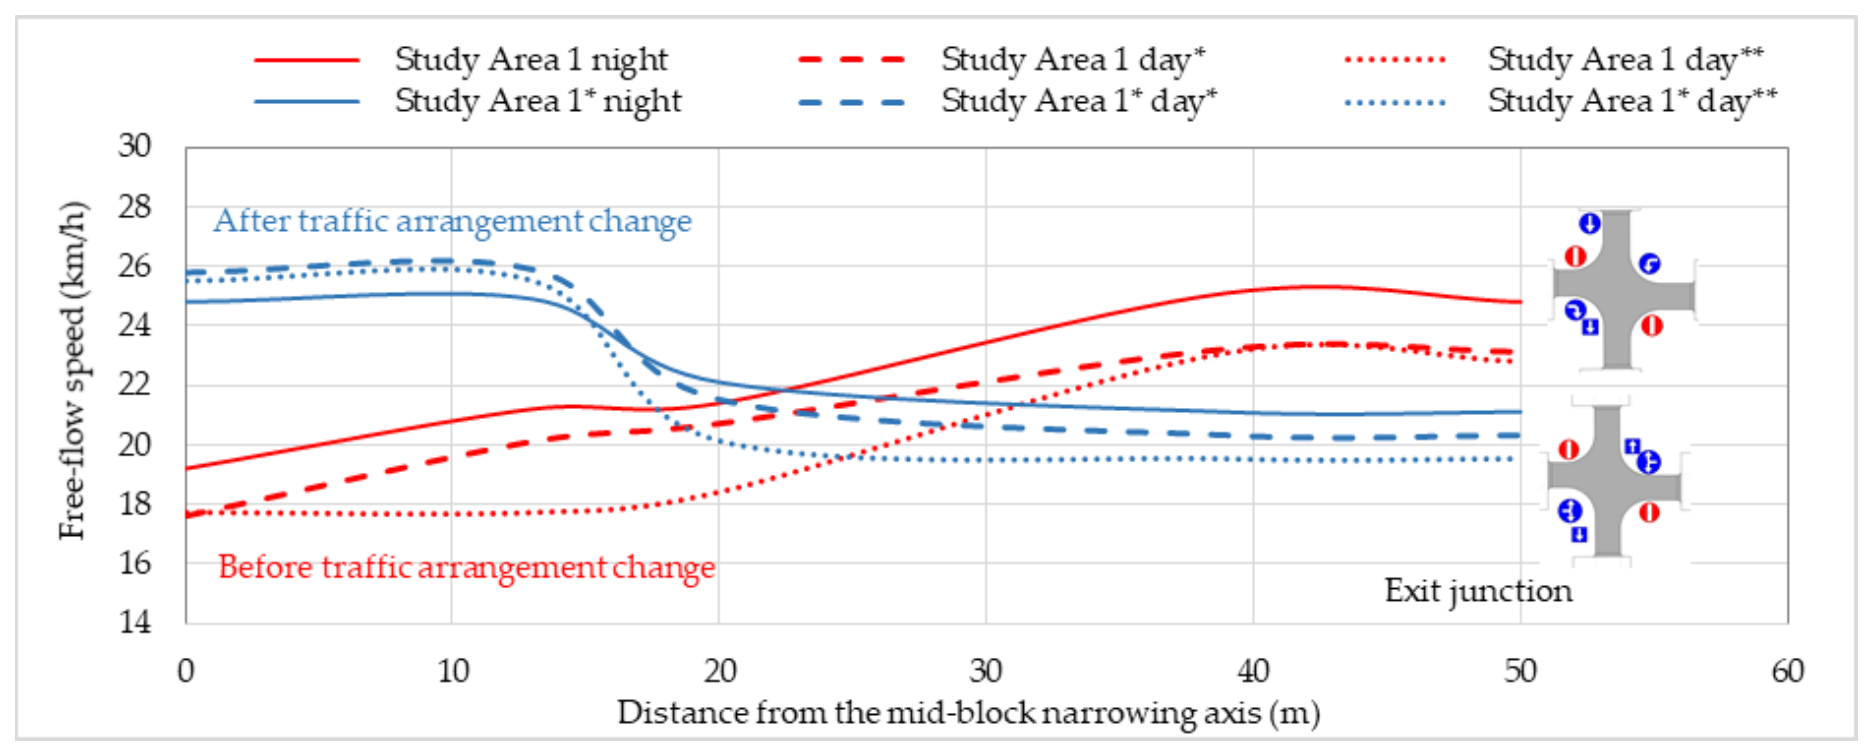
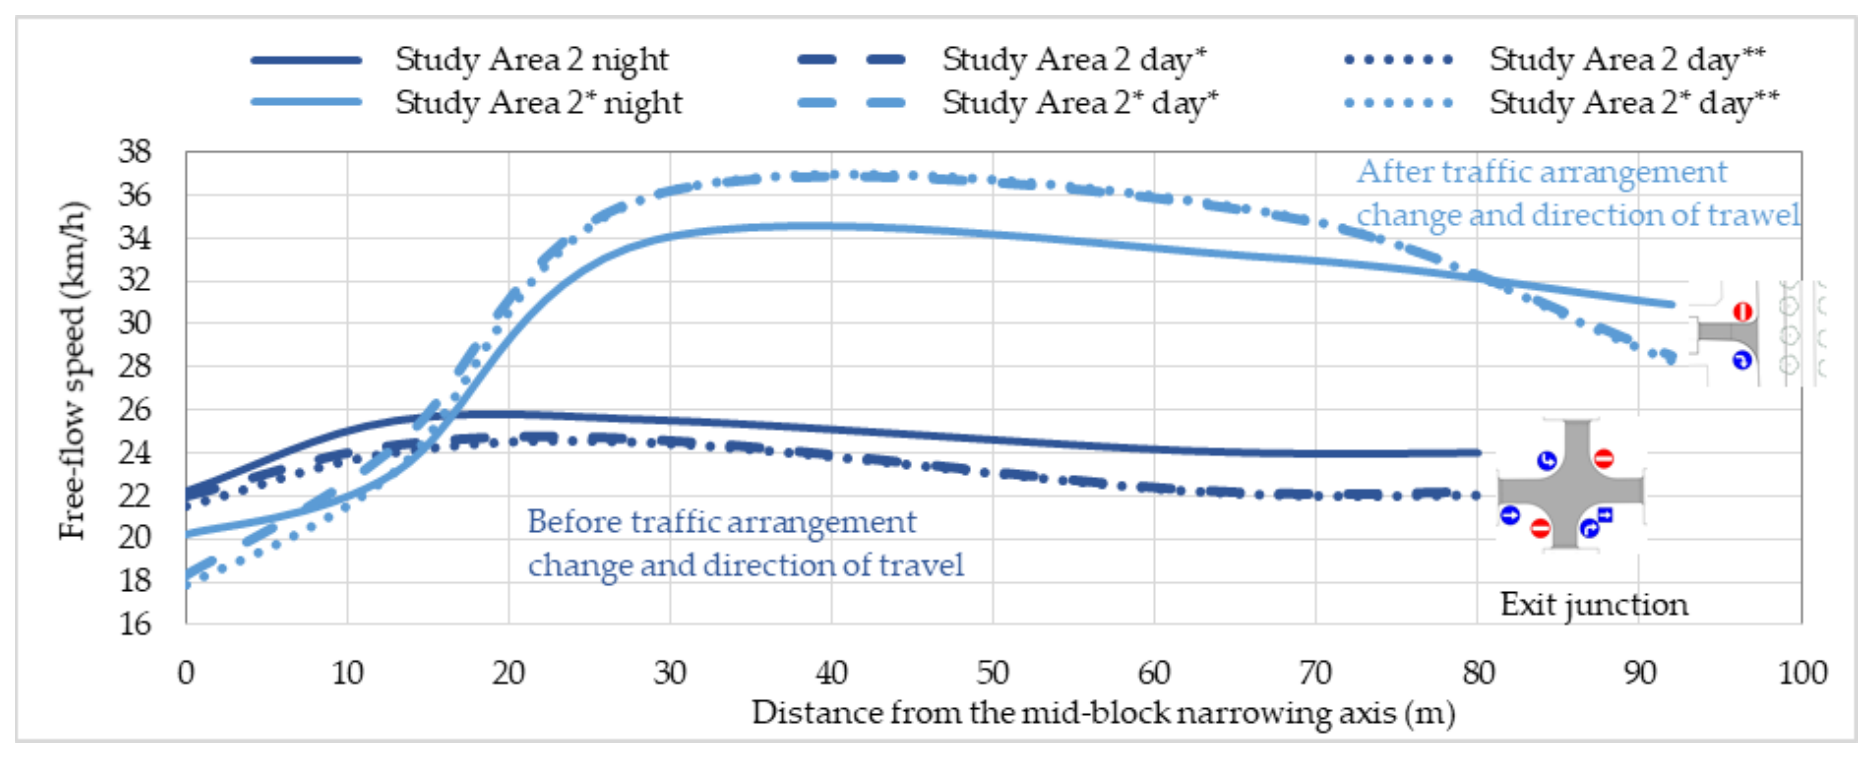
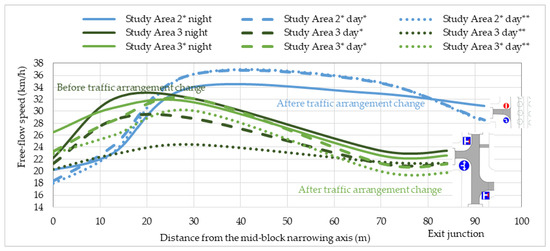
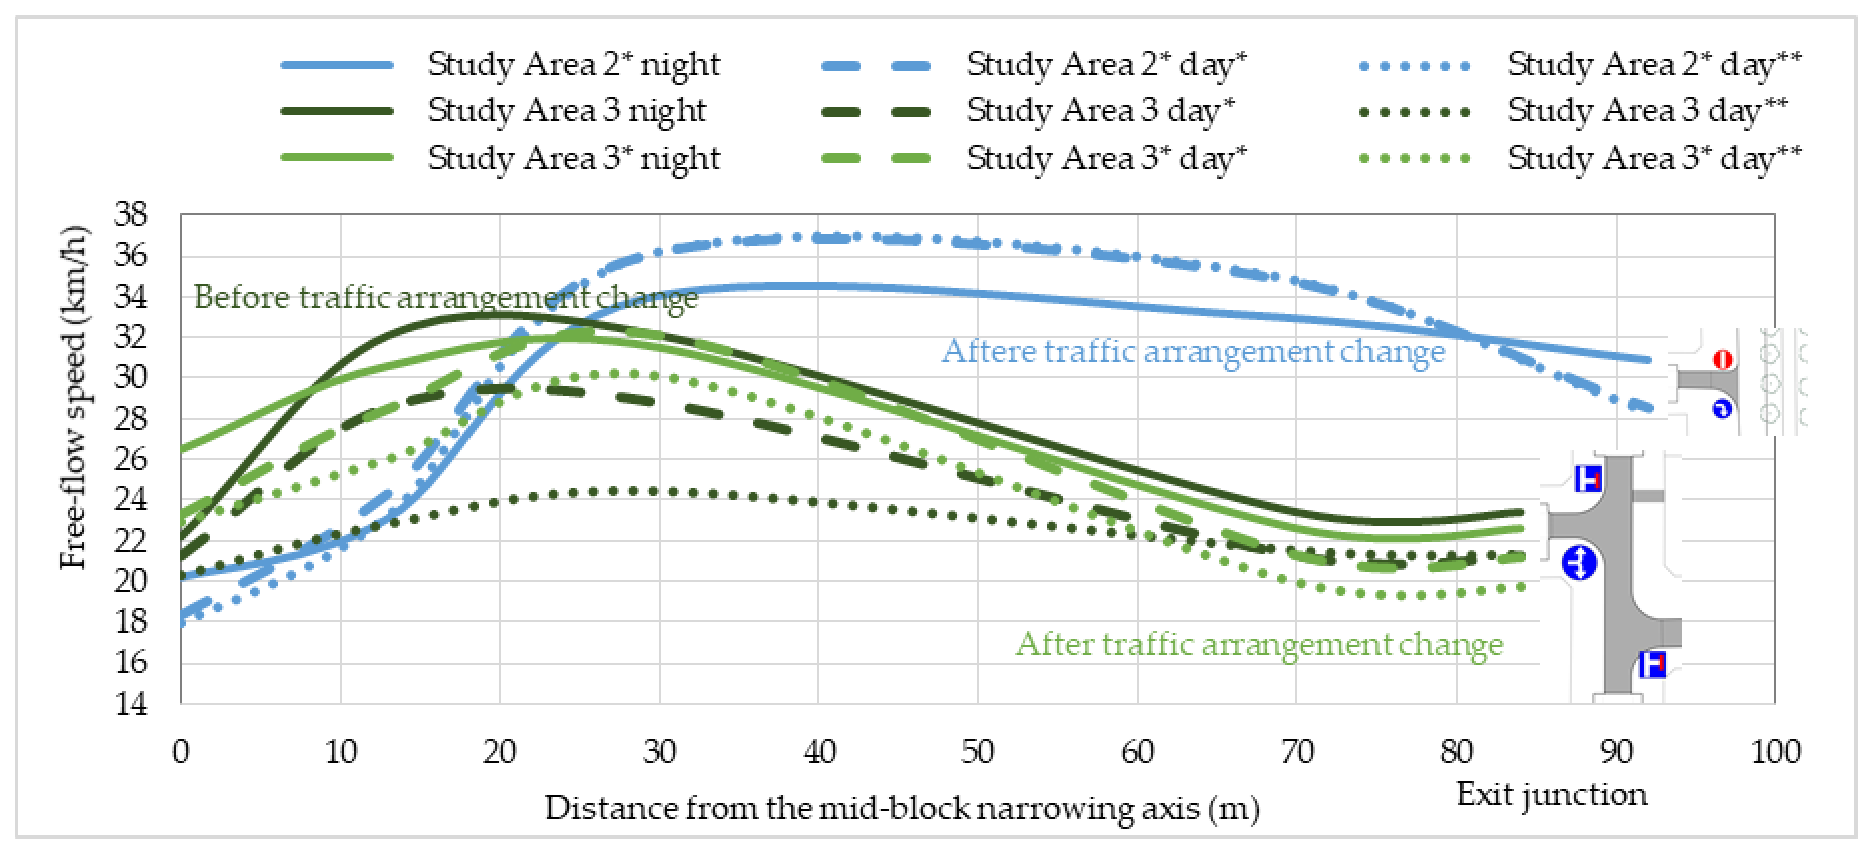
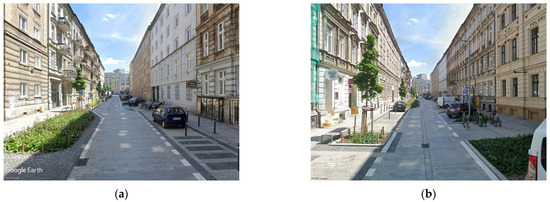
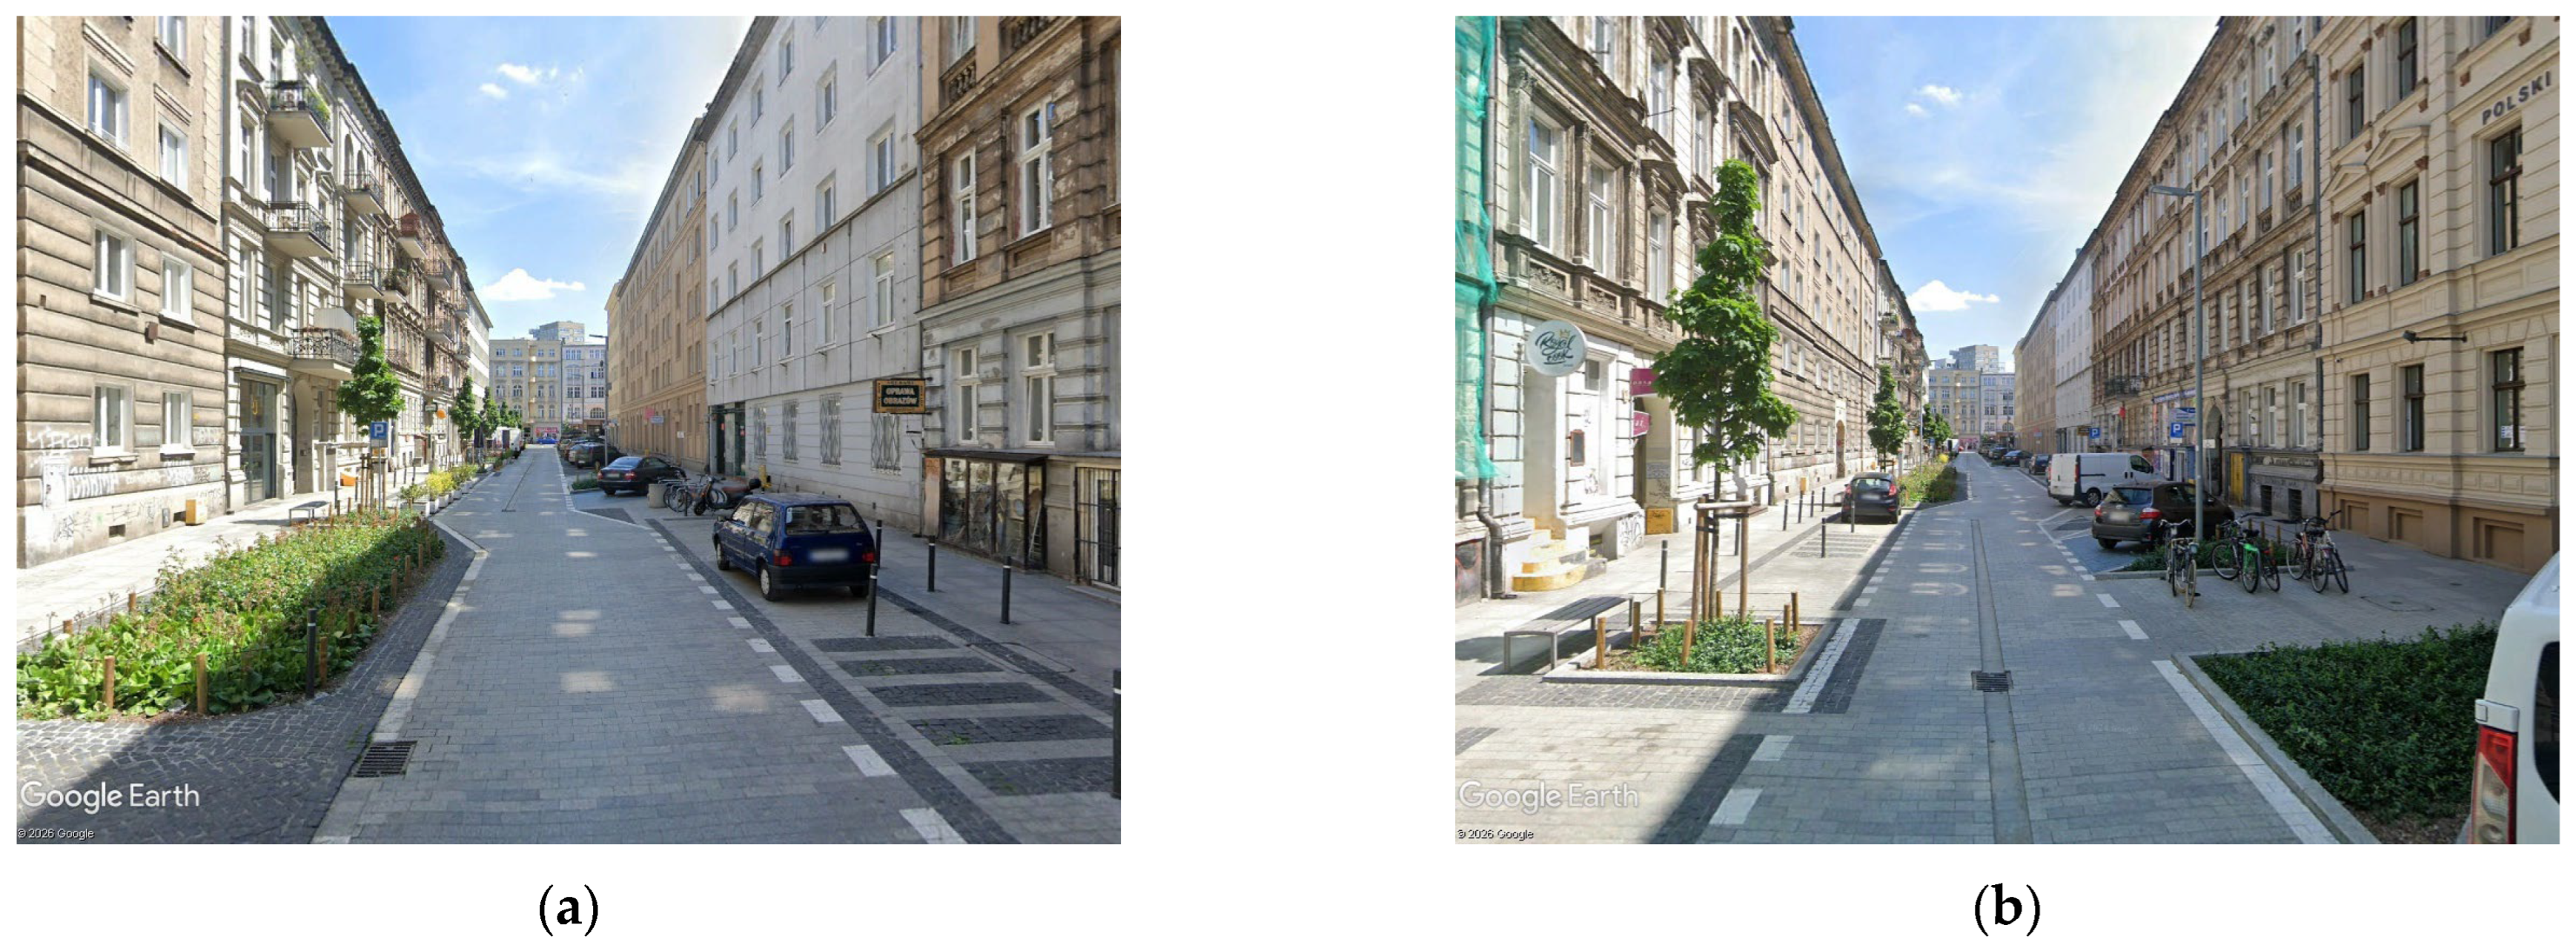
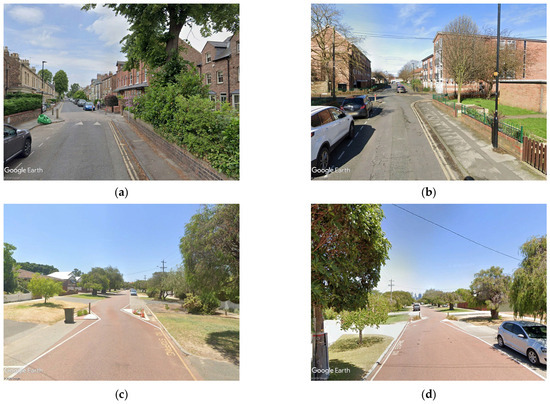
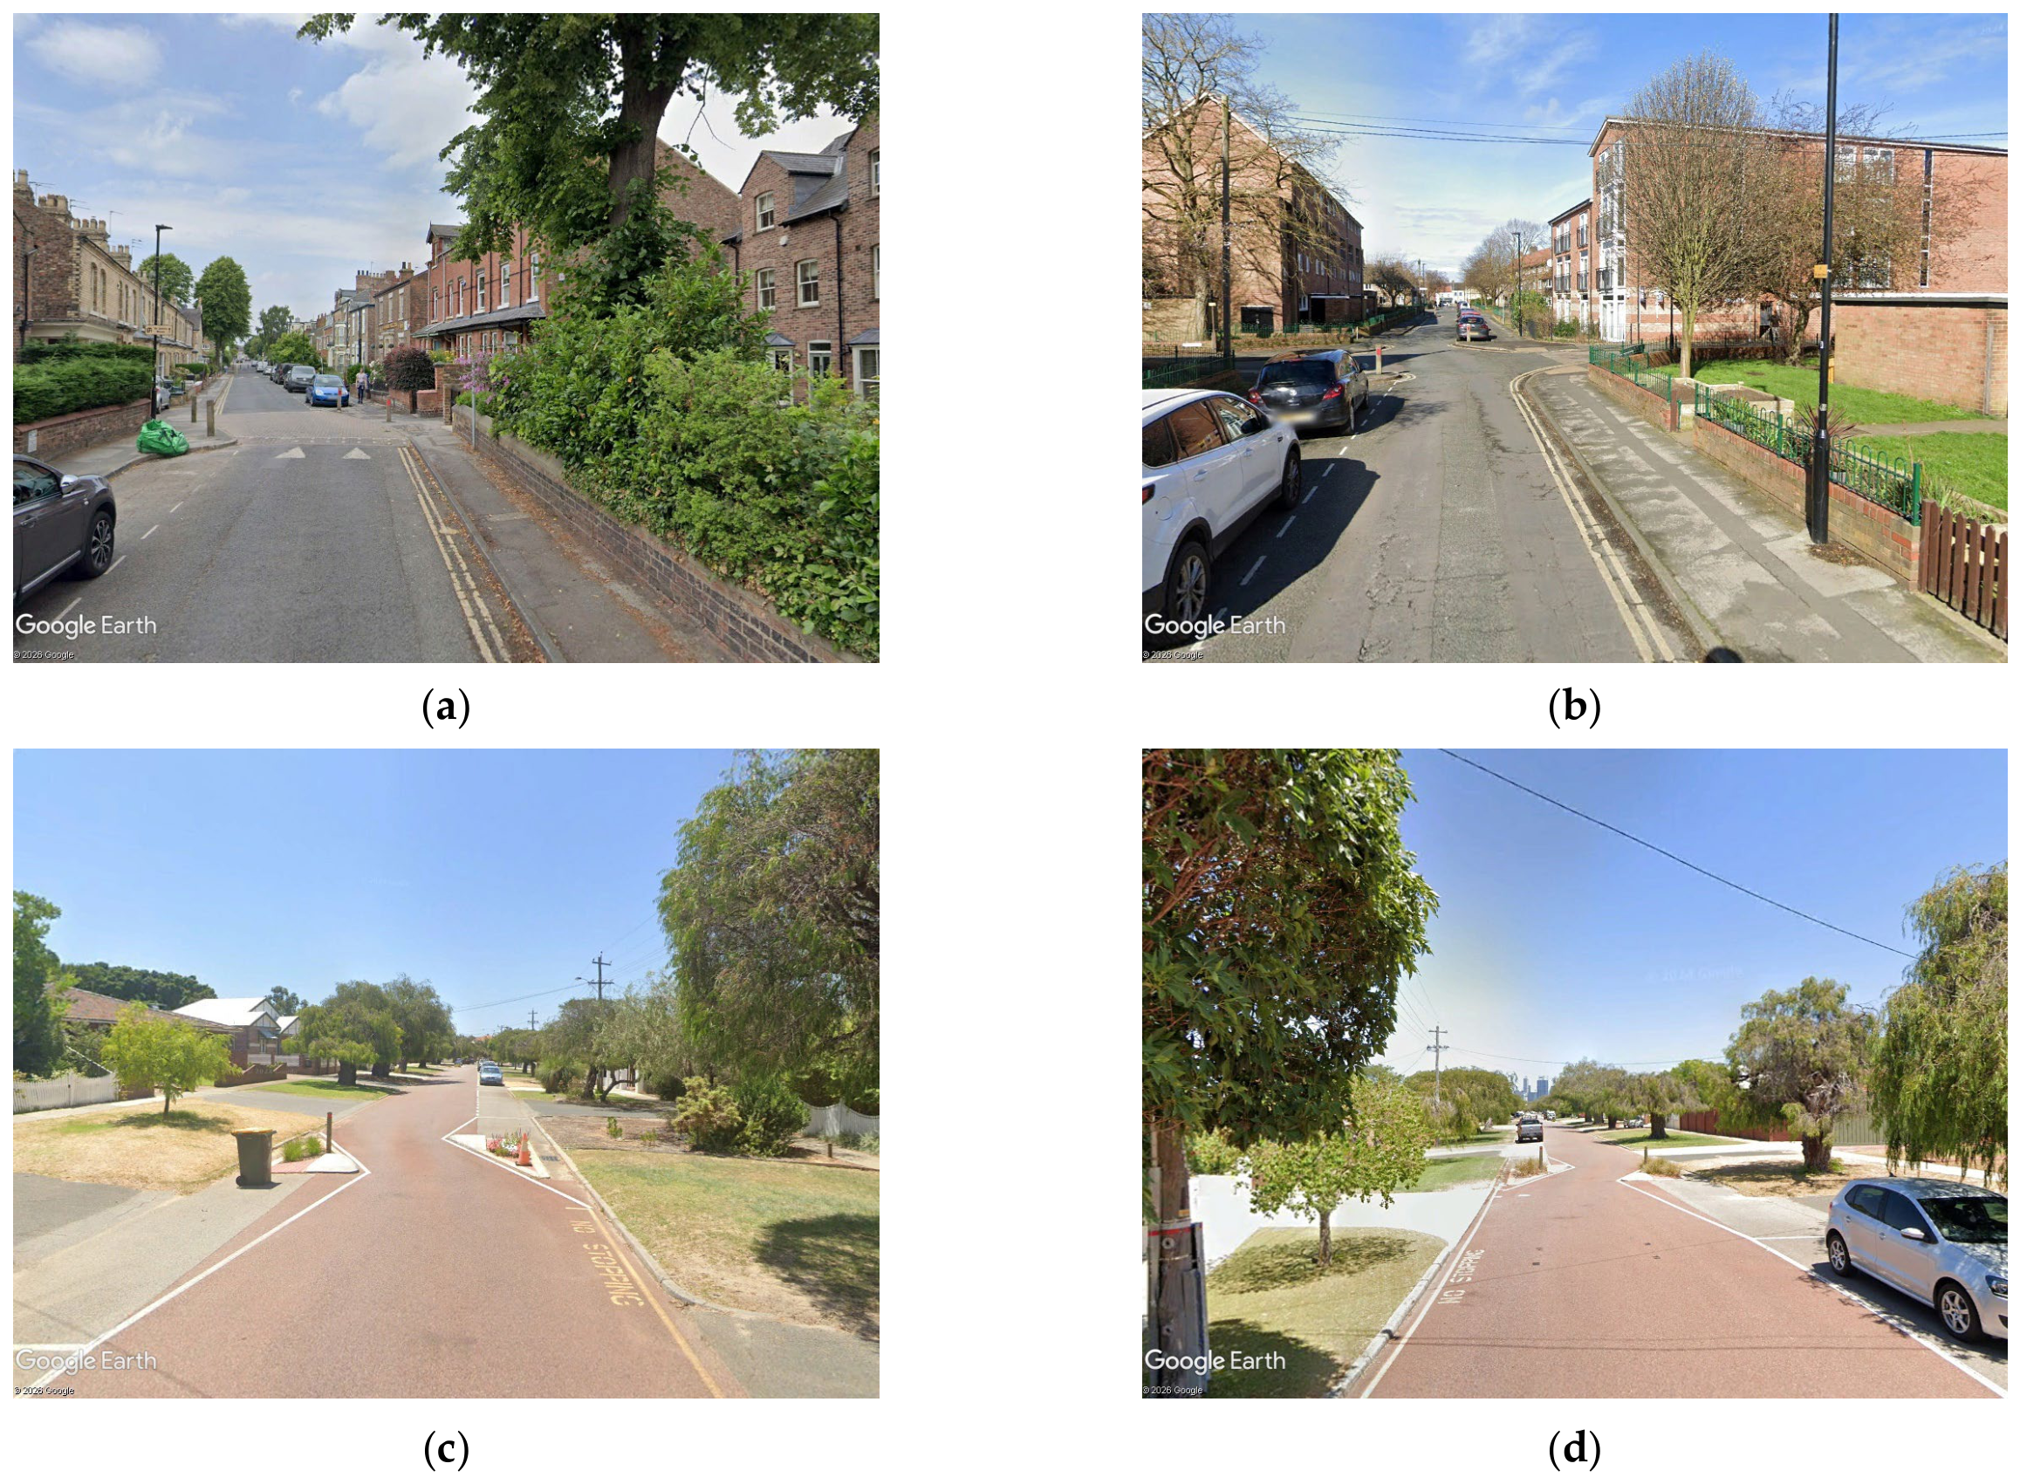
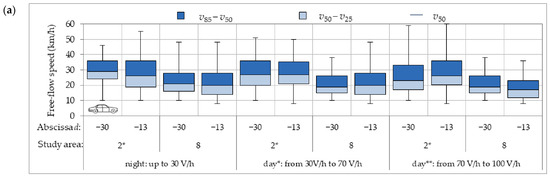
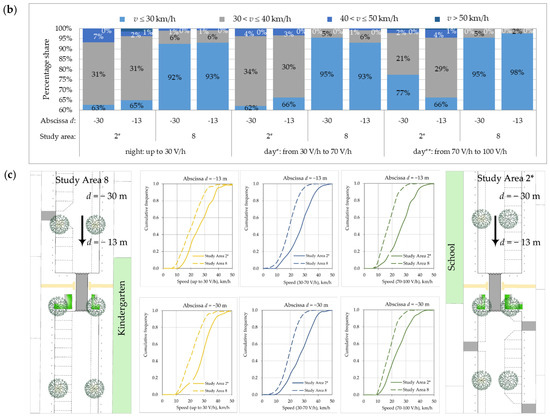
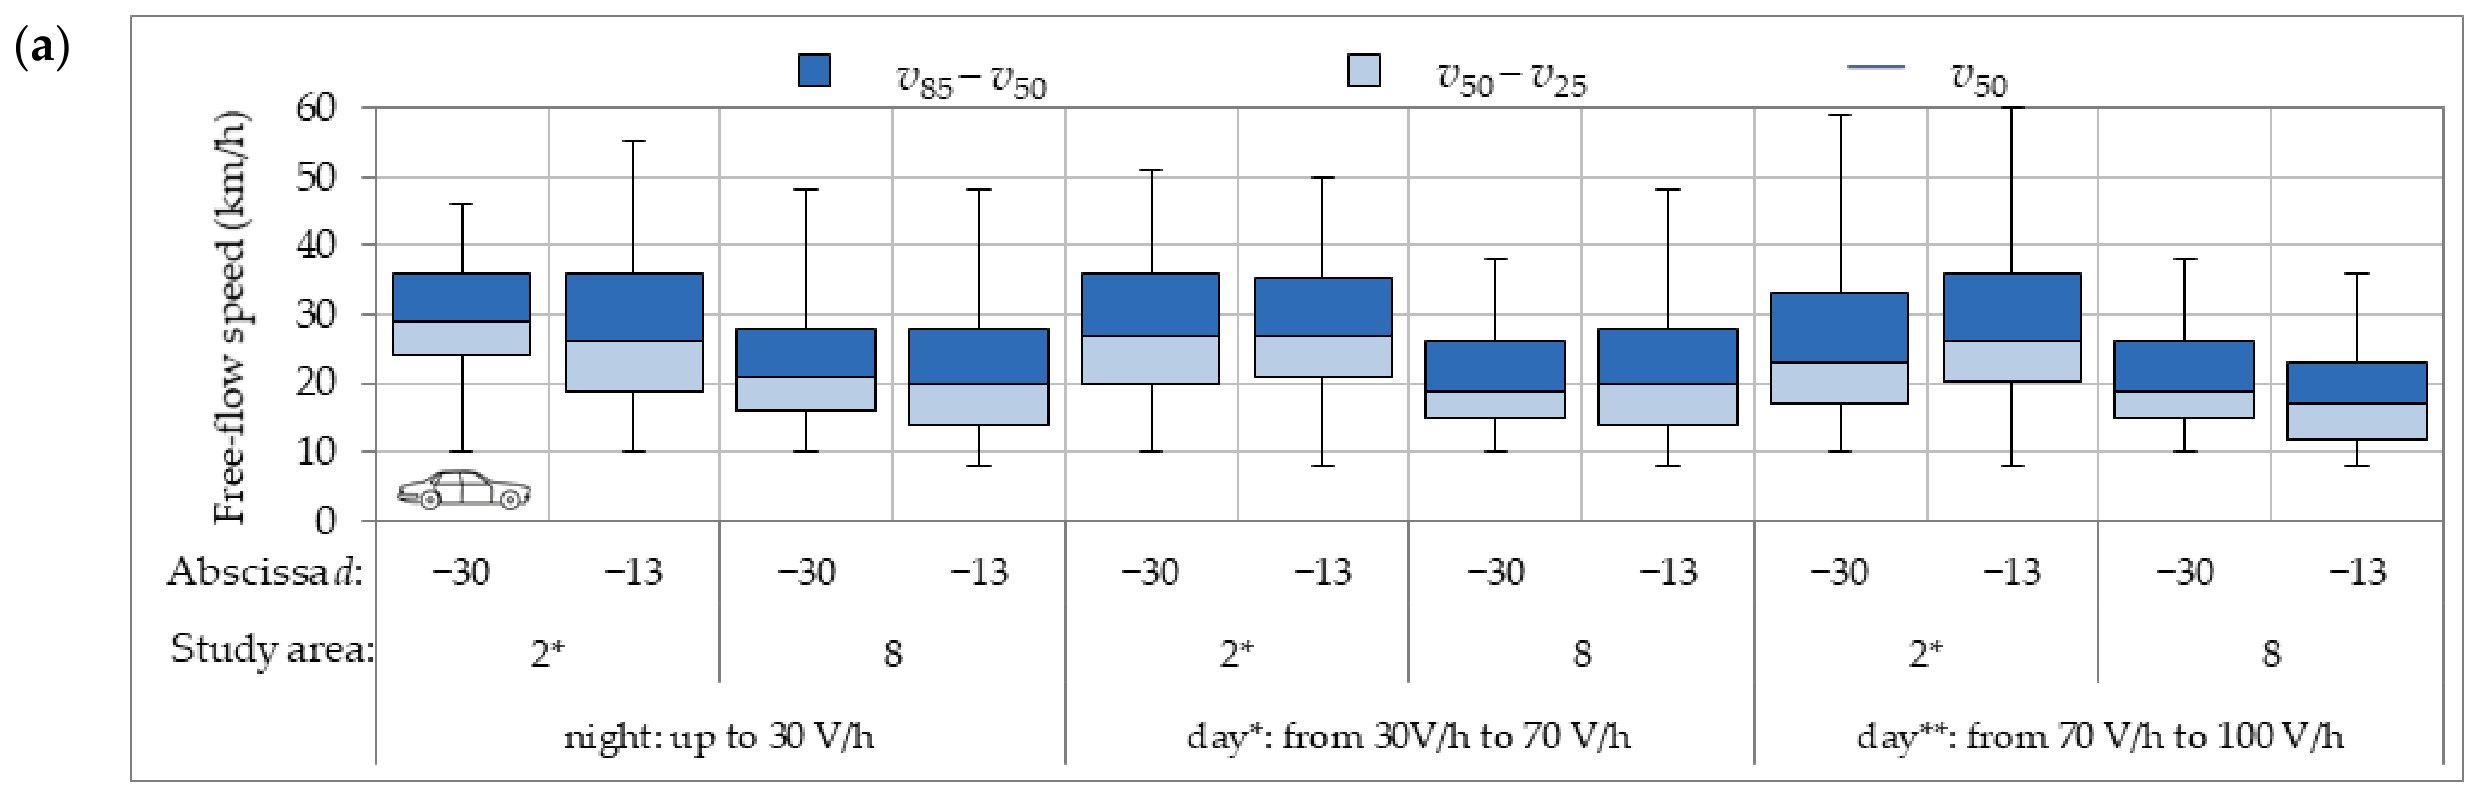
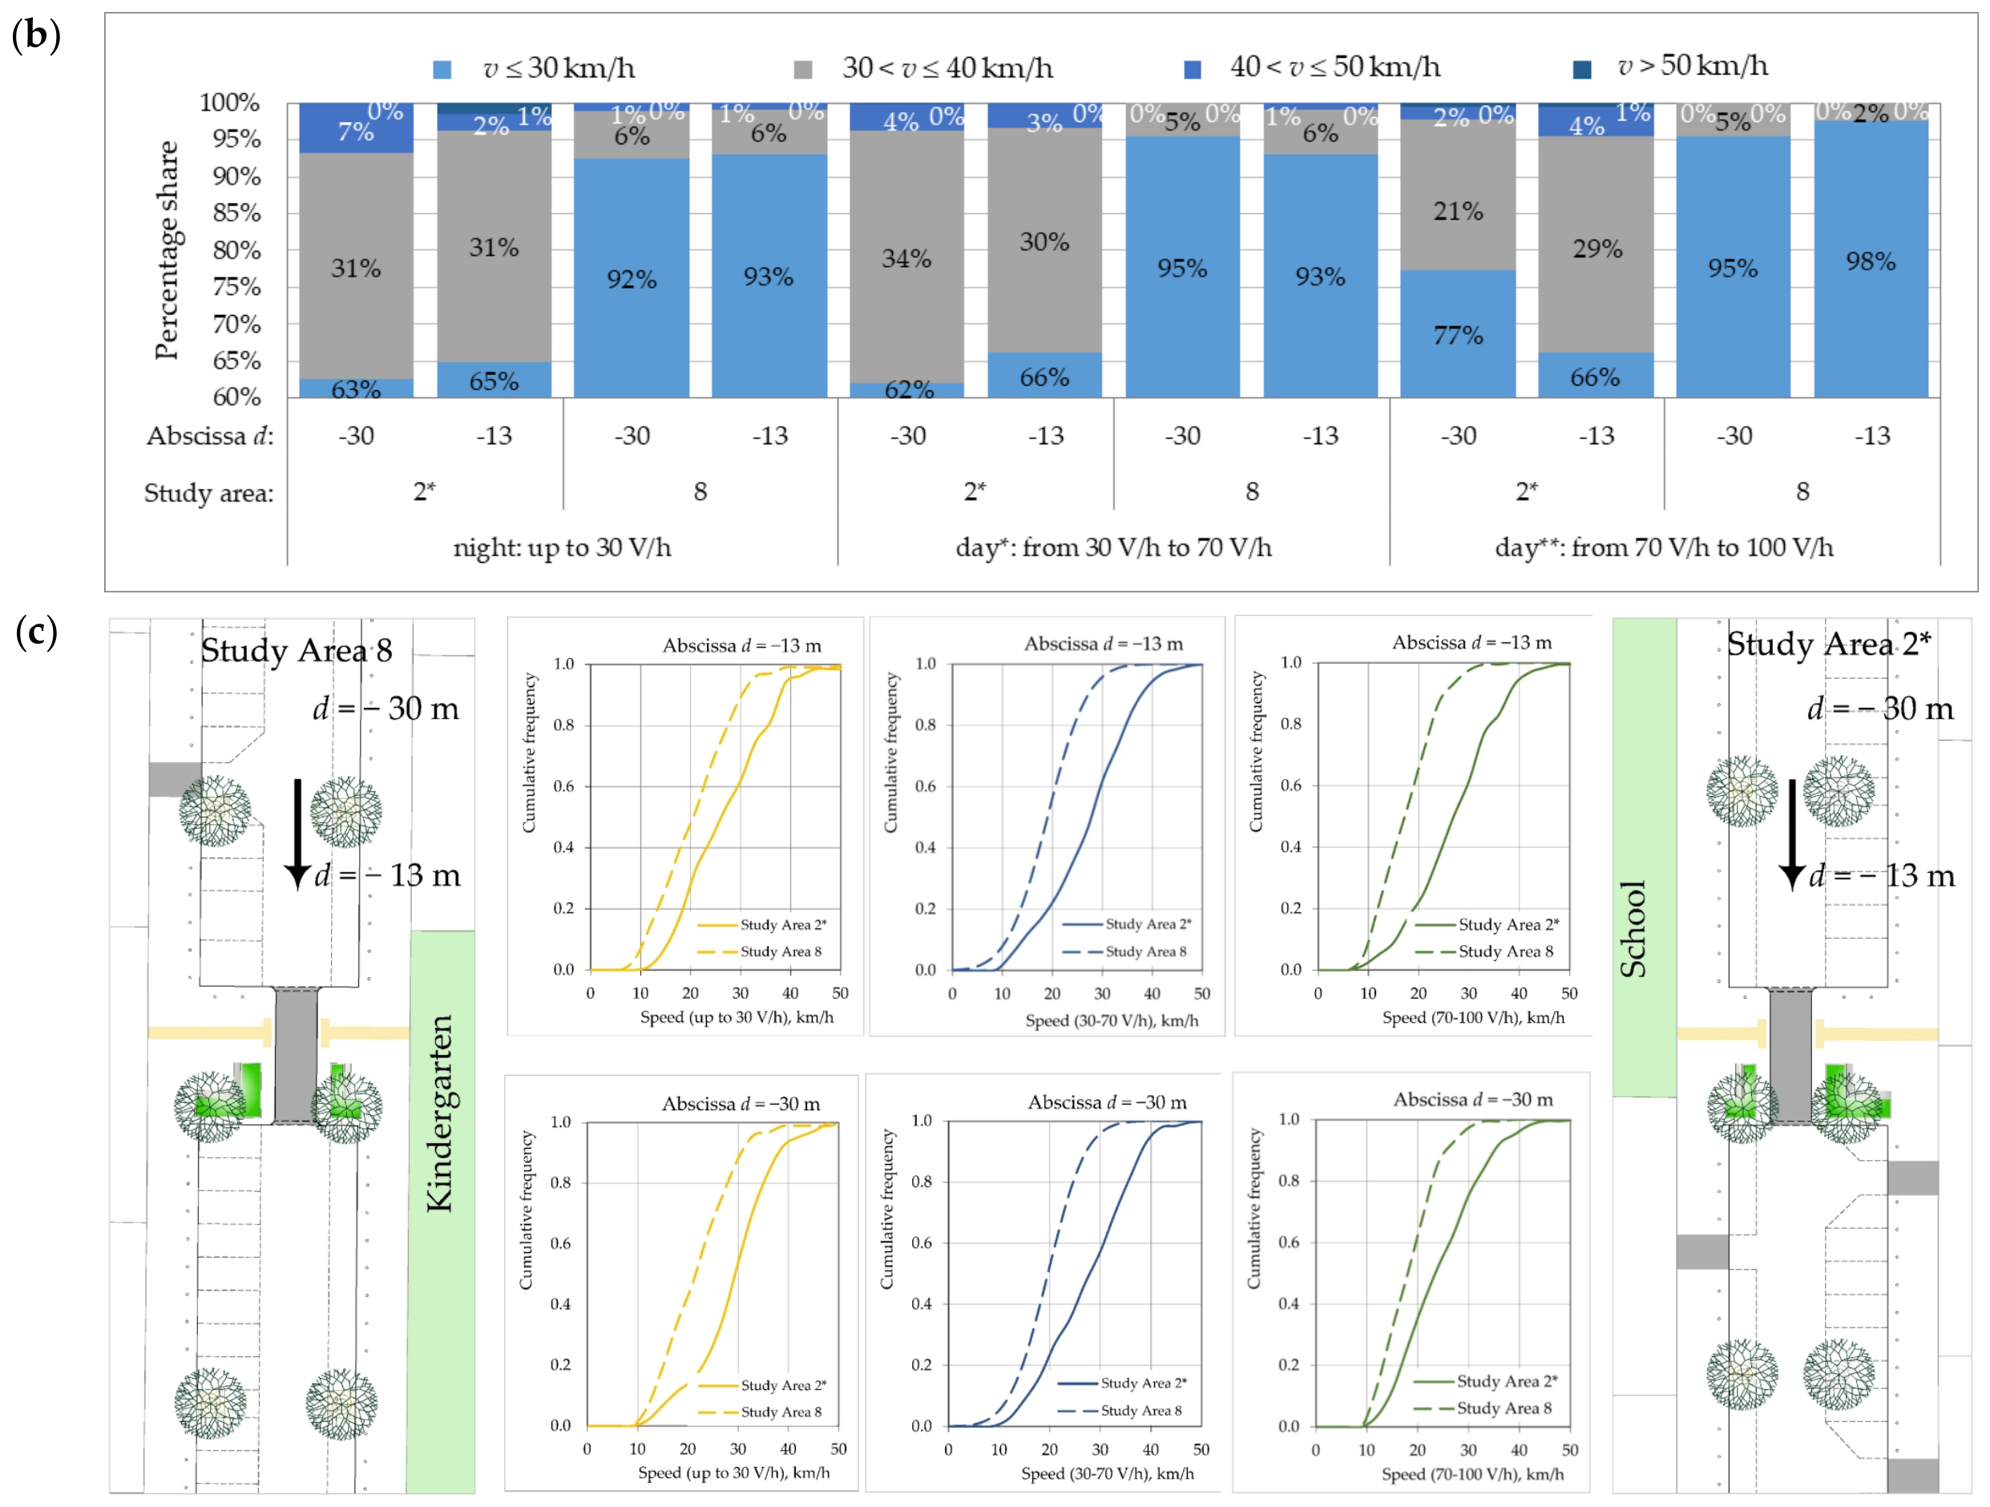
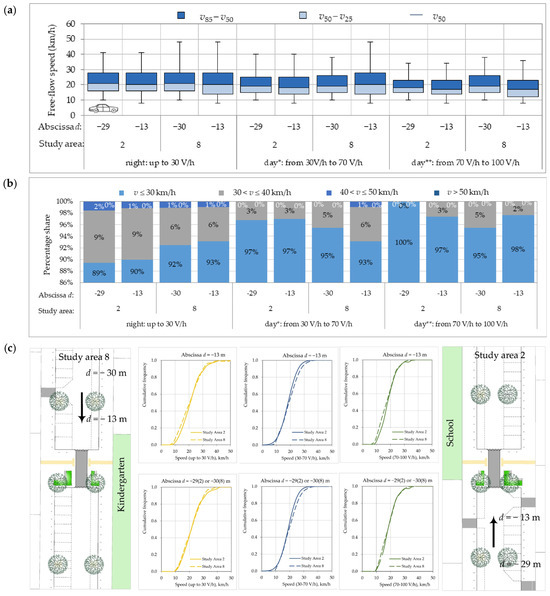
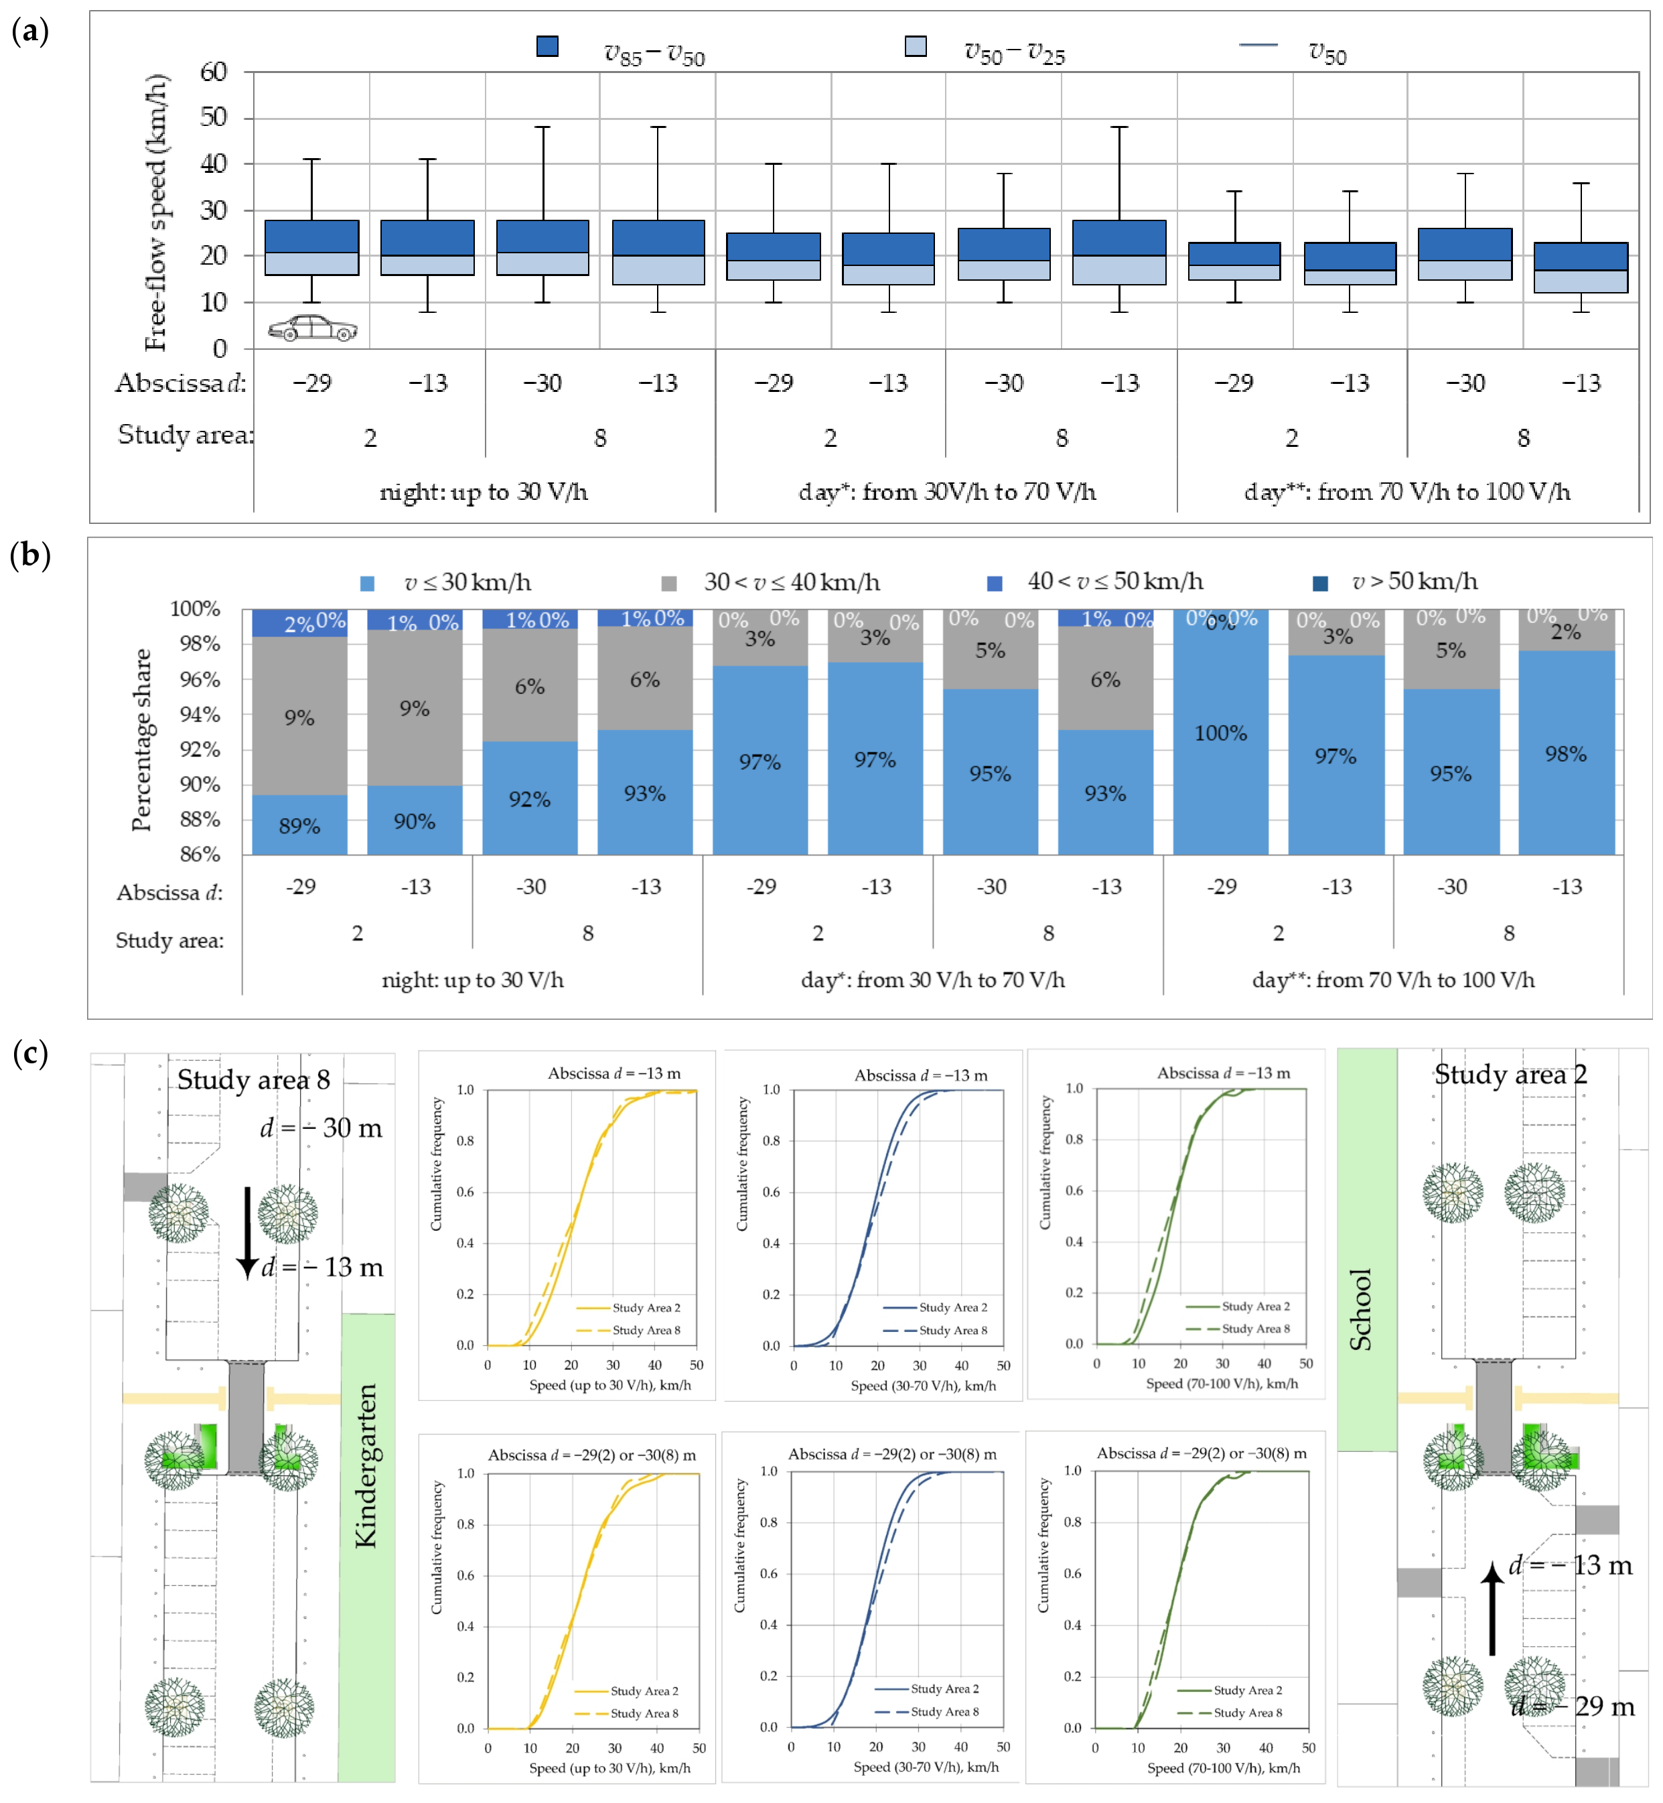
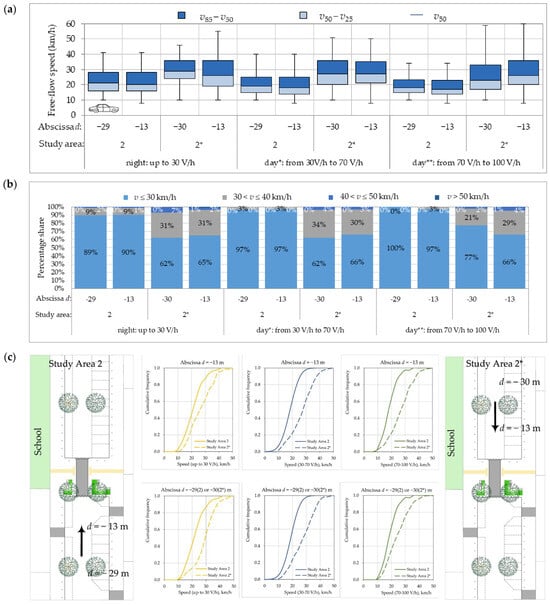
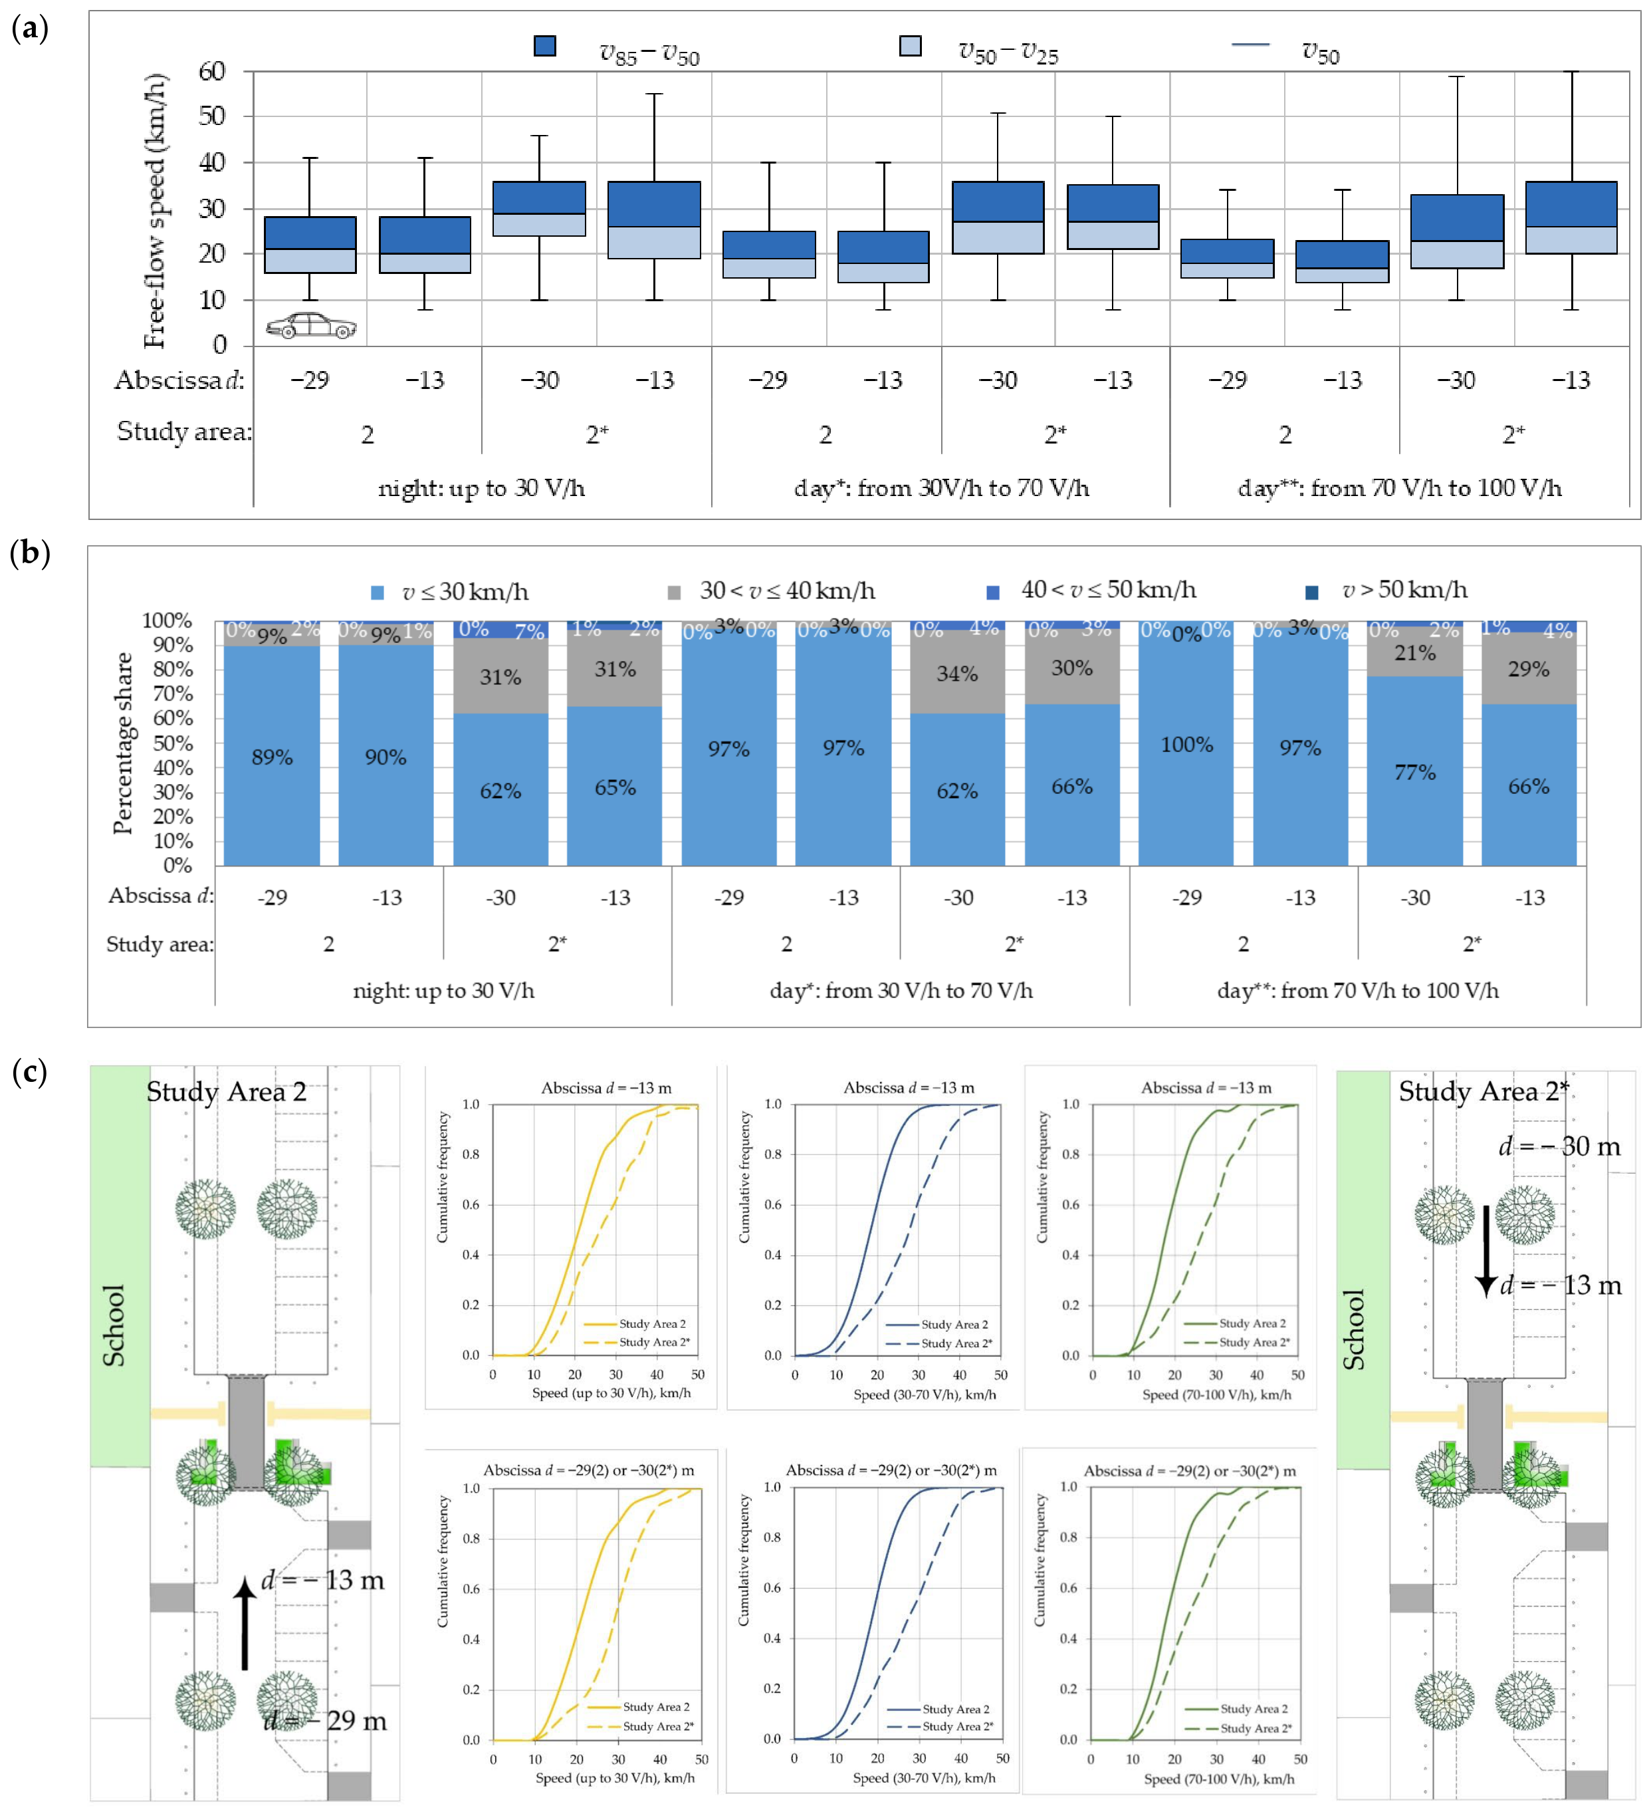
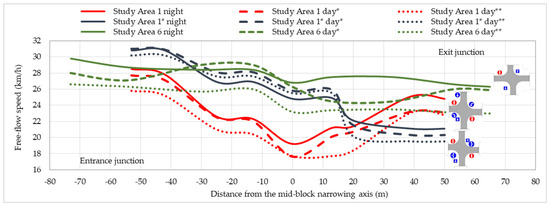
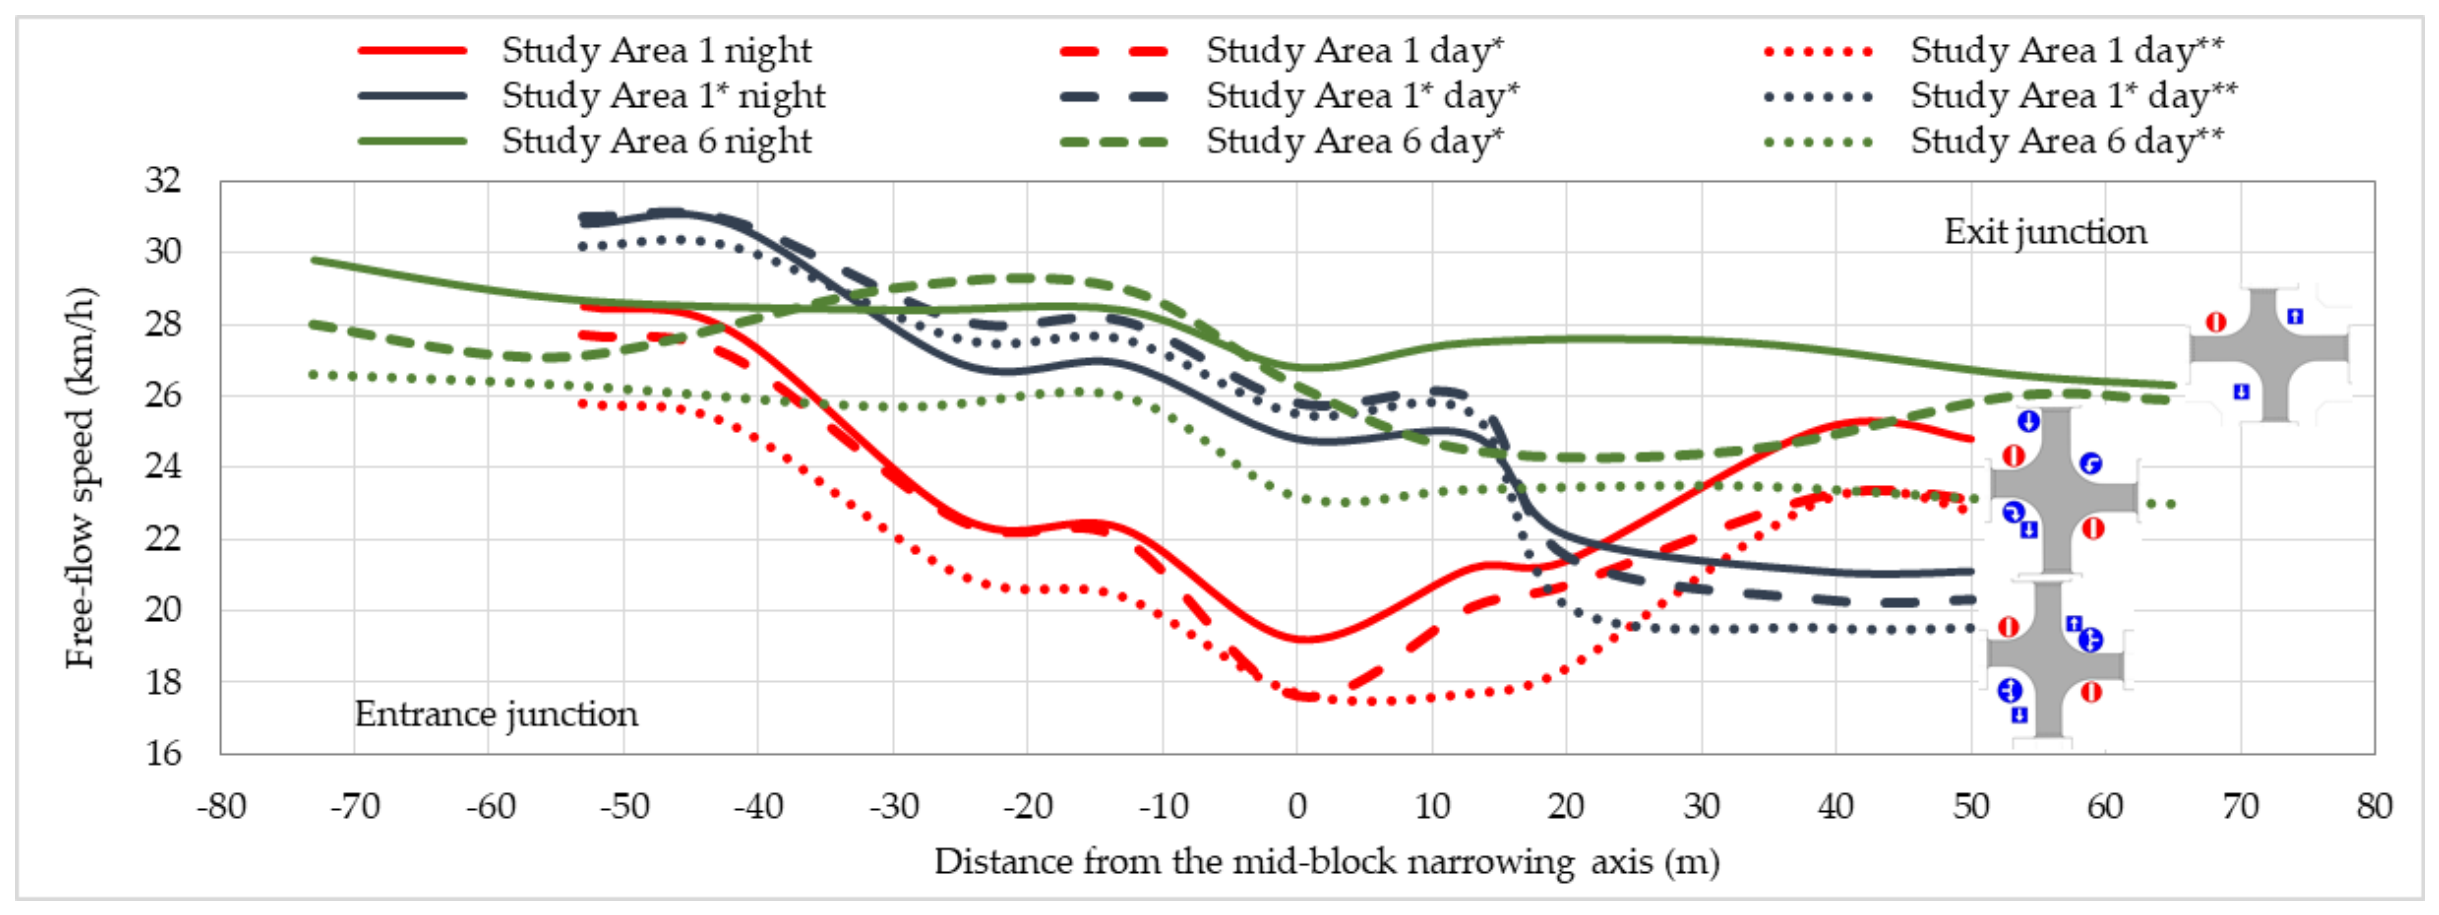
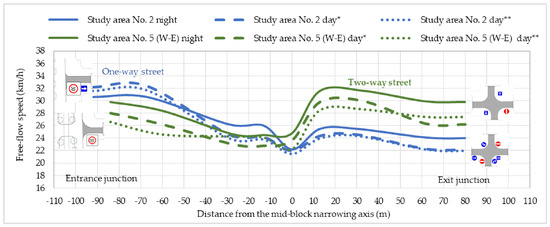
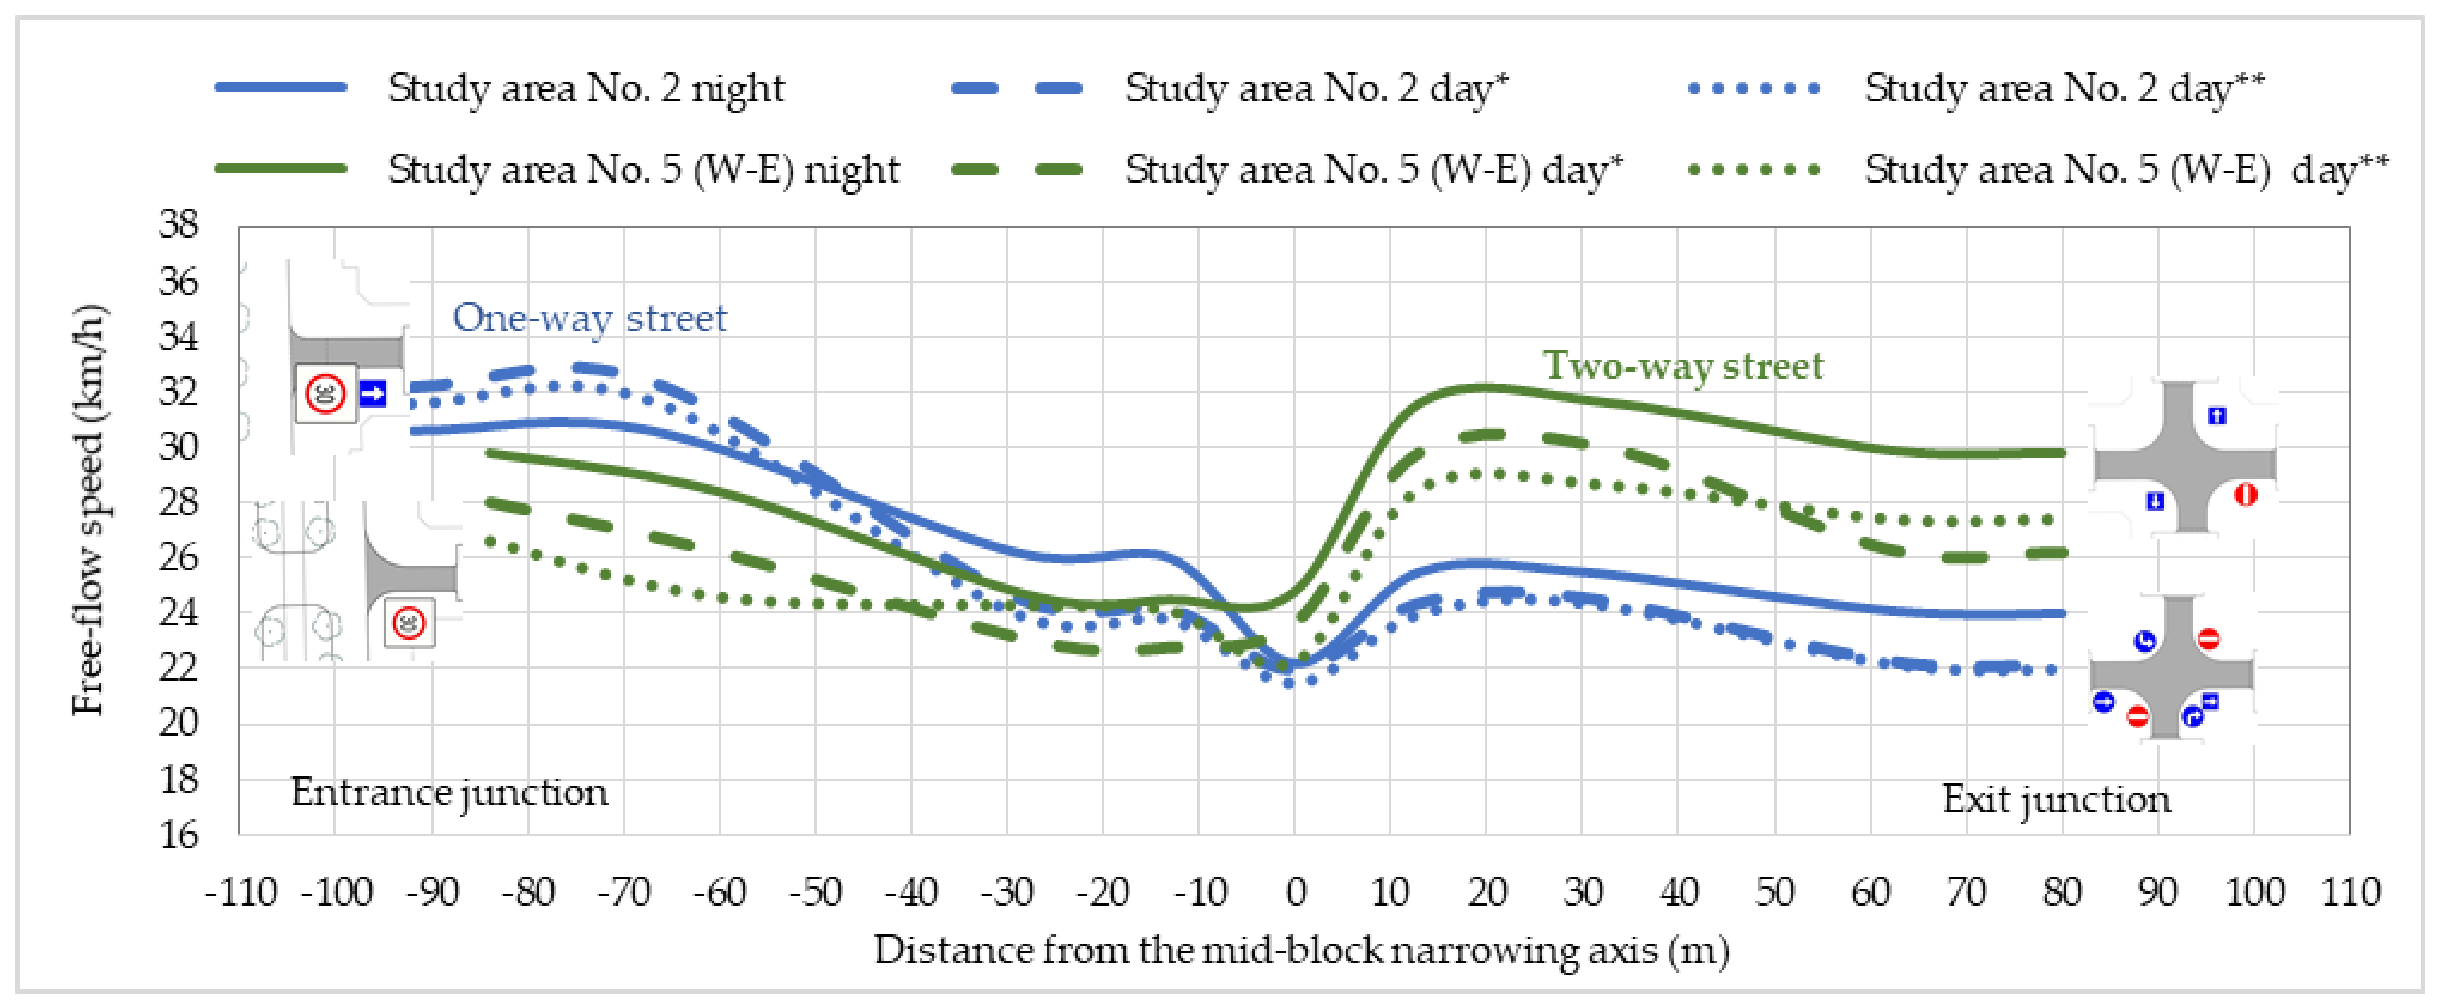
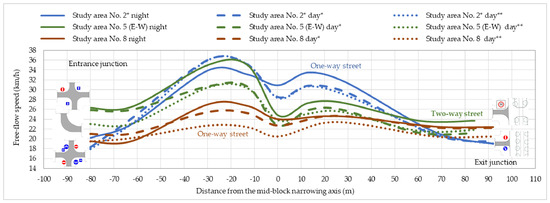
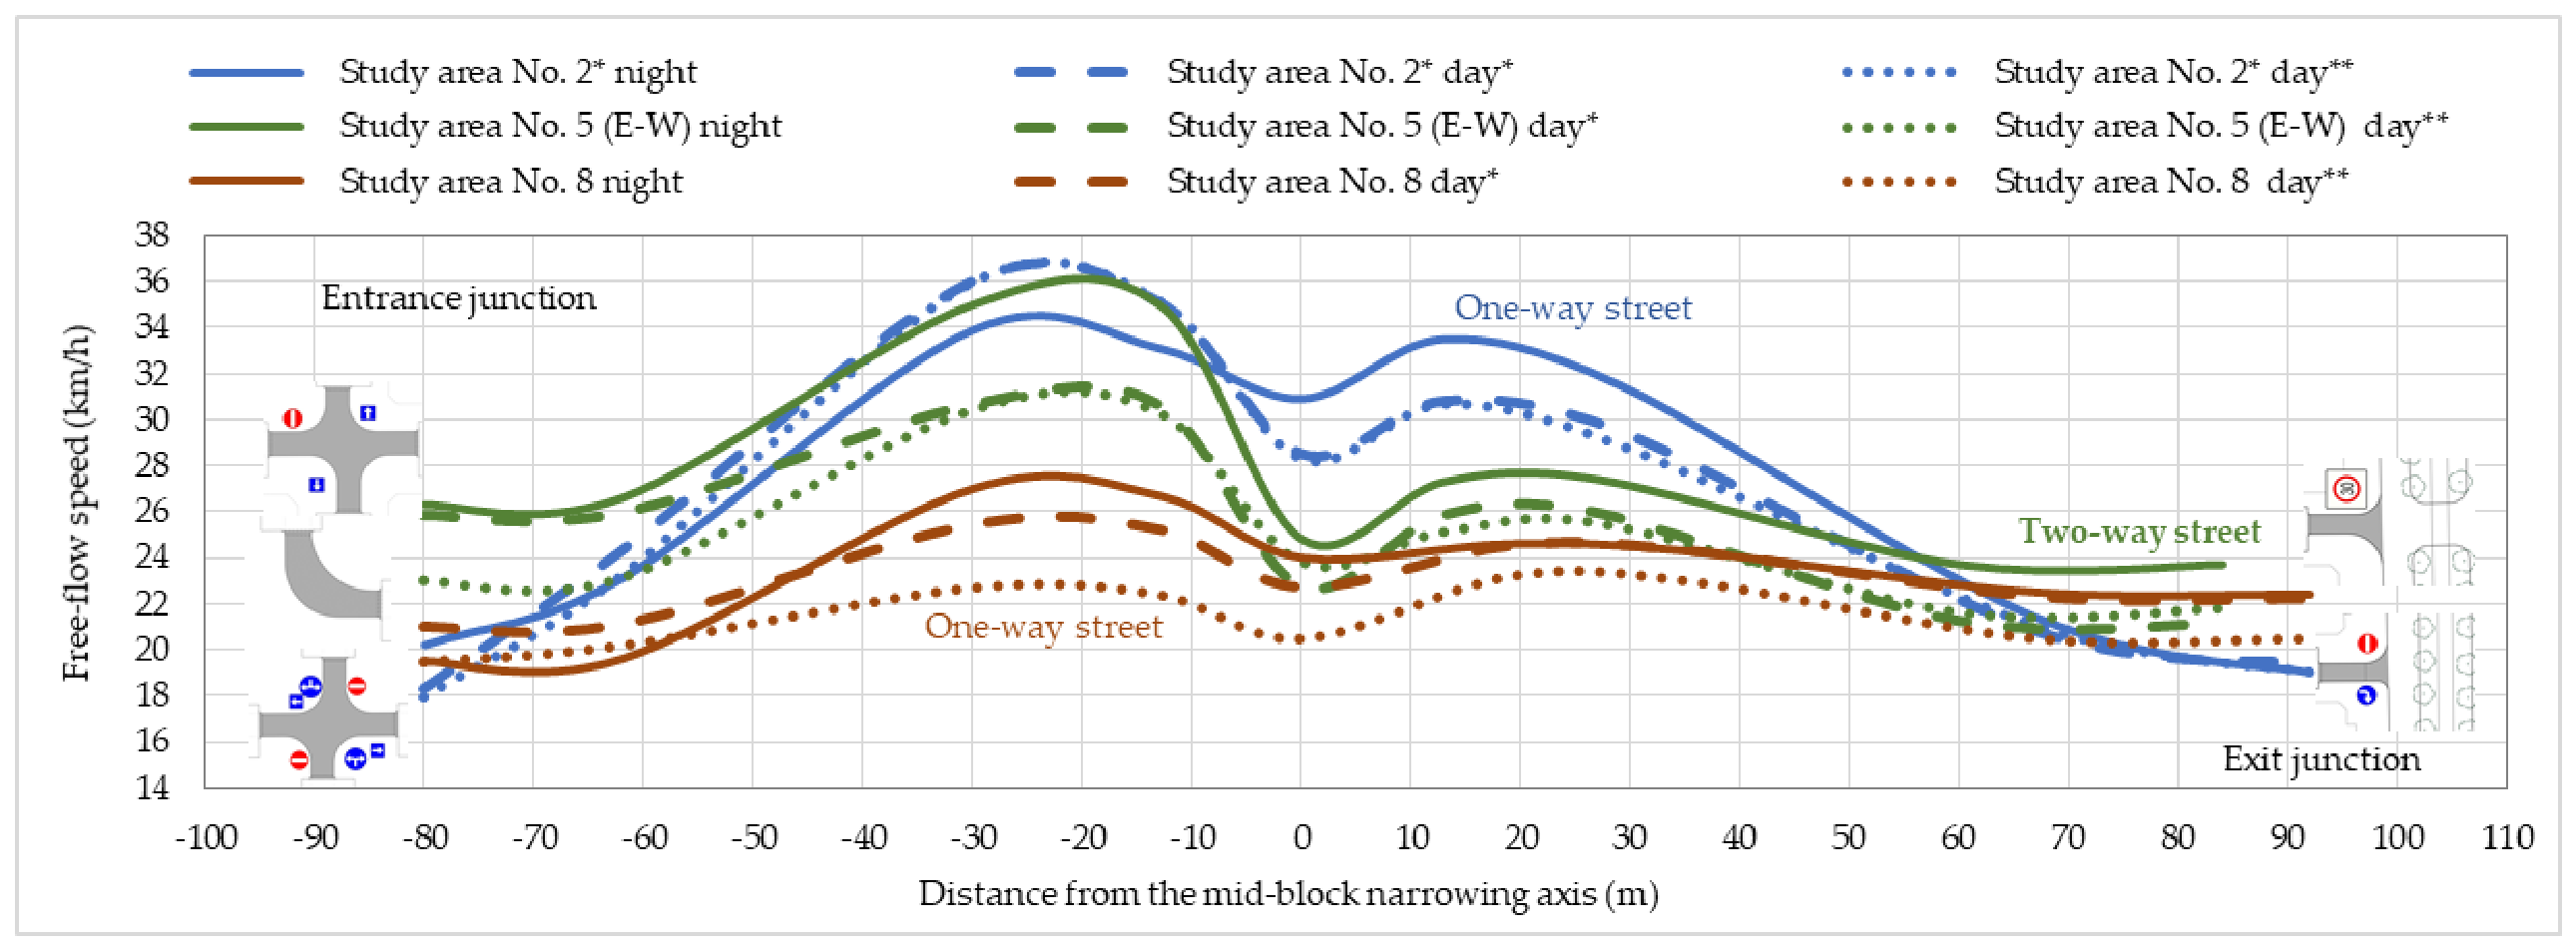
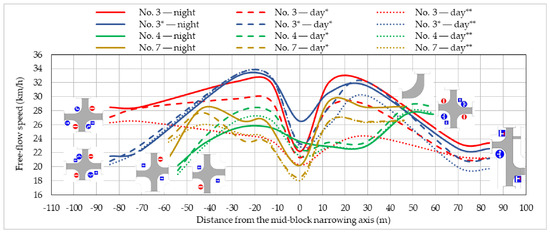
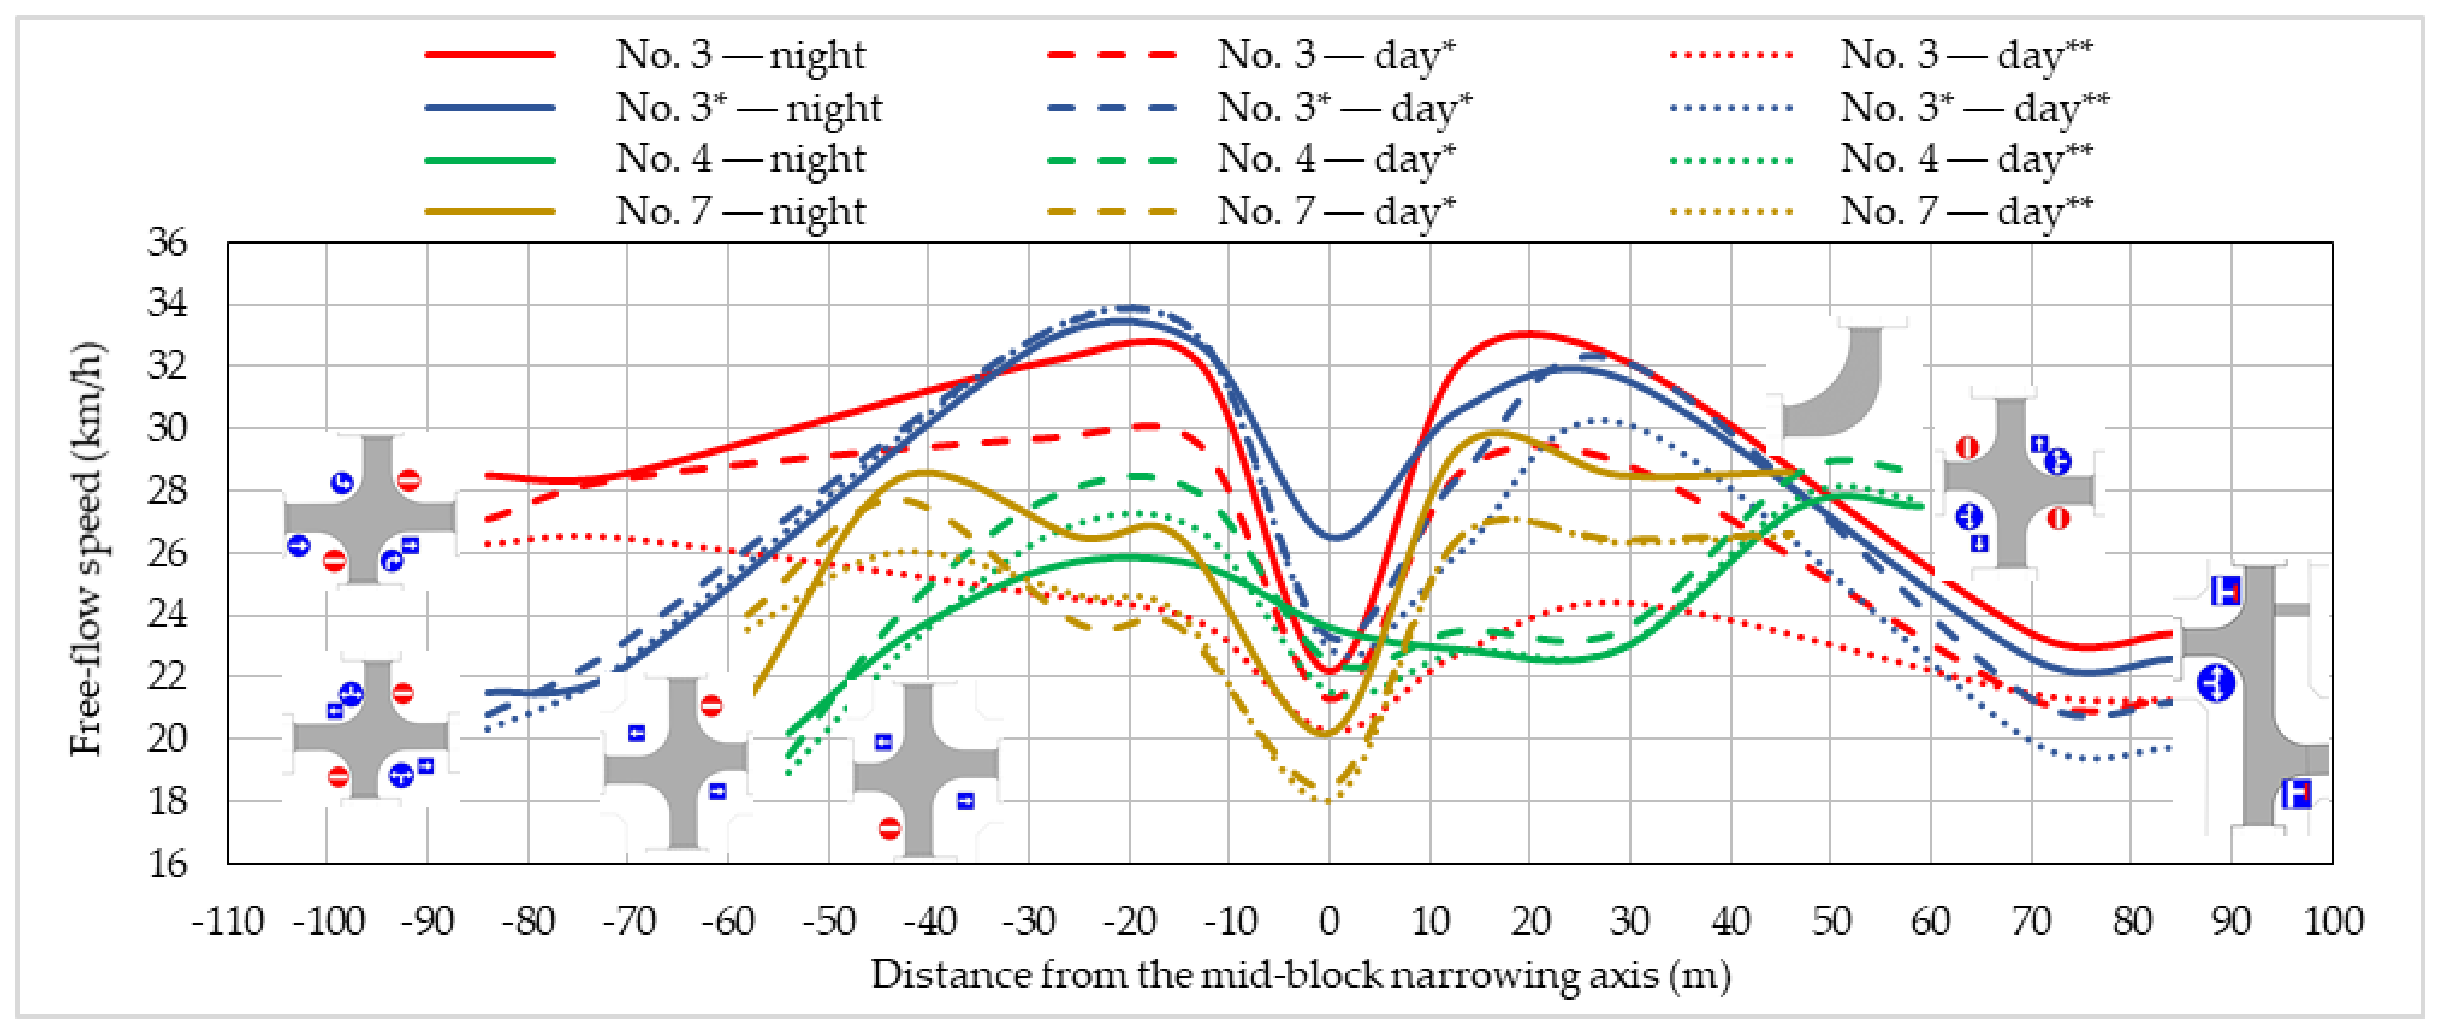
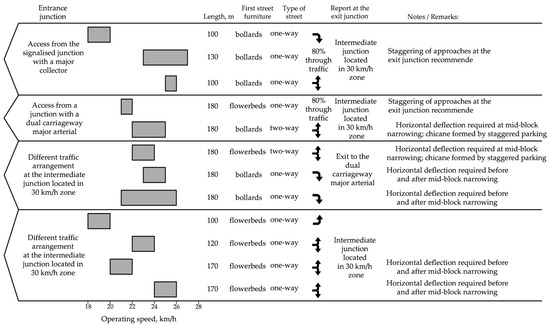
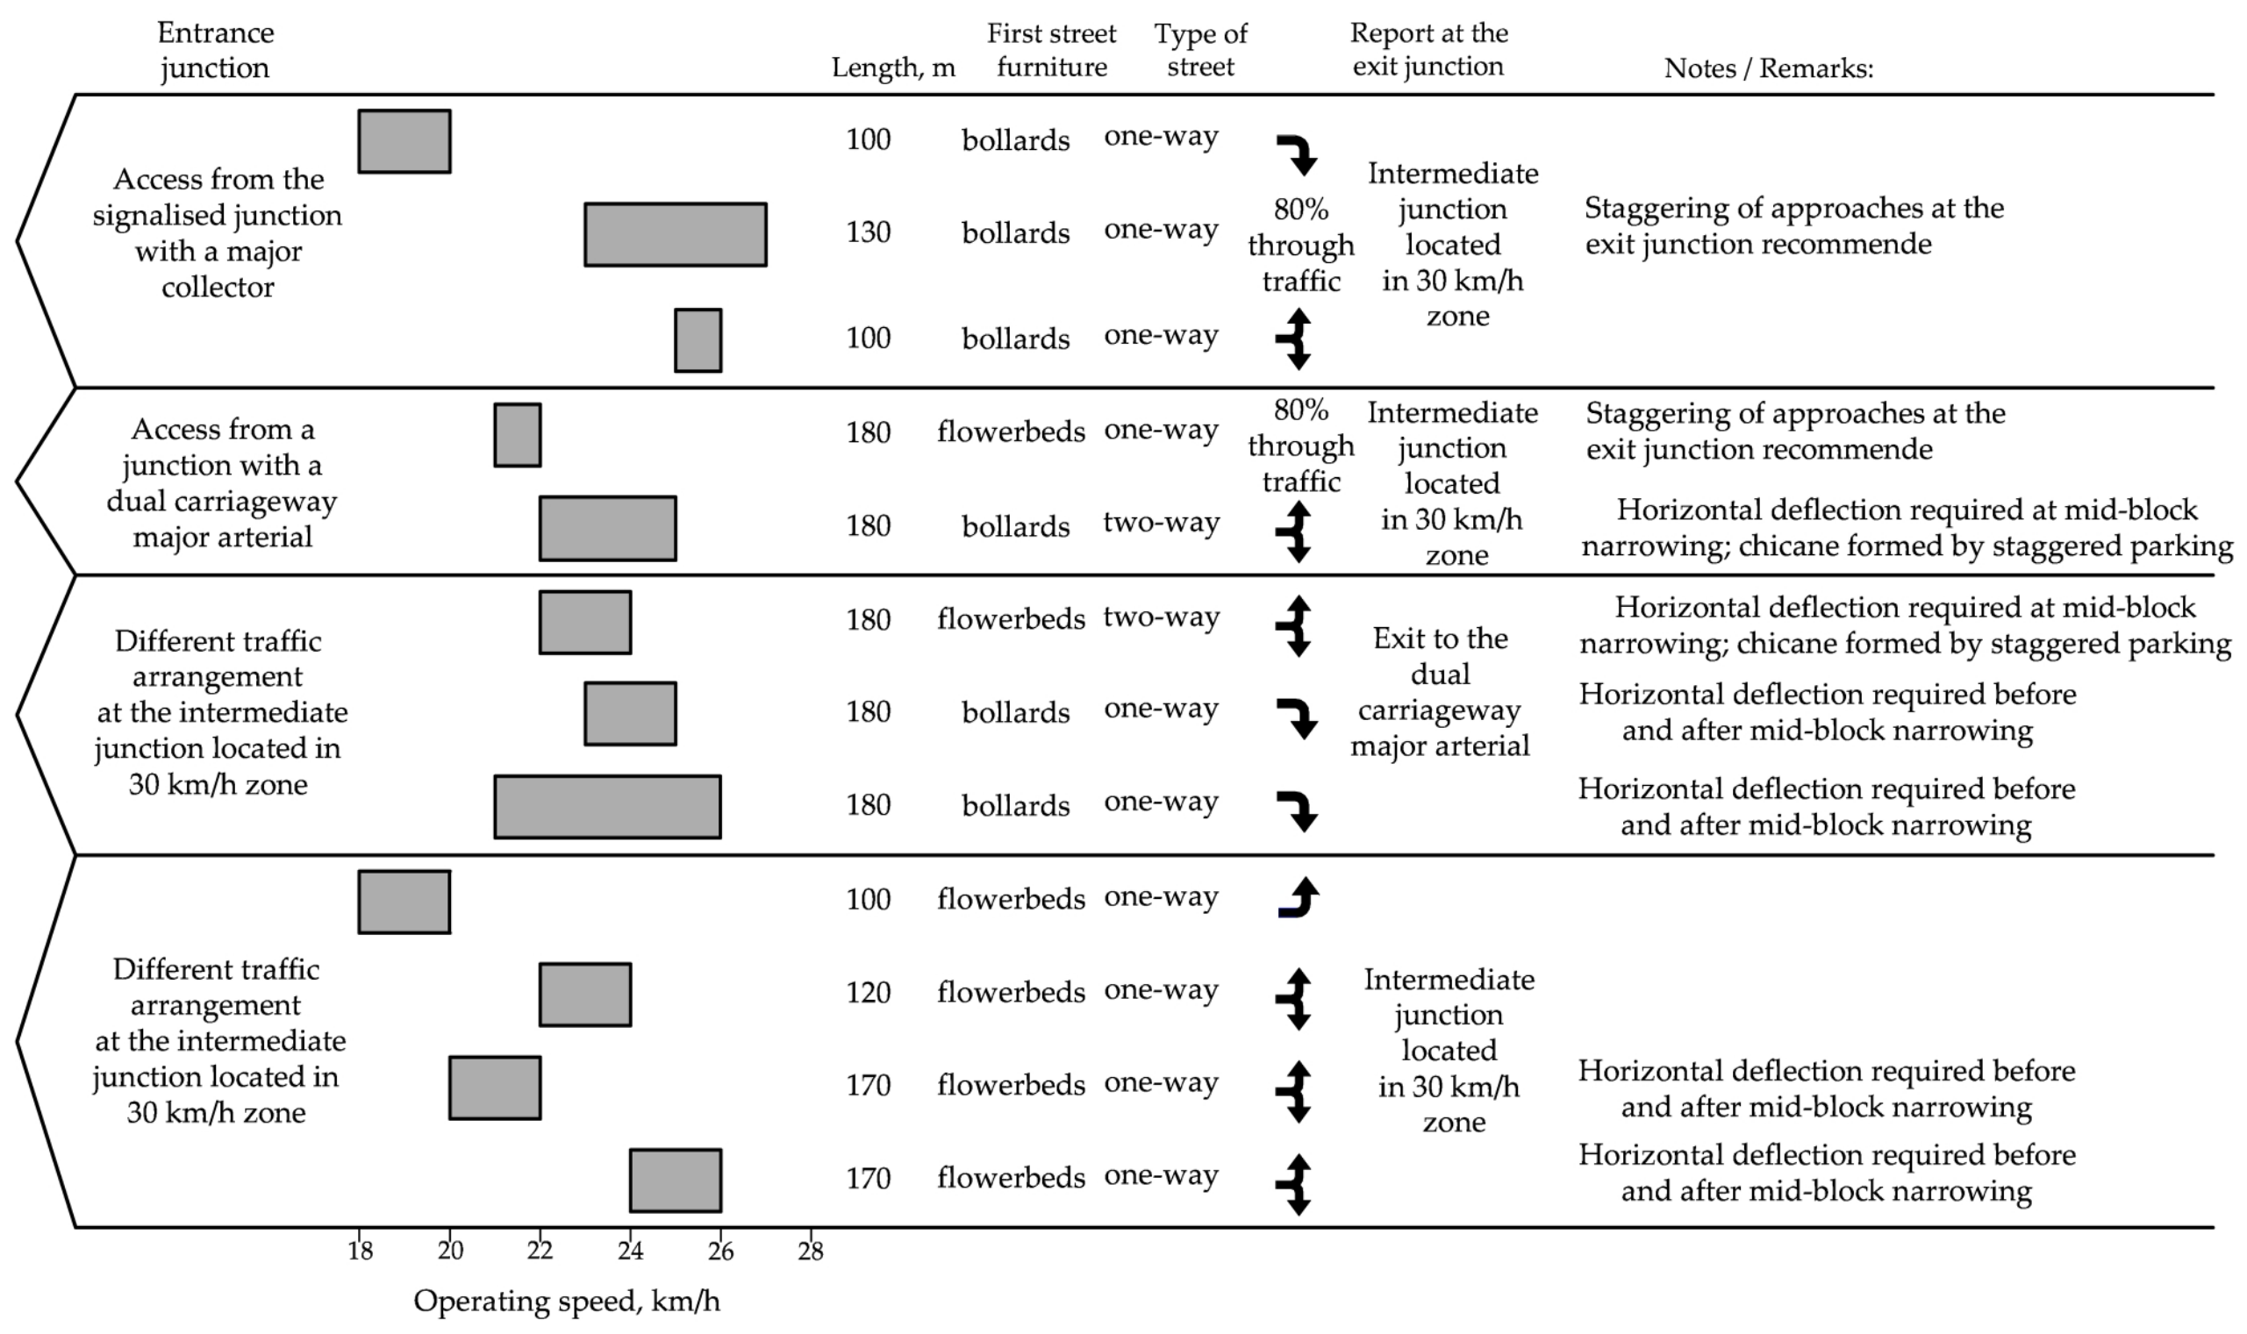
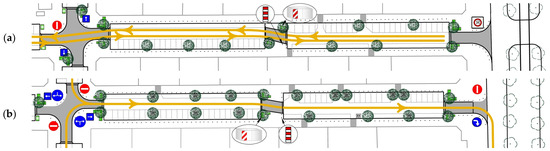
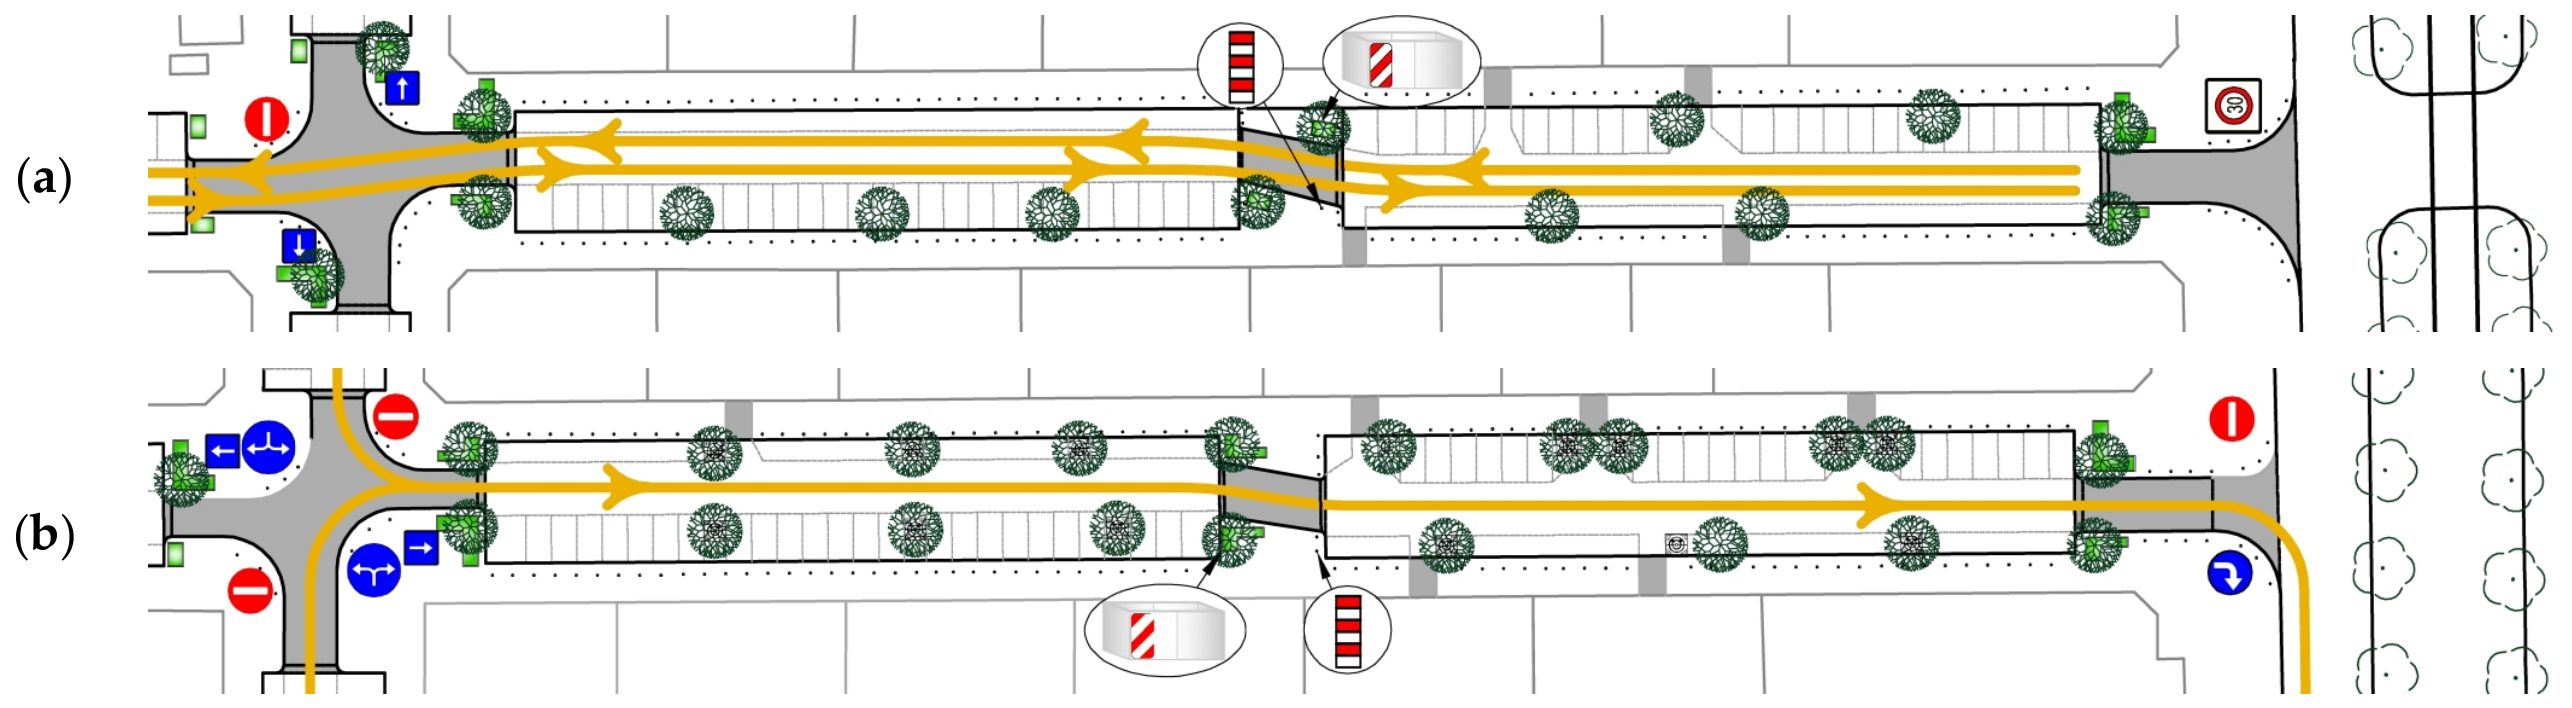
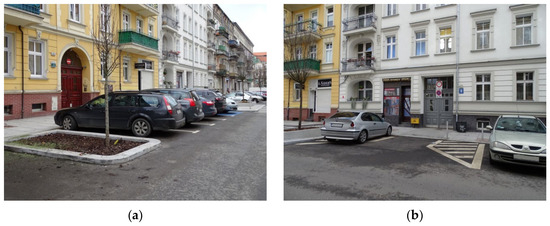
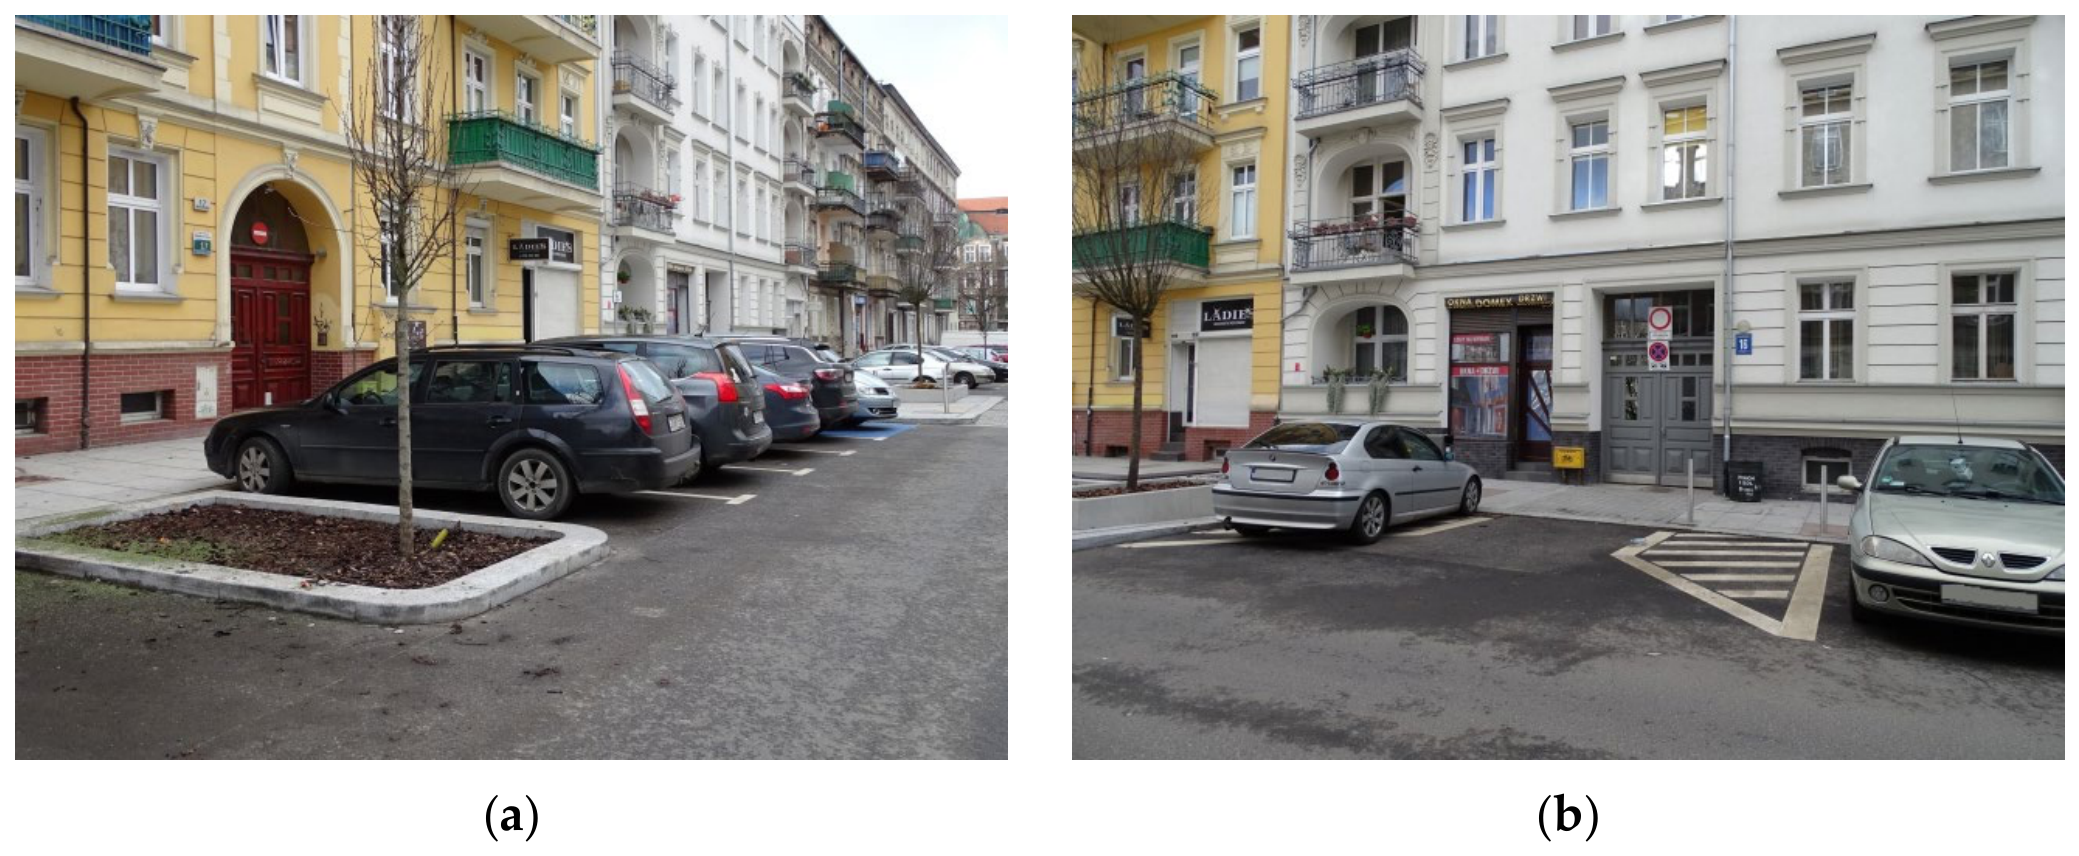

Disclaimer/Publisher’s Note: The statements, opinions and data contained in all publications are solely those of the individual author(s) and contributor(s) and not of MDPI and/or the editor(s). MDPI and/or the editor(s) disclaim responsibility for any injury to people or property resulting from any ideas, methods, instructions or products referred to in the content. |
© 2026 by the authors. Licensee MDPI, Basel, Switzerland. This article is an open access article distributed under the terms and conditions of the Creative Commons Attribution (CC BY) license.