


Abstract
Accurate identification of the spatial distribution of winter wheat is important for agricultural resource allocation and production management. However, the applicability, complementary effects, and optimal observation windows of different remote sensing data sources across key phenological stages of winter wheat remain unclear. Taking Haiyang City and Wenshang County in Shandong Province of China as the study areas, this study used multi-source remote sensing data from Sentinel-1, Sentinel-2, and Landsat-8/9 to extract spectral and backscattering features at different phenological stages. Winter wheat classification was conducted using the Random Forest algorithm, and the classification performance of different data combinations at each growth stage was compared. The results showed that winter wheat classification accuracy varied clearly with phenological development, with peak performance occurring at the heading stage in Haiyang and the grain-filling stage in Wenshang. Optical data played a dominant role in winter wheat classification. The tillering stage was identified as the earliest candidate observation window in both regions, although independent evaluation confirmed reliable early classification only in Wenshang. The incorporation of synthetic aperture radar (SAR) data did not consistently improve accuracy at all stages but provided complementary information under specific phenological and regional conditions. Overall, Sentinel-2 showed the most stable performance, and the optimal observation stage and data combination depended on regional landscape conditions.
1. Introduction
Wheat is one of the most widely cultivated staple crops worldwide, and ensuring its production security is of great significance for the global food security system. In the context of rapid population growth, intensifying climate change, and the increasing frequency of extreme weather events, the accurate acquisition of spatial distribution information on wheat cultivation has become increasingly critical for agricultural management, policy formulation, and resource allocation. Traditional approaches rely primarily on agricultural censuses and field surveys, which, despite their relatively high accuracy, suffer from long data acquisition cycles, limited spatial coverage, and low update frequencies, rendering them inadequate for the urgent demands of precision agriculture.
With the advancement of modern agricultural technologies, remote sensing has been widely applied in crop classification. By acquiring electromagnetic reflectance information from the Earth’s surface, remote sensing enables repeated and spatially extensive monitoring of crop growth. Remote sensing imagery provides abundant spatial, spectral, and temporal information, allowing crop classification to be conducted efficiently, accurately, and over large areas [1,2]. Through the analysis of multi-temporal and multi-spectral remote sensing data, researchers can extract crop phenological characteristics. In particular, time series data derived from vegetation indices, such as the Normalized Difference Vegetation Index (NDVI), combined with information on key phenological stages, have been successfully used for winter wheat identification, mapping, and phenological monitoring [3,4,5,6].
In recent years, the emergence of multiple remote sensing satellite data sources, including Moderate Resolution Imaging Spectroradiometer (MODIS), Landsat, Sentinel, and the Gaofen (GF) series, has provided abundant data resources for crop classification. These platforms exhibit substantial differences in spatial resolution, revisit frequency, and spectral configuration. MODIS offers high temporal resolution (1–2 days), making it suitable for time series analysis, but its spatial resolution is relatively coarse, ranging from approximately 250 m to 1 km [7]. Landsat-8 provides a spatial resolution of 30 m, with spectral coverage from the visible to the shortwave-infrared regions and a revisit cycle of 16 days [8]. Sentinel-2 features 13 spectral bands with spatial resolutions of 10, 20, and 60 m, including red-edge and shortwave-infrared bands, with a revisit cycle of 5 days [9]. The GF series (e.g., GF-1 and GF-6) offers spatial resolutions ranging from 2 to 16 m, and some sensors are equipped with distinctive bands, such as the yellow band; however, data acquisition frequency and spectral configurations vary considerably across platforms [10].
Large-scale crop classification has gradually become a key direction for improving the accuracy and efficiency of agricultural monitoring. In this process, researchers have employed a variety of satellite datasets to meet different application requirements. Early studies primarily relied on optical data with moderate to coarse spatial resolutions, such as MODIS imagery, for crop mapping; however, the insufficient spatial resolution limited the ability to capture fine-scale surface variations [11,12]. Fan et al. (2024) [13] conducted winter wheat mapping across major wheat-growing regions in China using Sentinel-2 data. Nevertheless, in hilly areas with frequent cloudy and rainy conditions, relying solely on optical imagery is prone to cloud contamination, making it difficult to consistently acquire high-quality observations [14,15]. In recent years, synthetic aperture radar (SAR) data have also been applied to crop classification. Sentinel-1 provides all-weather acquisition capabilities and is largely unaffected by cloud cover. It provides imagery with an approximate spatial resolution of 10 m and a nominal revisit interval of 6 days for the two-satellite constellation, or 12 days for a single satellite. Sentinel-1 time series data, either alone or combined with optical imagery, have been successfully applied to regional and parcel-scale crop classification [16,17,18]. However, the scattering characteristics of SAR data may reduce the separability of certain land cover types, and SAR observations are susceptible to interference and noise. These studies indicate that single-source remote sensing data exhibit inherent limitations in achieving high-accuracy crop classification. Recent studies have therefore increasingly explored the integration of optical and SAR data for precision agricultural monitoring. Maleki et al. (2024) reported that combining Sentinel-1 backscatter with Sentinel-2 spectral and vegetation index features improved summer crop classification, although the contribution of each sensor varied among crop types [19]. Brickner et al. (2025) further demonstrated the value of multi-temporal optical and SAR features for field-scale crop mapping in heterogeneous agricultural landscapes [20]. These findings indicate that the effectiveness of optical–SAR fusion may vary with crop type, phenological stage, and regional conditions, highlighting the need to evaluate different sensor combinations across key winter wheat growth stages.
Machine learning has become an important tool for crop classification because of its ability to process large and heterogeneous remote sensing datasets and capture complex relationships among input features [19,20,21]. Conventional machine learning algorithms, including Random Forest (RF) and Support Vector Machine (SVM), remain widely used because of their robustness, computational efficiency, and adaptability to heterogeneous agricultural landscapes [22,23,24,25]. More recently, advanced boosting algorithms, such as Extreme Gradient Boosting (XGBoost) and Light Gradient Boosting Machine (LightGBM), together with deep learning architectures, including convolutional neural networks (CNNs) and spatiotemporal Transformers, have been increasingly applied to crop mapping and phenological monitoring using optical and SAR time series data [26,27,28]. These methodological advances have strengthened the extraction of nonlinear spectral, temporal, and spatial patterns. However, crop classification performance remains influenced by sensor characteristics, phenological stages, sample conditions, and landscape heterogeneity. Therefore, systematic evaluation of different sensor combinations under a consistent classification framework remains important for identifying the contributions of individual data sources across crop growth stages.
Although optical–SAR fusion has been increasingly explored, single-source imagery remains common in operational crop-mapping applications because of constraints related to data availability, processing complexity, and timeliness. This reliance may limit the temporal stability and spatial consistency of classification results. Therefore, a systematic evaluation of the potential of multi-source remote sensing data for wheat classification, along with the identification of suitable data combinations and their applicability across key phenological stages, is of great importance for improving both the accuracy and timeliness of remote sensing-based monitoring. Accordingly, this study systematically evaluated winter wheat classification using multi-source satellite imagery within a consistent machine learning framework. To isolate the effects of sensor combinations and phenological development, RF was used consistently across all experiments. The classification performance of different data source combinations, including Sentinel-1, Sentinel-2, Landsat-8/9, and their multi-source combinations, was systematically analyzed across major wheat phenological stages. The complementary effects of optical and radar features were compared, the optimal data combinations and phenological stages for high-accuracy classification were identified, and the contributions of different spectral bands and backscattering features to classification performance at each stage were further examined.
2. Materials and Methods
2.1. Study Area
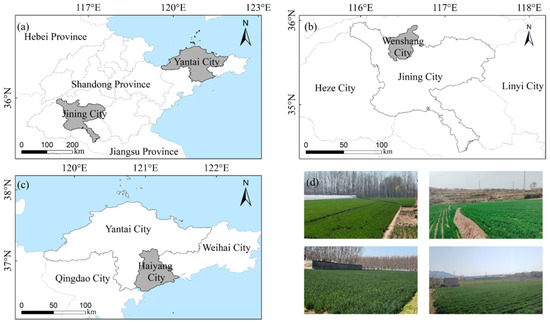
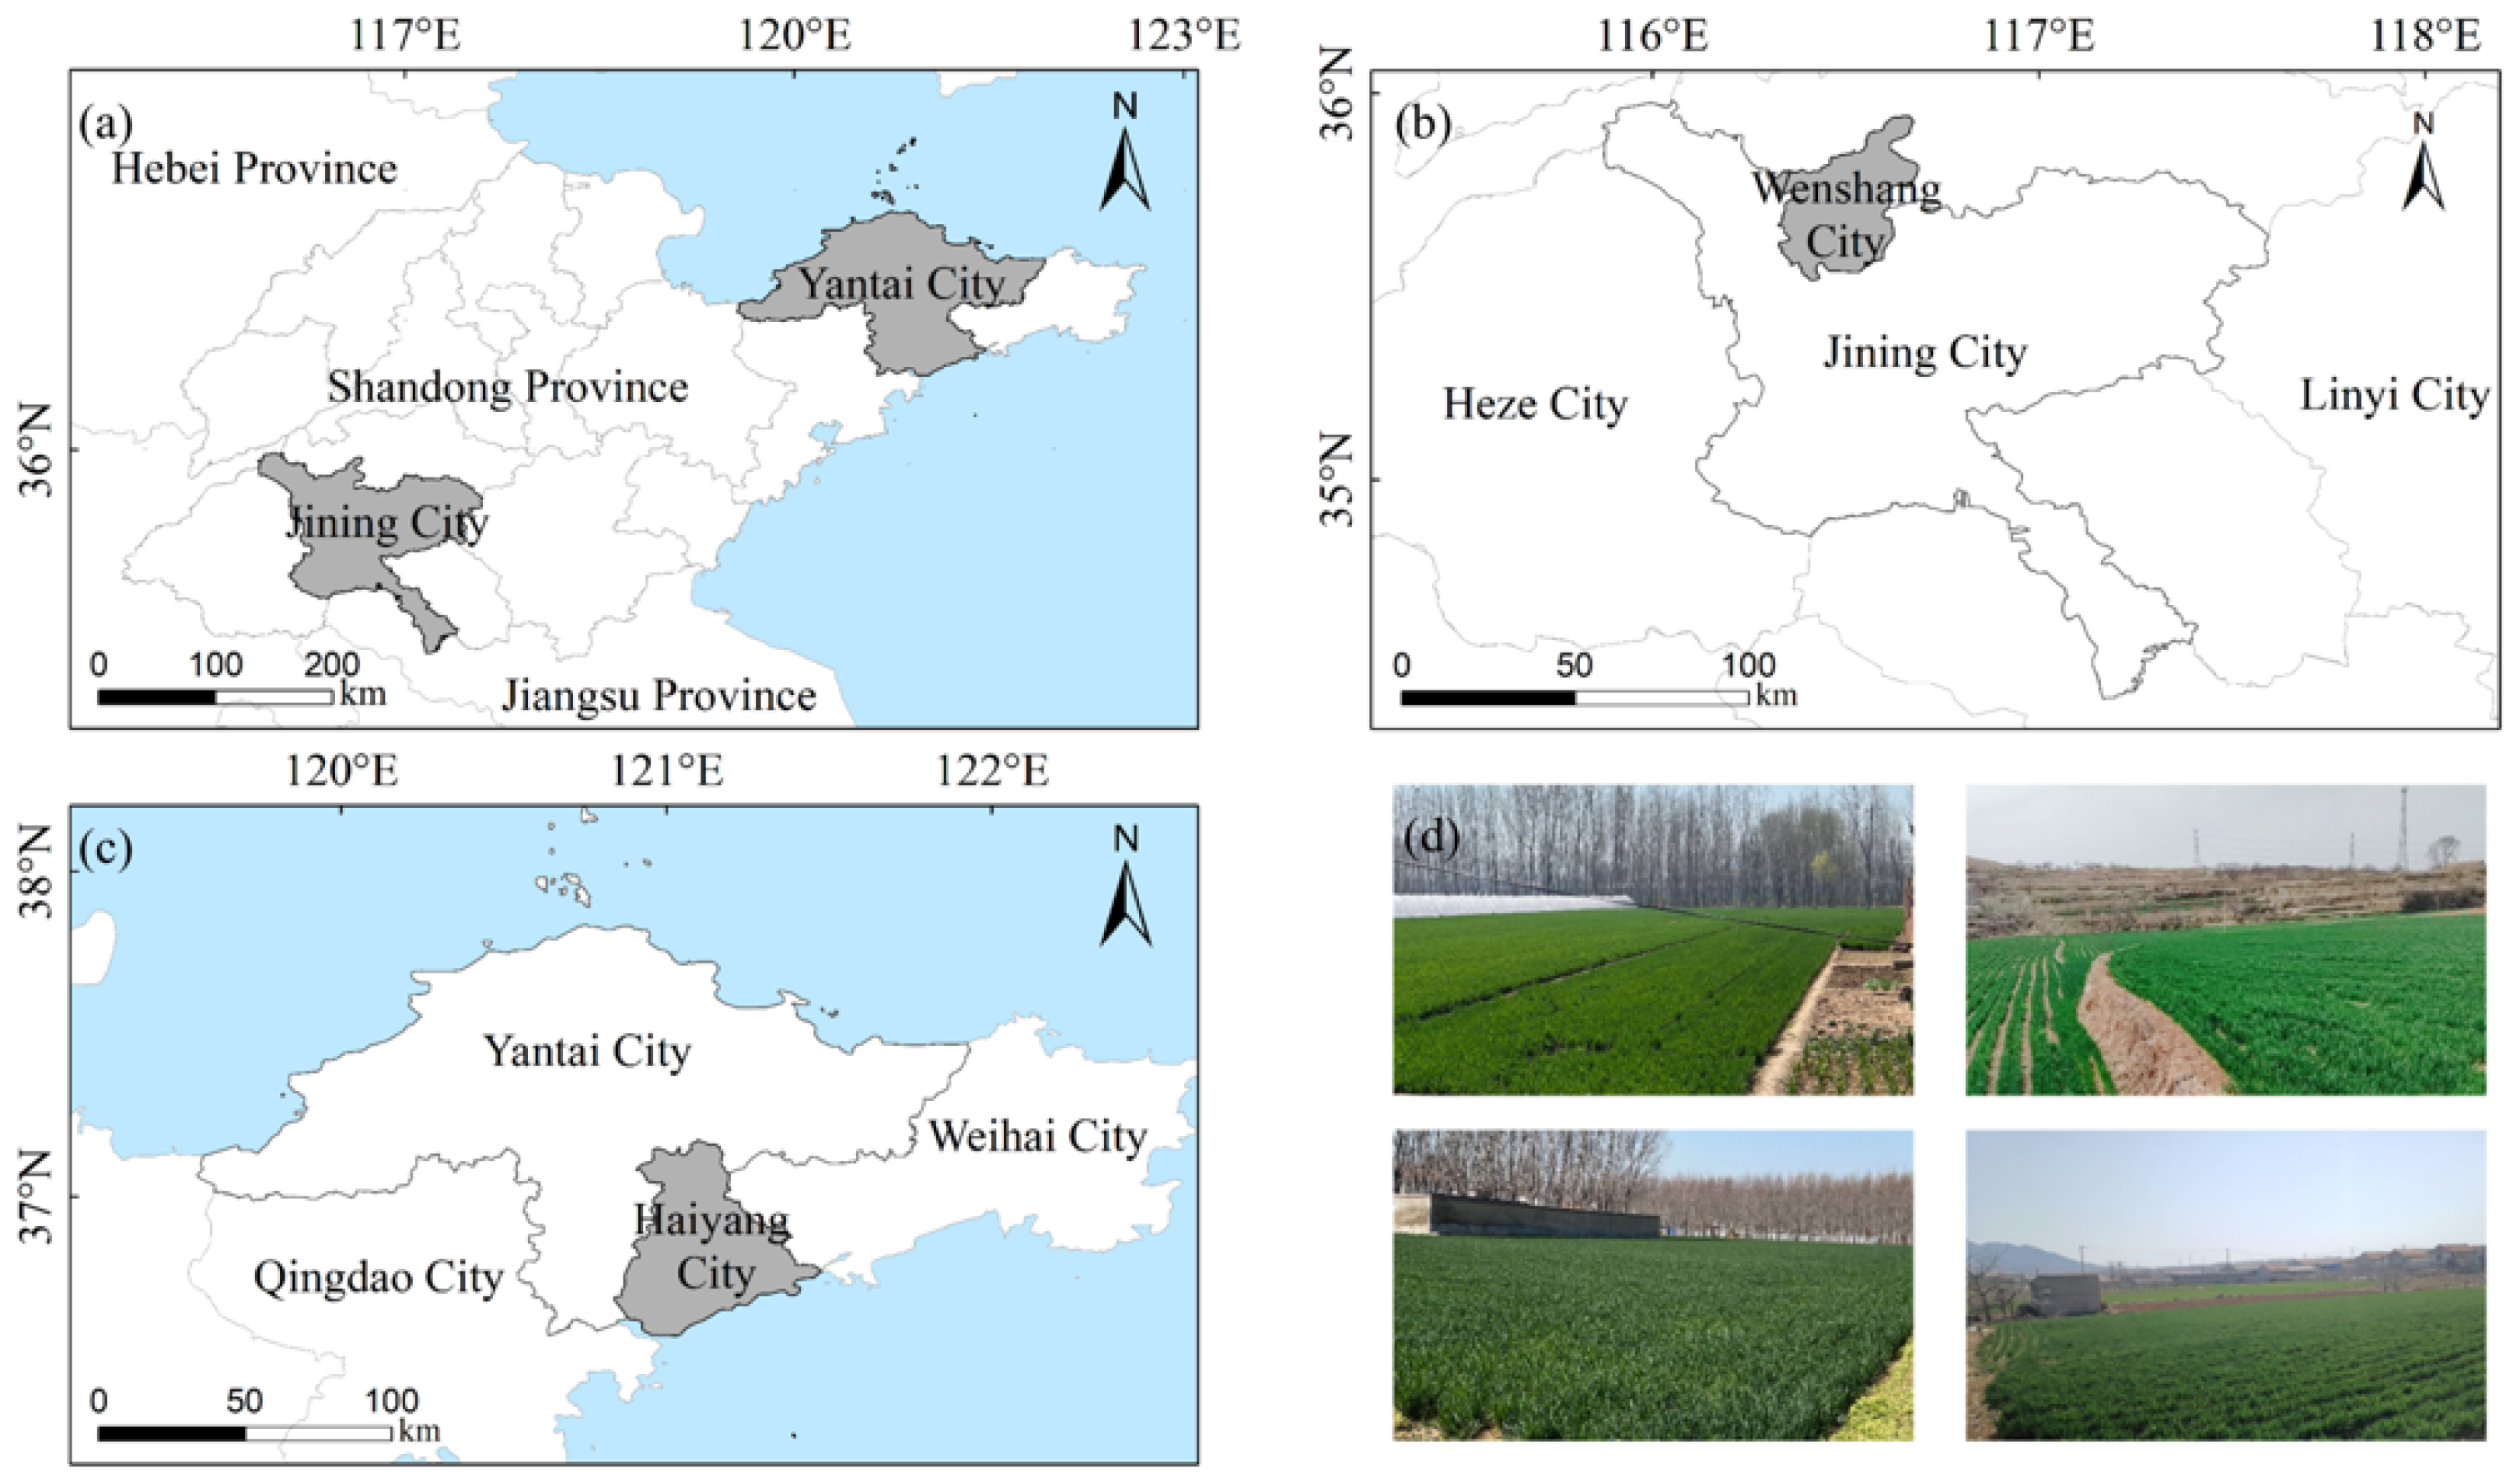
Wenshang County in Jining City and Haiyang City in Yantai City in Shandong Province were selected as the study areas, representing the central inland region and the southeastern coastal region of Shandong Province, respectively (Figure 1). Wenshang County is located in the central part of the Luxi Plain, with geographic coordinates ranging from 116°18′ E to 116°40′ E and from 35°30′ N to 35°50′ N. The terrain is predominantly flat with fertile soils, making it a typical agricultural region of the Huang–Huai–Hai Plain. Haiyang City is situated along the southern coast of the Jiaodong Peninsula, with geographic coordinates between 120°50′ E and 121°30′ E and 36°15′ N to 37°10′ N. Its topography slopes from northwest to southeast, characterized by low mountainous and hilly areas in the northwest and coastal plains in the southeast. Both regions belong to the temperate monsoon climate zone, featuring distinct seasons with hot and rainy summers, cold and dry winters, abundant sunshine, and sufficient thermal resources. The cropping systems in the study areas are typical of northern China, with wheat serving as the dominant winter crop and entering the jointing and rapid growth stages in spring. In addition to wheat, the regions also cultivate maize, peanut, and various fruit trees, forming a complex agricultural landscape dominated by a wheat–maize rotation system.
Figure 1.
Location of the study areas: (a) location of Shandong Province in China; (b) Wenshang County in Jining City; (c) Haiyang City in Yantai City; and (d) field photographs of winter wheat in the study areas.
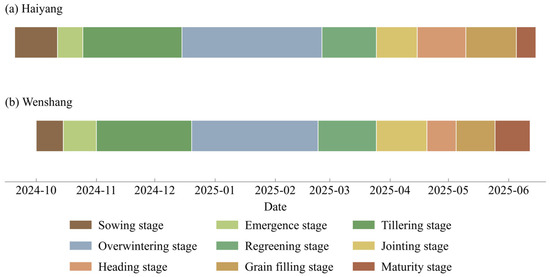
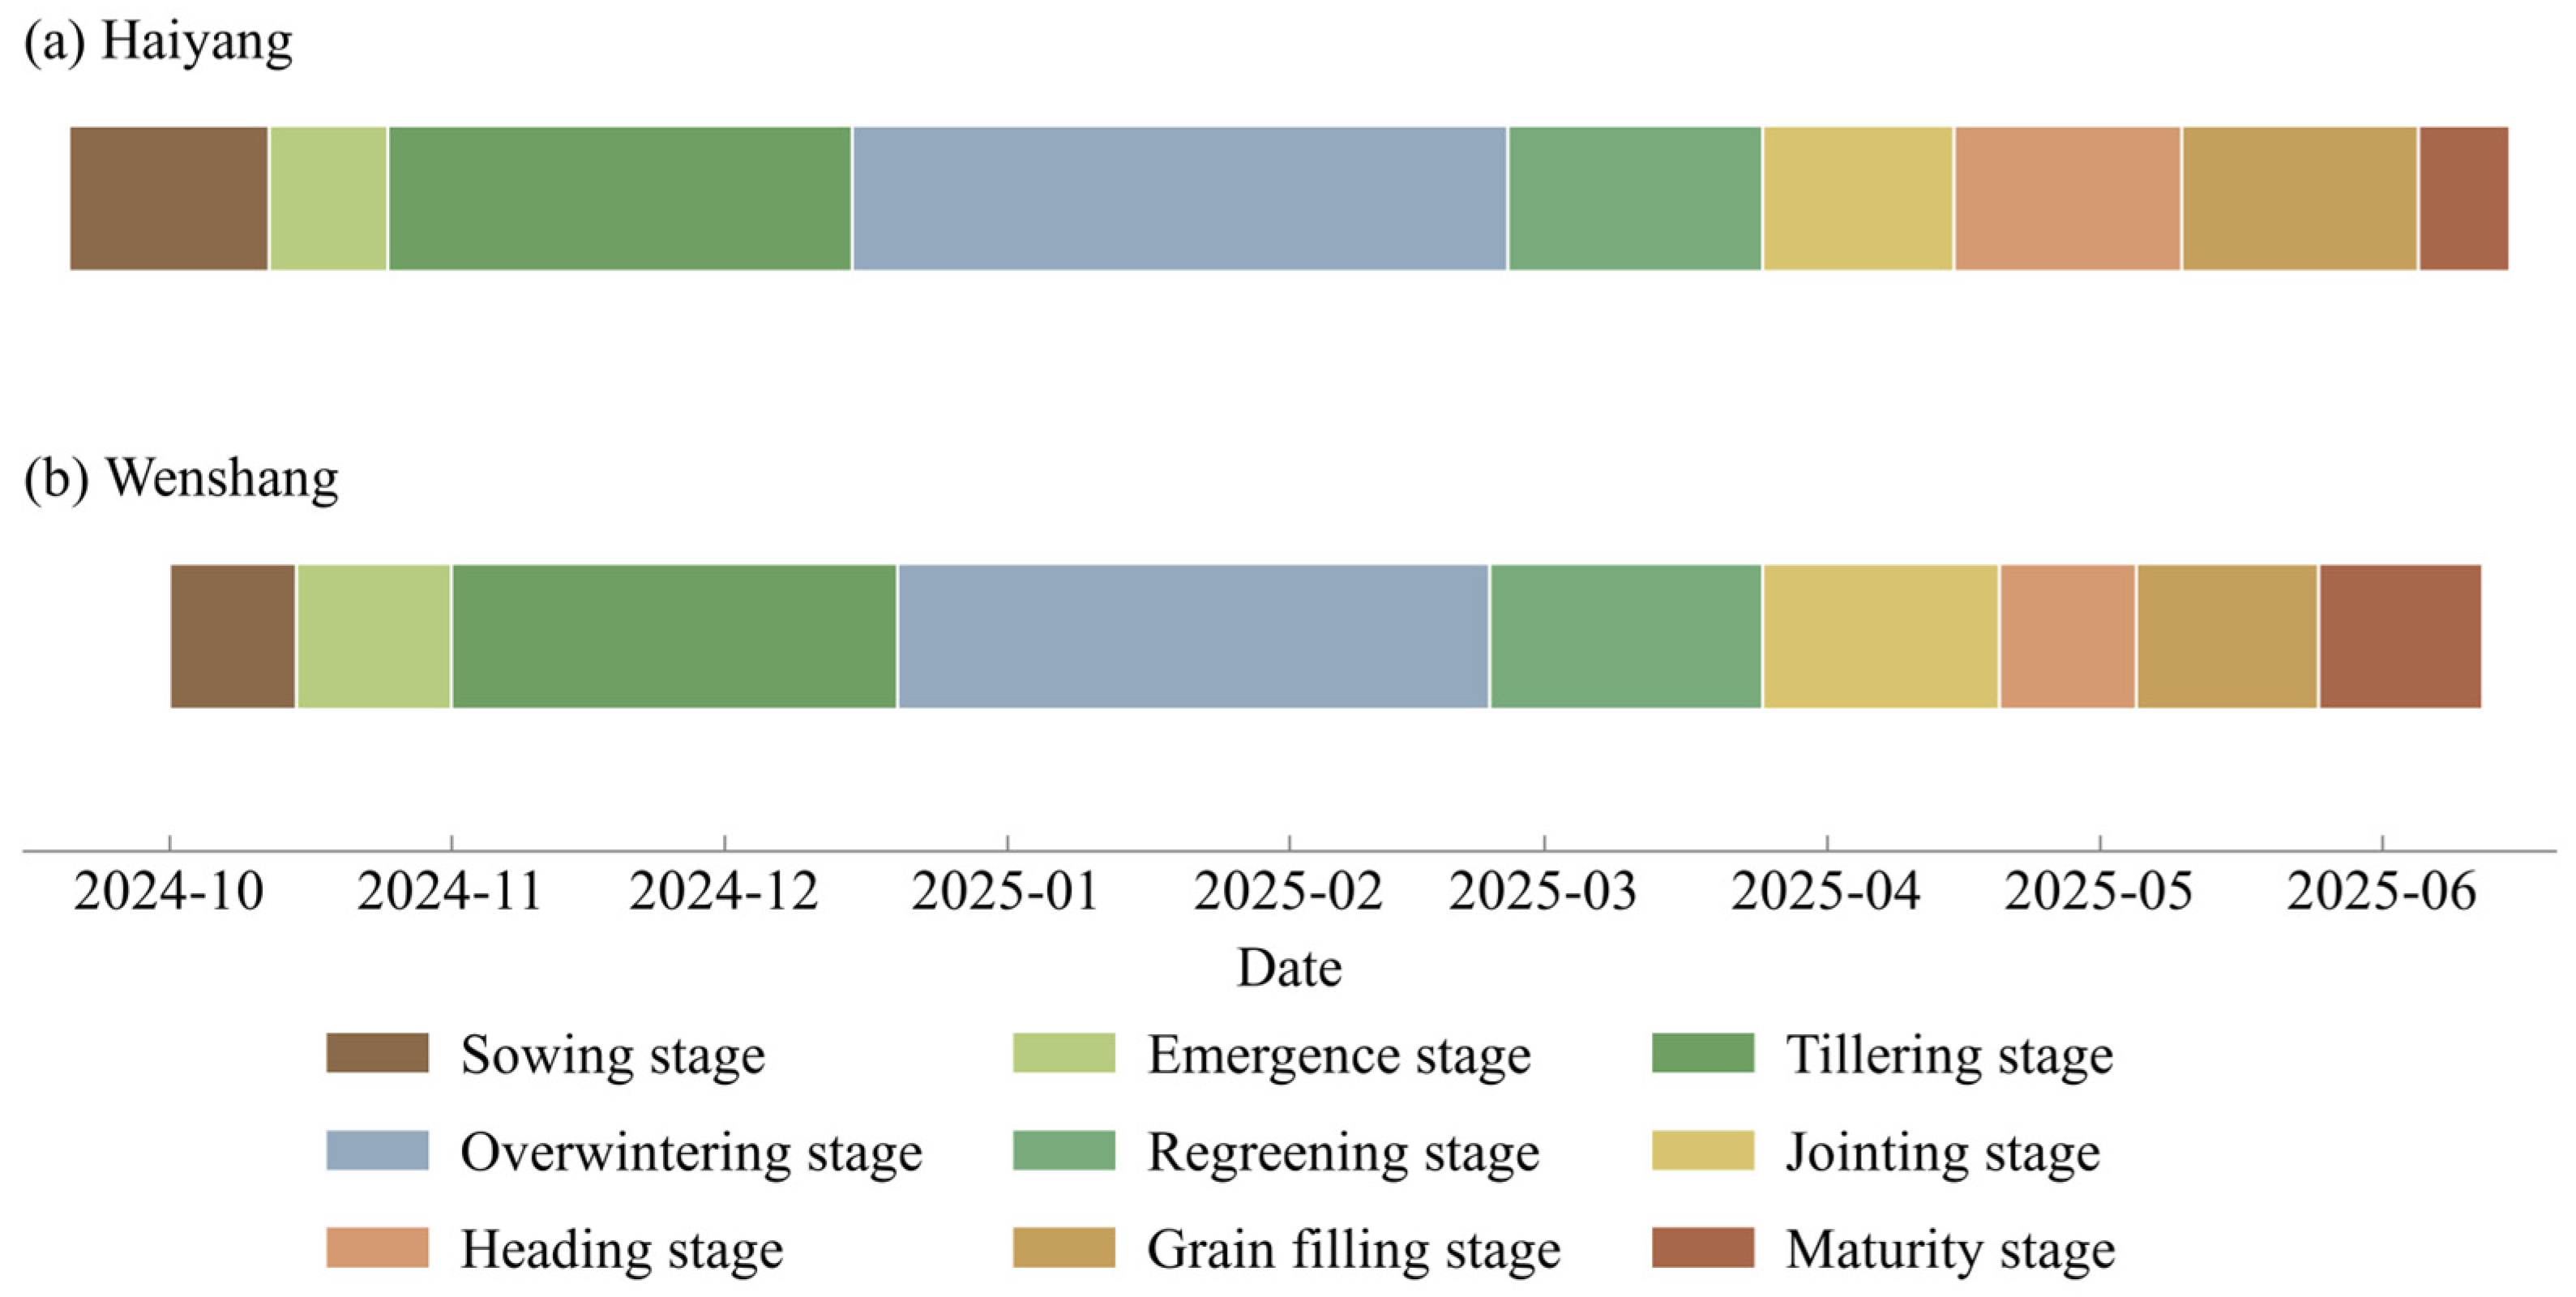
In this study, the phenological stages of winter wheat were delineated by analyzing the NDVI curve characteristics over the entire growth cycle in combination with field surveys. As shown in Figure 2, the overall phenological progression of winter wheat in Haiyang and Wenshang is generally similar, although clear temporal differences exist among individual stages. Wheat development in Haiyang tends to occur earlier. Sowing and emergence are typically completed from late September to late October, followed by the onset of the tillering stage in late October and a prolonged overwintering period. Regreening occurs from late February to late March of the following year, the jointing stage spans from late March to mid-April, heading takes place from mid-April to early May, grain filling begins in early May, and physiological maturity is reached in early June. In contrast, the phenological calendar of winter wheat in Wenshang is slightly delayed overall. Sowing and emergence are concentrated in October, with the tillering stage starting in early November and the overwintering period extending from late December to the following February. Regreening generally occurs from late February to late March, followed by jointing from late March to late April, heading from late April to May, grain filling in May, and maturity around mid-June.
Figure 2.
Winter wheat phenology in the study areas: (a) Haiyang; (b) Wenshang.
2.2. Datasets
All satellite imagery used in this study was accessed through the Google Earth Engine (GEE) Data Catalog (https://earthengine.google.com/). The specific products, data providers, and collection identifiers are summarized in Table 1.
Table 1.
Satellite datasets used in this study.
2.2.1. Optical Data
Optical data were derived from the Sentinel-2 and Landsat-8/9 datasets. Sentinel-2 is part of the European Space Agency’s Copernicus Programme and carries a Multispectral Instrument (MSI) comprising 13 spectral bands with native spatial resolutions of 10, 20, and 60 m. Ten Level-2A surface reflectance bands were selected in this study, including B2, B3, B4, and B8 at a native spatial resolution of 10 m, and B5, B6, B7, B8A, B11, and B12 at a native spatial resolution of 20 m. Prior to feature extraction, the 20 m bands were resampled to a common 10 m analysis grid using bilinear interpolation. The selected bands cover the visible, red-edge, near-infrared, and shortwave-infrared spectral regions, whereas the 60 m bands were not included in the classification feature set. Sentinel-2 provides a nominal revisit interval of approximately 5 days.
Landsat-8 and Landsat-9 were successfully launched in 2013 and 2021, respectively, and together constitute the core of the current Landsat land observation mission. The two satellites feature highly consistent sensor configurations and spectral settings, each carrying an Operational Land Imager (OLI/OLI-2) and a Thermal Infrared Sensor (TIRS/TIRS-2), covering a total of 11 spectral bands from the visible to the near-infrared, shortwave infrared, and thermal infrared regions [29]. The OLI sensor provides nine multispectral bands with a spatial resolution of 30 m (15 m for the panchromatic band). Landsat-9 further enhances radiometric resolution to 14 bits, enabling the detection of more subtle surface reflectance variations. Both satellites have a nominal revisit period of 16 days, and through phased orbital complementarity, their combined operation reduces the effective global land revisit cycle to 8 days. Owing to their long observation history and stable image quality, Landsat data have been widely used in studies of land use analysis, vegetation dynamics monitoring, and crop classification [30].
During image preprocessing, Sentinel-2 Level-2A surface reflectance data and Landsat-8/9 Collection 2 Tier 1 Level-2 surface reflectance data were used to improve the consistency of multi-date optical observations. For Sentinel-2, pixels classified in the Scene Classification Layer as no data, saturated or defective pixels, cloud shadows, clouds with medium or high probabilities, thin cirrus, or snow and ice were excluded. For Landsat-8/9, atmospherically corrected surface reflectance products generated using the Land Surface Reflectance Code were used. The digital numbers of bands SR_B1–SR_B7 were converted to surface reflectance using the Collection 2 scale factor and offset. Fill pixels, dilated clouds, cirrus, clouds, cloud shadows, snow, and radiometrically saturated pixels were removed using the QA_PIXEL and QA_RADSAT bands. The 20 m Sentinel-2 bands and the 30 m Landsat-8/9 bands were resampled to the common 10 m analysis grid using bilinear interpolation, and all optical images were clipped to the study-area boundaries.
2.2.2. Radar Data
Radar data were obtained from the Sentinel-1 Ground Range Detected collection available in GEE. Sentinel-1 is a key radar observation platform of the Copernicus Programme jointly implemented by the European Commission and the European Space Agency [31]. In this study, Interferometric Wide Swath (IW) scenes with VV and VH polarizations were used. The VV and VH bands are provided at a 10 m pixel spacing in the GEE collection, and the IW mode has a nominal swath width of approximately 250 km. VV and VH represent vertical transmission with vertical and horizontal reception, respectively. The two-satellite constellation has a nominal revisit interval of approximately 6 days.
Sentinel-1 Level-1 Ground Range Detected imagery was obtained from the COPERNICUS/S1_GRD collection in GEE. The imagery had undergone the standard preprocessing implemented using the Sentinel-1 Toolbox, including orbit-file application, border-noise removal, thermal-noise removal, radiometric calibration, and terrain correction using the 30 m Shuttle Radar Topography Mission digital elevation model. The resulting backscatter coefficients were provided in decibels.
Interferometric Wide Swath images with VV and VH dual polarization and ascending-orbit acquisitions were selected. Relative orbit 171 was used for Haiyang and relative orbit 142 for Wenshang. A fixed orbit direction and relative orbit were retained to maintain consistent viewing geometry across phenological stages. Pixels with VV values of −30 dB or lower were masked to remove residual border noise. Speckle noise was reduced using a 3 × 3 median filter applied after converting the VV and VH data to the linear power domain, and the filtered values were subsequently converted back to dB. Four radar features were used VV and VH backscatter in dB, the VV–VH difference in dB, and the VH/VV ratio in the linear power domain, calculated as:
2.2.3. Temporal Coverage of Different Satellite Imagery
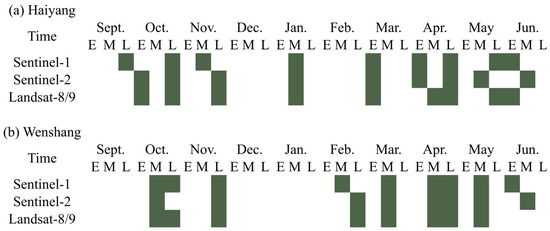
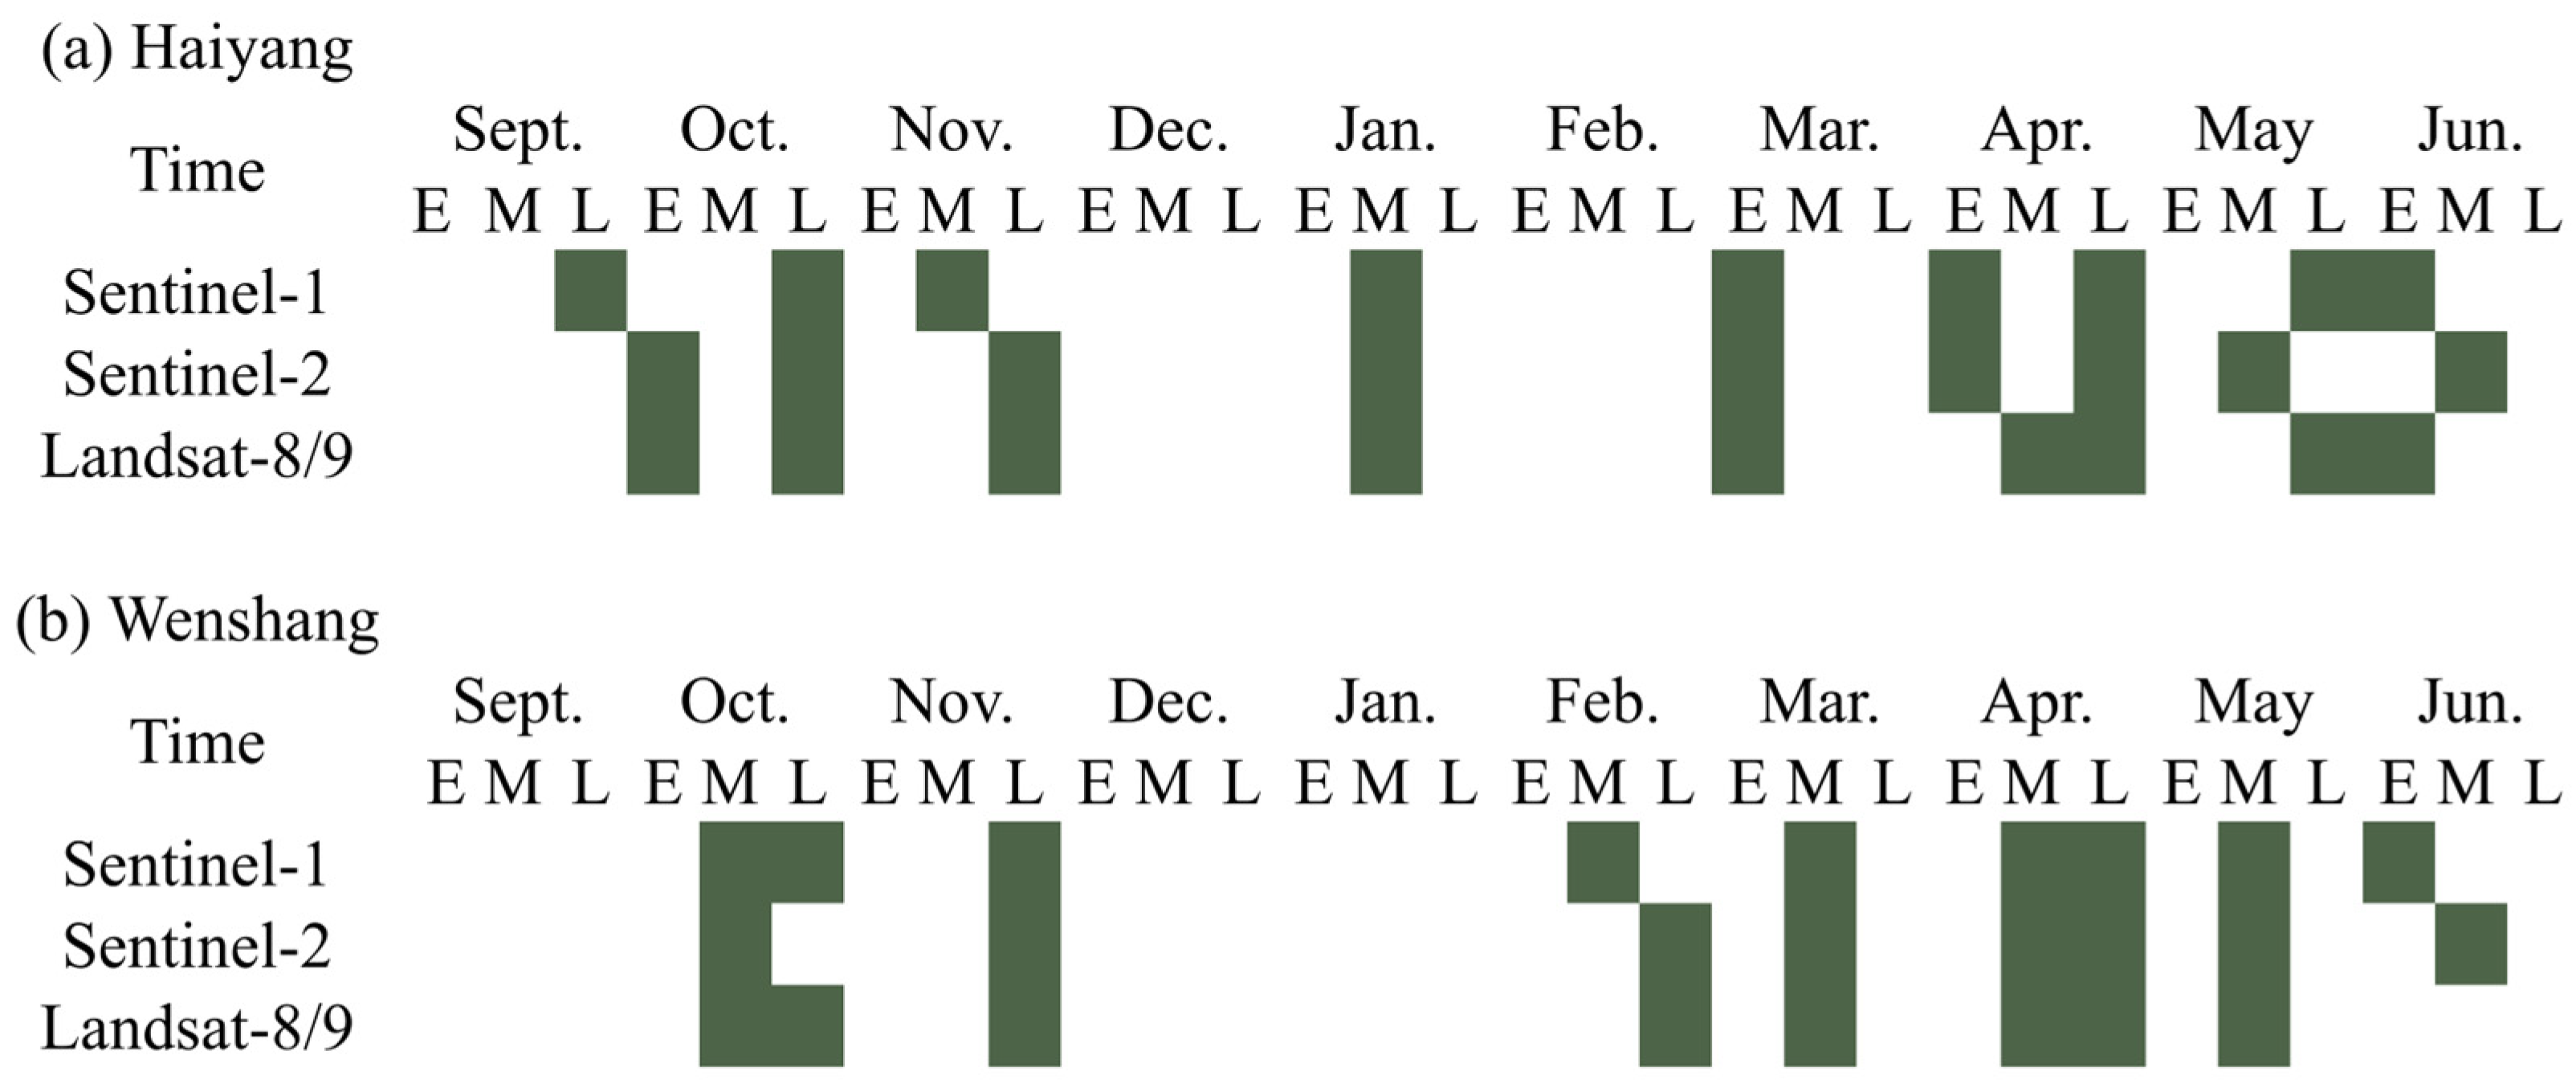
To construct a multi-source remote sensing feature set covering the main phenological stages of winter wheat, this study selected Sentinel-1, Sentinel-2, and Landsat-8/9 imagery for each growth stage in the Haiyang and Wenshang study areas, based on the typical phenological calendar of winter wheat (Figure 3). The selection of images was primarily based on image quality, cloud cover conditions, and spatial coverage, aiming to capture key surface changes during the crop growth process. The final time series dataset spans from the early sowing stage in September to the harvest period in June of the following year.
Figure 3.
Temporal distribution of the selected Sentinel-1, Sentinel-2, and Landsat-8/9 observations across winter wheat growth stages in (a) Haiyang and (b) Wenshang. E, M, and L denote the early, middle, and late ten-day periods of each month, respectively.
Acquisition dates were grouped into the early (E), middle (M), and late (L) ten-day periods of each month. One representative acquisition from each satellite data source was retained for each phenological stage and study area. Observations from all three data sources were available for all phenological stages in Haiyang. In Wenshang, Sentinel-2 imagery was unavailable for the emergence stage, and Landsat-8/9 imagery was unavailable for the maturity stage; these two sensor–stage combinations were therefore excluded from the corresponding comparisons. The resulting dataset enabled consistent stage-specific comparisons of individual sensors and multi-source combinations.
2.2.4. Sample Data
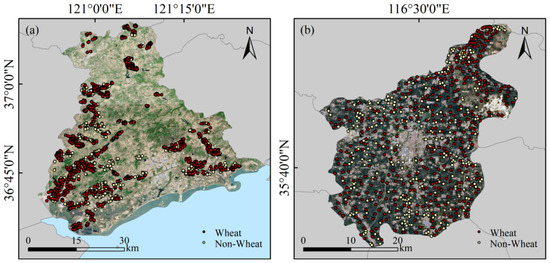
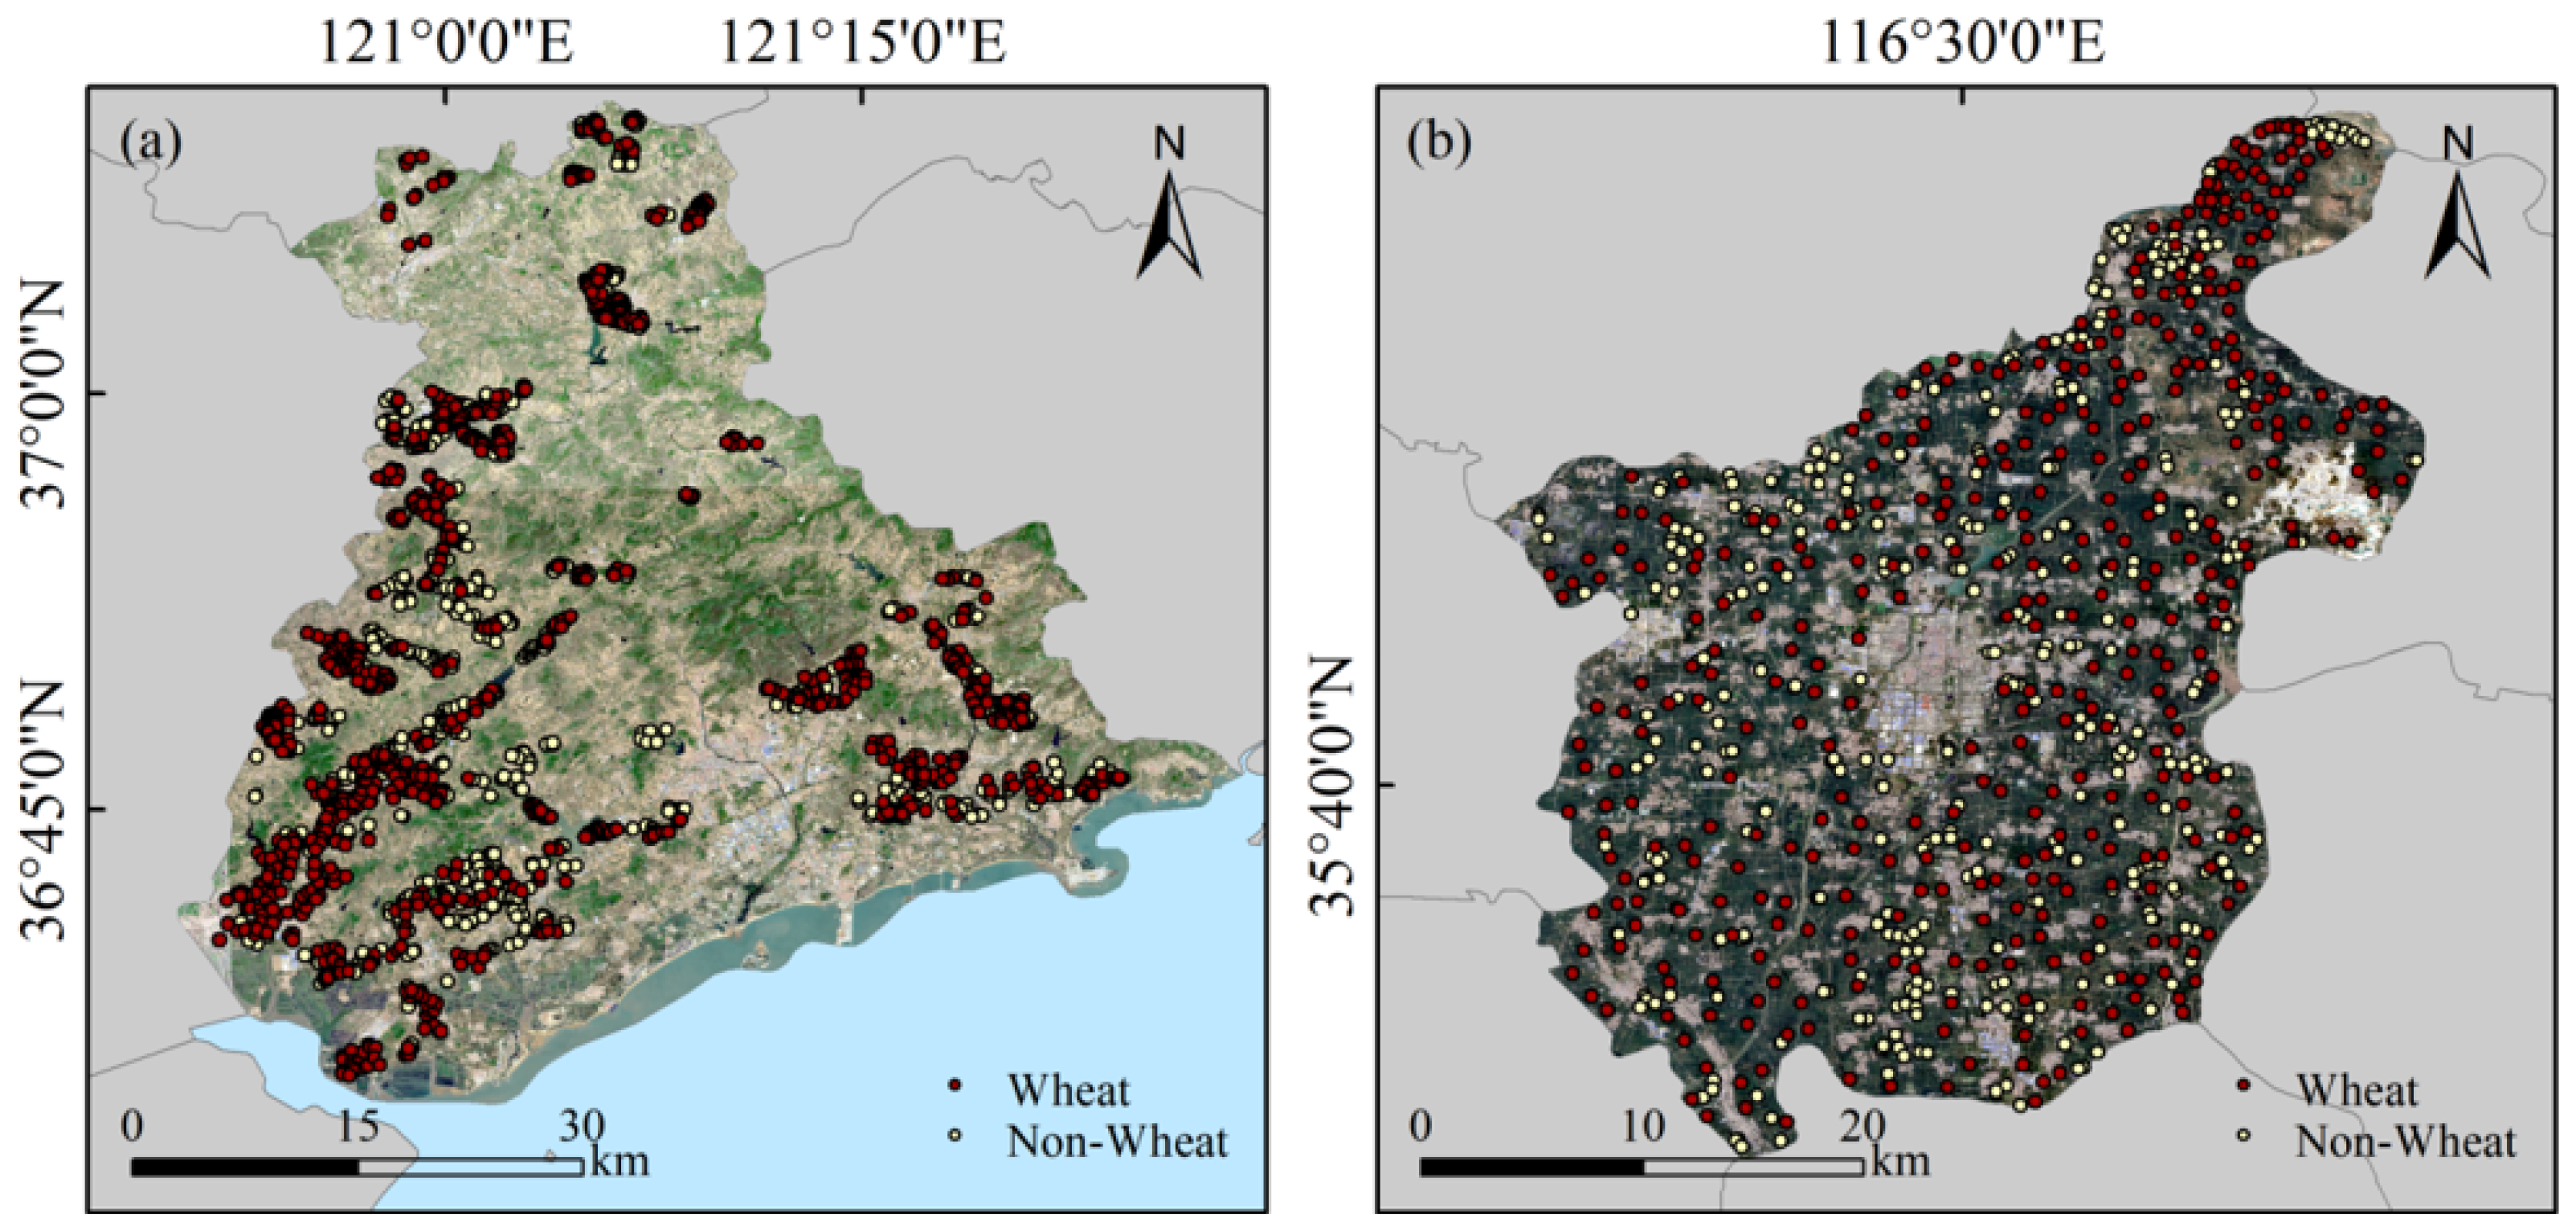
Reference samples were obtained from field surveys and supplementary visual interpretation. Field surveys were conducted in April using the GVG (v2.2.1) field survey system, when winter wheat was generally at the jointing-to-heading stages and its developed canopy facilitated discrimination from non-wheat land cover types. GVG integrates Global Positioning System (GPS), video, and a Geographic Information System (GIS) to record georeferenced imagery and crop information along survey routes [32]. Field samples were collected along accessible roads distributed across the principal agricultural areas of the two study sites, while additional samples were obtained through visual interpretation in areas insufficiently covered by the field routes to improve spatial coverage and reduce road accessibility bias. The resulting crop labels represented crop identity at the sampled locations for the corresponding growing season and were linked to multi-temporal Sentinel-1, Sentinel-2, and Landsat-8/9 observations. In total, 3452 sample points were collected, including 1861 winter wheat samples and 1591 non-wheat samples (Figure 4).
Figure 4.
Distribution of sampling points: (a) Haiyang; (b) Wenshang.
The samples were assigned to 1 km spatial blocks and partitioned at the block level using a class-stratified 70/30 development–test scheme. A 300 m exclusion buffer was applied around the test samples, and development samples within this buffer were removed. The development set (DEV) was used for model training and five-fold spatial cross-validation, whereas the independent test set (TEST) was reserved exclusively for final accuracy assessment. The same development–test partition and spatial cross-validation folds were retained across all phenological stages and sensor combinations.
2.3. Methods
2.3.1. Feature Extraction
For each study area, phenological stage, and available sensor, one representative quality-screened observation date was selected, and the corresponding features were extracted.
For Sentinel-1 imagery, four radar features were used to characterize surface backscattering and polarization differences: the filtered VV and VH backscatter coefficients in dB, the VV–VH difference in dB, and the VH/VV ratio calculated in the linear power domain. These features were extracted from ascending-orbit IW-mode observations with fixed relative orbits for the two study areas. For Sentinel-2 imagery, ten surface reflectance bands were selected as classification features, including B2, B3, B4, B5, B6, B7, B8, B8A, B11, and B12. Bands B2, B3, B4, and B8 have a native spatial resolution of 10 m, whereas bands B5, B6, B7, B8A, B11, and B12 have a native spatial resolution of 20 m. The 20 m bands were resampled to the 10 m analysis grid using bilinear interpolation, while the 60 m bands B1 and B9 were excluded from the classification feature set. For Landsat-8 and Landsat-9 imagery, seven surface reflectance bands, namely B1, B2, B3, B4, B5, B6, and B7, were selected as classification features. These bands cover the coastal aerosol, visible, near-infrared, and shortwave-infrared spectral regions and have a native spatial resolution of 30 m. Before feature extraction, the Landsat bands were resampled to the 10 m analysis grid using bilinear interpolation. Thermal infrared bands were not included in the classification feature set.
All satellite image preprocessing and feature extraction were performed using GEE, while the subsequent RF classification and accuracy assessment were also implemented on the same platform.
2.3.2. Classification Model
Features derived from Sentinel-2, Landsat-8/9, and Sentinel-1 were organized into combinations based on either individual data sources or multiple data sources and used as inputs to the RF classifier. Separate RF models were constructed for each study area, phenological stage, and available sensor combination. RF combines multiple decision trees generated through random sampling of observations and predictor variables and can also provide estimates of feature importance [33].
The predefined DEV spatial blocks were assigned to five mutually exclusive folds, with each block allocated entirely to a single fold. In each iteration, four folds were used for model training, and the remaining fold was used for validation. Training candidates located within 300 m of the validation samples were excluded before model fitting. Phenological stages and sensor combinations were compared using the five-fold results. Spatially structured validation was adopted to reduce optimistic accuracy estimates caused by spatial autocorrelation among nearby samples [34,35]. After the final configuration was determined, the RF model was trained using the complete DEV set and evaluated on the independent TEST set.
All experiments used the same RF configuration, including 150 trees, a minimum leaf population of 5, a bag fraction of 0.6, and a random seed of 42. No grid-search optimization was conducted, and the fixed parameter settings were applied consistently across all phenological stages and sensor combinations. Classification performance and stage-wise feature importance were summarized across the five folds. Feature importance was obtained from the Gini-based importance provided by the GEE RF classifier and was normalized within each fold-specific model before cross-fold summarization. After the final tillering-stage configurations had been selected, the models were retrained using the complete DEV sets, and their full-DEV feature importance was reported separately.
2.3.3. Accuracy Assessment
Classification performance was assessed using confusion matrices derived from the predicted and reference labels. Let denote a confusion matrix, where represents the number of samples predicted as class and assigned to reference class . Accordingly, rows represent predicted classes and columns represent reference classes. Overall accuracy (OA), user’s accuracy (UA), producer’s accuracy (PA), class-specific F1-score, and macro-averaged F1-score (Macro-F1) were calculated following established remote sensing accuracy assessment practices [36,37]:
where is the number of classes and is the total number of samples. Macro-F1 assigns equal weight to the class-specific F1-scores and was used as the primary metric for comparing phenological stages and sensor combinations. During five-fold spatial cross-validation, the metrics were calculated separately for each fold and summarized using the mean and standard deviation. The independent TEST set was reserved exclusively for the final performance assessment.
Within the DEV set, the earliest candidate observation stage was defined as the earliest phenological stage at which at least one available sensor combination achieved a mean Macro-F1 of at least 0.90 across the five spatial folds. Among the qualifying combinations at that stage, the combination with the highest mean Macro-F1 was selected. This threshold was used only for candidate selection, whereas the independent TEST set was used to assess spatial generalization.
3. Results
3.1. Classification Map
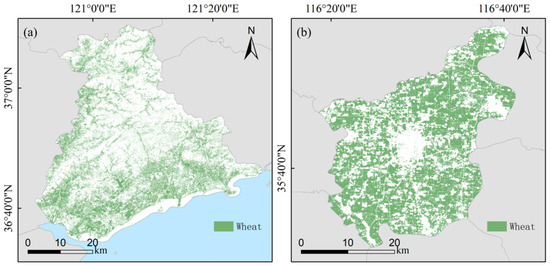
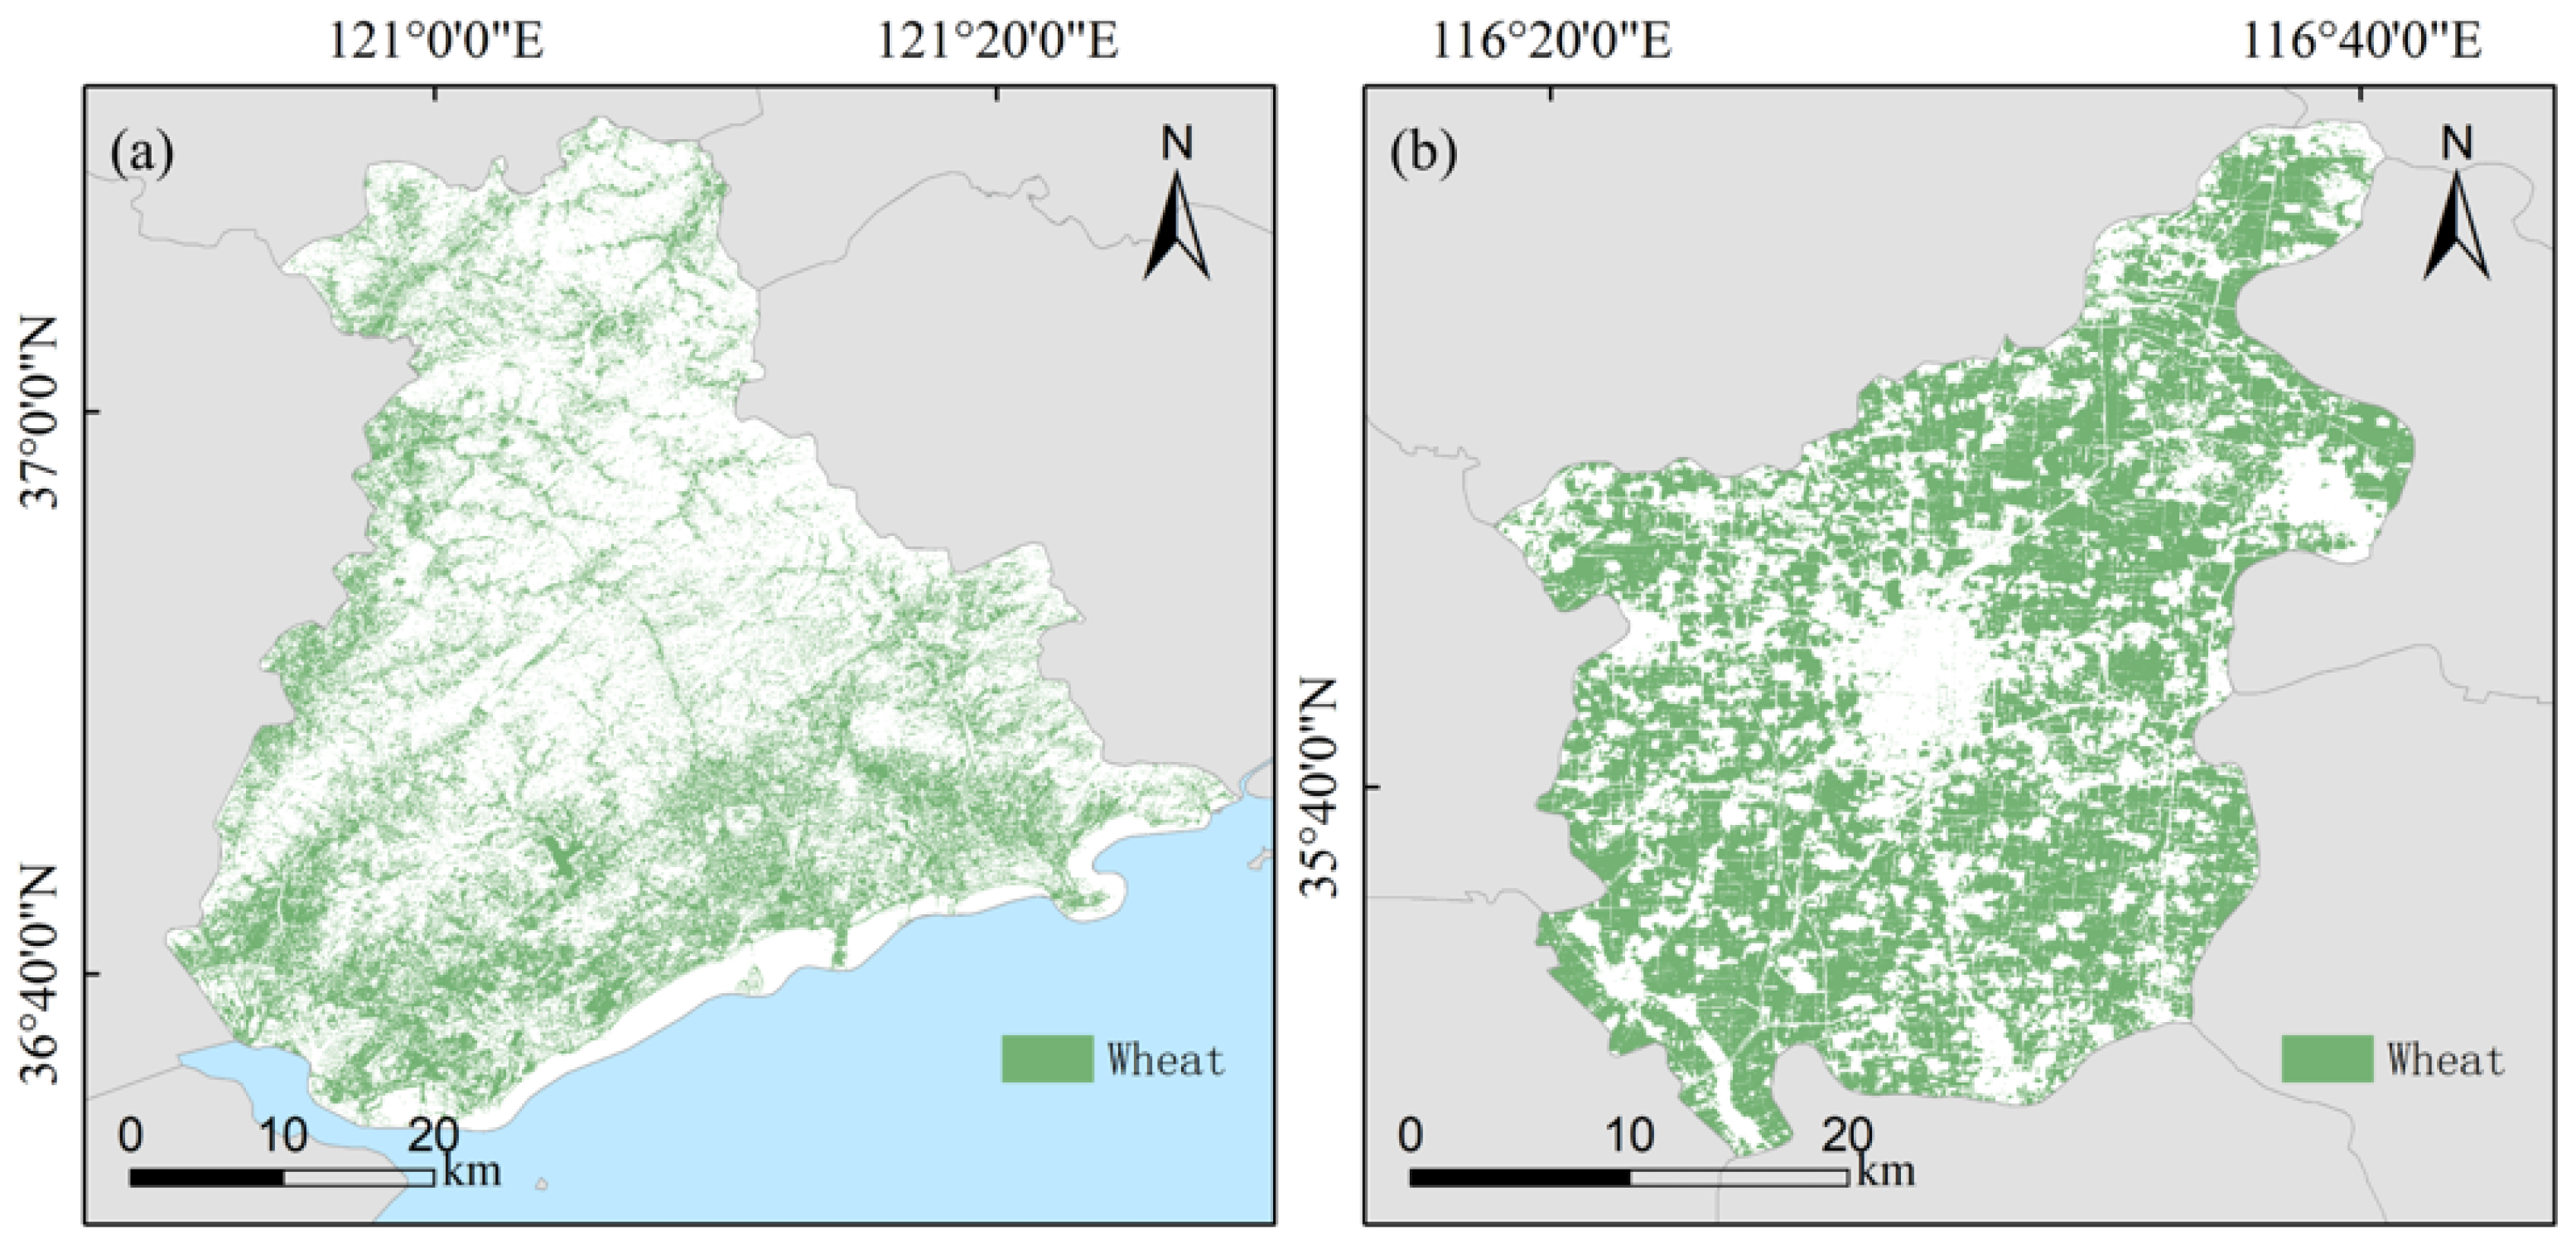
The winter wheat classification maps revealed pronounced differences in spatial distribution between Wenshang and Haiyang. In Wenshang, winter wheat was mainly distributed as large and contiguous patches within the principal cultivated areas, with interruptions near built-up areas and transportation corridors. The mapped patches generally showed regular spatial patterns and relatively low fragmentation.
In Haiyang, the mapped winter wheat distribution was more fragmented and less continuous. Winter wheat was mainly concentrated in relatively flat cultivated areas, whereas smaller and more scattered patches occurred in hilly and coastal zones. Several heterogeneous areas showed less clearly delineated patch boundaries.
Overall, the concentration and contiguity of mapped winter wheat were higher in Wenshang than in Haiyang, whereas the spatial pattern in Haiyang was more complex and fragmented (Figure 5).
Figure 5.
Winter wheat classification maps generated by the final tillering-stage RF models using (a) Sentinel-2 in Haiyang and (b) Sentinel-1, Sentinel-2, and Landsat-8 in Wenshang.
3.2. Classification Accuracy
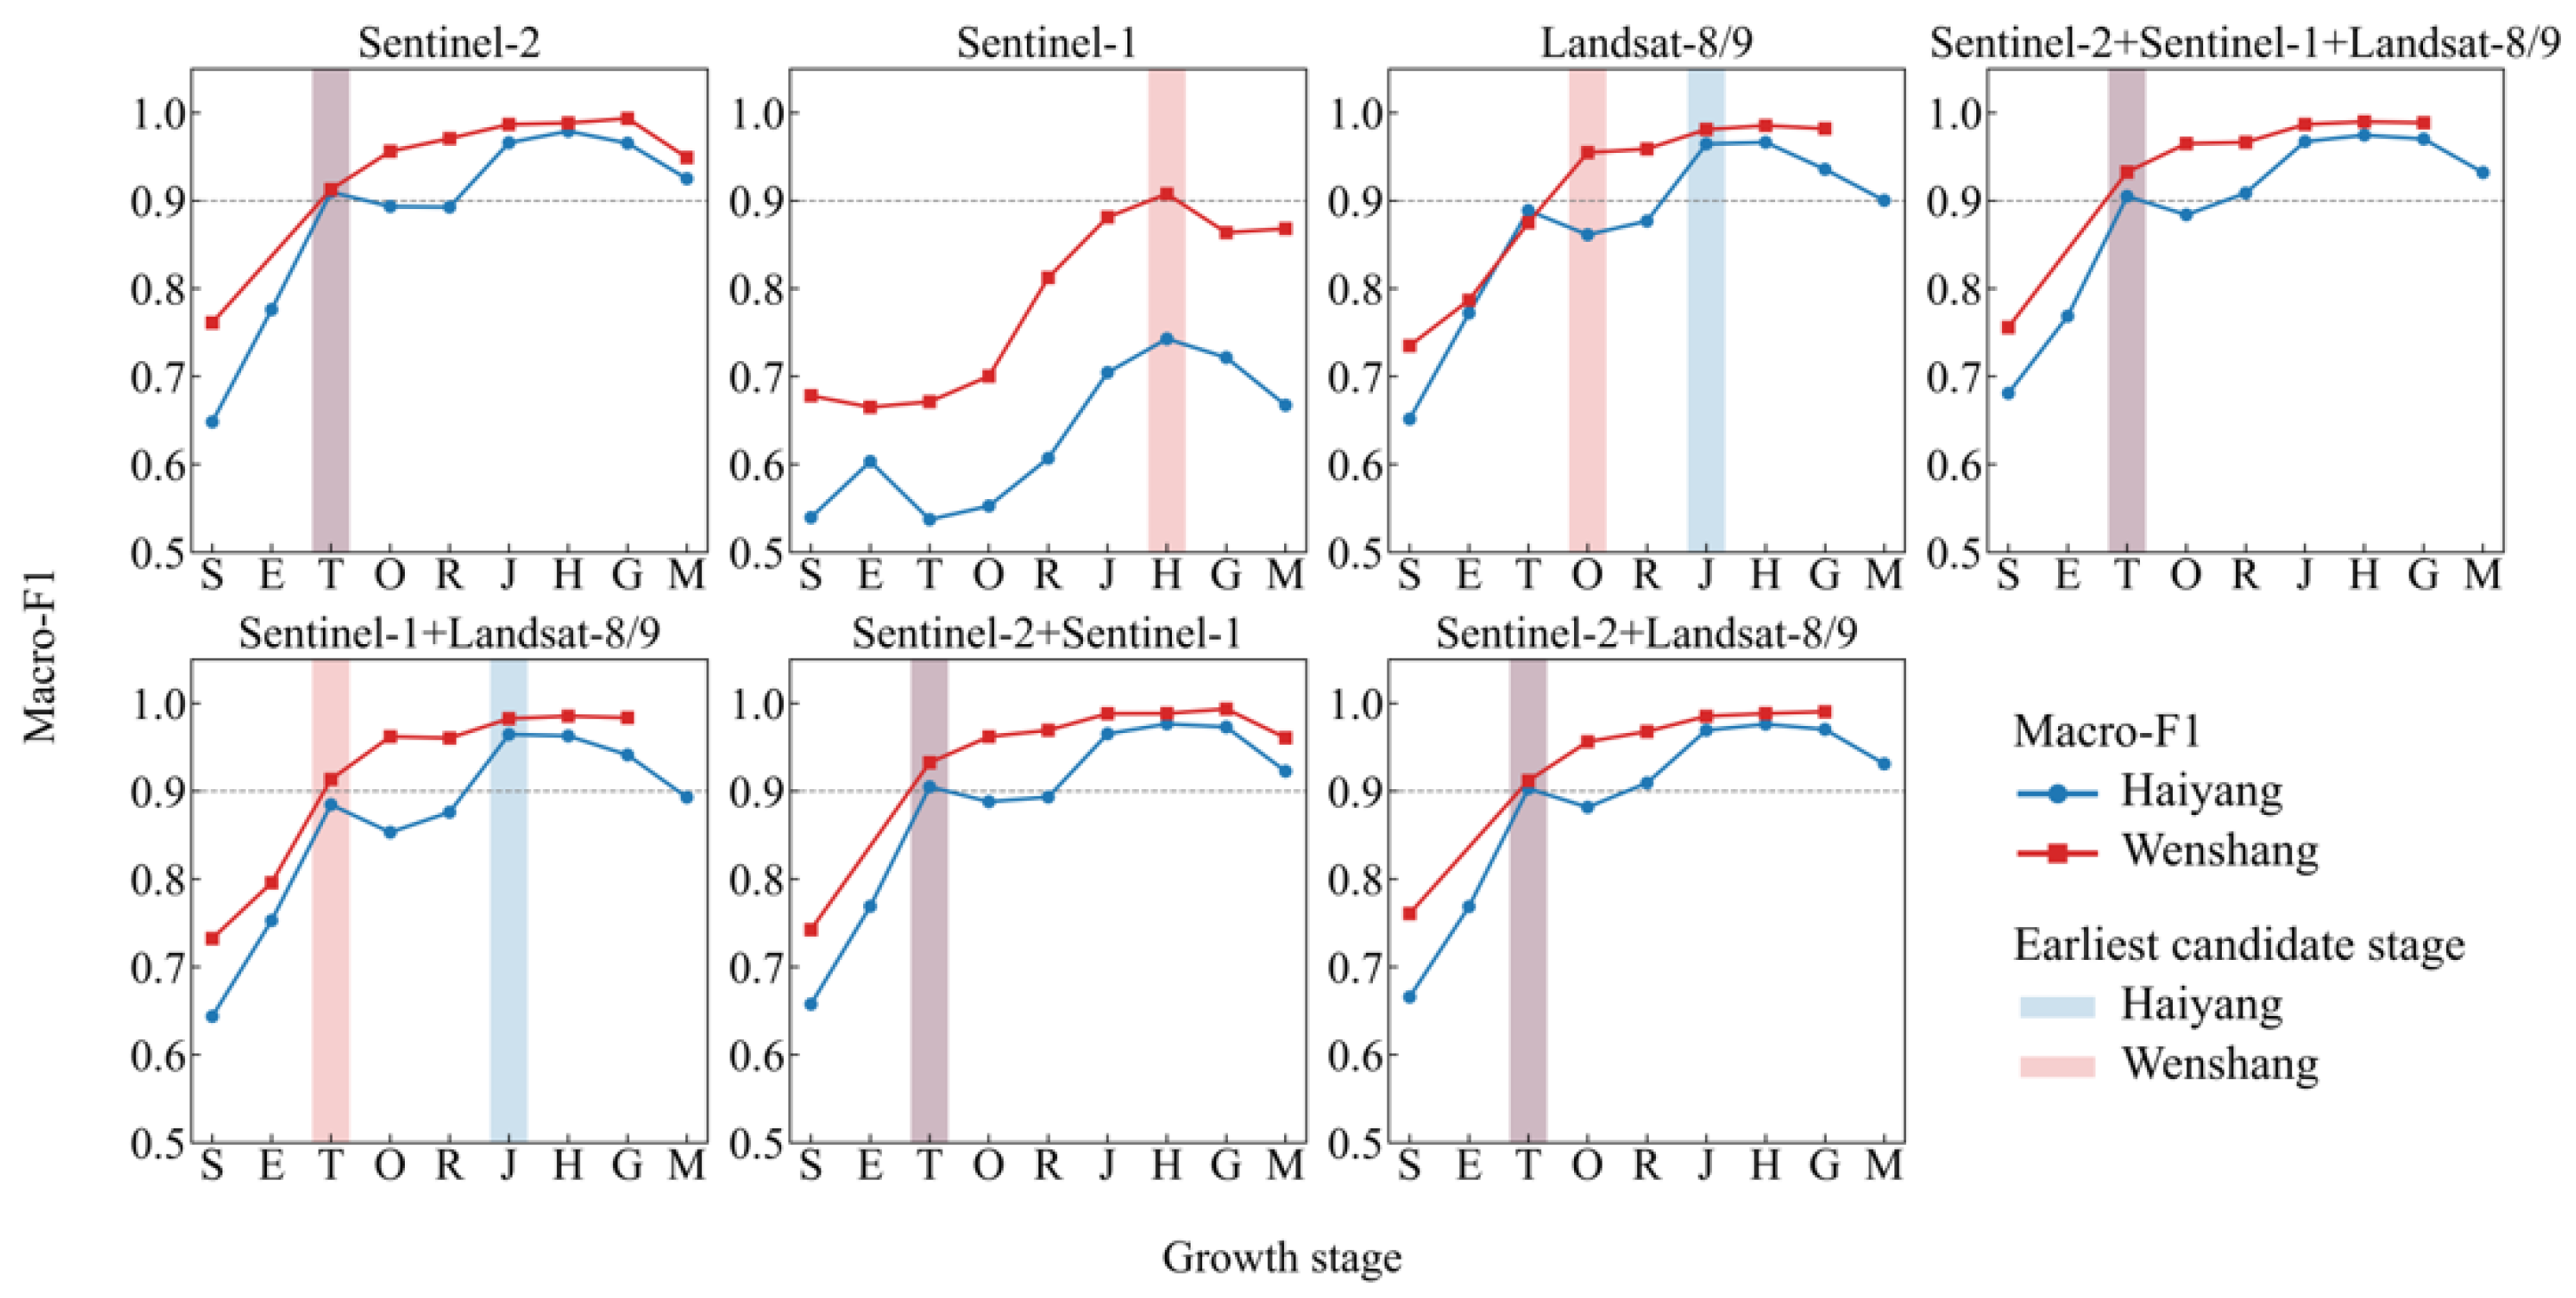
The five-fold spatial cross-validation results showed clear stage-dependent variations in winter wheat classification performance. Based on the predefined selection criterion of a mean Macro-F1 ≥ 0.90, the tillering stage was selected as the earliest candidate observation stage in both study areas. In Haiyang, Sentinel-2 achieved an OA of 0.9106 ± 0.0177 and a Macro-F1 of 0.9098 ± 0.0180. In Wenshang, the combination of Sentinel-1, Sentinel-2, and Landsat-8 achieved an OA of 0.9327 ± 0.0157 and a Macro-F1 of 0.9325 ± 0.0157. The highest Macro-F1 values were obtained at the heading stage in Haiyang using Sentinel-2 (0.9791 ± 0.0145) and at the grain-filling stage in Wenshang using Sentinel-2 (0.9936 ± 0.0079).
The final tillering-stage models were subsequently evaluated using the spatially independent TEST sets. In Haiyang, the model achieved an OA of 0.8747 and a Macro-F1 of 0.8732, indicating lower spatial generalization performance than that estimated by cross-validation. In Wenshang, the corresponding OA and Macro-F1 were both 0.9503, confirming reliable early classification at the tillering stage. The class-specific F1-scores for winter wheat and non-wheat were 0.8867 and 0.8598 in Haiyang and 0.9511 and 0.9495 in Wenshang, respectively. Detailed independent TEST results are presented in Table 2, Table 3 and Table 4.
Table 2.
Independent TEST accuracy of the final tillering-stage models.
Table 3.
Confusion matrix of the independent TEST results in Haiyang.
Table 4.
Confusion matrix of the independent TEST results in Wenshang.
3.3. Feature Importance
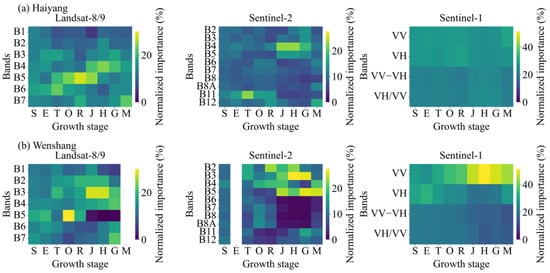
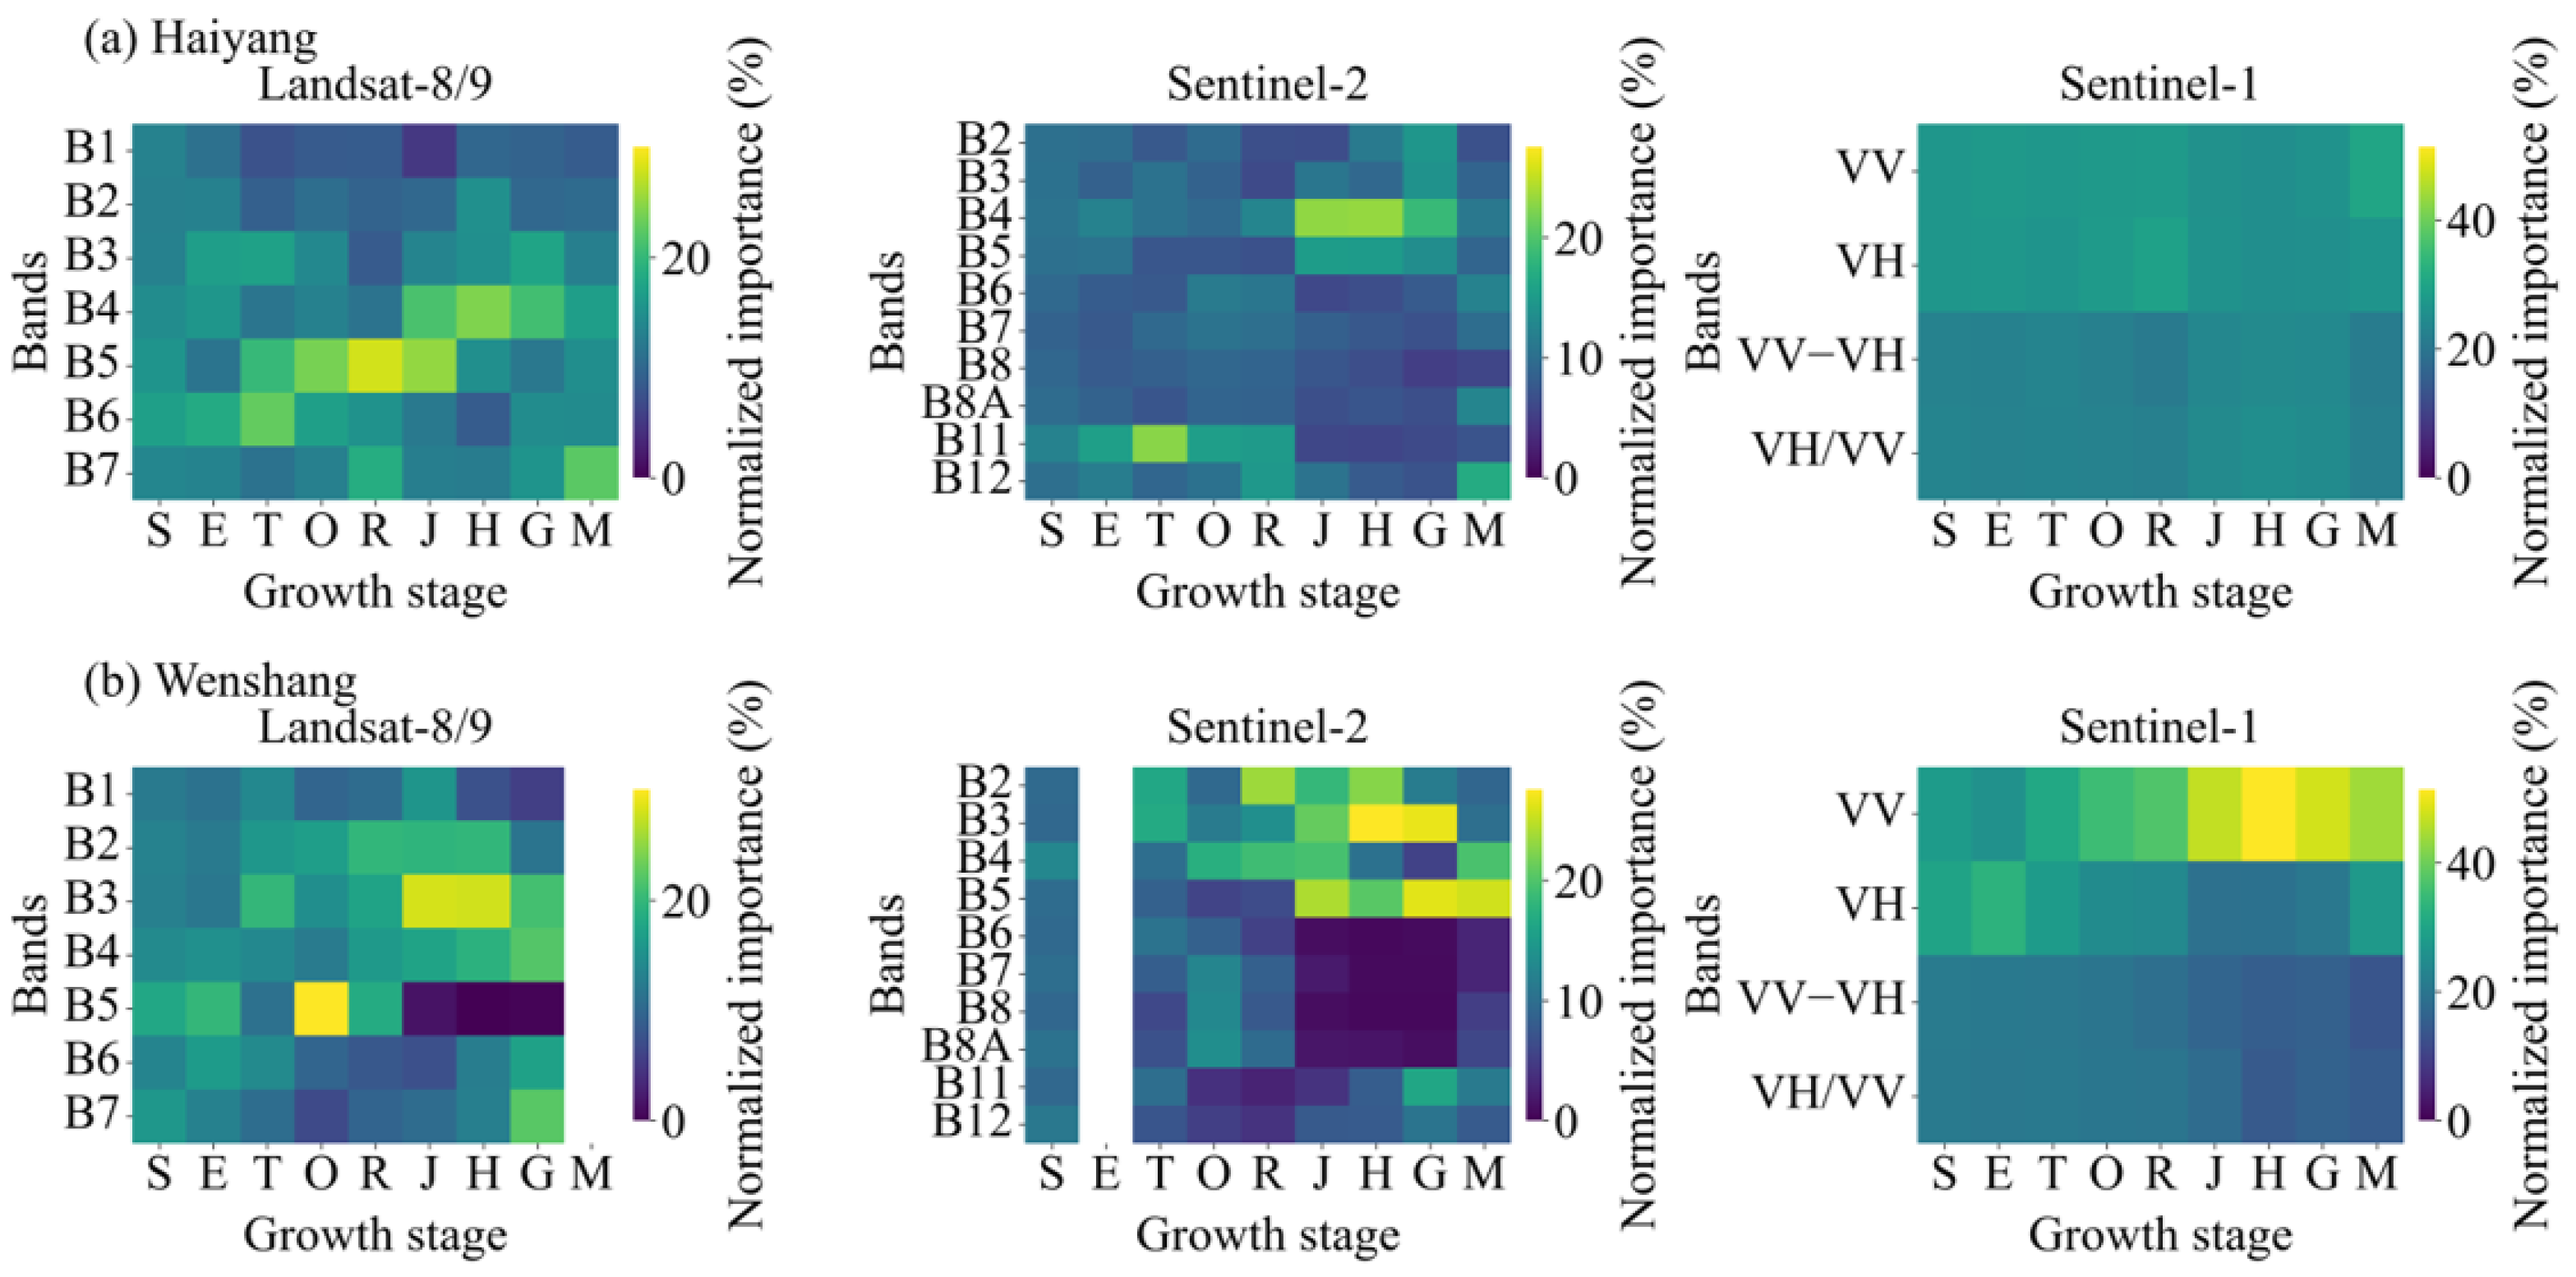
The mean normalized feature importance obtained from the five-fold spatial cross-validation showed clear variations across phenological stages (Figure 6). In the Sentinel-2 models for Haiyang, B11 ranked first from the sowing to regreening stages, accounting for 12.2–22.6% of the total importance. The leading band subsequently shifted to B4 at the jointing, heading, and grain-filling stages, with importance values ranging from 18.6% to 23.2%, whereas B12 ranked first at maturity. The Landsat results showed a similar temporal shift: B6 was the leading feature from sowing to tillering, B5 ranked first from overwintering to jointing, B4 became dominant at heading and grain filling, and B7 ranked first at maturity.
Figure 6.
Mean normalized RF feature importance (%) for the single-source Landsat-8/9, Sentinel-2, and Sentinel-1 models across winter wheat growth stages in (a) Haiyang and (b) Wenshang. Values represent the means across the five spatial cross-validation folds. S, E, T, O, R, J, H, G, and M denote sowing, emergence, tillering, overwintering, regreening, jointing, heading, grain filling, and maturity, respectively. Blank columns indicate unavailable sensor–stage observations.
The optical-band rankings in Wenshang varied more frequently across phenological stages. For Sentinel-2, B4 ranked first at sowing, B3 at tillering, B4 at overwintering, B2 at regreening, B5 at jointing, B3 at heading and grain filling, and B5 at maturity. Sentinel-2 imagery was unavailable at emergence. For Landsat-8/9, B5 ranked first at sowing, emergence, and overwintering, B3 at tillering, jointing, and heading, B2 at regreening, and B7 at grain filling. Landsat-8/9 imagery was unavailable at maturity.
The Sentinel-1 results differed between the two study areas. In Haiyang, the four radar features had relatively similar importance, and the leading feature alternated between VV and VH across stages. In Wenshang, VH ranked first at the sowing and emergence stages, whereas VV ranked first from tillering through maturity. The mean normalized importance of VV increased from 30.8% at tillering to 46.6% at jointing and reached its maximum of 51.4% at heading, before decreasing to 47.8% at grain filling and 44.1% at maturity. The standard deviations of the leading normalized importance values at the selected tillering stage were generally below three percentage points across the five folds, indicating relatively stable rankings among the spatial folds.
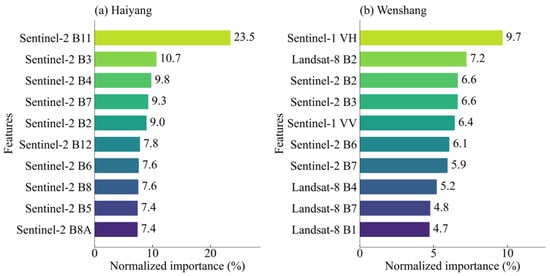
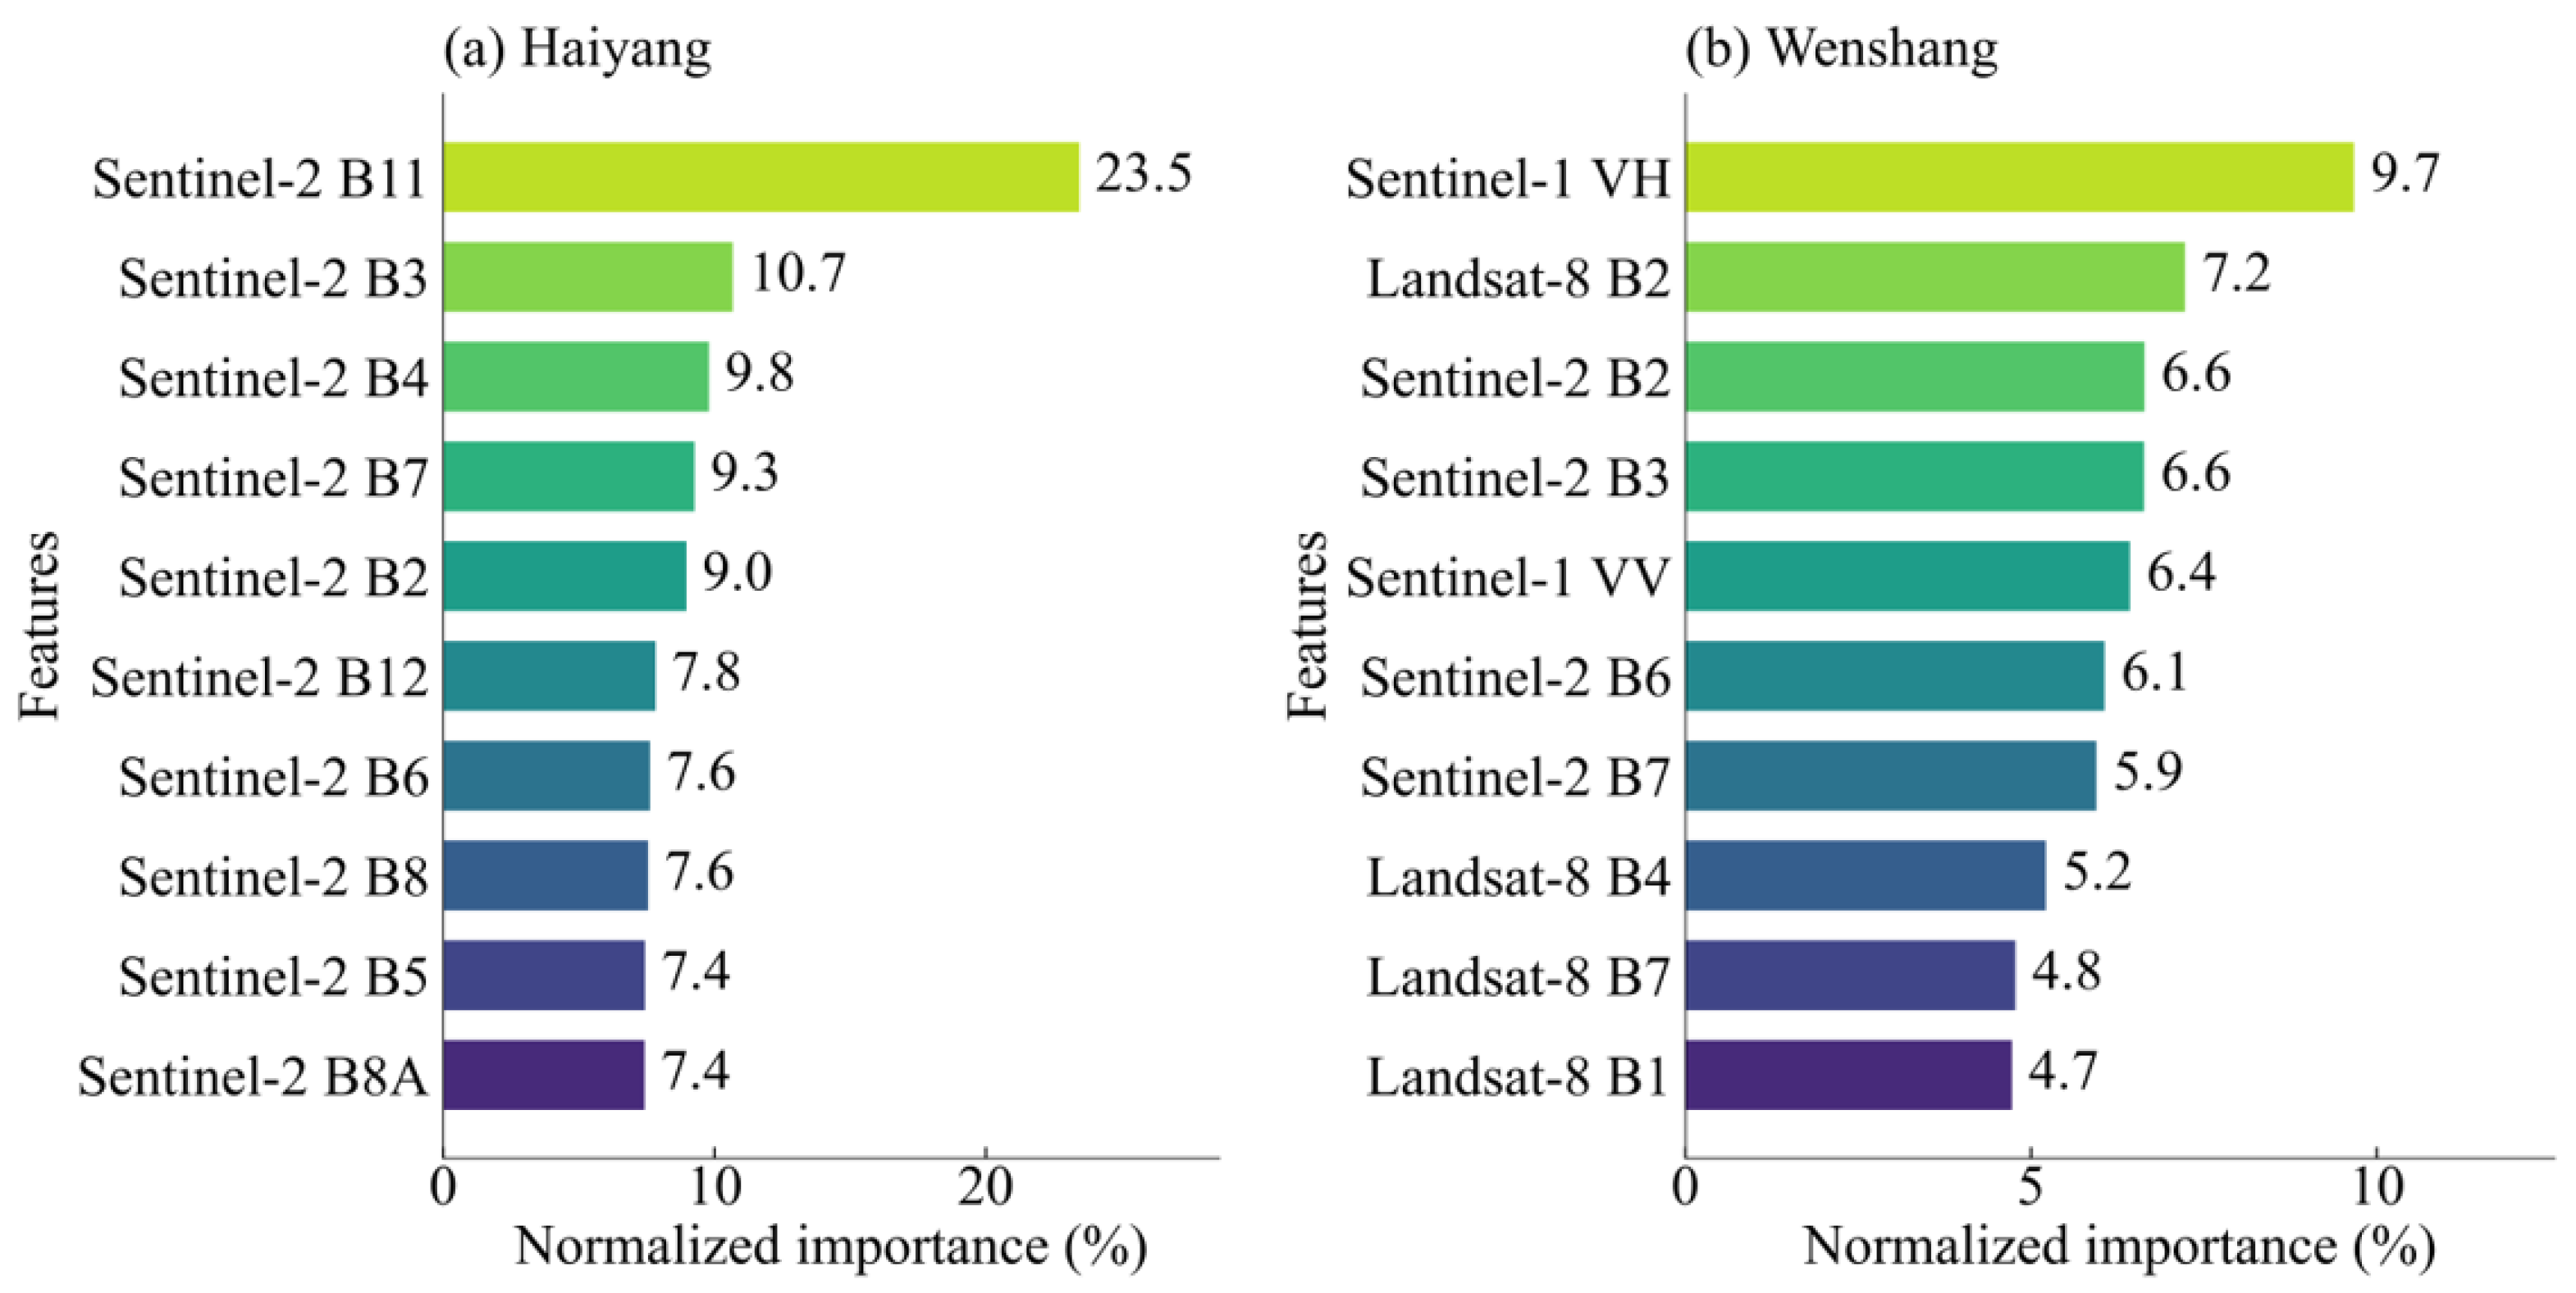
The feature rankings of the final tillering-stage models are shown in Figure 7. In Haiyang, B11 was the leading feature in the Sentinel-2 model, accounting for 23.5% of the total importance, followed by B3 (10.7%), B4 (9.8%), B7 (9.3%), and B2 (9.0%). In the Wenshang multi-source model, the cumulative importance contributions of Sentinel-2, Landsat-8, and Sentinel-1 were 42.9%, 34.5%, and 22.6%, respectively. The five highest-ranked individual features were Sentinel-1 VH (9.7%), Landsat-8 B2 (7.2%), Sentinel-2 B2 (6.6%), Sentinel-2 B3 (6.6%), and Sentinel-1 VV (6.4%). Unlike Haiyang, no single feature in the Wenshang model accounted for more than 10% of the total importance.
Figure 7.
Normalized feature importance of the final full-DEV tillering-stage RF models: (a) Sentinel-2 features in Haiyang and (b) the ten highest-ranked features from Sentinel-1, Sentinel-2, and Landsat-8 in Wenshang.
4. Discussion
4.1. Interpretation of Feature Importance
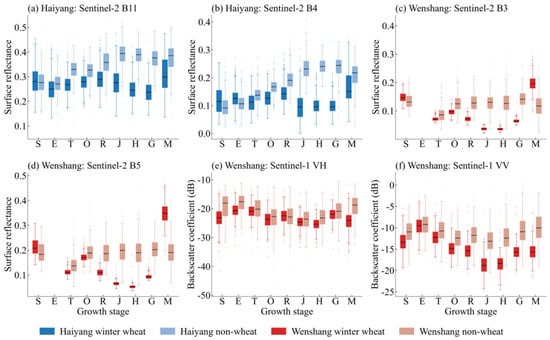
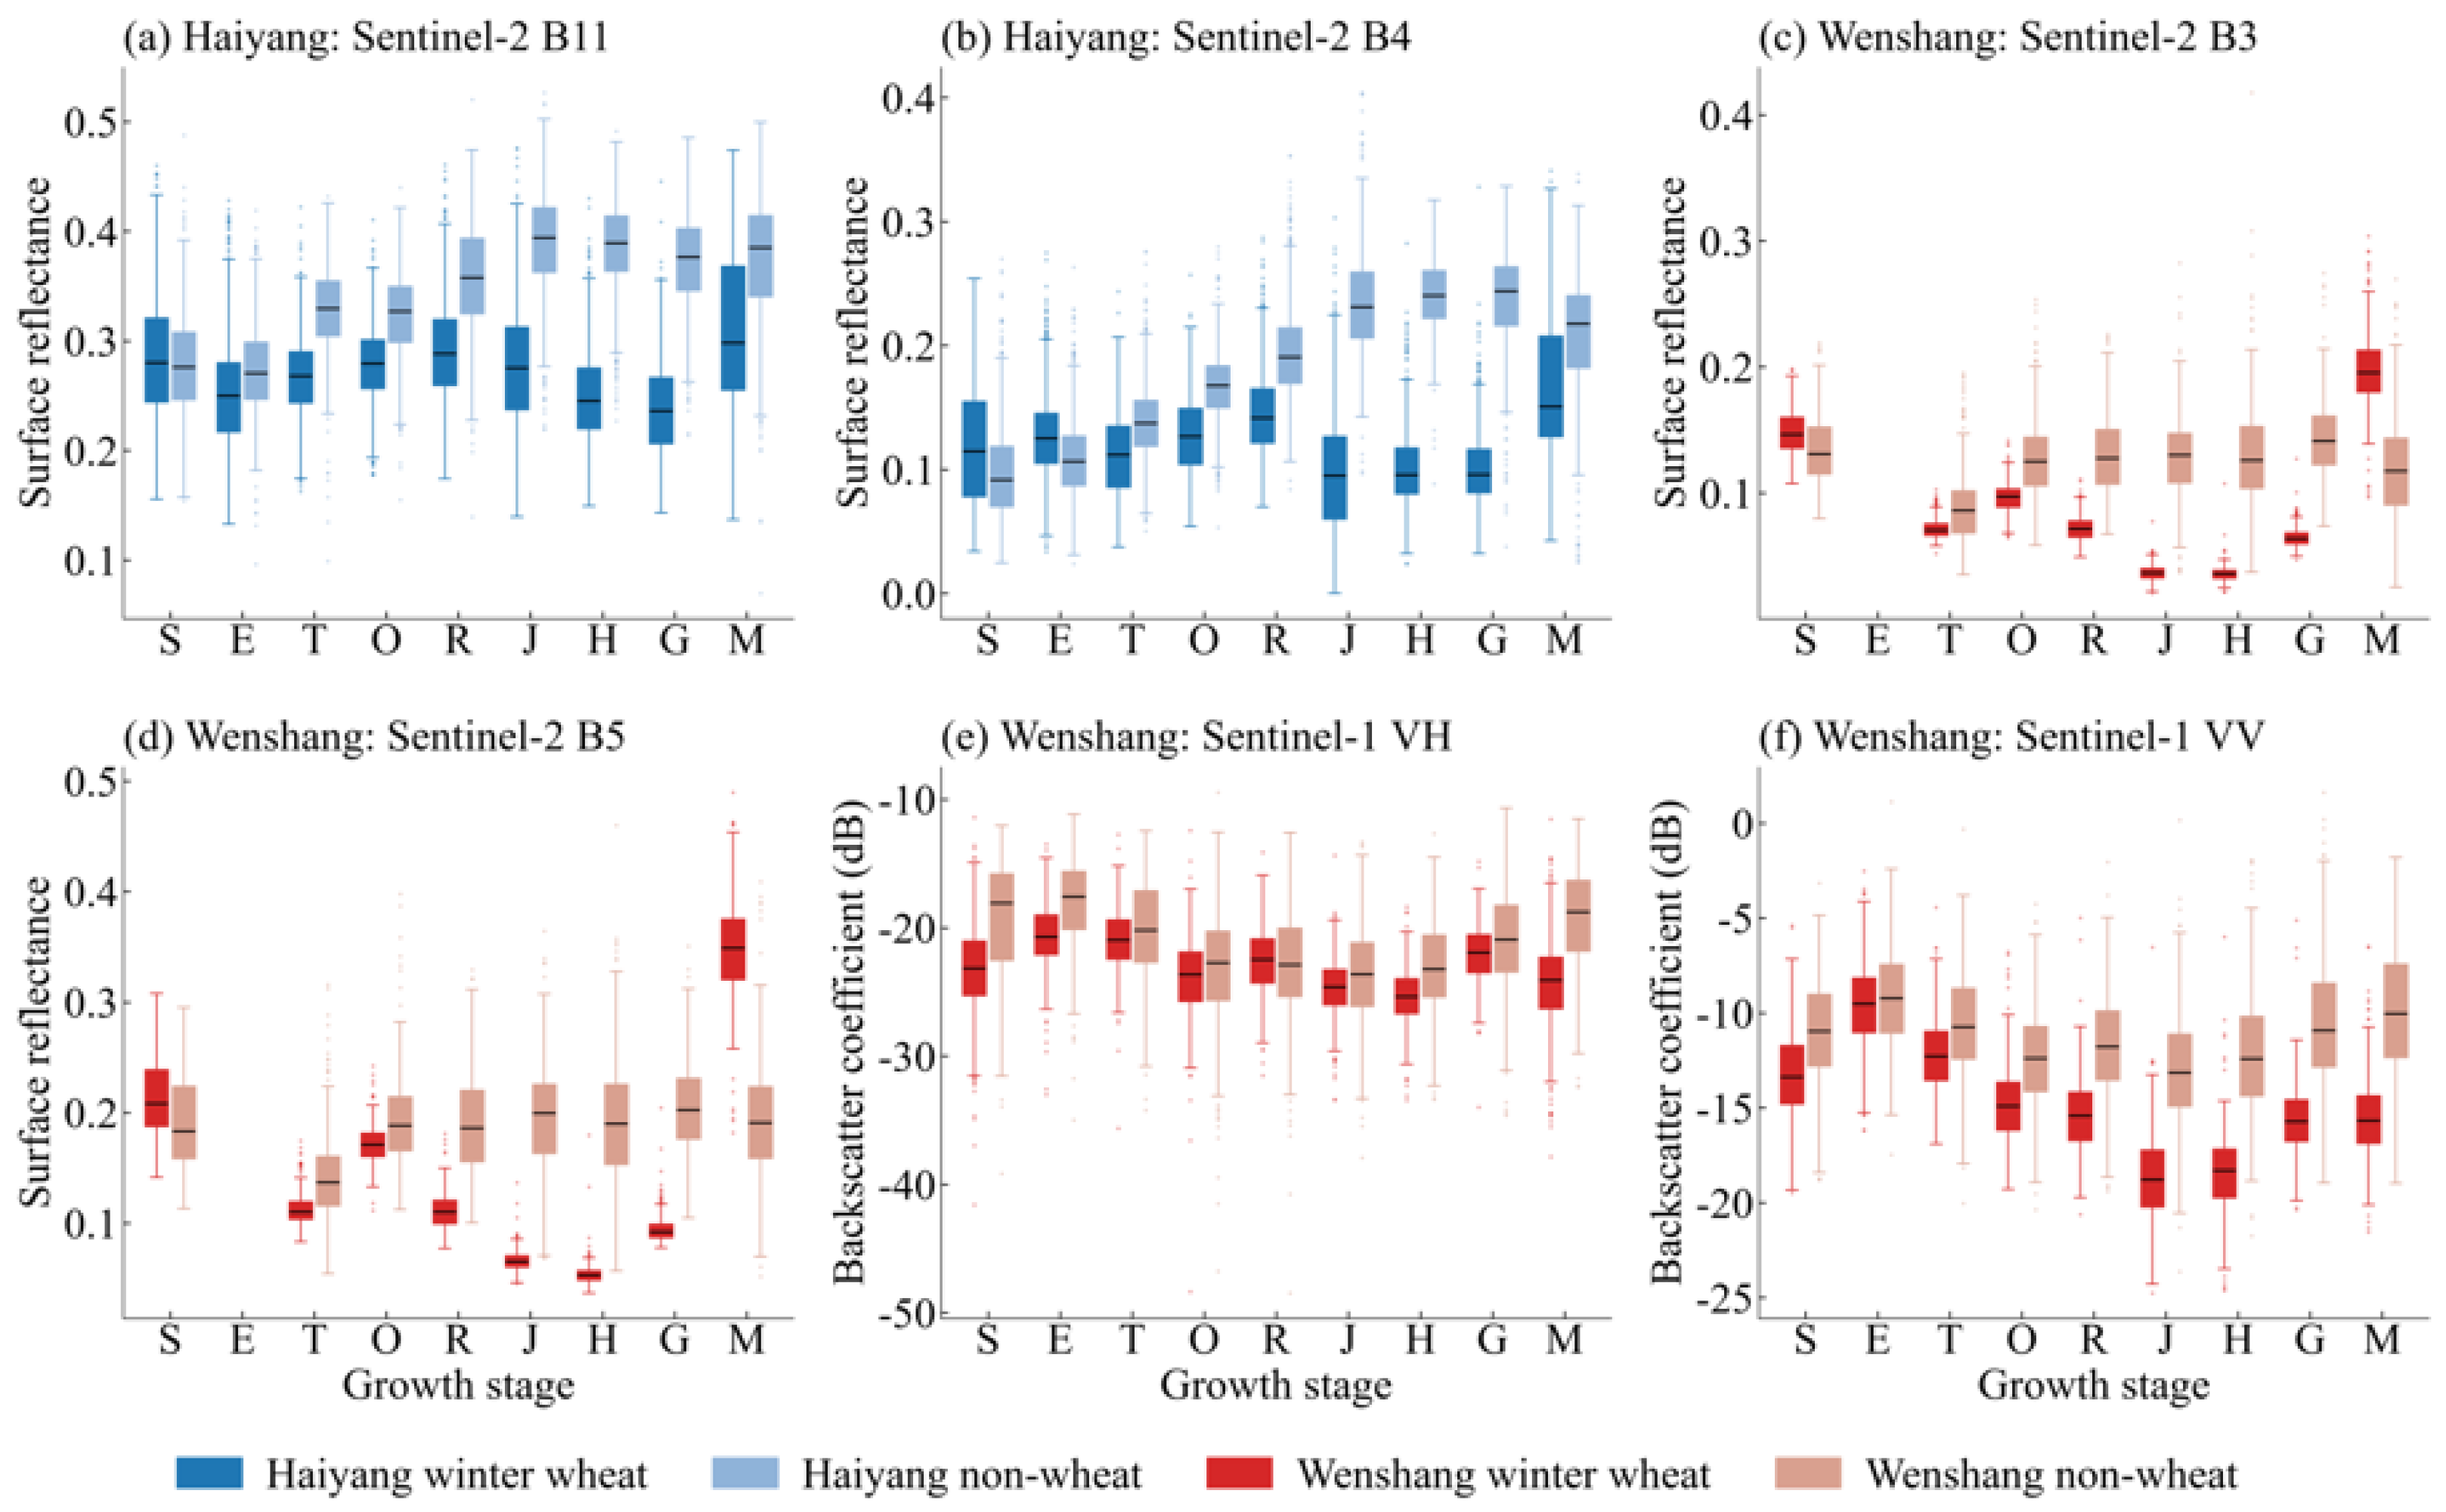
The temporal variation in feature importance and the corresponding class-specific feature distributions was closely associated with changes in surface cover and canopy development throughout the winter wheat growth cycle (Figure 8). In Haiyang, Sentinel-2 B11 was the leading feature during the early growth stages. At this time, wheat vegetation cover remained relatively low, and the observed signal was jointly influenced by soil background, surface moisture, and sparse vegetation. The high importance of B11 was therefore consistent with the sensitivity of shortwave-infrared reflectance to differences in soil–canopy moisture conditions and vegetation water content [38]. As winter wheat entered the jointing and heading stages, the leading feature shifted from B11 to the red band B4. This transition coincided with increasing canopy cover and chlorophyll absorption, which enhanced the spectral contrast between winter wheat and non-wheat vegetation.
Figure 8.
Distributions of selected optical and radar features for winter wheat and non-wheat samples across phenological stages: (a) Sentinel-2 B11 and (b) Sentinel-2 B4 in Haiyang; (c) Sentinel-2 B3, (d) Sentinel-2 B5, (e) Sentinel-1 VH, and (f) Sentinel-1 VV in Wenshang. S, E, T, O, R, J, H, G, and M denote sowing, emergence, tillering, overwintering, regreening, jointing, heading, grain filling, and maturity, respectively.
The Landsat-8/9 results showed a comparable but sensor-specific phenological transition. B6, corresponding to the first shortwave-infrared band, ranked first from sowing to tillering; B5, corresponding to the near-infrared band, ranked first from overwintering to jointing; B4, corresponding to the red band, ranked first at heading and grain filling; and B7, corresponding to the second shortwave-infrared band, ranked first at maturity. This sequence suggests a shift from information sensitive to moisture and canopy structure during the early and vegetative stages to visible-band contrast during heading and grain filling, followed by renewed shortwave-infrared sensitivity at maturity. Sentinel-2 nevertheless showed more consistent classification performance in Haiyang, which may be partly related to its finer spatial resolution and the availability of red-edge bands in this fragmented agricultural landscape.
In Wenshang, the importance of visible and red-edge bands changed more frequently across phenological stages. At jointing, Sentinel-2 B5, the first red-edge band, ranked first, which is consistent with the sensitivity of red-edge reflectance to crop chlorophyll and nitrogen status [39]. At heading and grain filling, the green band B3 ranked first, likely reflecting stage-dependent changes in leaf pigmentation and canopy reflectance. At maturity, B5 ranked first again, whereas the contribution of B3 decreased, indicating that canopy senescence altered the relative importance of green and red-edge information.
Sentinel-1 provided additional structural information in Wenshang, although the single-source and multi-source importance results should be distinguished. In the single-source Sentinel-1 models, VV ranked first from tillering through maturity and reached its highest normalized importance at heading, which may reflect changes in canopy geometry and soil–canopy interactions. In contrast, VH was the highest-ranked radar feature and the highest-ranked individual predictor in the final tillering-stage multi-source model, possibly reflecting sensitivity to volume scattering from the developing canopy. Because RF importance can be redistributed when correlated optical predictors are introduced, the VV and VH rankings in the single-source and multi-source models should not be interpreted as contradictory [28].
Overall, the feature importance patterns generally shifted from variables related to moisture and background conditions during the early stages to variables related to pigment content and canopy characteristics during the middle stages, whereas maturity showed patterns specific to regions and sensors. The differences between Haiyang and Wenshang further indicate that the contribution of individual remote sensing variables depends not only on crop phenology but also on field size, landscape fragmentation, and the selected sensor combination.
4.2. Effects of Phenological Stages on Classification Accuracy
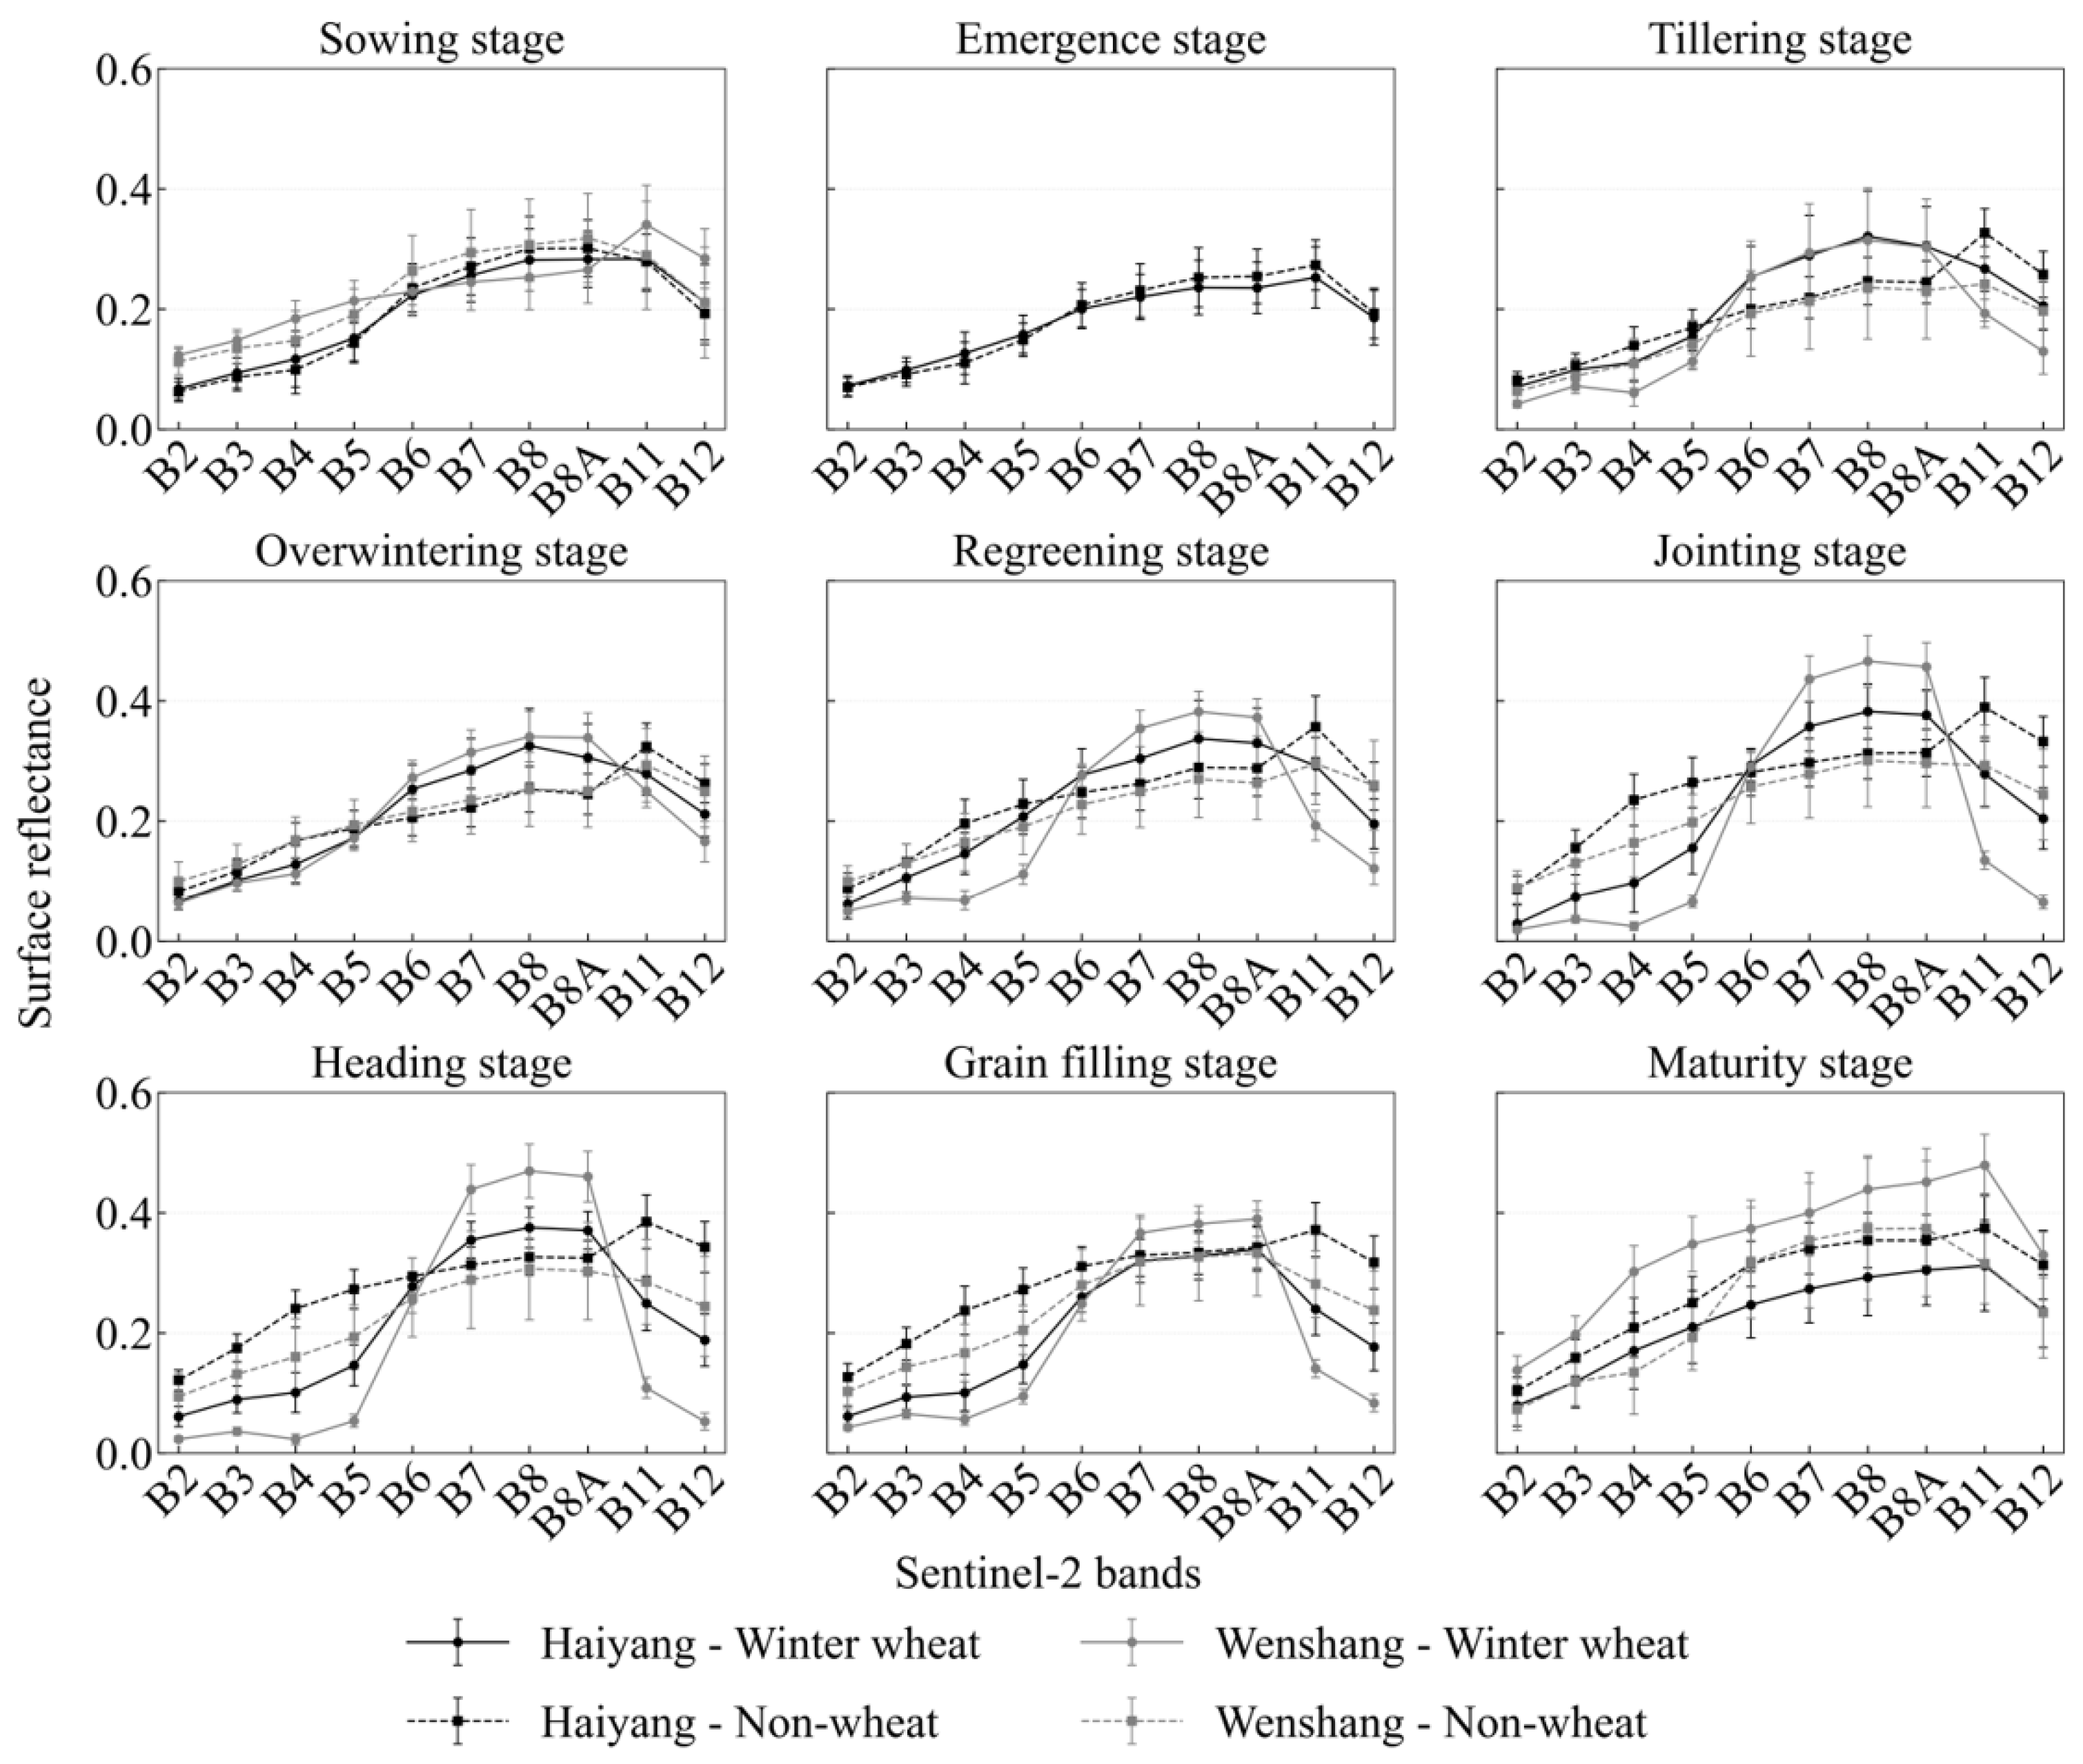
Classification performance varied substantially across the winter wheat growth cycle, reflecting changes in crop cover and class separability (Figure 9 and Figure 10). During the sowing and emergence stages, the wheat canopy was sparse, and the remotely sensed signal was strongly influenced by exposed soil, crop residues, and surface moisture. The resulting overlap between winter wheat and non-wheat features led to relatively low classification accuracy in both study areas.
Figure 9.
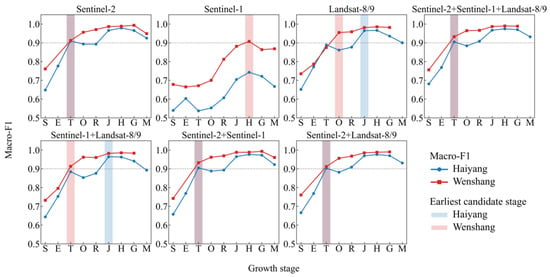
Mean Macro-F1 scores from five-fold spatial cross-validation for seven sensor combinations across winter wheat growth stages in Haiyang and Wenshang. The dashed horizontal line indicates the DEV selection threshold of Macro-F1 = 0.90, and the blue and red shaded bands indicate the earliest candidate stages selected for Haiyang and Wenshang, respectively. S, E, T, O, R, J, H, G, and M denote sowing, emergence, tillering, overwintering, regreening, jointing, heading, grain filling, and maturity, respectively. The purple shading represents the overlap between the blue and red shaded bands.
Figure 10.
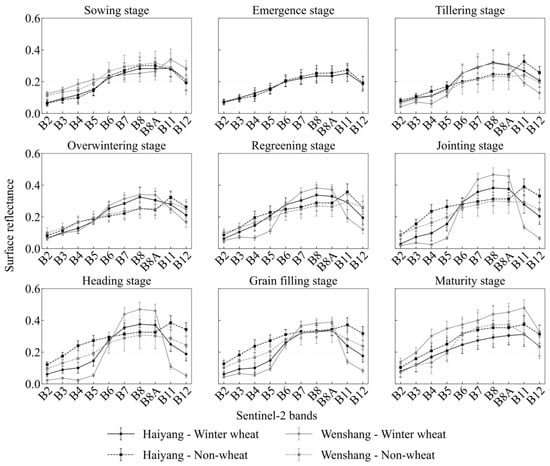
Mean Sentinel-2 surface reflectance profiles of winter wheat and non-wheat samples in Haiyang and Wenshang across nine phenological stages.
Classification accuracy increased markedly at the tillering stage as vegetation cover expanded and the spectral and backscattering differences between the two classes became more evident. Five-fold spatial cross-validation identified tillering as the earliest candidate stage with a mean Macro-F1 above 0.90 in both regions. However, the independent TEST results revealed different levels of spatial generalization. The Wenshang model achieved a Macro-F1 of 0.9503, confirming reliable early classification at tillering, whereas the Haiyang model decreased to 0.8732. Thus, the tillering-stage signal in Haiyang was sufficient to satisfy the DEV selection criterion but was less stable when transferred to spatially independent locations.
Performance continued to improve during the middle growth stages, when increasing canopy cover and biomass enhanced the distinction between winter wheat and other land cover types. The highest cross-validation Macro-F1 occurred at the heading stage in Haiyang (0.9791 ± 0.0145) and at the grain-filling stage in Wenshang (0.9936 ± 0.0079). These results indicate that the period from jointing to grain filling provided the strongest class separability, although the exact peak stage differed between the two regions, which is broadly consistent with previous early-season winter wheat mapping studies showing enhanced crop separability with phenological development [13,40]. At maturity, classification accuracy declined moderately as canopy senescence, reduced chlorophyll content, and harvesting-related surface changes weakened the contrast between winter wheat and non-wheat.
The contrasting TEST results may be associated with differences in the agricultural landscapes of the two study areas. Wenshang is dominated by relatively large and contiguous cultivated fields, which reduce within-pixel mixing and support stable early-season classification. In Haiyang, smaller and more fragmented fields, together with greater topographic and background heterogeneity, likely increased spatial variability in the early-season signal. Consequently, the earliest candidate stage identified through cross-validation should not be interpreted as automatically guaranteeing equivalent accuracy in an independent spatial domain.
4.3. Effects of Multi-Source Data Combinations on Classification Accuracy
The effects of sensor combinations on winter wheat classification varied across phenological stages and study areas. Among the single-source models, Sentinel-2 generally achieved the highest accuracy, whereas Sentinel-1 alone showed lower performance throughout most of the growth cycle. This difference indicates that optical spectral information provided the primary basis for winter wheat discrimination, while C-band backscattering features alone were insufficient to consistently separate winter wheat from non-wheat backgrounds. Similar variations in the effectiveness of optical–SAR fusion across phenological stages and regions have been reported in crop-mapping and phenological-monitoring studies conducted in China and other agricultural areas [19,20,27].
In Haiyang, adding additional sensors to Sentinel-2 did not consistently improve classification performance. At the tillering stage, Sentinel-2 alone achieved a Macro-F1 of 0.9098 ± 0.0180, compared with 0.9050 ± 0.0221 for the three-source combination. Sentinel-2 also provided the highest accuracy at the emergence, overwintering, and heading stages, including the regional peak Macro-F1 of 0.9791 ± 0.0145 at heading. Multi-source combinations produced modest improvements at several other stages, including regreening, jointing, grain filling, and maturity. These variable responses suggest that the additional spectral or backscattering features were useful only when they provided information not already represented by Sentinel-2. In the fragmented agricultural landscape of Haiyang, differences in spatial resolution and redundant predictor information may have limited the benefit of combining all three sensors.
Multi-source information was more beneficial during several stages in Wenshang. At the tillering stage, the Sentinel-1, Sentinel-2, and Landsat-8 combination increased the Macro-F1 from 0.9128 ± 0.0409 for Sentinel-2 alone to 0.9325 ± 0.0157. However, the Sentinel-1 and Sentinel-2 combination produced an almost identical Macro-F1, indicating that most of the improvement was associated with the addition of radar information, while Landsat-8 provided only a marginal further gain. Multi-source combinations also achieved the highest accuracy during overwintering, jointing, heading, and maturity, although the improvements over Sentinel-2 alone were generally small during the high-accuracy middle stages. At grain filling, Sentinel-2 alone reached the highest Macro-F1 of 0.9936 ± 0.0079.
These results demonstrate that multi-source fusion should be adapted to phenological stage and regional landscape conditions. Sentinel-2 provided the most consistent single-source performance and can serve as the primary data source for winter wheat classification. Sentinel-1 was useful when canopy structural information complemented optical observations, particularly during early classification in Wenshang, whereas Landsat-8/9 provided additional benefits only at selected stages. Therefore, the inclusion of more data sources does not necessarily improve classification accuracy, and sensor combinations should be selected according to their observed contribution rather than applied uniformly throughout the growth cycle.
4.4. Practical Implications for Agricultural Management and Sustainability
The determination of an early observation window can improve the timeliness of regional winter wheat monitoring [41,42]. Tillering-stage observations can provide preliminary information on the spatial distribution of winter wheat before the middle and late growth stages, thereby supporting early crop-area estimation, field-survey planning, and the allocation of agricultural monitoring resources. In Wenshang, the independent TEST Macro-F1 of 0.9503 demonstrated that the tillering-stage classification result could support reliable regional-scale early mapping. In Haiyang, the corresponding Macro-F1 of 0.8732 indicated that the tillering-stage result was more suitable for preliminary screening and could subsequently be updated using observations acquired during later phenological stages.
The results also provide an operational basis for selecting data sources according to phenological stage and regional conditions. Sentinel-2 can be prioritized when suitable optical imagery is available because it provided the most consistent single-source classification performance. Sentinel-1 and Landsat-8/9 can then be incorporated when they provide measurable improvements at specific phenological stages or under particular regional landscape conditions. Compared with routinely applying the same multi-source combination throughout the growing season, this adaptive strategy can reduce unnecessary data acquisition and processing while retaining useful complementary information from different sensors.
Accordingly, the proposed framework can support a tiered winter wheat monitoring workflow that combines early information delivery with subsequent accuracy improvement. Preliminary maps generated at the tillering stage can be used for early agricultural statistics, field-survey organization, and the identification of priority monitoring areas. These preliminary results can then be updated using observations from the heading or grain-filling stages to provide more accurate information for final crop-area estimation and production assessment. Such a workflow can improve the timeliness and resource use efficiency of regional crop monitoring and support more informed agricultural production management and food security planning.
4.5. Limitations and Future Perspectives
The present study was conducted during a single winter wheat growing season. Different weather conditions in other years may alter crop development, phenological timing, soil moisture, and the availability and quality of satellite observations. Consequently, the precise acquisition dates, feature rankings, and optimal sensor combinations may vary between years. Nevertheless, the stage-dependent relationships identified in this study may be more transferable than conclusions based solely on fixed calendar dates. Future research should therefore include multi-year observations and match remote sensing imagery with the actual phenological development of winter wheat in each growing season.
The applicability of the framework to other regions may also be affected by differences in topography, field size, settlement patterns, crop rotations, irrigation practices, and agricultural management. The contrasting results between Haiyang and Wenshang demonstrate that a sensor combination performing well in a contiguous plain landscape may not achieve the same effectiveness in a fragmented and heterogeneous region. Further validation in additional winter wheat production areas is therefore required, together with appropriate local adjustment of observation stages and sensor combinations.
In addition, the Sentinel-1 features used in this study were mainly based on VV and VH backscatter information. During early growth stages, these signals may be strongly affected by exposed soil, surface roughness, and soil moisture. Future studies could incorporate interferometric coherence, polarimetric decomposition parameters, and denser multi-temporal radar features to improve the representation of early canopy development and reduce background interference [43]. These developments may further enhance the reliability of early winter wheat monitoring under cloudy conditions or in regions where suitable optical observations are limited.
5. Conclusions
This study systematically evaluated the effects of phenological stages and satellite data combinations on winter wheat classification in the contrasting agricultural landscapes of Haiyang and Wenshang using a consistent RF framework. Five-fold spatial cross-validation showed clear stage-dependent variations in classification performance. The tillering stage was selected as the earliest candidate observation stage in both study areas, with mean Macro-F1 values of 0.9098 ± 0.0180 in Haiyang and 0.9325 ± 0.0157 in Wenshang. Classification performance continued to improve during subsequent growth stages, reaching its maximum at the heading stage in Haiyang using Sentinel-2 (0.9791 ± 0.0145) and at the grain-filling stage in Wenshang using Sentinel-2 (0.9936 ± 0.0079). Feature importance results further showed that the dominant variables changed with phenological development, generally shifting from shortwave-infrared and background-related features during the early stages to visible, red-edge, and canopy-related features during the middle stages, with patterns specific to regions and sensors occurring at maturity.
Independent TEST evaluation revealed different levels of spatial generalization between the two study areas. The final tillering-stage model achieved an OA of 0.8747 and a Macro-F1 of 0.8732 in Haiyang, indicating that the cross-validation threshold did not fully transfer to spatially independent locations. In Wenshang, the corresponding OA and Macro-F1 were both 0.9503, confirming the feasibility of reliable regional-scale early classification at the tillering stage. These contrasting results demonstrate that early-season classification is affected not only by crop phenology but also by field contiguity, landscape fragmentation, and background heterogeneity.
The effects of multi-source data combinations were also dependent on growth stage and regional conditions. Sentinel-2 provided the most consistent single-source performance and was selected for the final Haiyang model, whereas the Sentinel-1, Sentinel-2, and Landsat-8 combination was selected in Wenshang, where radar information provided useful complementary information during tillering. However, adding more data sources did not consistently improve accuracy, indicating that sensor combinations should be selected according to their observed contribution rather than applied uniformly. The proposed strategy adapted to phenological stages and regional conditions can support timely regional winter wheat mapping and agricultural production monitoring. Future research should evaluate its stability across multiple growing seasons and regions and explore interferometric coherence, polarimetric decomposition, and denser radar time series features to improve early monitoring under heterogeneous landscapes and limited optical observations.
Author Contributions
Conceptualization, X.H. and D.H.; methodology, Z.W.; software, M.Z.; validation, M.Z., P.G. and H.W.; formal analysis, W.N.; investigation, M.Z.; resources, X.H.; data curation, D.H.; writing—original draft preparation, M.Z.; writing—review and editing, H.W.; visualization, M.Z.; supervision, H.W.; project administration, Z.W.; funding acquisition, X.H. and D.H. All authors have read and agreed to the published version of the manuscript.
Funding
This research was funded by the Key Program of the Shandong Provincial Meteorological Bureau, grant numbers 2023sdqxz03 and 2024sdqxm02.
Institutional Review Board Statement
Not applicable.
Informed Consent Statement
Not applicable.
Data Availability Statement
The raw data supporting the conclusions of this article will be made available by the authors on request.
Conflicts of Interest
The authors declare no conflicts of interest.
References
- Jia, D.; Gao, P.; Cheng, C.; Ye, S. Multiple-feature-driven co-training method for crop mapping based on remote sensing time series imagery. Int. J. Remote Sens. 2020, 41, 8096–8120. [Google Scholar] [CrossRef] [Scilit]
- Li, J.; Yu, W.; Du, J.; Song, K.; Xiang, X.; Liu, H.; Zhang, Y.; Zhang, W.; Zheng, Z.; Wang, Y.; et al. Mapping Maize Tillage Practices over the Songnen Plain in Northeast China Using GEE Cloud Platform. Remote Sens. 2023, 15, 1461. [Google Scholar] [CrossRef] [Scilit]
- Tian, H.; Huang, N.; Niu, Z.; Qin, Y.; Pei, J.; Wang, J. Mapping Winter Crops in China with Multi-Source Satellite Imagery and Phenology-Based Algorithm. Remote Sens. 2019, 11, 820. [Google Scholar] [CrossRef] [Scilit]
- Liu, X.; Li, X.; Gao, L.; Zhang, J.; Qin, D.; Wang, K.; Li, Z. Early-season and refined mapping of winter wheat based on phenology algorithms-a case of Shandong, China. Front. Plant Sci. 2023, 14, 1016890. [Google Scholar] [CrossRef] [Scilit] [PubMed]
- Zhang, H.; Du, H.; Zhang, C.; Zhang, L. An automated early-season method to map winter wheat using time-series Sentinel-2 data: A case study of Shandong, China. Comput. Electron. Agric. 2021, 182, 105962. [Google Scholar] [CrossRef] [Scilit]
- Wang, M.; Luo, Y.; Zhang, Z.; Xie, Q.; Wu, X.; Ma, X. Recent advances in remote sensing of vegetation phenology: Retrieval algorithm and validation strategy. Natl. Remote Sens. Bull. 2022, 26, 431–455. [Google Scholar] [CrossRef] [Scilit]
- Justice, C.O.; Vermote, E.; Townshend, J.R.G.; DeFries, R.; Roy, D.P.; Hall, D.K.; Salomonson, V.V.; Privette, J.L.; Riggs, G.; Strahler, A.; et al. The Moderate Resolution Imaging Spectroradiometer (MODIS): Land remote sensing for global change research. IEEE Trans. Geosci. Remote Sens. 1998, 36, 1228–1249. [Google Scholar] [CrossRef] [Scilit]
- Roy, D.P.; Wulder, M.A.; Loveland, T.R.; Woodcock, C.E.; Allen, R.G.; Anderson, M.C.; Helder, D.; Irons, J.R.; Johnson, D.M.; Kennedy, R.; et al. Landsat-8: Science and product vision for terrestrial global change research. Remote Sens. Environ. 2014, 145, 154–172. [Google Scholar] [CrossRef] [Scilit]
- Drusch, M.; Del Bello, U.; Carlier, S.; Colin, O.; Fernandez, V.; Gascon, F.; Hoersch, B.; Isola, C.; Laberinti, P.; Martimort, P.; et al. Sentinel-2: ESA’s Optical High-Resolution Mission for GMES Operational Services. Remote Sens. Environ. 2012, 120, 25–36. [Google Scholar] [CrossRef] [Scilit]
- Yu, J.; Liu, Y.; Ren, Y.; Ma, H.; Wang, D.; Jing, Y.; Yu, L. Application Study on Double-Constrained Change Detection for Land Use/Land Cover Based on GF-6 WFV Imageries. Remote Sens. 2020, 12, 2943. [Google Scholar] [CrossRef] [Scilit]
- Chu, L.; Liu, Q.-S.; Huang, C.; Liu, G.-H. Monitoring of winter wheat distribution and phenological phases based on MODIS time-series: A case study in the Yellow River Delta, China. J. Integr. Agric. 2016, 15, 2403–2416. [Google Scholar] [CrossRef] [Scilit]
- Tao, J.-B.; Wu, W.-B.; Zhou, Y.; Wang, Y.; Jiang, Y. Mapping winter wheat using phenological feature of peak before winter on the North China Plain based on time-series MODIS data. J. Integr. Agric. 2017, 16, 348–359. [Google Scholar] [CrossRef] [Scilit]
- Fan, L.; Xia, L.; Yang, J.; Sun, X.; Wu, S.; Qiu, B.; Chen, J.; Wu, W.; Yang, P. A temporal-spatial deep learning network for winter wheat mapping using time-series Sentinel-2 imagery. ISPRS J. Photogramm. Remote Sens. 2024, 214, 48–64. [Google Scholar] [CrossRef] [Scilit]
- Yin, Q.; Liu, M.; Cheng, J.; Ke, Y.; Chen, X. Mapping Paddy Rice Planting Area in Northeastern China Using Spatiotemporal Data Fusion and Phenology-Based Method. Remote Sens. 2019, 11, 1699. [Google Scholar] [CrossRef] [Scilit]
- Czerkawski, M.; Upadhyay, P.; Davison, C.; Werkmeister, A.; Cardona, J.; Atkinson, R.; Michie, C.; Andonovic, I.; Macdonald, M.; Tachtatzis, C. Deep Internal Learning for Inpainting of Cloud-Affected Regions in Satellite Imagery. Remote Sens. 2022, 14, 1342. [Google Scholar] [CrossRef] [Scilit]
- Planque, C.; Lucas, R.; Punalekar, S.; Chognard, S.; Hurford, C.; Owers, C.; Horton, C.; Guest, P.; King, S.; Williams, S.; et al. National Crop Mapping Using Sentinel-1 Time Series: A Knowledge-Based Descriptive Algorithm. Remote Sens. 2021, 13, 846. [Google Scholar] [CrossRef] [Scilit]
- Li, C.; Chen, W.; Wang, Y.; Wang, Y.; Ma, C.; Li, Y.; Li, J.; Zhai, W. Mapping Winter Wheat with Optical and SAR Images Based on Google Earth Engine in Henan Province, China. Remote Sens. 2022, 14, 284. [Google Scholar] [CrossRef] [Scilit]
- Zhou, Y.; Zhu, W.; Feng, L.; Gao, J.; Chen, Y.; Zhang, X.; Luo, J. Hierarchical classification for improving parcel-scale crop mapping using time-series Sentinel-1 data. J. Environ. Manag. 2024, 369, 122251. [Google Scholar] [CrossRef] [Scilit] [PubMed]
- Maleki, S.; Baghdadi, N.; Bazzi, H.; Dantas, C.F.; Ienco, D.; Nasrallah, Y.; Najem, S. Machine Learning-Based Summer Crops Mapping Using Sentinel-1 and Sentinel-2 Images. Remote Sens. 2024, 16, 4548. [Google Scholar] [CrossRef] [Scilit]
- Brickner, N.Z.; Fine, L.; Rozenstein, O.; Paz-Kagan, T. Field crop mapping using machine learning and multi-sensor satellite fusion: Toward dynamic agricultural monitoring. Smart Agric. Technol. 2025, 12, 101650. [Google Scholar] [CrossRef] [Scilit]
- Zhou, T.; Pan, J.; Zhang, P.; Wei, S.; Han, T. Mapping Winter Wheat with Multi-Temporal SAR and Optical Images in an Urban Agricultural Region. Sensors 2017, 17, 1210. [Google Scholar] [CrossRef] [Scilit] [PubMed]
- Ghassemi, B.; Dujakovic, A.; Żółtak, M.; Immitzer, M.; Atzberger, C.; Vuolo, F. Designing a European-Wide Crop Type Mapping Approach Based on Machine Learning Algorithms Using LUCAS Field Survey and Sentinel-2 Data. Remote Sens. 2022, 14, 541. [Google Scholar] [CrossRef] [Scilit]
- Hudait, M.; Patel, P.P. Crop-type mapping and acreage estimation in smallholding plots using Sentinel-2 images and machine learning algorithms: Some comparisons. Egypt. J. Remote Sens. Space Sci. 2022, 25, 147–156. [Google Scholar] [CrossRef] [Scilit]
- Tufail, R.; Ahmad, A.; Javed, M.A.; Ahmad, S.R. A machine learning approach for accurate crop type mapping using combined SAR and optical time series data. Adv. Space Res. 2022, 69, 331–346. [Google Scholar] [CrossRef] [Scilit]
- Luo, K.; Lu, L.; Xie, Y.; Chen, F.; Yin, F.; Li, Q. Crop type mapping in the central part of the North China Plain using Sentinel-2 time series and machine learning. Comput. Electron. Agric. 2023, 205, 107577. [Google Scholar] [CrossRef] [Scilit]
- Halder, K.; Srivastava, A.K.; Zheng, W.; Alsafadi, K.; Zhao, G.; Maerker, M.; Singh, M.; Guoging, L.; Ghosh, A.; Vianna, M.; et al. A robust and scalable crop mapping framework using advanced machine learning and optical and SAR imageries. Smart Agric. Technol. 2025, 12, 101354. [Google Scholar] [CrossRef] [Scilit]
- Shojaeezadeh, S.A.; Elnashar, A.; Weber, T.K.D. A novel fusion of Sentinel-1 and Sentinel-2 with climate data for crop phenology estimation using Machine Learning. Sci. Remote Sens. 2025, 11, 100227. [Google Scholar] [CrossRef] [Scilit]
- Sun, X.; Wang, M.; Wang, J.; Li, G.; Hou, X. Deep learning classification of winter wheat from Sentinel optical-radar image time series in smallholder farming areas. Adv. Space Res. 2025, 75, 2683–2695. [Google Scholar] [CrossRef] [Scilit]
- Masek, J.G.; Wulder, M.A.; Markham, B.; McCorkel, J.; Crawford, C.J.; Storey, J.C.; Jenstrom, D.T. Landsat 9: Empowering open science and applications through continuity. Remote Sens. Environ. 2020, 248, 111968. [Google Scholar] [CrossRef] [Scilit]
- Hansen, M.C.; Loveland, T.R. A review of large area monitoring of land cover change using Landsat data. Remote Sens. Environ. 2012, 122, 66–74. [Google Scholar] [CrossRef] [Scilit]
- Torres, R.; Snoeij, P.; Geudtner, D.; Bibby, D.; Davidson, M.; Attema, E.; Potin, P.; Rommen, B.; Floury, N.; Brown, M.; et al. GMES Sentinel-1 mission. Remote Sens. Environ. 2012, 120, 9–24. [Google Scholar] [CrossRef] [Scilit]
- Wu, B.; Li, Q. Crop planting and type proportion method for crop acreage estimation of complex agricultural landscapes. Int. J. Appl. Earth Obs. Geoinf. 2012, 16, 101–112. [Google Scholar] [CrossRef] [Scilit]
- Breiman, L. Random Forests. Mach. Learn. 2001, 45, 5–32. [Google Scholar] [CrossRef] [Scilit]
- Brenning, A. Spatial cross-validation and bootstrap for the assessment of prediction rules in remote sensing: The R package sperrorest. In Proceedings of the 2012 IEEE International Geoscience and Remote Sensing Symposium, Munich, Germany, 22–27 July 2012; pp. 5372–5375. [Google Scholar] [CrossRef] [Scilit]
- Radočaj, D.; Plaščak, I.; Jurišić, M. A Comparative Assessment of Regular and Spatial Cross-Validation in Subfield Machine Learning Prediction of Maize Yield from Sentinel-2 Phenology. Eng 2025, 6, 270. [Google Scholar] [CrossRef] [Scilit]
- Congalton, R.G. A Review of Assessing the Accuracy of Classifications of Remotely Sensed Data. Remote Sens. Environ. 1991, 37, 35–46. [Google Scholar] [CrossRef] [Scilit]
- Sokolova, M.; Lapalme, G. A systematic analysis of performance measures for classification tasks. Inf. Process. Manag. 2009, 45, 427–437. [Google Scholar] [CrossRef] [Scilit]
- Gao, B.-C. NDWI—A normalized difference water index for remote sensing of vegetation liquid water from space. Remote Sens. Environ. 1996, 58, 257–266. [Google Scholar] [CrossRef] [Scilit]
- Clevers, J.G.P.W.; Gitelson, A.A. Remote estimation of crop and grass chlorophyll and nitrogen content using red-edge bands on Sentinel-2 and -3. Int. J. Appl. Earth Obs. Geoinf. 2013, 23, 344–351. [Google Scholar] [CrossRef] [Scilit]
- Wei, P.; Ye, H.; Qiao, S.; Liu, R.; Nie, C.; Zhang, B.; Song, L.; Huang, S. Early Crop Mapping Based on Sentinel-2 Time-Series Data and the Random Forest Algorithm. Remote Sens. 2023, 15, 3212. [Google Scholar] [CrossRef] [Scilit]
- Shen, Y.; Zhang, X.; Tran, K.H.; Ye, Y.; Gao, S.; Liu, Y.; An, S. Near real-time corn and soybean mapping at field-scale by blending crop phenometrics with growth magnitude from multiple temporal and spatial satellite observations. Remote Sens. Environ. 2025, 318, 114605. [Google Scholar] [CrossRef] [Scilit]
- You, N.; Dong, J.; Li, J.; Huang, J.; Jin, Z. Rapid early-season maize mapping without crop labels. Remote Sens. Environ. 2023, 290, 113496. [Google Scholar] [CrossRef] [Scilit]
- Shang, J.; Liu, J.; Poncos, V.; Geng, X.; Qian, B.; Chen, Q.; Dong, T.; Macdonald, D.; Martin, T.; Kovacs, J.; et al. Detection of Crop Seeding and Harvest through Analysis of Time-Series Sentinel-1 Interferometric SAR Data. Remote Sens. 2020, 12, 1551. [Google Scholar] [CrossRef] [Scilit]

Disclaimer/Publisher’s Note: The statements, opinions and data contained in all publications are solely those of the individual author(s) and contributor(s) and not of MDPI and/or the editor(s). MDPI and/or the editor(s) disclaim responsibility for any injury to people or property resulting from any ideas, methods, instructions or products referred to in the content. |
© 2026 by the authors. Licensee MDPI, Basel, Switzerland. This article is an open access article distributed under the terms and conditions of the Creative Commons Attribution (CC BY) license.