


Abstract
Volatile organic compounds (VOCs) emitted during solid-fuel combustion contribute to air pollution, secondary organic aerosol formation, and adverse environmental impacts. Improving the interpretation of VOC emissions is therefore important for developing more sustainable combustion systems and emission-monitoring strategies. Although online flame ionization detector systems enable continuous monitoring of total volatile organic compounds (TVOCs), the resulting measurements remain chemically non-specific and provide limited information about the composition of emitted mixtures. This study investigates whether data-driven approaches can improve the interpretation of TVOC signals generated during controlled solid-fuel combustion and proposes a descriptor-space-based pseudo-speciation framework. Continuous laboratory measurements of TVOCs and combustion parameters demonstrated that the integrated TVOC signal contains meaningful information about combustion dynamics, while preliminary machine-learning models confirmed that a substantial fraction of TVOC variability can be explained using routinely monitored process variables. To address the limited chemical specificity of TVOC measurements, principal component analysis and hierarchical clustering were applied to combustion-related VOCs described by molecular and physicochemical descriptors. The resulting framework organized VOCs into representative physicochemical groups, providing an intermediate interpretation layer between bulk TVOC measurements and compound-specific analysis. The proposed methodology demonstrates how artificial intelligence and chemoinformatics can enhance the interpretation of chemically non-specific TVOC signals and support more sustainable emission monitoring, combustion diagnostics, and environmental management.
1. Introduction
Residential solid-fuel combustion remains an important source of volatile organic compounds (VOCs), which contribute to air pollution, secondary organic aerosol formation, and adverse environmental and health effects [1,2]. Although considerable progress has been achieved in reducing particulate emissions from domestic heating systems, interpretation of gaseous VOC emissions remains considerably more challenging because VOCs comprise chemically diverse compounds whose composition changes continuously during the combustion process.
The term ‘volatile organic compounds’ encompasses a chemically diverse group of compounds characterized by markedly different physicochemical properties, atmospheric reactivities, and toxicological profiles. Emissions generated during solid-fuel combustion may contain oxygenated compounds, aromatic hydrocarbons, furans, phenolic species, low-molecular-weight hydrocarbons, and heavier semi-volatile organic compounds (SVOCs) [3,4,5]. The composition of emitted VOC mixtures depends strongly on fuel characteristics, combustion temperature, oxygen availability, combustion technology, and operational conditions [3,4,6]. Consequently, VOC emissions from residential solid-fuel combustion systems exhibit substantial variability not only in concentration but also in chemical composition. Recent reviews have further emphasized that VOCs and polycyclic aromatic hydrocarbons (PAHs) emissions from solid-fuel and biomass-related combustion processes are strongly affected by fuel type, combustion technology, sampling strategy, and measurement conditions, highlighting the need for improved interpretation of combustion-related VOC signals [7].
The release of VOCs during solid-fuel combustion is inherently stage-dependent and closely linked to the thermal decomposition, devolatilization, oxidation, and secondary transformation of the organic fuel matrix. During the initial heating and devolatilization stages, volatile and semi-volatile organic compounds are released as a result of evaporation, bond cleavage, and thermal cracking of fuel constituents. Depending on fuel composition and temperature, this stage may generate light hydrocarbons, oxygenated compounds, aromatic intermediates, furans, phenolic species, and other partially oxidized organic products [8,9].
During the subsequent active combustion stage, VOCs released during devolatilization and pyrolysis undergo partial or complete oxidation depending on the local temperature, oxygen availability, mixing conditions, and residence time in the combustion zone. At sufficiently high temperatures and under adequate air supply, most volatile intermediates are oxidized toward CO2 and H2O. However, under sub-stoichiometric or locally oxygen-deficient conditions, which frequently occur in small-scale solid-fuel combustion systems, incomplete oxidation and secondary recombination pathways may lead to the emission of chemically complex mixtures including aldehydes, organic acids, aromatic hydrocarbons, phenolic compounds, and PAHs [10]. The character of emitted VOC mixtures therefore changes substantially across the combustion cycle, shifting from thermally driven devolatilization products in the early stages toward incomplete oxidation and recombination products at higher temperatures. This stage-dependent variability in VOC formation provides the theoretical foundation for the temperature-dependent interpretation of TVOC signals presented in the current study.
In practical monitoring applications, VOC emissions are frequently measured using flame ionization detectors (FIDs), which provide continuous and real-time information on total volatile organic compound concentrations [11]. FID-based systems are attractive because of their robustness, simplicity, relatively low operational cost, and suitability for online monitoring applications. However, the detector response reflects only the total concentration of ionizable organic compounds and provides no information regarding the identity, composition, or relative abundance of individual VOC species. Consequently, continuous TVOC monitoring provides valuable information on emission dynamics but does not directly reveal which groups of compounds contribute to the observed detector response. While such signals contain valuable information regarding emission intensity and temporal variability, they do not directly reveal changes in chemical composition occurring during different combustion stages.
The principal limitation of TVOC monitoring therefore lies not in continuous signal acquisition but in signal interpretation. Similar TVOC values may originate from substantially different combustion conditions and chemically distinct VOC mixtures. While gas chromatography coupled with mass spectrometry (GC-MS) provides compound-specific information [5], these techniques require sophisticated instrumentation, extensive sample preparation, and offline analysis. Consequently, there is growing interest in computational approaches capable of extracting additional chemical insight from aggregate TVOC signals while preserving the simplicity of continuous monitoring.
Recent advances in machine learning have demonstrated considerable potential for analyzing complex environmental and combustion-related datasets. Data-driven approaches have been successfully applied to identify relationships between operating parameters and pollutant emissions, model nonlinear combustion phenomena, and predict the environmental performance of energy systems [12,13]. Although continuous flame ionization detector measurements provide only an integrated TVOC signal, temporal variations in this signal still reflect changes in combustion conditions and emission dynamics. Machine-learning methods can therefore be used to extract process-related information embedded in chemically non-specific TVOC measurements.
However, the prediction of TVOC variability alone does not explain which types of compounds are likely to contribute to the observed detector response. To provide an additional level of interpretation, descriptor-based approaches widely used in chemometrics and cheminformatics can be employed to organize chemically diverse VOCs into representative groups according to their physicochemical characteristics [14,15,16]. When combined with unsupervised learning techniques, such approaches can reveal hidden relationships between compounds and support the classification of complex chemical systems [17,18]. Such descriptor-space organization does not replace chemical speciation but establishes an interpretable intermediate layer between aggregate TVOC measurements and compound-specific analytical techniques.
In the present study, the term pseudo-speciation refers to the descriptor-based interpretation of integrated TVOC signals through the classification of combustion-related VOCs into representative physicochemical groups rather than direct identification or quantification of individual chemical species. Unlike conventional chemical speciation performed using techniques such as GC-MS, pseudo-speciation does not determine the exact composition of the emitted mixture but provides a chemically meaningful interpretation framework for otherwise non-specific detector responses. In the present work, these complementary concepts are combined into a clustering-based pseudo-speciation framework in which machine learning is used to characterize the relationship between combustion conditions and TVOC dynamics, whereas descriptor-space clustering provides a physicochemically meaningful interpretation of the observed signal.
The aim of this study is to investigate whether data-driven methods can support the interpretation of total volatile organic compound signals measured during solid-fuel combustion and to propose a clustering-based pseudo-speciation framework for their structured analysis. Specifically, the study aims to: (i) characterize the temporal variability of TVOC emissions under controlled combustion conditions, (ii) evaluate the feasibility of preliminary machine-learning models for describing TVOC variability, (iii) identify limitations associated with the interpretation of aggregate TVOC measurements, and (iv) develop a descriptor-space-based clustering framework supporting pseudo-speciation of combustion-related VOCs. Within the proposed framework, machine-learning models are used to identify relationships between combustion conditions and TVOC signal dynamics, whereas descriptor-space clustering provides an additional interpretation layer linking aggregate detector responses with representative physicochemical classes of combustion-related VOCs. The proposed methodology is intended as an exploratory step toward AI-assisted interpretation of chemically non-specific VOC signals and may contribute to future development of advanced emission-monitoring and emission-control strategies.
2. Materials and Methods
2.1. Laboratory System for Online Measurement of Volatile Organic Compounds
Experimental investigations were performed using a dedicated laboratory setup designed for continuous online monitoring of total volatile organic compounds emitted during controlled combustion of solid fuels. The measurement system enabled simultaneous registration of VOC concentration and selected combustion parameters under reproducible laboratory conditions.
The combustion process was conducted in a temperature-controlled laboratory furnace operating within the range of 500–950 °C. The combustion tests were performed using a representative hard coal sample. The basic physicochemical characteristics of the fuel are summarized in Table 1.
Table 1.
Basic characteristics of the coal used in the combustion tests.
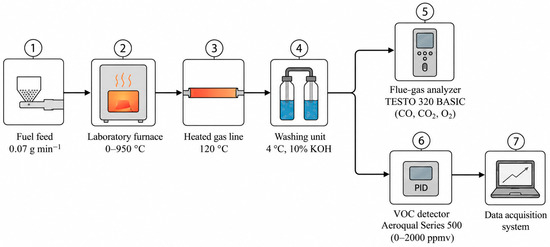
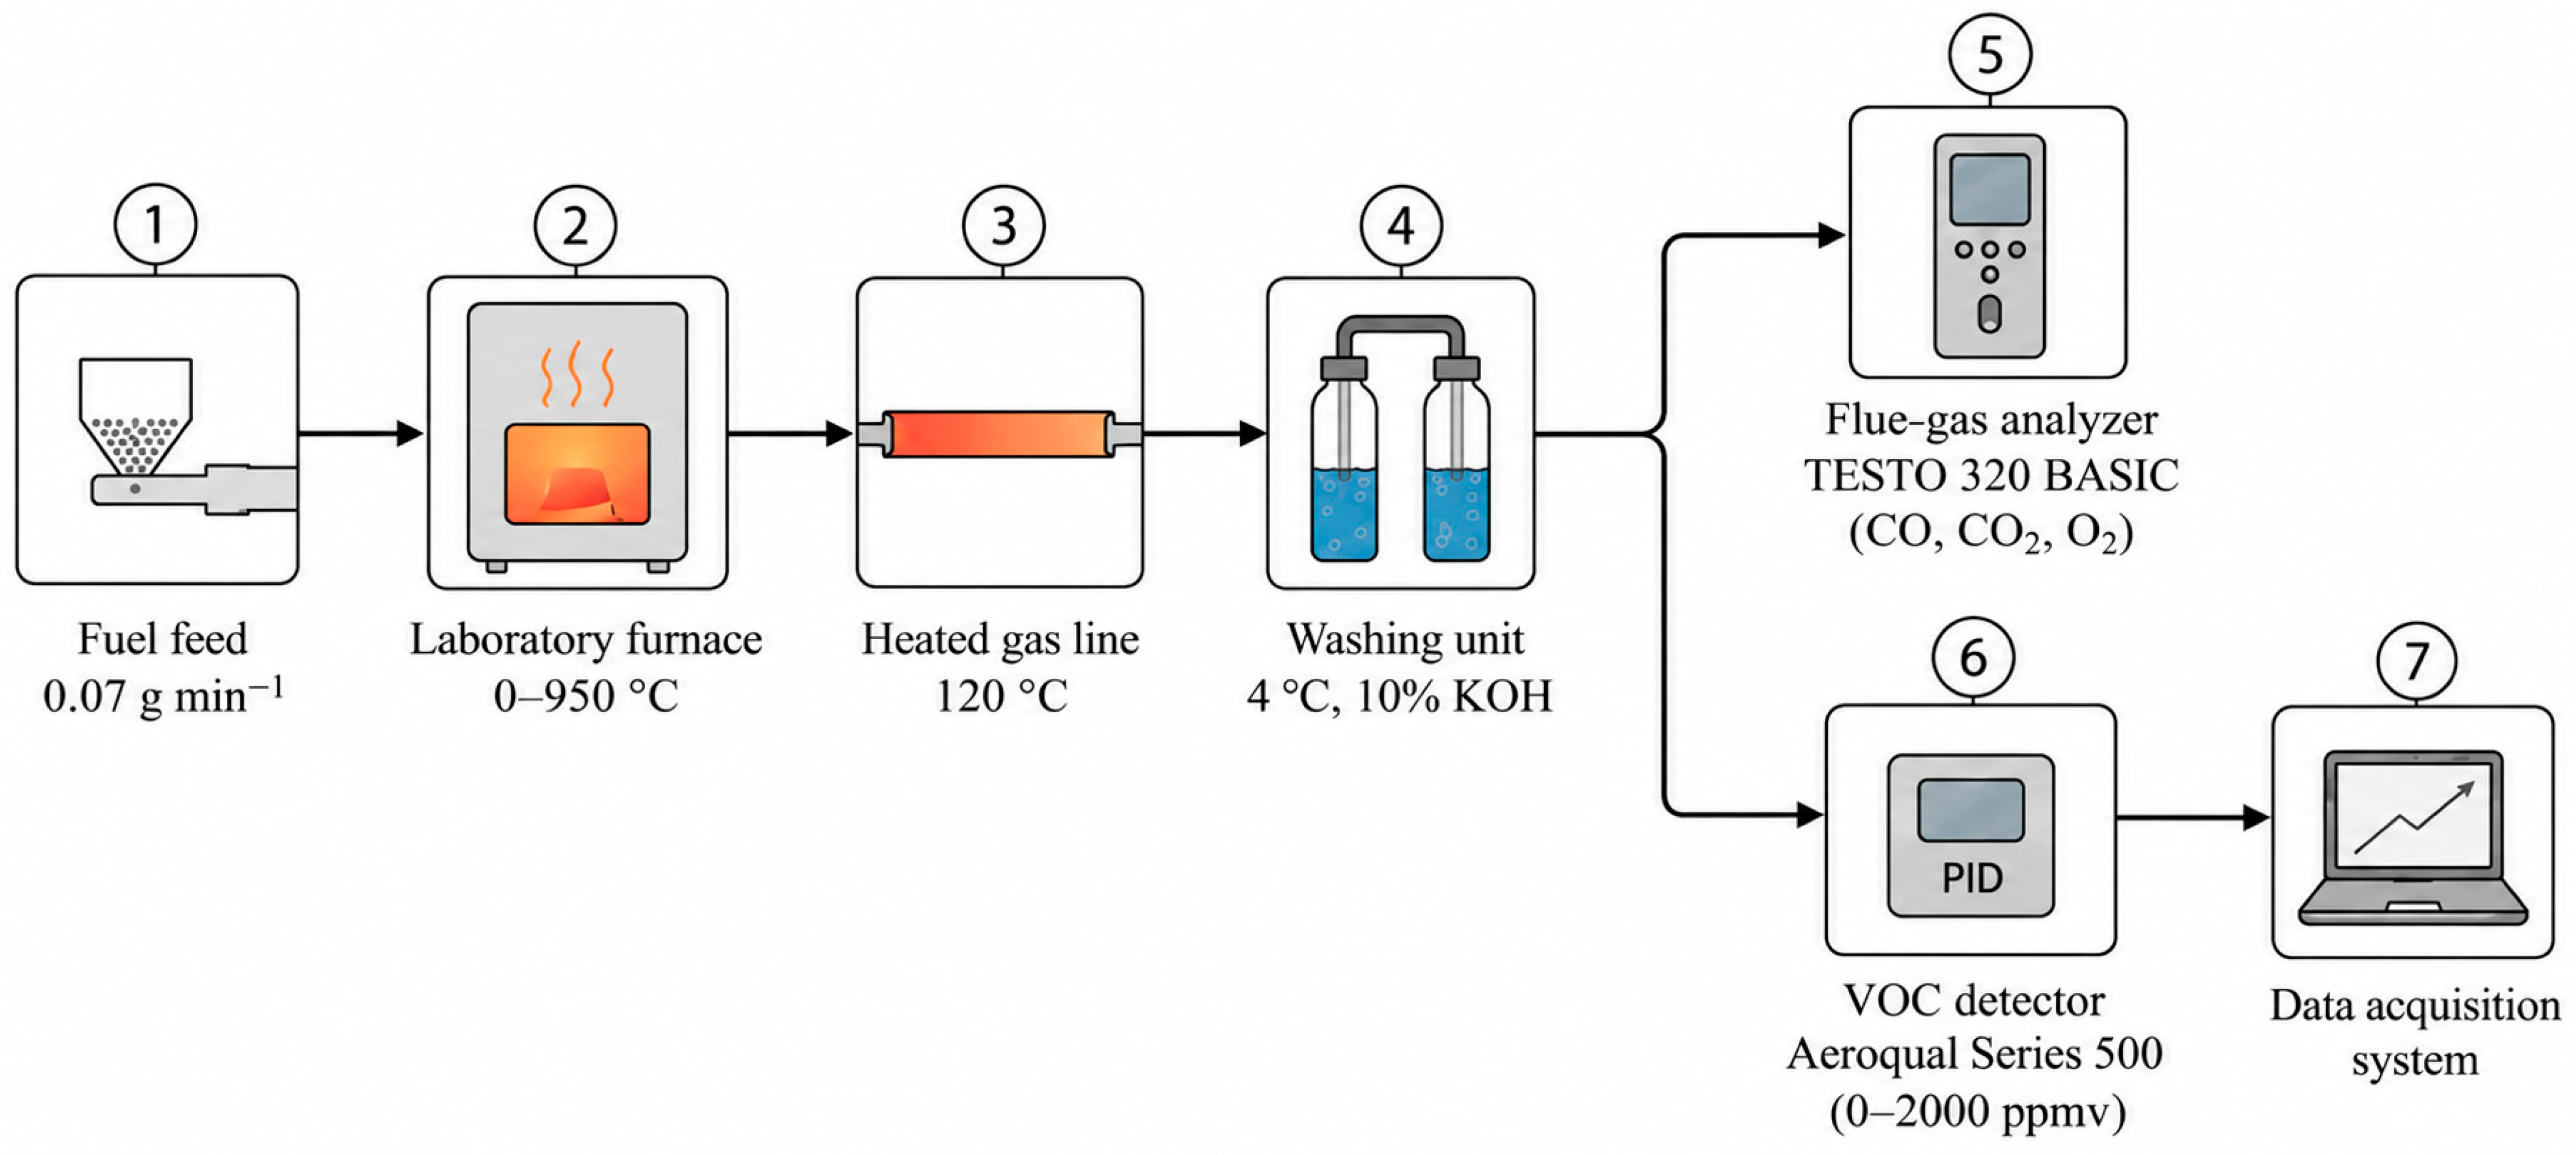
Fuel was continuously introduced into a drop-tube furnace using a screw feeder at a controlled feeding rate of approximately 0.07 g min−1. Flue-gases generated during combustion were transported through a heated sampling line maintained at approximately 120 °C to prevent condensation losses of semi-volatile organic compounds and to preserve the integrity of the gas sample.
Prior to TVOC measurement, the sampled gas stream was passed through an impinger-based gas-conditioning unit consisting of impingers containing a 10% KOH (Chemland, Poland) solution maintained at approximately 4 °C. This stage was introduced to remove acidic gases and other interfering species that could affect the performance of the VOC monitoring system. Basic flue-gas parameters, including CO, CO2, and O2 concentrations, were simultaneously monitored using a TESTO 320 BASIC flue-gas analyzer (Warsaw, Poland).
The measurement configuration was intentionally simplified to generate a stable and reproducible laboratory TVOC response suitable for comparative signal analysis and AI-based modeling rather than to provide exhaustive chemical characterization of raw flue-gas VOC composition.
The applied conditioning stage provided a stable and reproducible gas stream for on-line VOC monitoring. Since the study focused on comparative emission-profile analysis and AI-based interpretation of sensor responses, the recorded values were treated as post-conditioning TVOC signals.
It should be emphasized that the alkaline conditioning stage was not chemically neutral with respect to all VOC classes. In particular, polar and water-soluble oxygenated compounds, including low-molecular-weight alcohols, aldehydes, and organic acids, may have been partially retained in the 10% KOH impingers. Consequently, the reported TVOC values should be interpreted as conditioned detector responses obtained under reproducible laboratory conditions rather than unbiased total VOC concentrations in untreated flue-gas.
The TVOC signal was monitored online using an Aeroqual Series 500 VOC analyzer (Katowice, Poland) equipped with a VOC sensor operating within a measurement range of 0–2000 ppmv. During the combustion experiments, the maximum recorded TVOC signal did not exceed approximately 35 ppmv, remaining well below the upper operating limit of the sensor. Consequently, all measurements were performed within the linear operating range of the detector, and no saturation effects or nonlinear response corrections were required. The detector response was continuously recorded together with the combustion parameters using a dedicated data acquisition system, enabling synchronized analysis of combustion conditions and VOC signal dynamics. The Aeroqual VOC analyser was factory-calibrated using isobutylene as the reference compound. Consequently, the recorded TVOC values represent detector responses expressed in isobutylene-equivalent concentration rather than absolute concentrations of total organic carbon or the complete VOC mixture. As specified by the manufacturer, the sensor exhibits compound-dependent response factors, with sensitivity varying among different VOC classes. Therefore, the measured TVOC signal should be interpreted as an integrated detector response suitable for comparative analysis of temporal signal dynamics and process-related changes rather than quantitative determination of the total concentration of individual VOC species.
A simplified block diagram of the measurement system is presented in Figure 1. The integrated configuration allowed real-time observation of changes in total VOC signal during solid-fuel combustion experiments and provided the basis for subsequent data analysis and descriptor-based interpretation of VOC signal behavior.
Figure 1.
Simplified block diagram of the laboratory system for online measurement of total volatile organic compounds (source: own elaboration).
2.2. Validation and Repeatability Tests
Prior to the combustion experiments, preliminary validation and optimization tests were carried out using a separate auxiliary VOC measurement setup. This stage was introduced to define the operating conditions of the VOC detector, verify the stability of the measurement procedure, and establish the control parameters required before applying the system to flue-gas monitoring during solid-fuel combustion. The auxiliary setup was independent of the combustion system and consisted of a Tedlar bag filled with nitrogen, a peristaltic pump, a rotameter for flow-rate control, an injection port for introducing model VOC compounds, a Tenax adsorption–desorption module, and an Aeroqual Series 500 VOC analyser.
The validation procedure was designed to assess three key aspects of the measurement system: (i) repeatability of the detector response, (ii) thermal and flow conditions required for controlled adsorption and desorption of selected VOC, and (iii) potential analyte losses within the sampling train. Model VOC compounds with different physicochemical properties, including methanol, isopropanol, cyclohexane, n-hexane, and toluene (Sigma Aldrich, Polish distribution), were used for this purpose. Particular attention was given to toluene, which was subsequently selected as the reference compound for optimization studies because of its stable detector response and representative behavior within the sampling system.
The validation procedure was performed using model VOC compounds representing different physicochemical properties, including methanol, isopropanol, cyclohexane, n-hexane, and toluene. Particular attention was devoted to toluene, which was subsequently selected as the reference compound for optimization studies due to its stable detector response and representative behavior within the sampling system.
Initial repeatability tests were carried out using a 1% (v/v) solution of toluene in methanol. Repeated injections revealed moderate signal variability, with a relative standard deviation (RSD) of 11.0%. Following optimization of the analytical procedure, including stabilization of the sampling conditions and detector baseline, the repeatability improved substantially, reducing the RSD to 2.8% (Table 2). These results confirmed the ability of the system to provide stable and reproducible VOC measurements.
Table 2.
Repeatability of the VOC measurement system before and after optimization (source: own elaboration).
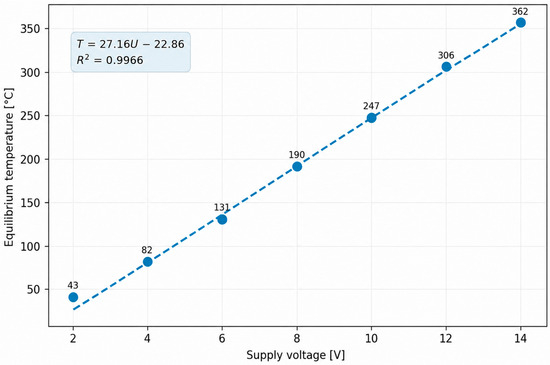
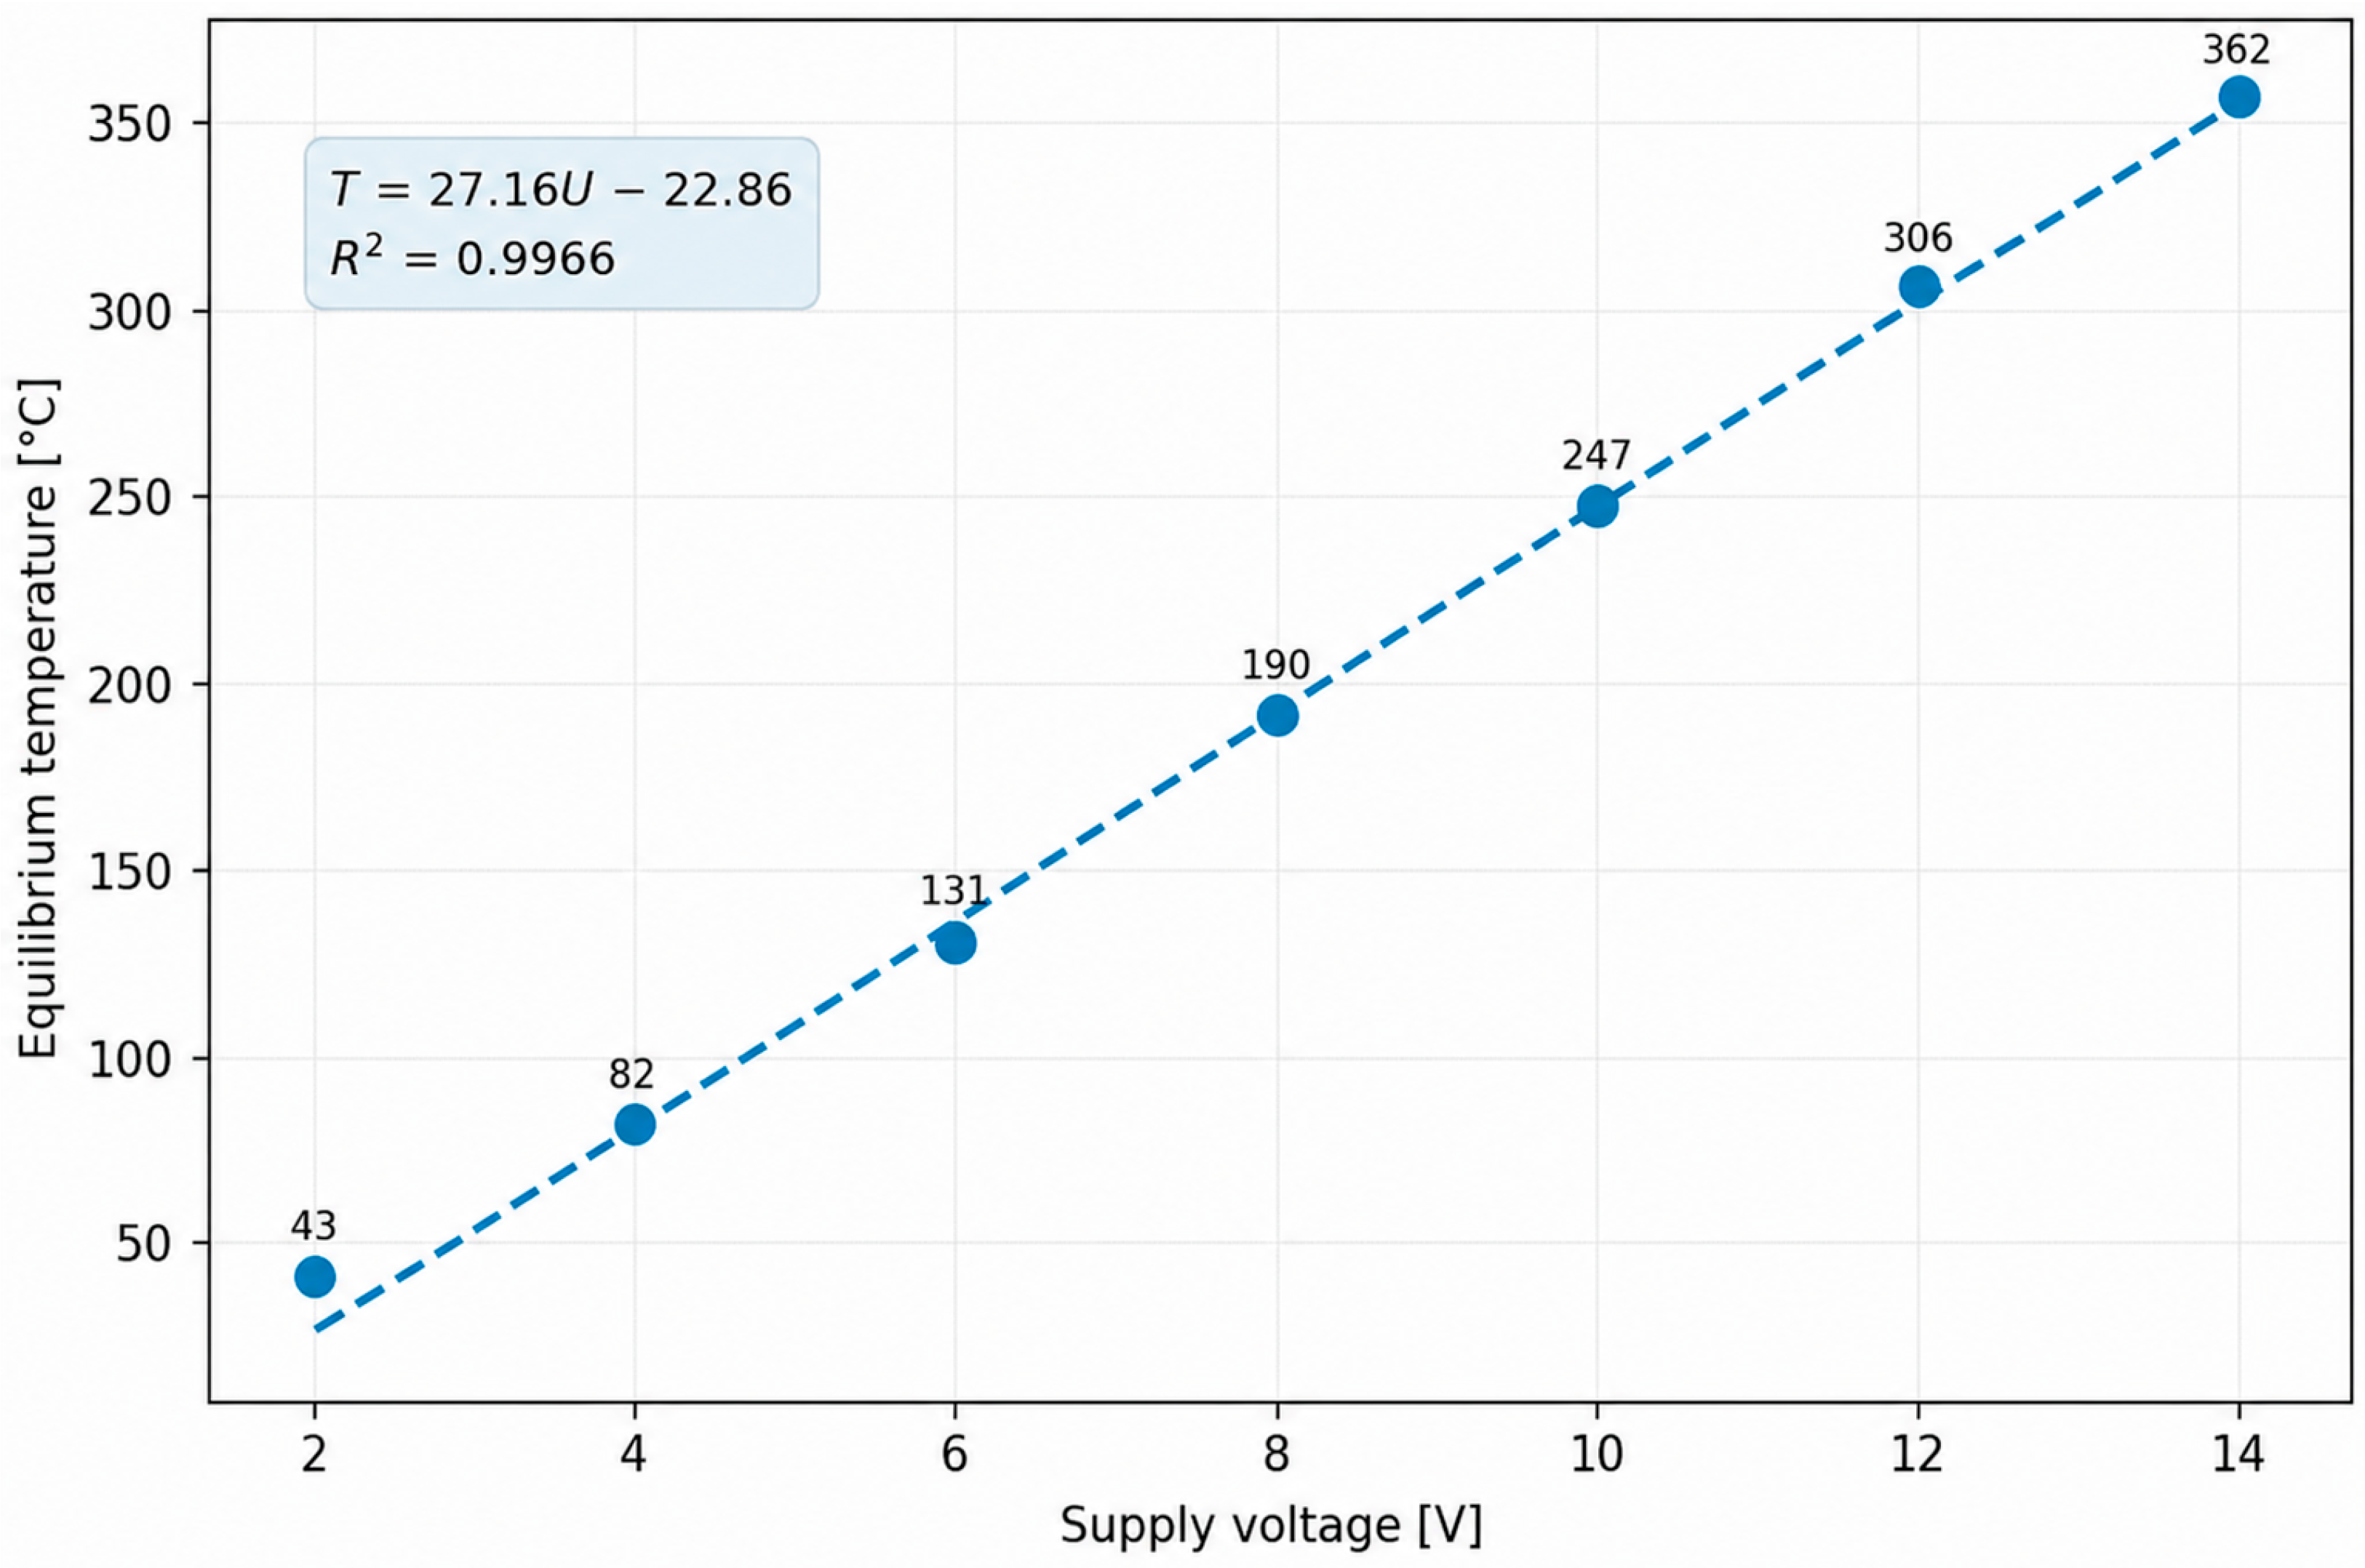
The thermal characteristics of the adsorption–desorption module were investigated in order to determine suitable operating conditions for analyte release. The equilibrium temperature of the sorption trap was evaluated as a function of the applied supply voltage (Figure 2). The temperature increased approximately linearly from 43 °C at 2 V to 362 °C at 14 V. A temperature of approximately 250 °C, corresponding to a supply voltage of about 11 V, was selected as the standard desorption condition because it enabled efficient analyte release while maintaining controlled thermal operation of the system.
Figure 2.
Thermal characterization of the adsorption–desorption module. Equilibrium temperature of the sorption trap as a function of applied supply voltage under constant flow conditions. The dashed line represents the linear regression model used to support the selection of desorption operating conditions (source: own elaboration).
Additional experiments were performed to evaluate detector response and analyte retention behavior using isopropanol, cyclohexane, n-hexane, and toluene. The results indicated that cyclohexane exhibited limited retention on the Tenax sorbent, whereas toluene produced the most stable and reproducible response. Consequently, toluene was selected as the reference analyte for calibration and optimization studies.
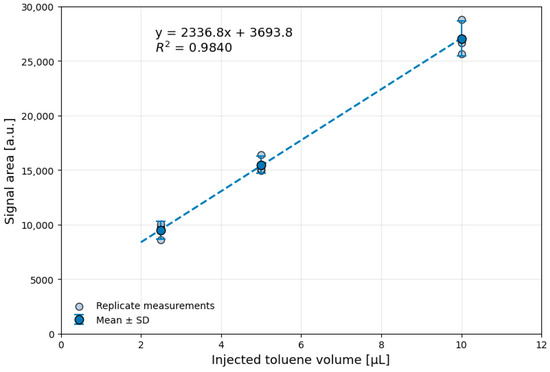
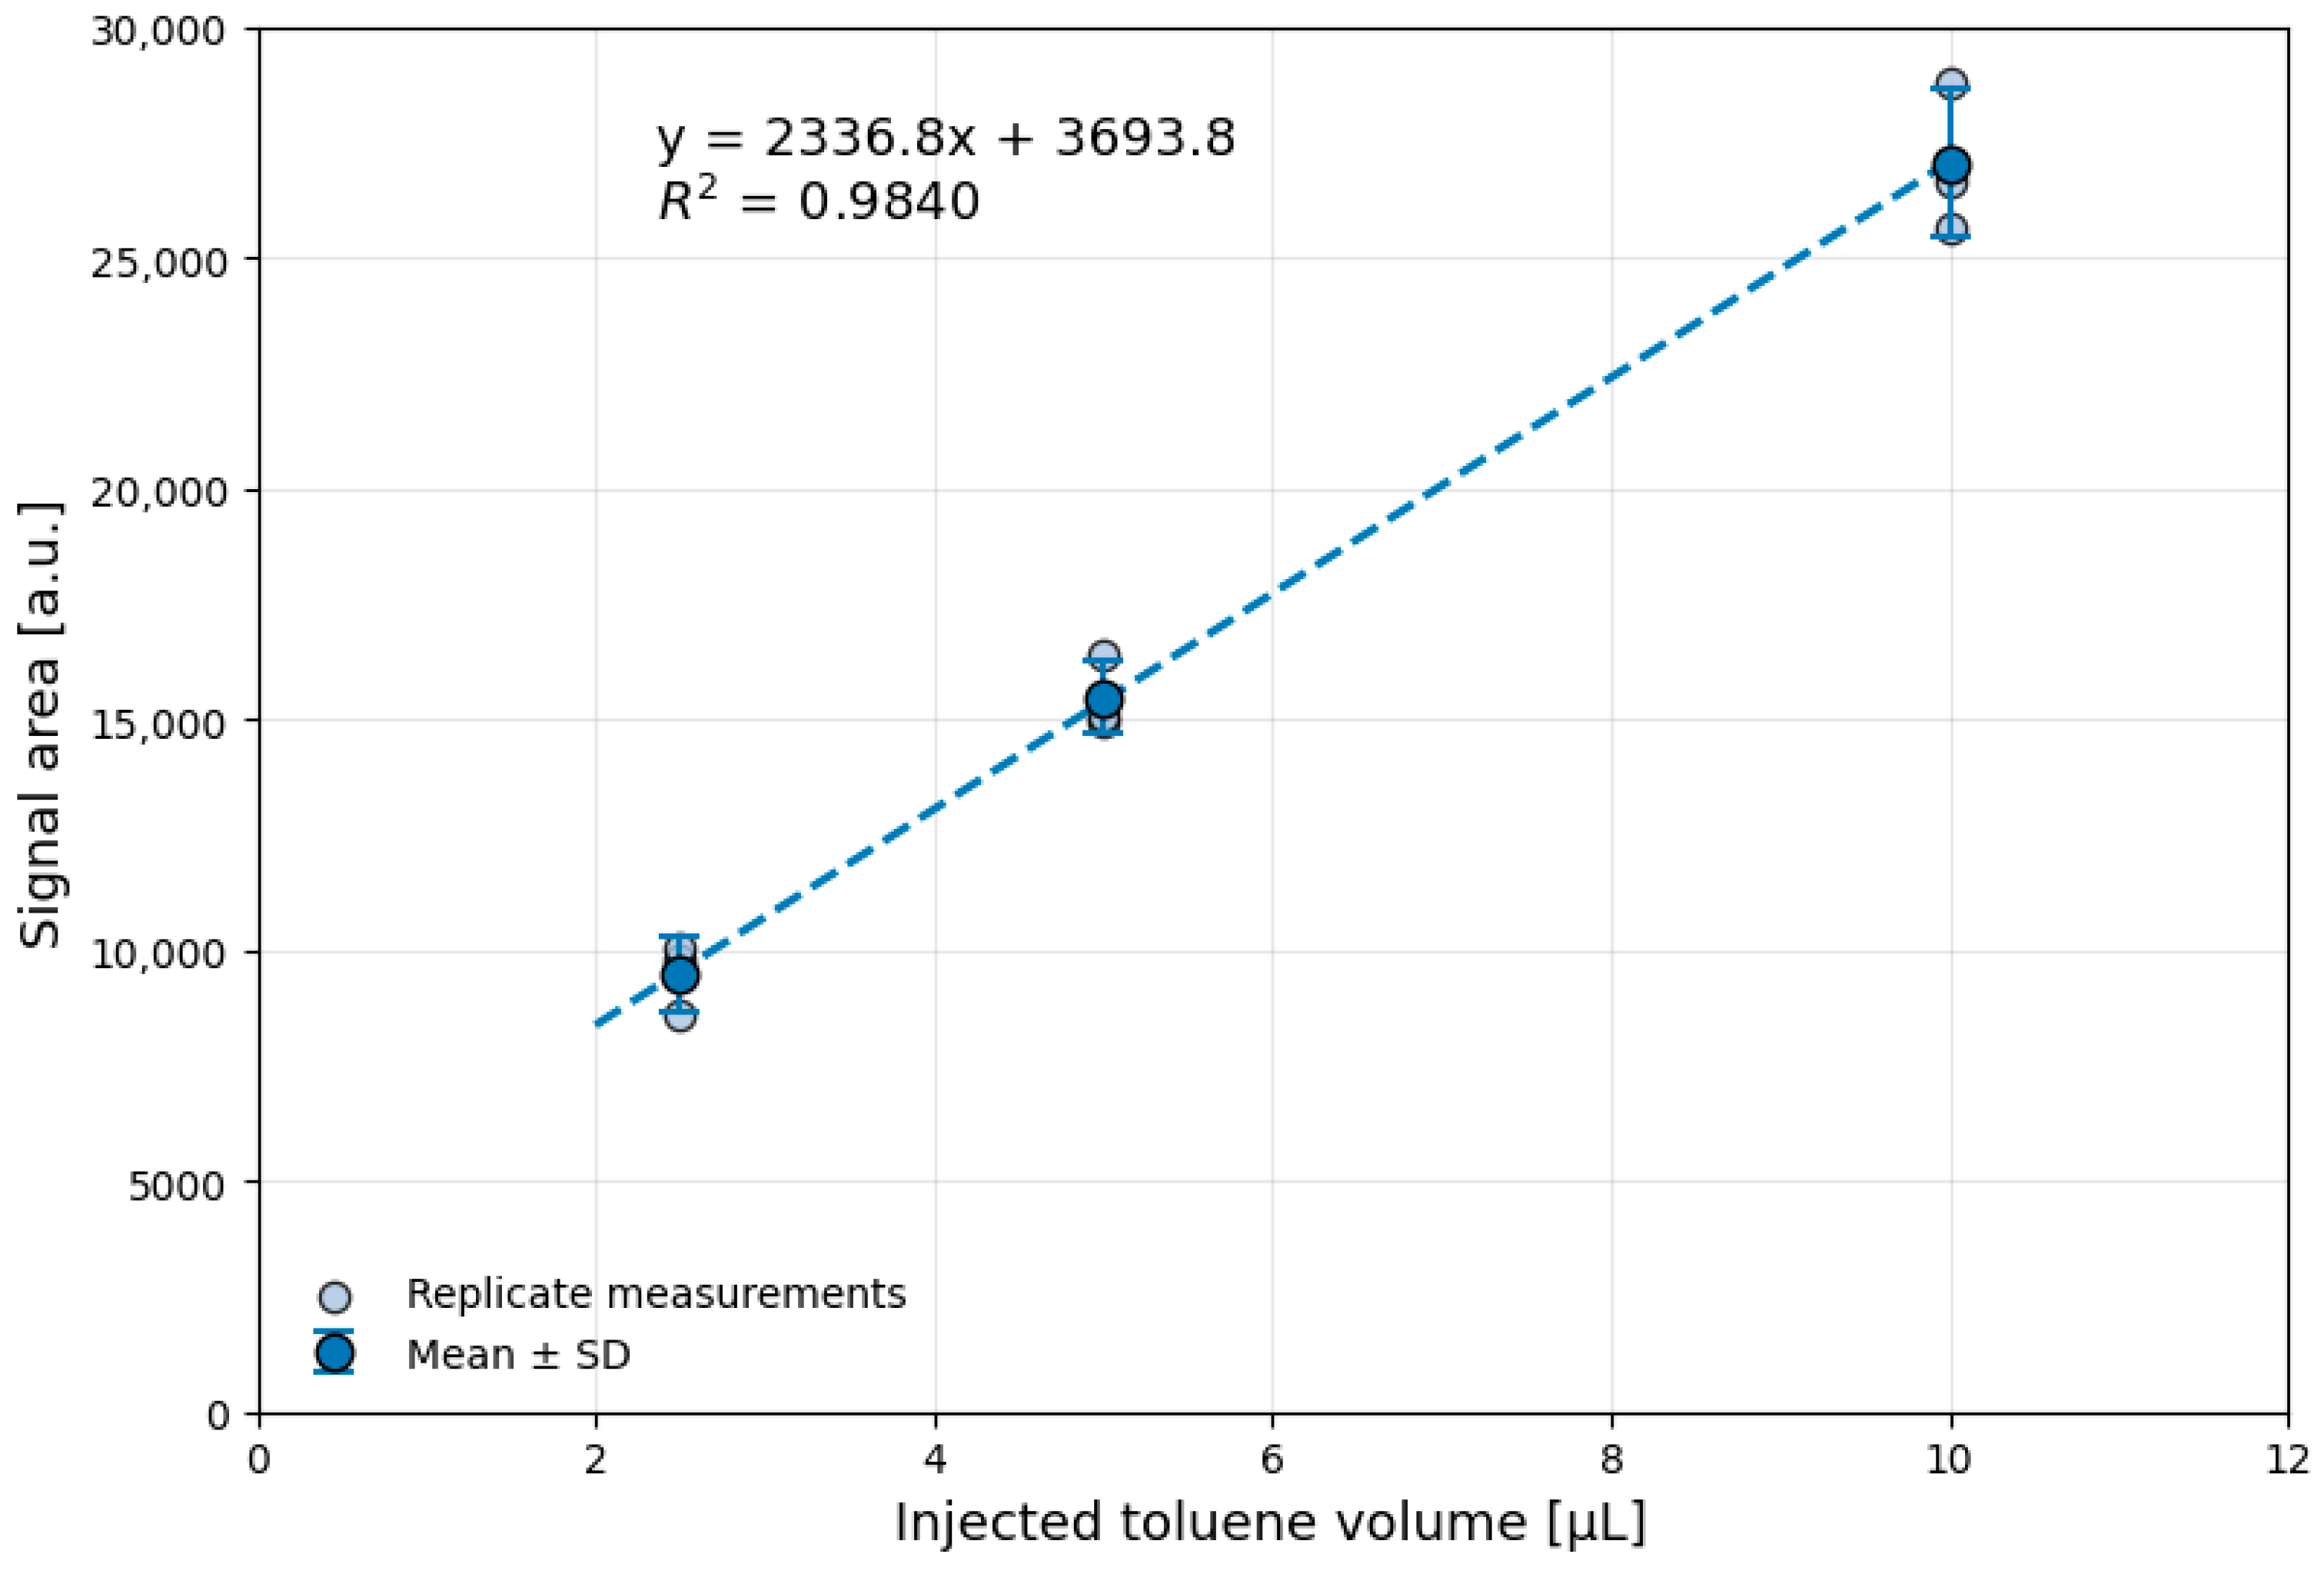
The calibration curve (Figure 3) obtained for toluene demonstrated excellent linearity over the investigated concentration range (R2 = 0.9999). Error bars represent the standard deviation of three replicate measurements at each injection volume, indicating good repeatability of the detector response despite minor experimental variability. These results confirm the suitability of the detector for comparative quantitative VOC measurements under the laboratory conditions adopted in this study. It should be noted that the calibration shown in Figure 3 is specific to toluene, which was selected as the reference compound because of its stable and reproducible behavior within the analytical system. According to the manufacturer’s specifications, the Aeroqual VOC sensor is factory-calibrated using isobutylene, and its sensitivity varies among different VOC classes due to compound-dependent response factors. Consequently, although the calibration curve confirms the linearity and repeatability of detector response for the reference compound, the recorded TVOC values should be interpreted as integrated detector responses rather than absolute concentrations of the total organic mass or total carbon present in chemically complex VOCs mixtures.
Figure 3.
Calibration curve of the Aeroqual Series 500 VOC detector obtained using toluene as the reference compound. Detector response expressed as signal area as a function of injected sample volume (source: own elaboration).
2.3. Combustion Experiments and Measured Parameters
Combustion experiments were performed using the laboratory setup described in Section 2.1 under controlled operating conditions. The objective of the experiments was to investigate temporal variations in TVOC emissions generated during solid-fuel combustion and to identify relationships between TVOC signal and selected combustion parameters.
During each experiment, the furnace temperature was increased from ambient conditions to approximately 950 °C, allowing observation of the VOC signal over a broad range of combustion conditions. The complete combustion cycle included fuel heating, devolatilization, ignition, active combustion, and burnout stages. The continuous TVOC and flue-gas measurements were acquired using the laboratory system described in Section 2.1.
The following variables were recorded throughout each experiment: furnace temperature (°C), total VOC concentration (ppmv), oxygen concentration, O2 (%), carbon monoxide concentration, CO (ppm), carbon dioxide concentration, CO2 (%), and measurement time (s). Based on the measured oxygen concentration, the excess air coefficient (λ) was calculated to characterize combustion conditions and air supply efficiency. The collected datasets constituted the basis for subsequent statistical analyses, machine-learning modeling, and descriptor-space interpretation of VOC emission behavior presented in the following sections.
2.4. Data Preprocessing and Exploratory Analysis
The raw experimental data consisted of synchronized time-series measurements collected during combustion experiments. Since all signals were acquired simultaneously but originated from different measurement devices, an initial synchronization procedure was performed to ensure temporal consistency across the dataset.
Prior to analysis, the data underwent a preprocessing workflow comprising data cleaning, signal inspection, and quality control. Missing values and obvious measurement artefacts associated with detector stabilization periods, start-up conditions, and transient acquisition disturbances were identified and removed. The resulting dataset represented continuous combustion trajectories suitable for subsequent statistical and machine-learning analyses.
Exploratory data analysis was subsequently conducted to characterize temporal emission behavior and identify relationships between combustion parameters and VOC emissions. Time-series visualization was applied to investigate the evolution of VOC concentration during successive combustion stages and to identify periods associated with increased emission intensity.
2.5. Predictive Modeling of Total Volatile Organic Compound Variability
To explore potential relationships between combustion conditions and TVOC emissions, preliminary data-driven models were developed. The primary objective was not to establish a predictive tool but rather to assess whether routinely measured combustion parameters contain sufficient information to explain variations observed in the integrated TVOC signal.
The input variables consisted of the furnace temperature, oxygen concentration, carbon monoxide concentration, carbon dioxide concentration, and excess air coefficient. The target variable was the total VOC concentration.
Prior to model development, the dataset was randomly divided into three subsets comprising 70% of observations for training, 15% for validation, and 15% for testing. The dataset consisted of multiple short experimental runs performed under different operating conditions rather than a single continuous combustion time series. Therefore, the random partitioning was adopted as an exploratory validation strategy for this proof-of-concept study, while recognizing that more rigorous validation based on experimental runs or chronological splitting should be considered in future investigations.
Two modeling approaches representing different levels of model complexity were investigated:
- Decision tree regression (DT);
- Artificial neural network (ANN).
The decision tree model was used as an interpretable machine-learning approach capable of identifying nonlinear relationships between combustion parameters and TVOC emissions. Tree growth was performed using the CART algorithm implemented in Statistica 13.0. The final selected regression tree contained 7 non-terminal nodes and 8 terminal nodes, with splits determined automatically by minimizing within-node variance.
Artificial neural network models were implemented using multilayer perceptrons (MLPs) in Statistica 13.0. Network architectures comprising five input neurons, one hidden layer containing 3–9 neurons, and one output neuron were evaluated. Model training was performed using the Broyden–Fletcher–Goldfarb–Shanno (BFGS) optimization algorithm with the Sum of Squares (SOS) error function. Depending on the tested architecture, hyperbolic tangent (tanh), logistic, exponential, sine, and identity activation functions were evaluated for the hidden and output layers. The final network architecture was selected based on the best compromise between predictive accuracy, validation performance, and model complexity.
Model performance was evaluated using the coefficient of determination (R2) and prediction error statistics calculated for the training, validation, and testing subsets. Comparison of model performance across the three subsets was used to assess predictive capability and potential overfitting. The adopted modeling strategy focused on evaluating the feasibility of data-driven prediction of total VOC variability rather than on maximizing predictive performance.
The relative importance of individual combustion parameters was additionally examined using the structure of the decision tree model. This analysis provided insight into the process variables most strongly associated with changes in VOC emissions during combustion. The modeling results were subsequently used to identify dominant drivers of VOC variability and to assess the feasibility of data-driven prediction of combustion-related VOC emissions.
2.6. Descriptor-Space-Based Pseudo-Speciation of Volatile Organic Compounds
To support the interpretation of total VOC emissions measured using flame ionization detection, a descriptor-based organization framework for combustion-related VOCs was developed, with particular reference to compounds reported in the biomass combustion literature as a basis for future application to solid fuels. The approach was intended to identify groups of compounds with similar physicochemical characteristics and potential emission behavior rather than to perform direct chemical speciation. A representative database of volatile and semi-volatile organic compounds associated with biomass combustion was compiled based on literature reports concerning residential wood combustion, carbon-rich fuel pyrolysis, atmospheric emissions, and combustion-related VOC studies. The database included light hydrocarbons, oxygenated VOCs, aromatic compounds, furans, phenolic species, lignin-derived compounds, and selected heavier semi-volatile aromatic compounds frequently reported in biomass smoke.
For each compound, physicochemical descriptors were collected from publicly available chemical databases, primarily PubChem [19] and the NIST Chemistry WebBook [20]. The extracted parameters included molecular weight, boiling point, vapor pressure at 20 °C, octanol/water partition coefficient (logP), topological polar surface area (TPSA), number of rotatable bonds, and molecular structural information represented using SMILES notation. Additional molecular descriptors were calculated directly from SMILES structures in order to characterize the chemical architecture of the compounds. These descriptors included:
- Number of carbon atoms;
- Oxygen-to-carbon ratio (O/C);
- Aromaticity indicators;
- Ring count;
- Heteroatom count;
- Double bond equivalent (DBE);
- Selected connectivity-based structural descriptors.
Table 3 summarizes the physicochemical descriptors used for descriptor-space construction and clustering analysis.
Table 3.
Descriptor framework used in PCA and clustering analysis (source: own elaboration).
The resulting descriptor matrix was used to construct a multidimensional physicochemical descriptor space representing combustion-related VOCs. Representative compounds included in the descriptor-space analysis together with selected physicochemical descriptors are presented in Table 4, whereas the complete dataset comprising approximately 100 combustion-related VOCs is publicly available through an online repository (see Data Availability Statement).
Table 4.
Representative VOCs included in descriptor-space analysis (source: own elaboration).
Prior to multivariate analysis, numerical variables were standardized using z-score normalization to eliminate scale-related effects between descriptors of different magnitudes and units. Principal component analysis (PCA) was subsequently applied for dimensionality reduction and exploratory visualization of descriptor relationships between compounds. PCA enabled identification of the dominant directions of variance within the descriptor space and facilitated interpretation of major physicochemical trends among VOC groups.
To further investigate structural similarities between compounds, hierarchical clustering analysis was performed using Euclidean distance and Ward linkage. This approach was selected due to its suitability for identifying compact descriptor-based groups in multidimensional physicochemical datasets. The clustering procedure was intended to identify representative classes of VOCs potentially associated with distinct emission behaviors, volatility ranges, and structural characteristics.
To support the selection of the final clustering solution, additional cluster-quality metrics were evaluated, including the silhouette coefficient, Davies–Bouldin index, and Calinski–Harabasz criterion summarized in Table 5. The final number of clusters was selected based on a combination of clustering quality metrics and physicochemical interpretability of the resulting VOC groups.
Table 5.
Cluster-quality metrics calculated for hierarchical clustering solutions containing 2–8 clusters (source: own elaboration).
All machine-learning models were developed using TIBCO Statistica™ 14 (TIBCO Software Inc., Palo Alto, CA, USA). Descriptor calculations, principal component analysis, hierarchical clustering, and graphical visualization were performed using Python 3.13, whereas preliminary data organization and preprocessing were carried out using Microsoft Excel 365 (Microsoft Corporation, Redmond, WA, USA).
3. Results and Discussion
3.1. Temporal and Temperature-Dependent Variability of Total Volatile Organic Compound Emissions
To evaluate the response of the developed online measurement system under realistic combustion conditions, a series of controlled combustion experiments was performed using the laboratory setup described in Section 2. The objective was to investigate how TVOC emissions evolve during successive stages of thermal transformation and combustion and to identify the temperature regions associated with increased VOC formation.
The continuously recorded measurement signals enabled simultaneous observation of VOC concentration, oxygen content, λ, and furnace temperature throughout complete heating and cooling cycles. This approach provided insight into the dynamic relationship between combustion conditions and VOC emissions, allowing the identification of characteristic emission patterns associated with devolatilization, pyrolysis, partial oxidation, and burnout processes. The temperature-dependent behavior of TVOC emissions observed in the present study is consistent with the thermochemical transformations reported for solid fuels and lignocellulosic materials. Previous studies have shown that volatile organic compounds are generated predominantly during devolatilization and pyrolysis stages, whereas their subsequent destruction is promoted by increasing combustion temperature and oxidation intensity [21,22]. Based on literature data and the experimental observations obtained in this work, several characteristic temperature regions were distinguished and used as a framework for interpretation of the measured emission profiles (Table 6).
Table 6.
Characteristic temperature regions of the combustion process and dominant thermochemical transformations associated with VOC formation (source: own elaboration based on [21,22]).
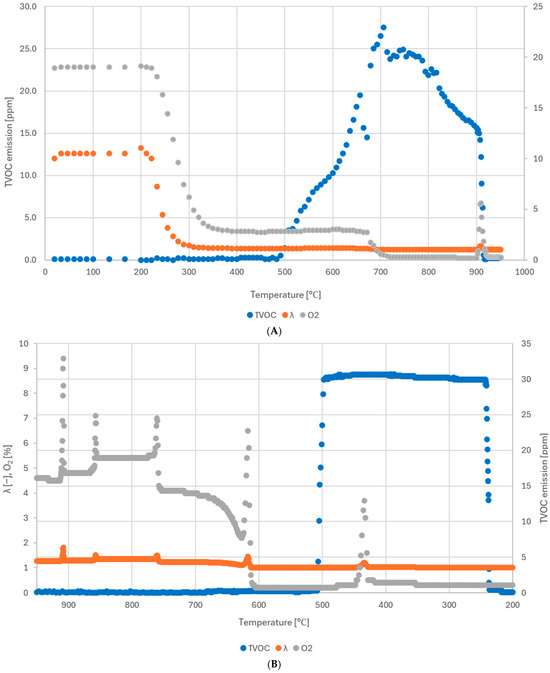
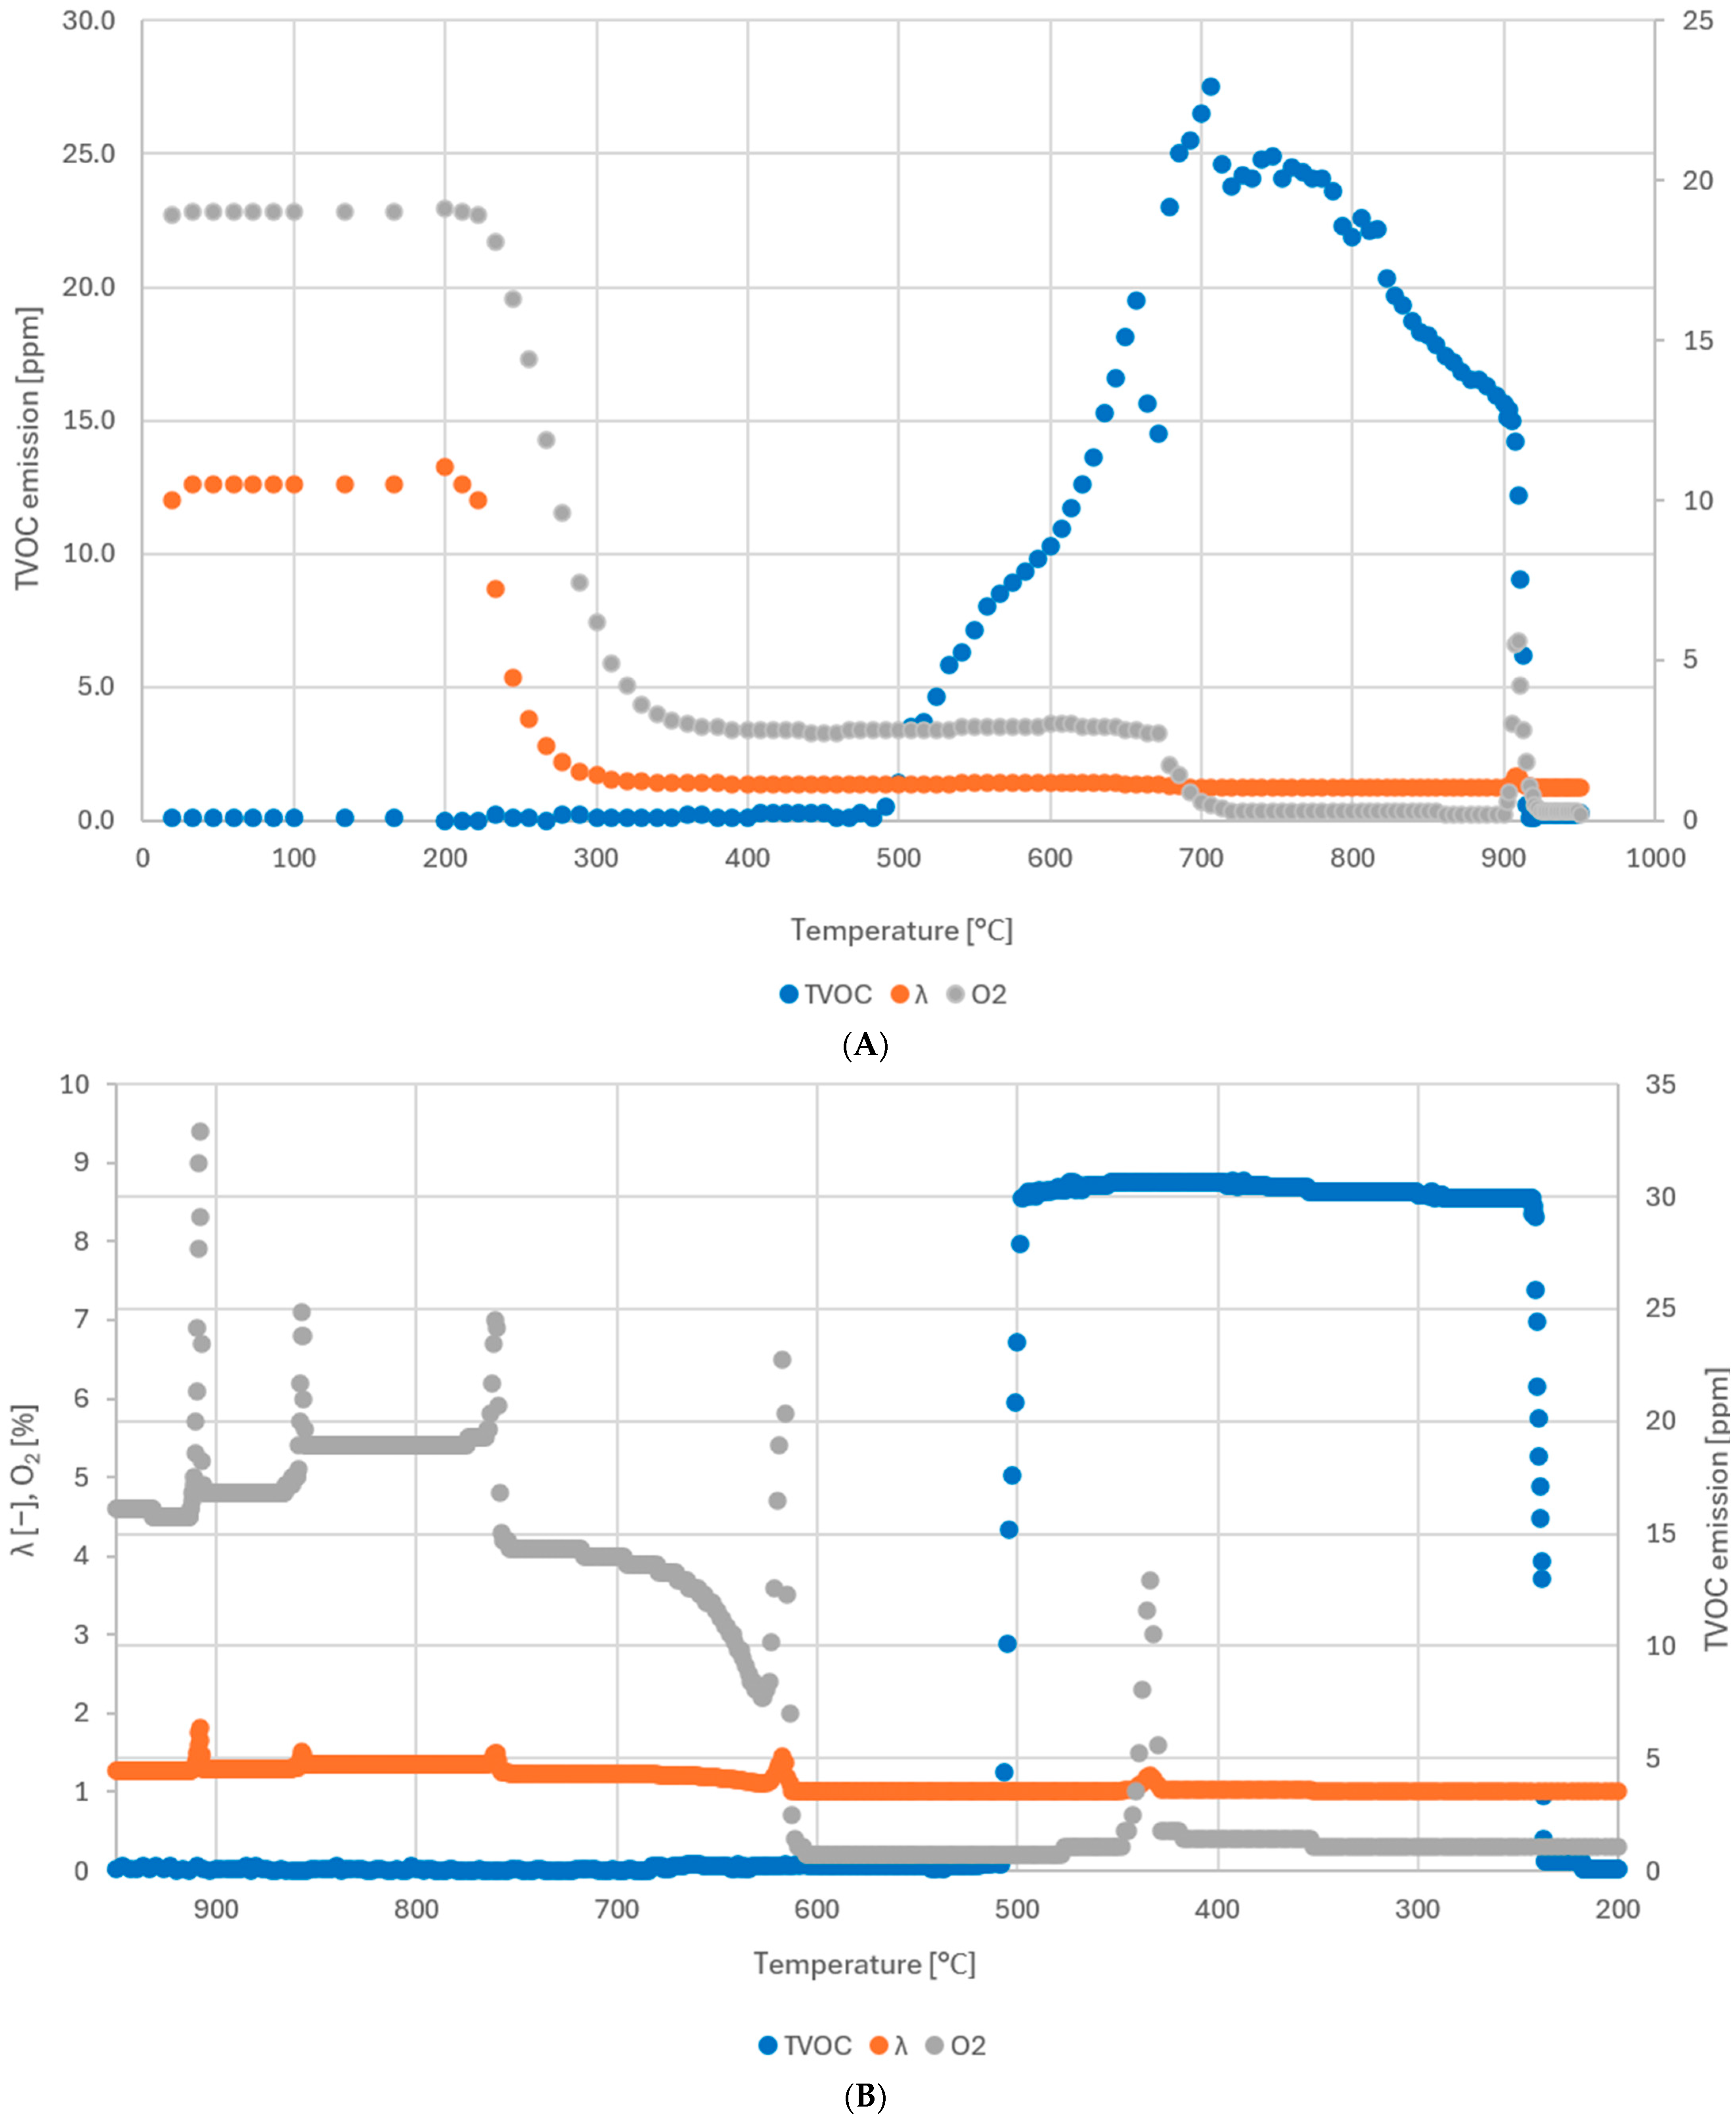
The temporal evolution of TVOC emissions during controlled heating and cooling cycles is presented in Figure 4. During the heating phase (Figure 4A), VOC concentrations remained low below approximately 200–300 °C, where only limited release of residual volatile species occurred. As the temperature increased, a pronounced rise in TVOC concentration was observed, corresponding to the onset of devolatilization and pyrolytic decomposition processes. The highest VOC concentrations were recorded within the temperature range of approximately 500–700 °C. According to the classification presented in Table 6, this region corresponds to advanced pyrolysis and partial oxidation of volatile products generated during fuel decomposition. Simultaneously, decreases in oxygen concentration and excess air coefficient were observed, indicating intensified combustion reactions and increased oxygen consumption. Similar temperature-dependent variations in VOC composition and emission intensity have been reported for biomass combustion systems, where aromatic hydrocarbons, oxygenated compounds, and other intermediate products were found to be strongly associated with fuel devolatilization and incomplete oxidation processes [23].
Figure 4.
Temporal evolution of total VOC concentration, oxygen concentration, and excess air coefficient (λ) during controlled heating (A) and cooling (B) cycles of the laboratory combustion system (source: own elaboration).
At temperatures above approximately 700 °C, TVOC concentrations gradually declined despite further temperature increase. This behavior suggests progressive oxidation of volatile organic compounds and a transition towards more complete combustion conditions. Above approximately 850 °C, VOC concentrations approached near-background levels, indicating efficient destruction of organic intermediates.
The cooling cycle (Figure 4B) exhibited a different response pattern. Although the temperature decreased continuously, transient increases in VOC concentration were still observed, reflecting secondary release of retained volatile species and temporary disturbances in thermochemical equilibrium. The differences observed between the heating and cooling trajectories indicate that VOC formation and destruction cannot be described solely as a function of instantaneous temperature but are also probably influenced by the thermal history of the system.
The observed TVOC profiles for the tested solid fuels showed the same general stage-dependent behavior: low VOC response during initial heating, a pronounced increase during devolatilization and pyrolysis, and a subsequent decrease during oxidation and burnout. This indicates that the dominant structure of the TVOC signal was governed primarily by combustion stage, temperature evolution, and oxygen availability.
3.2. Preliminary Machine-Learning Prediction of Total Volatile Organic Compound Signals
The dynamic behavior of TVOC emissions observed during the combustion experiments suggests the existence of nonlinear relationships between process parameters and VOC generation. To explore the feasibility of data-driven prediction of VOC variability, a preliminary machine-learning analysis was performed using the experimental dataset collected during the combustion tests. The objective of this stage was not to develop a production-ready predictive model but rather to evaluate whether the measured process variables contain sufficient information to explain and estimate changes in the TVOC signal. The modeling approach therefore served as an exploratory step supporting future development of more advanced predictive frameworks.
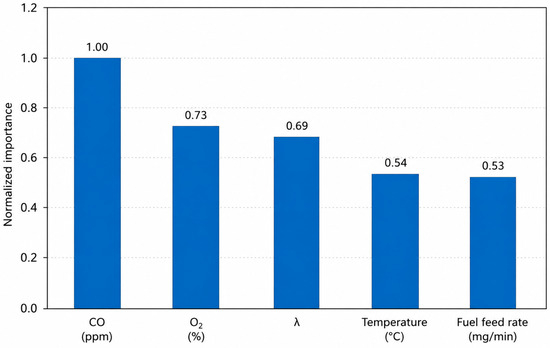
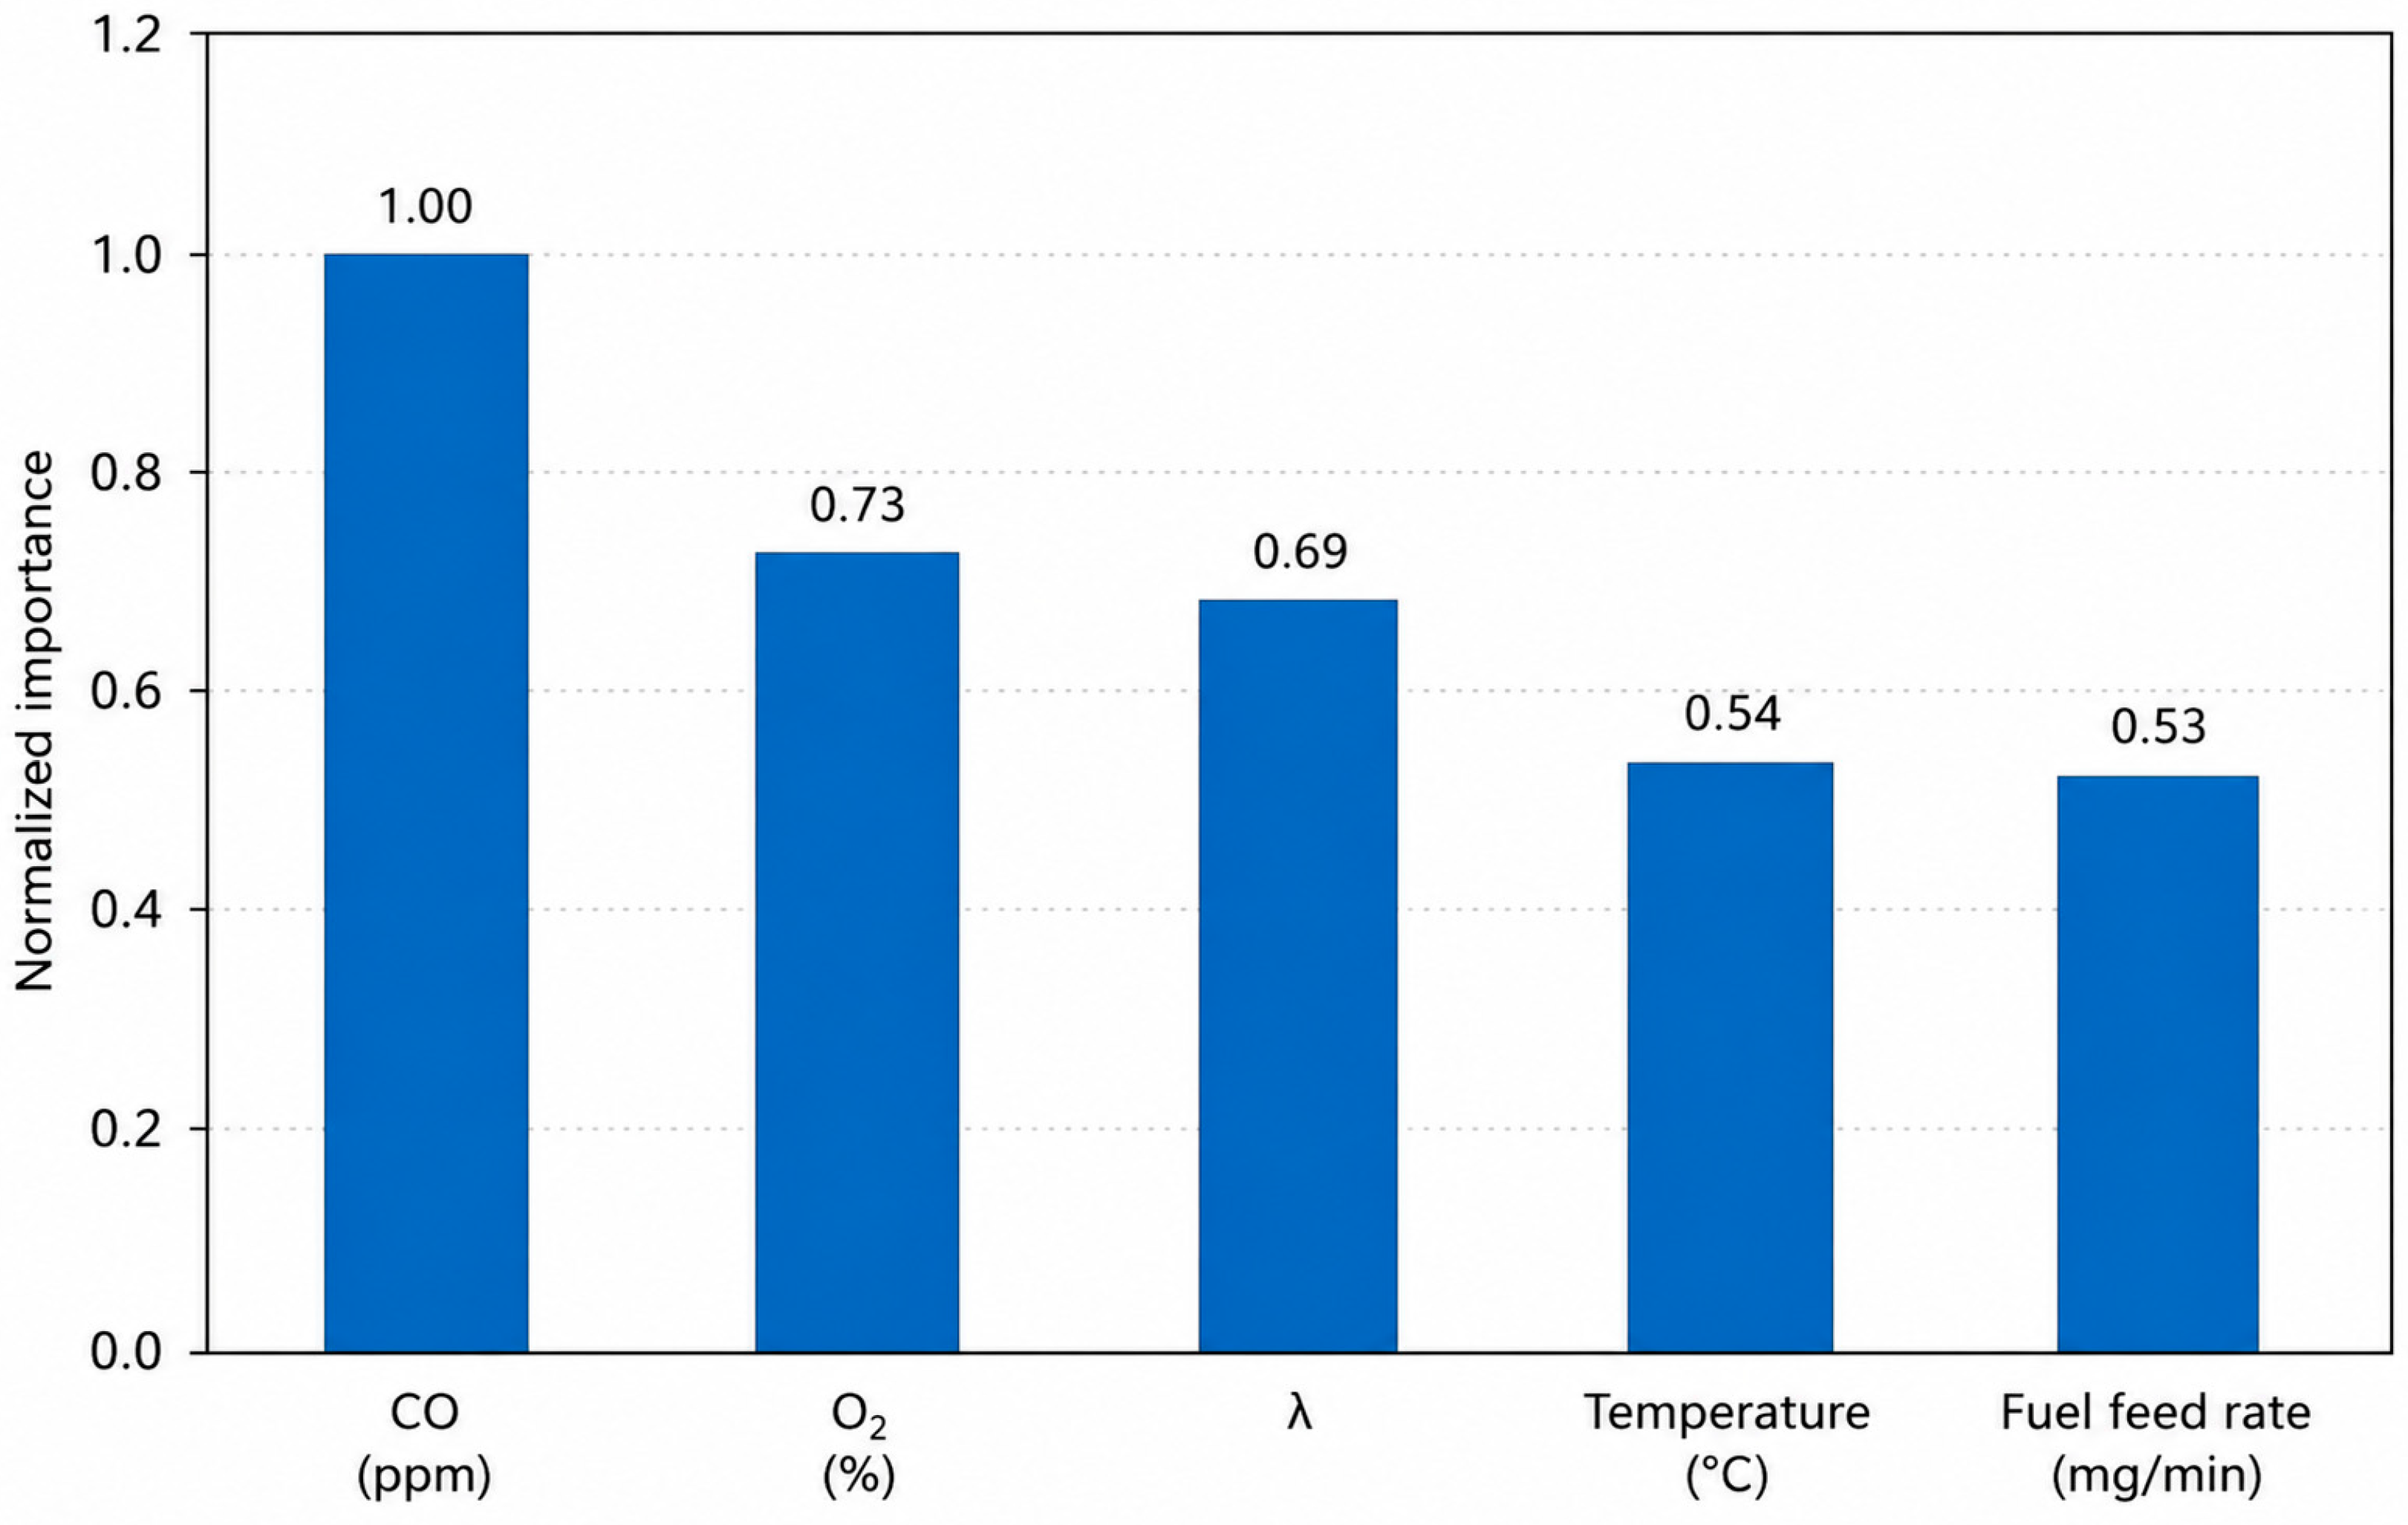
Decision tree regression models were initially developed to identify the most influential process variables governing TVOC emissions and to provide an interpretable description of the relationships present in the dataset. Several tree configurations of different complexity were evaluated using cross-validation. The selected model achieved a satisfactory compromise between prediction error and model simplicity while preserving interpretability of the decision structure. The variable importance analysis (Figure 5) indicated that oxygen concentration was the dominant predictor of TVOC emissions, followed by oxygen content expressed as the volume fraction, excess air coefficient, fuel feeding rate, and furnace temperature. These results are consistent with the combustion mechanisms discussed in Section 3.1, where oxygen availability and combustion intensity were shown to strongly influence VOC formation and oxidation processes.
Figure 5.
Relative importance of process variables in the decision tree model for TVOC prediction (source: own elaboration).
To investigate whether nonlinear relationships between combustion parameters and TVOC emissions could be captured more effectively, multilayer perceptron neural networks were subsequently evaluated. For each tested architecture, Statistica automatically generated multiple networks with different initial weight configurations, and the best-performing network was retained for comparison. The evaluated architectures comprised networks with five input neurons, one hidden layer containing 3–9 neurons, and one output neuron (Table 7). The final model, based on the MLP 5–7–1 architecture, achieved coefficients of determination of 0.92, 0.96, and 0.96 for the training, testing, and validation subsets, respectively. These results indicate that the measured combustion parameters contain substantial predictive information regarding TVOC variability. Nevertheless, owing to the relatively limited size of the experimental dataset and the absence of independent external validation, the developed neural networks should be regarded as exploratory proof-of-concept models rather than fully generalizable predictive tools.
Table 7.
Performance of the best multilayer perceptron neural network obtained for each tested architecture. Networks were trained in Statistica using the BFGS optimization algorithm and the Sum of Squares error function. The final model (MLP 5–7–1) was selected based on the best compromise between predictive accuracy, validation performance, and model complexity (source: own elaboration).
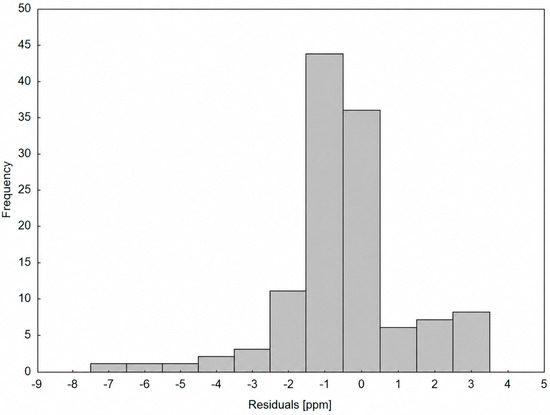
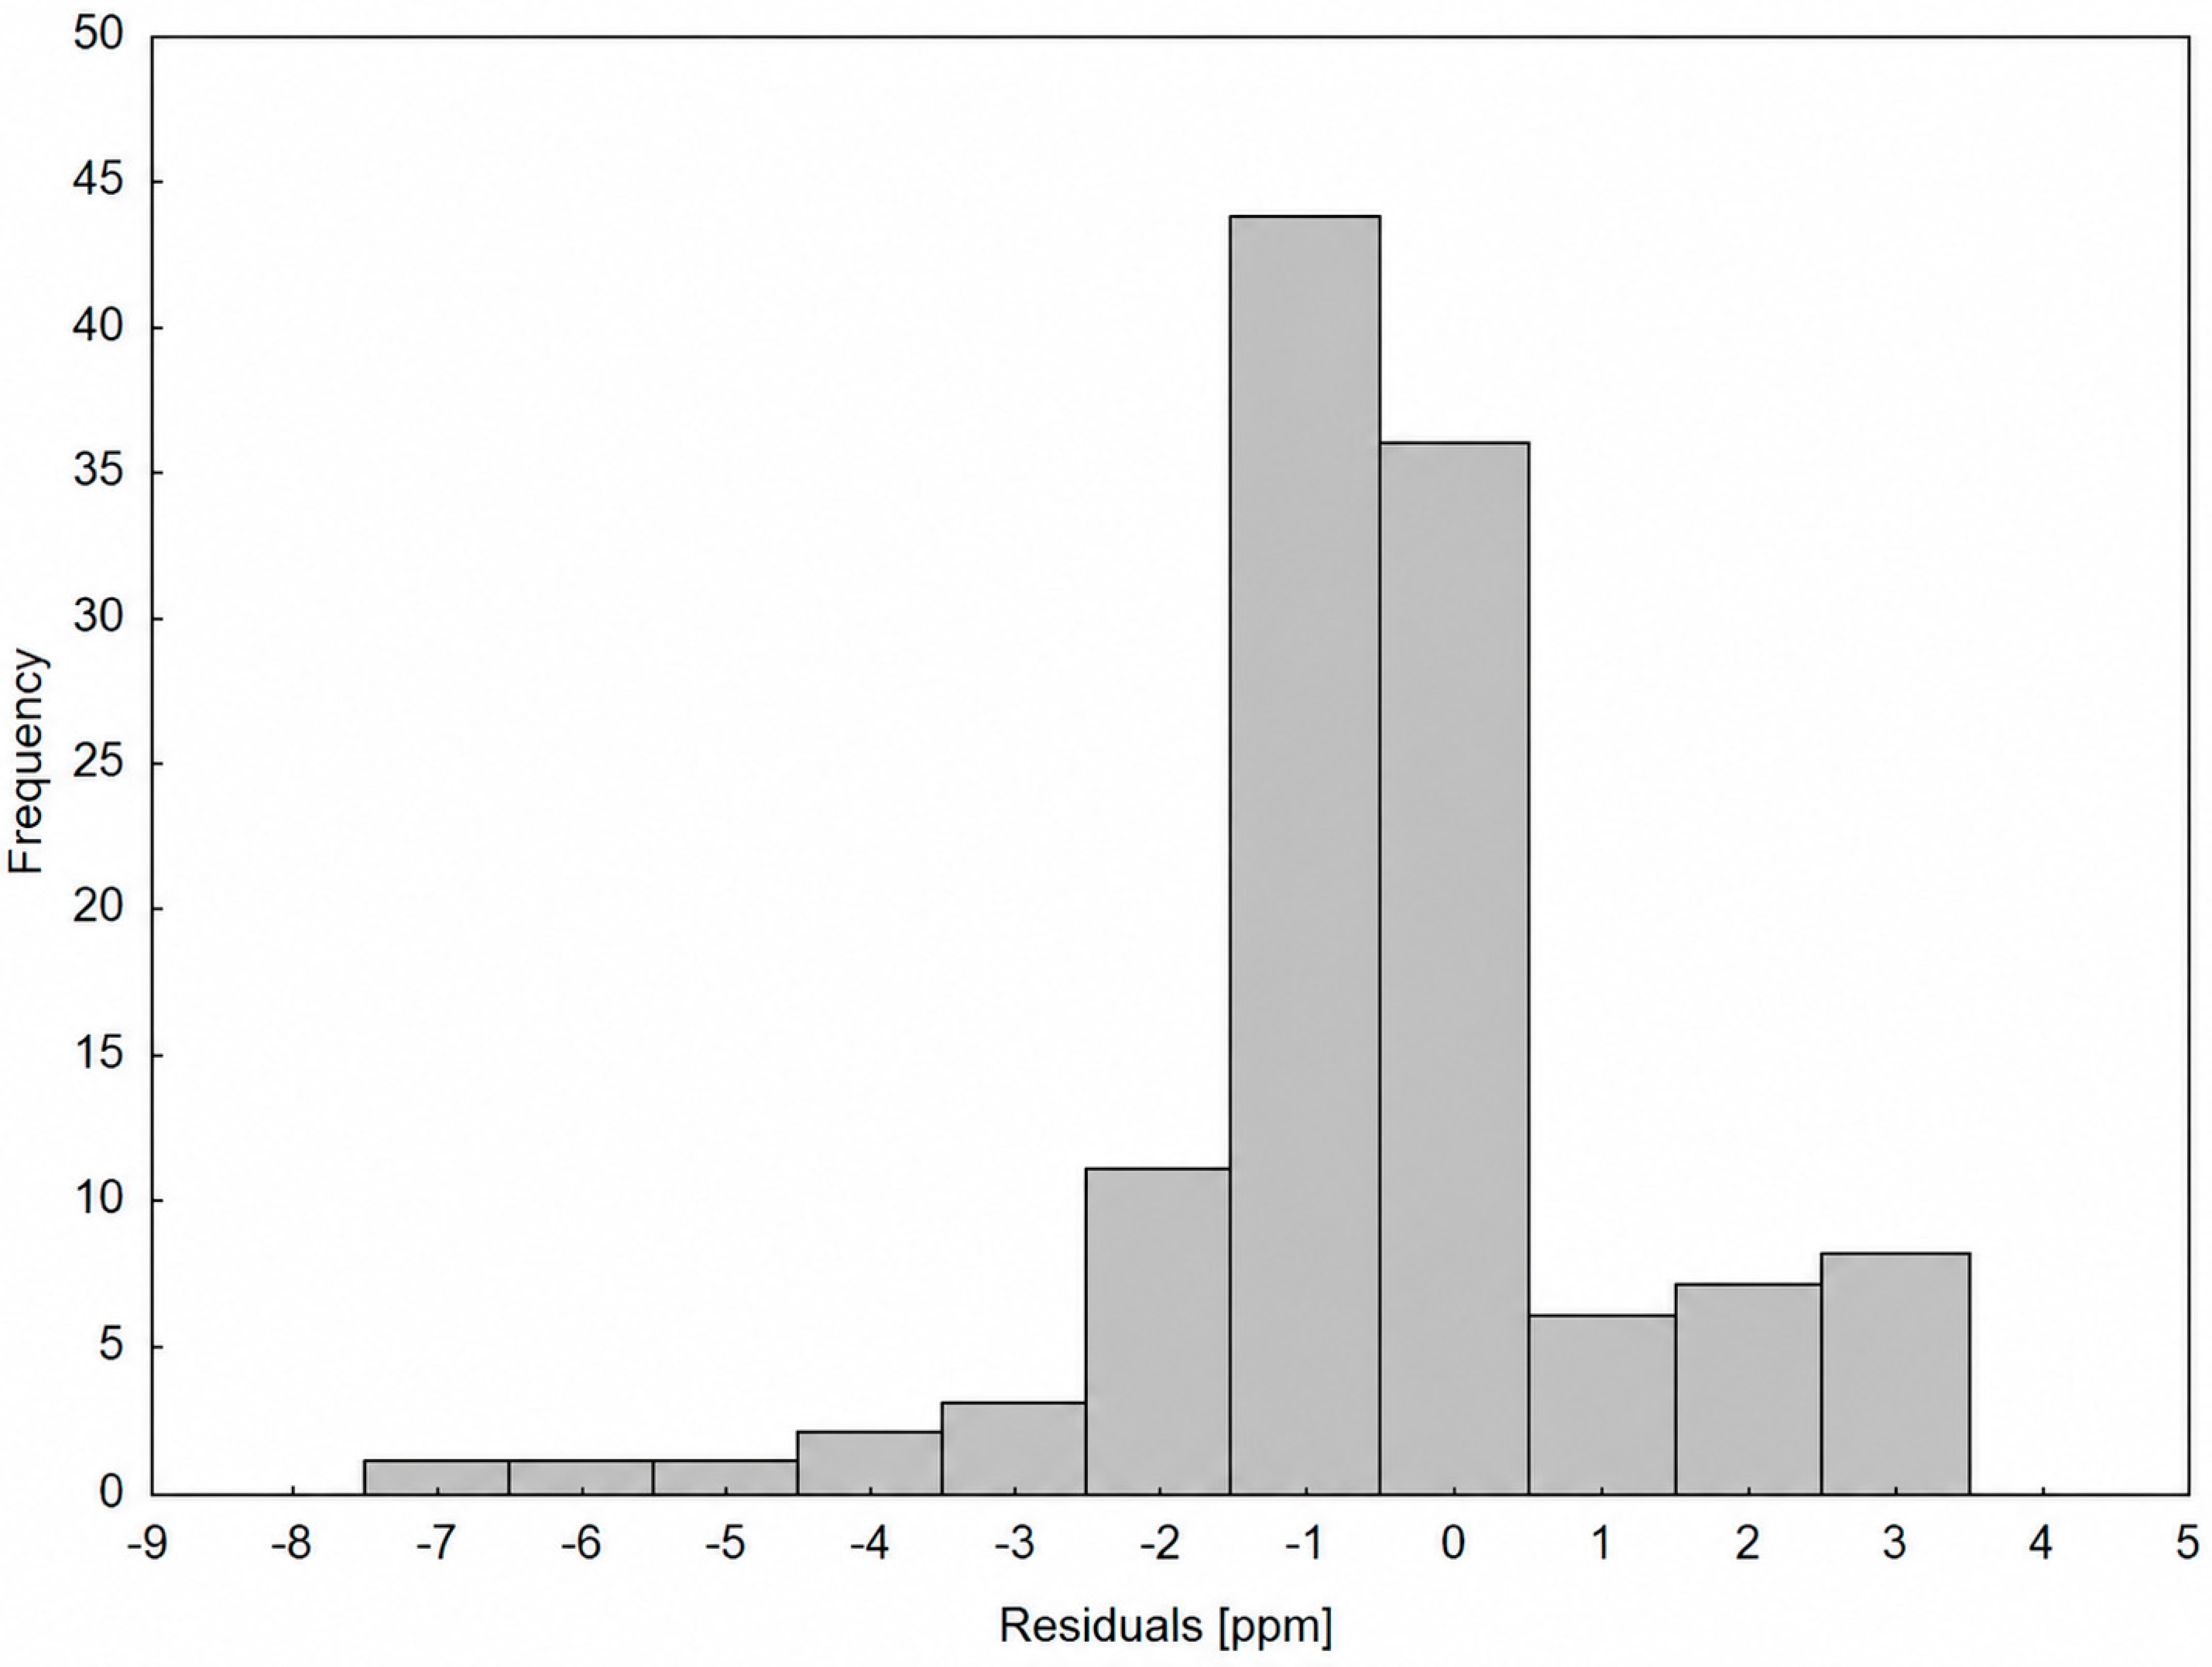
The residual distribution of the best-performing neural network model is shown in Figure 6. The majority of residuals were concentrated around zero, indicating satisfactory agreement between predicted and measured TVOC values for most observations.
Figure 6.
Residual distribution histogram for the best-performing multilayer perceptron neural network model used for the prediction of total volatile organic compound (TVOC) concentration (source: own elaboration).
Although several larger deviations were observed, no pronounced systematic bias was detected. The residual structure therefore suggests that the model captured the dominant nonlinear relationships present in the dataset while retaining acceptable predictive stability. The presence of such nonlinear dependencies is consistent with recent studies demonstrating that machine-learning approaches can successfully extract source-related information and identify latent patterns in complex VOC datasets that are not directly observable from concentration measurements alone.
The developed models demonstrated the feasibility of predicting variations in the total VOC signal from combustion-process parameters. Nevertheless, the obtained predictions remain limited to bulk TVOC concentrations and do not provide information regarding the underlying chemical composition of the emitted compounds.
This limitation motivated the subsequent descriptor-space analysis presented in Section 3.4, where VOCs were organized according to their physicochemical characteristics in order to establish a framework for interpreting changes in the total VOC signal in terms of representative groups of combustion-related compounds.
3.3. Limitations of Total Volatile Organic Compound Interpretation
The results presented in Section 3.1 and Section 3.2 demonstrate that continuous monitoring of total VOCs provides valuable process-related information regarding the dynamic behavior of combustion systems and enables the development of predictive models relating process parameters to emission intensity. The observed relationships between temperature, oxygen availability, excess air coefficient, and TVOC concentration indicate that the integrated VOC signal can serve as a useful process indicator reflecting the progression of devolatilization, pyrolysis, and oxidation phenomena.
Despite these advantages, the interpretation of TVOC measurements remains inherently limited because the detector response represents the cumulative concentration of a complex mixture of organic compounds rather than individual chemical species. Consequently, similar TVOC values may correspond to substantially different chemical compositions and emission profiles. This limitation is particularly important in biomass combustion systems, where emitted VOCs comprise a broad spectrum of compounds including light hydrocarbons, oxygenated species, aromatic compounds, furans, phenolic compounds, and lignin-derived products, each characterized by distinct physicochemical properties and environmental relevance.
The inability to directly distinguish between chemically different VOC classes restricts mechanistic interpretation of the measured signal and limits the transferability of predictive models based solely on total VOC concentration. From an analytical perspective, two combustion conditions producing comparable TVOC levels may in fact generate markedly different distributions of emitted compounds. As a result, changes in the measured TVOC signal cannot be unequivocally linked to specific groups of VOCs without additional information regarding the physicochemical characteristics of the emitted species.
An additional limitation arises from the gas-conditioning stage applied prior to online VOC detection. Because the sampled gas stream passed through alkaline KOH impingers, the recorded TVOC signal represents a conditioned detector response and may underrepresent part of the polar oxygenated VOC fraction. Nevertheless, since the same conditioning procedure was applied consistently throughout all experiments, the resulting dataset remains suitable for comparative analysis of combustion-stage-dependent changes and AI-assisted interpretation of reproducible TVOC signal dynamics. The proposed framework should therefore be interpreted as a supporting analysis of conditioned TVOC responses rather than complete quantitative VOC emissions or compound-specific chemical speciation.
Comprehensive chemical speciation using chromatographic techniques represents the most direct solution to this problem; however, such approaches are often time-consuming, expensive, and difficult to integrate with continuous online monitoring systems. Consequently, although the analyses presented in Section 3.1 and Section 3.2 demonstrate that dynamic TVOC signals contain process-related information that can be successfully captured using data-driven models, an additional interpretation layer is still required to relate these aggregate detector responses to chemically meaningful characteristics of the emitted VOC mixture. Therefore, an intermediate interpretation framework capable of linking total VOC measurements with representative groups of compounds would provide valuable additional insight while preserving the simplicity of online monitoring.
To address this challenge, the descriptor-space analysis presented in the following section constitutes the second component of the proposed pseudo-speciation framework. Rather than attempting direct identification of individual compounds, VOCs reported in biomass-combustion emissions were organized according to their physicochemical descriptors using principal component analysis and hierarchical clustering. Combined with the process-related information extracted from dynamic TVOC signals, this descriptor-based organization provides an additional interpretation layer linking aggregate detector responses with representative physicochemical classes of combustion-related VOCs. The proposed framework therefore establishes a conceptual bridge between bulk TVOC measurements and chemically meaningful emission categories without claiming direct chemical speciation.
3.4. Descriptor-Space Organization and Clustering of Combustion-Related Volatiles
The descriptor-space analysis presented in this section constitutes the second component of the proposed pseudo-speciation framework. While the previous analyses demonstrated that dynamic TVOC signals contain process-related information, the descriptor-space approach provides an additional physicochemical interpretation layer by organizing combustion-related VOCs into representative groups based on descriptor similarity. Principal component analysis and hierarchical clustering were therefore applied to investigate the structure of the descriptor space and identify major classes of combustion-related VOCs.
By organizing compounds according to descriptor similarity, it becomes possible to establish representative classes that may support the interpretation of changes observed in the measured TVOC signal. Accordingly, principal component analysis and hierarchical clustering were used to investigate the structure of the descriptor space and identify major groups of combustion-related VOCs. Based on the cluster-quality assessment presented in Table 5, a four-cluster solution was selected for further analysis. Although solutions containing a larger number of clusters achieved slightly better statistical separation, examination of cluster composition indicated that additional clusters primarily subdivided the major physicochemical groups rather than revealing fundamentally new VOC categories. The four-cluster solution therefore provided the most interpretable pseudo-speciation framework.
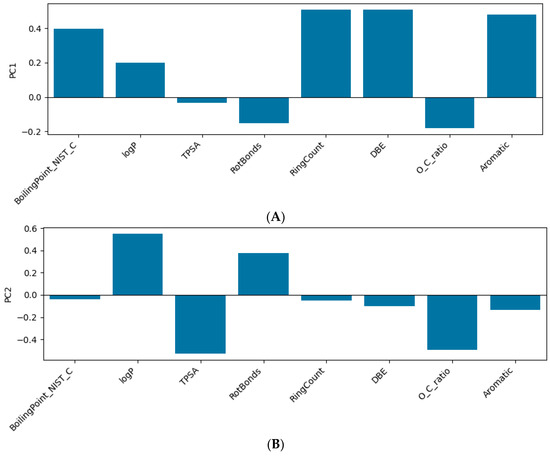
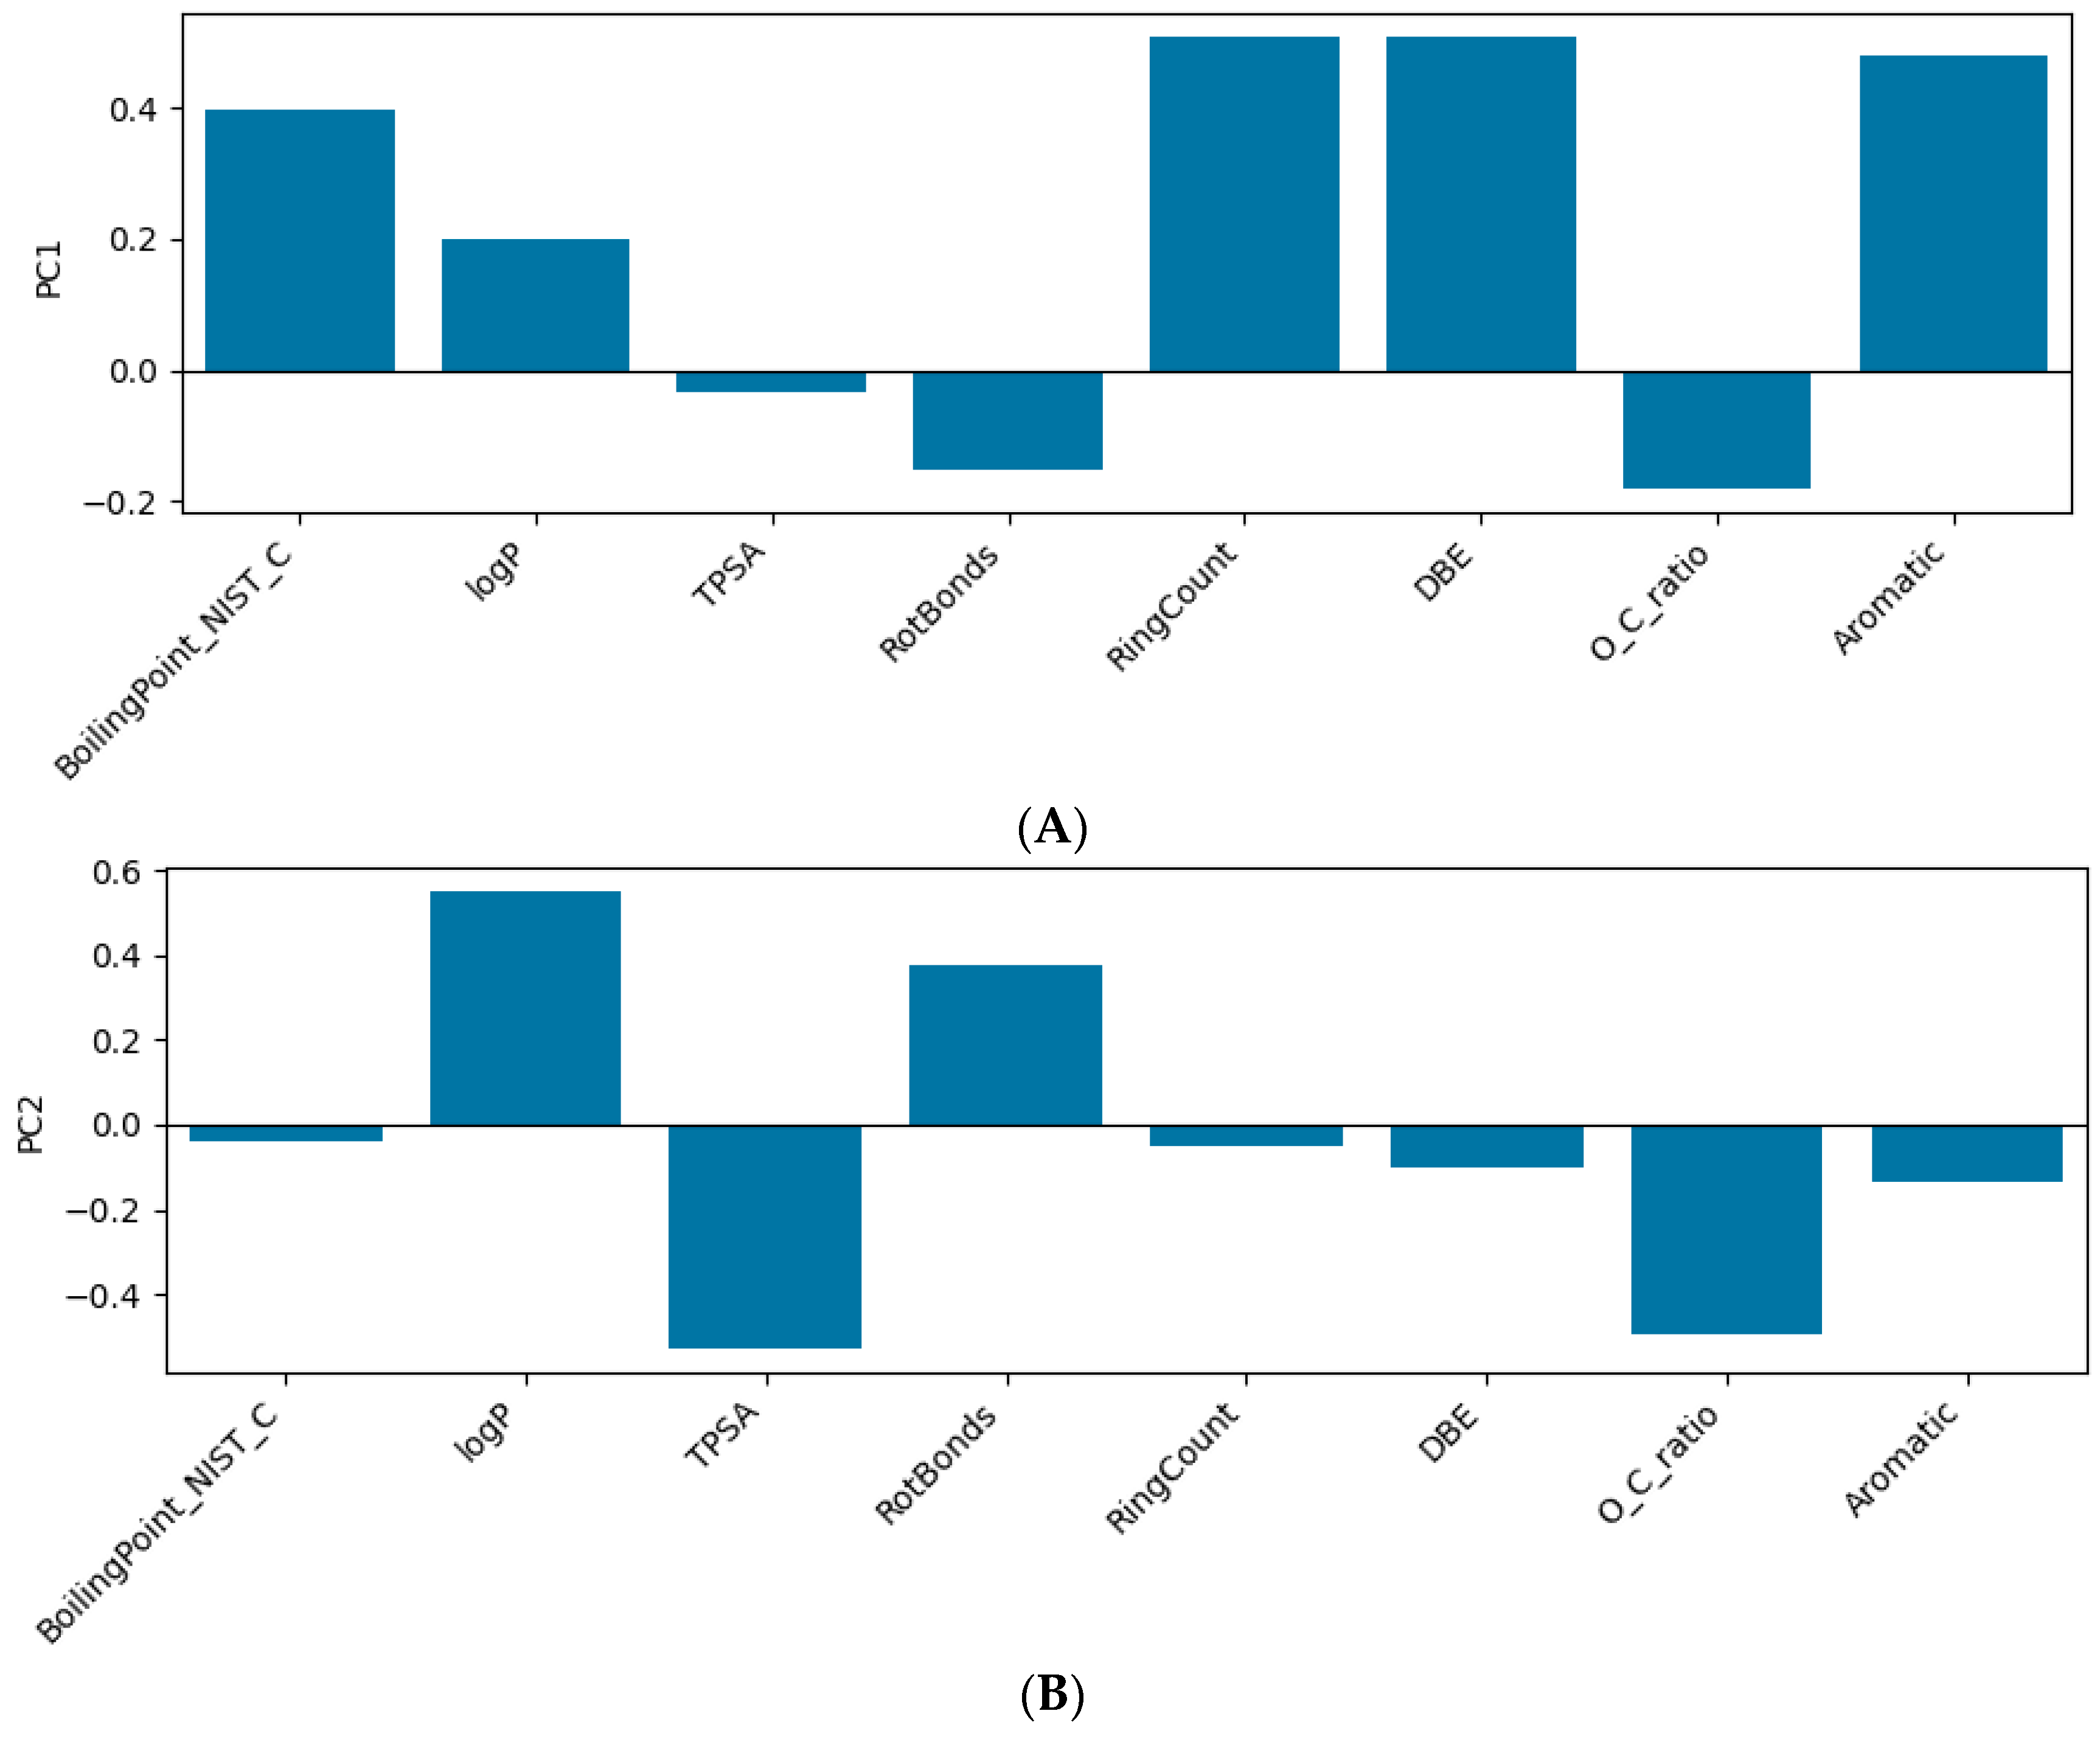
The PCA loading analysis (Figure 7) demonstrated that PC1 was dominated primarily by descriptors associated with molecular complexity and aromatic character, including the ring count, DBE, aromaticity, and boiling point. In contrast, PC2 was strongly influenced by polarity-related descriptors such as the TPSA and O/C ratio, together with hydrophobicity represented by logP. Consequently, the PCA space reflected two dominant physicochemical gradients: (i) increasing structural complexity and aromatic condensation along PC1 and (ii) increasing oxygenation and polarity along PC2.
Figure 7.
PCA loading profiles for the first two principal components describing the physicochemical descriptor space of combustion-related VOCs: (A) PC1 loadings and (B) PC2 loadings (source: own elaboration).
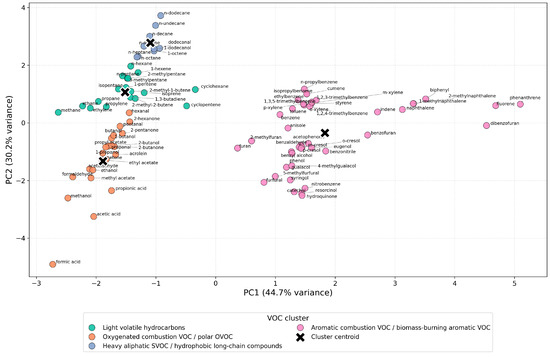
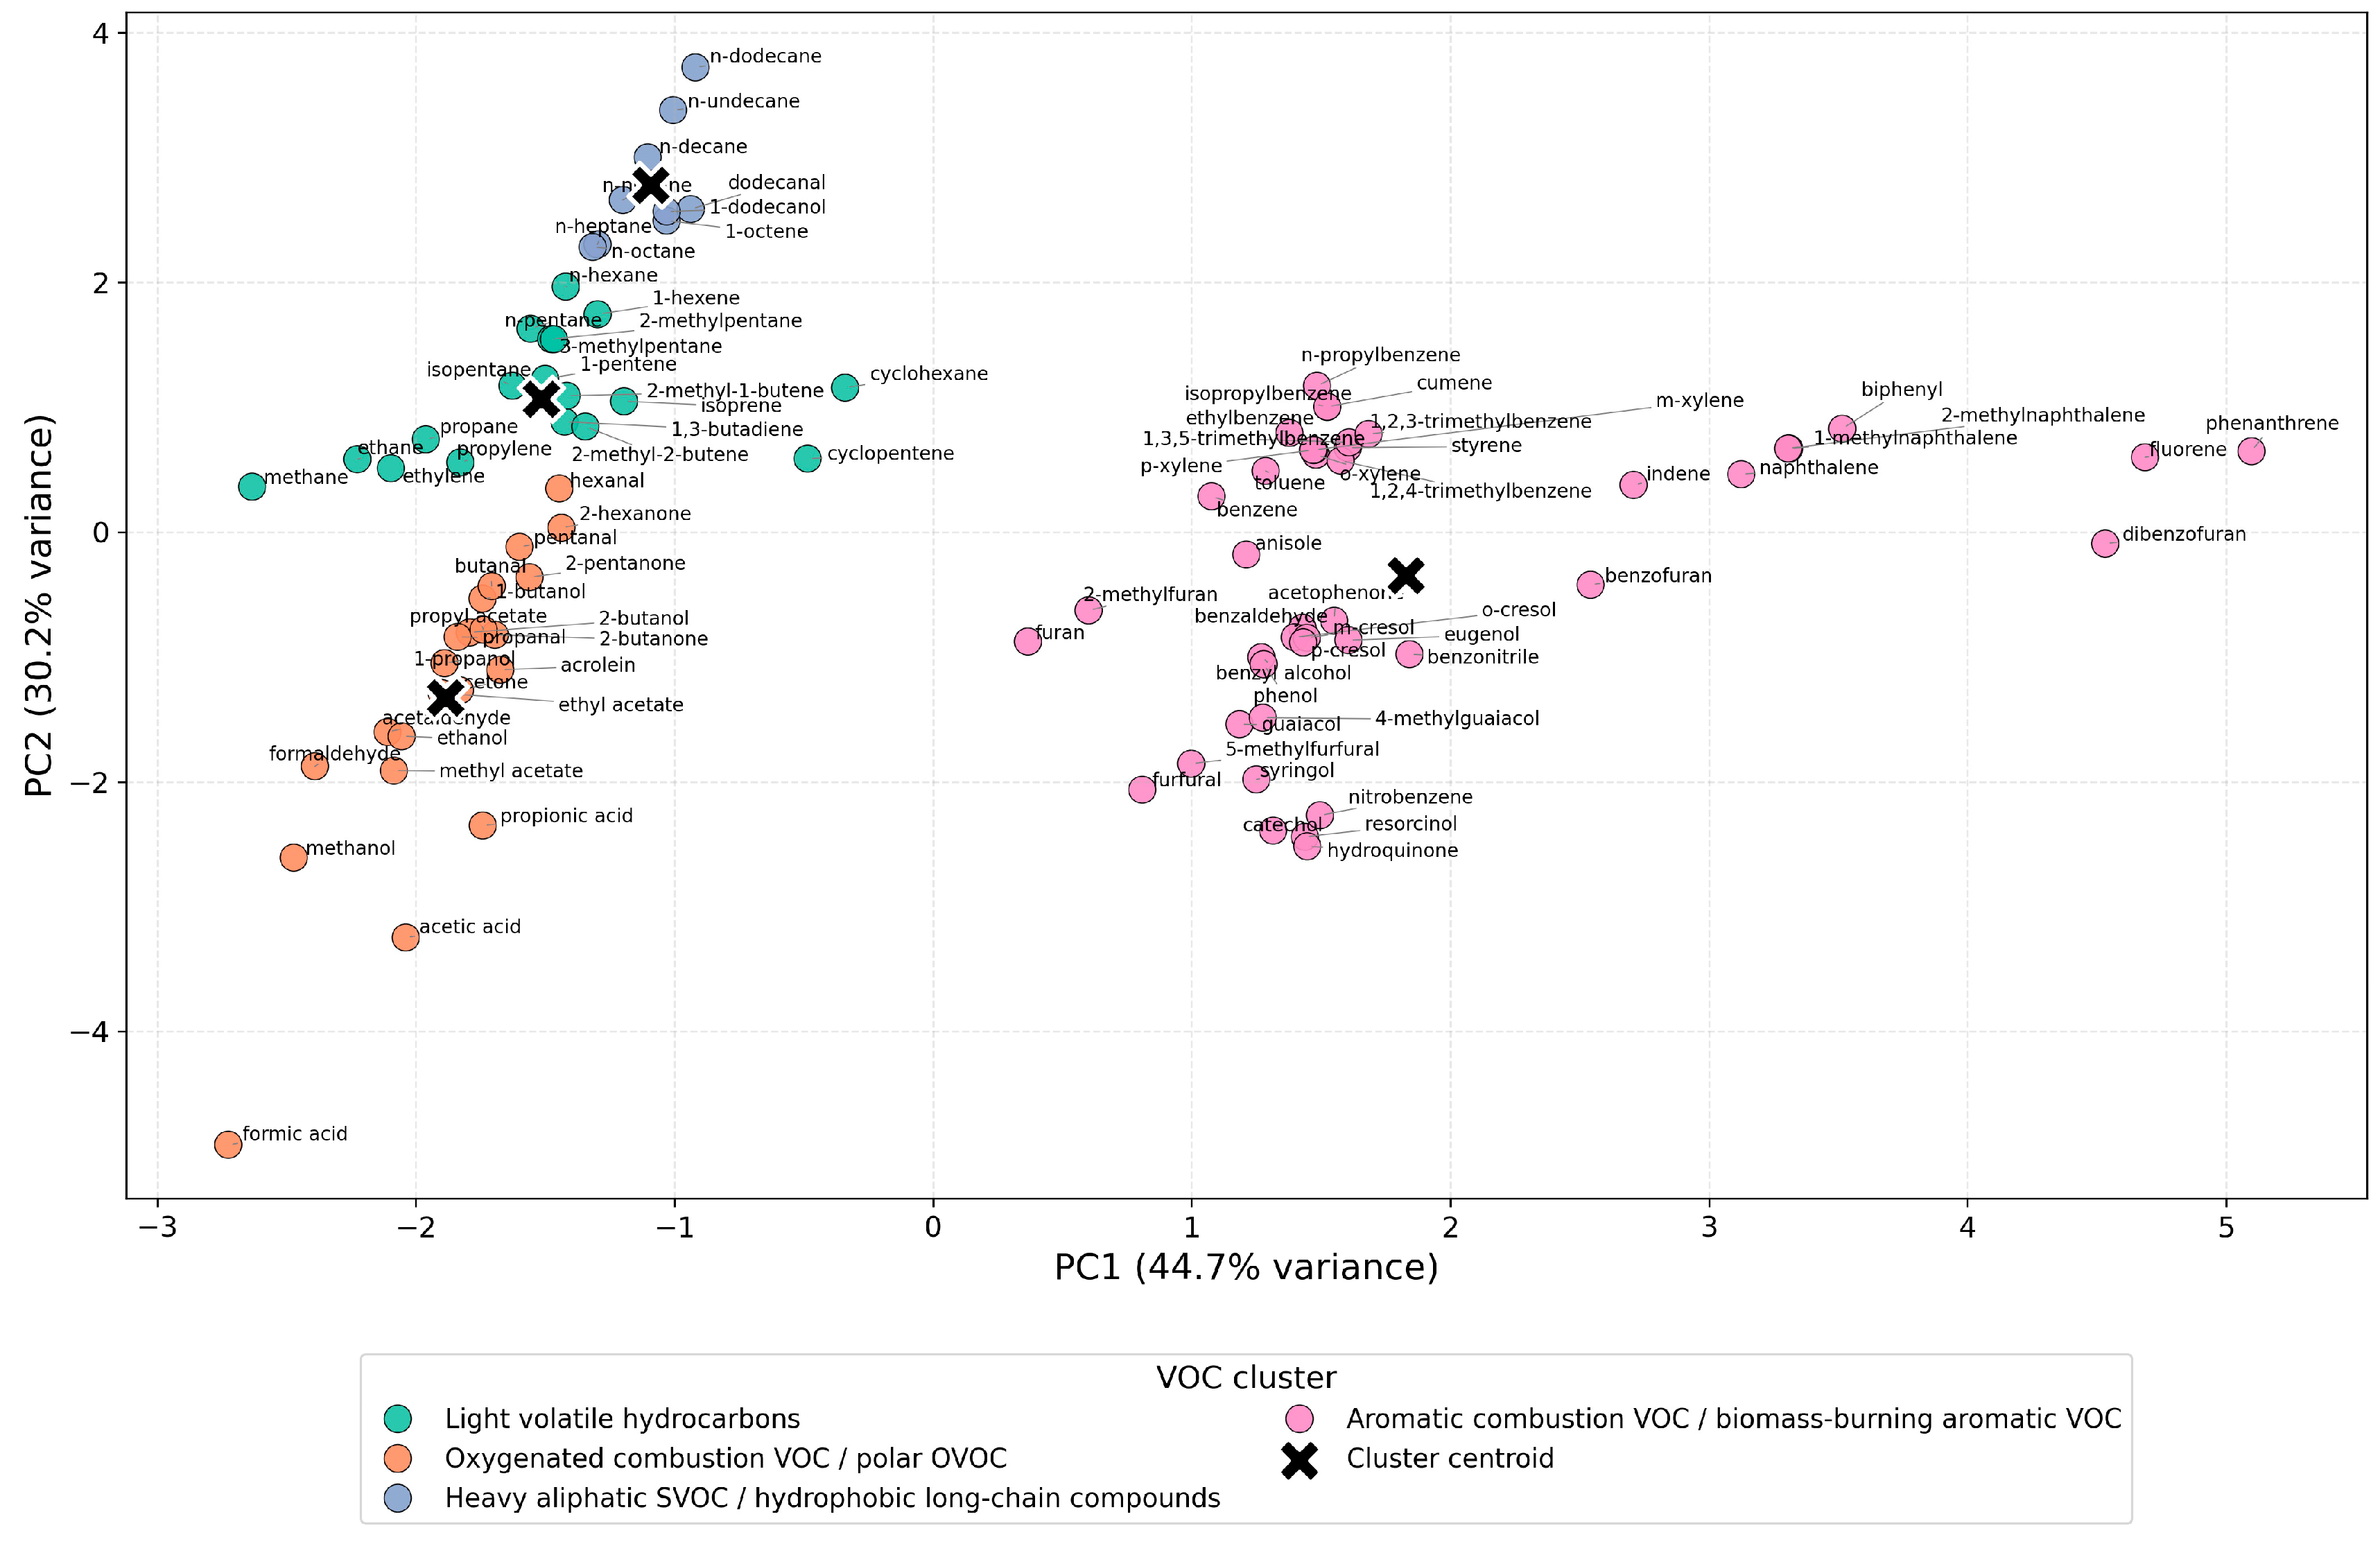
The first two principal components explained 74.9% of the total variance, with PC1 and PC2 accounting for 44.7% and 30.2%, respectively (Figure 8). This indicates that the majority of descriptor variability could be represented within a two-dimensional projection while preserving the dominant physicochemical relationships between compounds.
Figure 8.
PCA-based descriptor-space organization of combustion-related VOC clusters (source: own elaboration).
The PCA projection (Figure 8) demonstrated a clear separation between major groups of combustion-related VOCs. Four descriptor-based clusters were identified using hierarchical clustering performed on the full standardized descriptor matrix, while PCA was used for dimensionality reduction and visualization purposes. The identified four clusters corresponded to: (i) light volatile hydrocarbons, including low-molecular-weight alkanes and alkenes; (ii) oxygenated combustion VOCs and polar OVOCs, such as alcohols, aldehydes, ketones, carboxylic acids, and esters; (iii) heavy aliphatic SVOCs and hydrophobic long-chain hydrocarbons; and (iv) aromatic combustion VOCs, including alkylated aromatics, furans, methoxyphenols, and lignin-derived species.
Cluster 1 corresponded primarily to aromatic combustion VOCs, including benzene derivatives, alkylated aromatics, phenolic compounds, furans, methoxyphenols, polycyclic aromatic hydrocarbons (PAHs), and lignin-derived species such as guaiacol and syringol. This cluster occupied the positive PC1 region and was characterized by elevated aromaticity, an increased double bond equivalent, and higher ring-count descriptors. The presence of methoxyphenols, dibenzofuran, benzofuran, and methylfurans within the same descriptor region suggests substantial structural similarity between lignin-derived combustion products and condensed aromatic VOCs generated during incomplete combustion and pyrolysis processes.
Cluster 2 represented heavy aliphatic semi-volatile organic compounds (SVOCs) and hydrophobic long-chain hydrocarbons. The cluster contained long-chain n-alkanes and related compounds characterized by high boiling points and elevated logP values. These compounds occupied the upper-left region of the PCA space and were strongly associated with volatility-related descriptors and hydrophobicity. The descriptor profile indicates reduced polarity, low oxygen content, and increased molecular flexibility associated with larger hydrocarbon structures.
Cluster 3 included light volatile hydrocarbons such as low-molecular-weight alkanes and alkenes. These compounds were characterized by low boiling points, low molecular complexity, and limited structural functionality. The cluster occupied the negative PC1 region and represented highly volatile compounds typically associated with gaseous combustion emissions and early-stage devolatilization products during solid-fuel thermal degradation.
Cluster 4 consisted predominantly of oxygenated combustion VOCs and polar OVOCs, including alcohols, aldehydes, ketones, carboxylic acids, and esters. This cluster exhibited elevated oxygen-to-carbon ratios (O/C) and a high topological polar surface area, reflecting increased molecular polarity and oxygen functionality. Compounds such as formic acid, acetic acid, methanol, acetaldehyde, and acetate esters formed a distinct descriptor region separated from hydrocarbon and aromatic groups. The separation of this cluster along PC2 was strongly associated with polarity-related descriptors and oxygenation level.
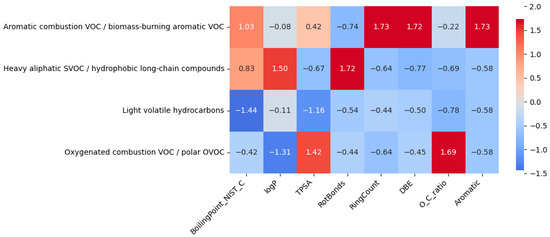
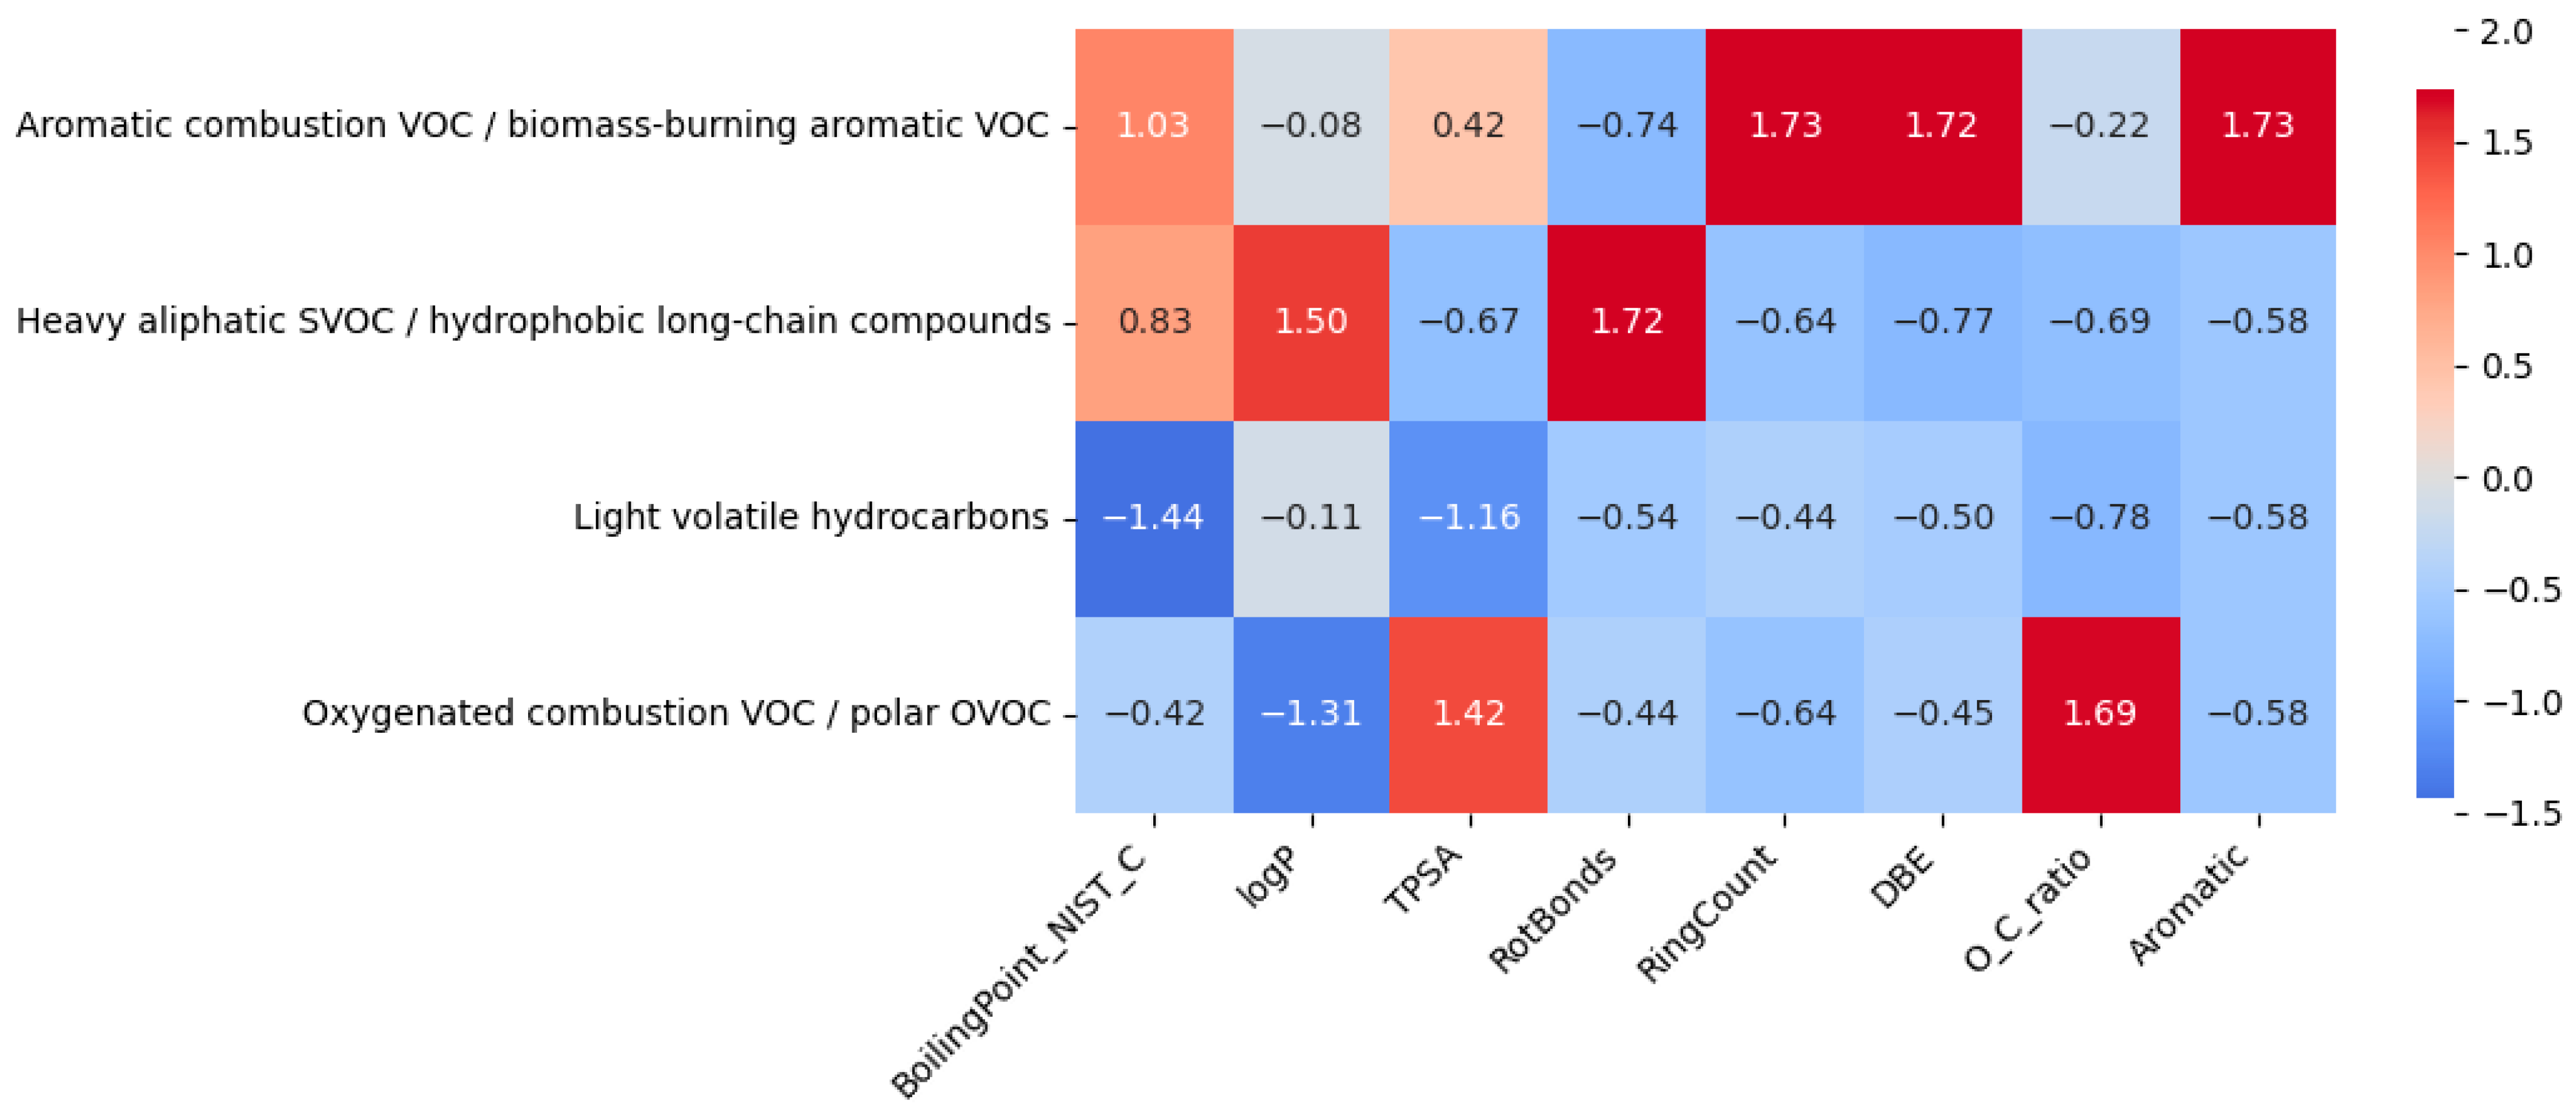
The descriptor heatmap presented in Figure 9 additionally confirmed the physicochemical consistency of the identified VOC groups and supported the PCA-based interpretation of descriptor-space organization. Distinct descriptor patterns were observed for each cluster, indicating that the clustering procedure successfully separated compounds according to dominant structural and volatility-related characteristics.
Figure 9.
Standardized physicochemical descriptor profiles of the identified combustion-related VOC clusters (source: own elaboration).
The aromatic combustion VOC cluster exhibited simultaneously elevated aromaticity, DBE, and ring-count values, confirming the structurally condensed nature of aromatic hydrocarbons, PAHs, and lignin-derived combustion products. In contrast, the heavy aliphatic SVOC cluster was distinguished primarily by high boiling points, elevated logP values, and an increased number of rotatable bonds, reflecting the hydrophobic and flexible character of long-chain hydrocarbons.
The light volatile hydrocarbon cluster showed the lowest boiling points and reduced descriptor complexity, consistent with small gaseous hydrocarbons and highly volatile combustion products. Meanwhile, the oxygenated combustion VOC cluster demonstrated the highest TPSA and O/C ratio values, reflecting the strong contribution of oxygen-containing functional groups and increased molecular polarity.
The clustering results demonstrated that combustion-related VOCs form descriptor-consistent groups corresponding to distinct physicochemical behaviors relevant to adsorption, desorption, transport, and volatility characteristics. Importantly, lignin-derived markers such as guaiacol, cresols, syringol, and furans were grouped together with aromatic combustion products rather than with simple oxygenated VOCs, suggesting that aromaticity and molecular structure exerted stronger influence on descriptor-space organization than oxygen content alone.
The descriptor-based organization additionally enabled computational selection of representative compounds for future experimental studies focused on adsorption–desorption behavior and pseudo-speciation strategies. Within the proposed framework, these descriptor-based groups constitute an interpretation layer that complements the process-related information extracted from dynamic TVOC signals, allowing aggregate detector responses to be discussed in terms of representative physicochemical classes rather than individual compounds. The identified clusters provide a rational basis for selecting descriptor-diverse VOC mixtures capable of representing broad regions of combustion-related chemical space while limiting the number of experimentally tested compounds.
3.5. Descriptor-Guided Selection of Representative Volatile Mixtures
To demonstrate the practical applicability of the descriptor-space organization framework, an exploratory computational workflow was developed for the selection of representative multi-component VOC mixtures intended for future adsorption/desorption experiments and pseudo-speciation studies. The clustering results were subsequently used to define representative compound groups and to support the computational selection of descriptor-diverse reference mixtures for future experimental studies involving VOC adsorption and desorption behavior.
The workflow was based on systematic evaluation of three-component mixtures constructed from compounds belonging to different descriptor-based VOC domains. The selection procedure aimed to maximize physicochemical diversity within the multidimensional descriptor space rather than to identify chemically optimal mixtures in a thermodynamic or kinetic sense. The evaluated criteria included descriptor-space separation, boiling point distribution, polarity-related descriptors, aromaticity, oxygenation level, and cluster coverage.
Initial descriptor-space screening indicated that mathematically optimal combinations frequently consisted of compounds originating from highly distant regions of the PCA space. However, several of these combinations were considered of limited practical relevance for solid-fuel combustion experiments due to unrealistic co-occurrence patterns or limited environmental representativeness. Consequently, the final selection strategy was refined to balance descriptor-space diversity with combustion relevance and experimental feasibility. Selected descriptor-diverse mixtures identified using the computational screening workflow are presented in Table 8.
Table 8.
Representative descriptor-diverse VOC mixtures identified using the computational workflow (source: own elaboration).
The presented examples illustrate how descriptor-space organization may support the rational selection of simplified representative VOC systems for future adsorption/desorption experiments. The proposed workflow should therefore be interpreted as a computational pre-screening strategy supporting experimental design rather than as a predictive chemical speciation model.
The identified mixtures represent substantially different physicochemical regions of the descriptor space while simultaneously reflecting chemically meaningful classes of combustion-related VOCs, including volatile aliphatics, aromatic hydrocarbons, oxygenated combustion products, and lignin-derived aromatic species. Consequently, the proposed framework may provide a useful basis for future studies involving adsorption behavior, thermal desorption characteristics, and simplified pseudo-speciation approaches for combustion-related VOC emissions.
4. Implications for AI-Assisted Interpretation of Total Volatile Organic Compound Emissions
The results obtained in this study demonstrate that online TVOC measurements can provide valuable information regarding the progression of combustion processes and their associated emission dynamics. The observed relationships between temperature, oxygen concentration, excess air coefficient, fuel feeding conditions, and TVOC response indicate that the integrated VOC signal contains meaningful process information that can be exploited using data-driven analytical approaches. These observations suggest that TVOC should not be regarded solely as an emission metric but also as a process-related indicator reflecting the progression of thermochemical transformations occurring during solid-fuel conversion. From this perspective, an improved interpretation of TVOC dynamics may contribute not only to emission assessment but also to a more comprehensive evaluation of the environmental performance of solid-fuel-based energy systems. Similar conclusions have been highlighted in recent studies emphasizing the broader environmental significance of VOC emissions in solid-fuel combustion and conversion technologies [24].
The preliminary machine-learning models developed in this work confirmed that a substantial fraction of TVOC variability could be explained using routinely measured combustion parameters. Although the predictive analysis was intentionally limited to exploratory regression models, the obtained results suggest that online VOC monitoring may support the development of intelligent data interpretation frameworks for combustion-process diagnostics. Recent reviews indicate that machine-learning methods are increasingly applied to solid-fuel combustion systems for the process modeling, optimization, and interpretation of complex thermochemical phenomena. In this context, the present results demonstrate that similar data-driven approaches may also provide useful insights into the behavior of integrated VOC signals generated during combustion processes [25]. Future studies based on larger datasets should investigate validation strategies preserving the temporal structure of combustion experiments, including chronological data partitioning or dedicated time-series learning approaches.
At the same time, the study highlights an important limitation of approaches based exclusively on total VOC concentration. The measured TVOC signal represents the cumulative response of numerous chemically distinct compounds exhibiting different physicochemical properties, formation pathways, atmospheric behavior, and environmental relevance. Consequently, interpretation of TVOC measurements solely in terms of concentration changes may overlook important information regarding the underlying chemical composition of the emitted mixture.
The descriptor-space framework proposed in this work complements the process-related information extracted from dynamic TVOC signals by providing a physicochemically meaningful interpretation layer between bulk TVOC measurements and detailed chemical speciation. Rather than attempting direct identification of individual compounds, the approach organizes combustion-related VOCs into representative descriptor-based groups that facilitate the interpretation of aggregate detector responses in terms of dominant physicochemical classes. Consequently, the proposed framework combines process-state information obtained from continuous TVOC monitoring with descriptor-space organization of VOCs, thereby extending interpretation beyond concentration changes alone. The concept is consistent with recent developments in VOC fingerprint analysis, where machine-learning methods are increasingly used to extract meaningful information from complex VOC patterns without relying exclusively on compound-by-compound interpretation. Similar strategies have been successfully applied to VOC-based classification and traceability problems using combined clustering and machine-learning workflows [26]. Rather than attempting direct identification of individual compounds, the approach organizes combustion-related VOCs into physicochemically meaningful groups, enabling the interpretation of changes in the integrated VOC signal within a broader chemical context. Such descriptor-based organization may facilitate future integration of experimental measurements, process knowledge, and machine-learning techniques for improved understanding of combustion-related VOC emissions.
It should be emphasized that the predictive models developed in the present study were constructed using a conventional random division of observations into training, testing, and validation subsets. While this approach is appropriate for an initial proof-of-concept assessment, combustion processes inherently exhibit temporal evolution and strong dynamic dependencies. Successive observations are not fully independent but reflect transitions between devolatilization, pyrolysis, oxidation, and burnout stages. Therefore, future studies should investigate modeling strategies that explicitly account for temporal structure, including chronological validation schemes and time-series machine-learning architectures capable of capturing process dynamics.
Future developments may benefit from a closer integration of dynamic TVOC analysis with descriptor-based organization of combustion-related VOCs. Such a workflow could support the interpretation of online detector responses not only in terms of signal intensity but also in relation to representative physicochemical classes of emitted compounds, while preserving the operational simplicity of total VOC monitoring systems. The present work should therefore be regarded as an initial proof-of-concept demonstrating how process-related information extracted from continuous TVOC signals can be complemented by descriptor-space analysis to establish an interpretable pseudo-speciation framework, rather than as a complete chemical characterization methodology.
5. Conclusions
The present study investigated the potential of data-driven methods to support the interpretation of total volatile organic compound signals measured during controlled solid-fuel combustion. Continuous online monitoring revealed distinct temperature-dependent emission patterns associated with devolatilization, pyrolysis, oxidation, and burnout stages, confirming that integrated TVOC signals contain meaningful information on combustion-process dynamics. Preliminary machine-learning analyses further showed that a substantial fraction of TVOC variability could be explained using routinely measured combustion parameters. Both decision tree and neural network models captured relationships between combustion conditions and emission intensity, indicating that aggregate TVOC measurements can serve as informative process indicators.
The main methodological contribution of this work is the proposed descriptor-space-based pseudo-speciation framework. Principal component analysis and hierarchical clustering enabled the organization of combustion-related VOCs into representative physicochemical groups, including light hydrocarbons, oxygenated VOCs, heavy aliphatic compounds, and aromatic combustion products. The resulting framework provides a structured method for linking chemically non-specific TVOC signals with classes of compounds characterized by similar physicochemical properties.
Importantly, the proposed approach does not replace conventional chemical speciation techniques. Instead, it offers an intermediate interpretation layer between aggregate VOC monitoring and compound-level analysis. The predictive models remain limited to bulk VOC concentrations, and the descriptor-based clusters require further validation against independent experiments and compound-specific VOC measurements. Therefore, the present work should be regarded as an exploratory step toward AI-assisted interpretation of combustion-related VOC emissions rather than a complete chemical-speciation methodology.
From a practical standpoint, the findings suggest that dynamic TVOC signals may be useful not only as aggregate compliance-oriented indicators but also as real-time diagnostic markers of combustion performance. In future air-quality monitoring and emission-control strategies, the proposed framework could support screening-level interpretation of VOC-related impacts, prioritization of emission episodes, and targeted GC-MS campaigns. Such applications may be particularly relevant for residential appliance certification, urban low-emission-zone management, and smart monitoring networks in densely populated areas with high residential heating activity.
Author Contributions
Conceptualization, J.G.; methodology, K.S.-S. and J.G.; software, K.S.-S.; validation, W.S. and J.G.; formal analysis, K.S. and W.S.; investigation, K.S.-S., K.S., W.S. and J.G.; resources, K.S.-S. and K.B.; data curation, K.S.-S., K.S., W.S. and A.K.; writing—original draft, K.S.-S. and A.K.; writing—review and editing, K.B. and J.G.; visualization, K.S.-S., K.S., W.S. and A.K.; supervision, K.S.-S., K.B. and J.G.; funding acquisition, K.B. All authors have read and agreed to the published version of the manuscript.
Funding
This work was financially supported by the National Science Centre Poland (grant no. 2024/08/X/ST8/01744). The work was partially financed by subvention for the AGH University of Krakow (grant no. 501.00 210000 10000) and from funds of the “Excellence Initiative- Research University” program for AGH.
Institutional Review Board Statement
Not applicable.
Informed Consent Statement
Not applicable.
Data Availability Statement
The complete VOC descriptor database used in this study is publicly available through Zenodo at https://doi.org/10.5281/zenodo.20628399 (published by K.S.-S. on 10 June 2026 and created in April 2026). The raw experimental combustion dataset is currently being organized and documented for public dissemination and will be deposited in an open-access repository after completion of the curation process. Until then, the data are available from the corresponding author upon reasonable request.
Acknowledgments
The authors gratefully acknowledge Jan Witek, a student, for his contribution to the development, optimization, and validation of the laboratory measurement system.
Conflicts of Interest
Author Anna Korzeniewska is a former employee of MDPI. However, they were not involved in the editorial process, peer review, or decision-making for this manuscript. The remaining authors declare no conflicts of interest.
References
- Szramowiat-Sala, K.; Sornek, K. Advancing Energy Efficiency in Wood-Fired Stoves: Investigating the Feasibility and Implementation of Thermoelectric Generators. J. Sustain. Dev. Energy Water Environ. Syst. 2024, 12, 1120489. [Google Scholar] [CrossRef] [Scilit]
- Hopan, F.; Chmelář, M.; Kremer, J.; Dej, M.; Vojtíšek-Lom, M.; Vicente, E.D.; Ryšavý, J.; Krpec, K.; Kuboňová, L.; Molčanov, A.; et al. In-Situ Investigation of Real-World Emissions from 111 Measurements on Solid Fuel Household Boilers. Sci. Total Environ. 2025, 981, 179564. [Google Scholar] [CrossRef] [Scilit] [PubMed]
- Szramowiat-Sala, K.; Korzeniewska, A.; Sornek, K.; Marczak, M.; Wierońska, F.; Berent, K.; Gołaś, J.; Filipowicz, M. The Properties of Particulate Matter Generated during Wood Combustion in In-Use Stoves. Fuel 2019, 253, 792–801. [Google Scholar] [CrossRef] [Scilit]
- Martens, P.; Czech, H.; Tissari, J.; Ihalainen, M.; Suhonen, H.; Sklorz, M.; Jokiniemi, J.; Sippula, O.; Zimmermann, R. Emissions of Gases and Volatile Organic Compounds from Residential Heating: A Comparison of Brown Coal Briquettes and Logwood Combustion. Energy Fuels 2021, 35, 14010–14022. [Google Scholar] [CrossRef] [Scilit]
- Křůmal, K.; Mikuška, P.; Horák, J.; Hopan, F.; Kuboňová, L. Influence of Boiler Output and Type on Gaseous and Particulate Emissions from the Combustion of Coal for Residential Heating. Chemosphere 2021, 278, 130402. [Google Scholar] [CrossRef] [Scilit] [PubMed]
- Desservettaz, M.; Pikridas, M.; Stavroulas, I.; Bougiatioti, A.; Liakakou, E.; Hatzianastassiou, N.; Sciare, J.; Mihalopoulos, N.; Bourtsoukidis, E. Emission of Volatile Organic Compounds from Residential Biomass Burning and Their Rapid Chemical Transformations. Sci. Total Environ. 2023, 903, 166592. [Google Scholar] [CrossRef] [Scilit] [PubMed]
- Křůmal, K.; Mikuška, P.; Horák, J.; Jaroch, M.; Hopan, F.; Kuboňová, L. Gaseous and Particulate Emissions from the Combustion of Hard and Soft Wood for Household Heating: Influence of Boiler Type and Heat Output. Atmos. Pollut. Res. 2023, 14, 101801. [Google Scholar] [CrossRef] [Scilit]
- Chen, D.; Cen, K.; Zhuang, X.; Gan, Z.; Zhou, J.; Zhang, Y.; Zhang, H. Insight into Biomass Pyrolysis Mechanism Based on Cellulose, Hemicellulose, and Lignin: Evolution of Volatiles and Kinetics, Elucidation of Reaction Pathways, and Characterization of Gas, Biochar and Bio-oil. Combust. Flame 2022, 242, 112142. [Google Scholar] [CrossRef] [Scilit]
- Hartikainen, A.H.; Basnet, S.; Yli-Pirilä, P.; Ihalainen, M.; Talvinen, S.; Tissari, J.; Mikkonen, S.; Zimmermann, R.; Sippula, O. Resolving Emission Factors and Formation Pathways of Organic Gaseous Compounds from Residential Combustion of European Brown Coal. Combust. Flame 2024, 265, 113485. [Google Scholar] [CrossRef] [Scilit]
- Huang, G.; Wang, S.; Chang, X.; Cai, S.; Zhu, L.; Li, Q.; Jiang, J. Emission Factors and Chemical Profile of I/SVOCs Emitted from Household Biomass Stove in China. Sci. Total Environ. 2022, 842, 156940. [Google Scholar] [CrossRef] [Scilit] [PubMed]
- EN 12619:2013; Stationary Source Emissions—Determination of the Mass Concentration of Total Gaseous Organic Carbon—Continuous Flame Ionisation Detector Method. CEN: Brussels, Belgium, 2013.
- Szramowiat-Sala, K.; Penkala, R.; Horák, J.; Krpec, K.; Hopan, F.; Ryšavý, J.; Borovec, K.; Górecki, J. AI-Based Data Mining Approach to Control the Environmental Impact of Conventional Energy Technologies. J. Clean. Prod. 2024, 472, 143473. [Google Scholar] [CrossRef] [Scilit]
- Szramowiat-Sala, K.; Krpec, K.; Penkala, R.; Ryšavý, J. Data-Driven Prediction of Pollutants Emission from Small-Scale Heating Units Using Temporal Deep Learning. Energy Convers. Manag. X 2025, 28, 101322. [Google Scholar] [CrossRef] [Scilit]
- Muratov, E.N.; Bajorath, J.; Sheridan, R.P.; Tetko, I.V.; Filimonov, D.; Poroikov, V.; Oprea, T.I.; Baskin, I.I.; Varnek, A.; Roitberg, A.; et al. QSAR without Borders. Chem. Soc. Rev. 2020, 49, 3525–3564. [Google Scholar] [CrossRef] [Scilit] [PubMed]
- Li, J.; Zhao, T.; Yang, Q.; Du, S.; Xu, L. A Review of Quantitative Structure-Activity Relationship: The Development and Current Status of Data Sets, Molecular Descriptors and Mathematical Models. Chemom. Intell. Lab. Syst. 2025, 256, 105278. [Google Scholar] [CrossRef] [Scilit]
- van Tilborg, D.; Rossen, L.; Grisoni, F. Molecular Deep Learning at the Edge of Chemical Space. Nat. Mach. Intell. 2026, 8, 575–587. [Google Scholar] [CrossRef] [Scilit] [PubMed]
- Boldini, D.; Ballabio, D.; Consonni, V.; Todeschini, R.; Grisoni, F.; Sieber, S.A. Effectiveness of Molecular Fingerprints for Exploring the Chemical Space of Natural Products. J. Cheminform. 2024, 16, 35. [Google Scholar] [CrossRef] [Scilit] [PubMed]
- Kausar, S.; Falcao, A.O. A Visual Approach for Analysis and Inference of Molecular Activity Spaces. J. Cheminform. 2019, 11, 63. [Google Scholar] [CrossRef] [Scilit] [PubMed]
- Kim, S.; Chen, J.; Cheng, T.; Gindulyte, A.; He, J.; He, S.; Li, Q.; Shoemaker, B.A.; Thiessen, P.A.; Yu, B.; et al. PubChem in 2021: New Data Content and Improved Web Interfaces. Nucleic Acids Res. 2021, 49, D1388–D1395. [Google Scholar] [CrossRef] [Scilit] [PubMed]
- Linstrom, P.J.; Mallard, W.G. NIST Chemistry WebBook, NIST Standard Reference Database Number 69; Updated in 2025; National Institute of Standards and Testing (NIST): Gaithersburg, MD, USA, 2013. [CrossRef] [Scilit]
- Yang, H.; Yan, R.; Chen, H.; Lee, D.H.; Zheng, C. Characteristics of Hemicellulose, Cellulose and Lignin Pyrolysis. Fuel 2007, 86, 1781–1788. [Google Scholar] [CrossRef] [Scilit]
- Mohan, D.; Pittman, C.U., Jr.; Steele, P.H. Pyrolysis of Wood/Biomass for Bio-Oil: A Critical Review. Energy Fuels 2006, 20, 848–889. [Google Scholar] [CrossRef] [Scilit]
- Paris, E.; Carnevale, M.; Vincenti, B.; Palma, A.; Guerriero, E.; Borello, D.; Gallucci, F. Evaluation of VOCs Emitted from Biomass Combustion in a Small CHP Plant: Difference between Dry and Wet Poplar Woodchips. Molecules 2022, 27, 955. [Google Scholar] [CrossRef] [Scilit] [PubMed]
- Sun, Y.; Wang, S.; Yang, Q.; Li, J.; Wang, L.; Zhang, S.; Yang, H.; Chen, H. Environmental Impact Assessment of VOC Emissions from Biomass Gasification Power Generation System Based on Life Cycle Analysis. Fuel 2023, 335, 126905. [Google Scholar] [CrossRef] [Scilit]
- Jiang, P.; Wang, C.; She, W.; Ye, W.; Li, Y.; Ji, T.; Mu, L.; Lu, X.; Zhu, J. Machine Learning Accelerated Data Generation, Process Modelling and System Optimization for Biomass Conversion and Valorization. Renew. Sustain. Energy Rev. 2026, 226, 116439. [Google Scholar] [CrossRef] [Scilit]
- Han, X.; Wu, T.; Cen, S.; Yong, J.; Tian, X.; Li, X.; Sun, R.; Liu, M.; Yu, H.; Li, Z. Multi-Task Deep Learning Utilizing VOCs Detected by HS-GC-IMS for Geographical Origin Tracing and Adulteration Detection of Turmeric Powder. Food Control 2025, 178, 111522. [Google Scholar] [CrossRef] [Scilit]

Disclaimer/Publisher’s Note: The statements, opinions and data contained in all publications are solely those of the individual author(s) and contributor(s) and not of MDPI and/or the editor(s). MDPI and/or the editor(s) disclaim responsibility for any injury to people or property resulting from any ideas, methods, instructions or products referred to in the content. |
© 2026 by the authors. Licensee MDPI, Basel, Switzerland. This article is an open access article distributed under the terms and conditions of the Creative Commons Attribution (CC BY) license.