


Abstract
Which economies are the net economic winners of the climate transition? The intuitive answer—clean, low-emission, resource-rich economies—conflates a natural endowment with a productive capability. Economic-complexity research measures countries’ capability to produce complex green goods, while a separate literature quantifies the macroeconomic cost of climate change; the two have not been integrated. We provide that integration, operationalising a four-condition test for a net winner and collapsing it onto two axes—capability alignment and cost coverage—for the 38 members of the Organisation for Economic Co-operation and Development (OECD), computed from trade, patent, bibliometric, emissions and vulnerability data. On these indicators, the resource-endowment ranking is largely reordered: a robust core of established green-goods exporters (Sweden, Denmark, Germany, the United Kingdom, France, Austria, Italy, Switzerland and Finland) holds the winner positions—a reordering robust to a GDP-based export term and to orthogonalising the axes—while several clean resource economies are, on current indicators, cost-bearers. Scored indicatively on the same axes, China, the dominant green-goods exporter, appears capability-rich but cost-heavy. We separate genuine opportunity capture from merely low costs, show a services reading can rehabilitate goods-thin economies, and stress-test the map with economic-fitness, nestedness and rank-conversion checks. Positions are structural and relative; the policy reading is capability-building, not endowment.
1. Introduction
The public and policy debate about the economics of the climate transition is shadowed by a tempting syllogism. Some countries are richly endowed with the resources a low-carbon world will need—critical minerals, sunshine, wind, hydro, arable land—and emit little per unit of output; therefore, those countries will be the economic winners of the transition. Each premise is individually defensible, yet the syllogism is a poor guide to who captures value, because it conflates an endowment with a capability and a clean balance sheet with a competitive one. A country that exports ore and sunlight does not thereby export the turbines, electrolysers, heat pumps, desalination plants or environmental instruments that a decarbonising and adapting world demands; and an economy whose grid is already clean has, by that fact, little residual mitigation market to sell into at home.
Two largely separate research programmes bear on this question. The first applies the tools of economic complexity and the product space [1,2] to the green economy, showing that a country’s ability to produce and export complex green products is predicted by the relatedness of those products to its existing capabilities rather than by resource endowment, and constructing indices of green complexity and green-complexity potential [3]—building on earlier mappings of national green product spaces [4], a consolidated measurement programme [5,6], a structured literature linking complexity, diversification and industrial policy to sustainability [7], and recent work coupling multidimensional complexity directly to inclusive green growth [8]. This literature measures capability—what we term the supply side of the transition. The second programme quantifies the macroeconomic cost of climate change. Building on damage estimates derived from the response of output to local temperature [9,10], recent work has converged on the finding that such estimates understate the damage once global trade, supply-chain and financial channels are included [11,12], that warming has already widened global economic inequality [13], and that national exposure and vulnerability compound the risk [14]. This literature measures cost—the burden side.
The two have not been brought together. Whether a country is a net economic winner of the transition depends jointly on whether it can capture the green opportunity (capability) and on whether that opportunity exceeds the mitigation and adaptation costs it must bear (cost coverage); yet no published assessment, to our knowledge, positions countries on both dimensions simultaneously or operationalises an explicit winner/loser test from them—the closest precedents identify green-race ‘winners’ from innovation and trade indicators alone, without setting them against the cost side [15], even as the green transition is already generating uneven territorial winners and losers [16]. The question is timely: active, and increasingly green, industrial policy has returned to the centre of the OECD agenda [17,18], and a complexity-and-strategic-industries reading of OECD economies has begun to take shape [19]. This paper closes that gap. The assessment covers the 38 OECD members; because that universe excludes China—the dominant global manufacturer of solar, battery, wind and related green goods—we also score China on the same axes as an out-of-sample reference (Section 4), so the OECD reading is not mistaken for the global one. Its contribution is fourfold. First, we propose and defend a four-condition test for a net economic winner and collapse it onto two measurable composite axes—capability alignment and cost coverage—yielding a four-tier typology. Second, we compute the positions of all 38 members of the Organisation for Economic Co-operation and Development (OECD) from real bilateral-trade, patent, bibliometric, emissions and vulnerability data, and show that the resource-endowment ranking is largely reordered: the robust winners are the incumbent green-goods manufacturing exporters, not the clean resource economies. Third, we extend the assessment in three ways that the single-axis capability literature cannot reach—a decomposition of cost coverage into genuine opportunity capture versus merely low costs; a services reading, built from balanced services-trade data, that rehabilitates economies that are thin in green goods but strong in climate-relevant services; and a relatedness-based adjacency analysis that grounds each economy’s latent opportunity in its patent and research base. Fourth, we stress-test the result with an economic-fitness metric [20], a nestedness analysis [21,22] and a capability-to-export conversion measure, and report a methodological corrective: once the degree sequence is controlled, the OECD green-export matrix shows no nestedness in excess of the degree-preserving null—its observed NODF sits significantly below that null—so the apparent capability hierarchy within green goods is largely an artefact of basket size rather than an additional structural law.
The remainder of the paper is organised as follows. Section 2 sets out the conceptual framework—the four conditions, the structural tension between them, and the three routes by which winners escape it. Section 3 describes the data, the construct proxies and the index construction. Section 4 presents the computed OECD map and the tier-by-tier reading, including the hard cases and the services and adjacency extensions. Section 5 discusses the findings against the literature and sets out the limitations. Section 6 concludes.
2. Conceptual Framework
We define a country as a net economic winner of the climate transition when, and only when, four conditions hold jointly. (i) Cost coverage: the climate-driven export opportunity exceeds the sum of mitigation cost and adaptation cost. (ii) Alignment: that opportunity is concentrated in sectors where the country holds revealed comparative advantage. (iii) Industrial depth: the advantage is backed by genuine manufacturing capability. (iv) Research and patent depth: it rests on an owned research base and patent portfolio rather than on borrowed or extractive capability.
The conditions are not a checklist of independent virtues; conditions (i) and (iv) are in structural tension. Economies that clear the cost-coverage inequality most easily tend to be low-complexity resource exporters or small low-emission economies whose green balance sheet is favourable precisely because they manufacture little—and which therefore fail the industrial- and patent-depth tests. Economies with deep green-patent portfolios tend to be heavy-industry manufacturers for which the residual mitigation cost is large, and the export thesis sits under intense cost competition. Winners escape this trap by one of three routes: pre-existing technology leadership on a low residual mitigation base (the Danish route); deliberately engineered alignment at scale through green industrial policy (the Chinese route—the dominant global green-goods manufacturer, though, as Section 4 shows, one whose own carbon-cost base leaves it capability-rich but cost-heavy) [23]; or capability redeployment through relatedness—moving an incumbent industrial capability into an adjacent green domain, as offshore and subsea engineering is, in principle, adjacent to offshore wind, carbon capture and hydrogen (a potential Norwegian route).
Relatedness is the mechanism that makes the third route measurable. The product-space literature shows that countries diversify into products close to those they already make—a regularity codified as the principle of relatedness [1,24] and measured as relatedness density in studies of regional diversification and industrial branching [25]—and that green capability in particular is predicted by proximity to a country’s existing export basket rather than by endowment [2,3]. The same regularity is documented on the technology side: across European regions, relatedness to pre-existing knowledge raises the probability of new green-technology specialisation, and does so more strongly for relatedness to non-green than to green prior knowledge [26]; related capability, rather than political support for environmental policy, is what is associated with regional green diversification, though political support conditions how strongly capability operates [27]. Relatedness identifies which green domains are adjacent to a country’s capabilities and therefore more likely to be redeployable; it does not, on its own, separate owned from borrowed capability, because it is computed from trade flows that carry no ownership information—a distinction we return to qualitatively in the hard cases. To position countries, the four conditions collapse onto two axes. The horizontal axis, capability alignment, combines conditions (ii)–(iv): revealed advantage matched to industrial, research and patent depth, with relatedness as the discriminator. The vertical axis, cost coverage, is condition (i): the export opportunity set against mitigation and adaptation cost. The two axes define four tiers—net winners (high on both); capable but cost-heavy (deep capability, costs not covered); clean but capability-thin (costs covered, capability lacking); and misaligned net cost-bearers (low on both).
3. Materials and Methods
3.1. Constructs, Proxies and Data Sources
The country universe is the 38 OECD members. Capability alignment is built from four components. Economic complexity is the Economic Complexity Index (ECI) computed from Atlas HS92 bilateral-trade data pooled over 2020–2024 [28]. Green-patent advantage is the OECD environment-related-technologies specialisation [29] (inventor-country basis, fractional counts, pooled over 2015–2020), expressed as a revealed advantage against the OECD mean and read both for the total environmental aggregate and, separately, for the climate-change-adaptation domain. Research depth is the OECD field-normalised citation impact, entered at low weight because cross-country coverage of transition-relevant fields is uneven. Relatedness density is each country’s proximity-weighted closeness to the green-goods basket, computed from the product-space proximity matrix. Cost coverage is built from the export opportunity net of a mitigation-cost proxy (the carbon intensity of gross domestic product [30]) and an adaptation-cost proxy—the Notre Dame Global Adaptation Initiative vulnerability index [31], a construct grounded in the exposure–sensitivity–adaptive-capacity framework [32]. Two proxy choices are stated plainly: carbon intensity measures the scale of the decarbonisation task, not its marginal abatement cost; and vulnerability is a relative exposure index, not a monetary adaptation bill, so the cost-coverage inequality is an ordinal, standardised construction rather than a costed ledger. Table 1 maps each construct to its proxy and source. A structural caution applies throughout: ECI, relatedness and the export term are all derived from the same trade matrix and are therefore correlated by construction, so the capability and cost-coverage axes are not statistically independent and the diagonal structure of the map is in part mechanical.
Table 1.
Constructs, proxies and data sources.
3.2. Defining the Green Basket: Three Readings
The export opportunity is read three ways, reported side by side. The mitigation-market reading defines the green basket as the 54-line APEC List of Environmental Goods [33]—photovoltaic cells, wind generating sets, turbines, filtration and measurement instruments. As a robustness check on the choice of definition, the basket is widened to the 248-line OECD Combined List of Environmental Goods [34], of which 232 codes map to the HS92 universe. The physical-climate reading defines the basket from revealed import intensity in the markets hit earliest and worst by climate change—cooling, for which demand is projected to more than triple by 2050 [35], water security, drought- and heat-resilient agriculture, resilient construction and early-warning instrumentation—and is the labelled alternative to the mitigation reading. The physical-climate winner set is insensitive to the exact basket: a narrow high-intensity core of 22 of the 30 codes yields the same winners as the full basket, and the winner set is stable under leave-one-out and random-subset (60–90%) resampling of the codes, with only borderline members such as Luxembourg occasionally shifting (Supplementary Materials). A services basket—construction and resilient-infrastructure services, insurance, telecommunications/computer/information services, and other business services including engineering and research consulting—is measured as a revealed-advantage share of total services exports from balanced services-trade data [36].
3.3. Index Construction
Revealed comparative advantage follows Balassa [37]: a country’s share of a product in its own exports relative to that product’s share of world exports (Equation (1)).
Relatedness density measures how close a country sits to a target product, weighting its present capabilities by their proximity to that product in the product space (Equation (2)), where φ is the product-proximity matrix and M the discretised RCA matrix; the construction follows sub-national applications that combine revealed advantage, product-space proximity and opportunity measures [38].
The capability-alignment index is a weighted sum of standardised components (Equation (3)), with weights summing to one and a default that down-weights research relative to the trade, patent and relatedness terms.
The cost-coverage index sets the standardised export opportunity against a weighted sum of the two standardised cost terms (Equation (4)), with cost weights reported and varied in the robustness analysis.
The magnitude of the opportunity for a green segment is the product of an addressable market, its growth, the country’s share or share-potential and a capture factor, summed over segments (Equation (5): V the addressable market of a green segment, g its projected growth, s the country’s current share or share-potential, and θ a capture factor, summed over segments) and reported as a point estimate with a range.
All components are standardised within the OECD-38 by z-score, so positions are read relative to OECD peers, and the two composite indices are then min–max-rescaled to a 0–10 frame for display. Tier membership is assigned at the OECD-38 mean (z = 0 on each axis), above or below the OECD average, because a midpoint cut on a min–max scale is sensitive to single extreme values. The raw, standardised and rescaled values are retained so that a reader can re-weight.
3.4. Robustness and Cross-Domain Methods
Tier assignments are stress-tested by a 2000-draw Monte Carlo over the capability weights (Dirichlet), the two cost weights, the normalisation, the patent lens and the choice of green-goods basket. The capability axis is further tested by substituting the non-linear economic-fitness metric [20] for the linear ECI, a check motivated by the recognition that the complexity index is best read as an ordinal capability summary rather than a cardinal score [39]. The structure of the green-export matrix is examined with the NODF nestedness metric [40]—a refinement of the nestedness concept first described for ecological mutualistic networks [41]—against a curveball null that preserves both row and column marginals [22], following null-model randomisation of trade networks [42]; this is the appropriate null for nestedness significance and a stricter test than the row-only null used in earlier industrial-ecosystem work [21]. A capability-to-export conversion measure—the gap between a country’s rank in green-goods export advantage and its rank in capability—identifies over- and under-converters. All computations are deterministic under a fixed random seed and reproducible from public data. The pipeline was implemented in Python 3.14 with NumPy [2.4.4] and Matplotlib 3.10.8 as its only third-party dependencies. All stochastic components—the Monte-Carlo tiering, the curveball null randomisation, the bootstrap and permutation tests, and the adaptation-basket resampling—draw on a single NumPy default_rng stream seeded at 20260629. The analysis code and computed tables are openly archived (see Data Availability Statement). A generative AI tool (Anthropic Claude Opus 4.8) was used to assist in implementing this code and in drafting and editing the manuscript text. It was not used to generate, source or alter any underlying data, and the constructs, component weights, normalisation, thresholds and robustness tests reported above were specified by the author. All AI-assisted code and text were reviewed and verified by the author, and the reported tables and figures were reproduced deterministically from the public sources listed in the Data Availability Statement.
4. Results
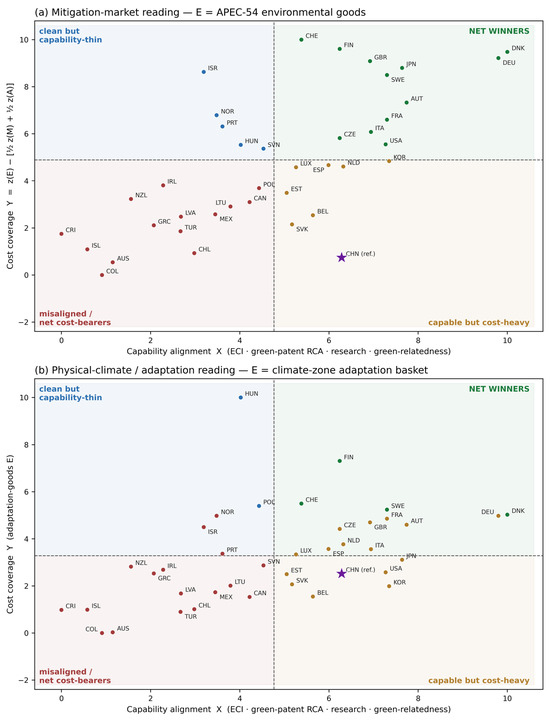
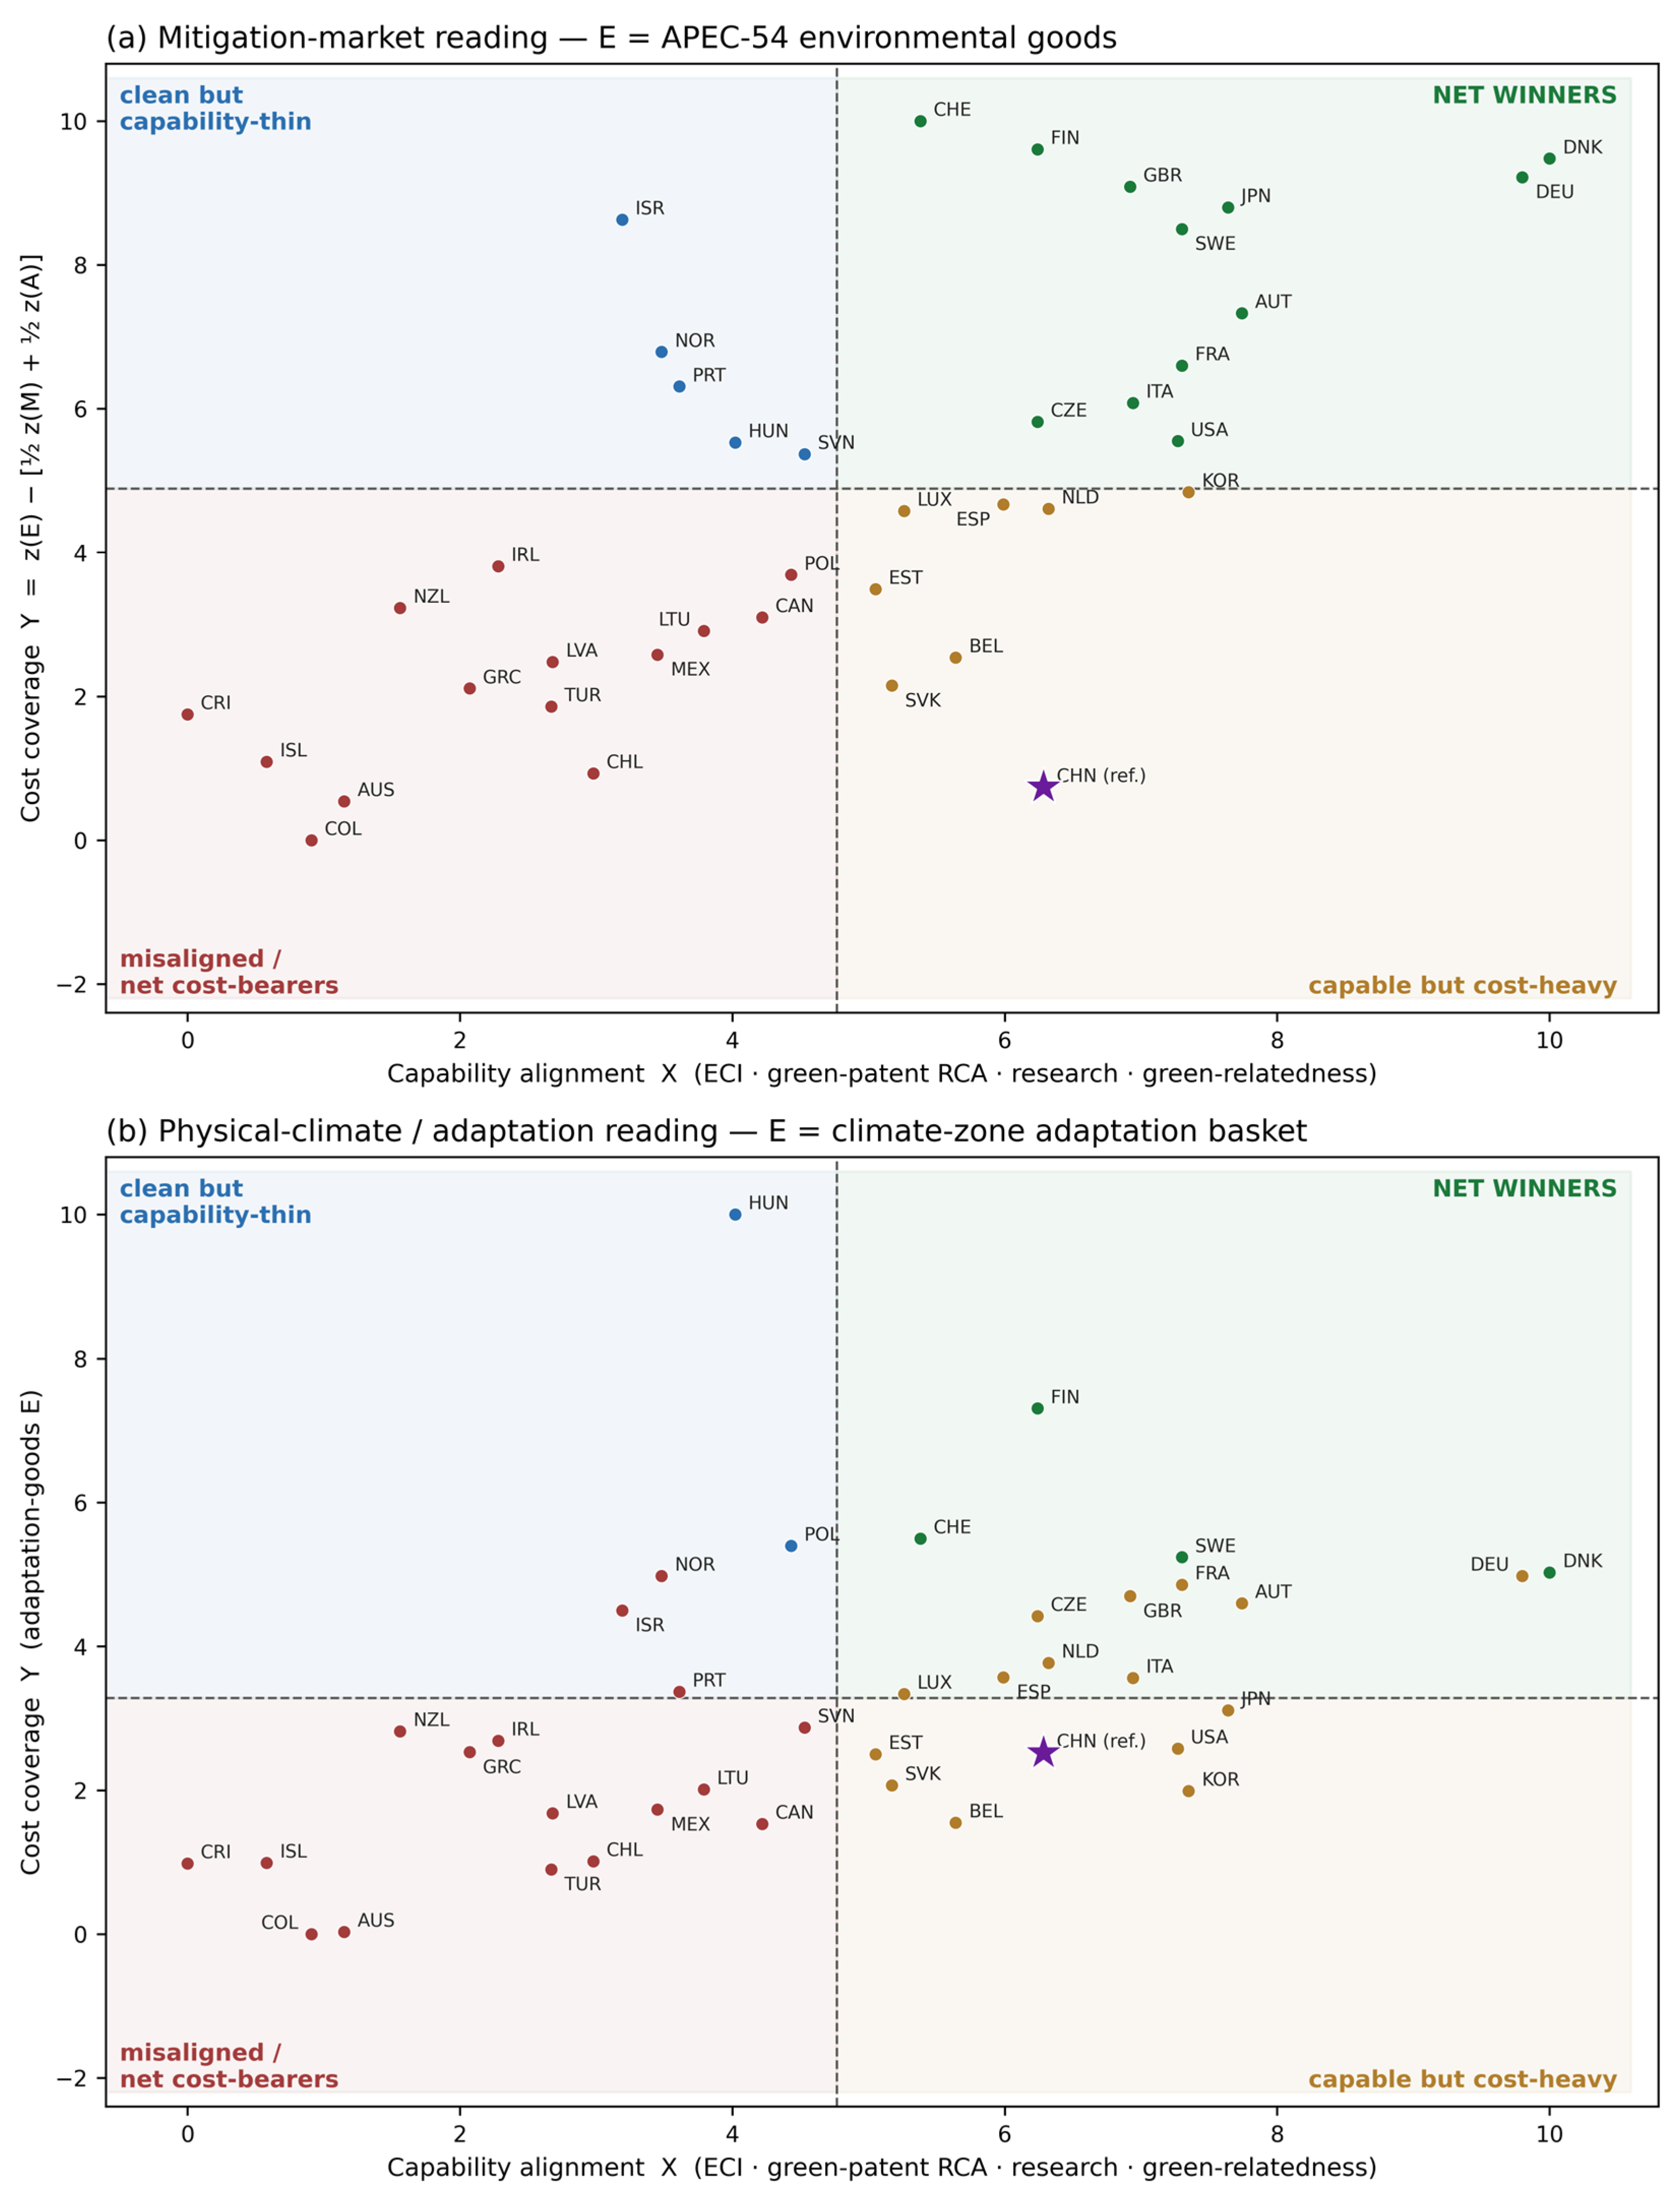
Figure 1 presents the computed OECD-38 map under the mitigation-market reading (panel a) and the physical-climate reading (panel b). In the mitigation reading, the net-winner quadrant is occupied by the large green-goods manufacturing exporters (Germany, Japan, the United States, the United Kingdom, Italy and Czechia), alongside Denmark, Sweden, Finland, Switzerland, Austria and France. These economies are not uniformly clean; the United States and Czechia carry above-average carbon intensity. What unites them is that they already manufacture and export the relevant goods, and the green-export advantage outweighs the mitigation burden on the ledger. Germany alone exports of the order of US$65 billion a year of APEC-basket goods at a revealed advantage of 1.66, on one of the highest green-goods relatedness scores in the OECD.
Figure 1.
Capability-aligned climate-transition map of the OECD-38 (computed positions, 2020–2024 data). Panel (a): mitigation-market reading (E = APEC-54 environmental goods). Panel (b): physical-climate/adaptation reading. The crosshair is the OECD-38 mean; axes are min–max-rescaled within the OECD-38 and are relative, not absolute. The purple star marks China on both panels, scored on the same axes as an out-of-sample reference (Section 4). Source: Atlas HS92 [28]; OECD environment-technology patents and bibliometrics [29]; ECI and product-space proximity; Ritchie et al. [30]; ND-GAIN [31]. Green-patent specialisation is volatile for small filers; services and non-HS opportunities are not captured in goods trade.
The mirror image is the misaligned corner—economies whose clean credentials are real but whose green-goods capability is not: Australia, Canada, Chile, Iceland, Ireland, New Zealand, Mexico, Türkiye, Greece, Colombia and Costa Rica sit below the OECD average on both axes. For the resource economies, the binding fact is that the naive export opportunity is a mirage: Australia exports only about US$1.6 billion a year of APEC-basket goods at a revealed advantage of 0.21, under-trading the basket roughly fivefold. The pattern is robust to the choice of green-goods list: widening from the 54 APEC lines to the 248 OECD Combined lines leaves it intact (Germany 1.74 on the wide list, Denmark 1.57, Japan 1.51; Australia 0.14, Chile 0.06, Norway 0.37).
For reference, China—excluded from the OECD sample—scores on the same two axes as capability-aligned: its capability alignment exceeds 27 of the 38 OECD members, resting on some of the highest green-goods relatedness in the sample and green-goods exports of about US$110 billion a year, larger than Germany’s. On the cost-coverage axis, however, its carbon intensity of GDP sits roughly four standard deviations above the OECD mean, so China falls among the cost-heavy rather than the net winners—a ‘capable but cost-heavy’ position. The placement is indicative rather than exact: OECD environment-technology patent and bibliometric data under-record China, so its green-patent term enters below the OECD mean, and its research term is set to neutral, and carbon intensity is a decarbonisation burden, not an abatement cost; its cost-heavy classification therefore rests largely on this single, out-of-sample term. Even so, it locates the de facto global green-goods winner where the framework predicts a high-capability, high-cost manufacturer should sit, and confirms that the OECD-restricted winner reading is not a claim about the global transition.
4.1. Robustness and the Robust Winner Core
Across the Monte Carlo, nine economies—Sweden, Denmark, Germany, the United Kingdom, France, Austria, Italy, Switzerland and Finland—hold the net-winner quadrant in at least 80% of draws and constitute a robust winner core; a robust cost-bearer floor (Australia, Canada, Chile, Ireland, Iceland, New Zealand, Mexico, Türkiye, Greece, Colombia, Costa Rica) almost never reaches the winner quadrant; and a band of genuinely conditional cases (Japan, Czechia, the United States, the Netherlands) flips with the weighting and the lens. Substituting the economic-fitness metric for ECI leaves the robust core unchanged but for a single swap (Switzerland out, Portugal in); the two metrics rank-correlate only moderately (Spearman ρ = 0.63, 95% CI [0.38, 0.81], p < 0.001), so the agreement on the core is informative rather than mechanical, though, because both metrics derive from the same trade matrix, it is a single-component robustness check, not a test of independence. Under the curveball null the green-export matrix shows no nestedness in excess of the degree-preserving null—its observed NODF (45.31) sits significantly below the null (mean 45.86; standard deviation of the curveball null 0.24; z = −2.29; two-sided empirical p = 0.038), a deliberate corrective: within green goods the apparent capability ladder is largely what the size distribution of export baskets already implies; a naive null fixing only row totals would have suggested otherwise. Because the capability and cost-coverage axes share the trade matrix, the winner structure was checked for circularity two ways. Orthogonalising cost coverage against capability retains six of the nine core winners—France, Austria and Italy fall just below the residual cut—and admits no clean resource economy to the winner set, so the qualitative reordering and a majority of the core survive even if the full nine-country membership is not invariant to this particular test; rebuilding the export term from a GDP-based measure independent of the complexity computation—though still correlated with the revealed-advantage term at r = 0.66—retains all nine. Net of the shared export term, the partial association between the axes falls from r = 0.73 to r = 0.24 (not significant at n = 38), indicating that much of the diagonal reflects the shared trade matrix. The endowment-to-capability reordering nonetheless survives both checks—no clean resource economy becomes a winner under either—so it is structural rather than an artefact of construction. The tiering is further robust to entering the mitigation and adaptation cost proxies separately rather than summed, to dropping or re-weighting the capability components, and to shifting the tier threshold (Supplementary Materials).
4.2. Capture Versus Low Costs
Positive cost coverage can arise two ways, and the distinction is material. For Denmark, Germany and Finland, the margin comes from genuine opportunity capture: each combines a large green-export advantage (1.75, 1.66 and 1.55, respectively) with above-mean capability, so the capture itself funds the costs. For Switzerland and France, the ledger clears mainly because costs are small—Swiss and French electricity is low-carbon, and France’s export capture is in fact slightly below average—so they carry their costs through a clean-energy base rather than through green-goods capture. The clean-but-capability-thin economies (Norway, Israel, Portugal, Hungary, Slovenia) show positive cost coverage only because their costs are low; on the mitigation lens, their capability sits below the OECD mean, so they hold no capture cushion if the burden rises on a steeper warming or lower-discount path.
4.3. The Services Reading and Adjacency
A green-export capability has two legs, and they diverge. On the climate-relevant services basket, Ireland records the highest advantage in the OECD (1.78, driven by information services and insurance) and Israel follows (1.41); both are services-rich (Ireland goods-thin, Israel capability-thin on the composite axis), which qualifies the borrowed-capability reading of Ireland’s goods position. Insurance capability, the financial substrate of adaptation, concentrates in Switzerland, the United Kingdom and Germany; the resource economies are thin on both legs (Australia 0.67, Chile 0.60, Norway 0.86). The adjacency analysis locates each economy’s latent opportunity—the green products closest to the existing capabilities that it does not yet export with advantage—and grounds it in the patent base. For the resource economies, the relatedness density into green goods is low in absolute terms, so broad green manufacturing is not a short adjacent step; the realistic routes run through narrow, patent-specific domains (for example, the sustainable-ocean and carbon-management technologies in which Norway’s environment-technology patenting is most specialised, and water and adaptation technologies for Chile), read from the product space and the patent portfolio together.
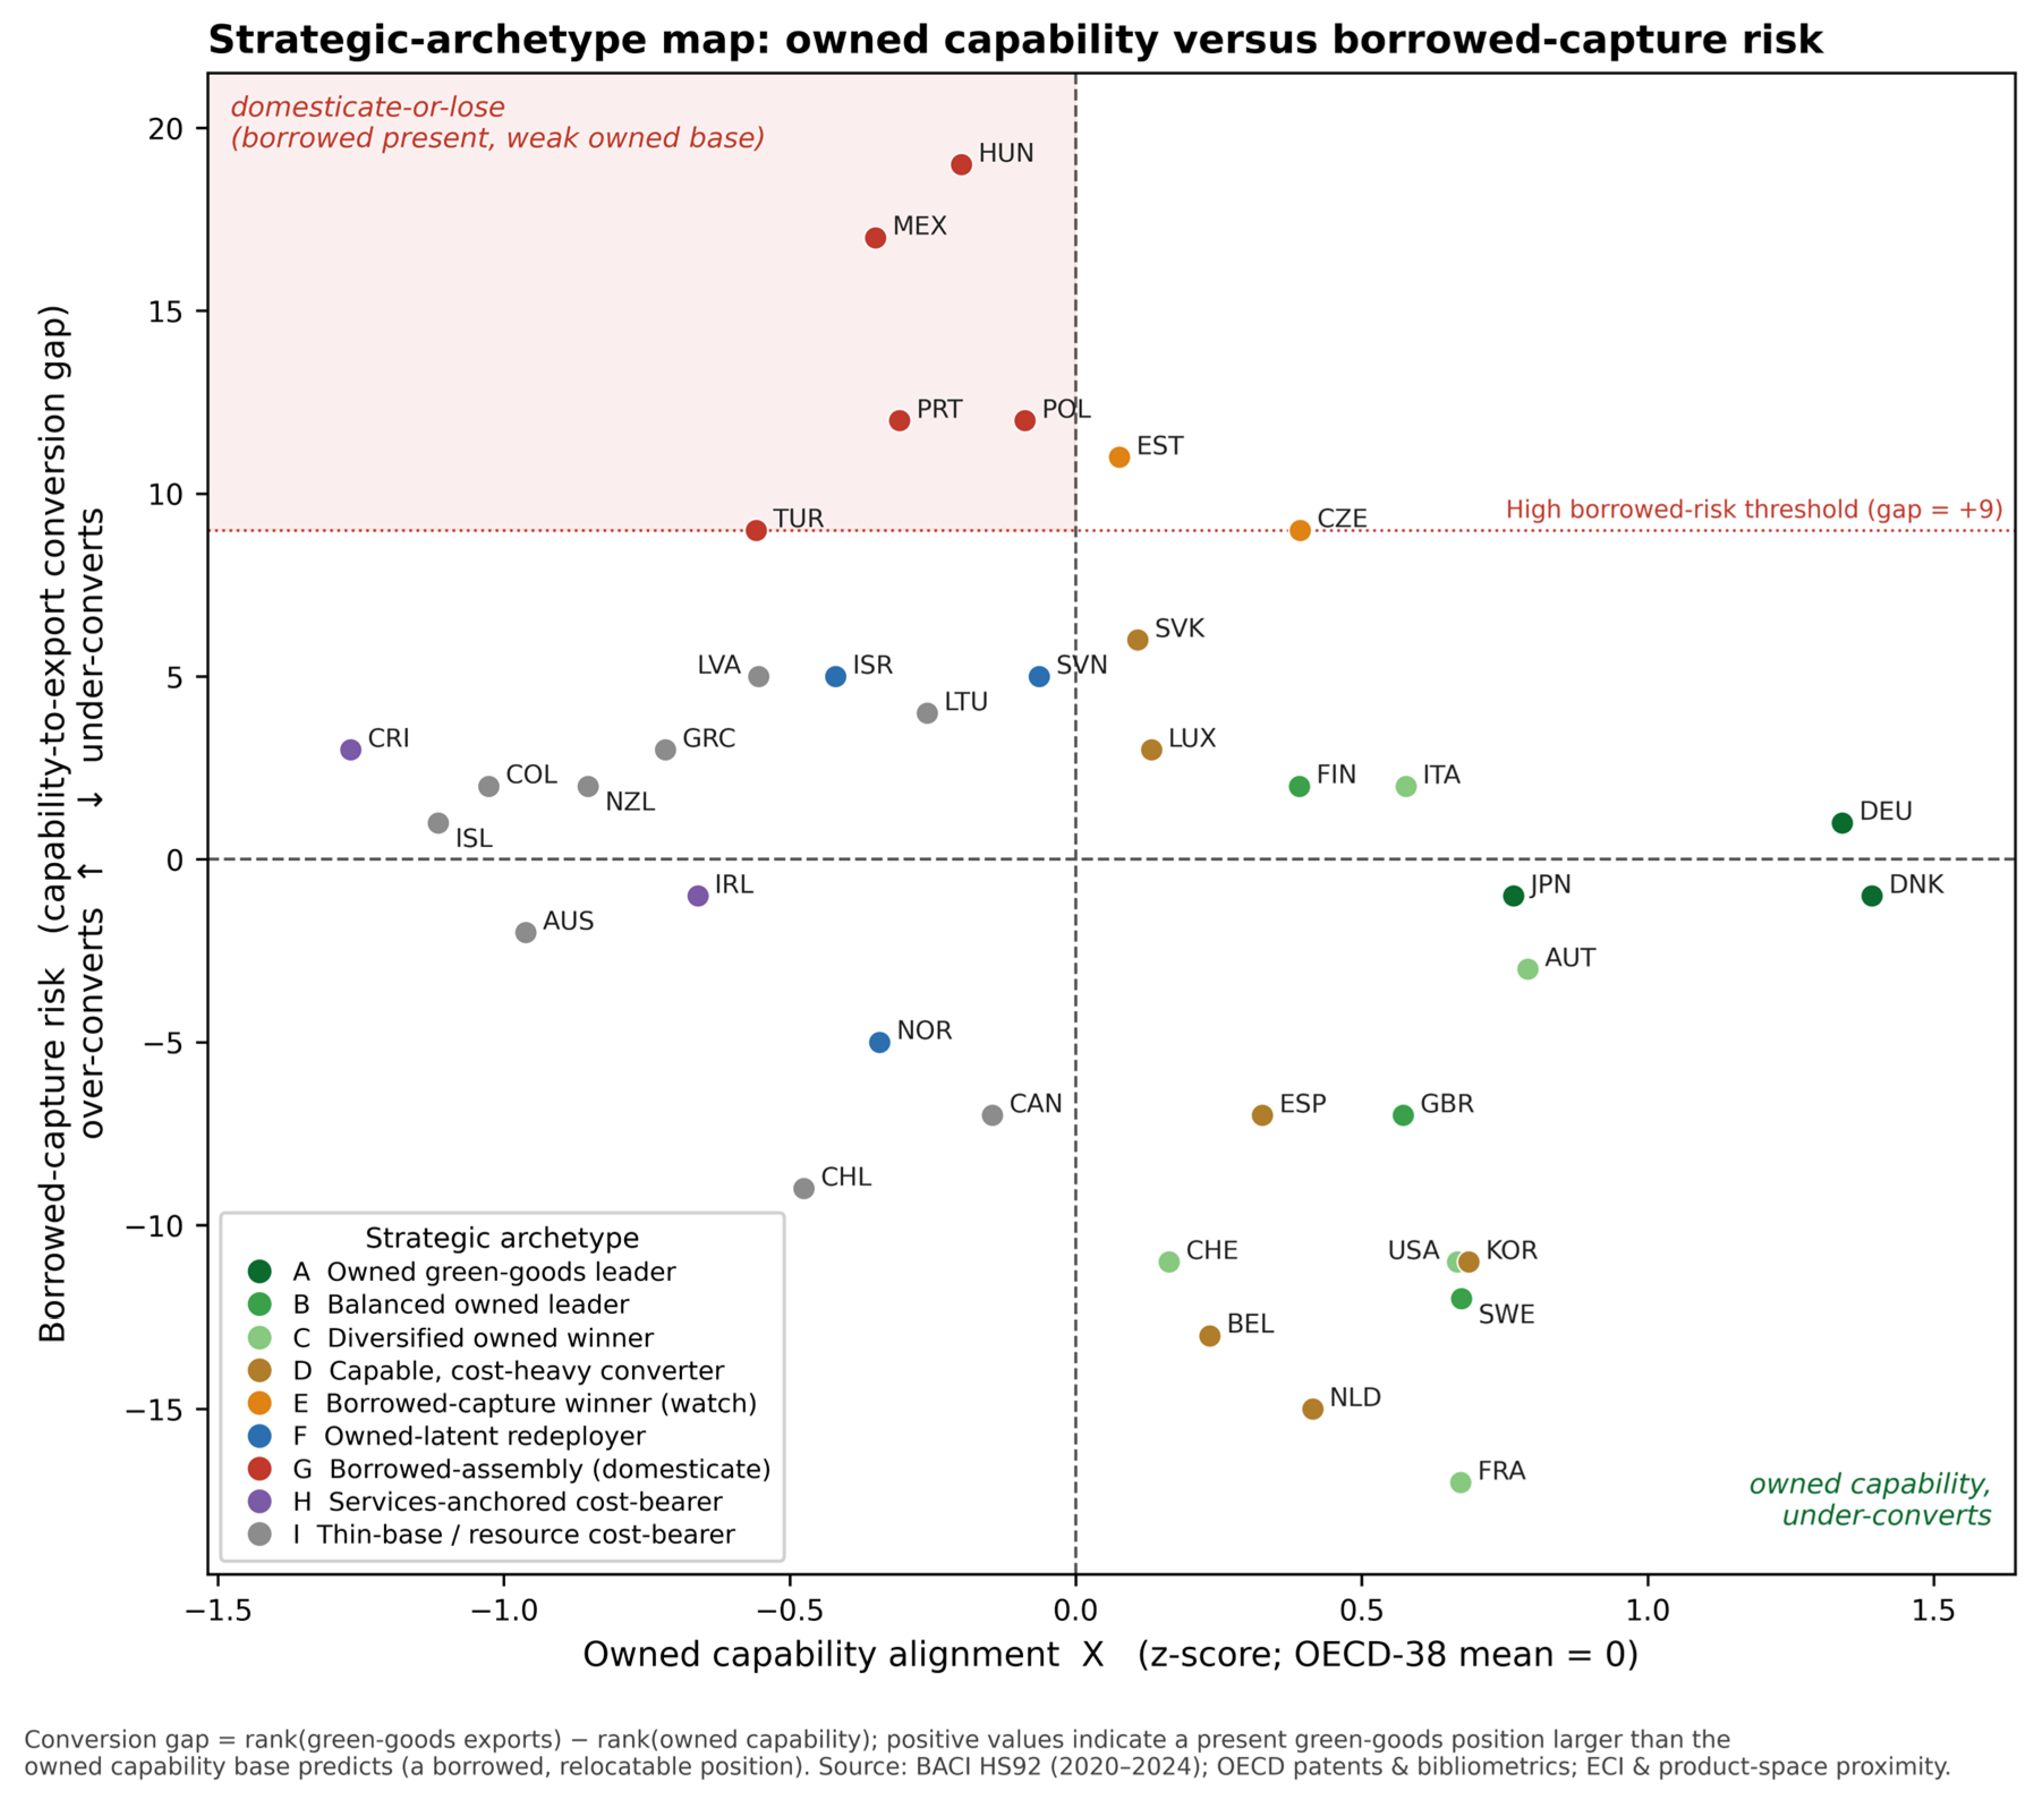
The four legs of this basket are held by different members, so the adaptation-services prize is distributed quite differently from the goods prize. Insurance, the financial substrate that prices physical risk, is concentrated in Switzerland (2.24), the United Kingdom (1.68), Ireland (1.40) and Germany (1.23); resilient-infrastructure construction services in Slovenia (3.30), Latvia (3.09), Korea (3.08), Estonia (2.68) and Türkiye (2.34); climate data and information services in Ireland (3.70), Finland (2.21), Sweden (1.90) and Israel (1.76); and engineering, technical and research services in Israel (1.46), Belgium (1.46) and the United Kingdom (1.34). The capability-to-export conversion measure is complementary: the largest over-converters (economies exporting more green goods than their capability rank predicts) are Hungary, Mexico, Poland and Portugal, whereas the largest under-converters are France, the Netherlands, Belgium and Sweden, whose capability surfaces in services and niche production rather than in the green-goods basket.
4.4. Magnitude of the Favourable Opportunity
Anchored on current trade and scaled to 2035 under an explicitly illustrative growth band (6–12% per year for mitigation goods) with a capture factor centred on no change in world share, the robust winner core’s mitigation green-goods exports could grow materially by 2035, and those of the wider capability-rich half of the OECD by more still; the specific multi-billion-dollar 2035 ranges, central estimates, and underlying assumptions are reported in the Supplementary Materials (Table S3) rather than in the body, to avoid their being quoted out of context. These ranges are scenario arithmetic, not forecasts: the current value is measured, but the growth rate and capture factor are stated assumptions, and the ranges are gross—not netted against the also-growing cost side, which is not sized here.
Table 2 brings these strands together for all 38 members: it pairs the cost burden with the opportunity-capture profile (products, both present and adjacent, and services), flags the borrowed-capacity risk, assigns a finer strategic archetype, and states the policy objective that would maximise the net gain, or minimise the net loss, that the changing climate imparts to each member.
Table 2.
Net status and implied policy objective for the 38 OECD members (computed, 2020–2024 data).
Figure 2.
Strategic-archetype map of the OECD-38: owned capability alignment X versus borrowed-capture risk (the capability-to-export conversion gap). Members in the upper-left region combine a borrowed, relocatable green-goods position with a weak owned capability base (archetype G); those in the lower-right combine owned capability with under-conversion (the owned winners). Colours denote the nine archetypes defined in Table 2. Computed from 2020 to 2024 data.
5. Discussion
The central empirical result—that the OECD’s best-positioned economies are, on current indicators, the established green-goods manufacturing exporters rather than the clean resource economies—follows directly from integrating the two bodies of literature the paper joins. The green-complexity programme [3] already shows that the capability to make complex green products is unevenly distributed and predicted by relatedness rather than endowment, and earlier ‘green race’ assessments [15] identified likely winners from innovation and trade indicators but stopped short of the cost side—even as warming has begun to redistribute income across countries [13]. Our contribution is to set that capability against the climate cost burden, so that the question becomes not merely who can make green goods but who can make them while covering the mitigation and adaptation costs they face. The resource economies fail not because they are dirty (several are exceptionally clean) but because their green-goods capability is thin and their naive export opportunity does not survive contact with revealed trade. This reframes a common policy intuition: a clean endowment is necessary neither for, nor sufficient to secure, a winning position. The point that income or resource endowment must not be read as transition capability has independent support: multidimensional complexity, not endowment, predicts inclusive green growth [8]; the endowment that increasingly governs green production is the heterogeneity of renewable-energy supply, which is itself beginning to relocate heavy green industry [43]; and a within-OECD gradient in economic-complexity levels is already visible across European countries [44].
The extensions sharpen the reading in ways a single capability index cannot. The capture-versus-low-cost decomposition shows that a favourable ledger is not always an earned one: Switzerland and France clear their costs through low-carbon electricity rather than through opportunity capture, which matters because a low-cost position carries no cushion if costs rise. The services reading rehabilitates Ireland and Israel, whose owned capability is in climate-relevant services rather than goods, and which a goods-only assessment can misclassify; we treat this as a secondary, services-side extension of the goods-based map rather than a replacement for it, and note that part of Ireland’s services advantage reflects foreign-owned multinationals rather than indigenous capability. The adjacency analysis converts the abstract ‘build capability’ prescription into specific, patent-grounded directions, and is candid that for the resource economies those directions are narrow. Methodologically, the nestedness corrective is itself a contribution: industrial-ecosystem studies have read nestedness as evidence of a capability ladder [21], but under a marginal-preserving null the green sub-matrix is not nested beyond its degree sequence, a caution that the apparent hierarchy is partly an artefact of basket size.
The services result is more than the rehabilitation of two economies. Because the four climate-relevant service legs are held by different members, the transition opportunity in services is genuinely distributed: an economy can be a goods cost-bearer yet hold a defensible adaptation-services position, whether in the digital and analytics services of Ireland and Israel, the insurance that prices physical risk in Switzerland and the United Kingdom, or the resilient-infrastructure construction of the Baltic states, Korea and Türkiye. A goods-only reading, which the bulk of the green-complexity literature adopts, therefore understates the transition prize for services-strong economies and can misassign the loser label. Two caveats keep the services reading indicative rather than decisive: the balanced services-trade data are modelled estimates rather than fully observed flows, and the climate-relevant basket is a coarse aggregate of four broad service categories that are only partly climate-specific, so it captures the direction of services capability rather than its precise green content.
A capability visible in the trade data is not always one a country owns. The relatedness and revealed-advantage measures are computed from trade flows alone and carry no information about who owns the productive assets, so they cannot, by construction, separate domestically held capability from borrowed capability, meaning capability that is present through participation in a foreign-owned value chain and is therefore relocatable; the global value chain literature has long stressed that a downstream trade position need not confer control of the higher-value design, branding and coordination functions that lead firms keep in-house, and that functional upgrading into those owned activities is the hardest move for a participant to make [45,46]. The conversion measure makes this concrete: the economies that export markedly more green goods than their underlying complexity predicts are the foreign-owned-assembly clusters of central Europe and Mexico, whose green-goods position rests on assembling components designed and owned elsewhere. Such positions are contingent, since they can move with the next investment decision rather than reflecting an accumulated, sticky capability, so a winner reading that leans on them is more fragile than the map alone reveals. The caveat cuts across both legs of the analysis: on the goods side it qualifies the apparent strength of the central-European manufacturers; on the services side it qualifies even the rehabilitated cases, since part of Ireland’s information-services advantage reflects foreign-owned multinationals rather than indigenous capability. The point is not that borrowed capability is valueless, since value chain participation can seed genuine learning and supplier linkages [47,48]; rather, those gains are conditional on domestic absorptive capacity [49] and are not delivered automatically, with the long-run evidence on whether participation translates into owned upgrading being decidedly mixed [50], and assembly-led growth that fails to deepen can stall before owned capability accumulates [51]. The assessment would therefore be sharpened by an ownership- or value-added-adjusted measure of relatedness, which trade data alone cannot supply and which we flag as a priority for further work. Figure 2 maps all 38 members on these two dimensions, owned capability and borrowed-capture risk, shaded by the nine strategic archetypes of Table 2; the upper-left zone, where a borrowed present position meets a weak owned capability base, is where the domestication challenge is most acute.
For the conditional and cost-bearing economies, the policy reading is one of smart specialisation [52]. The misaligned corner is not a verdict of permanent exclusion; it is a statement that, on current data, capability is not where the endowment is. The lever is relatedness: the achievable green opportunities are those adjacent to a country’s existing export basket, not those merely abundant in its ground, and the realistic route for a resource economy runs through deliberate capability-building in its patent-strong niches rather than through an expected endowment dividend—a green-industrial-policy task for which an evidence-based toolkit and an OECD-specific framework now exist [18,53], and whose political economy is itself a live field [23,54].
Limitation
Five limitations bound the claims. First, the assessment is relative and structural, not ledgered: there is no agreed national green balance sheet, positions are z-scored within the OECD-38, and the cost-coverage inequality is horizon- and discount-rate-dependent. Second, the capability and cost-coverage axes are not fully independent, because economic complexity, relatedness and the export term are computed from the same trade matrix; net of the shared export term, the association between the axes falls from r = 0.73 to a modest r = 0.24, so the diagonal is partly mechanical. It is not, however, an artefact: the winner core survives both orthogonalising the two axes (six of nine retained) and rebuilding the export term from an independent, GDP-based measure (all nine retained), and no clean resource economy enters the winner set under either check, so the reordering is structural, not constructed. The map must still not be read as evidence of a causal alignment. Third, the cost proxies are deliberately coarse—carbon intensity is a burden, not a marginal-abatement-cost curve, and vulnerability is a relative exposure index, not a monetary cost. Fourth, green-patent specialisation is volatile for small filers, so the patent component must be read with the trade and relatedness evidence; and the export opportunity is proxied by current trade, which omits services and novel non-HS goods. Fifth, the size-of-prize magnitudes are illustrative scenario arithmetic, not forecasts. Two further methods—transfer entropy to test the assumed patenting-then-exporting direction, and random-matrix denoising of the proximity matrix—would directly strengthen the causal and marginal claims and are left to future work.
6. Conclusions
Measured against a four-condition test that integrates capability with cost coverage, the OECD’s net winners of the climate transition are, on current capability and cost indicators, the economies that already make and export the goods a decarbonising and adapting world demands, on a manageable cost base—a robust core led by Denmark, Germany and the diversified manufacturing exporters—while several clean, low-emission resource economies are, on the indicators used here, cost-bearers whose naive export opportunity does not survive contact with the data. The feature that separates owned capability from borrowed capability and from mere endowment is relatedness; the favourable ledger is, for some winners, earned through capture and, for others, merely inherited through low costs; and a goods-only lens misses the services capability that rehabilitates several apparently misaligned economies. The positions are relative and structural and should not be read as causal conversions, but the central correction is robust to the green-goods definition, the complexity metric and the weighting: in the climate transition, it is capability rather than endowment that co-varies with captured value, and capability, unlike endowment, can be deliberately built. The practical implication for the conditional economies is a smart-specialisation agenda that targets the green domains adjacent to their existing and patent-strong capabilities.
Supplementary Materials
The following supporting information can be downloaded at: https://www.mdpi.com/article/10.3390/su18147424/s1, Table S1: Green-goods basket definitions; Table S2: Computed positions and component z-scores, OECD-38; Table S3: Size-of-prize scenario arithmetic (moved from the body); Table S4: Circularity/non-independence robustness (RC-1); Table S5: Cost-composite dimensional robustness (RC-2); Table S6: Nestedness and economic-fitness statistics (RC-3); Table S7: Monte-Carlo tier probabilities (RC-4, 2000 draws); Table S8: Adaptation-basket definition sensitivity (RC-5); Table S9: China as an out-of-sample reference (RC-8).
Funding
This research received no external funding.
Institutional Review Board Statement
Not applicable.
Informed Consent Statement
Not applicable.
Data Availability Statement
The original contributions presented in this study are derived from public-domain resources: HS92 bilateral-trade data (Atlas of Economic Complexity, atlas.cid.harvard.edu); OECD environment-related-technology patents and bibliometrics and OECD–WTO Balanced Trade in Services (data-explorer.oecd.org); Our World in Data CO2 (ourworldindata.org); the ND-GAIN Country Index (gain.nd.edu); and the APEC and OECD CLEG environmental-goods lists. The computed construct, score, robustness, services and adjacency tables and the analysis code, together with the full HS-code lists for each green-goods basket, are provided as Supplementary Materials and openly archived in the Zenodo repository at https://doi.org/10.5281/zenodo.21298846; the pipeline is deterministic under a fixed random seed and reproduces all reported tables and figures from the public data sources listed above.
Acknowledgments
During the preparation of this manuscript, the author used a large language model (Anthropic Claude Opus 4.8) for drafting and editing assistance and to support the implementation of the analysis code. The author has reviewed and edited all output and takes full responsibility for the content of this publication.
Conflicts of Interest
The author declares no conflicts of interest.
Abbreviations
| OECD | Organisation for Economic Co-operation and Development |
| ECI | Economic Complexity Index |
| RCA | Revealed Comparative Advantage |
| APEC | Asia-Pacific Economic Cooperation |
| CLEG | Combined List of Environmental Goods |
| NODF | Nestedness based on Overlap and Decreasing Fill |
| BaTIS | Balanced Trade in Services |
| ND-GAIN | Notre Dame Global Adaptation Initiative |
References
- Hidalgo, C.A.; Klinger, B.; Barabási, A.-L.; Hausmann, R. The product space conditions the development of nations. Science 2007, 317, 482–487. [Google Scholar] [CrossRef] [Scilit] [PubMed]
- Hidalgo, C.A.; Hausmann, R. The building blocks of economic complexity. Proc. Natl. Acad. Sci. USA 2009, 106, 10570–10575. [Google Scholar] [CrossRef] [Scilit] [PubMed]
- Mealy, P.; Teytelboym, A. Economic complexity and the green economy. Res. Policy 2022, 51, 103948. [Google Scholar] [CrossRef] [Scilit]
- Hamwey, R.; Pacini, H.; Assunção, L. Mapping green product spaces of nations. J. Environ. Dev. 2013, 22, 155–168. [Google Scholar] [CrossRef] [Scilit]
- Hidalgo, C.A. Economic complexity theory and applications. Nat. Rev. Phys. 2021, 3, 92–113. [Google Scholar] [CrossRef] [Scilit]
- Balland, P.-A.; Broekel, T.; Diodato, D.; Giuliani, E.; Hausmann, R.; O’Clery, N.; Rigby, D. The new paradigm of economic complexity. Res. Policy 2022, 51, 104450. [Google Scholar] [CrossRef] [Scilit] [PubMed]
- Ferraz, D.; Falguera, F.P.S.; Mariano, E.B.; Hartmann, D. Linking economic complexity, diversification, and industrial policy with sustainable development: A structured literature review. Sustainability 2021, 13, 1265. [Google Scholar] [CrossRef] [Scilit]
- Stojkoski, V.; Koch, P.; Hidalgo, C.A. Multidimensional economic complexity and inclusive green growth. Commun. Earth Environ. 2023, 4, 130. [Google Scholar] [CrossRef] [Scilit]
- Burke, M.; Hsiang, S.M.; Miguel, E. Global non-linear effect of temperature on economic production. Nature 2015, 527, 235–239. [Google Scholar] [CrossRef] [Scilit] [PubMed]
- Dell, M.; Jones, B.F.; Olken, B.A. What do we learn from the weather? The new climate–economy literature. J. Econ. Lit. 2014, 52, 740–798. [Google Scholar] [CrossRef] [Scilit]
- Bilal, A.; Känzig, D.R. The macroeconomic impact of climate change: Global vs. local temperature. Q. J. Econ. 2026, 141, 889–944. [Google Scholar] [CrossRef] [Scilit]
- Neal, T.; Newell, B.R.; Pitman, A. Reconsidering the macroeconomic damage of severe warming. Environ. Res. Lett. 2025, 20, 044029. [Google Scholar] [CrossRef] [Scilit]
- Diffenbaugh, N.S.; Burke, M. Global warming has increased global economic inequality. Proc. Natl. Acad. Sci. USA 2019, 116, 9808–9813. [Google Scholar] [CrossRef] [Scilit] [PubMed]
- Trust, S.; Saye, L.; Bettis, O.; Bedenham, G.; Hampshire, O.; Lenton, T.M.; Abrams, J.F. Planetary Solvency—Finding Our Balance with Nature; Institute and Faculty of Actuaries & University of Exeter: London, UK, 2025. [Google Scholar]
- Fankhauser, S.; Bowen, A.; Calel, R.; Dechezleprêtre, A.; Grover, D.; Rydge, J.; Sato, M. Who will win the green race? In search of environmental competitiveness and innovation. Glob. Environ. Change 2013, 23, 902–913. [Google Scholar] [CrossRef] [Scilit]
- Rodríguez-Pose, A.; Bartalucci, F. The green transition and its potential territorial discontents. Camb. J. Reg. Econ. Soc. 2024, 17, 339–358. [Google Scholar] [CrossRef]
- Aiginger, K.; Rodrik, D. Rebirth of industrial policy and an agenda for the twenty-first century. J. Ind. Compet. Trade 2020, 20, 189–207. [Google Scholar] [CrossRef] [Scilit]
- Juhász, R.; Lane, N.; Rodrik, D. The new economics of industrial policy. Annu. Rev. Econ. 2024, 16, 213–242. [Google Scholar] [CrossRef] [Scilit]
- Roos, G. Industry Policy and Strategic Industries in Complex OECD Economies. In Industrial Policy, Innovation, and Complexity; IGI Global Scientific Publishing: Hershey, PA, USA, 2025; pp. 1–28. [Google Scholar] [CrossRef] [Scilit]
- Tacchella, A.; Cristelli, M.; Caldarelli, G.; Gabrielli, A.; Pietronero, L. A new metrics for countries’ fitness and products’ complexity. Sci. Rep. 2012, 2, 723. [Google Scholar] [CrossRef] [Scilit] [PubMed]
- Bustos, S.; Gomez, C.; Hausmann, R.; Hidalgo, C.A. The dynamics of nestedness predicts the evolution of industrial ecosystems. PLoS ONE 2012, 7, e49393. [Google Scholar] [CrossRef] [Scilit] [PubMed]
- Strona, G.; Nappo, D.; Boccacci, F.; Fattorini, S.; San-Miguel-Ayanz, J. A fast and unbiased procedure to randomize ecological binary matrices with fixed row and column totals. Nat. Commun. 2014, 5, 4114. [Google Scholar] [CrossRef] [Scilit] [PubMed]
- Rodrik, D. Green industrial policy. Oxf. Rev. Econ. Policy 2014, 30, 469–491. [Google Scholar] [CrossRef] [Scilit]
- Hidalgo, C.A.; Balland, P.-A.; Boschma, R.; Delgado, M.; Feldman, M.; Frenken, K.; Glaeser, E.; He, C.; Kogler, D.F.; Morrison, A.; et al. The Principle of Relatedness. In Unifying Themes in Complex Systems IX; Morales, A.J., Gershenson, C., Braha, D., Minai, A.A., Bar-Yam, Y., Eds.; Springer: Cham, Switzerland, 2018; pp. 451–457. [Google Scholar] [CrossRef] [Scilit]
- Neffke, F.; Henning, M.; Boschma, R. How do regions diversify over time? Industry relatedness and the development of new growth paths in regions. Econ. Geogr. 2011, 87, 237–265. [Google Scholar] [CrossRef] [Scilit]
- Montresor, S.; Quatraro, F. Green technologies and Smart Specialisation Strategies: A European patent-based analysis of the intertwining of technological relatedness and key-enabling-technologies. Reg. Stud. 2020, 54, 1354–1365. [Google Scholar] [CrossRef] [Scilit]
- Santoalha, A.; Boschma, R. Diversifying in green technologies in European regions: Does political support matter? Reg. Stud. 2021, 55, 182–195. [Google Scholar] [CrossRef] [Scilit]
- Growth Lab at Harvard University. The Atlas of Economic Complexity: International Trade Data (HS92), 2020–2024 [Data Set]. 2025. Available online: https://atlas.cid.harvard.edu (accessed on 29 June 2026).
- Organisation for Economic Co-Operation and Development. Environment-Related Technologies and Bibliometric Indicators [Data Set]; OECD Data Explorer; OECD: Paris, France, 2025; Available online: https://data-explorer.oecd.org (accessed on 29 June 2026).
- Ritchie, H.; Roser, M.; Rosado, P. CO2 and Greenhouse Gas Emissions [Data Set]; Our World in Data. 2023. Available online: https://ourworldindata.org/co2-and-greenhouse-gas-emissions (accessed on 29 June 2026).
- Notre Dame Global Adaptation Initiative. ND-GAIN Country Index [Data Set]; University of Notre Dame: Notre Dame, IN, USA, 2026; Available online: https://gain.nd.edu/our-work/country-index/ (accessed on 29 June 2026).
- Brooks, N.; Adger, W.N.; Kelly, P.M. The determinants of vulnerability and adaptive capacity at the national level and the implications for adaptation. Glob. Environ. Change 2005, 15, 151–163. [Google Scholar] [CrossRef] [Scilit]
- Asia-Pacific Economic Cooperation. APEC List of Environmental Goods; Annex C, 2012 Leaders’ Declaration; APEC: Singapore, 2012; Available online: https://www.apec.org/meeting-papers/leaders-declarations/2012/2012_aelm/2012_aelm_annexc (accessed on 29 June 2026).
- Sauvage, J. The Stringency of Environmental Regulations and Trade in Environmental Goods; OECD Trade and Environment Working Papers No. 2014/03; OECD Publishing: Paris, France, 2014. [Google Scholar] [CrossRef]
- International Energy Agency. The Future of Cooling; IEA: Paris, France, 2018; Available online: https://www.iea.org/reports/the-future-of-cooling (accessed on 29 June 2026).
- World Trade Organization; Organisation for Economic Co-Operation and Development. WTO–OECD Balanced Trade in Services Dataset (BaTIS), BPM6 [Data Set]. Global Services Trade Data Hub. 2025. Available online: https://www.wto.org/english/res_e/statis_e/gstdh_batis_e.htm (accessed on 29 June 2026).
- Balassa, B. Trade liberalisation and ‘revealed’ comparative advantage. Manch. Sch. 1965, 33, 99–123. [Google Scholar] [CrossRef] [Scilit]
- Reynolds, C.; Agrawal, M.; Lee, I.; Zhan, C.; Li, J.; Taylor, P.; Mares, T.; Morison, J.; Angelakis, N.; Roos, G. A sub-national economic complexity analysis of Australia’s states and territories. Reg. Stud. 2018, 52, 715–726. [Google Scholar] [CrossRef] [Scilit]
- Mealy, P.; Farmer, J.D.; Teytelboym, A. Interpreting economic complexity. Sci. Adv. 2019, 5, eaau1705. [Google Scholar] [CrossRef] [Scilit] [PubMed]
- Almeida-Neto, M.; Guimarães, P.; Guimarães, P.R., Jr.; Loyola, R.D.; Ulrich, W. A consistent metric for nestedness analysis in ecological systems: Reconciling concept and measurement. Oikos 2008, 117, 1227–1239. [Google Scholar] [CrossRef] [Scilit]
- Bascompte, J.; Jordano, P.; Melián, C.J.; Olesen, J.M. The nested assembly of plant–animal mutualistic networks. Proc. Natl. Acad. Sci. USA 2003, 100, 9383–9387. [Google Scholar] [CrossRef] [Scilit] [PubMed]
- Saracco, F.; Di Clemente, R.; Gabrielli, A.; Squartini, T. Randomizing bipartite networks: The case of the World Trade Web. Sci. Rep. 2015, 5, 10595. [Google Scholar] [CrossRef] [Scilit] [PubMed]
- Verpoort, P.C.; Gast, L.; Hofmann, A.; Ueckerdt, F. Impact of global heterogeneity of renewable energy supply on heavy industrial production and green value chains. Nat. Energy 2024, 9, 491–503. [Google Scholar] [CrossRef] [Scilit]
- Roos, G.; Voloshenko, K.Y.; Drok, T.E.; Zverev, Y.M. European countries’ typology by the intensity of transboundary cooperation and its impact on the economic complexity level. Geogr. Environ. Sustain. 2020, 13, 6–15. [Google Scholar] [CrossRef] [Scilit]
- Gereffi, G.; Humphrey, J.; Sturgeon, T. The governance of global value chains. Rev. Int. Polit. Econ. 2005, 12, 78–104. [Google Scholar] [CrossRef] [Scilit]
- Humphrey, J.; Schmitz, H. How does insertion in global value chains affect upgrading in industrial clusters? Reg. Stud. 2002, 36, 1017–1027. [Google Scholar] [CrossRef] [Scilit]
- Javorcik, B.S. Does foreign direct investment increase the productivity of domestic firms? In search of spillovers through backward linkages. Am. Econ. Rev. 2004, 94, 605–627. [Google Scholar] [CrossRef] [Scilit]
- Giuliani, E.; Pietrobelli, C.; Rabellotti, R. Upgrading in global value chains: Lessons from Latin American clusters. World Dev. 2005, 33, 549–573. [Google Scholar] [CrossRef] [Scilit]
- Cohen, W.M.; Levinthal, D.A. Absorptive capacity: A new perspective on learning and innovation. Adm. Sci. Q. 1990, 35, 128–152. [Google Scholar] [CrossRef] [Scilit]
- Pahl, S.; Timmer, M.P. Do global value chains enhance economic upgrading? A long view. J. Dev. Stud. 2020, 56, 1683–1705. [Google Scholar] [CrossRef] [Scilit]
- Rodrik, D. Premature deindustrialization. J. Econ. Growth 2016, 21, 1–33. [Google Scholar] [CrossRef] [Scilit]
- Balland, P.-A.; Boschma, R.; Crespo, J.; Rigby, D.L. Smart specialization policy in the European Union: Relatedness, knowledge complexity and regional diversification. Reg. Stud. 2019, 53, 1252–1268. [Google Scholar] [CrossRef] [Scilit]
- Criscuolo, C.; Gonne, N.; Kitazawa, K.; Lalanne, G. An Industrial Policy Framework for OECD Countries: Old Debates, New Perspectives; OECD Science, Technology and Industry Policy Papers No. 127; OECD Publishing: Paris, France, 2022. [Google Scholar] [CrossRef]
- Allan, B.B.; Lewis, J.I.; Oatley, T. Green industrial policy and the global transformation of climate politics. Glob. Environ. Politics 2021, 21, 1–19. [Google Scholar] [CrossRef] [Scilit]

Disclaimer/Publisher’s Note: The statements, opinions and data contained in all publications are solely those of the individual author(s) and contributor(s) and not of MDPI and/or the editor(s). MDPI and/or the editor(s) disclaim responsibility for any injury to people or property resulting from any ideas, methods, instructions or products referred to in the content. |
© 2026 by the author. Licensee MDPI, Basel, Switzerland. This article is an open access article distributed under the terms and conditions of the Creative Commons Attribution (CC BY) license.