


Abstract
Accurate crop mapping in middle-to-high latitude agricultural basins is essential for food security, agricultural management, and sustainable land-use planning. However, crop classification in these regions remains challenging because fragmented field patterns, mixed pixels, and overlapping phenological stages often lead to severe spectral confusion among major dryland crops. To address this issue, this study developed a Phenology–Spectral Dual-Constrained Strategy (PS-DCS) by integrating agronomic knowledge with physically constrained spectral features. The proposed framework identified August as the optimal observation window based on crop phenological divergence. Wheat was first extracted using a spectral fingerprint combining the Chlorophyll Index Red Edge (CI_RE) and Redness index. Subsequently, maize and soybean were separated within the non-wheat mask using the B6 red-edge band selected through feature separability analysis. Validation based on Sentinel-2 time-series imagery and 1056 independent field samples collected in 2025 yielded an Overall Accuracy of 95.36% with a Kappa coefficient of 0.928. Compared with RF, XGBoost, and CNN models, PS-DCS maintained competitive classification performance while substantially reducing dependence on large training datasets and complex parameter tuning. Cross-year validation during 2022–2024 further demonstrated stable spatial transferability without threshold recalibration. These results indicate that translating agronomic mechanisms into physically interpretable remote sensing rules provides an effective and transparent framework for high-precision crop mapping and long-term agricultural monitoring in complex agricultural landscapes.
1. Introduction
Accurate information on crop spatial distribution and planting structure is essential for agricultural production monitoring [1], crop-yield estimation, food-security assessment, and sustainable land management in middle-to-high latitude agricultural basins [2]. These regions are generally characterized by fragmented agricultural landscapes, diverse land-cover types, and strong spatial heterogeneity, which increase the complexity of agricultural monitoring and land-use assessment [3]. Wheat, maize, and soybean constitute the dominant dryland cropping system in the study area and account for the majority of cultivated land. Their spatial distribution directly influences regional agricultural production and resource allocation [4].
Consequently, satellite remote sensing, particularly Sentinel-2 multispectral imagery with its high spatial resolution and red-edge spectral bands, has become an important approach for crop mapping and agricultural land-use monitoring because of its synoptic coverage, repetitive observations, and long-term monitoring capability. These characteristics enable effective characterization of crop spectral and phenological differences, providing an important foundation for the proposed classification framework [5].
To meet the increasing demand for high-spatiotemporal-resolution information, remote sensing-based crop classification has gradually evolved from single-date analyses to time-series approaches [6]. Benefiting from the increasing availability of dense satellite observations, Machine learning methods, including random forest (RF), support vector machine (SVM), and extreme gradient boosting (XGBoost) [7], together with deep learning approaches such as convolutional neural networks (CNNs), have substantially improved the extraction of complex spectral and temporal features from remote sensing data [8]. These methods have been widely applied in crop mapping and have achieved promising classification performance across various agricultural regions [9]. Nevertheless, most existing approaches rely heavily on large quantities of representative training samples and extensive parameter optimization, which may limit their applicability in data-scarce and spatially heterogeneous agricultural landscapes [10].
Despite these advances, several limitations still constrain the practical application of purely data-driven models [11]. First, these approaches generally require large amounts of high-quality labeled samples, whereas field data collection in middle-to-high latitude agricultural regions is often labor-intensive and limited [12]. Second, the decision-making processes of many machine learning and deep learning models remain insufficiently interpretable from an agronomic and physiological perspective [13]. Third, strong inter-annual climatic variability may alter crop growth dynamics and phenological timing, thereby reducing the transferability and robustness of models trained using data from a single year [14].
In contrast, classification approaches guided by agronomic knowledge and physical rules are generally more interpretable and less dependent on large training datasets, making them suitable for operational crop mapping [15]. However, their application in complex agricultural landscapes remains challenging because severe spectral similarity often occurs among crops during overlapping phenological stages. In middle-to-high latitude agricultural basins, wheat, maize, and soybean are commonly cultivated under a single-cropping system, resulting in substantial phenological overlap]. In particular, maize and soybean frequently exhibit similar canopy structures and spectral responses during the peak growing season, making them difficult to distinguish using conventional vegetation indices such as the Normalized Difference Vegetation Index (NDVI) [16]. Existing rule-based approaches mainly rely on static spectral indices (e.g., NDVI- or EVI-based thresholds) or empirical decision rules derived from single-date imagery, and rarely integrate seasonal phenological dynamics with optimal observation windows, thereby limiting classification performance in heterogeneous agricultural landscapes [17].
To address these challenges, this study developed a Phenology–Spectral Dual-Constrained Strategy (PS-DCS) by integrating crop phenological dynamics with physically meaningful spectral features. The proposed framework identifies optimal crop separation windows from Sentinel-2 time-series observations and constructs interpretable classification rules based on key spectral fingerprints. The specific objectives of this study are to:
- (1)
- identify the optimal temporal windows for discriminating wheat, maize, and soybean based on crop phenological characteristics;
- (2)
- develop interpretable phenology–spectral classification rules for crop mapping under limited training-sample conditions;
- (3)
- evaluate the classification performance and cross-year transferability of the proposed strategy through comparisons with RF, CNN, and XGBoost models, together with multi-year validation.
This study provides an interpretable phenology–spectral framework for crop mapping in middle-to-high latitude agricultural regions and supports long-term agricultural monitoring under limited training-sample conditions.
2. Study Area
2.1. Geographic Location and Physical Geography
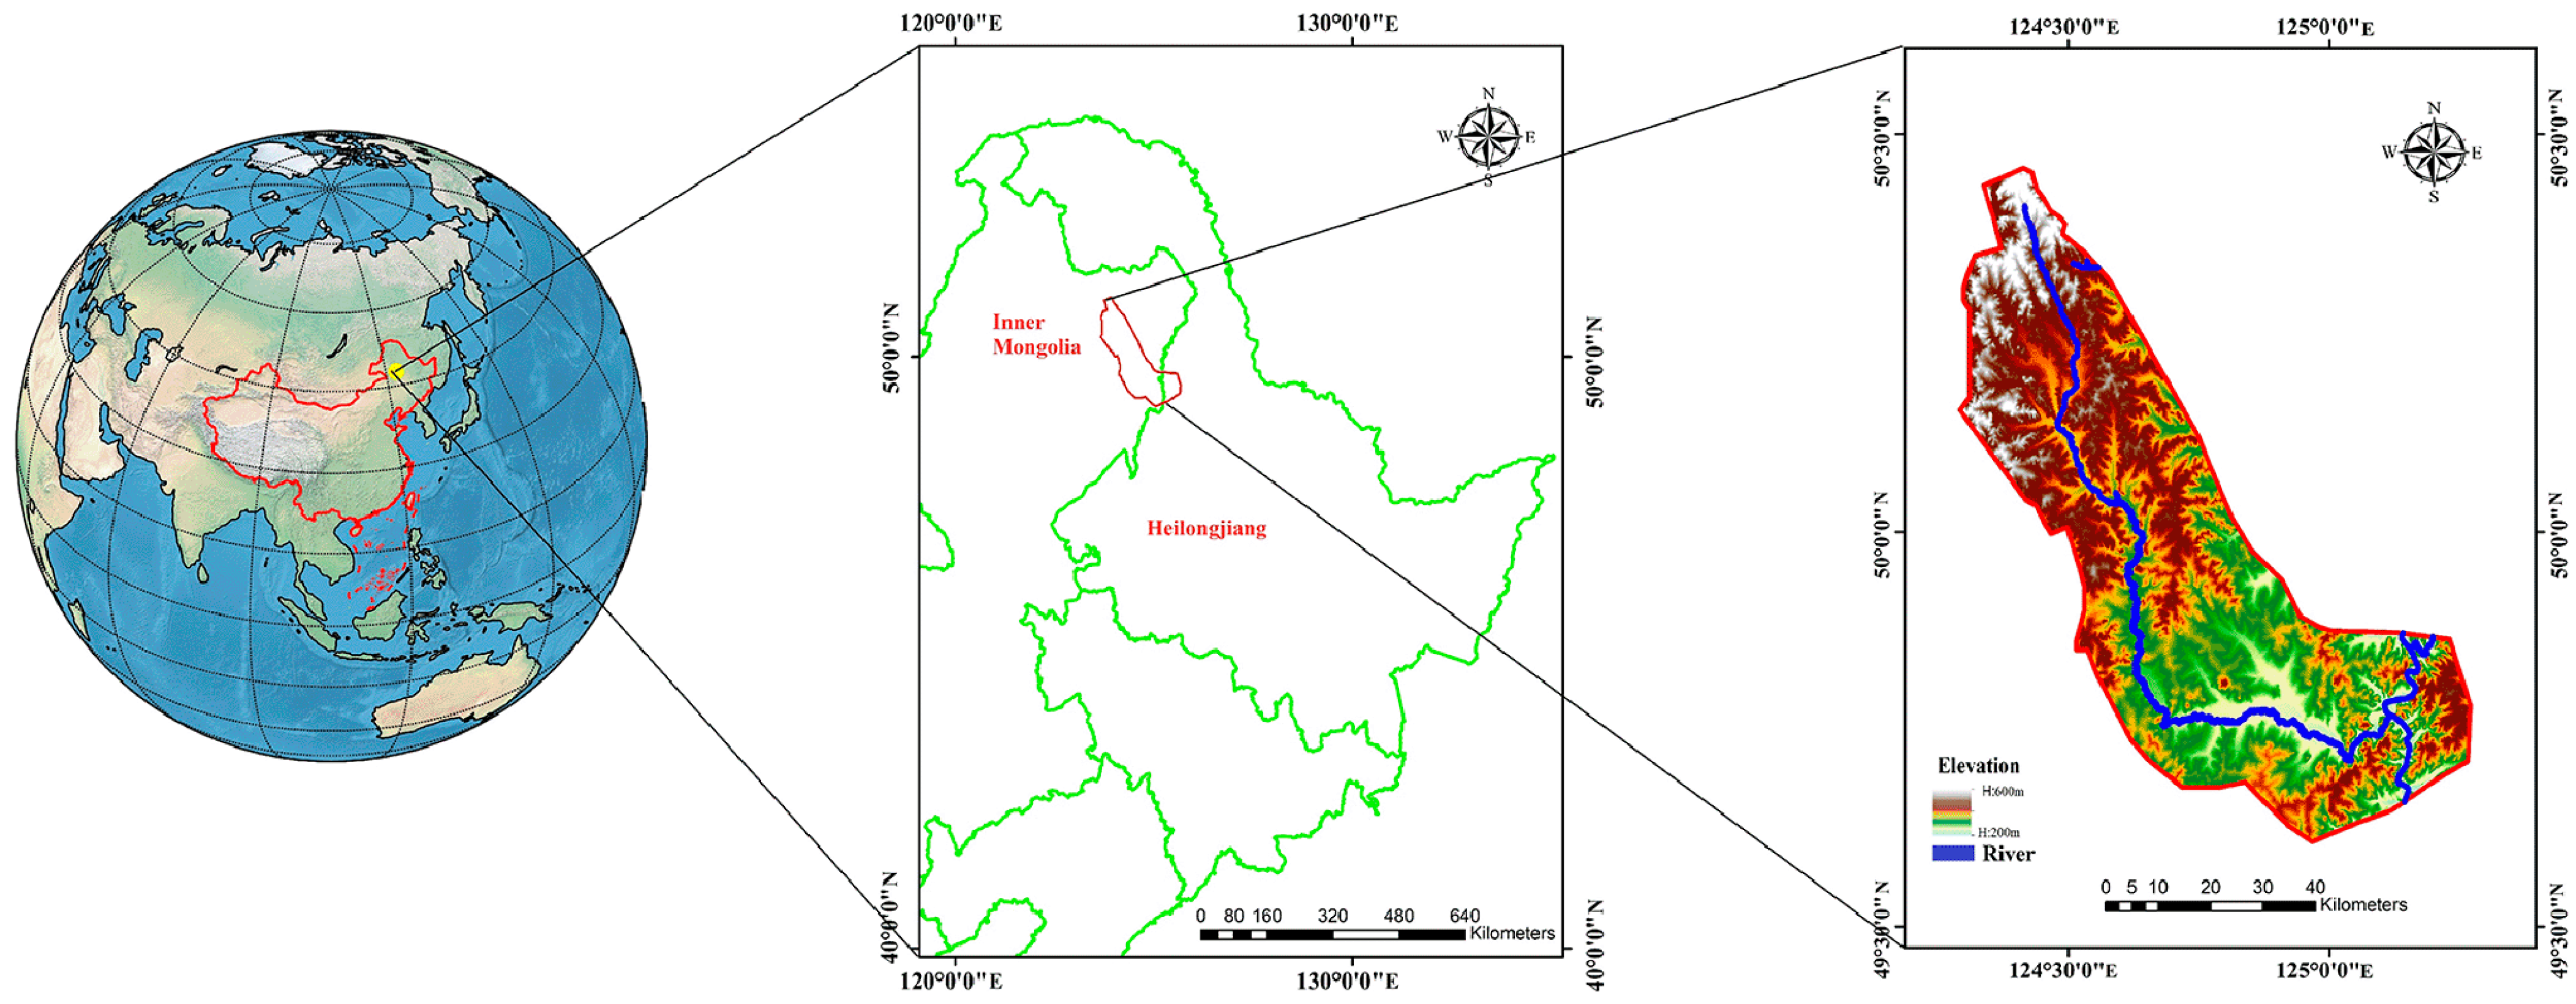
The study area is located in the Ouken River Basin on the right bank of the upper Heilongjiang (Amur) River (approximately 49–50° N, 123–125° E), covering an area of approximately 2600 km2. The basin is situated within the ecotonal transition zone between the eastern foothills of the Greater Khingan Range and the Songnen Plain (Figure 1). The study area is characterized by a typical cold-temperate continental monsoon climate, with long, cold winters and short, cool summers. The annual mean temperature ranges from −1 to 3 °C, while the frost-free period lasts only 90–110 days. Annual precipitation ranges from 400 to 600 mm, with most rainfall occurring between June and September. Owing to limited thermal resources and the synchronization of precipitation and temperature during the growing season, agriculture in the region is dominated by a single-cropping dryland farming system. Maize, soybean, and spring wheat are the principal crops cultivated in the basin.
Figure 1.
Study area of the project.
Due to the short growing season, the phenological stages of major crops substantially overlap, resulting in pronounced spectral similarity among crop types during the growing season. In addition, heterogeneous topographic conditions and variable field configurations further increase classification uncertainty [18]. These characteristics make the study area a representative case for evaluating high-precision crop mapping approaches in complex middle-to-high latitude agricultural landscapes.
2.2. Agro-Ecology and Cropping Systems
The study area is an important commodity grain production region in middle-to-high latitude China, characterized by relatively large and contiguous agricultural fields. According to field surveys and statistical yearbook records, spring wheat, maize, and soybean are the dominant crops in the study area and constitute the principal dryland cropping system.
Because of the short frost-free period, the growing seasons of these crops are highly concentrated, resulting in substantial phenological overlap [19]. Spring wheat is typically sown in late April, reaches the heading stage in late July, and matures in early to mid-August. In contrast, maize and soybean are generally sown in early May and remain in active vegetative and reproductive growth stages during mid- to late August.
3. Methodology
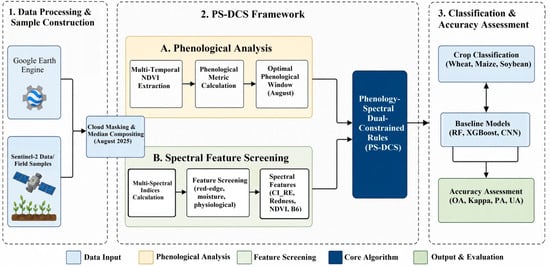
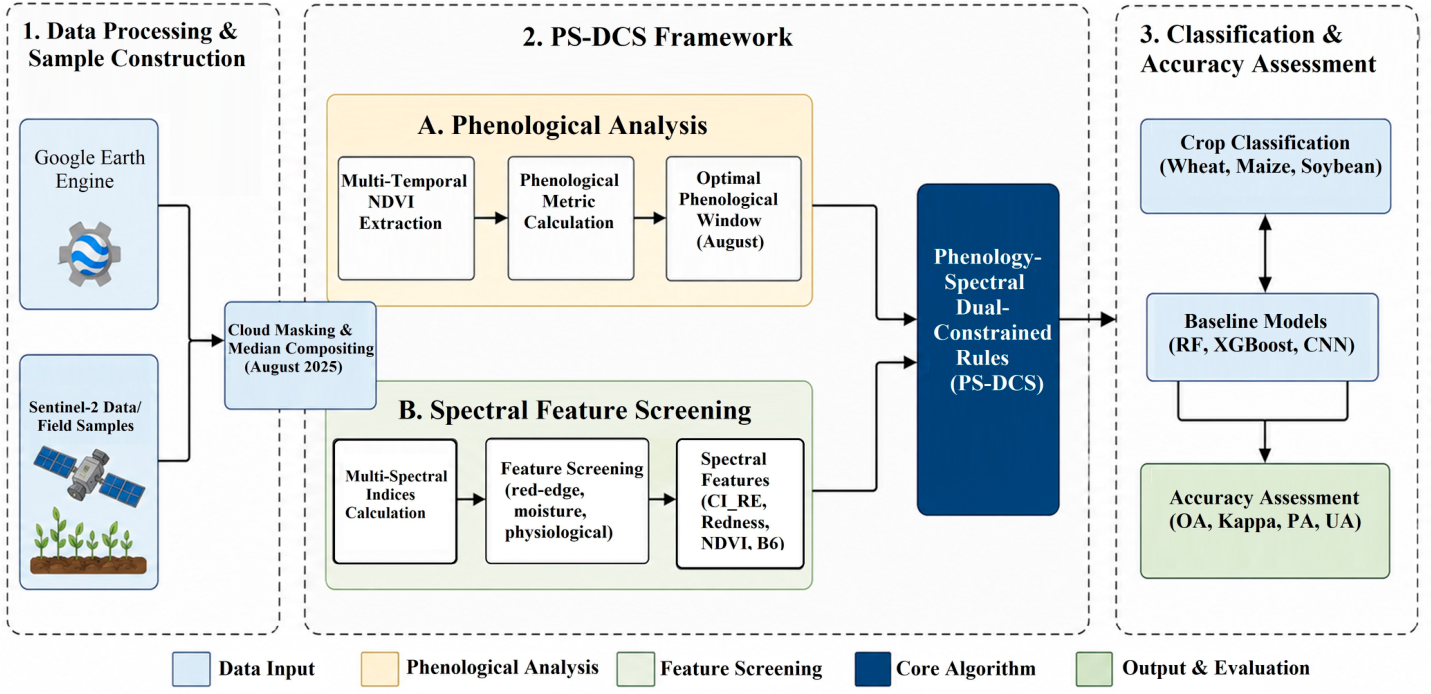
All data processing and analyses were conducted on the Google Earth Engine (GEE) cloud computing platform [20]. The platform provides cloud-based computing resources for efficient processing of Sentinel-2 time-series imagery and spectral feature extraction. The overall workflow of the proposed PS-DCS framework is illustrated in Figure 2.
Figure 2.
Workflow of the proposed Phenology-Spectral Dual-Constrained Strategy (PS-DCS) for crop classification. It includes (1) Sentinel-2-based data processing and sample construction in Google Earth Engine; (2) integration of optimal phenological windows and spectral features to build dual-constrained rules; and (3) crop classification (wheat, maize, soybean) with accuracy assessment and cross-year validation against baseline models.
3.1. Multi-Source Remote Sensing Data Preprocessing and Non-Agricultural Background Masking
Sentinel-2 MSI Level-2A surface reflectance products were used in this study. To minimize cloud contamination, clouds, cirrus, and cloud shadows were identified and masked during preprocessing using the QA60 quality assurance band and cloud-shadow masking procedures implemented in Google Earth Engine. Monthly cloud-free composite images were subsequently generated using a temporal median compositing approach, which further reduced the influence of residual clouds and other outliers [21].
In addition, a cropland mask was generated to exclude non-agricultural land cover types, including forests, grasslands, water bodies, and built-up areas, thereby reducing background interference during crop classification. For a monthly image collection {I1, I2, …, In} after cloud masking, the median composite for each pixel location and spectral band b was calculated as follows:
where represents the reflectance value of the Sentinel-2 image at pixel location for spectral band b and n denotes the total number of cloud-masked images acquired during the corresponding month. Compared with mean compositing, the median compositing approach is less sensitive to residual noise and outliers, resulting in more stable monthly composite images for subsequent spectral feature extraction and crop classification [22].
3.2. Ground Truth Sample Collection
To evaluate the performance and transferability of the proposed classification strategy, a ground truth dataset covering the entire study area was constructed. Ground truth samples were collected using a stratified random sampling strategy to ensure adequate representation of different crop types and spatial heterogeneity across the basin [23]. This sampling design enabled the characterization of variations in crop distribution under diverse environmental and agricultural conditions within the study area.
3.2.1. Field Investigation and Multi-Source Digital Augmentation
Ground truth samples were collected through a two-stage strategy combining field investigation and high-resolution image interpretation.
- (1)
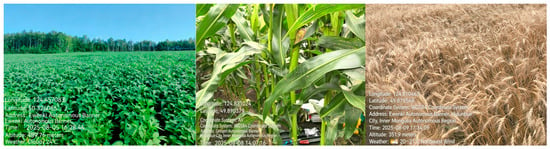
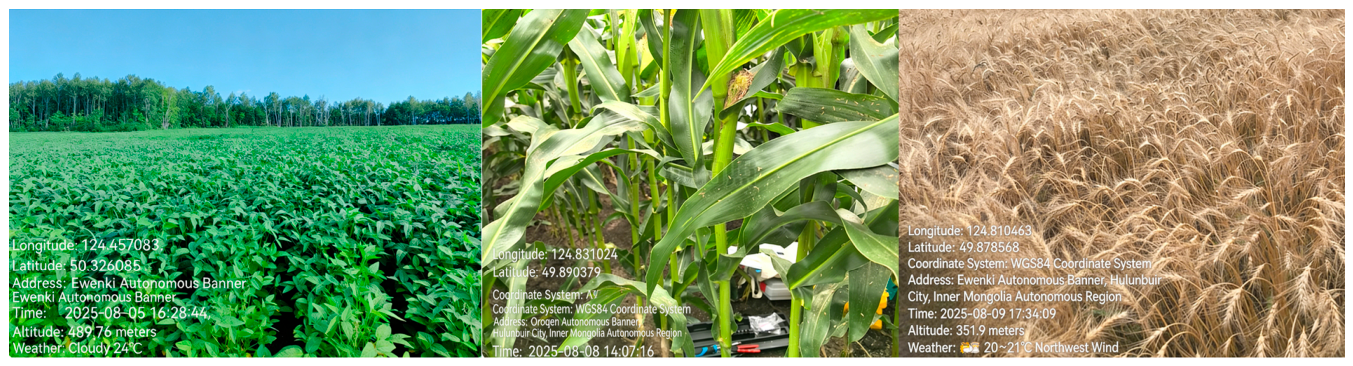
- Synchronous field survey. A basin-wide field campaign was conducted during the key phenological period from 1 to 15 August 2025. Sampling parcel locations were recorded using a Global Positioning System (GPS), resulting in more than 300 reference samples. Survey routes were systematically designed to cover both large, contiguous cropland areas and fragmented agricultural fields distributed across different parts of the basin (Figure 3). This sampling strategy ensured adequate representation of the spatial variability in crop distribution and field conditions within the study area.Figure 3. Distribution of field investigation sampling locations.
- (2)
- High-resolution imagery-assisted sample augmentation. Based on field observations and prior agronomic knowledge, sub-meter-resolution imagery acquired from Google Earth Pro (August 2025) was visually interpreted to supplement samples in areas that were difficult to access during field surveys, particularly fragmented agricultural parcels. To ensure sample reliability, all visually interpreted samples were cross-checked against field observations and crop phenological characteristics [24]. Following this procedure, a total of 1056 ground truth samples were obtained for subsequent model training and validation.
3.2.2. Sample Partitioning and Accuracy Assessment
To ensure the reliability of model evaluation, the 1056 ground-truth samples were partitioned into a training dataset (70%) and an independent validation dataset (30%) at the field-parcel level. Specifically, the training dataset comprised 218 wheat, 248 maize, and 274 soybean samples, while the validation dataset consisted of 93 wheat, 106 maize, and 117 soybean samples. The training samples were used for feature screening, threshold optimization, and model construction, whereas the validation samples were reserved exclusively for the final accuracy assessment. To minimize the influence of spatial autocorrelation and avoid information leakage, each field parcel was assigned entirely to either the training or validation dataset, ensuring that no parcel contributed samples to both subsets.
Classification performance was evaluated using Overall Accuracy (OA), Producer’s Accuracy (PA), User’s Accuracy (UA), F1-score, and the Kappa coefficient based on the independent validation dataset.
3.3. Phenological Decoupling and Observation Window Positioning Based on Temporal Trajectories
Accurate identification of the optimal observation window is critical for improving classification performance [19]. In this study, NDVI time-series trajectories of target crops were analyzed over the entire growing season (April–September). The NDVI is calculated as:
where and represent the reflectance of the near-infrared (B8) and red (B4) bands of Sentinel-2, respectively. Because of the short growing season in middle-to-high latitude regions, the vegetative growth periods of the three major crops largely overlap during June and July, resulting in substantial spectral similarity. In August, however, distinct phenological differences become evident. Spring wheat enters the senescence stage, whereas maize and soybean remain in active reproductive growth stages. To quantitatively characterize these phenological differences and identify the optimal crop separation window [25], the monthly mean NDVI trajectories derived from the labeled crop samples described in Section 4.2 were used to calculate the Phenological Separability Index (PSI), which measures the divergence between senescent wheat and actively growing maize and soybean:
Analysis of multi-year mean NDVI trajectories indicated that the PSI reached its maximum in August. Accordingly, August was identified as the optimal phenological window for crop classification. This window was subsequently used for the extraction of discriminative spectral features [26].
3.4. Construction of Multi-Dimensional Spectral Feature Pool and Fingerprint Screening
3.4.1. Construction of Multi-Dimensional Feature Pool
Within the identified optimal observation window, an initial feature space comprising 17 variables was constructed (Table 1). These variables were grouped into two categories: spectral bands and vegetation indices.
- (1)
- Spectral bands: Ten Sentinel-2 spectral bands were selected, including the visible bands (B2, B3, and B4), red-edge bands (B5, B6, B7, and B8A), the near-infrared band (B8), and shortwave infrared bands (B11 and B12) [27].
- (2)
- Vegetation indices: Seven vegetation indices representing crop greenness, chlorophyll content, moisture conditions, and senescence characteristics were selected (Table 1). These included NDVI and EVI for vegetation greenness, the Red-Edge Chlorophyll Index (CI_RE) for chlorophyll estimation, the Normalized Difference Senescence Index (NDSI) for vegetation senescence, and the Redness and Yellowness indices for characterizing crop maturation and senescence [16].
Table 1.
Spectral indices and their biophysical interpretation used in this study.
3.4.2. Spectral Fingerprint Screening Based on Cohen’s d
To identify the most discriminative spectral features and reduce feature redundancy, Cohen’s d effect size was combined with agronomic knowledge for spectral fingerprint screening [32]. Cohen’s d was calculated as follows:
where and are the mean values of a given spectral feature for crop types A and B, respectively; and are the corresponding standard deviations; and denote the sample sizes; and is the pooled standard deviation. Larger values of Cohen’s d indicate greater spectral separability between crop types. Based on this metric, key spectral features closely associated with crop physiological characteristics were selected to construct the subsequent physically based threshold rules [33].
3.5. Construction of Physical Constraint Rules and Cascaded Classification
This study developed a Phenology–Spectral Dual-Constrained Strategy (PS-DCS) that performs crop classification through a cascaded sequence of physically interpretable threshold rules. The classification procedure follows a hierarchical framework, progressing from easily separable crops to spectrally similar crop types.
To avoid data leakage, all classification thresholds were determined exclusively using the training samples, whereas the independent test samples were strictly excluded from the threshold optimization process [34].
- (1)
- Priority extraction of wheat using physical constraints. Spring wheat enters the senescence stage in August, exhibiting lower chlorophyll content, higher red reflectance, and reduced vegetation greenness than maize and soybean [35]. Based on these phenological characteristics, wheat was identified using three spectral constraints, including the Red-Edge Chlorophyll Index (CI_RE), the Redness Index, and NDVI. A pixel was classified as wheat only when all three threshold conditions were simultaneously satisfied:
- (2)
- Classification of maize and soybean. The non-wheat cropland area was first defined as:
Maize and soybean were subsequently distinguished within the non-wheat mask. Although both crops remain in active growth stages during August, differences in canopy structure and chlorophyll distribution lead to distinct red-edge spectral responses, providing a basis for their discrimination [37].
Spectral fingerprint selection. Based on feature importance evaluation and spectral difference analysis, the Sentinel-2 Red-Edge band 2 (B6) (740 nm) was selected as the key feature for distinguishing maize and soybean. The distributions of B6 reflectance for the two crops were analyzed using the training samples and exhibited a clear bimodal pattern, indicating good spectral separability. Accordingly, the optimal threshold () was determined by maximizing the between-class variance using the Otsu method:
where denotes the set of candidate thresholds, and represents the between-class variance corresponding to threshold . The resulting threshold was subsequently used to distinguish maize from soybean.
Where kappa(t) denotes the classification Kappa coefficient (or F1-score) at a given threshold The optimal threshold was determined by performing a stepwise search within the feature space to maximize classification performance on the training dataset [38].
Based on the identified optimal threshold , a univariate decision model was constructed as follows:
Although multiple spectral features exhibited strong separability between maize and soybean, only the feature with the highest discriminative capability (Sentinel-2 Band 6) was retained for the final threshold determination. This selection was based on the feature screening results presented in Section 4.2.2, where Band 6 achieved the largest Cohen’s d value among all candidate features. Therefore, the final rule was intentionally simplified to a single physically interpretable threshold, improving model transparency and operational efficiency without sacrificing classification accuracy.
3.6. Setup of Baseline Comparison Models
To evaluate the effectiveness of the proposed PS-DCS strategy, three representative data-driven models, namely Random Forest (RF), eXtreme Gradient Boosting (XGBoost), and Convolutional Neural Network (CNN), were selected for comparison. To ensure a fair and unbiased comparison, all baseline models were trained and evaluated using the same August composite feature set and the same training and validation datasets as the proposed PS-DCS framework. Hyperparameters for each model were optimized using the training dataset, and classification performance was assessed on the independent validation dataset.
3.7. Accuracy Assessment
Classification performance was assessed using confusion matrices. The evaluation metrics included Overall Accuracy (OA), Kappa coefficient, User’s Accuracy (UA), Producer’s Accuracy (PA), and F1-score. Their formulations are given as follows:
where the number of crop classes, N is the total number of validation samples, denotes the number of correctly classified samples in class , is the total number of reference samples in class , and is the total number of samples classified as class . Producer’s Accuracy (PA) is defined as the proportion of correctly classified samples relative to the total number of reference samples for a given class, whereas User’s Accuracy (UA) is the proportion of correctly classified samples relative to the total number of samples assigned to that class [39].
4. Experimental Results and Analysis
4.1. Construction of Ground Truth Samples and Verification of Spatial Representativeness
The final dataset comprised 1056 independent samples representing the three dominant crop types in the study area. Specifically, wheat accounted for 311 samples (29.5%), maize for 354 samples (33.5%), and soybean for 391 samples (37.0%). The relatively balanced sample proportions reduced potential class imbalance during model training and evaluation.
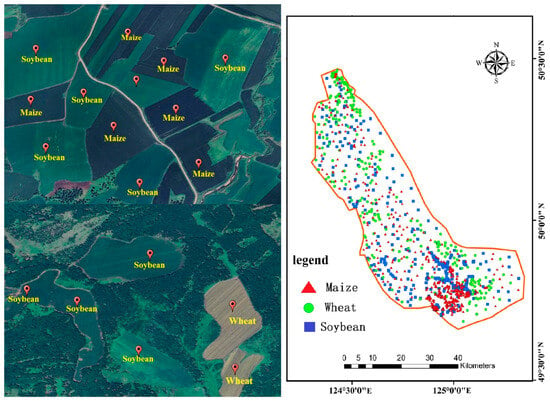
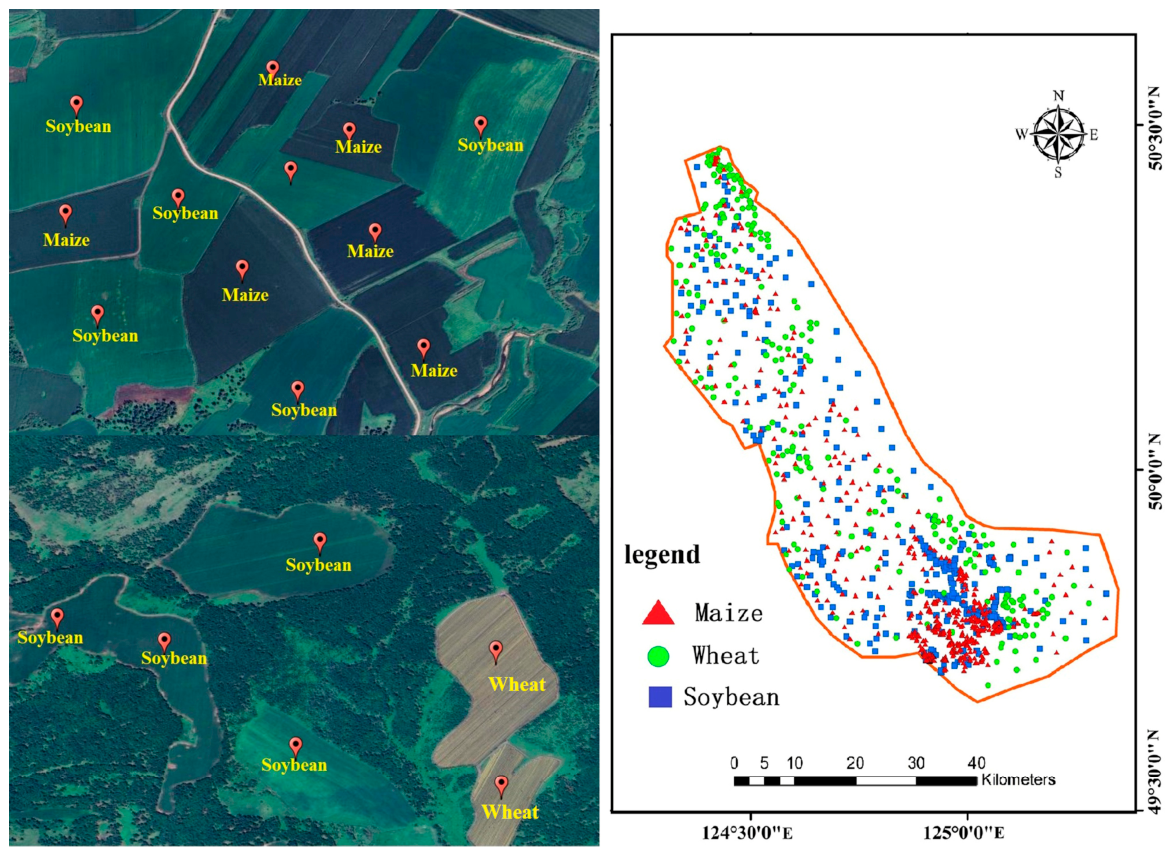
Spatial inspection confirmed that the samples were well distributed across the study area, covering both large contiguous agricultural fields and fragmented cropland parcels (Figure 4). This spatial distribution adequately represented the major agricultural landscapes and cropping patterns within the study area, providing a reliable basis for subsequent model training and accuracy assessment. To ensure an unbiased evaluation, the sample dataset was divided into independent training and validation subsets. The training samples were used for feature screening, threshold optimization, and model construction, whereas the remaining validation samples were reserved exclusively for the final accuracy assessment. To reduce the influence of spatial autocorrelation, training and validation samples were selected from different field parcels, ensuring that no parcel contributed samples to both subsets.
Figure 4.
High-resolution imagery-assisted sampling and spatial distribution of ground truth samples.
4.2. Feature Engineering and Physical Threshold Optimization
A feature engineering framework was developed to identify discriminative spectral characteristics for crop classification. The framework integrates multi-dimensional feature construction, statistical separability analysis, and threshold optimization. By combining crop phenological information with spectral response characteristics, key spectral fingerprints were identified and subsequently used to establish physically interpretable classification rules [40].
4.2.1. Feature Separability Analysis and Selection Results
Based on the multi-spectral information provided by Sentinel-2 imagery, an initial feature space containing 17 variables was constructed (Table 2). The feature space comprised two categories: spectral bands and spectral indices.
Table 2.
Remote Sensing Feature Set Used in This Study.
- (1)
- Spectral bands (10). Ten Sentinel-2 bands were selected, including visible bands, red-edge bands (B5, B6, and B7), and shortwave infrared bands.
- (2)
- Spectral indices (7). Seven vegetation indices related to crop growth status, chlorophyll content, moisture conditions, and senescence characteristics were included (Table 2).
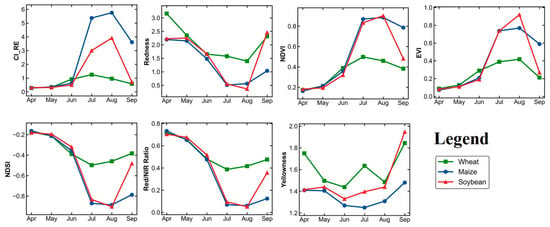
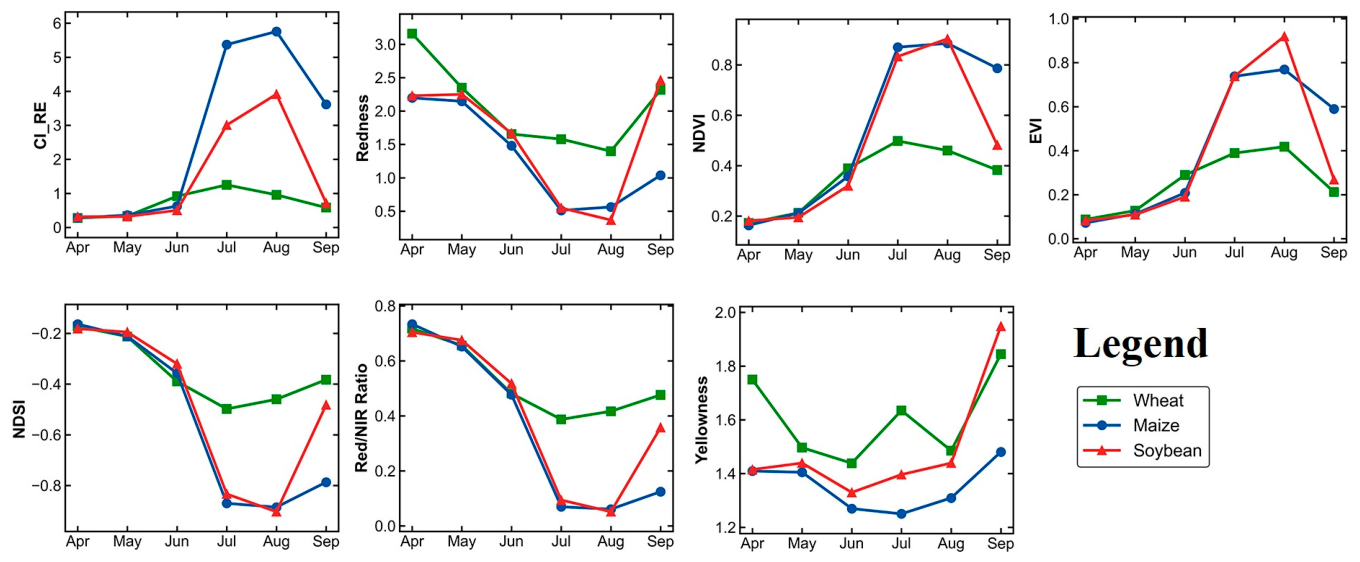
To identify the optimal observation window for crop discrimination, spectral dynamics of the three major crops were analyzed throughout the growing season (April–September). Figure 5 presents the monthly trajectories of representative spectral features. The temporal profiles showed that NDVI and EVI exhibited substantial overlap during the peak vegetative period (June–July), resulting in limited discrimination among crop types. In contrast, pronounced phenological divergence occurred in August. During this period, spring wheat rapidly entered the senescence stage, accompanied by a marked decline in CI_RE and an increase in the Redness index, whereas maize and soybean remained in active growth stages. These contrasting phenological responses provided the basis for selecting August as the optimal observation window. Spectral feature values extracted from labeled wheat, maize, and soybean samples were subsequently analyzed using descriptive statistics and Cohen’s d effect sizes to quantify inter-crop separability [37].
Figure 5.
Comparative analysis of spectral characteristics across different months.
The analysis of Cohen’s d effect sizes revealed that spectral separability among crop types was highest in August (Figure 6a,b). During this period, key spectral features exhibited the largest differences between wheat and maize, as well as between wheat and soybean. In contrast, the separability between maize and soybean remained relatively lower but was still sufficient for discrimination using red-edge features. Therefore, August was identified as the optimal observation window for subsequent feature extraction and crop classification.
Figure 6.
Monthly variations in spectral separability quantified using Cohen’s d effect size. (a) Spectral separability between wheat and maize/soybean. (b) Spectral separability between maize and soybean. Separability was quantified using Cohen’s d, calculated from the mean difference between crop classes normalized by the pooled standard deviation.
4.2.2. Feature Screening Based on Statistical Effect Size
The discriminative capability of each spectral feature was quantified using Cohen’s d effect size. Features exhibiting large inter-crop differences and clear physiological relevance were selected for subsequent rule construction.
- (1)
- Wheat identification
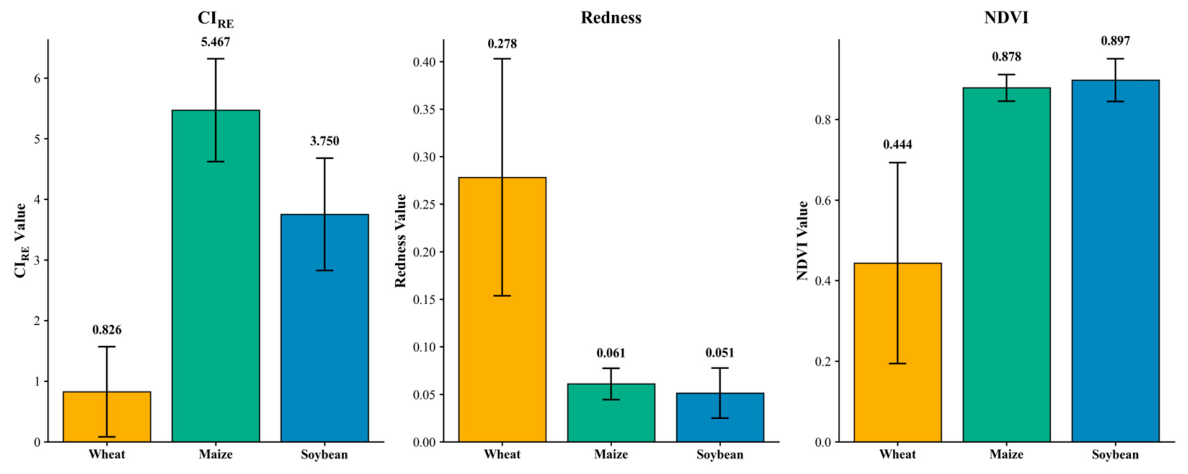
In the study area, spring wheat entered the senescence stage in August, accompanied by chlorophyll degradation and canopy yellowing. In contrast, maize and soybean remained in active growth stages, maintaining relatively high canopy greenness [30]. This phenological divergence resulted in distinct spectral responses among crop types. Based on iterative analysis of feature separability and threshold optimization, three features, namely CI_RE, Redness, and NDVI, were selected for wheat identification (Figure 7). During August, wheat exhibited lower CI_RE values and higher Redness values than maize and soybean. As a consequence, wheat occupied a distinct region in the multi-dimensional feature space, facilitating its separation from other crop types [31].
Figure 7.
Comparison of key spectral features (CI_RE, Redness, and NDVI) for wheat, maize, and soybean in August 2025. Error bars represent ±1 standard deviation.
The final decision rule was defined as: , where the thresholds were optimized using the training dataset by maximizing the F1-score. The final optimized threshold values were = 0.65, = 0.22, and = 0.45. These thresholds were subsequently used for wheat extraction in the proposed classification framework.
Wheat exhibited a characteristic spectral pattern during August, with lower CI_RE values, higher Redness values, and moderately reduced NDVI compared with maize and soybean. These differences are consistent with the senescence status of wheat, which is characterized by chlorophyll degradation and canopy yellowing during the maturation stage. In contrast, maize and soybean remained in active growth stages and maintained relatively high chlorophyll content and canopy greenness. The contrasting spectral responses indicate that CI_RE and Redness are particularly effective for identifying wheat during late-season phenological stages.
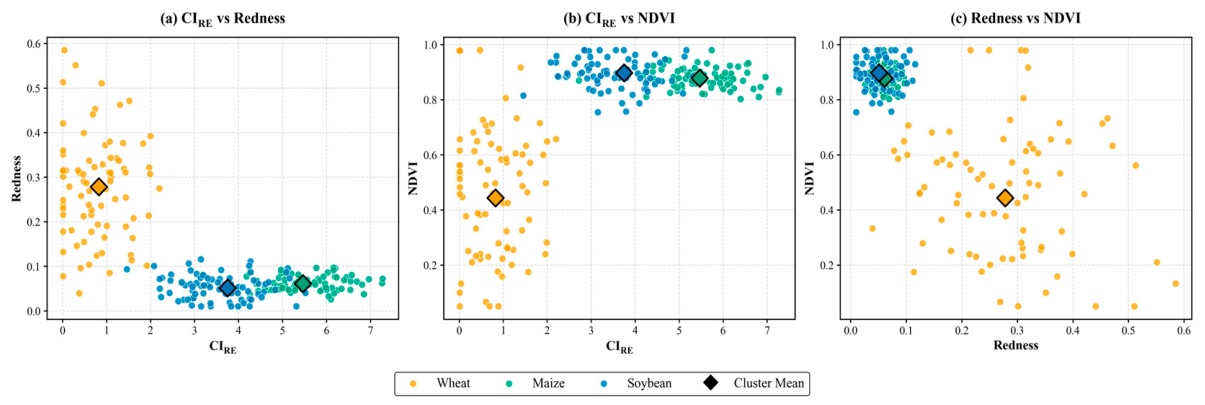
Figure 8 illustrates the distribution of the three major crops in the feature space defined by CI_RE, Redness, and NDVI. Owing to chlorophyll degradation and canopy yellowing during the senescence stage, wheat exhibited substantially lower CI_RE and higher Redness values than maize and soybean, resulting in clear separation from the other two crop types. In contrast, maize and soybean remained in active growth stages and therefore occupied regions with relatively higher CI_RE and NDVI values.
Figure 8.
Three-dimensional spectral feature distribution of wheat, maize, and soybean. (a) CI_RE vs. Redness; (b) CI_RE vs. NDVI; (c) Redness vs. NDVI. Diamonds indicate the cluster centroids calculated from independent samples. Wheat formed a distinct cluster characterized by low CI_RE and high Redness, whereas maize and soybean were mainly separated by differences in CI_RE and NDVI.
- (1)
- CI_RE vs. Redness. Wheat was clearly separated from maize and soybean by its low CI_RE and high Redness values, whereas maize and soybean clustered in the region with higher CI_RE values, reflecting their higher chlorophyll content.
- (2)
- CI_RE vs. NDVI. Maize generally exhibited the highest CI_RE and NDVI values, indicating vigorous canopy growth and photosynthetic activity. Soybean occupied an intermediate position, while wheat remained distinctly separated because of its lower CI_RE and NDVI values.
- (3)
- Redness vs. NDVI. Wheat formed an isolated cluster owing to its elevated Redness values. Although partial overlap existed between maize and soybean, their cluster centroids remained clearly separated, indicating that the combination of Redness and NDVI still provided useful discriminative information.
Overall, the complementary use of CI_RE, Redness, and NDVI effectively captured crop-specific phenological and physiological differences, providing a robust spectral basis for the subsequent rule-based classification.
- (2)
- Differentiation between maize and soybean
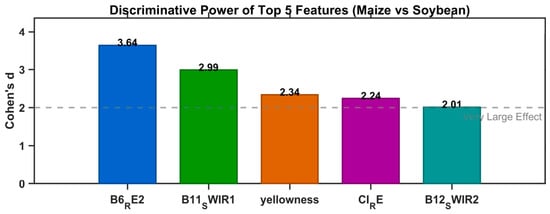
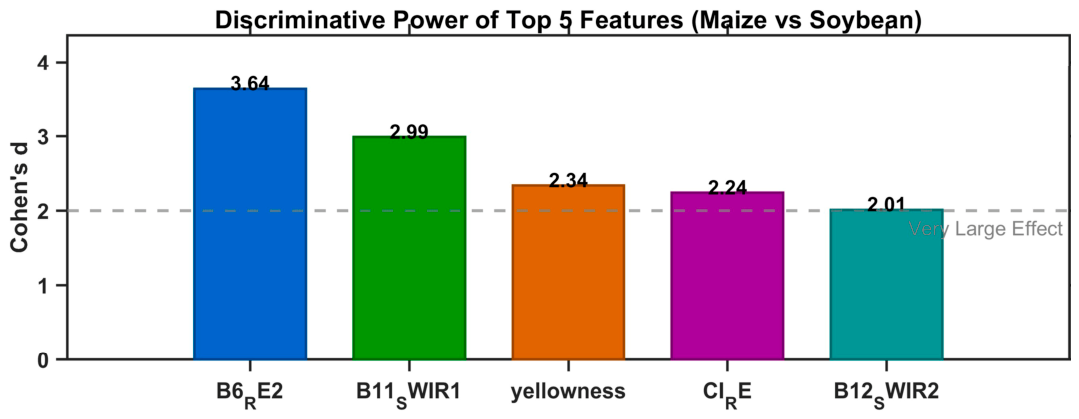
The discriminative capability of spectral features for maize and soybean was quantified using Cohen’s d effect size (Table 3) [36]. Based on the ranking results, the five most discriminative features were selected for further analysis.
Table 3.
Ranking of key spectral features for distinguishing maize and soybean based on Cohen’s d effect size.
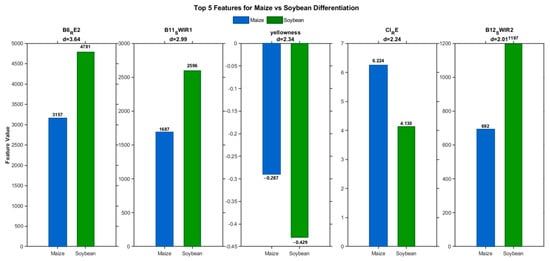
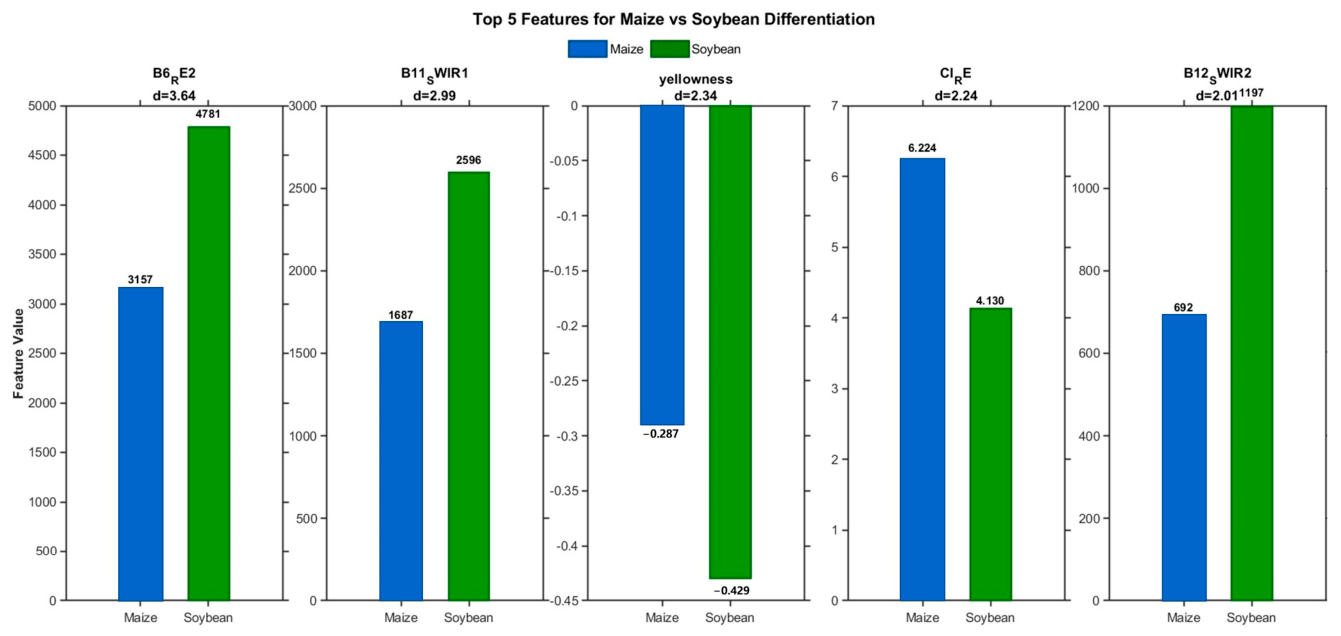
The selected features included Sentinel-2 Red-Edge band 2 (B6), B11 (SWIR1), Yellowness, CI_RE, and B12 (SWIR2). These features are associated with differences in canopy structure, chlorophyll content, and moisture conditions between maize and soybean. Figure 9 further illustrates the spectral differences between the two crop types from multiple perspectives, including red-edge reflectance, moisture sensitivity, pigment response, and canopy characteristics.
Figure 9.
Comparison of key spectral features between maize and soybean.
Figure 9 illustrates the spectral differences between maize and soybean from multiple perspectives, including red-edge reflectance, moisture sensitivity, pigment response, and canopy structure.
The five selected features were subsequently examined to determine their suitability for maize and soybean discrimination (Figure 9). Among these features, Sentinel-2 Band 6 (Red-Edge 2, ~740 nm) exhibited the highest discriminative capability and was therefore selected as the primary feature for subsequent threshold-based classification.
Among the spectral indices, Yellowness (Cohen’s d = 2.341) and the Red-Edge Chlorophyll Index (CI_RE; Cohen’s d = 2.242) also exhibited relatively high discriminative capability (Figure 10). These indices primarily reflected differences in canopy color and chlorophyll content between maize and soybean [37].
Figure 10.
Ranking of key spectral features for maize and soybean classification.
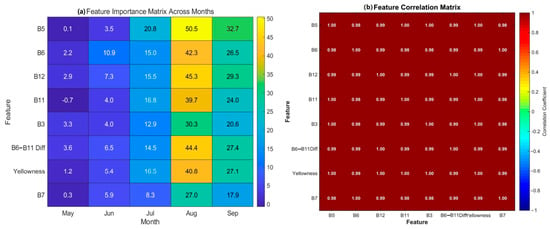
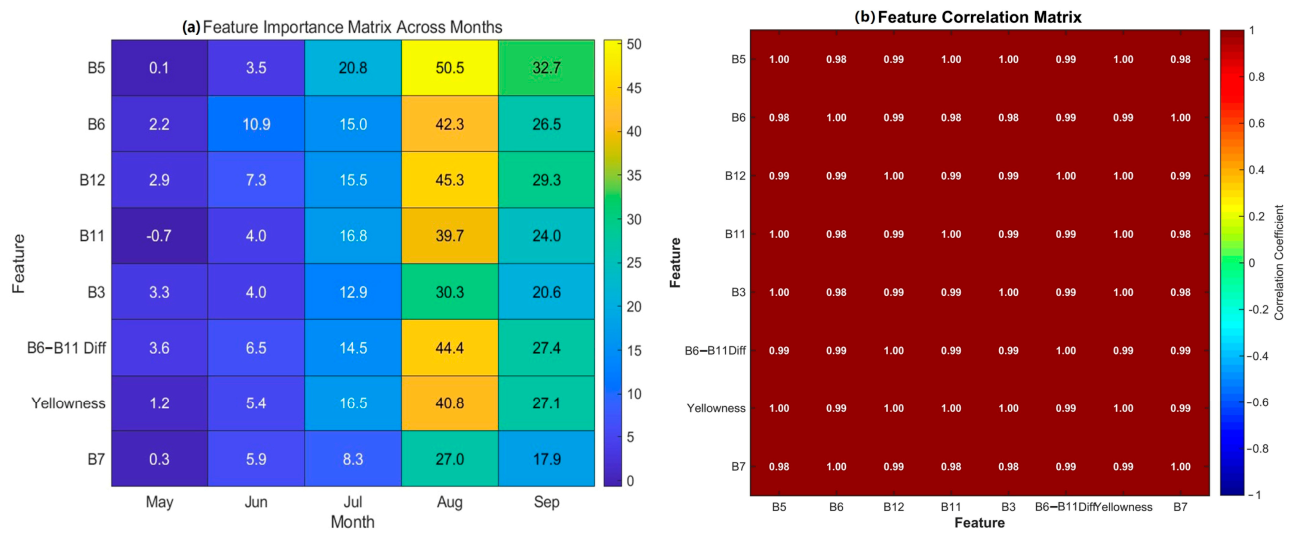
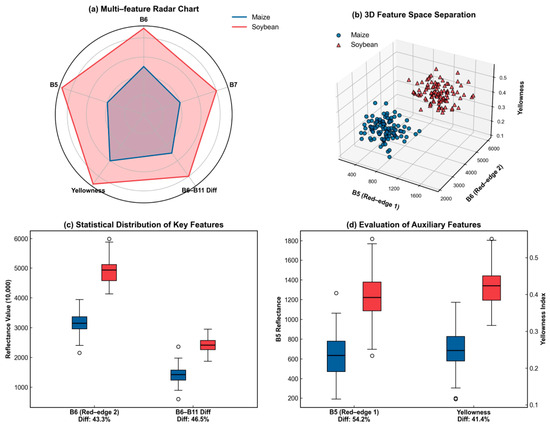
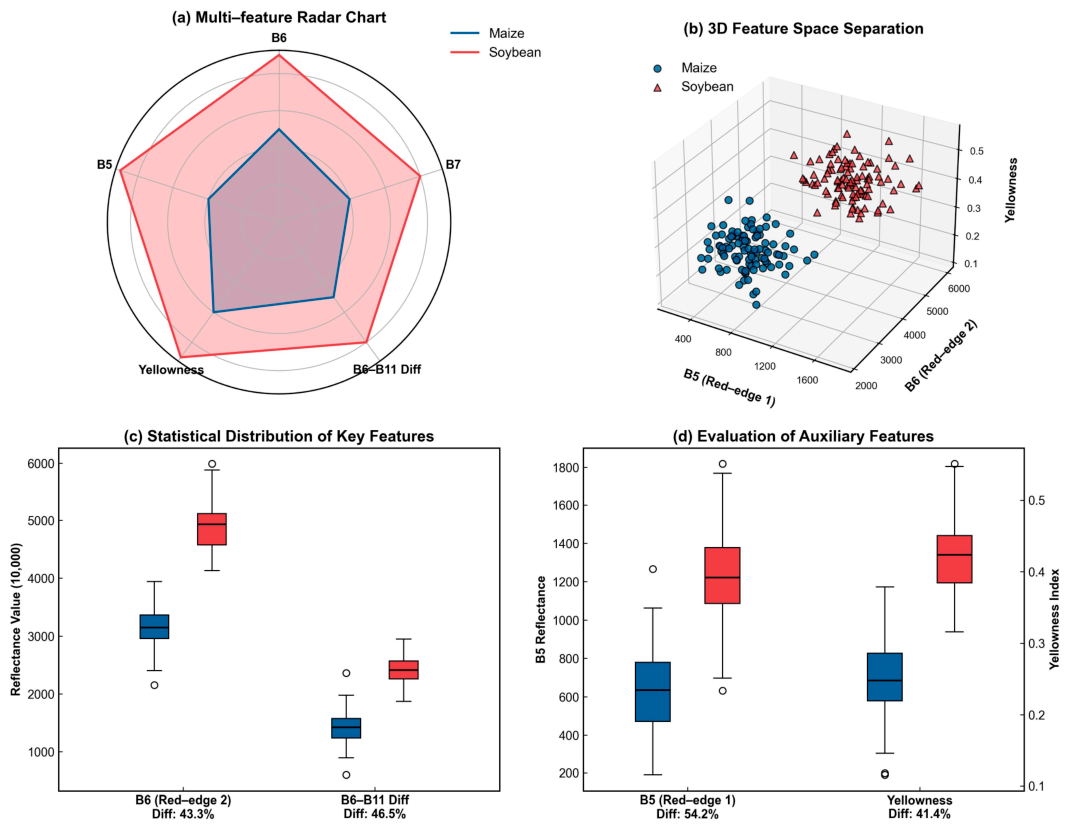
In contrast, the conventional vegetation index NDVI exhibited poor discriminative ability for maize and soybean, as both crops showed highly similar greenness during the peak growing season. By comparison, the red-edge bands (B5 and B6) and the Yellowness index exhibited substantially greater separability, as comprehensively demonstrated by the multi-feature radar chart (Figure 11a). Furthermore, the 3D feature-space distribution (Figure 11b) and the quantitative statistical comparisons (Figure 11c,d) confirmed that these red-edge- and pigment-sensitive features provided much clearer discrimination between maize and soybean. By capturing subtle differences in canopy chlorophyll content and physiological status, these findings strongly emphasize the importance of red-edge and pigment-related information for decoupling crops with similar canopy structures and greenness levels.
Figure 11.
Statistical distribution of NDVI and other key spectral features.
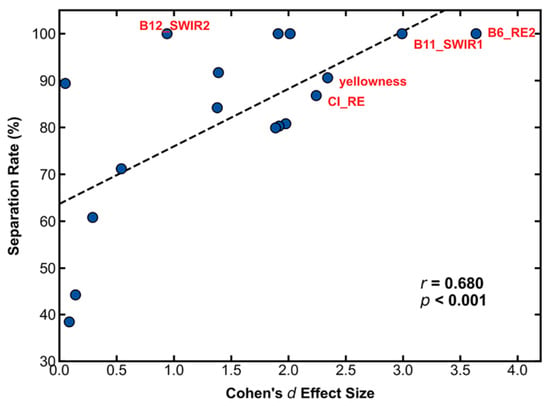
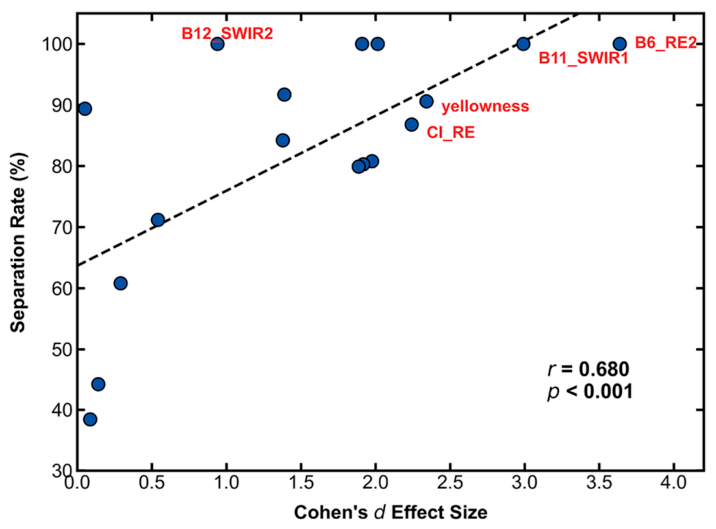
Figure 12 compares the discriminative ability of different spectral features based on Cohen’s d effect size. Among all candidate features, Sentinel-2 Band 6 (Red-Edge 2) exhibited the strongest discriminative capability (Cohen’s d = 3.637), substantially exceeding the Yellowness index (d = 2.341) and CI_RE (d = 2.242). Percentile analysis further demonstrated that the maize and soybean distributions in B6 showed no overlap within the P5–P95 range, indicating excellent class separability. This superior performance reflects the high sensitivity of the red-edge band to differences in canopy chlorophyll content and vegetation structure. During the August observation window, maize remained in the grain-filling stage with relatively high chlorophyll content, whereas soybean had entered the pod-setting stage, resulting in distinct red-edge reflectance characteristics between the two crops.
Figure 12.
Relationship between spectral feature separability and Cohen’s d effect size.
To determine the final decision threshold for maize–soybean separation, a supervised threshold optimization procedure was conducted using the independent training samples. Candidate threshold values were iteratively evaluated according to the observed distribution of Sentinel-2 Red-Edge band 2 (B6) values, and the corresponding classification performance was calculated for each candidate threshold. The threshold producing the highest classification performance was selected as the optimal threshold. Following this procedure, a B6 threshold of 3500 (digital number) was identified and subsequently adopted for the final maize–soybean classification.
4.3. Collaborative Classification Accuracy Assessment
4.3.1. Validation of Cropland Mask and Its Impact on Classification
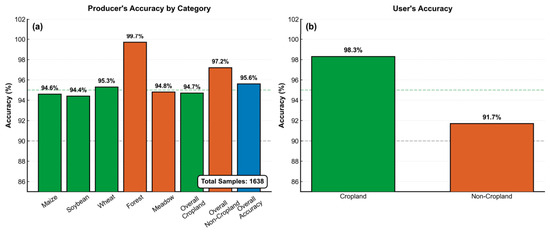
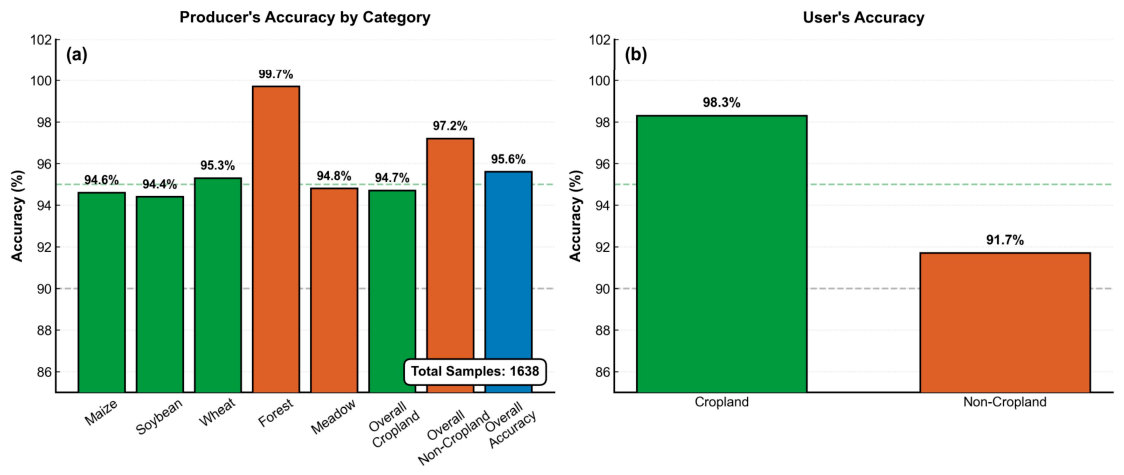
To ensure the reliability of the subsequent crop classification, the accuracy of the dynamic cropland mask was first evaluated [34]. A total of 1638 independent validation samples representing wheat, maize, soybean, forest, and grassland were used for accuracy assessment. The results demonstrated that the proposed cropland mask achieved high classification accuracy, with an Overall Accuracy (OA) of 95.64%, a Producer’s Accuracy (PA) of 94.67% for cropland and 97.25% for non-cropland, and a User’s Accuracy (UA) of 98.26% for cropland and 91.73% for non-cropland (Figure 13).
Figure 13.
Accuracy Assessment of Cropland Classification.
The relatively lower UA for non-cropland indicates that a small number of forest-edge and fallow grassland pixels were incorrectly identified as cropland. Nevertheless, these errors had limited influence on the subsequent crop classification because the proposed PS-DCS framework further distinguished crop types using crop-specific spectral fingerprints and phenological characteristics.
Comparative experiments further showed that using the optimized dynamic cropland mask reduced background interference compared with directly using the ESA WorldCover product, resulting in an improvement of approximately 3 percentage points in the Overall Accuracy of the subsequent crop classification.
These results demonstrate that the dynamic cropland mask effectively reduced non-cropland interference and provided a reliable basis for the subsequent phenology-based crop classification.
4.3.2. Crop Synergistic Classification Results and High-Resolution Spatial Verification
The proposed PS-DCS framework successfully generated a spatially continuous crop classification map for the entire study area (Figure 14). Classification performance was evaluated using two complementary approaches: (i) visual comparison with high-resolution imagery and (ii) quantitative accuracy assessment based on independent validation samples.
Figure 14.
Spatial crop classification results of the proposed PS-DCS framework and qualitative verification using high-resolution imagery.
- (1)
- Qualitative Verification Based on High-Resolution Imagery
As shown in Figure 14, visual comparison with the corresponding high-resolution imagery indicates that the proposed PS-DCS framework accurately captured the spatial distribution and field boundaries of the three major crop types. Wheat parcels were accurately identified and clearly separated from maize and soybean, while maize and soybean exhibited coherent spatial patterns with well-defined field boundaries. The proposed PS-DCS framework effectively reduced salt-and-pepper noise and preserved the spatial continuity of agricultural parcels, particularly in fragmented cropland regions [41]. In addition, background features such as forests, grasslands, water bodies, and built-up areas were effectively excluded, indicating that the proposed framework achieved reliable crop discrimination across heterogeneous agricultural landscapes.
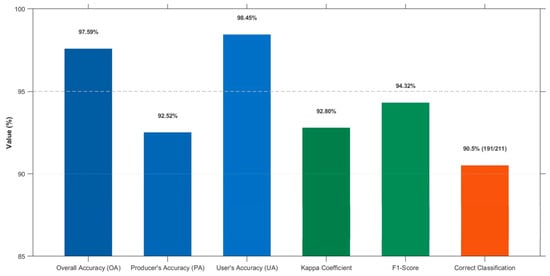
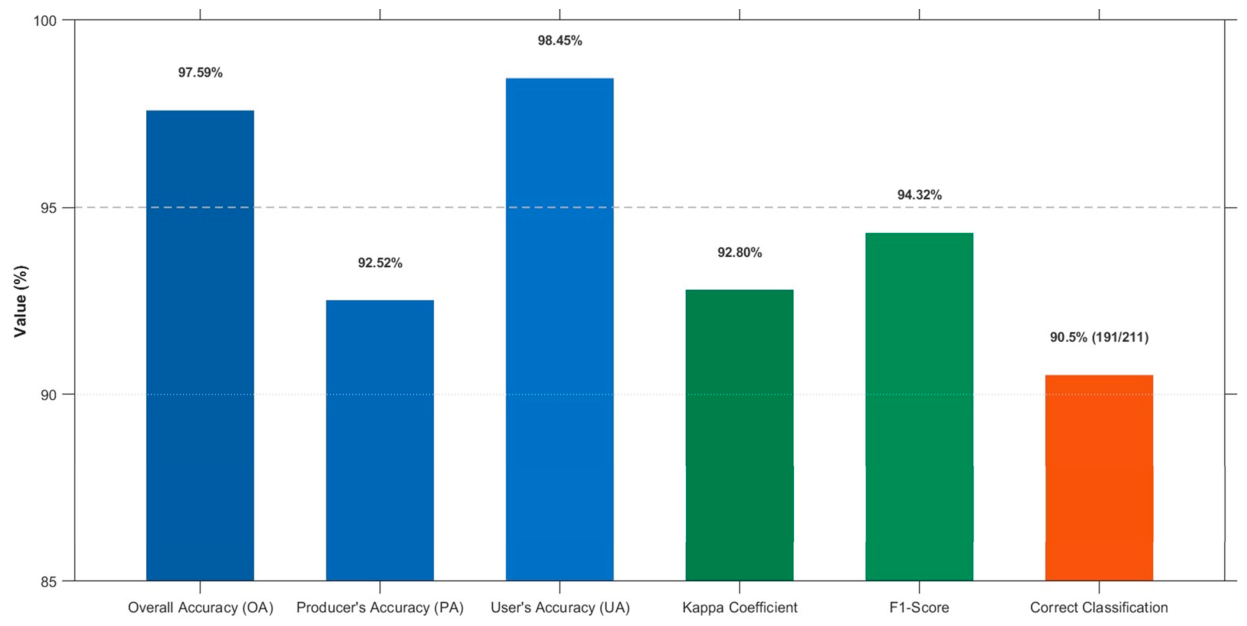
For wheat classification, the proposed framework achieved an Overall Accuracy (OA) of 97.59%, a Producer’s Accuracy (PA) of 90.52%, a User’s Accuracy (UA) of 98.45%, a Kappa coefficient of 0.9280, and an F1-score of 0.9432, indicating excellent classification performance.
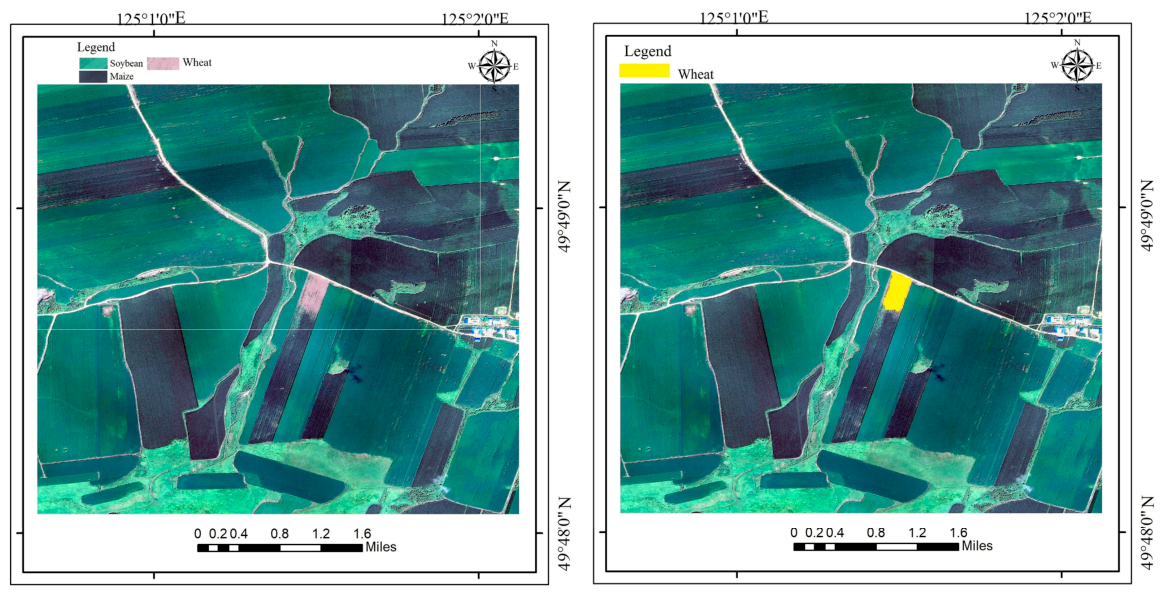
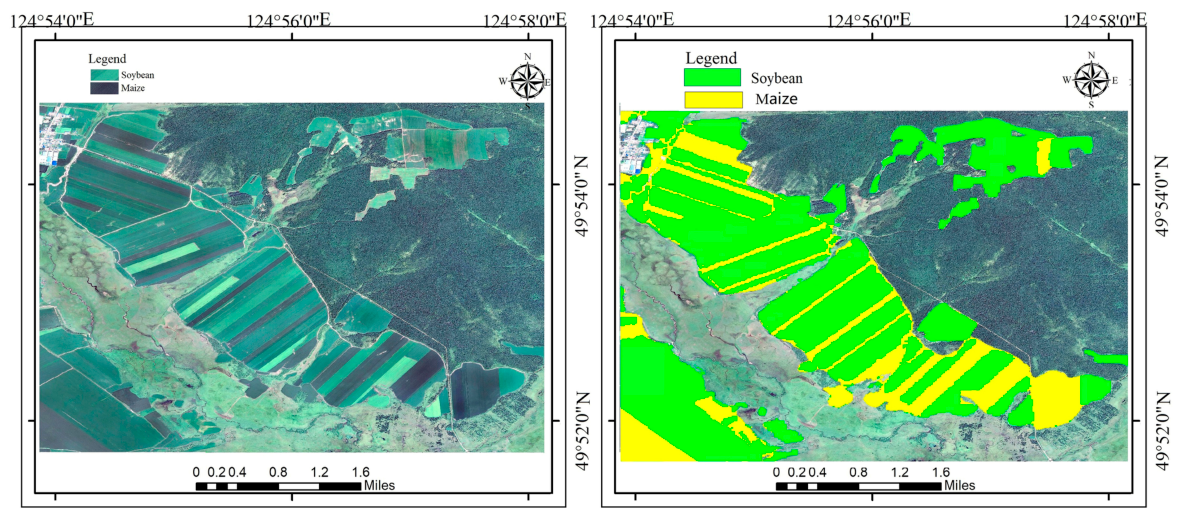
To further evaluate the spatial reliability of the classification results, the crop map was visually compared with sub-meter-resolution Google Earth imagery acquired in August 2025 [42]. As shown in Figure 15 and Figure 16, the proposed PS-DCS framework accurately delineated parcel boundaries and produced crop distribution patterns that were highly consistent with the reference imagery. The method performed particularly well in fragmented agricultural landscapes, including intercropped maize–soybean fields and sloping croplands where wheat was predominantly distributed [38]. Compared with conventional medium-resolution classification results, the proposed framework substantially reduced salt-and-pepper noise and boundary blurring, resulting in more spatially coherent and realistic crop maps.
Figure 15.
Validation of wheat classification results using imagery.
Figure 16.
Validation results for soybean and maize.
- (2)
- Full-Matrix Quantitative Verification Based on Independent Samples
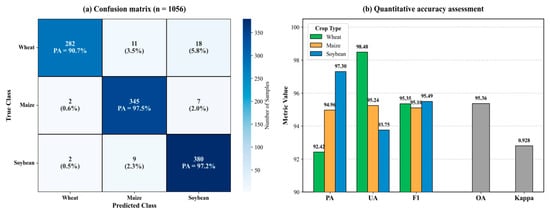
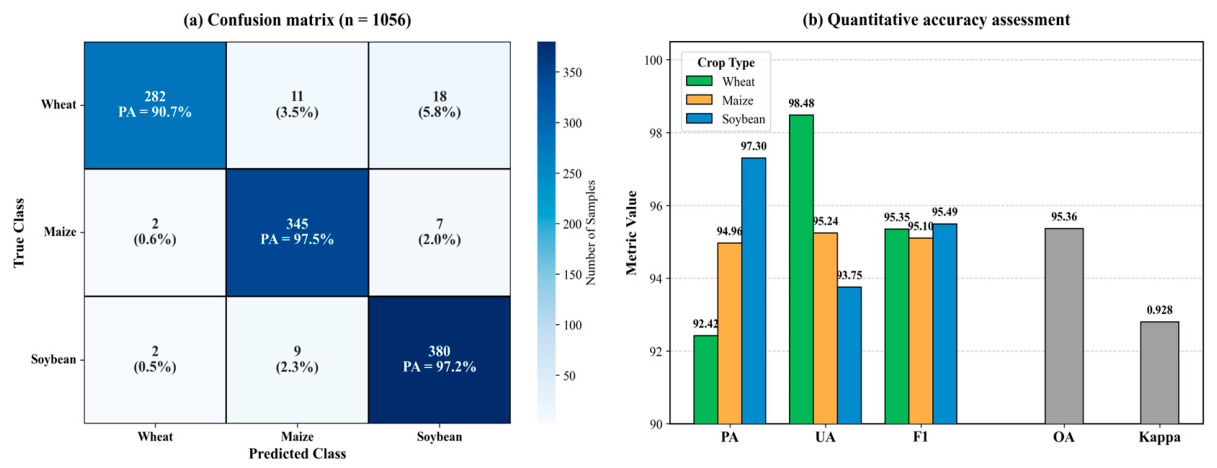
A full confusion-matrix evaluation was conducted using 1056 completely independent validation samples, including 311 wheat, 354 maize, and 391 soybean samples. The resulting confusion matrix and class-specific accuracy metrics are presented in Figure 17. The proposed PS-DCS framework achieved an Overall Accuracy (OA) of 95.36% with a Kappa coefficient of 0.928, demonstrating robust classification performance across the study area.
Figure 17.
Accuracy assessment of crop classification. (a) Confusion matrix (n = 1056); (b) Quantitative accuracy assessment including Producer’s Accuracy (PA), User’s Accuracy (UA), and F1-score for individual crops. The grey columns in panel (b) represent the overall classification performance metrics, namely Overall Accuracy (OA) and the Kappa coefficient.
As shown in Figure 17a, the confusion matrix indicates that most validation samples were correctly classified, with only limited confusion among the three crop types. Wheat achieved a Producer’s Accuracy (PA) of 90.7%, whereas maize and soybean achieved PA values of 97.5% and 97.2%, respectively. The corresponding User’s Accuracy (UA) and F1-score for each crop are presented in Figure 17b. Wheat exhibited the highest UA (98.48%), while maize and soybean maintained consistently high PA, UA, and F1-score values, demonstrating reliable classification performance across all three crop types.
Only a small number of misclassifications were observed [43], primarily between neighboring crop classes. Specifically, a limited number of wheat samples were classified as maize or soybean, while confusion between maize and soybean remained low. Overall, these results demonstrate that the proposed PS-DCS framework achieved accurate and robust crop classification using an independent validation dataset, providing reliable performance under complex agricultural conditions.
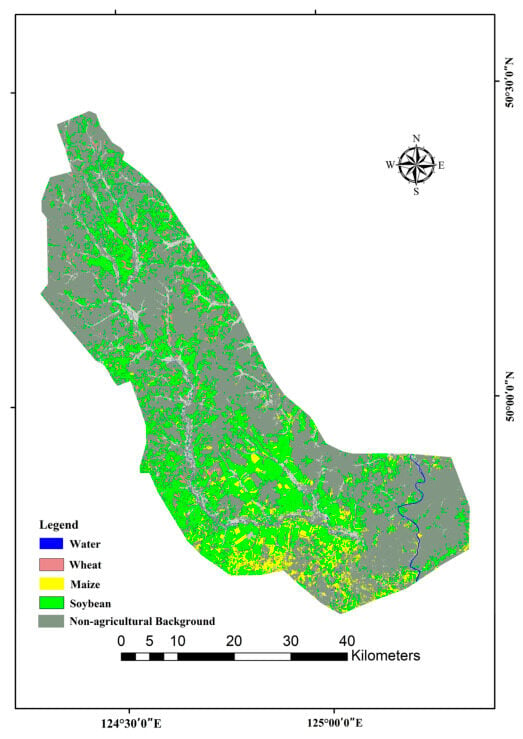
Figure 18 presents the 10 m resolution crop classification map of the Ouken River Basin in 2025. Maize was primarily distributed across the central plains and riparian zones, forming large and contiguous planting areas. Soybean exhibited a broader spatial distribution and frequently occurred adjacent to maize, particularly in gently undulating areas surrounding the basin. In contrast, wheat occupied a relatively smaller proportion of the study area and was mainly distributed along the southern margins and within several concentrated agricultural blocks, reflecting its early-maturing phenology and regional planting pattern.
Figure 18.
The 10 m resolution fine-grained crop classification map of the Ouken River Basin in 2025.
The classification map preserved clear parcel boundaries and continuous spatial patterns, demonstrating the capability of the proposed PS-DCS framework to generate fine-grained crop distribution maps at 10 m spatial resolution. These results provide a reliable representation of the spatial distribution of the three major crops across the study area.
4.3.3. Spatial Distribution Patterns and Analysis of Classification Error Mechanisms
To further investigate the spatial characteristics of classification errors [44], the 49 misclassified samples identified from the confusion matrix were spatially backtracked and analyzed (Figure 19). The results indicate that classification errors were not randomly distributed but exhibited clear spatial heterogeneity. Most misclassified samples were concentrated in fragmented agricultural areas near the basin margins, whereas classification remained highly consistent in the central plains characterized by large and contiguous cropland parcels.
Figure 19.
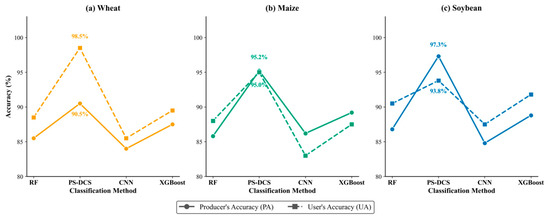
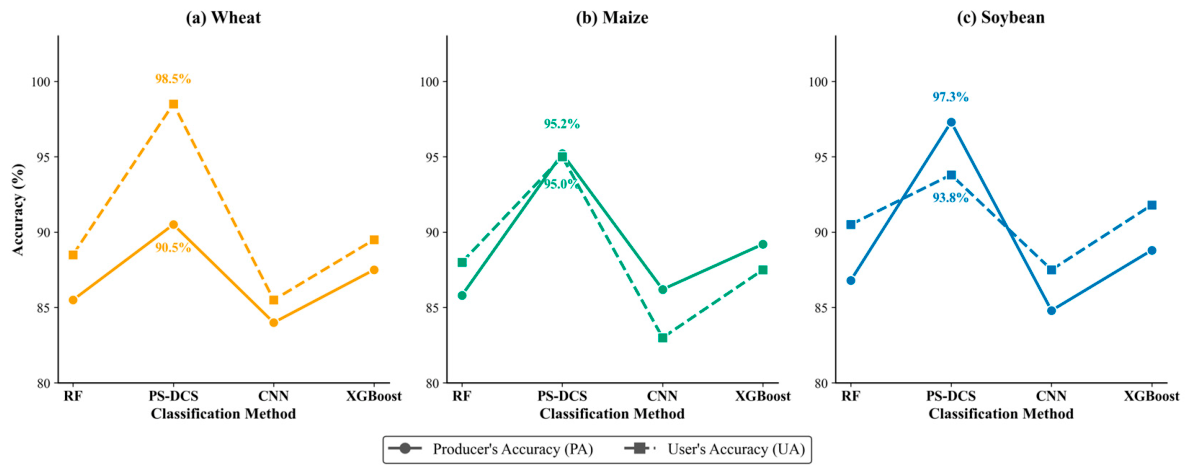
Comparison of producer’s accuracy among different methods.
Two dominant error patterns were identified. First, confusion between maize and soybean mainly occurred along parcel boundaries, where individual Sentinel-2 pixels frequently contained mixed canopy signals from adjacent crops [26]. Second, a small number of wheat omission errors were observed in fragmented cropland with relatively complex background conditions. Despite these localized errors, the proposed PS-DCS framework maintained stable classification performance across the majority of the study area, demonstrating its robustness under heterogeneous agricultural landscapes.
4.4. Comparison with Baseline Methods
To further evaluate the effectiveness of the proposed framework, its performance was compared with three representative machine-learning methods, namely Random Forest (RF), Convolutional Neural Network (CNN), and Extreme Gradient Boosting (XGBoost) [45], using identical input features and training samples [46].
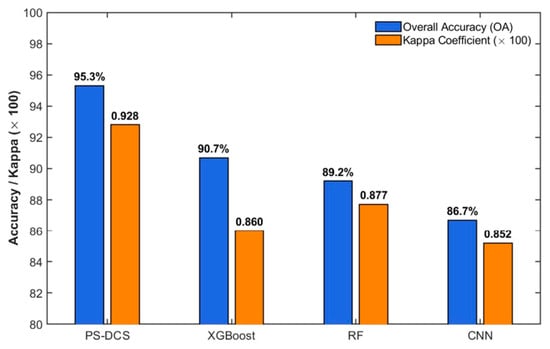
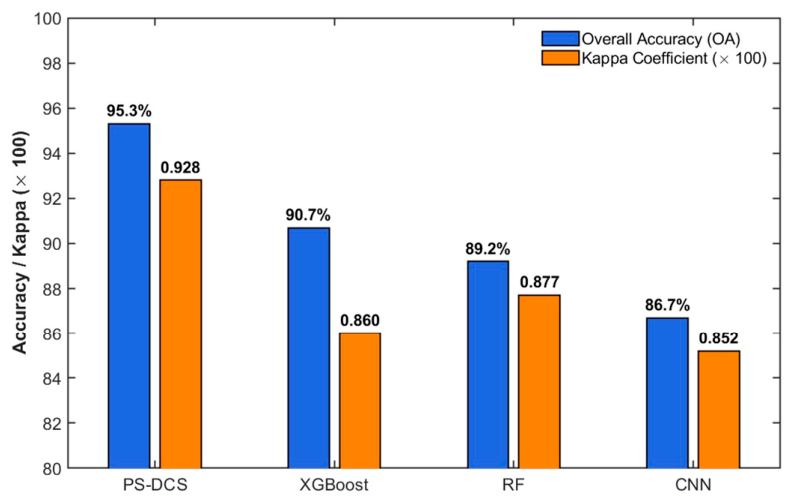
As shown in Figure 20, the proposed PS-DCS framework achieved the highest classification performance among all evaluated methods. The Overall Accuracy (OA) reached 95.36%, exceeding that of the second-best model (XGBoost) by 4.64 percentage points. In addition, PS-DCS consistently achieved high classification performance for all three crop types, particularly for maize and soybean, which are generally difficult to distinguish because of their similar spectral characteristics.
Figure 20.
Quantitative comparison of classification performance, including Overall Accuracy (OA) and Kappa coefficient, among different classification methods.
The superior performance of the proposed framework demonstrates that integrating phenological constraints with physically interpretable spectral features provides an effective strategy for crop classification under limited training-sample conditions. These results further suggest that the PS-DCS framework is capable of producing accurate, reliable, and interpretable crop maps for complex agricultural regions.
4.5. Cross-Year Generalization Validation
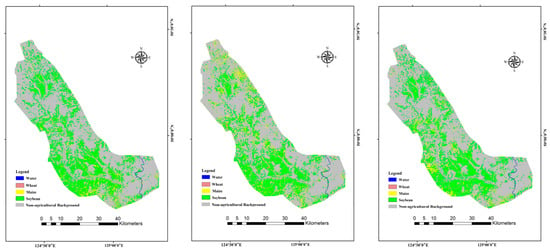
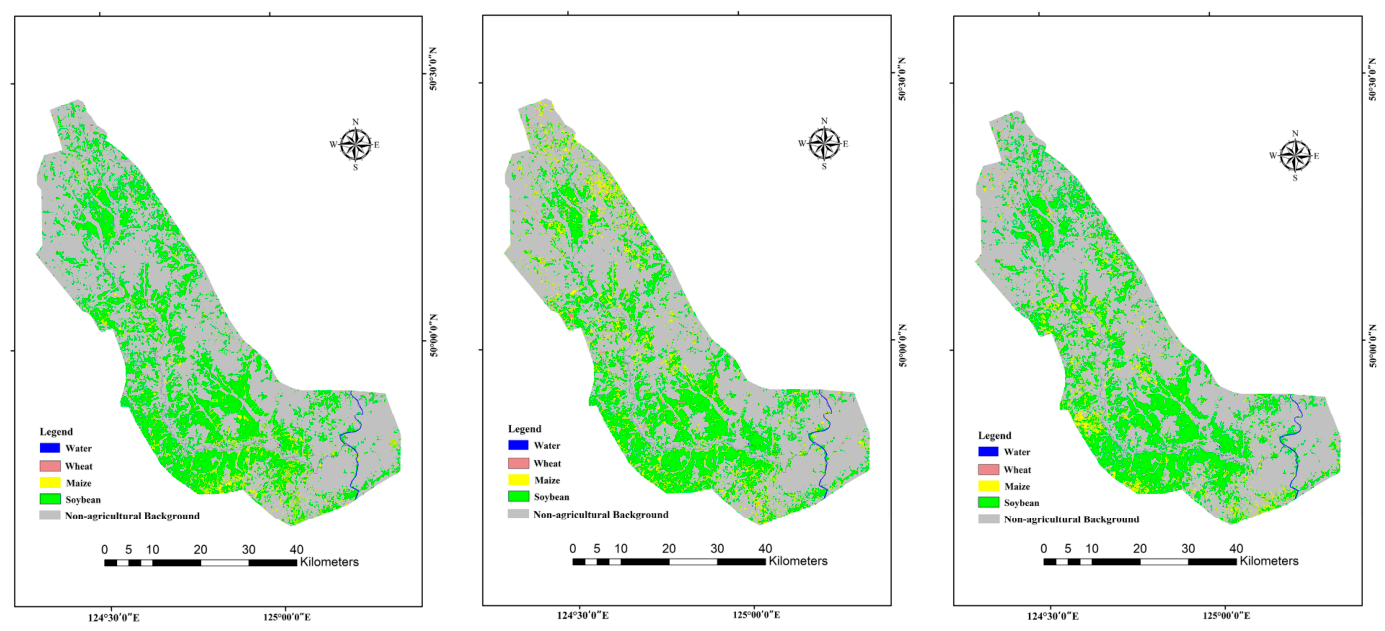
To further evaluate the temporal transferability of the proposed PS-DCS framework, the classification rules developed in this study were applied to historical Sentinel-2 imagery acquired in 2020, 2022, and 2024 (Figure 21). Because synchronous ground-truth samples were unavailable for these historical years, spatial-pattern consistency analysis was adopted to assess the cross-year generalization capability of the proposed framework at the regional scale.
Figure 21.
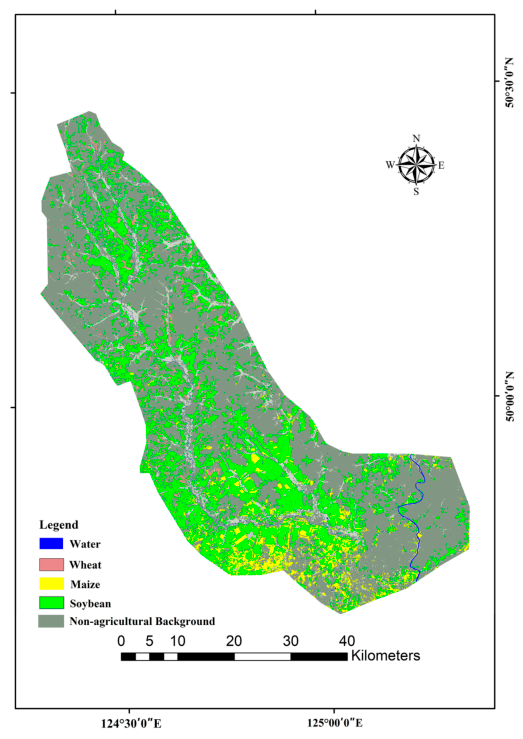
Cross-year crop classification results of the proposed PS-DCS framework for 2020, 2022, and 2024.
The results showed that the proposed framework maintained stable spatial discrimination performance without recalibrating the core physical thresholds. The spatial distribution patterns of the three major crops remained generally consistent across different years. Maize was primarily distributed in large and contiguous cropland within river-valley plains, soybean frequently occurred adjacent to maize, and wheat remained concentrated in peripheral and sloping agricultural areas.
Although interannual climatic variability resulted in fluctuations in absolute spectral reflectance [47], the phenological contrast among the three crops remained stable. Wheat consistently entered the senescence stage in August, whereas maize and soybean remained in active growth stages. Consequently, the physically constrained rules derived from phenological mechanisms remained applicable across different years, reducing the dependence of the framework on year-specific training samples.
Overall, the results suggest that integrating phenological constraints with physically interpretable spectral features enables stable cross-year crop mapping and provides a reliable basis for long-term agricultural remote-sensing applications in complex agricultural regions.
5. Discussion
5.1. Implications for Sustainable Agricultural Management in Complex Agricultural Landscapes
The crop distribution patterns identified in this study reflect the combined influences of topographic conditions, crop phenology, and agricultural management. Maize and soybean were predominantly distributed in flat and contiguous river-valley croplands, whereas wheat was mainly located in relatively marginal areas with greater topographic variation. This spatial differentiation indicates that different cropping systems are closely associated with local land suitability and environmental conditions.
Accurate crop distribution maps provide essential information for sustainable agricultural management in regions characterized by heterogeneous agricultural landscapes [36]. Compared with purely data-driven approaches that rely heavily on large training samples, the PS-DCS framework integrates phenological knowledge with physically interpretable spectral features, enabling reliable crop discrimination with substantially lower sample requirements. This characteristic makes the framework particularly suitable for agricultural regions where field samples are limited but crop phenological differences are pronounced.
The resulting crop maps support regional agricultural monitoring by providing reliable information on crop distribution, agricultural resource management, and long-term land-use planning [48]. In addition, the transparent decision rules incorporated into the PS-DCS framework improve the interpretability and reproducibility of crop mapping [49], demonstrating its practical potential for operational agricultural remote-sensing applications.
5.2. Limitations and Future Perspectives
Nevertheless, several limitations of the proposed framework should be acknowledged. First, the PS-DCS strategy relies on prior knowledge of crop phenology, and the threshold parameters may require recalibration when applied to regions with different cropping systems or phenological calendars. In addition, persistent cloud cover or anomalous weather conditions during the key phenological period may reduce the quality of the August composite and consequently affect classification accuracy. Second, although the proposed physical constraints effectively reduced classification uncertainty, mixed-pixel effects remain unavoidable in highly fragmented agricultural landscapes because of the 10 m spatial resolution of Sentinel-2 imagery. Future studies will explore the integration of multi-temporal optical imagery and Synthetic Aperture Radar (SAR) data to improve the robustness and transferability of the proposed framework under diverse environmental conditions.
Furthermore, the current implementation focuses on the optimal August observation window, which effectively captures the key phenological differences among the target crops but does not fully exploit temporal information throughout the growing season. Incorporating multi-temporal observations may further improve the discrimination of crops with partially overlapping phenological characteristics. Future work will therefore investigate the integration of multi-temporal observations, higher-spatial-resolution imagery, and transferable phenological rules to further improve the robustness and applicability of the proposed framework across different agricultural regions and years [50]. Future studies could further evaluate crop separability using additional distance-based metrics (e.g., the Jeffries–Matusita or Bhattacharyya distance) to complement the current phenological and statistical analyses.
6. Conclusions
This study proposed a Phenology–Spectral Dual-Constrained Strategy (PS-DCS) for fine-scale crop classification in middle-to-high latitude agricultural regions characterized by phenological overlap and complex agricultural landscapes. By integrating Sentinel-2 imagery with crop phenology and physically interpretable spectral features, the proposed framework achieved an Overall Accuracy of 95.36% and a Kappa coefficient of 0.928. The results demonstrated that combining CI_RE, Redness, and the Sentinel-2 red-edge band (B6) effectively improved the discrimination of wheat, maize, and soybean during the optimal August observation window.
Compared with conventional data-driven approaches, PS-DCS maintained competitive classification performance while requiring fewer training samples and avoiding extensive parameter tuning. Furthermore, cross-year validation indicated that the proposed framework preserved stable spatial distribution patterns without recalibrating the core physical thresholds, demonstrating good temporal transferability and robustness.
The resulting high-resolution crop distribution maps provide valuable information for agricultural management, crop structure assessment, and sustainable agricultural planning in complex agricultural landscapes. Future work will focus on integrating multi-temporal observations, Sentinel-1 SAR data, and higher-spatial-resolution imagery to further improve the robustness and applicability of the proposed framework across different agricultural regions.
Author Contributions
Conceptualization, Y.M. and M.W.; methodology, Y.M. and M.W.; software, Y.M.; validation, Y.M.; formal analysis, Y.M.; investigation, L.W., X.Z., Y.S. and Z.C.; data curation, Y.M., L.W., X.Z., Y.S. and Z.C.; writing—original draft preparation, Y.M.; writing—review and editing, M.W. and L.W.; supervision, M.W.; project administration, M.W.; funding acquisition, M.W. All authors have read and agreed to the published version of the manuscript.
Funding
This research was funded by the Natural Science Foundation of Jilin Province, grant number YDZJ202601ZYTS270, and the Key Program of the National Natural Science Foundation of China, grant number 42330607.
Institutional Review Board Statement
Not applicable.
Informed Consent Statement
Not applicable.
Data Availability Statement
Publicly available satellite datasets were analyzed in this study. The Sentinel-2 data can be found via the Google Earth Engine platform. However, the field observation data presented in this study are available on request from the corresponding author (M.W.). These field data are not publicly available due to ongoing project privacy and proprietary restrictions.
Acknowledgments
The authors would like to express their sincere gratitude to the local agricultural departments and field assistants for their valuable support and assistance during field investigations and ground truth data collection in the Oken River region.
Conflicts of Interest
The authors declare no conflicts of interest. The funders had no role in the design of the study; in the collection, analyses, or interpretation of data; in the writing of the manuscript; or in the decision to publish the results.
References
- Zhang, C.; Kerner, H.; Wang, S.; Hao, P.; Li, Z.; Hunt, K.A.; Abernethy, J.; Zhao, H.; Gao, F.; Di, L. Remote Sensing for Crop Mapping: A Perspective on Current and Future Crop-Specific Land Cover Data Products. Remote Sens. Environ. 2025, 330, 114995. [Google Scholar] [CrossRef] [Scilit]
- Simeón, R.; Masslouhi, K.E.; Agenjos-Moreno, A.; Ricarte, B.; Uris, A.; Franch, B.; Rubio, C.; San Bautista, A. Machine Learning Applied to Crop Mapping in Rice Varieties Using Spectral Images. Agriculture 2025, 15, 1832. [Google Scholar] [CrossRef] [Scilit]
- Brickner, N.Z.; Fine, L.; Rozenstein, O.; Paz-Kagan, T. Field Crop Mapping Using Machine Learning and Multi-Sensor Satellite Fusion: Toward Dynamic Agricultural Monitoring. Smart Agric. Technol. 2025, 12, 101650. [Google Scholar] [CrossRef] [Scilit]
- Yu, J.; Zhao, L.; Liu, Y.; Chang, Q.; Wang, N. Automatic Crop Type Mapping Based on Crop-Wise Indicative Features. Int. J. Appl. Earth Obs. Geoinf. 2025, 139, 104554. [Google Scholar] [CrossRef] [Scilit]
- Sun, Z.; Li, X.; Wei, H.; Feng, Z.; Yang, J. Landsat Image Classification Using a Deep Learning Model and Multiple-Source Training Samples. Int. J. Digit. Earth 2024, 17, 2409351. [Google Scholar] [CrossRef] [Scilit]
- Illarionova, L.; Dubrovin, K.; Fomina, E.; Stepanov, A.; Sorokin, A.; Verkhoturov, A. Multi-Sensor NDVI Time Series for Crop and Fallow Land Classification in Khabarovsk Krai, Russia. Sensors 2025, 25, 5746. [Google Scholar] [CrossRef] [Scilit] [PubMed]
- Song, Y.; Cao, X.; Wang, H.; Zhang, B.; Zeng, H.; Liang, Y. Explaining Spatially Heterogeneous Drivers of Urban Expansion with an XGBoost–SHAP–UGM Framework. GISci. Remote Sens. 2026, 63, 2652154. [Google Scholar] [CrossRef] [Scilit]
- Zhao, Q.; Qu, Y. The Retrieval of Ground NDVI (Normalized Difference Vegetation Index) Data Consistent with Remote-Sensing Observations. Remote Sens. 2024, 16, 1212. [Google Scholar] [CrossRef] [Scilit]
- Zhao, E.; Zhang, W.; Wang, Y.; Zhang, H.; Zhao, H. A Spatial-Temporal Attention-Based U-Net for Crop Mapping from Time-Series Sentinel-2 Imagery: A Case in Sanjiang Plain. Remote Sens. 2026, 18, 1677. [Google Scholar] [CrossRef] [Scilit]
- Gao, R.; Balz, T.; Yan, Y.; Zhuang, Q.; Shao, Z.; Chang, B. A Sample Spatiotemporal Expansion Method for Mapping Autumn-Harvested Crops in Cloudy and Rainy Areas. IEEE J. Sel. Top. Appl. Earth Obs. Remote Sens. 2026, 19, 6152–6165. [Google Scholar] [CrossRef] [Scilit]
- Fuentes, I.; Al-Shammari, D. Field-Aware and Explainable Modelling for Early-Season Crop Yield Prediction Using Satellite-Derived Phenology. Remote Sens. 2026, 18, 890. [Google Scholar] [CrossRef] [Scilit]
- Yan, J.; Chen, X.; Ren, R.; Mi, X.; Yuan, Z.; Yang, J.; Meng, X.; Jiang, Z.; Zhu, H.; Liu, Y. SSF-TransUnet: Fine-Grained Crop Classification via Cross-Source Spatial Spectral Fusion. Remote Sens. 2026, 18, 1034. [Google Scholar] [CrossRef] [Scilit]
- Li, H.; Song, X.-P.; Adusei, B.; Pickering, J.; Lima, A.; Poulson, A.; Baggett, A.; Potapov, P.; Khan, A.; Zalles, V. An Accurate 10 m Annual Crop Map Product of Maize and Soybean across the United States. Earth Syst. Sci. Data 2026, 18, 2227–2249. [Google Scholar] [CrossRef] [Scilit]
- Seguini, L.; Vrieling, A.; Meroni, M.; Nelson, A. Annual Winter Crop Distribution from MODIS NDVI Timeseries to Improve Yield Forecasts for Europe. Int. J. Appl. Earth Obs. Geoinf. 2024, 130, 103898. [Google Scholar] [CrossRef] [Scilit]
- Feng, D.; Yang, H.; Gao, K.; Jin, X.; Li, Z.; Nie, C.; Zhang, G.; Fang, L.; Zhou, L.; Guo, H. Time-Series NDVI and Greenness Spectral Indices in Mid-to-Late Growth Stages Enhance Maize Yield Estimation. Field Crops Res. 2025, 333, 110069. [Google Scholar] [CrossRef] [Scilit]
- Jiang, Y.; Lu, Z.; Li, S.; Lei, Y.; Chu, Q.; Yin, X.; Chen, F. Large-Scale and High-Resolution Crop Mapping in China Using Sentinel-2 Satellite Imagery. Agriculture 2020, 10, 433. [Google Scholar] [CrossRef] [Scilit]
- Maharjan, S.; Li, W.; Fazli, S.; Tariq, A.; Thomas, R.; Rakovski, C.; El-Askary, H. Enhancing Water Scarcity Resilience in Egypt through Machine Learning-Driven Phenological Crop Mapping and Water Use Efficiency Analysis. Int. J. Appl. Earth Obs. Geoinf. 2025, 141, 104668. [Google Scholar] [CrossRef] [Scilit]
- Heikonen, S.; Heino, M.; Jalava, M.; Siebert, S.; Viviroli, D.; Kummu, M. Climate Change Threatens Crop Diversity at Low Latitudes. Nat. Food 2025, 6, 331–342. [Google Scholar] [CrossRef] [Scilit] [PubMed]
- Xie, Y.; Zeng, H.; Li, J.; Zhao, H.; Yu, Q.; Qiu, B.; Ahmed, S.; Wu, B. Improving Parcel Level Crop Classification by Integrating a Novel Red Edge Maize-Cotton Mapping Index and Machine Learning: A Case Study in the Ebinur Lake Basin. Int. J. Appl. Earth Obs. Geoinf. 2025, 143, 104765. [Google Scholar] [CrossRef] [Scilit]
- Huang, X.; Vrieling, A.; Dou, Y.; Li, X.; Nelson, A. Divergent Crop Mapping Accuracies across Different Field Types in Smallholder Farming Regions. Int. J. Appl. Earth Obs. Geoinf. 2025, 139, 104559. [Google Scholar] [CrossRef] [Scilit]
- Sanghvi, M.; Garde, S.; Dravid, M.; Sawant, S.; Ghosh, S. Advancements in Land Use Land Cover Classification: Deep Learning and Sentinel-2 Satellite Imagery Integration. In Application of Geospatial Technology and Modelling on Natural Resources Management: Current State, Challenges and Sustainability; Springer: Cham, Switzerland, 2025; pp. 245–269. [Google Scholar] [CrossRef] [Scilit] [PubMed]
- Wen, C.; Lu, M.; Bi, Y.; Xia, L.; Sun, J.; Shi, Y.; Wei, Y.; Wu, W. Customized Crop Feature Construction Using Genetic Programming for Early- and in-Season Crop Mapping. Comput. Electron. Agric. 2025, 231, 109949. [Google Scholar] [CrossRef] [Scilit]
- Wang, C.; Chen, J.; Cai, C.; Liu, M.; Wang, Z.; Zhang, H.; Zhang, H. Comprehensive Analysis of a Parcel-Level Crop Mapping (PARCM) Framework From the Perspective of Spatial Heterogeneity and Spatiotemporal Transferability. IEEE J. Sel. Top. Appl. Earth Obs. Remote Sens. 2025, 18, 7290–7303. [Google Scholar] [CrossRef] [Scilit]
- Liu, N.; Zhao, Q.; Williams, R.; Duan, S.-B.; Liu, X.; Barrett, B. Enhanced Crop Mapping Using Polarimetric SAR Features and Time Series Deep Learning: A Case Study in Bei’an, China. IEEE Trans. Geosci. Remote Sens. 2025, 63, 5002917. [Google Scholar] [CrossRef] [Scilit]
- Halder, K.; Srivastava, A.K.; Zheng, W.; Alsafadi, K.; Zhao, G.; Maerker, M.; Singh, M.; Guoging, L.; Ghosh, A.; Vianna, M. A Robust and Scalable Crop Mapping Framework Using Advanced Machine Learning and Optical and SAR Imageries. Smart Agric. Technol. 2025, 12, 101354. [Google Scholar] [CrossRef] [Scilit]
- Lozano-Tello, A.; Caballero-Mancera, A.; Luceño, J.; Clemente, P.J. Evaluating Two Approaches for Mapping Solar Installations to Support Sustainable Land Monitoring: Semantic Segmentation on Orthophotos vs. Multitemporal Sentinel-2 Classification. Sustainability 2025, 17, 8628. [Google Scholar] [CrossRef] [Scilit]
- Arfa, A.; Minaei, M. Utilizing Multitemporal Indices and Spectral Bands of Sentinel-2 to Enhance Land Use and Land Cover Classification with Random Forest and Support Vector Machine. Adv. Space Res. 2024, 74, 5580–5590. [Google Scholar] [CrossRef] [Scilit]
- Rouse, J.W.; Haas, R.H.; Schell, J.A.; Deering, D.W. Monitoring Vegetation Systems in the Great Plains with ERTS. In Proceedings of the Third Earth Resources Technology Satellite-1 Symposium, Greenbelt, MD, USA, 10–14 December 1973; NASA: Washington, DC, USA, 1974; pp. 309–317. [Google Scholar]
- Huete, A.; Didan, K.; Miura, T.; Rodriguez, E.P.; Gao, X.; Ferreira, L.G. Overview of the Radiometric and Biophysical Performance of the MODIS Vegetation Indices. Remote Sens. Environ. 2002, 83, 195–213. [Google Scholar] [CrossRef] [Scilit]
- Gitelson, A.A.; Viña, A.; Arkebauer, T.J.; Rundquist, D.C.; Keydan, G.; Leavitt, B. Remote Estimation of Leaf Area Index and Green Leaf Biomass in Maize Canopies. Geophys. Res. Lett. 2003, 30, 1248. [Google Scholar] [CrossRef] [Scilit]
- Birth, G.S.; McVey, G.R. Measuring the Color of Growing Turf with a Reflectance Spectrophotometer. Agron. J. 1968, 60, 640–643. [Google Scholar] [CrossRef] [Scilit]
- Groß, J.; Möller, A. Some Additional Remarks on Statistical Properties of Cohen’s d in the Presence of Covariates. Stat. Pap. 2024, 65, 3971–3979. [Google Scholar] [CrossRef] [Scilit]
- Zheng, Y.; Dong, W.; Yang, Z.; Lu, Y.; Zhang, X.; Dong, Y.; Sun, F. A New Attention-Based Deep Metric Model for Crop Type Mapping in Complex Agricultural Landscapes Using Multisource Remote Sensing Data. Int. J. Appl. Earth Obs. Geoinf. 2024, 134, 104204. [Google Scholar] [CrossRef] [Scilit]
- Zhao, L.; Dong, T.; Du, X.; Dong, B.; Li, Q. Model Morphing Supported Large Scale Crop Type Mapping: A Case Stuy of Cotton Mapping in Xinjiang, China. Int. J. Appl. Earth Obs. Geoinf. 2025, 141, 104667. [Google Scholar] [CrossRef] [Scilit]
- Li, C.; Li, H.; Zhou, Y.; Wang, X. Detailed Land Use Classification in a Rare Earth Mining Area Using Hyperspectral Remote Sensing Data for Sustainable Agricultural Development. Sustainability 2024, 16, 3582. [Google Scholar] [CrossRef] [Scilit]
- Saketapuram, H.; Sahu, S.; Hsv, U.S.; Sarma M, M.; Chauhan, P. NovaSAR-Automated Data Processing for Geometric Correction and Radiometric Terrain Normalization for Analysis Ready Data. In 2024 IEEE Space, Aerospace and Defence Conference (SPACE); IEEE: Piscataway, NJ, USA, 2024; pp. 1089–1092. [Google Scholar] [CrossRef] [Scilit]
- Yang, S.; Gu, L.; Li, X.; Gao, F.; Jiang, T. Fully Automated Classification Method for Crops Based on Spatiotemporal Deep-Learning Fusion Technology. IEEE Trans. Geosci. Remote Sens. 2022, 60, 5405016. [Google Scholar] [CrossRef] [Scilit]
- Gopinath, G.; Sasidharan, N.; Surendran, U. Landuse Classification of Hyperspectral Data by Spectral Angle Mapper and Support Vector Machine in Humid Tropical Region of India. Earth Sci. Inform. 2020, 13, 633–640. [Google Scholar] [CrossRef] [Scilit]
- Gorbunov, I.; Gevaert, C.M.; Belgiu, M. Optimizing Crop Type Mapping for Fairness. Int. J. Appl. Earth Obs. Geoinf. 2025, 142, 104672. [Google Scholar] [CrossRef] [Scilit]
- Mohseni, F.; Kiani Sadr, M.; Eslamian, S.; Areffian, A.; Khoshfetrat, A. Spatial and Temporal Monitoring of Drought Conditions Using the Satellite Rainfall Estimates and Remote Sensing Optical and Thermal Measurements. Adv. Space Res. 2021, 67, 3942–3959. [Google Scholar] [CrossRef] [Scilit]
- Eyster, H.N.; Beckage, B. Applying a Deep Learning Pipeline to Classify Land Cover from Low-Quality Historical RGB Imagery. PeerJ Comput. Sci. 2024, 10, e2003. [Google Scholar] [CrossRef] [Scilit] [PubMed]
- Xun, L.; Xie, Y. Automatic Mapping of Maize Cultivated Area Based on a Novel Maize Mapping Index. IEEE J. Sel. Top. Appl. Earth Obs. Remote Sens. 2025, 18, 28300–28309. [Google Scholar] [CrossRef] [Scilit]
- Jocea, A.F.; Porumb, L.; Necula, L.; Raducanu, D. Sentinel-2 Land Cover Classification: State-of-the-Art Methods and the Reality of Operational Deployment—A Systematic Review. Sustainability 2025, 17, 10324. [Google Scholar] [CrossRef] [Scilit]
- Yang, G.; Wang, J.; Qi, Z. Maize Classification in Arid Regions via Spatiotemporal Feature Optimization and Multi-Source Remote Sensing Integration. Agronomy 2025, 15, 1667. [Google Scholar] [CrossRef] [Scilit]
- Tufail, R.; Tassinari, P.; Torreggiani, D. Assessing Feature Extraction, Selection, and Classification Combinations for Crop Mapping Using Sentinel-2 Time Series: A Case Study in Northern Italy. Remote Sens. Appl. Soc. Environ. 2025, 38, 101525. [Google Scholar] [CrossRef] [Scilit]
- Li, Z.; Chen, B.; Wu, S.; Su, M.; Chen, J.M.; Xu, B. Deep Learning for Urban Land Use Category Classification: A Review and Experimental Assessment. Remote Sens. Environ. 2024, 311, 114290. [Google Scholar] [CrossRef] [Scilit]
- Li, K.; Wang, J. A Multi-Source Data Fusion Method for Land Cover Production: A Case Study of the East European Plain. Int. J. Digit. Earth 2024, 17, 2339360. [Google Scholar] [CrossRef] [Scilit]
- Debiasi, H.; Franchini, J.C.; Tonini, V.; Roy, J.M.T.; Muhl, A.; Balbinot Junior, A.A. Alternative Diversified Cropping Systems for Soybean-Maize off-Season Double-Cropping in Southern Brazil. Int. J. Plant Prod. 2026, 20, 31. [Google Scholar] [CrossRef] [Scilit]
- Shi, S.; Liu, Q.; Yan, Z. Crop Type Mapping in an Irrigation District Using Multi-Source Remote Sensing and LSTM-Based Time Series Analysis. Agriculture 2026, 16, 920. [Google Scholar] [CrossRef] [Scilit]
- Long, J.; Liu, T.; Woznicki, S.A.; Marković, M.; Marko, O.; Sears, M. From Time-Series Generation and Model Selection to Transfer Learning: A Review and Comparative Analysis of Pixel-Wise Approaches for Large-Scale Crop Mapping. Comput. Electron. Agric. 2026, 246, 111646. [Google Scholar] [CrossRef] [Scilit]

Disclaimer/Publisher’s Note: The statements, opinions and data contained in all publications are solely those of the individual author(s) and contributor(s) and not of MDPI and/or the editor(s). MDPI and/or the editor(s) disclaim responsibility for any injury to people or property resulting from any ideas, methods, instructions or products referred to in the content. |
© 2026 by the authors. Licensee MDPI, Basel, Switzerland. This article is an open access article distributed under the terms and conditions of the Creative Commons Attribution (CC BY) license.