


Abstract
The changing climate raises the level of hydroclimatic non-stationarity and export of pollutants at the event scale in agricultural, mixed-land-use, and urbanizing watersheds. In this review, there is an emphasis on nitrogen, phosphorus, and sediment; however, selective references are made to pesticides, pathogens, microplastics, and wet-weather mixed-source processes when characteristics similar to event-driven transport, threshold exceedance, and adaptive control are identified. Drawing on a structured literature search of studies published from 2000 to December 2025, this narrative review synthesizes evidence from 138 selected references on how extreme rainfall, drought–rewetting, warming, and freeze–thaw processes alter source activation, hydrological connectivity, biogeochemical processing, and receiving-water hazards. Our resilience assessment is based on resistance, recovery, robustness, and persistence, which we interpret using exposure, sensitivity, and adaptive capacity. It is shown that standard average-load and fixed-baseline measurements may not detect short pollution pulses, cross-scenario failure, and long-term drift; operational measurement must thus involve event thresholds, recovery trajectories, tail-risk measures, and propagation of uncertainty. Extrapolation, interpretability, data demand, and applicability for data-sparse basins are used to compare process-based, data-driven, and hybrid models. Adaptation options are associated with measurable triggers as part of a monitoring–trigger–action cycle with location-specific instructions for monsoon-agricultural, cold-region, semi-arid and urban systems. The novel aspect of this framework is the integration of mechanism-based evidence, quantitative resilience indicators, model uncertainty, and adaptive governance into one decision-focused workflow. This sustainability-oriented framework advances long-term watershed management by linking water-quality protection and resilient development.
1. Introduction
1.1. Climate-Driven Hydrology–Water-Quality Risks
The current influence of climate change on water quality in the watershed is mainly due to the non-stationarity of hydrological variability in the region, not merely changes in the mean climate. The incidence of more frequent and intense extreme weather events like heavy rainfall, heatwaves, droughts, and changes in snow-melting patterns is increasing. Such changes have transformed the hydrology of watersheds by altering the seasonality of runoff, peak floods, baseflow, and the flow path of individual hydrological events [1,2]. Empirical data also demonstrate that historical mean conditions or annual average-load targets poorly represent the risks to water quality arising under hydroclimatic non-stationarity. High-frequency monitoring of urban watersheds has revealed that a couple of large storm events can control sediment loads over multiple years and even surpass TMDL-based allowances, suggesting that multi-year or yearly load models could underestimate short-duration extremes [3]. Agricultural catchment research also indicates that storm events trigger dynamic nutrient source areas and contribute excessively to the export of nitrate, phosphorus, and organic carbon [4,5]. Monsoonal agricultural watershed data in South China also indicates that both flood-event concentrations and event mean concentrations of sediment, nitrogen, phosphorus, and ammonia are significantly higher than non-flood conditions, and non-point sources are the major source of total pollutant loads [6]. Moreover, critical-source-area research indicates that a small watershed area may be responsible for an unequal share of phosphorus and sediment losses [7], whereas studies on lakes in Taihu and western Lake Erie indicate that nutrient loading, hydrodynamic disturbance, internal loading, and heating may cause non-linear responses of algal bloom which cannot be explained using static compliance levels [8,9,10]. These results account for why average-load control and fixed-compliance-based management fail during event-driven pollution pulses, spatially heterogeneous source activation, and shifting ecological response thresholds. This review covers agricultural, urbanizing, and mixed-use land basins where NPS risks are mainly associated with nitrogen, phosphorus, and sediment, with a selected discussion of pesticides, pathogens, microplastics, and combined sewer overflows and urban diffuse runoff during wet weather, when they demonstrate similar event-driven transport and adaptive control demands.
1.2. Resilience and Governance Demands
The idea of resilience is central to the field of engineering. It ensures the stability of systems near a unique equilibrium and the rate of recovery after perturbation [11]. The ecological focus has changed to consider how systems withstand disturbance without losing their functions, structures, and feedback, with an explicit acknowledgement of several stable states and regime changes [12,13]. A more recent development is applying resilience to social–ecological systems that have the capability to absorb shocks, recover, reorganize, and adapt in the face of changing environmental and socio-economic conditions [14].
Watersheds are the most common coupled socio-hydrologic systems, where climate, land use, hydrology, biogeochemistry, infrastructure, and governance operate at multiple scales. Nevertheless, traditional watershed management remains largely dependent on annual or multi-year averages, calibration by history, and deterministic plans. It tends to underestimate the impacts of extreme events, uncertainty, and adaptive feedbacks [15]. Resilience-based governance therefore offers a more sustainability-oriented approach because it connects scientific evidence with event response, long-term functional stability, and adaptive decision-making under uncertainty [15,16].
1.3. Scope and Novelty
The reviewed article summarizes the causal chain of climate-induced changes in the hydrologic cycle, mobilization and loading of NPS pollutants, the response of the receiving water, measurement of resilience, and adaptive governance. Its sources are authoritative reports and SCI-indexed studies published in the period between 2000 and 2025, and include large hydroclimatic situations, such as arid/semi-arid, temperate humid, monsoonal, and cold/alpine regions. The main pollutant groups are nitrogen and phosphorus (N/P) sediments.
The novelty of the review is not just another list of NPS models or climate effects. Rather, it combines four concepts which are usually addressed individually: measurable resilience dimensions, localized selection of indicators, model comparison with awareness of uncertainties, and adaptive governance based on triggers. In contrast to earlier reviews focusing on sources of pollution, BMP effectiveness, or the impact of climate change alone, this synthesis relates source–pathway–receptor processes to operational measures, quantitative limits, and failure modes of models, powerful strategy sets, and monitoring–trigger–action (MTA) implementation cycles.
1.4. Research Motivation and Core Questions
In order to ensure that NPS pollution governance is supported by hydroclimatic non-stationarity, this review answers four interconnected research questions:
Q1. How can comparable and operational resilience metrics be created at the event, seasonal, multi-annual, and spatially nested watershed scales to quantify resistance, recovery, robustness, and persistence?
Q2. What is the interaction between climate change and land-use change, which can be mediated by extreme rainfall, drought–rewetting sequences, warming, and changes in the freeze–thaw or snowmelt regime, with geomorphic setting, hydrological connectivity, biogeochemical transformation, and human activities that cause a reformation of pollutant generation, transport, hot moments, hotspots, and receiving-water responses?
Q3. What are the best methods to integrate hydrological–water-quality models, machine learning (ML) and hybrid strategies, observational and experimental evidence, scenario building, and uncertainty analysis to enhance the credibility of resilience assessment, attribution and extrapolation in non-stationary conditions?
Q4. In which contexts could the resilience of adaptation strategies and portfolios, such as nature-based solutions (NBS), best management practices (BMPs), low-impact development (LID), and institutional or market-based measures, be evaluated in uncertain future circumstances? Which decision frameworks are most appropriate to enable adaptive pathways backed by triggers and adaptive governance?
1.5. Literature Search and Source Selection
This narrative review was supported by a structured literature search to improve transparency and source coverage. Searches were conducted through Web of Science, Scopus, and Google Scholar. The search interval was between January 2000 and December 2025. Search strings included search items on diffuse pollution, climate forcing, resilience, modeling, and adaptation, such as: (“climat* change” OR “extreme weather”) AND (“non-point source pollution” OR “diffuse pollution” OR “ water quality “) AND (watershed OR catchment) AND (resilience OR robustness OR adaptive capacity OR vulnerability).
The initial search produced a pool of 1073 potentially relevant sources. Then, 171 overlapping records were removed, and 902 titles and abstracts were checked for relevance. In total, 336 full texts were consulted, and 198 sources were not retained since they did not address watershed-scale processes, did not discuss climate or hydrological non-stationarity, offered only generic descriptions of pollution without relevance to resilience or management, or repeated evidence already covered by more comprehensive studies. The main evidence base for this narrative synthesis consisted of 138 peer-reviewed articles and authoritative reports. Additional conceptual and methodological studies are presented in the text to clarify the relevant theories and formulas. Source relevance was considered based on the clarity of the data and methods, applicability to NPS processes or management, consideration of uncertainty, transferability across different hydroclimatic scenarios, and the presence of empirical or model-based evidence.
2. Theory and Quantification of Watershed NPS Resilience
2.1. Conceptual Boundaries and System Composition
The NPS pollution system of the watershed area may also be perceived as a coupled socio-hydrological system based on the source–pathway–receptor–governance framework [17] (Figure 1). Sources are activities producing pollutants and land use units comprising cropland, livestock operations, urban drainage systems, and industrial emissions [18]. Pathways consist of overland flow, subsurface flow, river channels, ditch networks, soils, and atmospheric deposition pathways in which pollutants are moved and transported; the most important transport pathway during extreme events is runoff, which is critical for export at the scale of an event [19]. Receptors are rivers, lakes, reservoirs, estuaries, soils, and their associated ecosystems, the status of which defines the ecological and human health impacts of NPS pollution [20]. Institutions, policies, management practices, and engineering- or nature-based measures that regulate source inputs, interrupt transport processes, and enhance recovery constitute governance [21].
Figure 1.
Source–pathway–receptor–governance framework for watershed NPS pollution. The blue arrows indicate the main transport pathways of pollutants from sources to receptors, including surface runoff, water-body transport, and atmospheric deposition. The downward arrows associated with clouds represent precipita-tion-driven transport, while the small red arrows indicate accelerated or enhanced transport processes under extreme climate events.
Two complementary lenses are used to interpret system boundaries. The drivers–pressures–state–impact–response (DPSIR) framework refers to a chain of climatic and socio-economic drivers of pressures, changes in state, impacts, and responses; hence, resilience assessment is associated with policy evaluation. The socio-hydrology viewpoint focuses on the co-evolution of human activities, investment, and regulation, which contribute to pollutant loading and the recovery curve. By contrast, hydrological perturbations occur in response to decision-making [22]. As such, the process of generating pollutants is based on land-use and geomorphologic patterns; transportation processes are based on hydrologic connectivity, and pollutants in recipient waters rely on critical nodes and breakpoints, which produce hot moments and hotspots [23]. All these perspectives form the foundation for determining leverage points in resilience-based watershed management.
2.2. Resilience Dimensions and Quantification Indicators
Resilience has been operationalized in four complementary dimensions in this framework: review resistance (Rs), recovery (Rc), robustness (Rb), and persistence (Rp). Resistance is the capability of a system to restrict departure from a reference state when disturbed [24]. Recovery is the rate and effectiveness at which the system returns to a baseline after perturbation [25]. Robustness is the capability of performing well under various interacting stressors, situations, and boundaries [26]. Persistence refers to the ability to preserve critical functions over time without gradual deterioration, regime changes, or collapse [27].
As resilience has multiple dimensions, there can be no single measurement. Rather, evaluation involves complementary measures that describe event-scale exceedance and recovery, cross-scenario stability, and long-term drift. As illustrated in Figure 2 and explained in Supplementary Methods S1, the indicator system incorporates metrics of disturbance (e.g., exceedance probability, duration, and magnitude) [28,29,30], recovery (e.g., recovery time and AUC*) [31,32,33], robustness (e.g., tail quantiles and compliance scenario fraction) [34,35,36,37], and persistence (e.g., long-term compliance, drift, and state transitions) [38,39,40,41]. This structure offers a functional connection between knowledge of processes and aiding in decision-making.
Figure 2.
Four-dimensional resilience indicator framework: resistance, recovery, robustness, and persistence.
2.3. Indicator Integration and Localization
To integrate assessment of external pressures, intrinsic system characteristics and governance capacity, the four dimensions of resilience are incorporated into an exposure–sensitivity–adaptive capacity (E-S-A) model. Exposure refers to the magnitude, rate, length, and spatial pattern of perturbations. Sensitivity is the size and elasticity of a response in a system. Adaptive capacity is the institutional, technical, and resource-based capability to respond, learn, and restructure due to change [42,43]. According to this structure, E-S-A elements serve as explanatory dimensions and management levers, with Rs, Rc, Rb, and Rp representing the measurable resilience results.
The E-S-A model was chosen as an organizational structure because it distinguishes three decision-related factors that are frequently combined in the research of NPS within a watershed: external hydroclimatic exposure, internal sensitivity of the watershed, and adaptive capacity developed through monitoring, infrastructure, institutions, and resources. This division allows physical drivers to be associated with measurable resilience outcomes and helps identify management levers that could be influenced by the watershed manager.
The connection has been made with system-response tracts. Variations in exposure, sensitivity, and adaptive capacity change the threshold exceedance, peak magnitude, recovery slope, cross-scenario variance, and long-term functional drift. This indicator of resilience is interpreted not only as a descriptive output but also as an intervention target. Practically speaking, the E-S-A structure makes clear how climate forcing, landscape features, and governance decisions combine to define event response, multi-scenario performance, and long-term maintenance of functionality (Figure 3).
Figure 3.
Directional links between exposure, sensitivity, adaptive capacity, and the four resilience dimensions. The upward arrows (↑) indicate an increase in the corresponding indicator.
The indicator system is modular rather than a mandatory checklist. For comparison across basins, a minimal core must consist of a declared and ; or ; and AUC*; or ; and Flong or . The other indicators are situation-specific: first-flush ratio, algal-bloom trigger frequency and paddy-drainage connectivity in monsoon agricultural basins; winter/spring nutrient export ratio, freeze–thaw erosion index and snowmelt exceedance duration in cold agricultural basins; drought storage index, rewetting pulse magnitude, and event tail quantile in arid and semi-arid basins; and CSO frequency/duration/load, pump or gate failure probability and LID clogging index in urban combined or mixed drainage basins (Table 1).
Table 1.
Localizing resilience indicators while retaining a comparable core set.
2.4. Cross-Scale Analysis, Hot Moments, and Hotspots
The variability in exposure and sensitivity determines the temporal and spatial distribution of risks associated with pollutants. Adaptive capacity is determined by whether such risks can be predicted and controlled. Resilience analysis has at its core hot moments and hotspots: they specify times and places where concentrations or loads increase significantly above background levels due to extreme precipitation, fertilizer use, changes in connectivity, or other causal factors [51].
Three families of methodology are particularly important. Event- and threshold-based methods involve identifying abrupt pollutant reactions by specifying hydrological or water-quality thresholds and lending themselves to storm pulses and rewetting droughts [58]. Connectivity and graph-based methods are used to identify important nodes and pathways, as well as breakpoints that control pollutant transfer across the watershed; hence, they assess system-level resilience [59,60]. Statistical and ML methods at cross-scales recognize constant controllers and enhance prediction in non-homogeneous watersheds [61]. All of them enable zoned, hierarchical, and adaptive governance by identifying areas and times of intervention.
2.5. Uncertainty Decomposition and Propagation
A future-oriented resilience evaluation is essentially a decision-making issue in the context of deep uncertainty. Uncertainty in watershed NPS pollution systems has its origins in at least three sources, including uncertainty of scenarios related to future socio-economic development, and climate forcing, structural uncertainty related to model formulation and process representation and parametric uncertainty related to a lack of information on coefficients and state variables [62,63]. These uncertainties correspond to the entire set of elements in the E-S-A framework. Exposure is uncertain since the timing, intensity, and clustering of future extremes cannot be predicted. Sensitivity is uncertain since hydrological, ecological, and biogeochemical responses can differ between systems and scales. Adaptive capacity is uncertain since policy implementation, technology adoption, and institutional effectiveness change over time.
Since uncertainty is propagated throughout the source–pathway–receptor–governance continuum, it influences not only estimates of resilience but also the projected behavior of management measures. Typical methods include GLUE, Monte Carlo simulation, Bayesian inference, multi-model ensembles, and cross-validation [64]. Their combined application results in a clearer and stronger assessment of strategies and decreases overconfidence in deterministic planning.
3. Models and Data: An Assessment Toolkit
3.1. Model Families and Critical Applicability
Climate-impact and resilience assessments are based on hydrological–water-quality models, although their utility depends on process representation, scale, data requirements, and failure models. A comparison of eight representative families (SWAT [65,66], HSPF [67,68], MIKE SHE [69,70], AnnAGNPS [71,72], SPARROW [73,74], VIC [75,76], SWMM [77,78], and machine-learning or hybrid models [79,80,81]) is presented in Table S1 in the Supplementary Material. It is viewed in terms of decisions rather than software catalogs.
There is no singular family that can encompass all the dimensions of resilience. The process models assist in diagnosing mechanisms and testing spatial interventions, although they can be extrapolated poorly in cases where parameters, connectivity, storage-release behavior, or management feedback vary. Event models solve short pollution pulses but are poor at persistence. Statistical and machine-learning models can enhance prediction and ensemble speed but require representative training examples. The choice of model must therefore be based on the prevailing decision and failure risk, with multi-model or hybrid integration being employed only in situations where increased complexity can be justified.
3.2. Scenarios and Forcing Data
The future-oriented resilience evaluation is based on situations that capture climatic forcing and socio-economic–land-use change together. Downscaling climate and bias correction is important because they define how extremes, seasonality, and dependence structures are translated into forcing at the watershed scale. Dynamical downscaling has higher physical realism in complex terrain and extremes, while statistical downscaling is efficient in large ensemble analysis [82,83]. Bias correction must maintain extreme-value behavior and the time correlation in both examples. A multi-model, multi-method ensemble approach is a better way to represent climate uncertainty [84,85].
The land-use and management pathways should also integrate into the SSP-consistent development paths. Agricultural scenarios must depict BMP uptake, fertilizer timing, and crop changes; urban scenarios must depict impervious growth, changes in drainage, and LID application [86,87,88].
3.3. Machine Learning and Hybrid Modeling
ML and hybrid modeling can only be of use when the operational role of these processes is specified. The current review considers ML as (i) a high-frequency concentration or load series prediction instrument; (ii) a substitute for computationally expensive process models; or (iii) a topology-aware learner of river networks. Stress tests should be performed intentionally to assess these uses to incorporate extreme events, leave-one-period-out validation, and leave-one-subwatershed-out validation.
The case studies demonstrate potential and limitations. LSTM models have been found to be superior to conventional hydrology models for continuous streamflow prediction in ungauged basins, given that they are trained on large training sets [79,89], and GNNs can capture river-network topology to predict water quality at multiple points [80]. Hydrodynamic surrogates may also be used as physics-informed neural networks (PINNs) and physics-guided machine learning (PGMLs) to minimize the cost of ensembles [81]. Nevertheless, ML failure modes are significant; examples include extrapolating data outside the training climate, false associations with seasonality, missing information for extreme events, and loss of interpretability. An acceptable solution is to apply process models to causal attribution and strategy representation, and apply ML or surrogate models to event detection, gap filling, rapid ensemble screening, and uncertainty exploration.
3.4. Model Credibility and Uncertainty Propagation
Applications based on resilience require more than traditional goodness-of-fit measures. Since they entail non-stationary forcing, multiple process domains, and strategy comparison under uncertain conditions, credible assessment needs to integrate multi-objective calibration, uncertainty quantification, transferability tests, and reproducible workflows. The typical performance measures are Nash–Sutcliffe efficiency (NSE) and KGE/KGE’ which are best interpreted using bias–variance correlation decomposition to prevent compensation between errors [90]. Residual diagnostics and structural evaluation are recommended to evaluate the stability of prediction; MCMC-based inference may facilitate parameter estimation and formal uncertainty characterization [91,92].
To enhance generalization, leave-one-subwatershed-out and leave-one-period-out validation must be used, and when feasible, multi-source data assimilation should limit states and parameters [89]. An end-to-end workflow based on the scenario–hydrology–water-quality–resilience–strategy assessment is needed to ensure traceability and relevance to policies.
Theoretically, model selection needs to be problem-oriented rather than model-oriented. One should use process-based models in cases where the aim is to diagnose source–pathway–receptor mechanisms, assess the appropriate BMP location, or consider climate–land use interactions. Event-based models are more suitable in cases where the issue of concern is short-duration storm pulses, CSO behavior or initial flush dynamics. Data-driven models are best used when monitoring networks are extensive, emulation speed is paramount, or scenario ensembles are computationally expensive. Such hybrid frameworks are becoming more popular as they permit mechanistic interpretability while increasing computational efficiency and predictive versatility.
The same reasoning can be applied to the treatment of uncertainty. Scenario uncertainty must not be treated merely at the climate-input level, but must be translated into hydrological states, pollutant loads, resilience indicators, and decision outcomes. Structural uncertainty cannot be minimized by model intercomparison alone; instead, important controls like connectivity, storage-release dynamics, and management feedback must be present at the correct scale. Parametric uncertainty must be employed not only to provide confidence limits but to determine the variables most limiting to strategy robustness.
The propagation of uncertainty must adhere to the complete evaluation sequence: climate model/SSP-RCP choice → downscaling and bias adjustment→land-use and management trajectories → hydrological conditions → load and concentration of pollutants → indicators of resilience → ranking of strategies. Multi-model climate and land-use ensembles are used to represent scenario uncertainty, model family comparisons to represent structural uncertainty, and GLUE, Bayesian inference, MCMC, or Monte Carlo sampling to represent parametric uncertainty. Thus, the final reporting should offer a distribution of , AUC*, Trec, , , and rather than single deterministic values.
These methodological factors are directly relevant to governance. In cases where the models cannot realistically depict hot moments, connectivity thresholds, and management failure modes, strategy screening can be used; however, it can be deceptive even when the average performance seems satisfactory. On the other hand, evaluation systems that explicitly consider event response, multi-scenario performance, and long-term persistence are more effective at recognizing situations when apparently effective strategies are prone to failure in changing climatic conditions.
4. Mechanisms and Evidence of Climate Change Impacts on Pollution Processes
4.1. Hydroclimatic Forcing and Source–Pathway Coupling
Extreme rainfall has a significant impact on the movement and deposition of pollutants. Hortonian overland flow rates increase quickly when rainfall intensity exceeds infiltration capacity, and erosion becomes intense. Simultaneously, particulate-bound phosphorus transport rates also increase, and this excessive initial increase in flow is referred to as the first-flush effect [93,94,95]. In agricultural catchments, high rainfall rates occurring simultaneously with fertilizer application or cultivation may also cause pulses in dissolved nitrogen, which result in a coupled high-flow, high-concentration export regime [5,96,97]. Therefore, changes in climate not only enhance the size of events but also enhances the coupling of hydrological forces and vulnerable management periods.
Drought–rewetting sequences produce another significant pathway. In drought periods, runoff and baseflow decrease, hydrological connectivity decreases, and soluble N and P build-up in soil pores, ditches, and stagnant water occurs, which may be concentrated due to evaporation and heatwaves [53,54,98]. Rewetting re-establishes hydrological transport pathways and quickly clears stored material. The process produces strong but brief pollutant surges, the magnitude of which may exceed background or average levels. This amplitude is related to the amount of pre-existing storage and the degree of reconnection [54,99].
Changes in snow cover and more frequent freeze–thaw regimes in cold and alpine areas alter runoff timing, increase overlap between high spring flows and agricultural applications, and destabilize soil structures, thus increasing nutrient export, erosion, and solute leaching [49,100,101].
In all three forms of forcing, the main point is that climate change alters the timing and efficacy of source–pathway coupling. Table 2 presents evidence-based mechanisms linking climate forcing to NPS pollution resilience indicators.
Table 2.
Evidence-based mechanisms linking climate forcing to NPS pollution resilience indicators.
4.2. Temperature, Moisture, and Biogeochemical Regulation
Also, climate change affects the biogeochemical processes of pollutants through temperature and moisture. In general, warming can lead to faster decomposition of organic matter, ammonification, nitrification, and denitrification at a certain thermal range, altering the partitioning of N between dissolved and gas forms of N loss [102,103,104]. Background nitrate concentrations are elevated by moderate warming, whilst higher warming promotes denitrification and gaseous loss. The overall effect of warming on phosphorus is highly sensitive to redox conditions: warming could increase the process of mineralization and turnover of bioavailable P. However, in oxic environments, sorption to iron and aluminum oxides might partially counteract this release; in anoxic environments, decreased sorption may significantly enhance the availability of P [105,106,107].
Hydrological fluctuations do affect these processes. When it is dry, nitrification occurs, and denitrification ceases as anaerobic microsites shrink, leading to the buildup of nitrate. At the same time, decreased water volume and increased residence time may cause algal proliferation. After rewetting, the stored dissolved N is quickly exported, whereas the decomposition of algal biomass and imported organic material uses up oxygen, leading to hypoxia [53,99,108]. Hypoxia also increases internal P loading by decreasing sorption capacity of sediments and can change N cycling via denitrification [109,110]. These findings show that climate-related hydrological fluctuation, redox shift, and N–P cycle are closely integrated.
Vegetation responses represent an additional complexity level. Increased productivity, changes in root characteristics, and modification of C–N–P interactions can be induced by raised CO2 and extended growing seasons, but they are limited by stoichiometry, water stress, and nutrient limitation [111,112,113]. Consequently, the overall impact of exported nutrients is heterogeneous within different regions and vegetation.
4.3. Connectivity, Critical Source Areas, and Human Activities
The impact of climate change on NPS pollution is not only seen through the alteration of the source strength but also through the reorganization of hydrological connectivity. During high-intensity rainfall, the production of runoff in hillslopes and its convergence increase, which enhances the interaction between hillslopes, ditches, and river networks and changes former potential source regions to dominant export regions [114,115]. When exposed to long-term drought, CSAs may be moved to bare slopes and erosion hotspots due to vegetation degradation, soil cracking, and changed routing [51,116]. Hence, modifications to connectivity decide if the stored pollutants stay in the landscape or are quickly transported to the receiving waters.
Such changes also have a strong relationship with human activities. The infrastructure, design of drainage, management of land, and its restoration may be an amplifier or an attenuator of connectivity. Thresholds and hysteresis are two important characteristics of climate-sensitive NPS dynamics: when connectivity reaches some critical threshold, even small CSAs can generate disproportionately large exports; conversely, when connectivity is disrupted or retention processes are reinstated, the retention of pollutants is enhanced [117]. It is therefore paramount in the prediction and design of interventions that these thresholds are identified.
4.4. Evidence Integration and Attribution Under Uncertainty
The strong attribution of climate effects to the pollution of watersheds also includes triangulation using observations, experiments, and models. Monitoring over extended periods shows tendencies, sudden changes, and regime dynamics, which can be affected by simultaneous land-use modification or mitigation actions [118,119]. High-frequency monitoring is especially useful in the case of identifying the first flushes of storms, drought–rewetting pulses, and other short-duration processes that limit model calibration [120,121]. Paired watersheds and controlled studies are experimental methods that reinforce causal inference and assist in establishing reasonable parameter limits, particularly when repeated at hill slope, headwater, and reach levels [122,123,124].
These combined climatic–hydrology–water-quality models, along with historical reconstruction and counterfactual scenarios, may also be applied to distinguish between the climatic and anthropogenic causes of the observed change [125,126]. Since attributions are based on scenario assumptions, downscaling options, model structure and parameterization, uncertainties must be explicitly quantified, and ensemble distributions, sensitivities, and evidence weightings should be reported [127,128]. Such an evidence chain viewpoint is critical to a trustworthy resilience evaluation due to non-stationarity.
Another consequence is that resilience assessment ought to be an iterative process as opposed to a one-off process. When new monitoring information, scenario updates, or new governance goals are made available, indicators of resilience and rankings of strategies need to be recalculated. It is especially vital in such a watershed where adaptation alters the behavior of the system, e.g., redesigning drainage, reconnecting floodplains, or altering the patterns of farmer adoption. Reassessment on an iterative basis enables decision-makers to differentiate between temporary improvement and permanent resilience gains.
The same is true of attribution as a moving target in non-stationary conditions. Climate forcing, land-use change, and management intervention can also have different relative impacts on the event, seasonal, and multi-annual scales. It implies that evidence integration must be performed explicitly to fit the process timescale with the design of observation and model structure; otherwise, short-term pulses can be overlooked, and long-term drift could be attributed to extreme events.
5. Operational Methodologies for Resilience Assessment
5.1. Event-Scale Resilience Curves
Scale analysis of events measures resistance and recovery in terms of observed or simulated paths of disturbance. Thresholds and baselines should not be considered absolute under non-stationarity based on a long historical average. An operational solution would be to integrate (i) regulatory or ecological thresholds, e.g., water-quality goals of Grade III or algal-bloom limits [129,130]; (ii) changes in seasonality reference baselines estimated by sliding windows or pre-event conditions [131,132]; and (iii) tolerance bands that are indicative of monitoring uncertainty and natural variation [133].
Analysts report on each event, including the event number, rainfall/discharge trigger, threshold definition, baseline method, sampling interval, missing-data ratio, peak concentration or load, exceedance duration, AUC*, and recovery time. Means should be replaced by distributions and tail quantiles since extreme events can have a significant impact on the annual pollutant export and influence the failure of the strategy.
5.2. System Dynamics and Surrogate Models
While the event-scale study addresses both the disturbance and recovery pathways, watershed management may need to assess whether a system crosses critical thresholds into either undesirable or degraded states. Within this framework, system dynamics (SDs) and surrogate models (SMs) are useful complementary tools in evaluating tolerance boundaries, scenario resilience ranges, and cross-scenario strength.
The SD models can describe coupled feedback among the social, ecological, hydrological, and water-quality processes to include the non-linear development of watershed systems. Together with monitoring data and model calibration, SD models can provide an estimate of the tolerance range in which basic system functions are still acceptable, i.e., the highest level of deviation permissible on critical functional measures [24,134]. In comparison, SMs can be used to greatly alleviate the computational load related to large ensemble simulations and quickly examine large-dimensional scenario space. Based on the distributions of indicator responses, they may be applied to build scenario resilience bands, which are multi-scenario performance ranges bound by tolerance limits and which expand the idea of one-dimensional tolerance limits to a broader uncertainty-sensitive evaluation model [135,136].
Taken together, these two methods solve some serious computational bottleneck issues in traditional scenario analysis and maintain the interpretability of resilience measurement. The concept of scenario resilience bands offers a simple visual depiction of how system performance and scenario disturbance severity relate to each other and, hence, helps to extract safety margins afterwards as well as better assess scenarios across all scenarios.
5.3. Network and Connectivity Perspectives
Network- and connectivity-based methods offer a spatially explicit point of view on resilience assessment as they connect watershed topology and dynamic pollutant transport regimes. They are implemented as a combination of fixed structural topology with dynamic functional connectivity that varies based on hydrological conditions. Connectivity representation can be enhanced by constraining model parameters with in situ measurements or data assimilation techniques to increase the realism of the model [137,138,139]. The concept of critical nodes, dominant transport routes, and breakpoints, which are areas in the framework where pollution connectivity suddenly shifts and intervention is most effective in producing disproportionately large system-wide impacts, can be applied to determine these critical nodes [140,141]. These breakpoints are high-priority intervention objectives to control the transfer of pollutants across the watershed.
Management actions such as NBS, BMPs, and LID can be treated as an intervention variable in the network, and their best location can be determined using benefit-maximizing or cost-effectiveness principles [142,143]. Two primary areas of recent methodological advances have been made. To begin with, high-frequency sensor networks have enhanced the decomposition of event procedures and the ability to infer connectivity. Secondly, bootstrap and Bayesian sampling methods have enabled uncertainty to be measured, thus moving resilience indicators to the interval estimations and enhancing inter-catchment comparability.
5.4. Socio-Technical Resilience
The evaluation of socio-technical resilience depends on the fact that governance actors should be considered part of watershed NPS pollution systems instead of being regarded as external conditions. This view is consistent with the adaptive capacity aspect of the E-S-A model, which allows coupled social–ecological systems to be evaluated more fully.
An initial aspect of analysis concerns the governance structure and collaborative capacity. Institutional hierarchy, inter-agency coordination costs, and flexibility of implementation can serve as indicators of the pace and responsiveness of governance systems, which can be used alongside recovery-related water-quality indicators to evaluate the association between the performance of the governance system and the results of environmental interventions [144,145].
The second line of analysis focuses on fiscal and market-based policy mechanisms. Ecological compensation, subsidies, or emissions trading can also affect the implementation of mitigation measures, and difference-in-differences methods and synthetic control methods are examples of causal-inference models that can be employed to isolate the impact of policy intervention on other climatic fluctuations occurring simultaneously [146].
One third line of analysis deals with behavioral reaction and cross-simulation of both human and environmental systems. The approach of representing stakeholder decision-making through agent-based models (ABMs) or dynamic game-theoretic methods could subsequently be combined with hydrological–water-quality models to develop a closed simulation loop. These frameworks can produce hypothetical emission reductions and robustness distributions in worst-case or highly uncertain situations and can thus be used to facilitate resilience-oriented adaptive decision-making [147,148].
5.5. Operational Workflow for Resilience Assessment
To minimize the risk of conceptual overload, this section has transformed resilience assessment into an operational process. The steps are as follows: define the target of decision-making, create a dynamic baseline, identify events, compute resilience measures, spread uncertainty, contrast strategy portfolios, and determine triggers to adaptive behavior (Table 3).
Table 3.
Operational workflow for resilience assessment and adaptive management.
6. Adaptation Strategies and Decision Support
6.1. NBS
NBSs such as riparian buffer strips, floodplain renaturation and wetland restoration may reduce N, phosphorus and sediment pulses mainly via interception, sedimentation, adsorption, denitrification and temporary storage-regulation mechanisms whilst at the same time producing co-benefits in terms of greater habitat heterogeneity and higher carbon sequestration [149,150,151]. These aspects of resilience can be explained in three ways. Firstly, they minimize the strength of threshold exceedance and event-scale AUC*, thus enhancing the resistance to disturbance. Secondly, they decrease the duration of the high-concentration tail attenuation, thus enhancing recovery. Thirdly, they raise the chances of constant adherence to water-quality goals under various conditions, therefore increasing the system robustness.
In order to assess and manage it, the working capacity of NBS (vegetation cover, storage volume, and hydraulic performance) must be clearly related to the indicators of resilience and visible trigger factors. To illustrate this, if the connectivity of hydrology from upstream is increasing, or if the event-scale AUC* is consistently increasing, actions like sediment removal, replanting, or hydraulic maintenance need to be performed immediately to avoid the system falling into a high-load–low-efficiency degenerative cycle.
6.2. Agricultural BMPs
6.2.1. Measure Spectrum and Scenario Sensitivity
Agricultural BMPs such as cover crops, minimal or no tillage, contour farming, precise fertilization, drainage, use of animal manure, and vegetated buffer strips are effective in reducing the export of TN, TP, TSS, and other pathogen indicators in various regions. They also mitigate storm-induced flows of pollution. However, their efficiency is highly situational. The main factors that define the size of a pulse are antecedent moisture levels and initial nutrient storage, whereas soil texture and drainage patterns affect the contribution of dissolved and particulate pollutant fractions relatively. Also, the long-term effectiveness might be significantly weakened by the reduction in adoption rate and deterioration in maintenance [152,153].
6.2.2. Indicator Alignment and Evaluation
On the event scale, evaluation should focus on changes in exceedance probability, exceedance duration, exceedance severity, recovery time, and AUC*, rather than changes in the threshold. Multi-annual scales should explicitly model coupled dynamics of adoption rate, effectiveness decay, and extreme event frequency, cross-scenario feasible/compliance fractions, and protection levels when there is an adverse tail or worst-case scenario. Where possible, priority should be given to paired small watershed studies, phased implementation design, and natural experiments to enhance the strength of causal attributions. Modules of social–behavioral patterns of farmer adoption and compliance must also be added because such patterns are better realistic representations of agricultural adaptive capacity.
6.3. Urban LID and Blue-Green-Gray Hybrid Systems
6.3.1. System Design and Real-Time Control
Bioretention cells, permeable pavements, green roofs, and rain gardens are examples of LID practices that can help decrease flow and pollutant peaks over a short duration and high-intensity rainfall events. They achieve the best performance, however, when combined with the traditional gray infrastructure, which comprises the detention basins, overflow channels, pumping stations, and control gates. Organized real-time control of inflow allocation, storage-release scheduling, and overflow mitigation by rule-based control or model predictive control can significantly decrease the occurrence of CSOs and improve resilience to forecast errors and failure of equipment [55,56,57].
One recent instance of operational supervisory control is finite state machine (FSM) control, which uses simulated annealing to minimize CSO. The FSM manages the pump and valve position in the sewer storage tanks, whereas simulated annealing sets level thresholds and flow-distribution parameters off-line. Optimized FSM has been shown to reduce CSO volumes by up to 56.9%, pollutant loads by up to 61 percent, and the frequency of overflows by up to 40 percent in benchmark urban wastewater models with minimal online computational demands [154]. This is a good example of resilience governance since it translates forecast or sensor data into clear rules governing state transitions, which can be integrated into an MTA loop.
6.3.2. Assessment Priorities and Failure Modes
It is suggested that a dual-indicator system is used to assess urban hybrid systems: (1) curves of event-scale resilience in terms of threshold exceedance, recovery, and AUC*, and (2) metrics based on frequency, duration, and load of CSOs and other overflow events. Ensemble-based assessments must include explicit consideration of operational uncertainties like forecast error, sensor drift, pump failure, and lack of maintenance to assess performance of protection in worst-case situations. Particular attention needs to be paid to degradation processes that impact permeable LID systems, such as high groundwater levels, winter icing, and chronic clogging.
6.4. Institutional and Economic Instruments
6.4.1. Governance Instruments and Adaptive Capacity
Institutional and economic tools are the main factors that contribute to the enhancement of adaptive capacity in the watershed NPS pollution systems. Nutrient trading may be used to focus pollution control on sources that generate lower marginal control costs using overall load limits and non-uniform trading rates [155]. The use of payments for ecosystem services (PESs) can enhance adoption of BMPs and NBS by contracting incentives and compensation mechanisms [156,157]. One necessary condition of these two instruments is a reliable monitoring, reporting, and verification (MRV) system to establish baselines, manage leakage and rebound effects, and determine the responsibilities of long-term maintenance as well as risk-sharing agreements.
6.4.2. Coupling with Resilience Assessment
In the E-S-A context, institutional instruments mainly influence the dimension of adaptive capacity, though they may also indirectly enhance disturbance resistance and resilience over a longer timeframe through enhanced adoption rates and decreased implementation uncertainty. In order to assess resilience, policy design variables, including trading ratios, load caps, payment structures, and penalty levels, are proposed as dimensions of stress-testing scenarios. Meanwhile, equity and distributional results form explicit criteria of strategy acceptability because highly effective yet socially unfeasible solutions must not be chosen unconsciously.
6.5. Multi-Objective Trade-Offs and Synergies
6.5.1. Objective Set
Watershed management often aims at enhancing water-quality adherence, decreasing the risk of flooding, reestablishing the diversity of the ecosystem, increasing carbon storage, and preserving food security concurrently, with limited budget, land resources, and social fairness. The recommendation is thus to have a unified objective vector, i.e., indicators like water-quality threshold exceedance and AUC*, compliance probability, including a worst-case scenario, flood peak reduction, carbon and habitat co-benefits, and cost- and equity-related indicators that describe total expenditure and benefit distribution.
6.5.2. Methodological Approaches
The practical solution would be to create Pareto frontiers by means of the ε-constraint method or multi-objective evolutionary algorithms and then filter out candidate portfolios based on stakeholder preference structures by applying robust MCDA methods. The next step in this process is to perform vulnerability analysis in the context of robust decision making (RDM) to determine which combinations of scenarios lead to strategy failure, including those where the frequency of extreme events increases with decreasing adoption and maintenance decay. Based on this, it is possible to optimize the composition and spatial distribution of adaptation portfolios more efficiently.
6.6. Decision-Method Integration
RDM is a method for selecting strategies that are viable in a broad spectrum of possible futures without necessarily depending on a specific prediction of the future. Generally, the procedure includes four stages, namely scenario sampling, performance comparison, diagnostic vulnerability, and iterative improvement [158,159]. The dynamic adaptive policy pathways (DAPPs) concept focuses on sequencing and timing, structuring deployment, scaling, and switching of measures along pathway maps, adaptation trigger points, and lead times. It is especially appropriate to use DAPP in watersheds with thresholds, lock-in risks, or partially irreversible changes [158,160,161]. Info-gap decision theory, in contrast, emphasizes tolerance analysis in extreme non-probabilistic uncertainty and can be applied to determine the guarantee region of the candidate strategies in worst-case scenarios that cannot be described probabilistically [162].
A combined method of working is thus advisable. Robust candidate portfolios must be initially filtered through RDM based on a common indicator system and explicit uncertainty decomposition. DAPPs may subsequently be applied to candidates grouped into tiered pathways, such as baseline, enhanced, and diversion pathways, depending on trigger conditions and sequencing logic. Lastly, Info-Gap analysis can be utilized to examine the minimum guaranteed domain of each of these pathways in conditions of non-probabilistic uncertainty, and thus, generate adaptation portfolios which are both analytically robust and practically implementable.
6.7. Scenario Robustness and the MTA Closed Loop
6.7.1. Cross-Scenario Comparison
In a scenario matrix in which shared socio-economic pathways and representative concentration pathways (SSPs-RCPs) are combined with land use-management pathways, the performance of each strategy portfolio should be quantified in the form of quantile-based outcome measures and tail-risk measures and subsequently evaluated against the specified worst-case protection conditions. At this stage, we obtained a list of strong candidate portfolios that satisfy all possible credible futures.
6.7.2. Closed-Loop Implementation
The key processes and resilience indicators must subsequently be included in an MTA loop. The observable leading variables or composite indicators may be identified as adaptation tipping points or operational triggers, and after the observation of these thresholds, pathway changes or intensified measures need to be started. This closed-loop structure, when combined with DAPPs, may be useful to control the lock-in risk, lead time, and budget allocation during changing conditions.
To put this into practice, implementation can be started with a manager-facing trigger register. Every trigger needs to indicate the monitored variable, the data source, the calculation duration, the threshold, the lead time, the responsible institution, the funding method, and the action approved in advance. For example, a wet-season TP AUC* exceedance by more than the rolling 90th percentile during two subsequent storms could initiate buffer maintenance and fertilizer-window constraints; a predicted CSO overflow likelihood greater than a specified threshold could cause temporary storage to be used as well as RTC regulations; and a long-term increase in Chl-a or hypoxia occurrence could cause escalation from baseline BMPs to wetland extension or sediment control.
6.7.3. Governance Implications
The MTA framework can be applied with fiscal and institutional tools like water-quality trading (WQT) and PES to change the idea behind the concepts of who pays, who gains, and who reimburses measurable performance indicators and contract trigger conditions. This is made possible by lowering the level of uncertainty in implementation and maintenance and making sure that extreme year-tail-risk performance is part of both annual and rolling assessments.
6.8. Illustrative Application: Monsoon Agricultural-Lake Basin
An example of this work can be applied to a Taihu-style monsoon agricultural-lake basin. The aim of management is not to exceed the seasonal thresholds of inflow-river TP and TN without creating conditions of cyanobacterial bloom in the receiving lake. Baseline X0(t) is calculated using a 10-year seasonal reference distribution and is recalculated each year; (t) is the combination of the regulation water-quality standard with an ecological bloom-risk threshold. Data are detected when daily rainfall has exceeded the local 95th percentile, or discharge has exceeded the 90th percentile in the fertilization and drainage season.
The assessment computes Pexc, Dexc, Mexc, AUC*, and Trec for TP and TN. The evaluation of robustness is carried out by generating SSP-RCP climate scenarios, land-use pathways, model-structure alternatives, and BMP adoption ensembles; the appropriate outputs are Qadv(), Pfeas(), Pout(), and strategy-specific ΔLmax(). Persistence is measured in terms of Flong and β based on seasonal or annual time series. A basic portfolio consists of soil tests and formula fertilization, vegetated ditches, riparian buffers, and wetland retention. A better pathway involves paddy-drainage management, real-time advice on fertilizer application based on rainfall, and increased wetland storage capacity. A diversion pathway is set aside should there be recurring exceedance or a bloom-risk trigger. The MTA loop connects the triggers with actions: repeated storm-event AUC* exceedance leads to buffer maintenance and fertilizer rescheduling; increasing lake Chl-a or the hypoxia rate leads to internal-loading investigation; and falling BMP adoption leads to payment adjustment or enforcement. The present application shows that the framework can shift between indicators and decisions; a full-fledged numerical example could also provide data on events, number of scenarios, computed indicator values, and portfolio rankings.
7. Conclusions and Prospects
The changing climate is altering watershed NPS pollution systems by changing the strength of pollutant sources, pathway efficiency of transport, and feedback of receptors due to changes in rainfall extremity, drought–rewetting cycles, freeze–thaw processes, and background warming. These changes create hot moments and hotspots of pollution risk at the event scale, hydroclimatic non-stationarity, and the normalization of compound extremes at the multi-annual scale. In this context, a resilience-based approach offers a unified paradigm to manage NPS pollution, and rather than concentrating on achieving a level of compliance, it focuses on responding to events, long-term resilience, and adaptive governance. The four complementary dimensions that characterize system performance within this framework are resistance, recovery, robustness, and persistence, whereas the E-S-A framework provides an analytical structure to external forcing, internal system response, and governance capacity, where uncertainty is explicitly introduced into decision-making. This sustainability-oriented framing aligns watershed NPS management with long-term water security, ecosystem integrity, and resilient development.
Future development is expected to appear in leading peer-reviewed journals in four general directions. Firstly, standardization of metrics and protocols is necessary to create a minimum reporting structure to identify an event, define a threshold, calculate an indicator, and disclose uncertainties so that comparability across watersheds and studies can be enhanced. Secondly, increased focus must be placed on compound risks and non-stationary theory involving the use of explicit connectivity thresholds, critical transitions, and early-warning signals in monitoring and modeling frameworks, with focus placed on tail-risk characterization instead of mean-condition analysis. Thirdly, it is necessary to integrate mechanisms and data even more deeply, especially by creating physics-constrained artificial intelligence (AI), SMs, and automated uncertainty-quantification pipelines, which could support massive scenario screening and extreme-year stress testing, with interpretability and extrapolation stability as non-negotiable conditions. Finally, the shift towards closed-loop governance needs to be hastened by incorporating NBS, BMPs, LID, and institutional tools into a coordinated strategy portfolio and developing trigger-based adaptive pathways based on RDM, DAPPs, and Info-Gap models, incorporating MRV with equity constraints into performance measures and contracts, and ensuring the presence of a long-term MTA governance system.
Supplementary Materials
The following supporting information can be downloaded at https://www.mdpi.com/article/10.3390/su18136917/s1, Methods S1: Algorithms for measurement indicators of four resilience dimensions (disturbance resistance, recovery capacity, robustness, and persistence indicators); Table S1: Comparison of model families (scale, inputs, modules, costs, and applicable scenarios).
Author Contributions
Conceptualization, B.-L.L. and C.-X.Y.; methodology, B.-L.L.; validation, S.-P.Y. and C.-Q.S.; formal analysis, C.-X.Y.; investigation, C.-X.Y.; resources, S.-P.Y.; data curation, C.-Q.S.; writing—original draft preparation, B.-L.L.; writing—review and editing, B.-L.L.; visualization, J.-L.R.; supervision, B.-L.L.; project administration, B.-L.L.; funding acquisition, C.-X.Y. and C.-Q.S. All authors have read and agreed to the published version of the manuscript.
Funding
This research was funded by the Heilongjiang Provincial Natural Science Foundation of China (PL2024E018) and The Harbin University Special Fund for Rural Revitalization Doctoral Scientific Research (HXC2023003).
Institutional Review Board Statement
Not applicable.
Informed Consent Statement
Not applicable.
Data Availability Statement
The original contributions presented in this study are included in the article/supplementary material. Further inquiries can be directed to the corresponding author.
Acknowledgments
AI-assisted language editing and manuscript-formatting support were used. The authors retain responsibility for the scientific content, data interpretation, and accuracy.
Conflicts of Interest
Author Bao-Ling Liu was employed by the company Harbin Institute of Technology National Engineering Research Center for Water Resources Co., Ltd. The remaining authors declare that the research was conducted in the absence of any commercial or financial relationships that could be construed as a potential conflict of interest.
Abbreviations
The following abbreviations are used in this manuscript:
| ABMs | Agent-Based Models |
| AI | Artificial Intelligence |
| AnnAGNPS | Annualized Agricultural Non-Point Source Pollution Model |
| BMPs | Best Management Practices |
| C | Carbon |
| Chl-a | Chlorophyll-a |
| CSAs | Critical Source Areas |
| CSOs | Combined Sewer Overflows |
| DAPP | Dynamic Adaptive Policy Pathways |
| DPSIR | Drivers–Pressures–State–Impact–Response |
| E–S–A | Exposure–Sensitivity–Adaptive Capacity |
| FSM | Finite State Machine |
| GLUE | Generalized Likelihood Uncertainty Estimation |
| GNNs | Graph Neural Networks |
| HSPF | Hydrological Simulation Program–Fortran |
| KGE | Kling–Gupta Efficiency |
| LID | Low-Impact Development |
| LSTM | Long Short-Term Memory |
| MCDA | Multi-Criteria Decision Analysis |
| MCMC | Markov Chain Monte Carlo |
| MIKE SHE | MIKE European Hydrological System |
| ML | Machine Learning |
| MRV | Monitoring, Reporting, and Verification |
| MTA | Monitoring–Trigger–Action |
| N | Nitrogen |
| N2 | Dinitrogen |
| NBSs | Nature-Based Solutions |
| NH4+ | Ammonium |
| NO3− | Nitrate |
| N2O | Nitrous Oxide |
| NPS | Non-Point Source |
| NSE | Nash–Sutcliffe Efficiency |
| P | Phosphorus |
| PES | Payments for Ecosystem Services |
| PGML | Physics-Guided Machine Learning |
| PINN | Physics-Informed Neural Network |
| RCPs | Representative Concentration Pathways |
| RDM | Robust Decision-Making |
| RTC | Real-Time Control |
| SDs | System Dynamics |
| SMs | Surrogate Models |
| SPARROW | Spatially Referenced Regression on Watershed Attributes |
| SSPs | Shared socio-economic Pathways |
| SWAT | Soil and Water Assessment Tool |
| SWMM | Storm Water Management Model |
| TN | Total Nitrogen |
| TP | Total Phosphorus |
| TSSs | Total Suspended Solids |
| VIC | Variable Infiltration Capacity |
| WQT | Water-Quality Trading |
References
- Ridder, N.; Ukkola, A.; Pitman, A.; Perkins-Kirkpatrick, S. Increased occurrence of high impact compound events under climate change. npj Clim. Atmos. Sci. 2022, 5, 1–8. [Google Scholar] [CrossRef] [Scilit]
- Wang, H.; Liu, J.; Klaar, M.; Chen, A.; Gudmundsson, L.; Holden, J. Anthropogenic climate change has influenced global river flow seasonality. Science 2024, 383, 1009–1014. [Google Scholar] [CrossRef] [Scilit] [PubMed]
- Miller, S.A.; Webber, J.S.; Jastram, J.D.; Aguilar, M.F. Using high-frequency monitoring data to quantify city-wide suspended-sediment load and evaluate TMDL goals. Environ. Monit. Assess. 2023, 195, 1372. [Google Scholar] [CrossRef] [Scilit] [PubMed]
- Blaen, P.; Khamis, K.; Lloyd, C.; Comer-Warner, S.; Ciocca, F.; Thomas, R.; MacKenzie, A.; Krause, S. High-frequency monitoring of catchment nutrient exports reveals highly variable storm event responses and dynamic source zone activation. J. Geophys. Res. Biogeosci. 2017, 122, 2265–2281. [Google Scholar] [CrossRef] [Scilit]
- Yue, F.; Li, S.L.; Waldron, S.; Oliver, D.; Chen, X.; Li, P.; Peng, T.; Liu, C.-Q. Source availability and hydrological connectivity determined nitrate-discharge relationships during rainfall events in karst catchment as revealed by high-frequency nitrate sensing. Water Res. 2023, 231, 119616. [Google Scholar] [CrossRef] [Scilit] [PubMed]
- Hu, H.; Huang, G. Monitoring of Non-Point Source Pollutions from an Agriculture Watershed in South China. Water 2014, 6, 3828–3840. [Google Scholar] [CrossRef] [Scilit]
- Zhou, Y.; Deng, J.; Li, Z.; Wang, T.; Du, Y.; Zhao, S.; Zhang, X. Targeting the critical source areas of phosphorus based on hydrological sensitive area delineation to control nonpoint source pollution in watersheds. Front. Environ. Sci. 2022, 10, 1020336. [Google Scholar] [CrossRef] [Scilit]
- Qin, B.; Yang, G.; Ma, J.; Wu, T.; Li, W.; Liu, L.; Deng, J.; Zhou, J. Spatiotemporal Changes of Cyanobacterial Bloom in Large Shallow Eutrophic Lake Taihu, China. Front. Microbiol. 2018, 9, 451. [Google Scholar] [CrossRef] [Scilit] [PubMed]
- Qin, B.; Deng, J.; Shi, K.; Wang, J.; Brookes, J.; Zhou, J.; Zhang, Y.; Zhu, G.; Paerl, H.; Wu, L. Extreme Climate Anomalies Enhancing Cyanobacterial Blooms in Eutrophic Lake Taihu, China. Water Resour. Res. 2021, 57, e2020WR029371. [Google Scholar] [CrossRef] [Scilit]
- Bertani, I.; Obenour, D.; Steger, C.; Stow, C.; Gronewold, A.; Scavia, D. Probabilistically assessing the role of nutrient loading in harmful algal bloom formation in western Lake Erie. J. Gt. Lakes Res. 2016, 42, 1184–1192. [Google Scholar] [CrossRef] [Scilit]
- Cinner, J.E.; Barnes, M.L. Social Dimensions of Resilience in Social-Ecological Systems. One Earth 2019, 1, 51–56. [Google Scholar] [CrossRef] [Scilit]
- Baho, D.; Allen, C.; Garmestani, A.; Fried-Petersen, H.; Renes, S.; Gunderson, L.; Angeler, D. A quantitative framework for assessing ecological resilience. Ecol. Soc. 2017, 22, 17. [Google Scholar] [CrossRef] [Scilit] [PubMed]
- Holling, C. Resilience and Stability of Ecological Systems. Annu. Rev. Ecol. Evol. Syst. 1973, 4, 1–23. [Google Scholar] [CrossRef] [Scilit]
- Li, T.; Dong, Y.; Liu, Z. A review of social-ecological system resilience: Mechanism, assessment and management. Sci. Total Environ. 2020, 723, 138113. [Google Scholar] [CrossRef] [Scilit] [PubMed]
- Li, J.; Liu, G.; Shen, Z. Integrating spatiotemporal variability of non-point source pollution and best management practice efficiency to improve adaptive watershed management. Water Res. 2025, 284, 124042. [Google Scholar] [CrossRef] [Scilit] [PubMed]
- Johnson, T.; Butcher, J.; Santell, S.; Schwartz, S.; Julius, S.; LeDuc, S. A review of climate change effects on practices for mitigating water quality impacts. J. Water Clim. Change 2022, 13, 1684–1705. [Google Scholar] [CrossRef] [Scilit] [PubMed]
- Patterson, J.J.; Smith, C.; Bellamy, J. Understanding enabling capacities for managing the ‘wicked problem’ of nonpoint source water pollution in catchments: A conceptual framework. J. Environ. Manag. 2013, 128, 441–452. [Google Scholar] [CrossRef] [Scilit] [PubMed]
- Wang, X.; Zhang, M.; Liu, L.; Wang, Z.; Lin, K. Using EEM-PARAFAC to identify and trace the pollution sources of surface water with receptor models in Taihu Lake Basin, China. J. Environ. Manag. 2022, 321, 115925. [Google Scholar] [CrossRef] [Scilit] [PubMed]
- Salfety, O.; Sarne, O.; Boindala, S.P.; Abhijith, G.R.; Ostfeld, A. A Cell Model for Pollutant Transport Quantification in Rainfall-Runoff Watershed Events. Water 2025, 17, 1693. [Google Scholar] [CrossRef] [Scilit]
- Belle, G.; Schoeman, Y.; Oberholster, P. Potential Toxic-Element Pollution in Surface Water and Its Implications for Aquatic and Human Health: Source-Pathway-Receptor Model. Water 2023, 15, 3100. [Google Scholar] [CrossRef] [Scilit]
- Badrzadeh, N.; Samani, J.M.V.; Mazaheri, M.; Kuriqi, A. Evaluation of management practices on agricultural nonpoint source pollution discharges into the rivers under climate change effects. Sci. Total Environ. 2022, 838, 156643. [Google Scholar] [CrossRef] [Scilit] [PubMed]
- Mijic, A.; Liu, L.; O’Keeffe, J.; Dobson, B.; Chun, K.P. A meta-model of socio-hydrological phenomena for sustainable water management. Nat. Sustain. 2024, 7, 7–14. [Google Scholar] [CrossRef] [Scilit]
- Shehab, Z.N.; Jamil, N.R.; Aris, A.Z.; Shafie, N.S. Spatial variation impact of landscape patterns and land use on water quality across an urbanized watershed in Bentong, Malaysia. Ecol. Indic. 2021, 122, 107254. [Google Scholar] [CrossRef] [Scilit]
- Imani, M.; Hasan, M.M.; Bittencourt, L.F.; McClymont, K.; Kapelan, Z. A novel machine learning application: Water quality resilience prediction Model. Sci. Total Environ. 2021, 768, 144459. [Google Scholar] [CrossRef] [Scilit] [PubMed]
- Hillebrand, H.; Kunze, C. Meta-analysis on pulse disturbances reveals differences in functional and compositional recovery across ecosystems. Ecol. Lett. 2020, 23, 575–585. [Google Scholar] [CrossRef] [Scilit] [PubMed]
- Huang, J.J.; Sangiorgio, M.; Wu, W.Y.; Maier, H.R.; Wang, Q.J.; Hughes, J.; Castelletti, A. Solving the robustness puzzle: The joint impact of optimization approach, robustness metrics, and scenarios on water resources management under deep uncertainty. J. Environ. Manag. 2025, 373, 123540. [Google Scholar] [CrossRef] [Scilit] [PubMed]
- Salcedo-Sanz, S.; Casillas-Perez, D.; Del Ser, J.; Casanova-Mateo, C.; Cuadra, L.; Piles, M.; Camps-Valls, G. Persistence in complex systems. Phys. Rep.-Rev. Sect. Phys. Lett. 2022, 957, 1–73. [Google Scholar] [CrossRef] [Scilit]
- Yi, C.X.; Jackson, N. A review of measuring ecosystem resilience to disturbance. Environ. Res. Lett. 2021, 16, 053008. [Google Scholar] [CrossRef] [Scilit]
- Sterk, M.; Gort, G.; Klimkowska, A.; van Ruijven, J.; van Teeffelen, A.J.A.; Wamelink, G.W.W. Assess ecosystem resilience: Linking response and effect traits to environmental variability. Ecol. Indic. 2013, 30, 21–27. [Google Scholar] [CrossRef] [Scilit]
- Newton, B.; Spence, C. A resilience framework for physical hydrology. Hydrol. Process. 2023, 37, e14926. [Google Scholar] [CrossRef] [Scilit]
- Ingrisch, J.; Bahn, M. Towards a Comparable Quantification of Resilience. Trends Ecol. Evol. 2018, 33, 251–259. [Google Scholar] [CrossRef] [Scilit] [PubMed]
- Fu, Z.; Li, D.J.; Hararuk, O.; Schwalm, C.; Luo, Y.Q.; Yan, L.M.; Niu, S.L. Recovery time and state change of terrestrial carbon cycle after disturbance. Environ. Res. Lett. 2017, 12, 104004. [Google Scholar] [CrossRef] [Scilit]
- Mebane, C.A. The Capacity of Freshwater Ecosystems to Recover from Exceedences of Aquatic Life Criteria. Environ. Toxicol. Chem. 2022, 41, 2887–2910. [Google Scholar] [CrossRef] [Scilit] [PubMed]
- Rocchetta, R.; Crespo, L.G. A scenario optimization approach to reliability-based and risk-based design: Soft-constrained modulation of failure probability bounds. Reliab. Eng. Syst. Saf. 2021, 216, 107900. [Google Scholar] [CrossRef] [Scilit]
- McPhail, C.; Maier, H.R.; Kwakkel, J.H.; Giuliani, M.; Castelletti, A.; Westra, S. Robustness Metrics: How Are They Calculated, When Should They Be Used and Why Do They Give Different Results? Earths Future 2018, 6, 169–191. [Google Scholar] [CrossRef] [Scilit]
- Bonham, N.; Kasprzyk, J.; Zagona, E.; Smith, R. Interactive and Multimetric Robustness Tradeoffs in the Colorado River Basin. J. Water Resour. Plan. Manag. 2024, 150, 1–12. [Google Scholar] [CrossRef] [Scilit]
- Han, J.X.; Xin, Z.H.; Shan, G.Q.; Liu, Y.Z.; Xu, B.; Zhang, Q.; Zhang, C. Developing nutrient pollution management strategies on a watershed scale under climate change. Ecol. Indic. 2024, 159, 111691. [Google Scholar] [CrossRef] [Scilit]
- Markonis, Y.; Moustakis, Y.; Nasika, C.; Sychova, P.; Dimitriadis, P.; Hanel, M.; Máca, P.; Papalexiou, M. Global estimation of long-term persistence in annual river runoff. Adv. Water Resour. 2018, 113, 1–12. [Google Scholar] [CrossRef] [Scilit]
- Suárez-Sierra, B.M.; Gómez-Montoya, K.M.; Taimal, C.A. Pollutants exceedances modeling using non-homogeneous poisson processes: A case study for Medellín and Bogota, 2018–2020. Air Qual. Atmos. Health 2025, 18, 2385–2404. [Google Scholar] [CrossRef] [Scilit]
- Meyer, K.; Hoyer-Leitzel, A.; Iams, S.; Klasky, I.; Lee, V.; Ligtenberg, S.; Bussmann, E.; Zeeman, M.L. Quantifying resilience to recurrent ecosystem disturbances using flow–kick dynamics. Nat. Sustain. 2018, 1, 671–678. [Google Scholar] [CrossRef] [Scilit]
- Babaousmail, H.; Ayugi, B.; Hammad, Z.; Alupot, D.; Posset, K.R.; Mumo, R.; Rajasekar, A. Quantifying Drought Impacts Based on the Reliability–Resiliency–Vulnerability Framework over East Africa. Climate 2024, 12, 92. [Google Scholar] [CrossRef] [Scilit]
- Chapagain, P.S.; Banskota, T.R.; Shrestha, S.; Khanal, N.R.; Yili, Z.; Yan, J.Z.; Linshan, L.; Paudel, B.; Rai, S.C.; Islam, M.N.; et al. Studies on adaptive capacity to climate change: A synthesis of changing concepts, dimensions, and indicators. Humanit. Soc. Sci. Commun. 2025, 12, 331. [Google Scholar] [CrossRef] [Scilit]
- Wu, C.W.; Shui, W.; Huang, Z.G.; Wang, C.H.; Wu, Y.H.; Wu, Y.P.; Xue, C.Z.; Huang, Y.H.; Zhang, Y.Y.; Zheng, D.Y. Urban heat vulnerability: A dynamic assessment using multi-source data in coastal metropolis of Southeast China. Front. Public Health 2022, 10, 989963. [Google Scholar] [CrossRef] [Scilit] [PubMed]
- Qin, B.; Paerl, H.; Brookes, J.; Liu, J.; Jeppesen, E.; Zhu, G.; Zhang, Y.; Xu, H.; Shi, K.; Deng, J. Why Lake Taihu continues to be plagued with cyanobacterial blooms through 10 years (2007–2017) efforts. Sci. Bull. 2019, 64, 354–356. [Google Scholar] [CrossRef] [Scilit] [PubMed]
- Yan, X.; Xia, Y.; Ti, C.; Shan, J.; Wu, Y.; Yan, X. Thirty years of experience in water pollution control in Taihu Lake: A review. Sci. Total Environ. 2024, 914, 169821. [Google Scholar] [CrossRef] [Scilit] [PubMed]
- Miao, K.; Dai, W.; Xie, Z.; Li, C.; Ye, C. Effect of Grass Buffer Strips on Nitrogen and Phosphorus Removal from Paddy Runoff and Its Optimum Widths. Agronomy 2023, 13, 2980. [Google Scholar] [CrossRef] [Scilit]
- Zhang, X.; Hu, T.; Yang, L.; Guo, Z. The Investigation of Perfluoroalkyl Substances in Seasonal Freeze–Thaw Rivers During Spring Flood Period: A Case Study in Songhua River and Yalu River, China. Bull. Environ. Contam. Toxicol. 2018, 101, 166–172. [Google Scholar] [CrossRef] [Scilit] [PubMed]
- Wei, C.; Gao, C.; Han, D.; Zhao, W.; Lin, Q.; Wang, G. Spatial and Temporal Variations of Water Quality in Songhua River from 2006 to 2015: Implication for Regional Ecological Health and Food Safety. Sustainability 2017, 9, 1502. [Google Scholar] [CrossRef] [Scilit]
- Seybold, E.; Dwivedi, R.; Musselman, K.; Kincaid, D.; Schroth, A.; Classen, A.; Perdrial, J.; Adair, E. Winter runoff events pose an unquantified continental-scale risk of high wintertime nutrient export. Environ. Res. Lett. 2022, 17, 104044. [Google Scholar] [CrossRef] [Scilit]
- Kong, F.-X.; Nie, L.; Xu, Y.; Rui, X.; He, Y.; Zhang, T.; Wang, Y.; Du, C.; Bao, C. Effects of freeze-thaw cycles on the erodibility and microstructure of soda-saline loessal soil in Northeastern China. Catena 2021, 209, 105812. [Google Scholar] [CrossRef] [Scilit]
- Qiu, J.; Shen, Z.; Leng, G.; Wei, G. Synergistic effect of drought and rainfall events of different patterns on watershed systems. Sci. Rep. 2021, 11, 18957. [Google Scholar] [CrossRef] [Scilit] [PubMed]
- Austin, A.; Yahdjian, L.; Stark, J.; Belnap, J.; Porporato, A.; Norton, U.; Ravetta, D.; Schaeffer, S. Water pulses and biogeochemical cycles in arid and semiarid ecosystems. Oecologia 2004, 141, 221–235. [Google Scholar] [CrossRef] [Scilit] [PubMed]
- Leitner, S.; Homyak, P.M.; Blankinship, J.C.; Eberwein, J.; Jenerette, G.D.; Zechmeister-Boltenstern, S.; Schimel, J.P. Linking NO and N2O emission pulses with the mobilization of mineral and organic N upon rewetting dry soils. Soil Biol. Biochem. 2017, 115, 461–466. [Google Scholar] [CrossRef] [Scilit]
- Paranaíba, J.R.; Quadra, G.; Josué, I.I.P.; Almeida, R.M.; Mendonça, R.; Cardoso, S.J.; Silva, J.; Kosten, S.; Campos, J.M.; Almeida, J.; et al. Sediment drying-rewetting cycles enhance greenhouse gas emissions, nutrient and trace element release, and promote water cytogenotoxicity. PLoS ONE 2020, 15, e0231082. [Google Scholar] [CrossRef] [Scilit] [PubMed]
- Rodríguez, M.; Fu, G.; Butler, D.; Yuan, Z.; Cook, L. The effect of green infrastructure on resilience performance in combined sewer systems under climate change. J. Environ. Manag. 2024, 353, 120229. [Google Scholar] [CrossRef] [Scilit] [PubMed]
- Jean, M.E.; Morin, C.; Duchesne, S.; Pelletier, G.; Pleau, M. Optimization of Real-Time Control with Green and Gray Infrastructure Design for a Cost-Effective Mitigation of Combined Sewer Overflows. Water Resour. Res. 2021, 57, e2021WR030282. [Google Scholar] [CrossRef] [Scilit]
- Jean, M.E.; Morin, C.; Duchesne, S.; Pelletier, G.; Pleau, M. Real-time model predictive and rule-based control with green infrastructures to reduce combined sewer overflows. Water Res. 2022, 221, 118753. [Google Scholar] [CrossRef] [Scilit] [PubMed]
- Yin, Z.; Qin, G.; Guo, L.; Tang, X.; Wang, J.; Li, H. Coupling antecedent rainfall for improving the performance of rainfall thresholds for suspended sediment simulation of semiarid catchments. Sci. Rep. 2022, 12, 4816. [Google Scholar] [CrossRef] [Scilit] [PubMed]
- Sun, C.; Chen, L.; Zhu, H.; Xie, H.; Qi, S.; Shen, Z. New framework for natural-artificial transport paths and hydrological connectivity analysis in an agriculture-intensive catchment. Water Res. 2021, 196, 117015. [Google Scholar] [CrossRef] [Scilit] [PubMed]
- Tian, N.; Zhang, Y.; Li, J.; Du, W.; Liu, X.; Jiang, H.; Bian, H. Evaluation and Optimization of Hydrological Connectivity Based on Graph Theory: A Case Study in Dongliao River Basin, China. Water 2022, 14, 3958. [Google Scholar] [CrossRef] [Scilit]
- Miao, J.; Zhang, X.; Zhang, G.; Wei, T.; Zhao, Y.; Ma, W.; Chen, Y.; Li, Y.; Wang, Y. Applications and interpretations of different machine learning models in runoff and sediment discharge simulations. Catena 2024, 238, 107848. [Google Scholar] [CrossRef] [Scilit]
- Mustafa, S.; Nossent, J.; Ghysels, G.; Huysmans, M. Integrated Bayesian Multi-model approach to quantify input, parameter and conceptual model structure uncertainty in groundwater modeling. Environ. Model. Softw. 2020, 126, 104654. [Google Scholar] [CrossRef] [Scilit]
- Shi, P.; Yang, T.; Yong, B.; Xu, C.-Y.; Li, Z.; Wang, X.; Qin, Y.; Zhou, X. Some statistical inferences of parameter in MCMC approach and the application in uncertainty analysis of hydrological simulation. J. Hydrol. 2022, 617, 128767. [Google Scholar] [CrossRef] [Scilit]
- Vrugt, J.; Braak, C.; Gupta, H.; Robinson, B. Equifinality of formal (DREAM) and informal (GLUE) Bayesian approaches in hydrologic modeling? Stoch. Environ. Res. Risk Assess. 2009, 23, 1011–1026. [Google Scholar] [CrossRef] [Scilit]
- Gassman, P.; Reyes, M.; Green, C.; Arnold, J. The Soil and Water Assessment Tool: Historical Development, Applications, and Future Research Directions. Trans. ASABE 2007, 50, 1211–1250. [Google Scholar] [CrossRef] [Scilit]
- Aloui, S.; Mazzoni, A.; Elomri, A.; Aouissi, J.; Boufekane, A.; Zghibi, A. A review of Soil and Water Assessment Tool (SWAT) studies of Mediterranean catchments: Applications, feasibility, and future directions. J. Environ. Manag. 2022, 326, 116799. [Google Scholar] [CrossRef] [Scilit] [PubMed]
- Kim, S.H.; Lee, D.H.; Kim, M.S.; Rhee, H.P.; Hur, J.; Shin, K.H. Systematic tracing of nitrate sources in a complex river catchment: An integrated approach using stable isotopes and hydrological models. Water Res. 2023, 235, 119755. [Google Scholar] [CrossRef] [Scilit] [PubMed]
- Roostaee, M.; Deng, Z. HSPF-based watershed-scale water quality modeling and uncertainty analysis. Environ. Sci. Pollut. Res. 2019, 26, 8971–8991. [Google Scholar] [CrossRef] [Scilit] [PubMed]
- Jaber, F.H.; Shukla, S. MIKE SHE: Model Use, Calibration, and Validation. Trans. ASABE 2012, 55, 1479–1489. [Google Scholar] [CrossRef] [Scilit]
- Vansteenkiste, T.; Tavakoli, M.; Van Steenbergen, N.; De Smedt, F.; Batelaan, O.; Pereira, F.; Willems, P. Intercomparison of five lumped and distributed models for catchment runoff and extreme flow simulation. J. Hydrol. 2014, 511, 335–349. [Google Scholar] [CrossRef] [Scilit]
- Polyakov, V.; Fares, A.; Kubo, D.; Jacobi, J.; Smith, C. Evaluation of a non-point source pollution model, AnnAGNPS, in a tropical watershed. Environ. Model. Softw. 2007, 22, 1617–1627. [Google Scholar] [CrossRef] [Scilit]
- Tamanna, M.; Pradhanang, S.M.; Gold, A.J.; Addy, K.; Vidon, P.G.; Bingner, R.L. Evaluation of AnnAGNPS Model for Runoff Simulation on Watersheds from Glaciated Landscape of USA Midwest and Northeast. Water 2020, 12, 3525. [Google Scholar] [CrossRef] [Scilit]
- McLaughlin, P.; Alexander, R.; Blomquist, J.; Devereux, O.; Noe, G.; Smalling, K.; Wagner, T. Power analysis for detecting the effects of best management practices on reducing nitrogen and phosphorus fluxes to the Chesapeake Bay Watershed, USA. Ecol. Indic. 2022, 136, 108713. [Google Scholar] [CrossRef] [Scilit]
- Wellen, C.; Arhonditsis, G.B.; Labencki, T.; Boyd, D. A Bayesian methodological framework for accommodating interannual variability of nutrient loading with the SPARROW model. Water Resour. Res. 2012, 48, W10505. [Google Scholar] [CrossRef] [Scilit]
- Hamman, J.; Nijssen, B.; Bohn, T.; Gergel, D.; Mao, Y. The Variable Infiltration Capacity model version 5 (VIC-5): Infrastructure improvements for new applications and reproducibility. Geosci. Model Dev. 2018, 11, 3481–3496. [Google Scholar] [CrossRef] [Scilit]
- Raje, D.; Priya, P.; Krishnan, R. Macroscale hydrological modelling approach for study of large scale hydrologic impacts under climate change in Indian river basins. Hydrol. Process. 2014, 28, 1874–1889. [Google Scholar] [CrossRef] [Scilit]
- Baek, S.S.; Ligaray, M.; Pyo, J.; Park, J.P.; Kang, J.H.; Pachepsky, Y.; Chun, J.A.; Cho, K.H. A novel water quality module of the SWMM model for assessing low impact development (LID) in urban watersheds. J. Hydrol. 2020, 586, 124886. [Google Scholar] [CrossRef] [Scilit]
- Ma, B.Y.; Wu, Z.N.; Hu, C.H.; Wang, H.L.; Xu, H.S.; Yan, D.H.; Soomro, S.E.H. Process-oriented SWMM real-time correction and urban flood dynamic simulation. J. Hydrol. 2022, 605, 127269. [Google Scholar] [CrossRef] [Scilit]
- Kratzert, F.; Klotz, D.; Herrnegger, M.; Sampson, A.; Hochreiter, S.; Nearing, G. Toward Improved Predictions in Ungauged Basins: Exploiting the Power of Machine Learning. Water Resour. Res. 2019, 55, 11344–11354. [Google Scholar] [CrossRef] [Scilit]
- Wan, H.; Xiang, L.; Cai, Y.; Xie, Y.; Xu, R. Temporal and spatial feature extraction using graph neural networks for multi-point water quality prediction in river network areas. Water Res. 2025, 281, 123561. [Google Scholar] [CrossRef] [Scilit] [PubMed]
- Donnelly, J.; Daneshkhah, A.; Abolfathi, S. Physics-informed neural networks as surrogate models of hydrodynamic simulators. Sci. Total Environ. 2023, 912, 168814. [Google Scholar] [CrossRef] [Scilit] [PubMed]
- Gibson, P.; Stuart, S.; Sood, A.; Stone, D.; Rampal, N.; Lewis, H.; Broadbent, A.; Thatcher, M.; Morgenstern, O. Dynamical downscaling CMIP6 models over New Zealand: Added value of climatology and extremes. Clim. Dyn. 2024, 62, 8255–8281. [Google Scholar] [CrossRef] [Scilit]
- Tabari, H.; Paz, S.M.; Buekenhout, D.; Willems, P. Comparison of statistical downscaling methods for climate change impact analysis on precipitation-driven drought. Hydrol. Earth Syst. Sci. 2021, 25, 3493–3517. [Google Scholar] [CrossRef] [Scilit]
- Senatore, A.; Fuoco, D.; Maiolo, M.; Mendicino, G.; Smiatek, G.; Kunstmann, H. Evaluating the uncertainty of climate model structure and bias correction on the hydrological impact of projected climate change in a Mediterranean catchment. J. Hydrol. Reg. Stud. 2022, 42, 101120. [Google Scholar] [CrossRef] [Scilit]
- Olmo, M.; Balmaceda-Huarte, R.; Bettolli, M. Multi-model ensemble of statistically downscaled GCMs over southeastern South America: Historical evaluation and future projections of daily precipitation with focus on extremes. Clim. Dyn. 2021, 59, 3051–3068. [Google Scholar] [CrossRef] [Scilit]
- Du, B.; Wu, L.; Ruan, B.; Xu, L.; Liu, S.; Guo, Z.-X. Can the best management practices resist the combined effects of climate and land-use changes on non-point source pollution control? Sci. Total Environ. 2024, 946, 174260. [Google Scholar] [CrossRef] [Scilit] [PubMed]
- Yang, W.; Zhang, J.; Hua, P.; Krebs, P. Investigating non-point pollution mitigation strategies in response to changing environments: A cross-regional study in China and Germany. Water Res. 2023, 244, 120432. [Google Scholar] [CrossRef] [Scilit] [PubMed]
- Guo, W.; Teng, Y.; Li, J.; Yan, Y.; Zhao, C.; Li, Y.; Li, X. A new assessment framework to forecast land use and carbon storage under different SSP-RCP scenarios in China. Sci. Total Environ. 2023, 912, 169088. [Google Scholar] [CrossRef] [Scilit] [PubMed]
- Arsenault, R.; Martel, J.L.; Brunet, F.; Brissette, F.; Mai, J. Continuous streamflow prediction in ungauged basins: Long short-term memory neural networks clearly outperform traditional hydrological models. Hydrol. Earth Syst. Sci. 2023, 27, 139–157. [Google Scholar] [CrossRef] [Scilit]
- Gupta, H.V.; Kling, H.; Yilmaz, K.K.; Martinez, G.F. Decomposition of the mean squared error and NSE performance criteria: Implications for improving hydrological modelling. J. Hydrol. 2009, 377, 80–91. [Google Scholar] [CrossRef] [Scilit]
- Zhao, Y.; Li, H.; Zhao, L.; Li, C.; Chen, S.; Su, X. A comprehensive method for error separation in hydrological modelling. Hydrol. Process. 2024, 38, e15273. [Google Scholar] [CrossRef] [Scilit]
- Besalatpour, A.; Pourreza-Bilondi, M.; Afshar, A. Parallelization of AMALGAM algorithm for a multi-objective optimization of a hydrological model. Appl. Water Sci. 2023, 13, 241. [Google Scholar] [CrossRef] [Scilit]
- Wang, L.; Li, Y.; Wu, J.J.; An, Z.Z.; Suo, L.N.; Ding, J.L.; Li, S.; Wei, D.; Jin, L. Effects of the Rainfall Intensity and Slope Gradient on Soil Erosion and Nitrogen Loss on the Sloping Fields of Miyun Reservoir. Plants 2023, 12, 423. [Google Scholar] [CrossRef] [Scilit] [PubMed]
- Perera, T.; McGree, J.; Egodawatta, P.; Jinadasa, K.; Goonetilleke, A. Catchment based estimation of pollutant event mean concentration (EMC) and implications for first flush assessment. J. Environ. Manag. 2020, 279, 111737. [Google Scholar] [CrossRef] [Scilit] [PubMed]
- Tan, Z.; Leung, L.; Li, H.Y.; Tesfa, T.; Zhu, Q.; Yang, X.; Liu, Y.; Huang, M. Increased extreme rains intensify erosional nitrogen and phosphorus fluxes to the northern Gulf of Mexico in recent decades. Environ. Res. Lett. 2021, 16, 054080. [Google Scholar] [CrossRef] [Scilit]
- Hanrahan, B.R.; King, K.W.; Williams, M.R. Controls on subsurface nitrate and dissolved reactive phosphorus losses from agricultural fields during precipitation-driven events. Sci. Total Environ. 2021, 754, 142047. [Google Scholar] [CrossRef] [Scilit] [PubMed]
- Jacobs, S.R.; Breuer, L.; Butterbach-Bahl, K.; Pelster, D.E.; Rufino, M.C. Land use affects total dissolved nitrogen and nitrate concentrations in tropical montane streams in Kenya. Sci. Total Environ. 2017, 603, 519–532. [Google Scholar] [CrossRef] [Scilit] [PubMed]
- Schaeffer, S.M.; Homyak, P.M.; Boot, C.M.; Roux-Michollet, D.; Schimel, J.P. Soil carbon and nitrogen dynamics throughout the summer drought in a California annual grassland. Soil Biol. Biochem. 2017, 115, 54–62. [Google Scholar] [CrossRef] [Scilit]
- Gao, D.C.; Bai, E.; Li, M.H.; Zhao, C.H.; Yu, K.L.; Hagedorn, F. Responses of soil nitrogen and phosphorus cycling to drying and rewetting cycles: A meta-analysis. Soil Biol. Biochem. 2020, 148, 107896. [Google Scholar] [CrossRef] [Scilit]
- Wang, G.P.; Zhang, K.L.; Jia, C.Y.; Zhang, Z.D. Physical property responses of soils subjected to different degrees of erosion and seasonal freeze-thaw cycles in Northeast China. Soil Tillage Res. 2024, 244, 106264. [Google Scholar] [CrossRef] [Scilit]
- Zhang, T.; Li, D.F.; East, A.E.; Kettner, A.J.; Best, J.; Ni, J.R.; Lu, X.X. Shifted sediment-transport regimes by climate change and amplified hydrological variability in cryosphere-fed rivers. Sci. Adv. 2023, 9, eadi5019. [Google Scholar] [CrossRef] [Scilit] [PubMed]
- Lai, T.V.; Farquharson, R.; Denton, M.D. High soil temperatures alter the rates of nitrification, denitrification and associated N2O emissions. J. Soils Sediments 2019, 19, 2176–2189. [Google Scholar] [CrossRef] [Scilit]
- Dai, Z.M.; Yu, M.J.; Chen, H.H.; Zhao, H.C.; Huang, Y.L.; Su, W.Q.; Xia, F.; Chang, S.X.; Brookes, P.C.; Dahlgren, R.A.; et al. Elevated temperature shifts soil N cycling from microbial immobilization to enhanced mineralization, nitrification and denitrification across global terrestrial ecosystems. Glob. Change Biol. 2020, 26, 5267–5276. [Google Scholar] [CrossRef] [Scilit] [PubMed]
- Velthuis, M.; Veraart, A.J. Temperature Sensitivity of Freshwater Denitrification and N2O Emission-A Meta-Analysis. Glob. Biogeochem. Cycles 2022, 36, e2022GB007339. [Google Scholar] [CrossRef] [Scilit]
- Zhou, Q.; Zhou, L.; Zhang, H.; Li, J.; Zeng, Q. Microbial phosphorus cycling shaped by citrus-induced soil acidification and phosphorus accumulation in fertilized orchards. J. Environ. Manag. 2025, 395, 127885. [Google Scholar] [CrossRef] [Scilit] [PubMed]
- Touhami, D.; Condron, L.M.; McDowell, R.W.; Moss, R. Effects of long-term phosphorus fertilizer inputs and seasonal conditions on organic soil phosphorus cycling under grazed pasture. Soil Use Manag. 2023, 39, 385–401. [Google Scholar] [CrossRef] [Scilit]
- Tao, Y.; Ma, S.; Cao, M.M.; Li, J.H.; Wang, F.; Gao, Z.Q.; Xu, Q.; Guo, J.; Sun, K.; Wang, F. Recent advances on iron bound phosphorus in wetland sediments: Characteristics, influencing factors, interactions with organic matter and emerging contaminants. Environ. Pollut. 2025, 383, 126826. [Google Scholar] [CrossRef] [Scilit] [PubMed]
- Pinto, R.; Weigelhofer, G.; Brito, A.G.; Hein, T. Effects of dry-wet cycles on nitrous oxide emissions in freshwater sediments: A synthesis. Peerj 2021, 9, e10767. [Google Scholar] [CrossRef] [Scilit] [PubMed]
- Sánchez-Carrillo, S.; Catalán, M.; Sadeghi-Nassaj, S.M.; Vargas-Sánchez, M.; Alcocer, J.; Garcia-Oliva, F. Sediment phosphorus mobility in a semi-arid wetland with highly fluctuating hydrology. Ecol. Process. 2025, 14, 77. [Google Scholar] [CrossRef] [Scilit]
- Zhang, L.; Wang, H.L.; Liu, X.H.; Zhan, H.B.; Schneidewind, U.; Krause, S.; Jin, M.G.; Liang, X.; Liu, Y.F.; Li, P. Denitrification dominates nitrate attenuation and nitrous oxide effluxes under water table fluctuations. J. Hazard. Mater. 2025, 493, 138325. [Google Scholar] [CrossRef] [Scilit] [PubMed]
- Phillips, R.P.; Meier, I.C.; Bernhardt, E.S.; Grandy, A.S.; Wickings, K.; Finzi, A.C. Roots and fungi accelerate carbon and nitrogen cycling in forests exposed to elevated CO2. Ecol. Lett. 2012, 15, 1042–1049. [Google Scholar] [CrossRef] [Scilit] [PubMed]
- Jiang, M.K.; Crous, K.Y.; Carrillo, Y.; Macdonald, C.A.; Anderson, I.C.; Boer, M.M.; Farrell, M.; Gherlenda, A.N.; Castañeda-Gómez, L.; Hasegawa, S.; et al. Microbial competition for phosphorus limits the CO2 response of a mature forest. Nature 2024, 630, 660–665. [Google Scholar] [CrossRef] [Scilit] [PubMed]
- Tan, Q.Q.; Jia, Y.F.; Wang, G.A. Decoupling of soil nitrogen and phosphorus dynamics along a temperature gradient on the Qinghai-Tibetan Plateau. Geoderma 2021, 396, 115084. [Google Scholar] [CrossRef] [Scilit]
- Renkenberger, J.; Montas, H.; Leisnham, P.T.; Chanse, V.; Shirmohammadi, A.; Sadeghi, A.; Brubaker, K.; Rockler, A.; Hutson, T.; Lansing, D. Climate Change Impact on Critical Source Area Identification in a Maryland Watershed. Trans. ASABE 2016, 59, 1803–1819. [Google Scholar] [CrossRef] [Scilit]
- Yan, Y.J.; Hu, Z.Y.; Wang, L.J.; Jiang, J.; Dai, Q.H.; Gan, F.L.; Almaliki, A.H.; Hashim, M.A.; Hussein, E.E.; Ghoneim, S.S.M. Impact of extreme rainfall events on soil erosion on karst Slopes: A study of hydrodynamic mechanisms. J. Hydrol. 2024, 638, 131532. [Google Scholar] [CrossRef] [Scilit]
- Zhao, J.C.; Zhang, J.J.; Hu, Y.W.; Li, Y.; Tang, P.; Gusarov, A.V.V.; Yu, Y. Effects of land uses and rainfall regimes on surface runoff and sediment yield in a nested watershed of the Loess Plateau, China. J. Hydrol. Reg. Stud. 2022, 44, 101277. [Google Scholar] [CrossRef] [Scilit]
- Li, L.; Gou, M.M.; Wang, N.; Ma, W.; Xiao, W.F.; Liu, C.F.; La, L.M. Landscape configuration mediates hydrology and nonpoint source pollution under climate change and agricultural expansion. Ecol. Indic. 2021, 129, 107959. [Google Scholar] [CrossRef] [Scilit]
- Zena, K.; Demissie, T.A.; Feyessa, F.F. Evaluating long-term impacts of land use/land cover changes on pollution loads at a catchment scale. Water Sci. Technol. 2024, 90, 75–102. [Google Scholar] [CrossRef] [Scilit] [PubMed]
- Zuo, D.; Xu, Z.; Yao, W.; Jin, S.; Xiao, P.; Ran, D. Assessing the effects of changes in land use and climate on runoff and sediment yields from a watershed in the Loess Plateau of China. Sci. Total Environ. 2016, 544, 238–250. [Google Scholar] [CrossRef] [Scilit] [PubMed]
- Perera, T.; McGree, J.; Egodawatta, P.; Jinadasa, K.; Goonetilleke, A. Taxonomy of influential factors for predicting pollutant first flush in urban stormwater runoff. Water Res. 2019, 166, 115075. [Google Scholar] [CrossRef] [Scilit] [PubMed]
- Moin, S.; Birgand, F.; Hunt, W.F., III. Using optic sensors for near-continuous water quality monitoring of stormwater runoff. J. Asabe 2025, 68, 847–855. [Google Scholar] [CrossRef] [Scilit]
- Van Loon, A.F.; Rangecroft, S.; Coxon, G.; Naranjo, J.A.B.; Van Ogtrop, F.; Van Lanen, H.A.J. Using paired catchments to quantify the human influence on hydrological droughts. Hydrol. Earth Syst. Sci. 2019, 23, 1725–1739. [Google Scholar] [CrossRef] [Scilit]
- Knapp, A.K.; Avolio, M.L.; Beier, C.; Carroll, C.J.W.; Collins, S.L.; Dukes, J.S.; Fraser, L.H.; Griffin-Nolan, R.J.; Hoover, D.L.; Jentsch, A.; et al. Pushing precipitation to the extremes in distributed experiments: Recommendations for simulating wet and dry years. Glob. Change Biol. 2017, 23, 1774–1782. [Google Scholar] [CrossRef] [Scilit] [PubMed]
- Sidle, R.C.; Gomi, T.; Usuga, J.C.L.; Jarihani, B. Hydrogeomorphic processes and scaling issues in the continuum from soil pedons to catchments. Earth-Sci. Rev. 2017, 175, 75–96. [Google Scholar] [CrossRef] [Scilit]
- Olaoye, I.A.; Confesor, R.B.; Ortiz, J.D. Effect of Projected Land Use and Climate Change on Water Quality of Old Woman Creek Watershed, Ohio. Hydrology 2021, 8, 62. [Google Scholar] [CrossRef] [Scilit]
- Wang, J.; Si, Z.J.; Liu, T.; Liu, Y.; Wang, L.F. Land Use-Future Climate Coupling Mechanism Analysis of Regional Agricultural Drought Spatiotemporal Patterns. Sustainability 2025, 17, 7119. [Google Scholar] [CrossRef] [Scilit]
- Lafferty, D.C.; Sriver, R.L. Downscaling and bias-correction contribute considerable uncertainty to local climate projections in CMIP6. npj Clim. Atmos. Sci. 2023, 6, 158. [Google Scholar] [CrossRef] [Scilit]
- Tao, F.L.; Rötter, R.P.; Palosuo, T.; Diaz-Ambrona, C.G.H.; Mínguez, M.I.; Semenov, M.A.; Kersebaum, K.C.; Nendel, C.; Specka, X.; Hoffmann, H.; et al. Contribution of crop model structure, parameters and climate projections to uncertainty in climate change impact assessments. Glob. Change Biol. 2018, 24, 1291–1307. [Google Scholar] [CrossRef] [Scilit] [PubMed]
- Kelly, M.; Phillips, G.; Teixeira, H.; Várbíró, G.; Herrero, F.; Willby, N.; Poikane, S. Establishing ecologically-relevant nutrient thresholds: A tool-kit with guidance on its use. Sci. Total Environ. 2021, 807, 150977. [Google Scholar] [CrossRef] [Scilit] [PubMed]
- Casillas-García, L.; Anda, J.; Yebra-Montes, C.; Shear, H.; Díaz-Vázquez, D.; Gradilla-Hernández, M. Development of a specific water quality index for the protection of aquatic life of a highly polluted urban river. Ecol. Indic. 2021, 129, 107899. [Google Scholar] [CrossRef] [Scilit]
- Unda-Calvo, J.; Ruiz-Romera, E.; Martínez-Santos, M.; Vidal, M.; Antigüedad, I. Multivariate statistical analyses for water and sediment quality index development: A study of susceptibility in an urban river. Sci. Total Environ. 2020, 711, 135026. [Google Scholar] [CrossRef] [Scilit] [PubMed]
- Ying, O.; Nkedi-Kizza, P.; Wu, Q.-T.; Shinde, D.; Huang, C. Assessment of seasonal variations in surface water quality. Water Res. 2006, 40, 3800–3810. [Google Scholar] [CrossRef] [Scilit] [PubMed]
- Brandão, L.P.; Silva, V.; Bassi, M.; De Oliveira, E. Risk Assessment in Monitoring of Water Analysis of a Brazilian River. Molecules 2022, 27, 3628. [Google Scholar] [CrossRef] [Scilit] [PubMed]
- Li, Y.F.; Li, Y.; Wu, W. Threshold and resilience management of coupled urbanization and water environmental system in the rapidly changing coastal region. Environ. Pollut. 2016, 208, 87–95. [Google Scholar] [CrossRef] [Scilit] [PubMed]
- Long, A.Y.; Sun, R.C.; Mao, X.Y.Z.; Duan, Q.Y.; Wu, M.T. Surrogate modelling-based multi-objective optimization for best management practices of nonpoint source pollution. Water Res. 2025, 269, 122788. [Google Scholar] [CrossRef] [Scilit] [PubMed]
- Droppers, B.; Bierkens, M.; Wanders, N. A Multi-Resolution Deep-Learning Surrogate Framework for Global Hydrological Models. Water Resour. Res. 2025, 61, e2024WR037736. [Google Scholar] [CrossRef] [Scilit]
- Dwivedi, D.; Poeppl, R.E.; Wohl, E. Hydrological connectivity: A review and emerging strategies for integrating measurement, modeling, and management. Front. Water 2025, 7, 1496199. [Google Scholar] [CrossRef] [Scilit]
- Li, J.L.; Wang, G.X.; Ma, J.P.; Huang, P.; Song, C.L.; Sun, S.Q.; Guo, L.M.; Li, K.; Wang, H.Y.; Li, D.F.; et al. Structural Connectivity Shaped by Cryospheric Degradation Modulates Sediment Transport Dynamics in High Mountain Asia. Water Resour. Res. 2025, 61, e2024WR038654. [Google Scholar] [CrossRef] [Scilit]
- Thomas, I.A.; Jordan, P.; Shine, O.; Fenton, O.; Mellander, P.E.; Dunlop, P.; Murphy, P.N.C. Defining optimal DEM resolutions and point densities for modelling hydrologically sensitive areas in agricultural catchments dominated by microtopography. Int. J. Appl. Earth Obs. Geoinf. 2017, 54, 38–52. [Google Scholar] [CrossRef] [Scilit]
- Cole, D.; Ruiz-Mercado, G.; Zavala, V. A Graph-Based Modeling Framework for Tracing Hydrological Pollutant Transport in Surface Waters. Comput. Chem. Eng. 2023, 179, 1–12. [Google Scholar] [CrossRef] [Scilit]
- Sarker, S.; Veremyev, A.; Boginski, V.; Singh, A. Critical Nodes in River Networks. Sci. Rep. 2019, 9, 11178. [Google Scholar] [CrossRef] [Scilit] [PubMed]
- Li, J.C.; Hu, M.C.; Ma, W.J.; Liu, Y.; Dong, F.F.; Zou, R.; Chen, Y.H. Optimization and multi-uncertainty analysis of best management practices at the watershed scale: A reliability-level based bayesian network approach. J. Environ. Manag. 2023, 331, 117280. [Google Scholar] [CrossRef] [Scilit] [PubMed]
- Yang, G.X.; Best, E.P.H. Spatial optimization of watershed management practices for nitrogen load reduction using a modeling-optimization framework. J. Environ. Manag. 2015, 161, 252–260. [Google Scholar] [CrossRef] [Scilit] [PubMed]
- Ayre, M.; Nettle, R. Enacting resilience for adaptive water governance: A case study of irrigation modernization in an Australian catchment. Ecol. Soc. 2017, 22, 1. [Google Scholar] [CrossRef] [Scilit]
- Liu, Y.; Kim, J.; Nabatchi, T. A “Watershed” Moment for Collaboration: The Impacts of Legislation and Network Governance on Environmental Outcomes. Public Adm. Rev. 2025, 86, 414–429. [Google Scholar] [CrossRef] [Scilit]
- Que, W.; Zhang, Y.; Liu, S.; Yang, C.-H. The spatial effect of fiscal decentralization and factor market segmentation on environmental pollution. J. Clean. Prod. 2018, 184, 402–413. [Google Scholar] [CrossRef] [Scilit]
- Zhou, K.; Wang, Q.; Tang, J. Evolutionary game analysis of environmental pollution control under the government regulation. Sci. Rep. 2022, 12, 474. [Google Scholar] [CrossRef] [Scilit] [PubMed]
- Liu, T.; Bruins, R.; Heberling, M. Factors Influencing Farmers’ Adoption of Best Management Practices: A Review and Synthesis. Sustainability 2018, 10, 432. [Google Scholar] [CrossRef] [Scilit] [PubMed]
- Calvo, C.; Rodríguez-Gallego, L.; de León, G.; Cabrera-Lamanna, L.; Castagna, A.; Costa, S.; González, L.; Meerhoff, M. Potential of different buffer zones as nature-based solutions to mitigate agricultural runoff nutrients in the subtropics. Ecol. Eng. 2024, 207, 107354. [Google Scholar] [CrossRef] [Scilit]
- Hallberg, L.; Hallin, S.; Djodjic, F.; Bieroza, M. Trade-offs between nitrogen and phosphorus removal with floodplain remediation in agricultural streams. Water Res. 2024, 258, 121770. [Google Scholar] [CrossRef] [Scilit] [PubMed]
- Walton, C.R.; Zak, D.; Audet, J.; Petersen, R.J.; Lange, J.; Oehmke, C.; Wichtmann, W.; Kreyling, J.; Grygoruk, M.; Jablonska, E.; et al. Wetland buffer zones for nitrogen and phosphorus retention: Impacts of soil type, hydrology and vegetation. Sci. Total Environ. 2020, 727, 138709. [Google Scholar] [CrossRef] [Scilit] [PubMed]
- Martínez-Mena, M.; Carrillo-López, E.; Boix-Fayos, C.; Almagro, M.; Franco, N.G.; Díaz-Pereira, E.; Montoya, I.; de Vente, J. Long-term effectiveness of sustainable land management practices to control runoff, soil erosion, and nutrient loss and the role of rainfall intensity in Mediterranean rainfed agroecosystems. Catena 2020, 187, 104352. [Google Scholar] [CrossRef] [Scilit]
- Zhao, X.K.; Song, X.Y.; Wang, D.Y.; Li, L.J.; Meng, P.F.; Fu, C.; Wang, L.; Wei, W.Y.; Yang, N.; Liu, Y.; et al. Optimizing Straw Mulching Methods to Control Soil and Water Losses on Loess Sloped Farmland. Agronomy 2024, 14, 696. [Google Scholar] [CrossRef] [Scilit]
- Martins, W.; Júnior, Ê.L.; Da Silva, M.; Ramirez, M.A.P.; Reinecke, S.; Euzébio, T. Finite state machine control optimized by simulated annealing for reducing combined sewer overflows. Meas. Sci. Technol. 2026, 37, 196207. [Google Scholar] [CrossRef] [Scilit]
- Su, J.-Y.; Goel, R.; Burian, S.; Hinners, S.; Kochanski, A.; Strong, C.; Barber, M. Water Quality Trading Framework with Uncertainty for River Systems Due to Climate and Population Characteristics. Water 2021, 13, 1738. [Google Scholar] [CrossRef] [Scilit]
- Izquierdo-Tort, S.; Jayachandran, S.; Saavedra, S. Redesigning payments for ecosystem services to increase cost-effectiveness. Nat. Commun. 2024, 15, 9252. [Google Scholar] [CrossRef] [Scilit] [PubMed]
- Guo, Y.; Zheng, H.; Wu, T.; Wu, J.; Robinson, B.E. A review of spatial targeting methods of payment for ecosystem services. Geogr. Sustain. 2020, 1, 132–140. [Google Scholar] [CrossRef] [Scilit]
- Kwakkel, J.H.; Haasnoot, M.; Walker, W.E. Comparing Robust Decision-Making and Dynamic Adaptive Policy Pathways for model-based decision support under deep uncertainty. Environ. Model. Softw. 2016, 86, 168–183. [Google Scholar] [CrossRef] [Scilit]
- Poblete, D.; Vicuña, S.; Aedo, S.; Molina-Perez, E.; Cortés, H.; Melo, O.; Ocampo-Melgar, A.; Tesen, K.; Suárez, F.; Herane, J.P.; et al. Using a robust decision making (RDM) approach to explore current and future vulnerabilities of a semi-arid coastal basin: A case study of the Quilimarí basin in Chile. Front. Environ. Sci. 2025, 13, 1553675. [Google Scholar] [CrossRef] [Scilit]
- Ramm, T.D.; Watson, C.S.; White, C.J. Strategic adaptation pathway planning to manage sea-level rise and changing coastal flood risk. Environ. Sci. Policy 2018, 87, 92–101. [Google Scholar] [CrossRef] [Scilit]
- Ramm, T.D.; Watson, C.S.; White, C.J. Describing adaptation tipping points in coastal flood risk management. Comput. Environ. Urban Syst. 2018, 69, 74–86. [Google Scholar] [CrossRef] [Scilit]
- Matrosov, E.S.; Woods, A.M.; Harou, J.J. Robust Decision Making and Info-Gap Decision Theory for water resource system planning. J. Hydrol. 2013, 494, 43–58. [Google Scholar] [CrossRef] [Scilit]
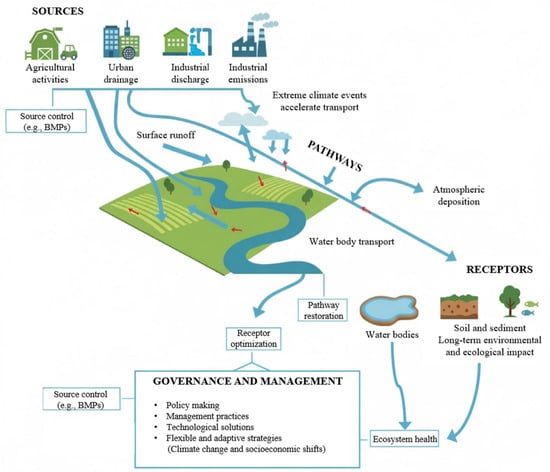
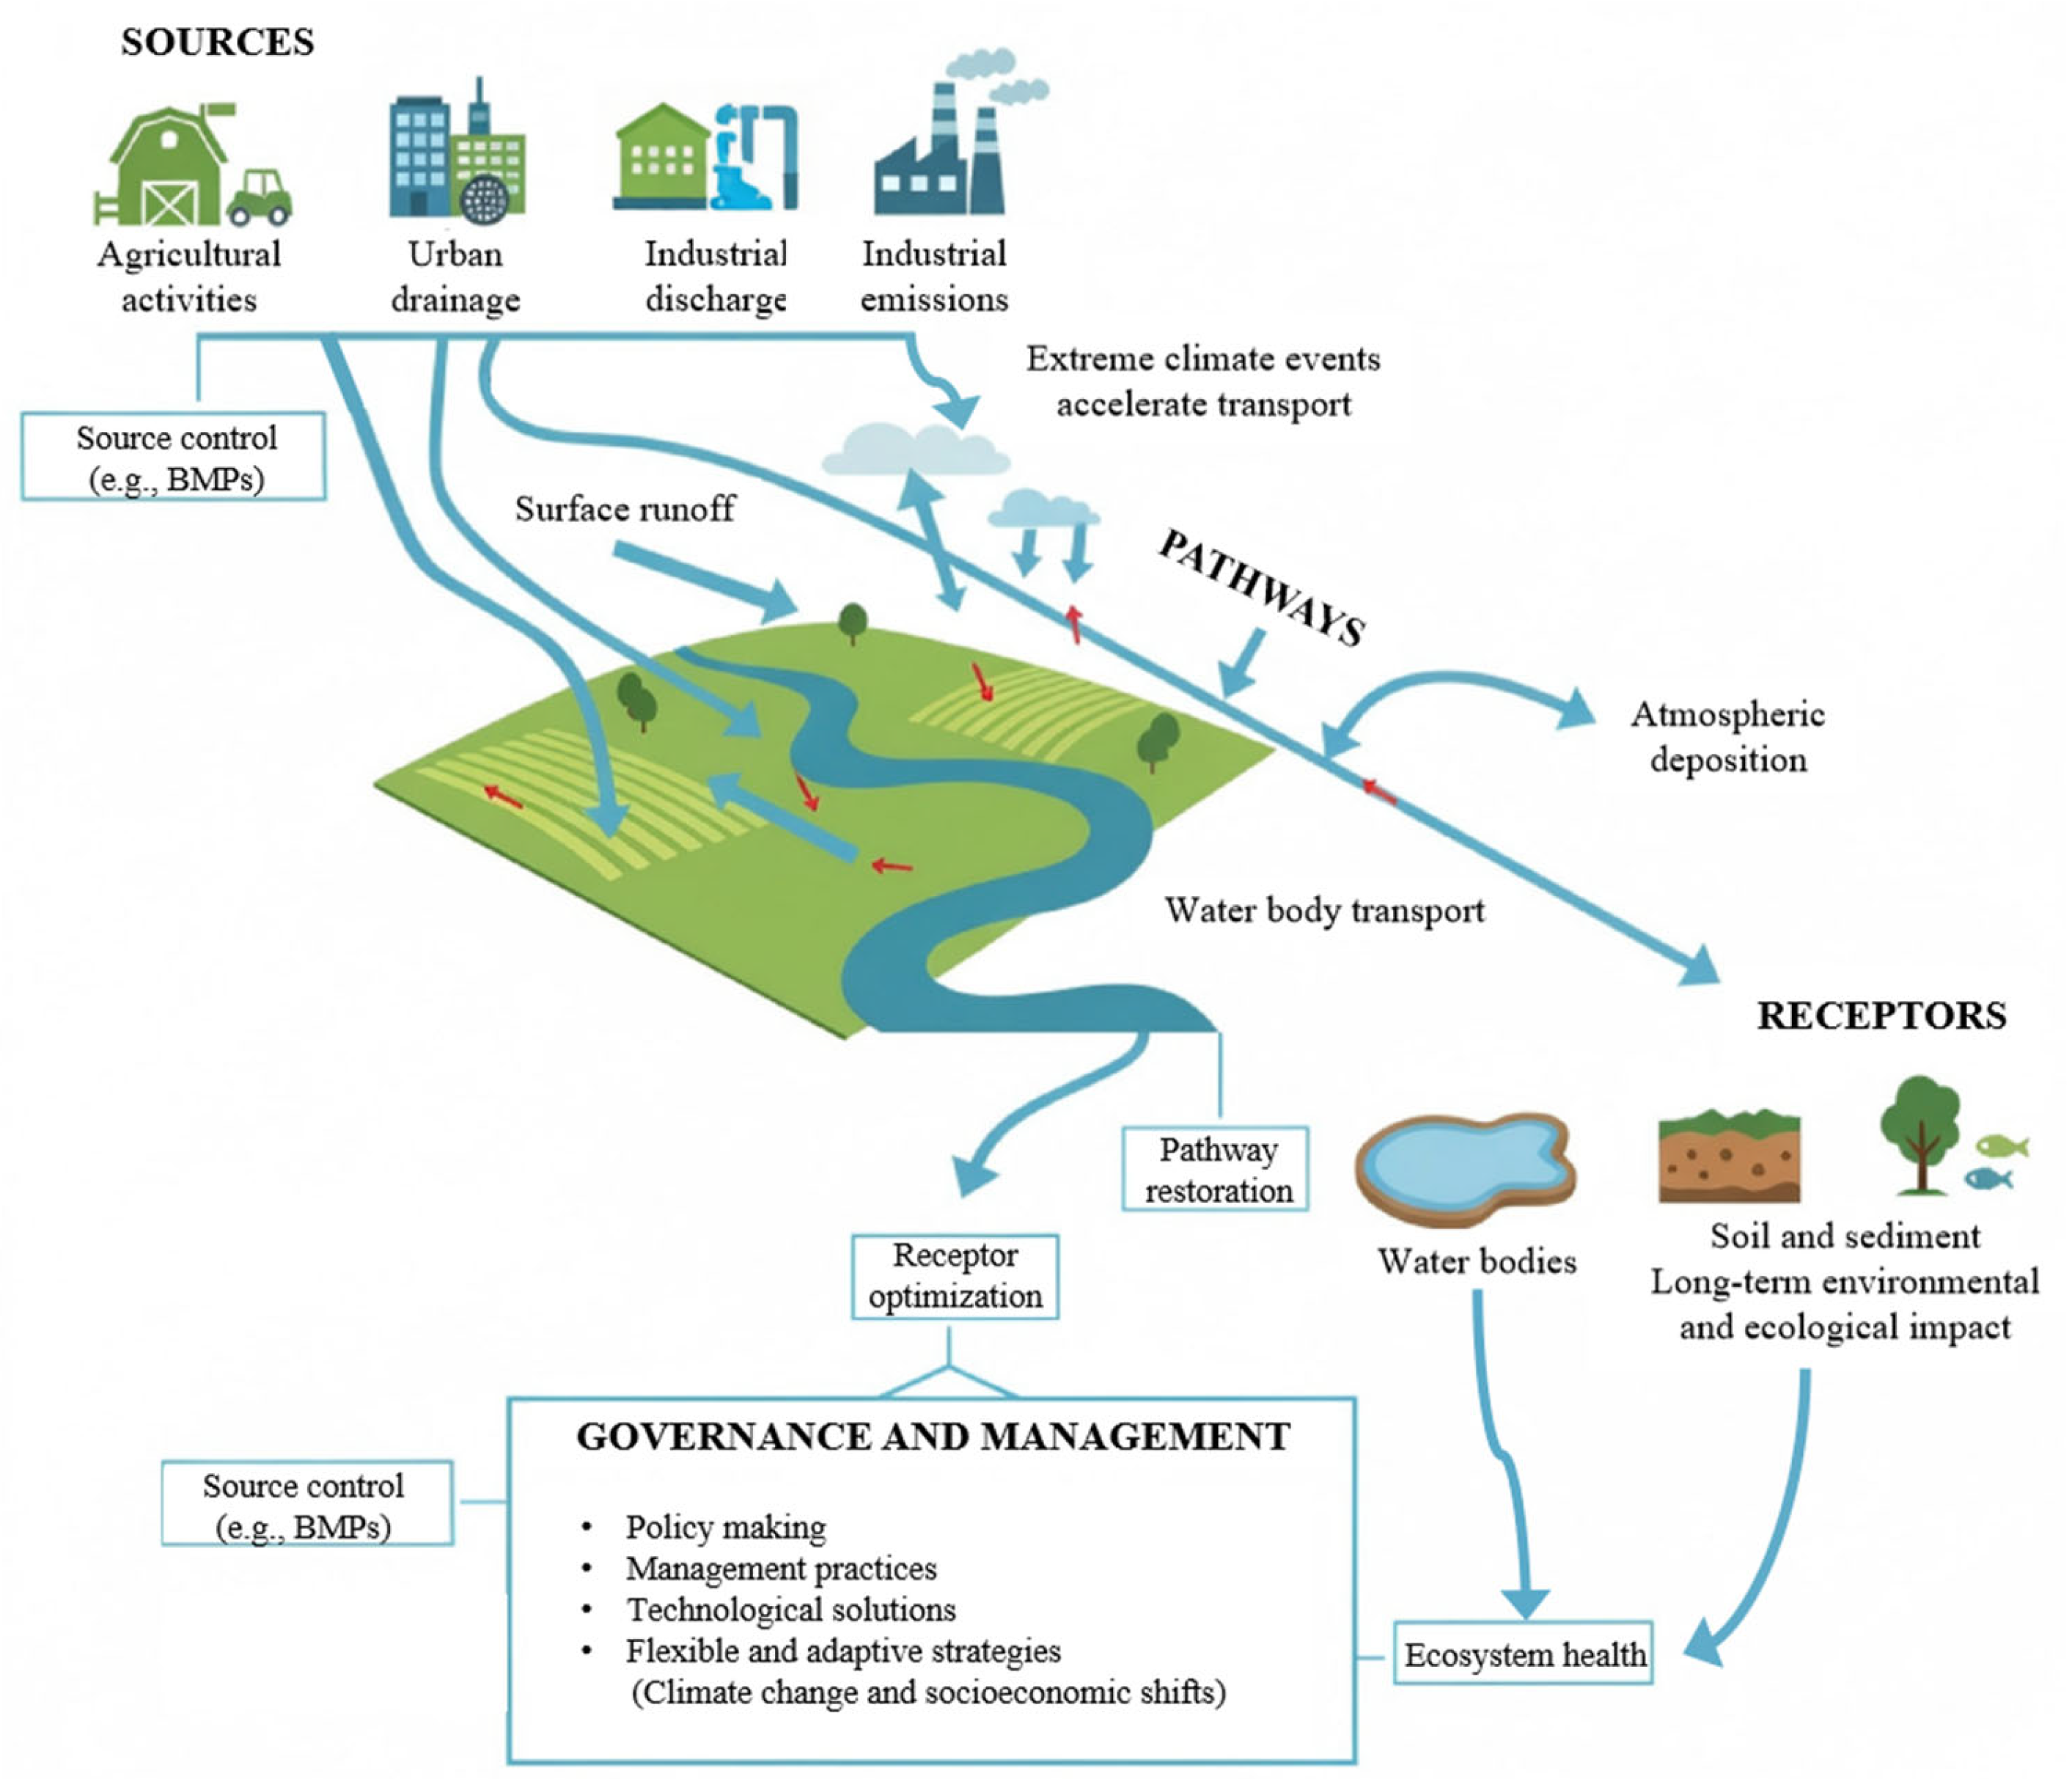
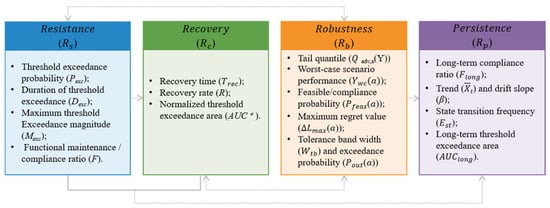
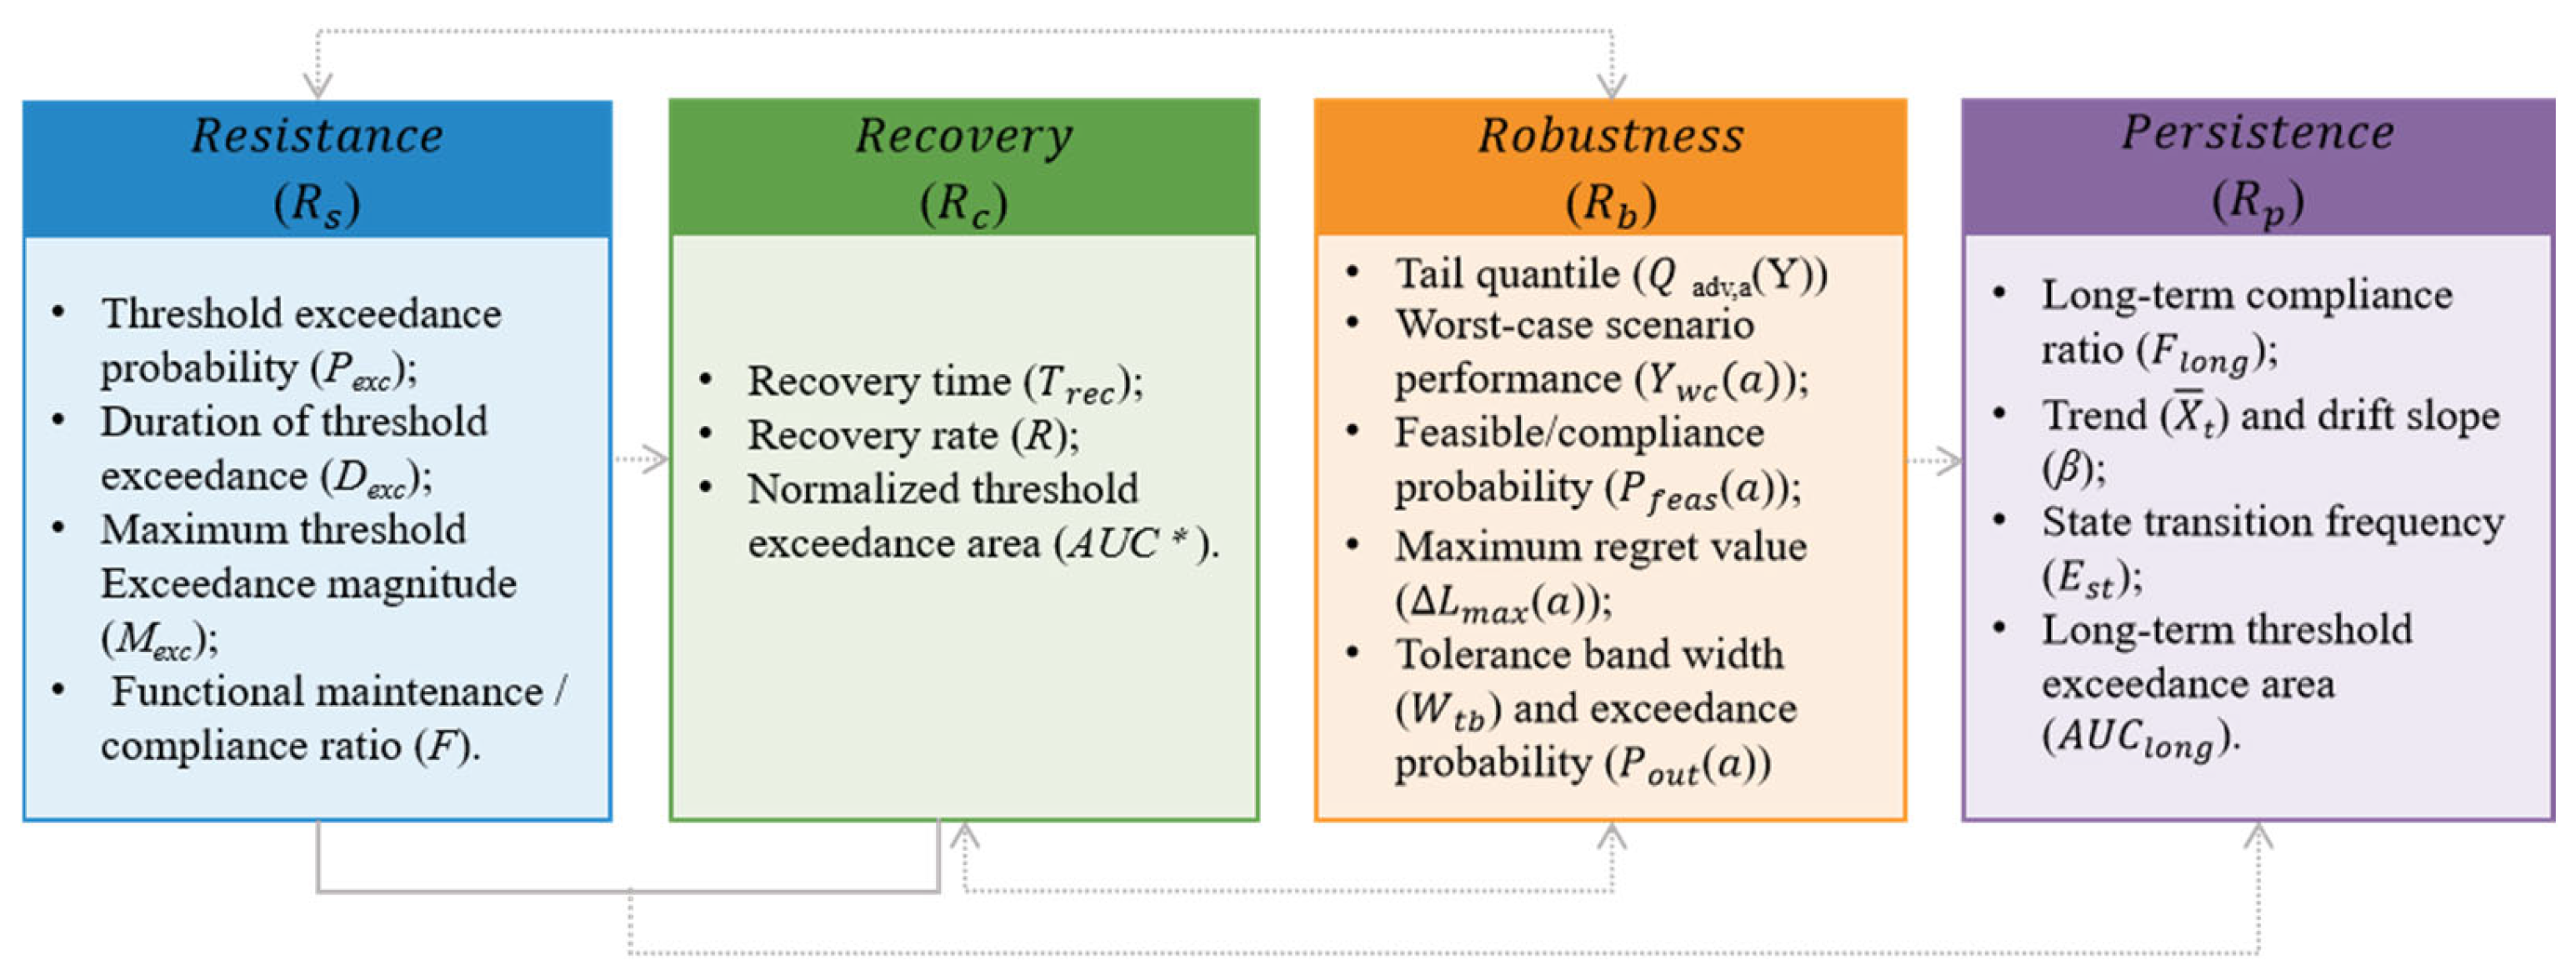
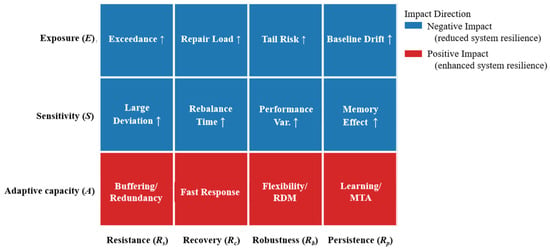
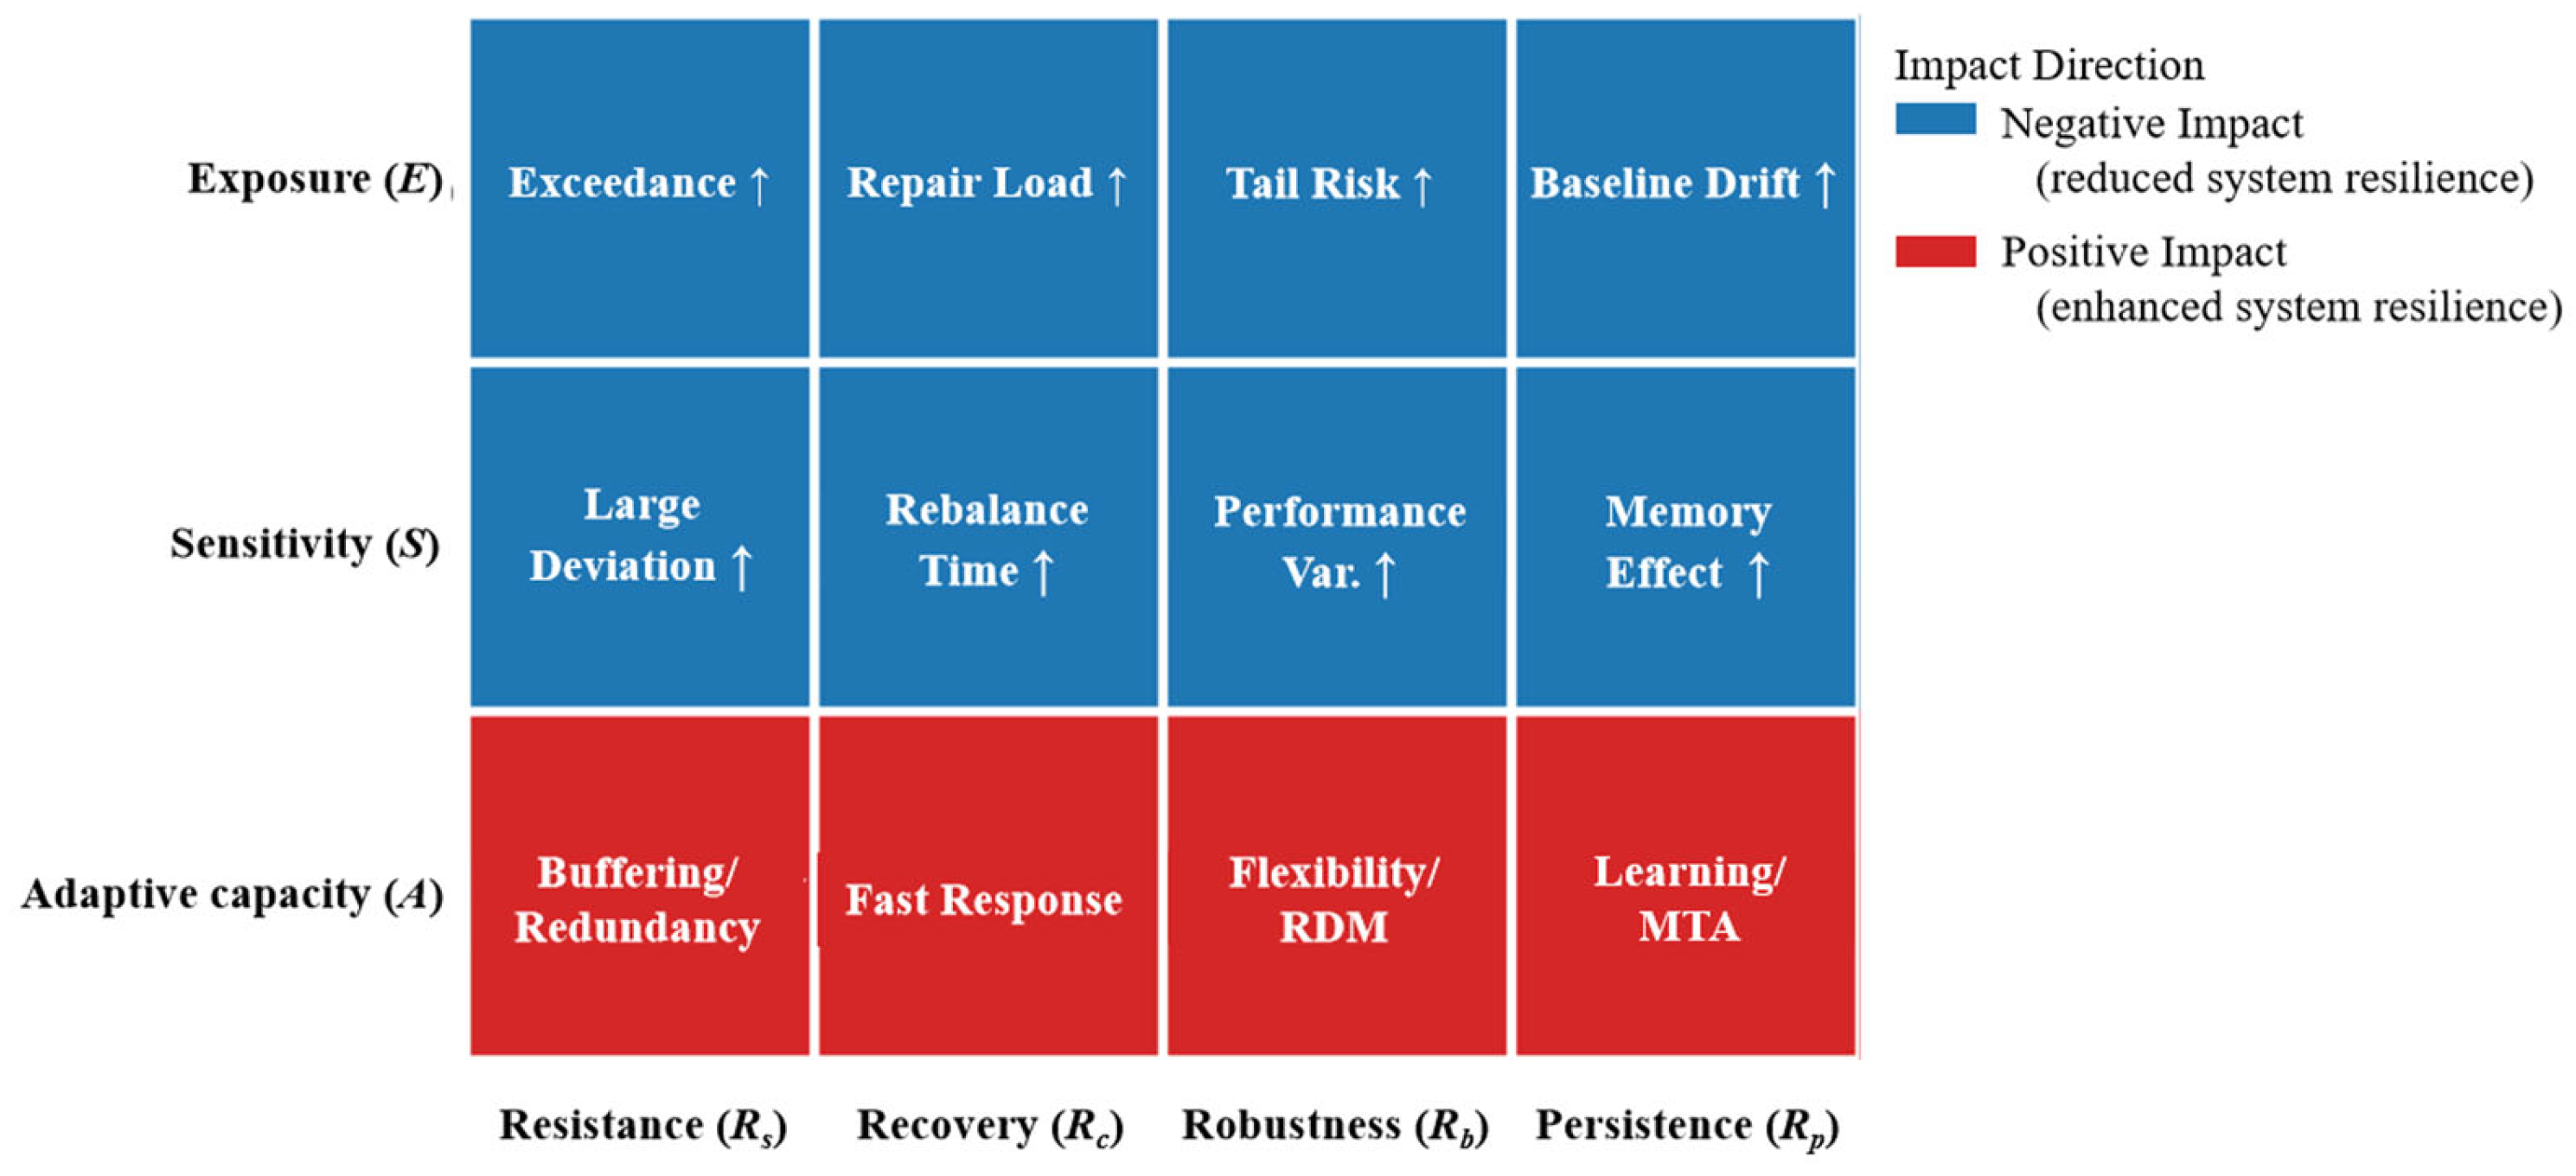

Disclaimer/Publisher’s Note: The statements, opinions and data contained in all publications are solely those of the individual author(s) and contributor(s) and not of MDPI and/or the editor(s). MDPI and/or the editor(s) disclaim responsibility for any injury to people or property resulting from any ideas, methods, instructions or products referred to in the content. |
© 2026 by the authors. Licensee MDPI, Basel, Switzerland. This article is an open access article distributed under the terms and conditions of the Creative Commons Attribution (CC BY) license.