


Abstract
The coal chemical industry is a major emitter of carbon and pollutants in China, yet the synergistic potential of decarbonization options remains unclear. This study integrates life-cycle assessment (LCA) and techno-economic analysis (TEA) to evaluate the synergistic reduction potential of substituting conventional coal-based H2/O2 with renewable-powered electrolytic H2/O2 across eight scenarios for 2030 and 2050, explicitly accounting for green H2 supply constraints. We find that full life-cycle emissions reached 1.29 Gt CO2eq and 20.43 Mt of pollutants in 2023 (≈10% of national GHG emissions), projected to rise to 2.49 Gt and 41.46 Mt by 2050. While the theoretical maximum carbon reduction potential reaches 95%, a severe green H2 supply gap limits near-term feasibility: achievable reductions are only 12% (carbon) and 1% (pollutants) by 2030, rising to 42% and 11% by 2050, with abatement costs of –380 billion to 3.6 trillion CNY. The wind- and solar-powered pathways are most cost-effective (marginal abatement costs as low as 195 CNY/t CO2eq). We recommend prioritizing deployment in renewable-rich regions and aligning electrolysis scale-up with grid decarbonization to enable a pragmatic transition toward a green H2-integrated coal chemical industry.
1. Introduction
China’s coal chemical industry is crucial for ensuring energy security and diversifying chemical feedstocks through clean coal conversion [1,2]. However, it is also a major source of carbon emissions and air pollutants [3,4]. The sector consumes 968 million tons of coal annually—24% of China’s total, second only to power generation—and emits 500 million tons of CO2, accounting for 5% of national emissions [5]. As an energy- and water-intensive industry, it releases substantial amounts of air pollutants and wastewater [6,7]. Driven by growing demand, the industry is expanding rapidly and will generate significant additional emissions. Considering China’s dual carbon goals, its high-carbon development model faces challenges and requires urgent decarbonization and pollution reduction.
Coal functions as both a fuel and a feedstock in the coal chemical industry. Emissions from coal mining, processing, and combustion can be mitigated via electrification [8,9,10]. As a feedstock, coal gasification produces syngas (CO and H2), and generates CO2 [11]. To correct the hydrogen-to-carbon (H/C) ratio in synthesis, the water–gas shift reaction emits additional CO2 [1]. Reducing these process emissions is critical for improving coal utilization efficiency, but practical implementation in China remains limited.
Adding exogenous hydrogen to adjust the H/C ratio is considered an effective way to reduce carbon emissions in the coal chemical industry [1,12,13,14,15,16]. In the international literature, “power-to-X” (PtX) refers strictly to producing fuels or chemicals using only renewable hydrogen and non-fossil carbon sourced (biomass or direct air capture (DAC)). Our approach—green H2 supplementing coal gasification while coal remains the primary carbon source—is more accurately described as a “green H2-integrated coal-to-X” or “hybrid coal-and-H2-to-X” pathway, a transitional step toward a fully renewable PtX system. Chen et al. [1] analyzed the carbon reduction potential and costs of using nuclear- or renewable-based green H2 in the coal chemical industry, considering direct emissions from the chemical conversion and indirect emissions from electricity and heat consumption, but without accounting for upstream carbon emissions from the coal mining and processing—a non-negligible source given the large volumes of coal consumed. Guo et al. [12] adopted a full life-cycle approach to estimate both carbon emissions (from chemical production, fuel consumption, and upstream energy supply) and the emission reduction potential and cost of developing green H2. Yet, their study did not address pollutant emission reductions. Since China’s coal chemical industry is concentrated in the ecologically fragile Yellow River Basin [17,18,19], it is essential to consider the synergistic reduction of carbon and pollutants. Furthermore, few studies have considered whether China’s planned green H2 production can meet the industry’s specific demands [20].
Several studies have estimated the synergistic carbon and pollutant reduction potential in China’s coal chemical industry. Most of these estimates rely on pollutant emissions derived from energy-saving equivalents rather than from direct emission accounting [18]. This approach gives a rough indication of reduction potential but overlooks pollutant reductions from coal mining and processing, leading to deviations from actual conditions. The Manual of Industrial Source Production and Emission Accounting Coefficients provides both direct emission coefficients for coal chemical products and indirect coefficients for power generation, heat supply, and coal mining. These coefficients are detailed and reflect pollutant generation and abatement across different processes. Nevertheless, data quality at the activity level requires improvement, and some data are not publicly accessible. Consequently, few studies have applied this coefficient set to assess pollutant emission reductions, leading to insufficient accuracy in identifying key areas for synergistic mitigation.
In this study, we contribute to the existing literature by integrating four previously underexplored aspects into a unified LCA–TEA framework: the coordination of carbon emissions (as CO2eq) and pollutant emissions—including ammonia (NH3), sulfur dioxide (SO2), nitrogen oxides (NOx), particulate matter (PM), volatile organic compounds (VOCs), ammonia nitrogen (NH3-N), chemical oxygen demand (COD), total nitrogen (T-N), total phosphorus (T-P), volatile phenols (VP), petroleum (PP), and cyanide (CN)—across different production stages using China’s official industrial emission coefficients; the synergistic role of electrolytic O2 in displacing conventional air-separation O2; the distinction between theoretical and supply-constrained reduction potentials based on China’s national H2 roadmap; and provincial-level marginal abatement costs derived from local renewable resources and electricity tariffs. These stages encompass upstream activities and end-of-pipe treatment, with emission factors applied after treatment. We assess medium- and long-term decarbonization and pollutant reduction potentials, along with associated cost–benefits, by constructing eight alternative scenarios involving green H2 and O2 from a life-cycle perspective. We also evaluate whether China’s planned green H2 production can meet the industry’s demand in 2030 and 2050, based on the national hydrogen roadmap, and propose feasible deployment scenarios. Currently, the integrated development of the coal chemical industry with green power and green H2 in China remains at the research and demonstration stage. This study aims to provide a reference for the decarbonization, pollution reduction, and green transformation of China’s coal chemical industry. We refer to our approach as “green H2-integrated coal-to-X” to distinguish it from a fully renewable “power-to-X” (PtX) system, which would require non-fossil carbon sources.
2. Materials and Methods
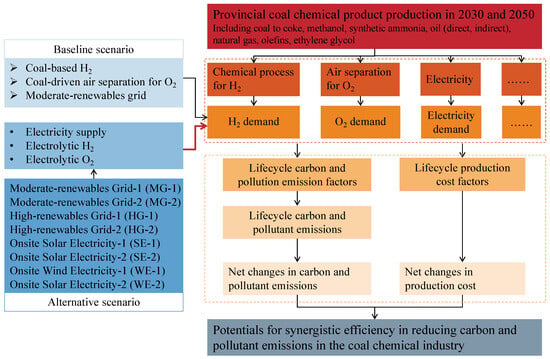
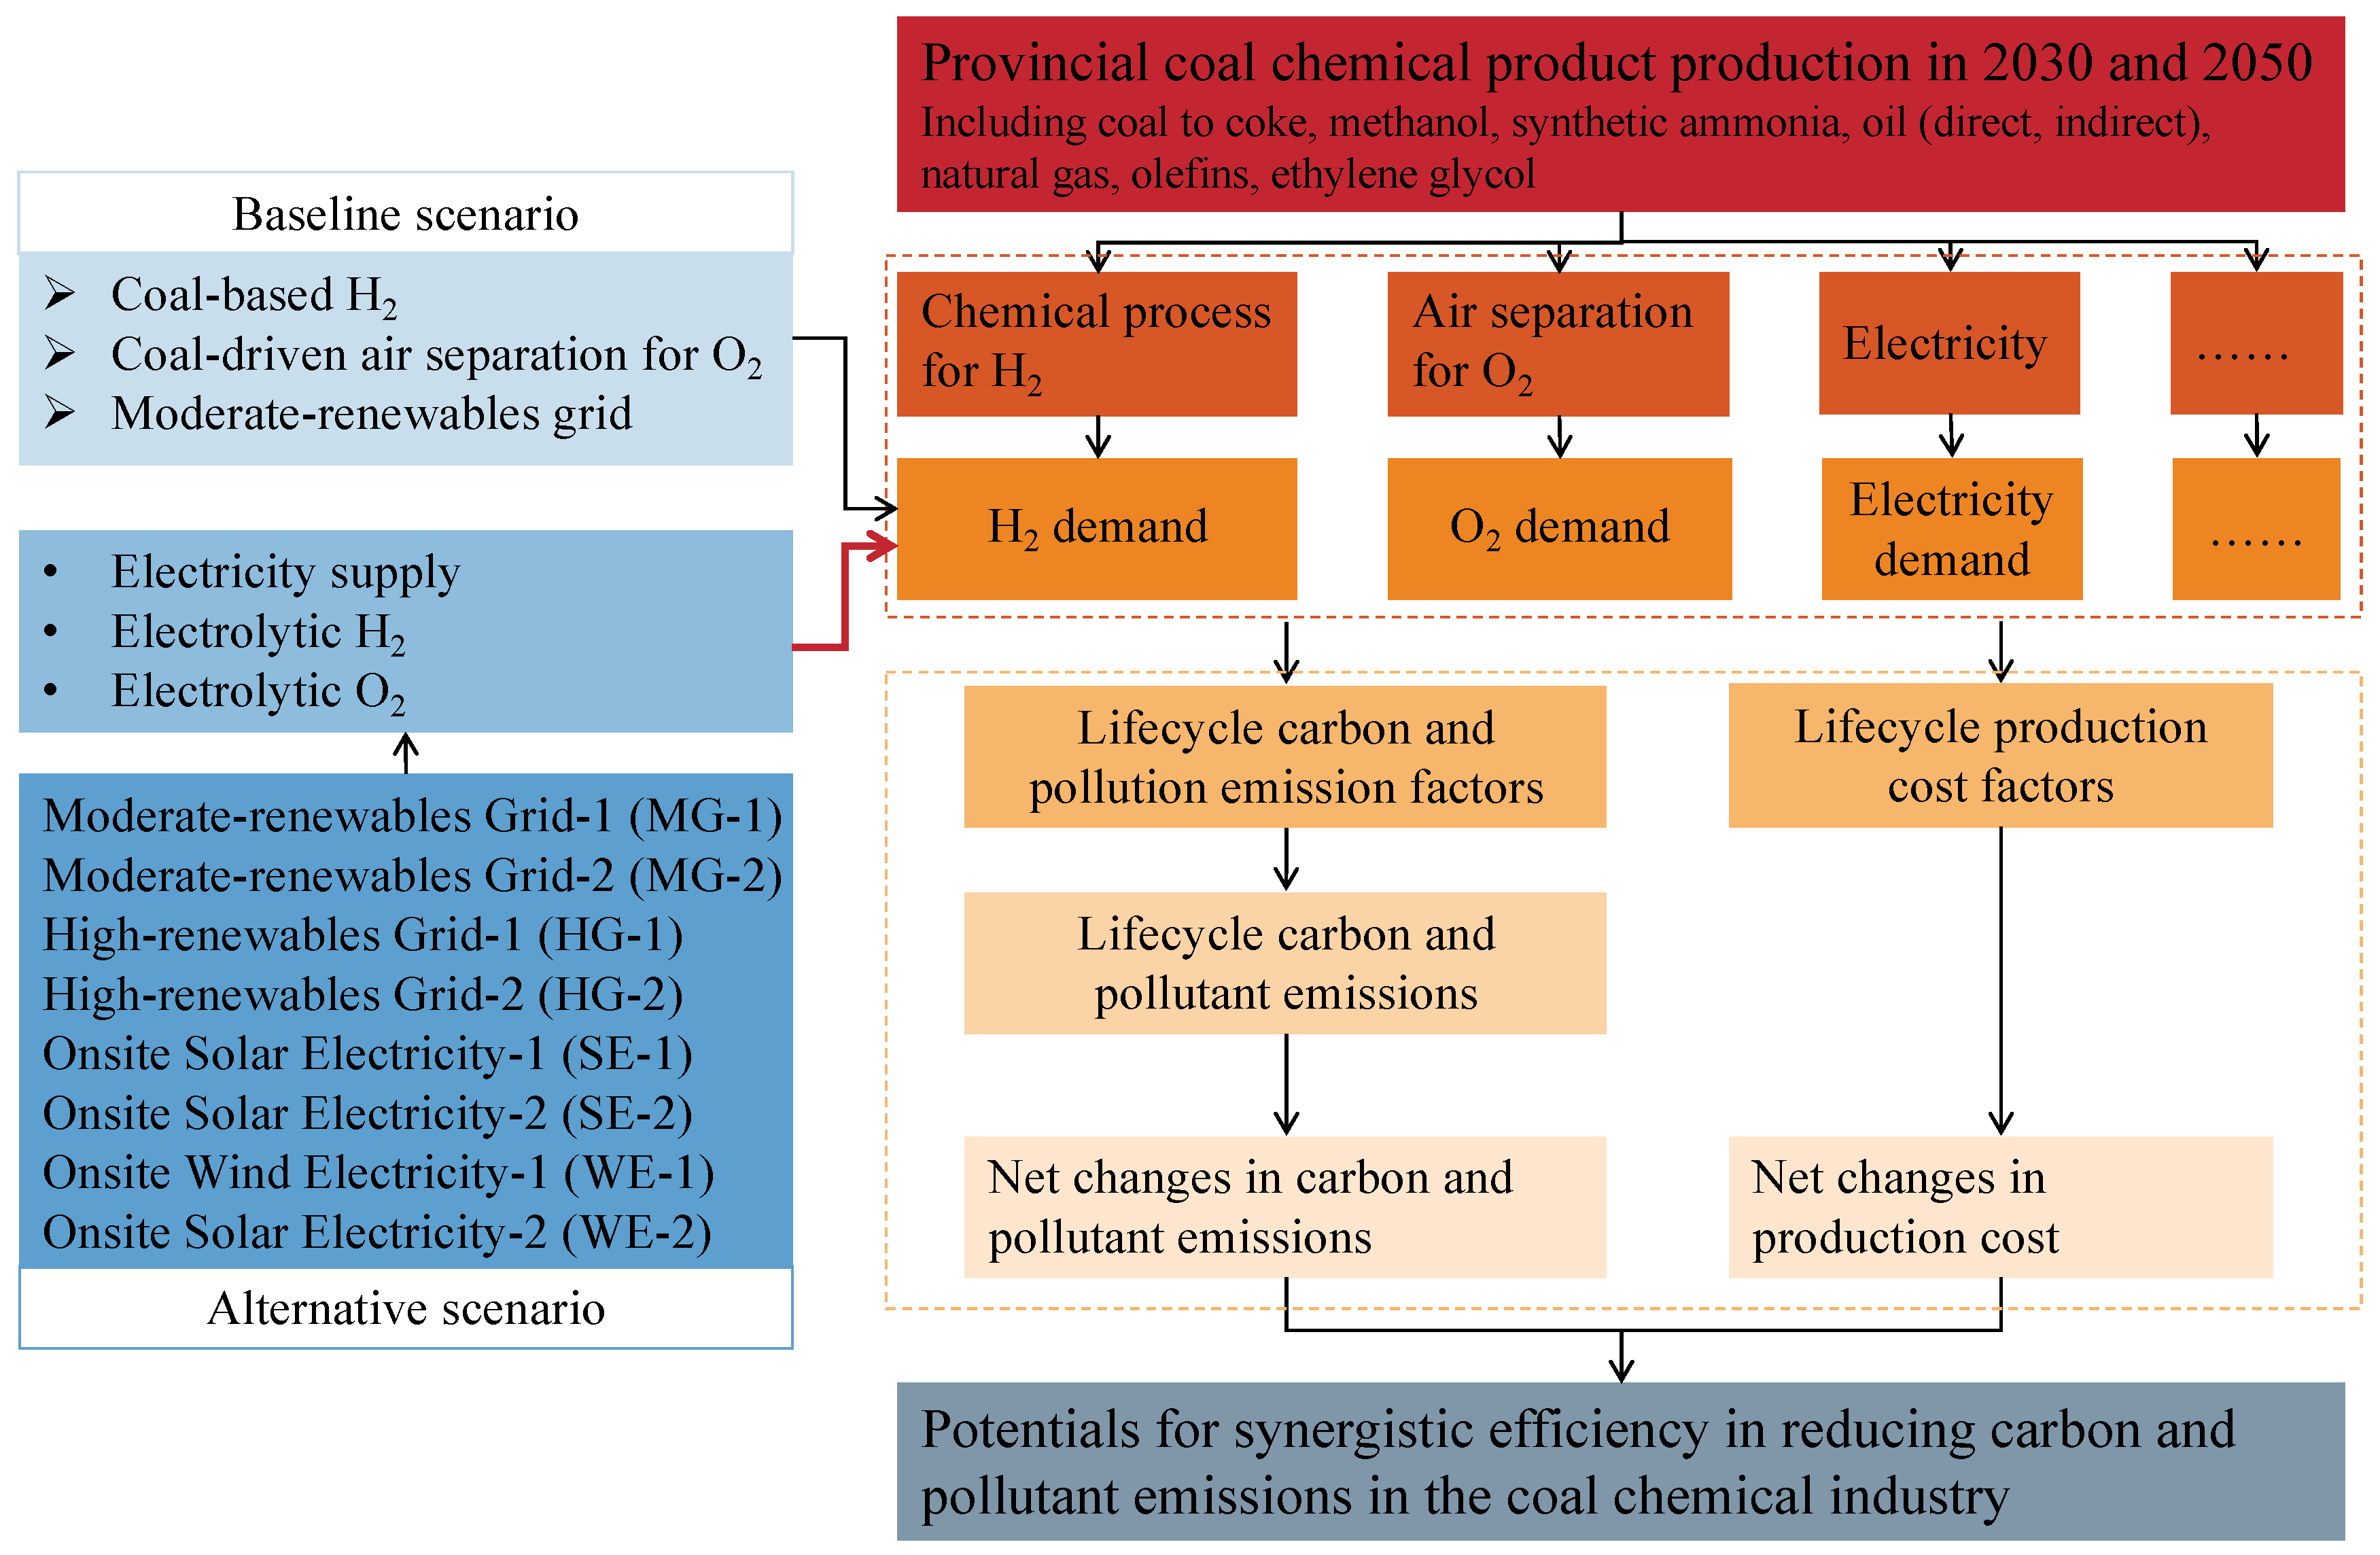
Figure 1 presents the overall research framework for carbon and pollutant emission reduction and the associated cost changes in China’s coal chemical industry. The industry comprises several key subsectors: coal-to-coke, coal-to-methanol, coal-to-ammonia, coal-to-oil (direct and indirect liquefaction), coal-to-natural gas, coal-to-olefins, and coal-to-ethylene glycol. We integrate life-cycle assessment (LCA) and techno-economic analysis (TEA) to evaluate the emission reduction potential and costs of deploying green power, H2, and O2. The LCA covers production processes (coal gasification, water–gas conversion, air separation for O2, water electrolysis, and battery energy storage), fuel consumption (including electricity and heat from captive power plants), and upstream processes (grid electricity, heat supply, and coal mining). TEA assesses the technical performance and cost–benefit of these processes and products.
Figure 1.
Overall research framework for this study.
2.1. Current Status and Baseline Emissions
2.1.1. Production of Coal Chemical Products
We collected data on the output of traditional coal chemical products (coke, ammonia, methanol) and modern coal chemical products in China for 2023, using data from the Statistical Yearbook and the Environmental Statistics Report. Additionally, we compiled information on 213 modern coal chemical projects in China as of April 2024, obtained from the Ministry of Ecological and Environmental Protection and relevant provincial websites. The production distribution of traditional products and the details of modern coal chemical projects for 2023 are presented in Tables S2 and S3.
Provincial coal chemical production for 2030 and 2050 was estimated using 2023 provincial production data and medium- to long-term forecasts for sectors like steel and agriculture [5,21,22,23], by assuming that the production structure of traditional coal chemical products in each province remains unchanged (Table S4). Considering the large scale and long timelines of modern projects, we assumed over 200 projects under construction would be operational by 2030 and those in planned by 2050. This represents a maximum-capacity expansion scenario designed to assess the feasibility and cost-effectiveness of green H2/O2 synergies under future capacity growth, and to identify the remaining gaps (green H2 supply constraints) that need to be addressed for large-scale deployment. Carbon and pollutant emissions for each modern product were estimated based on 90% of its production capacity and allocated at the provincial level (Table S5) [5,12]. To address uncertainty in commissioning timelines, we also considered a conservative scenario in which 20% of the projects currently classified as “in planning” for 2050 are delayed by 5–10 years and are not operational within the study horizon.
2.1.2. Accounting for Carbon and Pollutant Emissions
We collected the 2020 GHG emission factors for all lifecycle stages, including chemical reactions, fuel combustion, upstream coal mining, and electricity/heat supply, from the China’s emission accounts (CEADs) and the Tiangong LCA database from Tsinghua University to obtain GHG emission factors for upstream processes (Tables S6–S12). CH4 and N2O emissions were converted to CO2eq using 100-year global warming potentials (GWPs) of 29.8 and 273, respectively [24]. To facilitate economic comparison, we aggregate multiple pollutants into a unified ‘pollutant equivalent’ for economic analysis based on the Environmental Protection Tax Law (revised in 2018) [25] (pollutant equivalent values: ammonia (NH3): 9.09; sulfur dioxide (SO2): 0.95; nitrogen oxides (NOx): 0.95; particulate matter (PM): 2.36; volatile organic compounds (VOCs): 0.95; ammonia nitrogen (NH3-N): 0.8; chemical oxygen demand (COD): 1; total nitrogen (T-N): 0.8; total phosphorus (T-P): 0.25; volatile phenols (VP): 0.08; petroleum (PP): 0.1; and cyanide (CN): 0.05). However, we recognize that tax-equivalence weights are socioeconomic instruments rather than indicators of physical environmental damage; we therefore conducted a complementary LCIA using the ReCiPe 2016 method (Tables S16 and S17; Section 3.2). Using provincial production data and the corresponding emission factors, we calculated baseline carbon and pollutant emissions for 2023, 2030, and 2050.
where Ppj is the emission of pollutant j, bijx is the emission coefficient of pollutant j for product i at stage x, Pp is the pollutant equivalent, and Dpj is the pollutant equivalent coefficient of pollutant j. All parameters are defined in Table S20.
Emissions associated with the manufacturing and construction of electrolyzers, renewable energy systems (wind turbines, solar panels), and storage facilities are excluded from our system boundaries. Their life-cycle emissions are relatively small compared with the operational emissions of coal chemical processes and power generation, as detailed in Table S1. This is consistent with prior LCA studies [1,12].
2.2. Emission Reduction Scenarios
We used a national-level, top-down LCA and TEA model to evaluate the medium-to-long-term potential of green H2/O2 in China’s coal chemical industry. To make the analysis tractable, we adopted several simplifications and boundary conditions, which define the scope and limitations of our findings. The key system boundaries and modeling assumptions are summarized in Table S1. Within this framework, we established a baseline scenario and eight alternative scenarios to assess the medium- and long-term potential for carbon and pollutant reduction in China’s coal chemical industry, focusing on green electricity, H2, and O2 for 2030 and 2050 (Table 1). We evaluate the carbon and pollutant reduction potential and benefits of these eight scenarios under two modes: (i) electrolysis H2 + electrolysis O2 (SRS), and (ii) electrolysis H2 + electrolysis O2 + electrically driven air separation O2 (ERS). In SRS mode, the industry obtains all H2 and O2 via water electrolysis. In ERS mode, H2 comes from electrolysis, the co-generated O2 is utilized, and the remaining O2 is supplied by air separation. For each mode, we evaluated the potential and benefits under four power structures: medium renewable grid (MG), high renewable grid (HG), solar energy (SE), and wind energy (WE). In 2023, the grid generation mix consists of coal (63%), hydro (13%), nuclear (5%), wind (9%), solar (3%), natural gas (3%), and biomass (4%), with a life-cycle GHG emission factor of 608 kg CO2eq/MWh [26]. The projected power generation structure and carbon emission factors for 2030 and 2050 are presented in Table S8 [27,28,29].
Table 1.
Emission reduction scenarios in China’s coal chemical industry.
2.3. Carbon and Pollutant Emissions Reduction Potentials
We quantified the carbon and pollutant reduction potential of each scenario by comparing its emissions with the baseline. The demand for H2, O2, and electricity in each scenario was estimated using chemical reaction equations and literature data [12]. By analyzing consumption in water electrolysis, air separation, and coal gasification, along with hydrogen leakage and energy storage, we calculated the pollution reduction potential of producing H2 and O2 via grid-connected or green power electrolysis to replace conventional methods. For each scenario, we calculated the emissions reductions from water–gas shift-based H2, coal-driven air separation-based O2, coal gasification, and coal mining, and then added the emission increases from electrolysis, energy storage, and H2 leakage.
where ∆Pc, ∆Ppj, and ∆Pp represent the carbon emission reduction potential, pollutant j’s reduction potential, and tax-equivalent pollutant reduction potential (used solely for cost–benefit aggregation), respectively. The environmental significance of pollutant reductions is evaluated separately via LCIA characterization factors (Supplementary Tables S16 and S17), ensuring that the aggregation for economic comparison does not obscure the distinct environmental and health impacts of different pollutant species. λgc is the carbon emission parameter for process g, which includes H2 production from coal, O2 production via air separation, and electricity consumption in coal gasification and mining. λhc is the carbon emission parameter for process h, including electricity consumption for electrolysis, energy storage, and H2 leakage. λgpj is the emission parameter for pollutant j in process g. λhpj is the emission parameter for pollutant j in process h. kgpj and khpj represent the average treatment efficiency of pollutant j in processes g and h, respectively.
2.4. Cost–Benefit Analysis
We employed an interpolation method to assess cost variations for eight coal-based products under the eight scenarios relative to the baseline, along with the corresponding carbon and pollutant reductions per unit cost. The analysis was based on national average electricity costs, hydrogen production costs via wind and solar electrolysis (Tables S13 and S14), and hydrogen demand across different processes [30,31,32]. We evaluated the economic viability of adopting green electricity, H2, and O2 as inputs by examining cost variations and carbon reduction per unit cost. Cost changes included savings from reduced H2, O2, and electricity consumption, alongside additional costs arising from water electrolysis, energy storage, and hydrogen leakage. The cost–benefit of unit emission reduction was defined as the ratio of total emission reduction to cost variation.
where ∆E is the change in production cost of the alternative compared to the baseline scenario. Uc and Up denote the unit cost of carbon and pollutant emission reductions, respectively. λge and λhe represent the cost parameter of the production process g and h, respectively.
Cost boundary and interpretation of negative costs. The cost analysis includes electrolyzer capital expenditure (CAPEX) and O&M, electricity for electrolysis and air separation, energy storage, and hydrogen leakage losses. Avoided costs include coal consumption for H2 production and air-separation O2, and grid electricity otherwise used for air separation. Costs for carbon transport, storage, or utilization (CCUS) are not included, as we focus on emission avoidance rather than post-combustion capture. Similarly, hydrogen transportation, compression, storage, and distribution costs are also excluded. We assume on-site production and consumption of electrolytic H2 within the same production base, consistent with our provincial-level supply–demand matching. If green H2 were supplied from centralized hubs to dispersed end-users, additional costs would apply; we note this as a limitation. Negative abatement costs mean the scenario yields net economic savings relative to the baseline, mainly from: (i) replacing expensive coal-based H2 with lower-cost renewable H2 in regions with favorable renewable resources; (ii) using electrolysis-derived O2 to displace costly air-separation O2; and (iii) projected declines in electrolyzer costs and renewable electricity prices by 2050 (Tables S13 and S14). These should be interpreted as cost savings, not direct revenues.
2.5. Uncertainty Analysis
We drew on literature data regarding demand forecasts, GHG and pollutant emission factors, cost parameters, and project status (operational, under-construction, and planned) for coal chemical facilities. These data were used to estimate carbon emissions for China’s coal chemical industry in 2030 and 2050. However, these estimates remain subject to uncertainty and may not fully capture future realities. Additionally, we applied national average cost of H2 production from coal gasification, grid electricity, and renewable sources to estimate carbon and pollutant abatement costs. These estimates do not account for potential changes in operating parameters; therefore, actual costs may differ from our projections. A dedicated discussion of the sensitivity of our conclusions to these key parameters is provided in Section 4.3, supported by a quantitative sensitivity analysis in Supplementary Information (Table S15).
3. Results
3.1. Carbon and Pollutant Emissions
3.1.1. Inconsistent Carbon and Pollutant Emission Sources Throughout the Industry Lifecycle
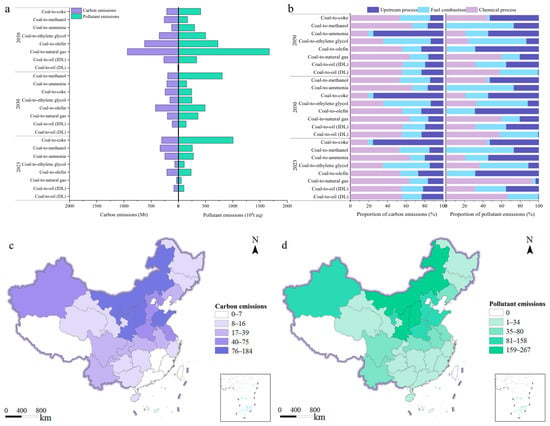
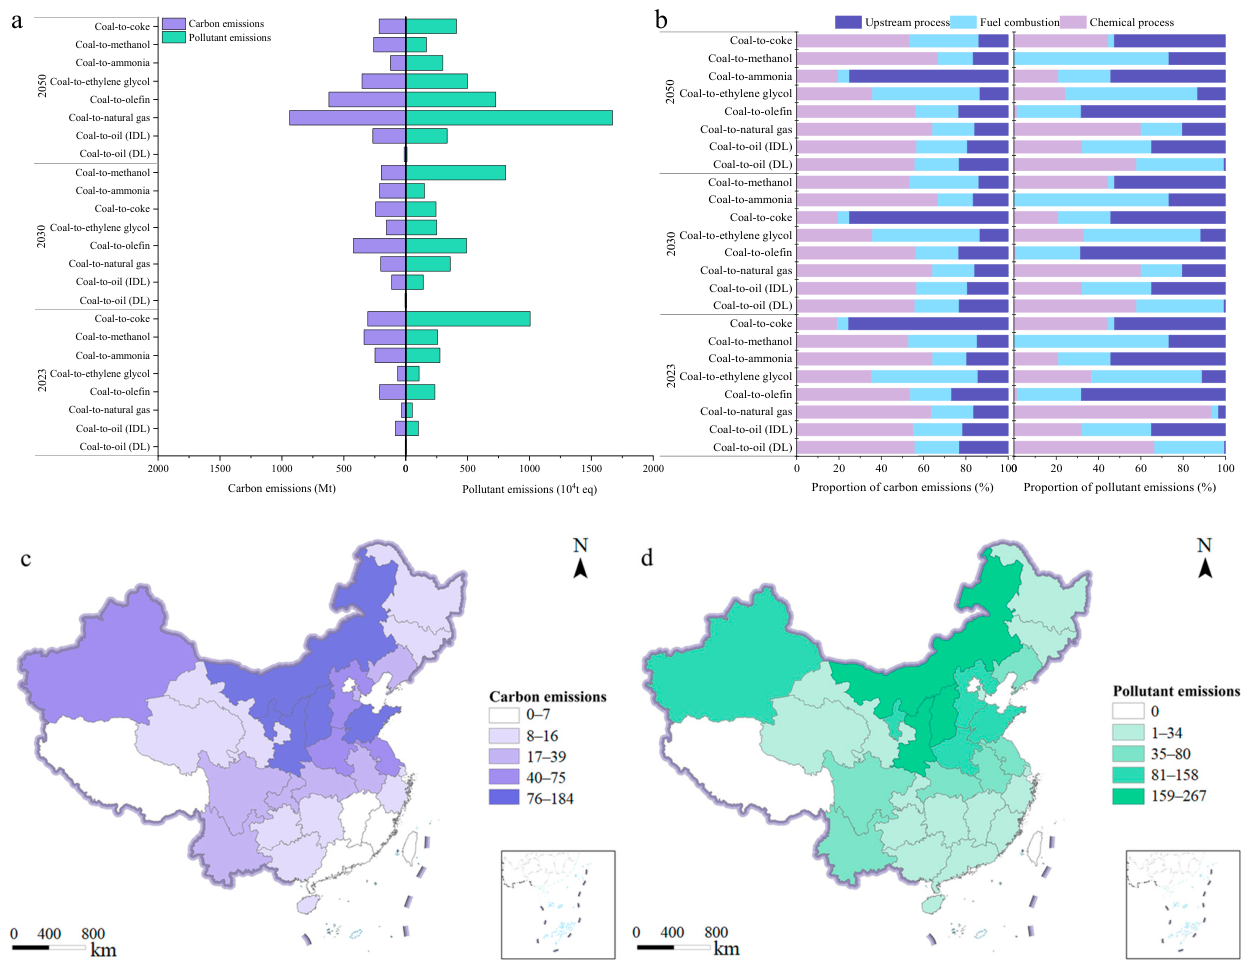
China’s coal chemical industry is projected to emit 1.29 Gt CO2eq and 20.43 Mt of pollutants in 2023. Traditional coal chemical processes, including coal-to-coke, coal-to-methanol, and coal-to-ammonia, account for about 75% of these emissions. Except for coal-to-coke, whose emissions come almost entirely from upstream mining, the emission profiles of other products vary considerably (Figure 2a,b). Onsite chemical processes contribute 47% of carbon and 12% of pollutant emissions; onsite fuel combustion at power plants accounts for 20% and 28%, respectively. Upstream processes contribute 33% and 60% of total carbon and pollutant emissions. For most products, over 73% of carbon emissions originate from chemical processes and fuel combustion. For coal-to-coke, 75% of emissions come from upstream processes.
Figure 2.
Carbon and pollutant emissions and distribution in China’s coal chemical industry. (a) Carbon emissions. (b) Pollutant emissions. (c) Carbon emissions distribution (Mt). (d) Pollutant emissions distribution (104 t).
To further assess the reliability of our estimates, we compared our results with previous LCA studies and available inventories. Our estimated carbon emissions are broadly consistent with the ranges reported in earlier studies [1,12,33], and our pollutant emissions are broadly comparable to the values in the China Environmental Statistics Yearbook. The minor deviations mainly reflect differences in system boundaries, emission factor selection, and the inclusion of upstream coal mining and processing.
3.1.2. Highly Concentrated Spatial Distribution of Provincial Carbon and Pollutant Emissions
The distribution of carbon and pollutant emissions across provinces is highly concentrated. In 2023, Inner Mongolia, Ningxia, Shanxi, and Shandong collectively contributed approximately 0.67 Gt CO2eq (52%) of carbon emissions and 11.0 Mt (54%) of pollutant emissions, accounting for most of the national total from this industry (Figure 2c,d). These provinces also hosted a predominant share of production capacity, representing 48% of traditional and 68% of modern coal chemical capacity in 2023 (e.g., 190.61 Mt of coke and 6.71 Mt of olefins). Coal chemical production capacity in these regions is closely aligned with coal-fired power generation [34].
3.1.3. Decarbonization and Pollution Reduction in the Modern Coal Chemical Industry
As product capacity continues to shift, carbon emissions from China’s coal chemical industry are projected to reach 1.53 Gt CO2eq in 2030 and 2.49 Gt CO2eq in 2050, with corresponding pollutant emissions of 24.53 Mt and 41.16 Mt. Most emissions will remain concentrated in Inner Mongolia, Xinjiang, Shaanxi, and Shanxi (Figure S1). With ongoing capacity controls on traditional products and rapid expansion of modern production, carbon and pollutant emissions from the traditional segment are projected to decrease by 23% and 24% by 2030, while those from the modern segment rise by 136% and 102%. The modern coal chemical industry will account for over half of total emissions, with coal-to-olefins as the largest contributor. By 2050, emissions from traditional processes are projected to decline further by 41% and 36%, while those from modern process increase by 423% and 347%. Decarbonization and pollution reduction in the modern coal chemical industry will be critical over the medium to long term.
3.2. Theoretical Carbon and Pollutant Reduction Potentials
3.2.1. Reduction Potentials in the SRS Mode
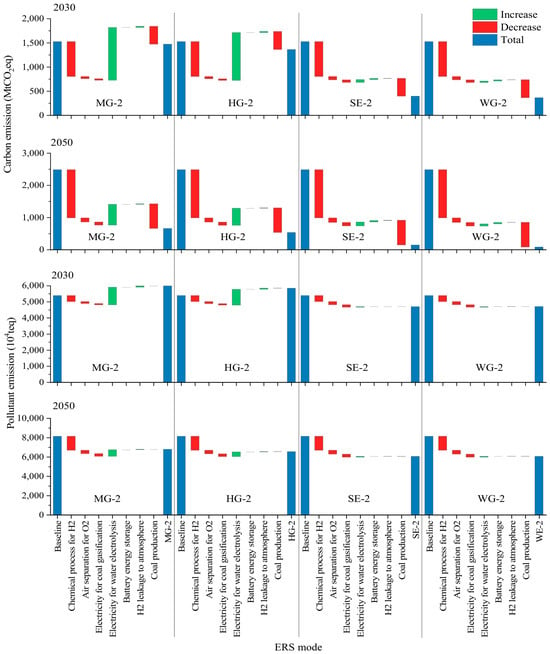
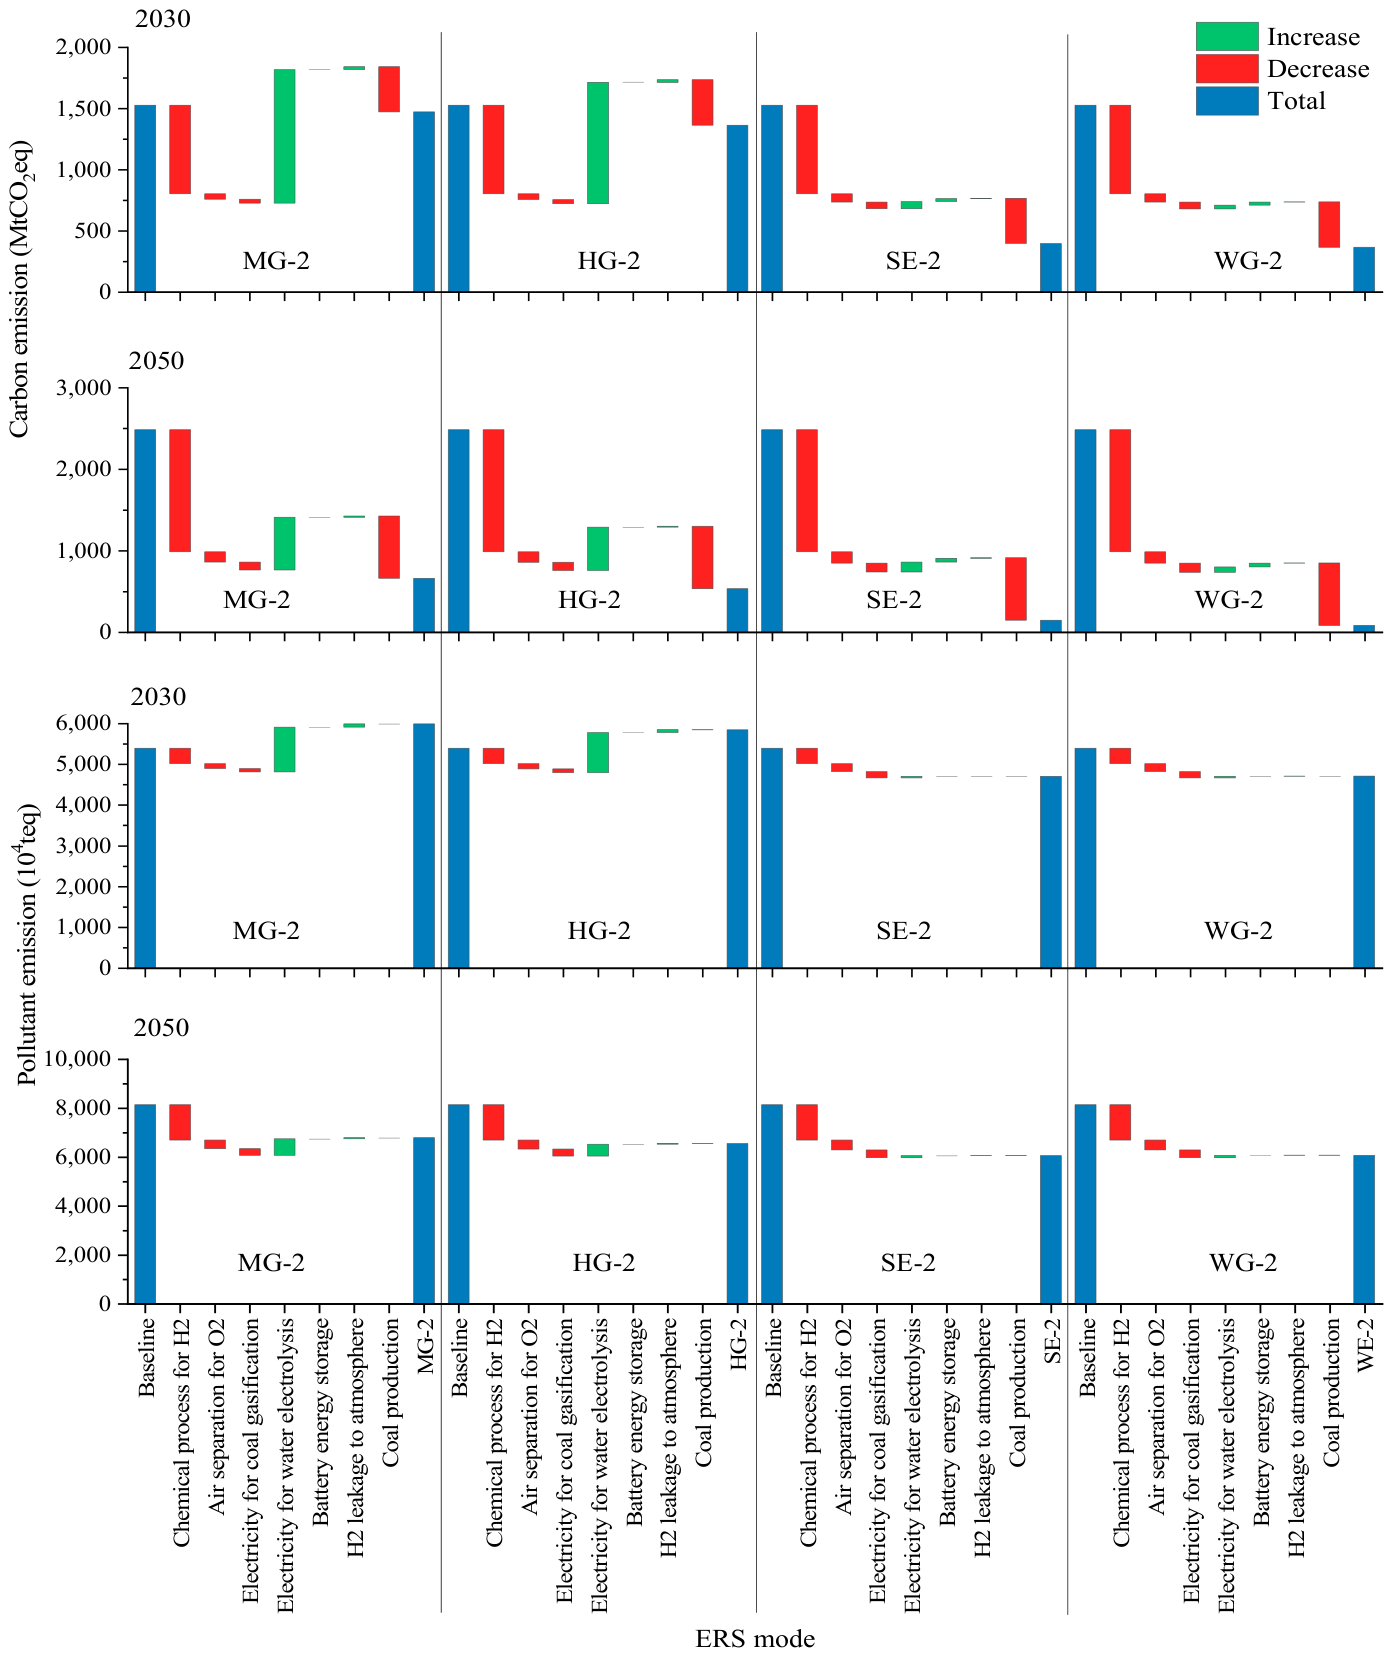
Figure 3 compares carbon and pollutant emissions under different reduction scenarios in 2030 and 2050. The ERS mode reduces emissions from coal gasification, air separation for O2, and coal production, though electrolysis adds some emissions. As shown in Figure S2, SE-1 and WE-1 have the highest theoretical reduction potential among the SRS options. But as the electricity mix gets cleaner, the gap between wind-/solar-based and grid-based electrolysis narrows, reducing the long-term benefits of the SE-1 and WE-1. For instance, the theoretical reduction in SE-1 and WE-1 is 163–189% higher than in MG-1 and HG-1 in 2030, but this advantage narrows to 42–60% by 2050. Thus, the cleanliness of the power mix will be essential for advancing decarbonization and pollution reduction.
Figure 3.
Carbon and pollutant emissions under alternative scenarios of ERS mode.
3.2.2. Reduction Potentials in the ERS Mode
The ERS mode has much greater theoretical carbon and pollutant reduction potential than SRS. For 2030, MG-2 and HG-2 could reduce carbon emissions by 0.05 Gt CO2eq and 0.16 Gt CO2eq, respectively. However, because they rely on a carbon-intensive grid, they would also increase pollutant equivalents of 24.91 Mt and 21.48 Mt. (Figure 3 and Figure S3). WE-2 and SE-2 have slightly lower theoretical reductions than WE-1 and SE-1, but the differences are marginal. Over the medium and long term, WE-2 and SE-2 still have much higher potential than MG-2 and HG-2, though this advantage narrows to 12–24% by 2050 as renewable electricity share grows.
Further analysis shows that by 2030, MG and HG could reduce COD and T-P emissions alongside carbon. But as Figure S3 shows, these scenarios would increase air pollutants (SO2, NOx, PM) because they rely on a carbon-intensive grid for electrolysis [35,36,37]. This shows that the aggregated “pollutant equivalent” metric, used for cost–benefit comparison, masks important differences in environmental and health impacts. Under the assumed power mix evolution, the theoretical reduction potential for carbon and COD would increase by 7.1 Mt and 3.2 Mt by 2050, while air pollutants could be reduced by 70–95%. In contrast, WE and SE scenarios, particularly WE-2 and SE-2, have better theoretical potential for long-term decarbonization and synergistic pollution reduction.
To assess whether the tax-equivalent metric masks heterogeneous impacts, we analyzed the WE/SE scenarios using ReCiPe 2016 midpoint characterization. The results (Tables S16 and S17) show that reduction patterns across impact categories are broadly consistent with the tax-equivalent trends: WE-2 achieves the highest reductions across all three LCIA categories in both 2030 and 2050. However, the relative magnitudes differ: PM2.5 formation and freshwater eutrophication reductions are proportionally larger than human toxicity reductions, reflecting pollutant-specific removal efficiencies. No scenario shows a trade-off where tax-equivalent gains conceal adverse effects in key LCIA categories. This consistency supports the robustness of WE/SE pathways as synergistic reduction strategies.
3.3. Cost–Benefits of Decarbonization and Pollutant Reduction
3.3.1. Lower Reduction Costs in ERS Mode
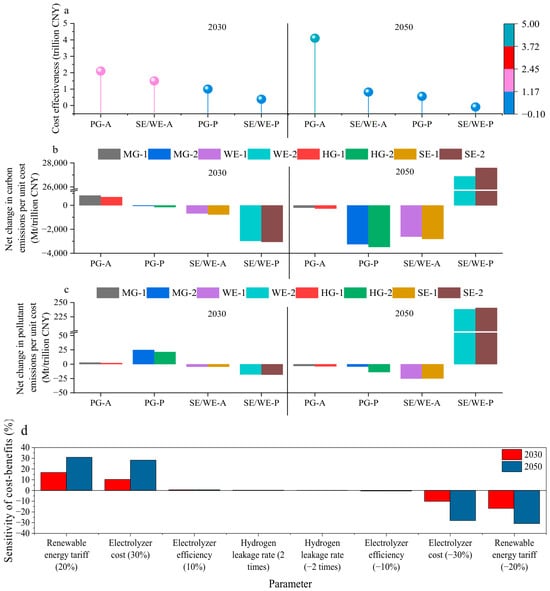
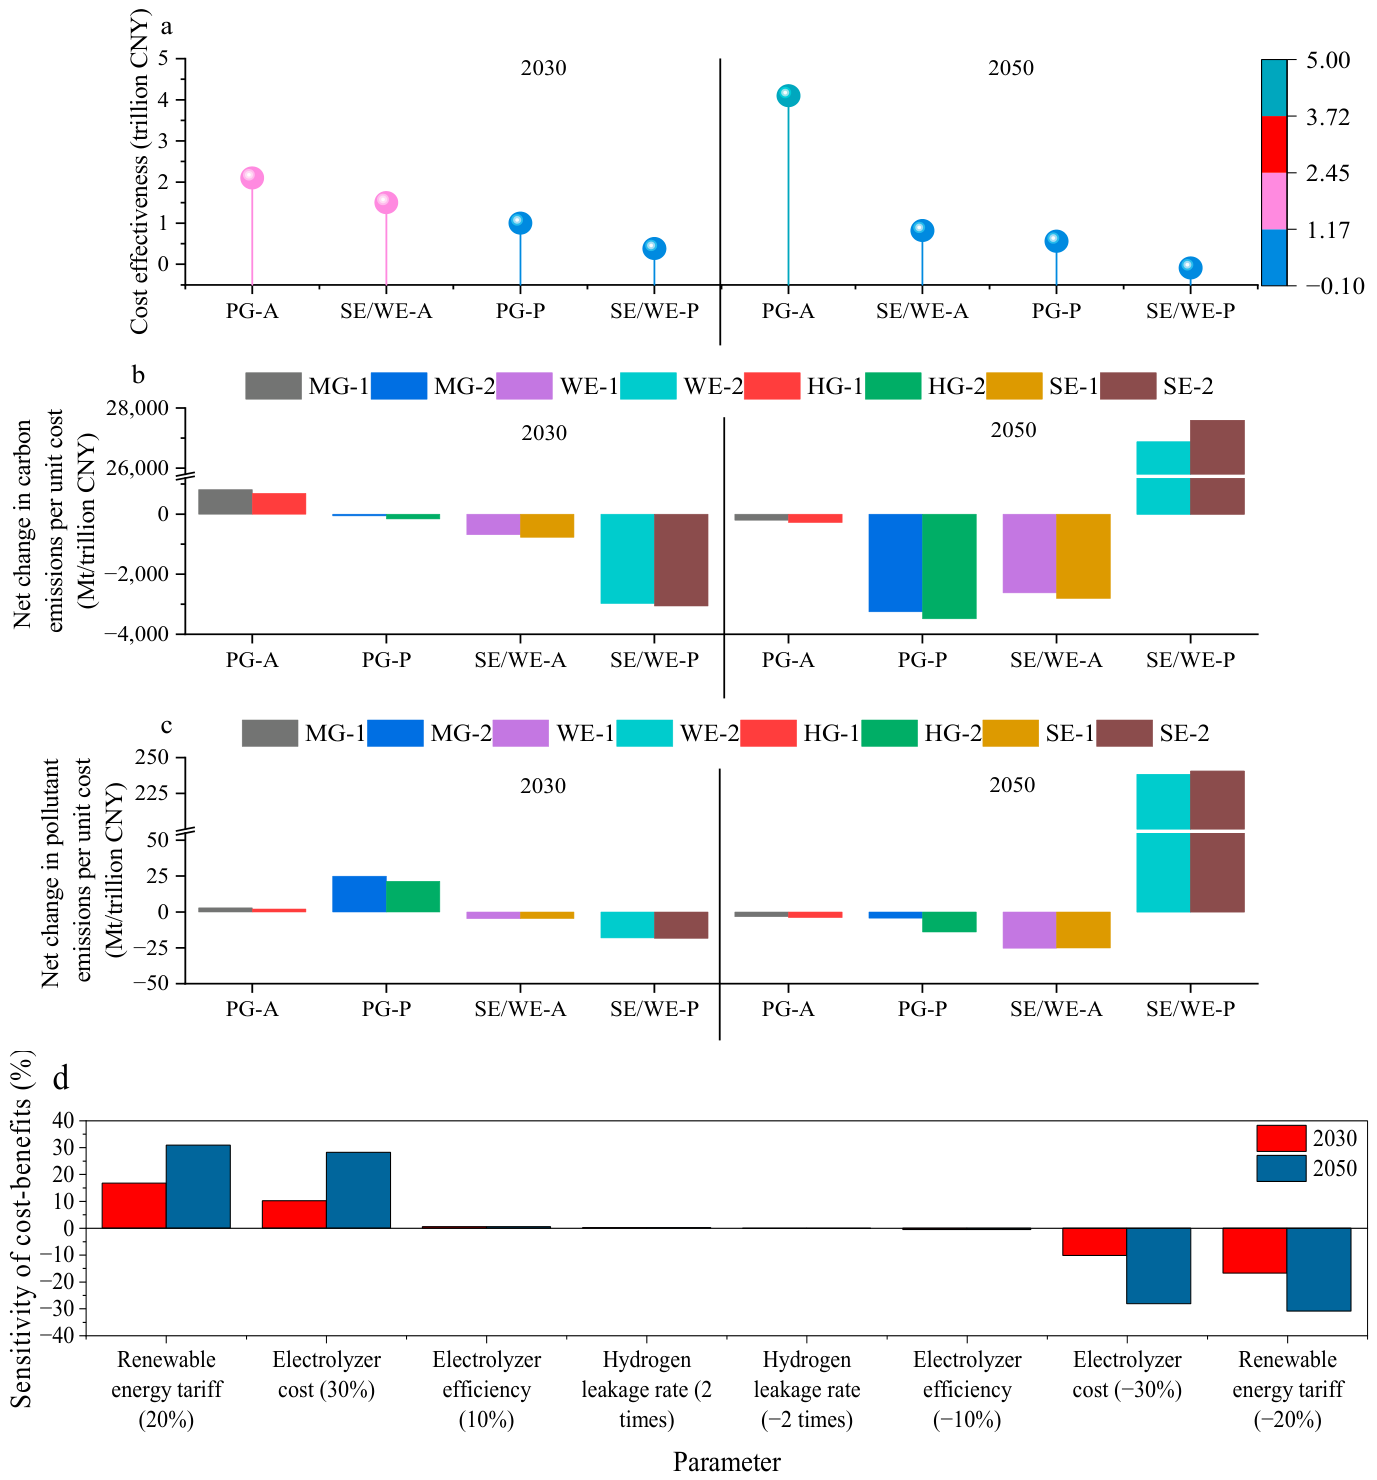
By 2030, the additional reduction costs for grid-based (PG-A) and wind-/solar-based (WE/SE-A) electrolysis are projected to be 2.1 trillion CNY and 1.5 trillion CNY above the baseline (Figure 4a). The ERS mode reduces these to 1.0 trillion CNY for PG-P and 0.38 trillion CNY for WE/SE-P. Figure 4b,c present the carbon and pollutant reductions per unit cost. For MG-1 and HG-1, the incremental cost of achieving an additional 690–820 Mt CO2eq and 2.1–2.8 Mt of pollutant equivalents is about 1 trillion CNY. Given the high costs and the carbon intensity of grid, the grid-powered H2 pathway is not recommended for 2030. WE and SE scenarios, especially WE-2 and SE-2, achieve 3000 Mt CO2eq and 18 Mt of pollutants per trillion CNY, making them the most cost-effective option by 2030.
Figure 4.
Cost benefits of green electricity—green H2—green O2 to help the coal chemical industry decarbonize and reduce emissions. (a) The cost of decarbonization and pollutant reduction in China’s coal chemical industry by green electricity—green H2—green O2; (b), net change in carbon emissions per unit cost; (c), net change in pollutant emissions per unit cost; and (d), sensitivity of cost-effectiveness to parameter changes. PG-A, grid electricity + electrolytic H2 + electrolytic O2; SE/WE-A, photovoltaic/wind power + electrolytic H2 + electrolytic O2; PG-P, grid electricity + electrolytic H2 + electrolytic O2 + electrically driven air separation O2; SE/WE-P, photovoltaic/wind power + electrolytic H2 + electrolytic O2+ electrically driven air separation O2.
By 2050, all scenarios show better cost–benefit performance, with PG-P and WE/SE-P having lower costs than their PG-A and WE/SE-A. WE-2 and SE-2 remain the most cost-effective, delivering 26.9–27.6 Gt CO2eq and 238–240 Mt of pollutants per trillion CNY. Although green H2 supply is still projected to be insufficient by 2050, the PG-P scenarios, especially HG-2, can help meet demand.
3.3.2. High Reduction Costs in Xinjiang and Provinces Along the Yellow River Basin
By 2030, additional reduction costs in Xinjiang, Inner Mongolia, Shaanxi, Shanxi, Henan, and Shandong account for 64.9% of the industrial total (Figure S4), as these provinces benefit from low H2 production costs due to their high renewable energy shares [38]. However, due to its concentrated production capacity [34] and substantial H2 demand (Figure S5), Inner Mongolia has the highest total abatement cost, yet the lowest marginal abatement cost (MAC) (CNY/t CO2eq). By 2050, reduction costs in Inner Mongolia and Shaanxi together are projected to represent 68.6% of the total.
3.3.3. Regionalized Marginal Abatement Costs Reveal Substantial Inter-Provincial Heterogeneity
The national-average cost analysis above is useful for macro-level trends, but it masks substantial inter-provincial heterogeneity in renewable resource and electricity tariffs. To address this, we regionalized our analysis for the 14 provinces with significant coal chemical capacity, focusing on Inner Mongolia, Ningxia, Xinjiang, Shaanxi, Shanxi, Henan, and Shandong, which together account for over 85% of the industry’s H2 demand and production capacity. Using provincial-level LCOH (Table S14), local industrial electricity tariffs (Table S19), and province-specific H2 demand (Figure S5), we calculated scenario-specific marginal abatement costs (MAC) for CO2 reduction (Table S18; Figure S4c–f).
The results show large differences in abatement costs across provinces. In 2030, under WE-2, Inner Mongolia exhibits the lowest MAC at 195–235 CNY/t CO2eq, due to its abundant wind, low LCOH (17.6 CNY/kg H2, Table S14), and preferential electricity tariffs for strategic industries (as low as 0.32 CNY/kWh). Ningxia follows at 215–255 CNY/t CO2eq, benefiting from its similarly low electricity costs (0.294–0.38 CNY/kWh) and concentrated high-energy industrial base.
Xinjiang presents an MAC of 255–305 CNY/t CO2eq—moderately higher than Inner Mongolia—despite having the lowest provincial LCOH (28.2 CNY/kg H2 in 2030, Table S14). This is attributable to its higher transmission and infrastructure costs, as well as the logistical challenges of integrating remote renewable generation with industrial demand centers (e.g., Zhundong, Hami). Shaanxi and Shanxi face higher MACs at 295–365 and 305–375 CNY/t CO2eq, respectively, due to their higher grid electricity tariffs (0.38–0.45 CNY/kWh in both provinces) and less favorable renewable resource endowments compared with the northwest. Henan and Shandong, while hosting significant production capacity (notably coke and methanol), exhibit MACs of 380–450 and 410–480 CNY/t CO2eq—substantially above the national average—primarily because of their elevated electricity tariffs (0.45–0.52 and 0.48–0.55 CNY/kWh, respectively) and greater reliance on imported power.
For the SE-2 scenario, MACs are marginally higher than those of WE-2 (typically 10–20 CNY/t CO2eq above WE-2) in most provinces, except in Xinjiang and Qinghai where solar resources are exceptionally abundant and the cost differential between WE-2 and SE-2 is smaller (5–10 CNY/t CO2eq). This reflects the comparative advantage of solar power in high-irradiation regions.
By 2050, as renewable electricity costs and electrolyzer CAPEX decline across all regions (Tables S13 and S14), the inter-provincial MAC gap narrows considerably. Inner Mongolia retains the lowest MAC (55–85 CNY/t CO2eq), followed by Ningxia (60–90 CNY/t CO2eq) and Xinjiang (75–105 CNY/t CO2eq), while Shaanxi and Shanxi converge to 90–130 and 100–140 CNY/t CO2eq, respectively. The MACs of Henan and Shandong are projected to decline to 140–190 and 160–210 CNY/t CO2eq, respectively, as grid decarbonization reduces electricity costs and transmission bottlenecks ease. This convergence suggests that while Inner Mongolia and Ningxia offer the lowest-cost opportunities in the near term, the cost differentials diminish over time, supporting a diversified regional deployment strategy.
Policy implications of regional findings. Our regionalized analysis carries three critical policy implications. First, near-term investment should be prioritized in Inner Mongolia, Ningxia, and Xinjiang, where the combination of low-cost renewable electricity, favorable LCOH, and concentrated production capacity delivers the highest abatement per unit of investment. Second, in provinces with higher MACs (Shaanxi, Shanxi, and especially Henan and Shandong), the pace of electrolysis deployment should be aligned with local grid decarbonization progress to avoid “pollution leakage” and to ensure economic viability. Third, the substantial variation in MACs underscores the limitation of a uniform national strategy—instead, targeted provincial policies that reflect local renewable resource endowments, electricity tariffs, and industrial structure are essential for cost-effective deployment.
4. Discussion
The quantitative results represent central macro level trends, not precise forecasts for any specific province or project. Regional heterogeneity and future industrial shifts may cause deviations. Scenario analysis shows that supplementing with renewable H2 and O2 has significant decarbonization and pollution reduction potential. This aligns with previous studies [1,12,33], which show that external H2 supplementation effectively reduces carbon emissions. We argue that this is not just an incremental improvement, but a fundamental step toward shifting the industry from fossil-fuel-based to electricity-based chemical manufacturing.
4.1. Strategic Integration of Green H2 and O2: Beyond Incremental Abatement—Toward a Hybrid Coal-and-H2 Pathway
The large emission reductions under WE/SE scenarios show the synergistic potential of renewable H2 and O2. This synergy displaces fossil fuels and offers clear economic advantages, lowering decarbonization costs compared with conventional approaches. By 2050, reduction costs under WE/SE are projected to be 80% lower than under PG. The combination of electrolytic H2, co-generated O2, and electrically driven air separation O2 is particularly cost-effective. By 2030, PG-P and WE/SE-P costs are projected to be 52% and 75% lower than PG-A and WE/SE-A, respectively. By 2050, these advantages widen to 86% and 111%. This economic viability is crucial for large-scale deployment and represents a shift from coal-based feedstock toward a hybrid coal-and-H2 pathway, which also lays the groundwork for a future fully renewable PtX system.
Positioning green H2/O2 among alternative mitigation options. Compared with energy efficiency, electrification, blue H2 with CCS, methane control, and capacity control, green H2/O2 is unique in directly addressing the carbon-to-hydrogen ratio imbalance in syngas production, the fundamental source of process CO2, while also reducing pollutant burdens by displacing coal-based inputs. It is therefore best characterized as a medium-to-long-term core mitigation pathway, complementary to near-term efficiency measures and electrification, and potentially synergistic with CCUS in a future circular carbon economy.
4.2. Key Challenges: Supply–Demand Gap and Pollution Leakage
Realizing the potential of renewable H2/O2 supplementation faces two critical, interconnected challenges: a substantial green H2 supply–demand gap and the risk of near-term pollution leakage.
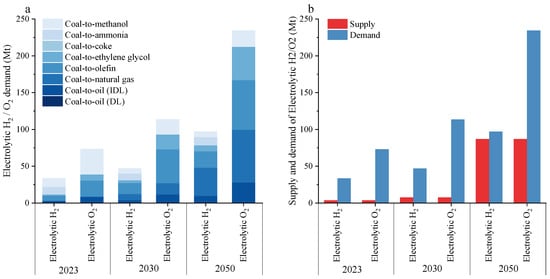
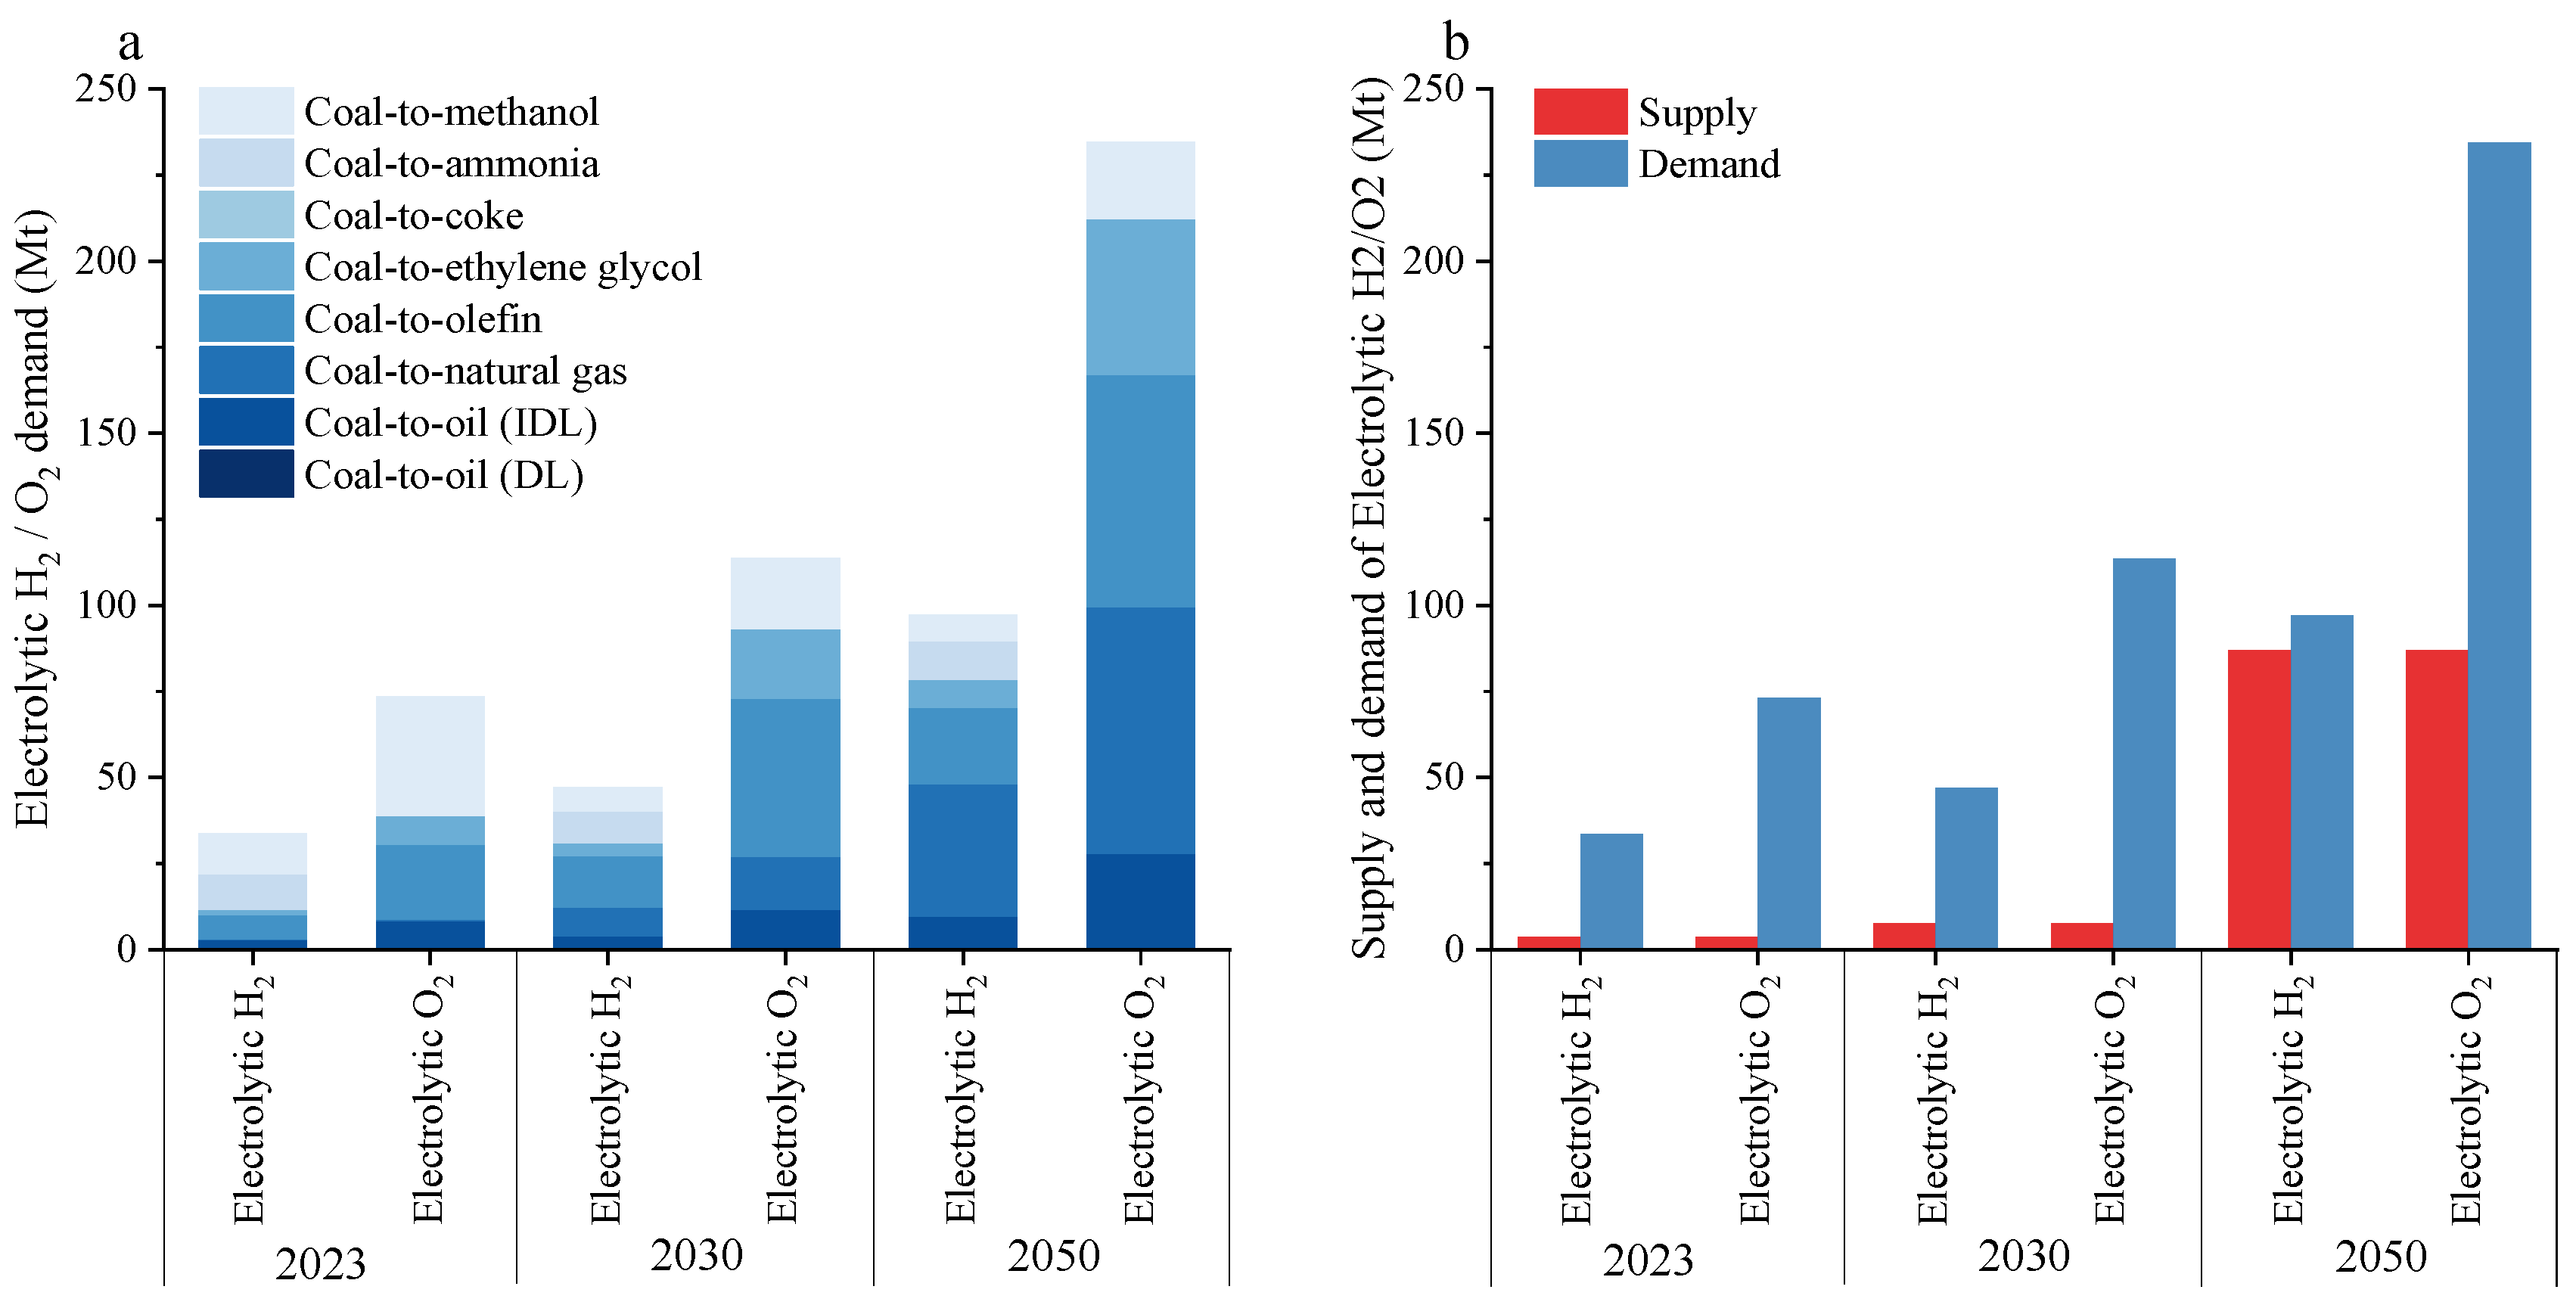
The primary obstacle is the severe mismatch between projected green H2 supply and the industry’s demand. Currently, China’s hydrogen production is dominated by fossil fuels, with electrolytic hydrogen accounting for only about 1% of total output [39]. Although green H2 production is expected to grow rapidly, reaching an estimated 7.7 Mt annually by 2030, demand from the coal chemical sector alone is projected to reach 47 Mt of H2 and 1.136 Gt of O2 (Figure 5a). Consequently, green H2 is projected to meet only 16.4% of H2 demand and 6.8% of O2 demand by 2030 (Figure 5b). Bridging this gap will require an unprecedented expansion of green H2 capacity, supported by targeted policies, with an average annual growth rate of approximately 13%. Under current hydrogen supply plans and the existing planning framework for key sectors (including coal chemicals, steel, and transportation), the achievable portion of the theoretical potential is estimated at 1.9 Gt CO2eq and 5 Mt of pollutants by 2030, equivalent to 12% and 1% of the industry’s baseline emissions, respectively. By 2050, if the supply gap persists but narrows as projected, the realizable portion could increase to approximately 1.04 Gt CO2eq and 9 Mt of pollutants, representing 42% and 11% of baseline emissions, respectively.
Figure 5.
Analysis of electrolytic H2 and O2 demand and supply in China. (a) Electrolytic H2 and electrolytic O2 demand of different coal chemical products in 2023, 2030 and 2050. (b) Comparison of electrolytic H2 and O2 demand and supply in coal chemical industry in 2023, 2030 and 2050.
Within this constrained supply context, a second challenge is the choice of electricity source for electrolysis. In the near-to-medium term, reliance on the current grid for large-scale electrolysis (PG-P) introduces a “pollution leakage” effect. While reducing carbon emissions at the plant, this pathway may increase air pollutants such as SO2, NOx, and PM by shifting the emission burden to the coal-fired power sector. This finding underscores that deep grid decarbonization is a prerequisite for achieving truly synergistic reductions of both carbon and air pollutants through electrolytic hydrogen.
The decarbonization pathway must navigate a dual constraint: a physically limited supply of green H2 and the imperative to avoid exacerbating air pollution during the transition. These challenges directly inform the need for a strategic, phased implementation framework, as discussed in the following section.
4.3. Sensitivity and Robustness of Findings
Our conclusions regarding the strategic value and cost-effectiveness of renewable H2/O2 pathways depend on future technological and economic parameters. To assess the robustness of these findings, we examine the impact mechanisms of key uncertain variables.
The core economic advantage of the WE/SE pathways is structural, arising from the avoidance of the carbon and pollution costs inherent in conventional coal-based production. Consequently, fluctuations in renewable electricity prices and electrolyzer capital costs directly affect absolute abatement costs. However, they are unlikely to reverse the fundamental cost-effectiveness ranking of the pathways, provided that these incremental costs do not exceed the environmental costs of the displaced systems. Similarly, improvements in electrolyzer efficiency would further strengthen this conclusion by reducing operational costs. Conversely, accelerated grid decarbonization would narrow the economic gap between the WE/SE and grid-powered (PG) pathways, affirming the synergy between power sector greening and industrial decarbonization.
Furthermore, the impact of hydrogen leakage on the life-cycle carbon balance is negligible compared with the substantial emissions avoided by replacing coal-based processes, and thus does not undermine the comparative assessment.
The Tornado diagram (Figure 4d) shows that the renewable electricity tariff has the largest impact on the unit abatement cost (±16.8%), followed by electrolyzer cost (±10.2%), while other parameters have negligible effects. Thus, while specific results are sensitive to input parameters, the central finding remains robust.
Beyond these cost-related parameters, additional assumptions may affect quantitative projections. Production forecasts and commissioning schedules influence absolute emission levels. The sensitivity analysis on utilization rate (±10%) in Table S15 further captures the influence of capacity-related uncertainty on our main results. Our conservative capacity scenario (20% delay of planned projects) suggests that baseline emissions in 2050 would be approximately 18–22% lower than in the maximum-capacity case, with correspondingly smaller absolute reductions. Nevertheless, the relative ranking of WE/SE pathways remains unchanged as it is driven by structural cost differences. Grid emission factors affect grid-powered scenarios but have limited influence on WE/SE pathways, which rely on near-zero-carbon electricity. Pollutant removal efficiencies are based on national averages; while plant-level values may vary, the comparative results are robust because they focus on displacement of coal-based inputs rather than absolute removal rates. The green H2 supply constraint is the most consequential uncertainty for near-term reductions; our theoretical vs. constrained distinction (Section 3.2) explicitly addresses this, and constrained estimates should be interpreted as scenario-based projections rather than precise forecasts.
4.4. Towards a Synergistic Transition: Integrated Water–Energy–Carbon Strategies
The intermittent nature of renewable energy and the high costs of retrofitting coal chemical plants pose significant operational challenges [15,40,41,42,43]. A coordinated near-to- medium-term strategy is needed, combining WE/SE-P with PG-P to address green H2 shortages and ensure stability, while prioritizing new projects in renewable-rich regions to advance a renewable-driven decarbonization pathway.
Consequently, a pragmatic transition strategy must be spatially and temporally differentiated. In the near-to-medium term, electrolysis deployment should be prioritized in regions with abundant renewable resources (e.g., parts of Inner Mongolia, Xinjiang, Ningxia) to directly follow the WE/SE-P pathway, thereby maximizing immediate synergistic benefits. In provinces where the grid remains coal-intensive, large-scale rollout of grid-powered electrolysis (PG-P) should be deliberately paced to avoid exacerbating air pollution, focusing instead on pilot projects and grid decarbonization. This staged approach aligns the growth of the hydrogen economy with the greening trajectory of the power sector. By 2050, as the national grid becomes cleaner, the strategic role of PG-P can expand to provide system flexibility and supplement supply, evolving into a complementary component of a fully renewable PtX system.
Existing research highlights severe water stress in China’s major coal-producing regions, where water availability often constrains industrial expansion [44,45,46,47,48].
According to existing studies, producing 1 kg of H2 via water electrolysis requires 10–15 kg of water [36,49]. Our rough calculations indicate that meeting the 2050 demand for green H2 in Inner Mongolia’s coal chemical industry (Figure S5) would require approximately 230 million cubic meters of high-purity water annually. We estimate that this is equivalent to 83.51% of the region’s current total water resource allocation in this region, underscoring the need for integrated water resource management. Addressing this constraint requires prioritizing non-conventional water sources (e.g., treated industrial wastewater) and adopting water-efficient electrolyzer technologies with higher recirculation rates.
Therefore, the transition from “coal to X” to “power to X” must be viewed as a challenge embedded in the water–energy–carbon nexus. Our proposed strategy of prioritizing development in renewable-energy-rich regions must be integrated with sub-provincial planning that carefully considers local water availability. Future policies should incentivize water-efficient PtX projects that are integrated with industrial symbiosis networks, utilize non-freshwater resources and adopt the most water-efficient electrolysis technologies. This approach will enhance both the environmental sustainability and social acceptability of a green H2 economy in China’s coal-centric regions.
4.5. Policy Implications
Wind and solar pathways are the most cost-effective, but large-scale deployment is constrained by the green H2 supply gap and the risk of near-term “pollution leakage.” A multi-pronged policy framework is essential: (i) accelerate renewable power capacity and grid flexibility; (ii) prioritize integrated PtX projects in renewable-rich regions (Inner Mongolia, Ningxia, Xinjiang) while aligning electrolysis deployment with grid decarbonization elsewhere; and (iii) direct R&D towards lowering electrolyzer costs and advancing water-efficient technologies. The ultimate goal is a systemic shift—initially toward green H2-integrated coal-to-X, and eventually toward fully renewable PtX. This hybrid approach is a pragmatic near-to-medium-term strategy that builds infrastructure for a future transition. Future research should also investigate whether green H2-integrated gasification alters the composition and toxicity of process effluents—a gap not addressed by conventional mass-balance inventories. Combining experimental screening with process modeling will help ensure that decarbonization does not create new environmental liabilities.
5. Conclusions
This study quantifies the potential and benefits of using renewable electrolytic H2 and O2 to substitute conventional coal-based inputs in China’s coal chemical industry. Results show that the ERS mode achieves substantially greater synergistic carbon and pollution reduction than the SRS mode. By 2030, while WE/SE-P scenarios offer the best unconstrained technical potential (~75% carbon and 13% pollution reduction, 3 Gt CO2eq and 18 Mt pollutants per trillion CNY), green H2 supply constraints limit achievable reductions to approximately 12% (carbon) and 1% (pollutants). By 2050, WE/SE-P still provide substantial unconstrained benefits (27 Gt CO2eq and 240 Mt pollutants per trillion CNY), while PG-P scenarios, particularly HG-2, can effectively supplement supply, enabling realistic reductions of ~42% (carbon) and 11% (pollutants). We conclude that accelerating green H2 supply, reducing electrolysis costs, increasing renewable electricity share, and deploying external H2 supplementation are cost-effective strategies for synergistic carbon and pollutant reduction. Future policy and R&D should promote the integration of green H2 into coal chemical processes and, in the longer term, advance foundational technologies (e.g., DAC-based carbon supply, low-cost renewable electrolysis) required for a fully renewable PtX system.
Supplementary Materials
The following supporting information can be downloaded at: https://www.mdpi.com/article/10.3390/su18136866/s1, Figure S1: Distribution of carbon and pollutant emissions from the coal chemical industry in 2030 and 2050 in the baseline scenario. (a), carbon emissions in 2030 (Mt); (b), Pollutant emissions in 2030 (104t); (c), carbon emissions in 2050 (Mt); (d), Pollutant emissions in 2050 (104t).; Figure S2: Carbon and pollutant emissions under alternative scenarios of SRS mode.; Figure S3: Synergistic carbon abatement potential for different abatement scenarios. (a), carbon reduction potential in 2030; (b), carbon reduction potential in 2050.; Figure S4: Cost distribution of green electricity green hydrogen and green oxygen to help reduce carbon and pollution in coal chemical industry. (a), cost distribution of carbon and pollution reduction for scenarios MG-1, HG-1, WE-1, and SE-1 in 2030; (b), cost distribution of carbon and pollution reduction for scenarios MG-1, HG-1, WE-1, and SE-1 in 2050; (c), cost distribution of carbon and pollution reduction for scenarios MG-2, HG-2, WE-2, and SE-2 in 2030; and (d), cost distribution of carbon and pollution reduction for scenarios MG-2, HG-2, WE-2, and SE-2 in 2050; (e), provincial total abatement costs; (f), MACs under WE-2/SE-2 in 2030 and 2050.; Figure S5: Provincial coal chemical industry electrolysis H2/O2 demand. (a), all electrolytic H2/O2 in 2023; (b), electrolytic H2/O2 in 2030; (c), electrolytic H2/O2 in 2050; (d), electrolytic H2/O2 + air separation O2 in 2023; (e), electrolytic H2/O2 + air separation O2 in 2030; (f), electrolytic H2/O2 + air separation O2 in 2050.; Figure S6: Distribution of coal chemical product capacity and installed green power in each province. Among them, the figures (a–c) represent the distribution of coal chemical product capacity and green power installation in 2023, 2030 and 2050, respectively. The figures (d–f) show the distribution of coal chemical products (excluding coke) product capacity and green power installation in 2023, 2030 and 2050, respectively.; Table S1: System boundaries and key modeling assumptions.; Table S2 Modern coal chemical projects in China 2023; Table S3 Traditional coal chemical production in 2023 (Mt); Table S4 Forecast of conventional coal chemical capacity in 2030 and 2050 (Mt) [5,21,22,23]; Table S5 Forecast of capacity and production of the modern coal chemical industry in 2030 and 2050 [50]; Table S6 Demand for coal, electricity and heat in the production of various coal chemical products [51,52,53,54,55,56,57,58,59,60,61,62]; Table S7 GHG emission factors for different production processes [29,53,63,64,65,66]; Table S8 Grid electricity mixes for 2020, 2030 and 2050 [29]; Table S9 Pollutant emission factors in the chemical production process of various coal chemical products; Table S10 Pollutant emission factors from upstream coal mining and processing processes; Table S11 Pollutant emission factors in the power and heat production process; Table S12 Demands for H2 and O2 in coal chemical industry [12]; Table S13 Cost parameters of different hydrogen production methods (CNY/kg H2) [30,32,67,68,69,70,71,72,73]; Table S14 Provincial hydrogen production costs in 2022 and cost projections for 2030 and 2050 (CNY/kg H2) [38]; Table S15 Sensitivity of key outcome metrics to variations in critical parameters; Table S16 LCIA characterization results for key impact categories under alternative scenarios (2030); Table S17 LCIA characterization results for key impact categories under alternative scenarios (2050); Table S18 Regionalized marginal abatement costs (MAC) for CO2 reduction under WE-2 and SE-2 scenarios in major coal-chemical provinces (CNY/t CO2eq); Table S19 Industrial electricity tariffs and projections for Chinese provinces (CNY/kWh) [21]; Table S20 Key parameters used in Equations (1)–(9): definitions, units, and data sources [12,19,20,25].
Author Contributions
Y.S.: Conceptualization, methodology, investigation, formal analysis, writing—original draft, writing—review and editing. Y.Z.: Conceptualization, investigation, writing—review and editing. Y.L.: Conceptualization, investigation, writing—review and editing. Q.Q.: Methodology, writing—review and editing, supervision, data curation. L.B.: Methodology, writing—review and editing, supervision, data curation. All authors have read and agreed to the published version of the manuscript.
Funding
This research was supported by the projects Research on Coal Chemical Industry Park Pollution Reduction and Carbon Reduction Synergistic Optimisation Strategies Based on Artificial Intelligence (2024YSKY-21), Assessment and Empirical Research on the Synergistic Capacity of Resource Dependent Industries for Pollution Reduction and Carbon Reduction in the Yellow River Basin (2022-YRUC-01-0404), and Technological System and Strategies of Synergistic Governance for Pollution Reduction and Carbon Reduction in the Yellow River Basin (2022-YRUC-01-0602-05).
Institutional Review Board Statement
Not applicable.
Informed Consent Statement
Not applicable.
Data Availability Statement
The original contributions presented in this study are included in the article/Supplementary Material. Further inquiries can be directed to the corresponding authors.
Acknowledgments
Thanks for all funding support provided for this research.
Conflicts of Interest
The authors declare no competing financial interests.
References
- Chen, Q.; Lv, M.; Gu, Y.; Yang, X.; Tang, Z.; Sun, Y.; Jiang, M. Hybrid energy system for a coal-based chemical industry. Joule 2018, 2, 607–620. [Google Scholar] [CrossRef] [Scilit]
- Tu, K.J. Prospects of the Chinese Coal Chemical Industry in an Increasingly Carbon-Constrained World; OIES Paper: CE, No. 13; The Oxford Institute for Energy Studies: Oxford, UK, 2024. [Google Scholar]
- Wang, B.; He, L.; Yuan, X.; Sun, Z.; Liu, P. Carbon emissions of coal supply chain: An innovative perspective from physical to economic. J. Clean. Prod. 2021, 295, 126377. [Google Scholar] [CrossRef] [Scilit]
- Xie, K.; Li, W.; Zhao, W. Coal chemical industry and its sustainable development in China. Energy 2010, 35, 4349–4355. [Google Scholar] [CrossRef] [Scilit]
- Jin, L.; Hao, C.; Wu, L.; Xu, X.; Liu, W.; Chen, X.; Yan, G.; Zhang, Z.; Zhang, H. Pathway of carbon emissions peak of China′s coal chemical industry. Res. Environ. Sci. 2022, 35, 368–376. [Google Scholar] [CrossRef]
- Shi, J.; Huang, W.; Han, H.; Xu, C. Pollution control of wastewater from the coal chemical industry in China: Environmental management policy and technical standards. Renew. Sustain. Energy Rev. 2021, 143, 110883. [Google Scholar] [CrossRef] [Scilit]
- Wen, Z.; Meng, F.; Di, J.; Tan, Q. Technological approaches and policy analysis of integrated water pollution prevention and control for the coal-to-methanol industry based on Best Available Technology. J. Clean. Prod. 2016, 113, 231–240. [Google Scholar] [CrossRef] [Scilit]
- Vrontisi, Z.; Luderer, G.; Saveyn, B.; Keramidas, K.; Lara, A.R.; Baumstark, L.; Bertram, C.; de Boer, H.S.; Drouet, L.; Fragkiadakis, K.; et al. Enhancing global climate policy ambition towards a 1.5 °C stabilization: A short-term multi-model assessment. Environ. Res. Lett. 2018, 13, 044039. [Google Scholar] [CrossRef] [Scilit]
- Wang, D.; Wu, B.; Meng, W.; Zhou, H.; Liao, Z.; Hong, X. Analysis of electrification reconfiguration for the coal to ethylene glycol process integrated with renewable energy. Int. J. Hydrogen Energy 2024, 67, 361–372. [Google Scholar] [CrossRef] [Scilit]
- Wang, R.; Cai, W.; Cui, R.Y.; Huang, L.; Ma, W.; Qi, B.; Zhang, J.; Bian, J.; Li, H.; Zhang, S.; et al. Reducing transition costs towards carbon neutrality of China’s coal power plants. Nat. Commun. 2025, 16, 241. [Google Scholar] [CrossRef] [Scilit] [PubMed]
- Yang, Q.; Chu, G.; Zhang, L.; Zhang, D.; Yu, J. Pathways toward carbon-neutral coal to ethylene glycol processes by integrating with different renewable energy-based hydrogen production technologies. Energy Convers. Manag. 2022, 258, 115529. [Google Scholar] [CrossRef] [Scilit]
- Guo, Y.; Peng, L.; Tian, J.; Mauzerall, D.L. Deploying green hydrogen to decarbonize China’s coal chemical sector. Nat. Commun. 2023, 14, 8104. [Google Scholar] [CrossRef] [Scilit] [PubMed]
- Lin, H.; Wu, Q.; Chen, X.; Yang, X.; Guo, X.; Lv, J.; Lu, T.; Song, S.; McElroy, M. Economic and technological feasibility of using power-to-hydrogen technology under higher wind penetration in China. Renew. Energy 2021, 173, 569–580. [Google Scholar] [CrossRef] [Scilit]
- Shi, Z.; Shi, X.; Cai, D.; Feng, K.; Lou, Q. Construction scheme for the system coupling coal chemical industry with green electricity and green hydrogen. South. Energy Constr. 2023, 10, 143–149. [Google Scholar] [CrossRef]
- Yang, W.; Han, Y.; Yuan, H.; Yan, Y.; Li, X. Economic Evaluation and Future Feasibility Analysis of the Coal Chemical Industry Coupled with Green Hydrogen Technology; China Economic Publishing House: Beijing, China, 2024; pp. 307–332. [Google Scholar]
- Zhen, G.; Yan, K. Research on the progress of coal chemical industry and green hydrogen coupling. Shanxi Chem. Ind. 2024, 10, 288–290. [Google Scholar] [CrossRef]
- Jiang, W.; Gao, W.; Gao, X.; Ma, M.; Zhou, M.; Du, K.; Ma, X. Spatio-temporal heterogeneity of air pollution and its key influencing factors in the Yellow River Economic Belt of China from 2014 to 2019. J. Environ. Manag. 2021, 296, 113172. [Google Scholar] [CrossRef] [Scilit] [PubMed]
- Zhang, H.; Wang, Y.; Hao, C.; Lu, Y.; Jin, L.; Lian, C.; Jiang, H.; Wu, L.; Cao, D. Coal-carbon-pollutant coordinated control of coal chemical industry under carbon peak and carbon neutrality constraints. Environ. Res. 2023, 44, 1120–1127. [Google Scholar] [CrossRef] [Scilit] [PubMed]
- Tao, J.; Lin, Y.; Wang, B.; Cong, N.; Xie, Y.; Zhu, J. Spatiotemporal characteristics of eco-environmental vulnerability in the Yellow River Basin, China. Chin. J. Ecol. 2024, 44, 3054–3063. [Google Scholar] [CrossRef]
- Odenweller, A.; Ueckerdt, F. The green hydrogen ambition and implementation gap. Nat. Energy 2025, 10, 110–123. [Google Scholar] [CrossRef] [Scilit]
- Kaveh, D.; Ingeborg, H.F.; Thomas, H.; Anne, L.K.; Erica, M.; Henna, N.; Mats, R.; Eduard, R.; Sujeetha, S.; Adrien, Z.; et al. Outlook for China’s Energy Transition 2024—Forecast for 2050; DNV: Singapore, 2024. [Google Scholar]
- Zhang, Z.; Du, X. Economic research of carbon reduction in hydrogen metallurgy under the goal of carbon neutralization. Price Theory Pract. 2021, 5, 65–68. [Google Scholar] [CrossRef]
- SixSigma Research. 2024 Research and Outlook of China’s Green Methanol Industry; SixSigma Research: Singapore, 2024; Available online: https://mp.weixin.qq.com/s?__biz=MzU1ODY1MDkwNA==&mid=2247519966&idx=8&sn=0ef7b6376f06c6f01caebdcbf9cb987a&chksm=fc218da9cb5604bfd33495f2d56fe1021715b44cb61bc8c78f6ed0aeb0e3d0def6fcb898375c&scene=27 (accessed on 17 June 2025).
- IPCC. Climate Change 2023: Metrics to Evaluate Emissions; IPCC: Geneva, Switzerland, 2023. [Google Scholar]
- The people’s Republic of China. Environmental Protection Tax Law of the People’s Republic of China (Revised in 2018); State Taxation Administration of The People’s Republic of China: Beijing, China, 2018.
- Cai, B.; Zhao, L.; Zhang, Z.; Lu, X.; Jia, M.; Zhang, L.; Liu, M.; Lei, Y.; Jiang, L.; Gao, Y.; et al. China Regional Power Grids Carbon Dioxide Emission Factors. 2023. Available online: https://zhuanlan.zhihu.com/p/676422054 (accessed on 20 June 2024).
- Global Energy Internet Development Cooperation Organization. Research on China’s 2030 Energy and Electricity Development Plan and Prospects for 2060; Global Energy Internet Development Cooperation Organization: Beijing, China, 2021. [Google Scholar]
- Xia, P.; Yuan, B.; Lu, G.; Wang, Y.; Zhang, Y.; Zhang, L.; Shu, Y. Carbon peak and carbon neutrality path for China’s power industry. Chin. J. Eng. Sci. 2021, 23, 1–14. [Google Scholar] [CrossRef] [Scilit]
- Zhang, N.; Xing, L.; Lu, G. Outlook and challenges for the development of medium—And long term energy and power transformation in China. Manag. Chin. Power Enterp. 2018, 13, 58–63. [Google Scholar]
- Chai, S.; Zhang, G.; Li, G.; Zhang, Y. Industrial hydrogen production technology and development status in China: A review. Clean Technol. Environ. Policy 2021, 23, 1931–1946. [Google Scholar] [CrossRef] [Scilit]
- Sun, X.; Liu, C.; Xia, N.; Zhao, L. Research on typical design of wind-solar coupled hydrogen production system. South. Energy Constr. 2023, 10, 112–119. [Google Scholar] [CrossRef]
- Zhang, Y.; Zhang, N.; Hongcai, D.; Siyu, Z.; Xiaoyu, W.; Meimei, X. Model construction and pathways of low-carbon transition of China’s power system. Electr. Power 2021, 54, 1–11. [Google Scholar] [CrossRef]
- Sun, Y.Y.; Zhang, Y.; Li, Y.C.; Qiao, Q.; Bai, L. Carbon and pollution mitigation pathways for coal chemical industry in the Yellow River Basin. Res. Environ. Sci. 2025, 38, 2569–2579. [Google Scholar] [CrossRef]
- National Bureau of Statistics. China Statistical Yearbook; National Bureau of Statistics: Beijing, China, 2024. Available online: https://www.stats.gov.cn/sj/ (accessed on 17 June 2025).
- Amikam, G.; Fridman-Bishop, N.; Gendel, Y. Biochar-assisted iron-mediated water electrolysis process for hydrogen production. ACS Omega 2020, 5, 31908–31917. [Google Scholar] [CrossRef] [Scilit] [PubMed]
- Terlouw, T.; Bauer, C.; McKenna, R.; Mazzotti, M. Large-scale hydrogen production via water electrolysis: A techno-economic and environmental assessment. Energy Environ. Sci. 2022, 15, 3583–3602. [Google Scholar] [CrossRef] [Scilit]
- Zhao, H.; Yuan, Z. Progress and perspectives for solar-driven water electrolysis to produce green hydrogen. Adv. Energy Mater. 2023, 13, 2300254. [Google Scholar] [CrossRef] [Scilit]
- Shi, W.; Wu, F.; Zhang, K.; Zhao, X.; Zhang, R.; ZHang, Y. Potential for green hydrogen to replace gray hydrogen in various places while considering the difference of resource endowment. Mod. Chem. Ind. 2024, 44, 1–7. [Google Scholar] [CrossRef]
- RMI, China Hydrogen Alliance Research Institute. The Key to Opening a New Era of Green Hydrogen Energy: China’s 2030 “Renewable Hydrogen 100” Development Roadmap; RMI: Beijing, China; China Hydrogen Alliance Research Institute: Beijing, China, 2022. [Google Scholar]
- Boettcher, S.W. Introduction to green hydrogen. Chem. Rev. 2024, 124, 13095–13098. [Google Scholar] [CrossRef] [Scilit] [PubMed]
- Patonia, A. Green hydrogen and its unspoken challenges for energy justice. Appl. Energy 2025, 377, 124674. [Google Scholar] [CrossRef] [Scilit]
- Zhen, Z.; Li, B.; Ou, X.; Zhou, S. How hydrogen can decarbonize the chemical industry in China: A review based on the EIC–TER industrial assessment framework. Int. J. Hydrogen Energy 2024, 60, 1345–1358. [Google Scholar] [CrossRef] [Scilit]
- Liu, H.; Ma, J.; Chen, X.; Wang, Q.; Chuang, P. Opportunities and challenges for the intelligent transformation of the coal industry in the context of high-quality economic development. Coal Econ. Res. 2024, 44, 92–99. [Google Scholar] [CrossRef]
- Shi, X.; Liao, X.; Li, Y. Quantification of fresh water consumption and scarcity footprints of hydrogen from water electrolysis: A methodology framework. Renew. Energy 2020, 154, 786–796. [Google Scholar] [CrossRef] [Scilit]
- Cavaliere, P.D.; Perrone, A.; Silvello, A. Water Electrolysis for the Production of Hydrogen to Be Employed in the Ironmaking and Steelmaking Industry. Metals 2021, 11, 1816. [Google Scholar] [CrossRef] [Scilit]
- Xia, Y.; Shi, J.; Zhao, Z.; Liu, Z.; Liu, X.; Zhang, C. Mapping the coal-water nexus in the Yellow River Basin. J. Clean. Prod. 2023, 411, 137249. [Google Scholar] [CrossRef] [Scilit]
- Xu, Z.; Lian, J.; Zhang, J.; Bin, L. Investigating and optimizing the water footprint in a typical coal energy and chemical base of China. Sci. Total Environ. 2020, 727, 138781. [Google Scholar] [CrossRef] [Scilit] [PubMed]
- Zhao, J.; Zhou, L.; Zhou, W.; Ren, H.; Yu, Y.; Wang, F.; Ma, T. Techno-economic analysis and comparison of coal-based chemical technologies with consideration of water resources scarcity. Energy Strategy Rev. 2021, 38, 100754. [Google Scholar] [CrossRef] [Scilit]
- Shiva Kumar, S.; Himabindu, V. Hydrogen production by PEM water electrolysis—A review. Mater. Sci. Energy Technol. 2019, 2, 442–454. [Google Scholar] [CrossRef] [Scilit]
- Sun, L.; Liu, Z.; Wu, Q.; Teng, W. Technological analysis and environment management policy suggestion of modern coal chemical industry pollution management. Coal Qual. Technol. 2019, 34, 1–6+19. [Google Scholar]
- Zhang, Y.; Yuan, Z.; Margni, M.; Bulle, C.; Hua, H.; Jiang, S.; Liu, X. Intensive carbon dioxide emission of coal chemical industry in China. Appl. Energy 2019, 236, 540–550. [Google Scholar] [CrossRef] [Scilit]
- Liu, X.; Zhu, B.; Zhou, W.; Hu, S.; Chen, D.; Griffy-Brown, C. CO2 emissions in calcium carbide industry: An analysis of China’s mitigation potential. Int. J. Greenh. Gas. Control 2011, 5, 1240–1249. [Google Scholar] [CrossRef] [Scilit]
- WRI. Greenhouse Gas Protocol tool for Energy Consumption in China V2.1. 2013. Available online: http://www.ghgprotocol.org/calculation-tools (accessed on 17 May 2024).
- Ministry of Ecology and Environment of China. Guidelines for Greenhouse Gas Emission Accounting and Reporting of Power Companies. 2021. Available online: https://www.mee.gov.cn/xxgk2018/xxgk/xxgk06/202112/W020211202787053248513.pdf (accessed on 17 June 2025).
- National Development and Reform Commission of China. Guidelines for Greenhouse Gas Emission Accounting and Reporting of Chemical Companies. 2013. Available online: http://www.gov.cn/gzdt/att/att/site1/20131104/001e3741a2cc13e13f1c04.pdf (accessed on 17 June 2025).
- National Energy Administration of China. Plans for China’s Coal Deep Processing S48 Industry Demonstration. 2017. Available online: http://zfxxgk.nea.gov.cn/auto83/201703/W020170303357509200744.pdf (accessed on 17 June 2025).
- Cinda Securities. Financial Analysis Report of a Coal Chemical Company in China. 2020. Available online: https://pdf.dfcfw.com/pdf/H3_AP202011181430589743_1.pdf?1605720153000.pdf (accessed on 17 June 2025).
- PingAn Securities. Financial Analyses of Coal Chemical Industry in China. 2022. Available online: https://www.hstong.com/news/detail/22030213222622497 (accessed on 17 June 2025).
- ZhongTai Securities. Analysis Report of Coal-to-Coke Industry in China. 2020. Available online: https://baijiahao.baidu.com/s?id=1727979407627337163&wfr=spider&for=pc (accessed on 17 June 2025).
- Shanghai Brilliance Credit Rating; Investors Service. Impacts of Electricity Price Adjustment on the PVC Industry. 2015. Available online: http://www.shxsj.com/uploadfile/kanwu/1231-6.pdf (accessed on 17 June 2025).
- LeadLeo. Status Analysis of China’s Ammonia Industry in 2019. 2019. Available online: http://pdf.dfcfw.com/pdf/H3_AP202008191399559082_1.pdf (accessed on 17 June 2025).
- Sealand Securities. Financial Analyses of a Coal Chemical Company in China. 2026. Available online: https://finance.sina.com.cn/roll/2026-03-31/doc-inhswxzu1973270.shtml (accessed on 17 June 2026).
- IKE Environmental Technology. Chinese Life Cycle Database V0.8. 2014. Available online: https://ghgprotocol.org/Third-Party-Databases/CLCD?page=4 (accessed on 17 June 2025).
- Zhu, X.; Wang, S.; Wang, L. Life cycle analysis of greenhouse gas emissions of China’s power generation on spatial and temporal scale. Energy Sci. Eng. 2022, 10, 1083–1095. [Google Scholar] [CrossRef] [Scilit]
- Xu, K.; Chang, J.; Zhou, W.; Li, S.; Shi, Z.; Zhu, H.; Chen, Y.; Guo, K. A comprehensive estimate of life cycle greenhouse gas emissions from onshore wind energy in China. J. Clean. Prod. 2022, 338, 130683. [Google Scholar] [CrossRef] [Scilit]
- Ministry of Ecology and Environment National Bureau of Statistics. Announcement on the Release of 2022 Electricity Carbon Dioxide Emission Factors. 2023. Available online: https://www.mee.gov.cn/xxgk2018/xxgk/xxgk01/202412/t20241226_1099413.html (accessed on 17 June 2025).
- Wang, H.X.; Xu, W.Y.; Zhang, Z.X. Development status and suggestions of green hydrogen energy produced by water electrolysis from renewable energy. Chem. Ind. Eng. Prog. 2022, 41, 118–131. [Google Scholar] [CrossRef]
- Sun, X.; Cheng, X.; Wang, S.; Wang, J.; Zhao, Y.; Zhang, B. Dynamic cost analysis of hydrogen production from wind power and photovoltaic power. Clean. Coal Technol. 2023, 29, 1–10. [Google Scholar] [CrossRef]
- Jiang, S. Cost prediction: Green hydrogen vs grey /blue hydrogen. Green Pet. Petrochem. 2022, 7, 6–11. [Google Scholar] [CrossRef]
- Teng, X.; Zhang, G.; Hu, C.; Zhu, C.; Dan, Y.; Di, L.; Sha, L. Analysis on hydrogen energy economy and low cost of hydrogen source in typical cities of China. Chem. Ind. Eng. Prog. 2022, 41, 6295–6301. [Google Scholar] [CrossRef]
- Liu, W.; Wang, Y.M.; Xiong, Y.L. Key technology of water electrolysis and levelized cost of hydrogen analysis under carbon neutral vision. Trans. China Electrotech. Soc. 2022, 37, 2888–2896. [Google Scholar] [CrossRef]
- Xu, J.; Ding, X.; Gong, Y.; He, G.; Hu, T. Economic analysis of hydrogen production plant with water electrolysis. Energy Storage Sci. Technol. 2022, 11, 2374–2385. [Google Scholar] [CrossRef]
- Wang, Y.Z.; Ou, X.M.; Zhou, S. Future cost trend of hydrogen production in China based on learning curve. Clim. Change Res. 2022, 18, 283–293. [Google Scholar]

Disclaimer/Publisher’s Note: The statements, opinions and data contained in all publications are solely those of the individual author(s) and contributor(s) and not of MDPI and/or the editor(s). MDPI and/or the editor(s) disclaim responsibility for any injury to people or property resulting from any ideas, methods, instructions or products referred to in the content. |
© 2026 by the authors. Licensee MDPI, Basel, Switzerland. This article is an open access article distributed under the terms and conditions of the Creative Commons Attribution (CC BY) license.