Article

Green Product Design Methodology with TRIZ Evolutionary Trends

1
Department of Industrial and Systems Engineering, Chung Yuan Christian University, Taoyuan City 32023, Taiwan
2
Department of Agroindustrial Technology, Faculty of Agricultural Technology, Brawijaya University, Malang 64145, Indonesia
*
Authors to whom correspondence should be addressed.
Sustainability 2026, 18(13), 6865; https://doi.org/10.3390/su18136865
Submission received: 8 May 2026 / Revised: 21 June 2026 / Accepted: 2 July 2026 / Published: 6 July 2026
(This article belongs to the Section Sustainable Products and Services)

Abstract

With the increasing importance of green design in the business landscape, designers are compelled to shift towards eco-design practices. However, existing methodologies face challenges related to resource requirements, abstract concepts, and industry specificity. To address these challenges and stimulate innovation, this study proposes a green design methodology that integrates TRIZ concepts and is anchored in TRIZ evolutionary trends. The methodology includes function and attribute analysis, the introduction of green features, the identification of TRIZ trends through a two-stage process, and the use of a developed system to improve calculation efficiency. Detailed design solutions are generated by combining green features, TRIZ trends, and inventive principles. A case study validates the methodology, showcasing its value in promoting sustainable development. By leveraging the evolutionary potential of products and incorporating TRIZ, the methodology offers a promising approach to address sustainability challenges and drive innovation. This research serves as a starting point for a practical and efficient design methodology that utilizes TRIZ concepts and a computer-aided application tool. Future steps involve stress-testing the methodology and exploring its application in different domains.

1. Introduction

Green design has become a critical focus for designers as it is rapidly becoming a top requirement for products. As a result of legal regulations, industry standards, and increasing customer awareness of environmental issues, designers are compelled to shift their daily design activities towards eco-design or green design [1]. Companies are also shifting their corporate environmental strategies from cleaner processes to the holistic nature of green products [2]. In addition, being a pioneer in green product innovation offers an enormous edge, as every product is bound to have an environmental burden throughout its entire life cycle. Furthermore, the utilization of eco-innovation tools in the early stages of product development has been shown to significantly contribute to knowledge creation, aiding in the selection of the best ideas and reducing uncertainties related to environmental and market opportunities. This can further promote green knowledge and improve an organization’s eco-innovation performance. As green design is becoming a necessity in the current business landscape, there are no downsides to incorporating it into a company’s values.
Before diving into further discourse, defining the concept of “green design” is crucial. The term “green” has gained popularity, and it is imperative to establish a clear definition of what constitutes green design. This ensures that all efforts are directed towards the same objective and facilitates effective communication within the field. Sdrolia & Zarotiadis [2] dedicated their efforts to this exact matter. They have synthesized 51 articles to analyze and propose a clear definition of the word, which says that “Green is a product (tangible or intangible) that minimizes its environmental impact (direct and indirect) during its whole life cycle, subject to the present technological and scientific status”. This definition will be used in the subsequent discussions.
Despite extensive research on green design methodologies, significant challenges remain that hinder their implementation in practical and industrial applications. Many existing methodologies require significant time, effort, and expertise, making them impractical for companies with limited resources. This already creates a gap, since the intent is to extend the reach of these studies for general use. Furthermore, some users find the concepts too abstract or difficult to use. In addition, certain methodologies are designed for specific industries and would require extensive customization to be useful in other contexts. These factors can act as major impediments to their adoption and widespread use [3,4]. The significance of green design methodology lies not only in addressing current challenges but also in leveraging concepts that can stimulate innovation, such as TRIZ. It is possible to modify classical TRIZ tools to make them more practical for users. One great example is the TRIZ evolutionary trends. Trends can be viewed as potential pathways for product development, outlining the possible states a product may evolve into [5,6].
With that, the aim of this research is to propose a methodology for green design anchored in the concept of TRIZ, particularly TRIZ trends. The researchers envision that the development of scientific knowledge, such as TRIZ, and the optimization of methodologies will play a crucial role in promoting sustainable development.
The following section discusses insights and concepts from the existing literature to explain the research rationale and shape its aim, followed by the proposed methodology in Section 3. The methodology includes a detailed step-by-step procedure and clear guidelines for its application. It will also introduce a system, implemented via a computer-aided tool, to help eliminate redundant or repetitive activities. A case study is presented in Section 4 to validate the researchers’ efforts, and the results will be discussed in the next section, followed by the conclusion.

2. Literature Review

2.1. Potential Challenges for Green Design

There has been a growing body of literature on green design methodologies. This is evident in multiple systematic reviews published to date [2,3,7,8,9,10]. The growing need for green design calls for broader implementation of proposed frameworks and procedures. As this is relevant to all, it is crucial to focus on the practical implications. In this regard, recent studies were evaluated to identify potential challenges that may arise when applying methodologies to facilitate eco-innovation.
The review identified four categories of potential challenges: resources, expertise, application, and complexity, as summarized in Table 1. Resources refer to the time, effort, information, or financial investment required for implementation, which can restrict application, especially to small-scale users. Expertise is the technical knowledge required for implementation, which can limit the number of users. Application refers to the potential limitations of methodologies crafted for specific niches, requiring extensive customization for broader use. Finally, complexity requires that researchers must ensure their proposals are clear and replicable. In the headers of Table 1, “R” refers to Resources, “E” to Expertise, “A” to Application, and “C” to Complexity.
Ahmad et al. [3] conducted a decade-long review of sustainable product design tools from 2007 to 2017. This supports the findings in Table 1, which conclude that, despite their abundance, challenges hinder their adoption in the industry. It suggests that proposed tools must be simple, user-friendly, and provide clear analysis results and guidelines, all while requiring fewer resources and less time. In addition, it was identified that publications often overlooked the social aspect of sustainability. Ferrer et al. [25] also noted a high level of abstraction in current eco-innovation methods. Schöggl et al. [4] agreed and highlighted common disadvantages: focusing on a single design aspect, requiring extensive quantitative data, or being inaccessible to designers. El Ouardi and Boungab [26] also argued eco-innovation still suffers from definitional fragmentation and operational ambiguity, which provide limited guidance for organizational action and practical implementation. Another review by Ghane et al. [27] focused on methodologies based on TRIZ evolutionary trends and recommended the use of computer-aided techniques to overcome limitations in accessing scientific data, patents, social media, disruptive technologies, and manufacturing.

2.2. Green Design Methodologies with TRIZ

The methodologies and principles for green design are endless. TRIZ is a widely used and convenient approach for eco-design. As a guiding approach, TRIZ, especially the contradiction matrix and inventive principles, is an efficient tool for increasing creative performance. It is a catalyst for creative stimuli and plays a significant role in eco-design development [28].
Understanding the product’s purpose is crucial, and TRIZ uses function and attribute analysis to do so. This analysis plays a vital role in various problem-solving methodologies employed in product design and development, including quality function deployment (QFD) and value engineering [29,30].
Another TRIZ principle is evolutionary trends. In terms of innovation, trends can be seen as suggested paths to follow, describing the states through which a product could evolve [31]. This knowledge base offers the possibility of going beyond one’s personal limitations in knowledge and expertise. It expands the scope of search solutions, leading to breakthrough solutions [32]. The benefits of TRIZ trends are numerous, and the concept is further strengthened as studies update it, such as that by Verhaegen et al. [5], who expanded the trends to enable more specific categorization. Trends also serve as an important innovation-supporting approach in competitive industries by facilitating the development of novel products and solutions [33]. It was considered more practical to predict future improvements in a technical system by assessing its evolutionary potential.
With that, this research will focus on addressing the challenges of existing green design methodology by performing the methodology through the following: (1) use of TRIZ as founding principles especially the evolutionary trends, (2) provision of clear guidelines and step-by-step procedures, (3) inclusion of relevant aspects and relatable information that are applicable to a broader community, and (4) adequate provision of computer-aided tools necessary to ensure that the process can be replicated.

2.3. TRIZ Evolutionary Trends

In this section, it is acknowledged that multiple studies aim to update the understanding of evolutionary trends. The significant ones are discussed below to determine which will be applied in the research. The trend of evolution was first proposed by Altshuller [34] in the law of technical system evolution, which is listed as follows: (1) increase idealization, (2) different subsystems have different levels of evolution, (3) transfer to a higher-level system, (4) increase flexibility, (5) reduce the number of energy conversions, and (6) transfer to a smaller level. Altshuller [35] also estimated the evolution trends of six engineering systems based on patents in the succeeding year, which are listed as follows: (1) from single to multiple, (2) from whole to segmentation, (3) from rigid to flexible, (4) from one-way to two-way, (5) from one-dimensional to multi-dimensional, and (6) from single-purpose to multi-purpose.
Rantanen & Domb [36] proposed the pattern of evolution, which means that there are rules for the evolution of systems, and their evolution falls into the following five modes: (1) unbalanced evolution of each component of the system, (2) transfer to a higher level or merge into a larger system, (3) transfer to a smaller level or split into smaller systems, (4) increase interaction between systems, and (5) system expansion and looping.
Mann [37] initially compiled 11 evolutionary trends: (1) the system tends to increase benefits, reduce costs, and reduce harm; (2) increase dynamics; (3) increase system segmentation; (4) increase spatial segmentation; (5) increase surface segmentation; (6) increase control; (7) reduce complexity; (8) use all available physical dimensions; (9) reduce the number of energy conversions; (10) increase rhythm coordination; and (11) increase action coordination. In addition, Mann [37] proposed 37 evolutionary trends, which are divided into three parts: time, space, and interface, as shown in Table 2.
Each of the evolutionary trends from Ikovenko [38] is interrelated, and there are roughly 11 evolutionary trends, which can be classified as follows: (1) S-curve evolution, (2) increasing value trend, (3) increasing integrity of system components, (4) increasing pruning level, (5) transition to a super-system, (6) increasing coordination, (7) increasing control, (8) increasing dynamics, (9) reducing human participation, (10) uneven development of system components, and (11) increasing flow trend. Lu [39] integrated the 51 trends proposed by Ikovenko [38] and Mann [37], which cover a broader range of product aspects and are therefore used in this study’s analysis.

3. Methodology

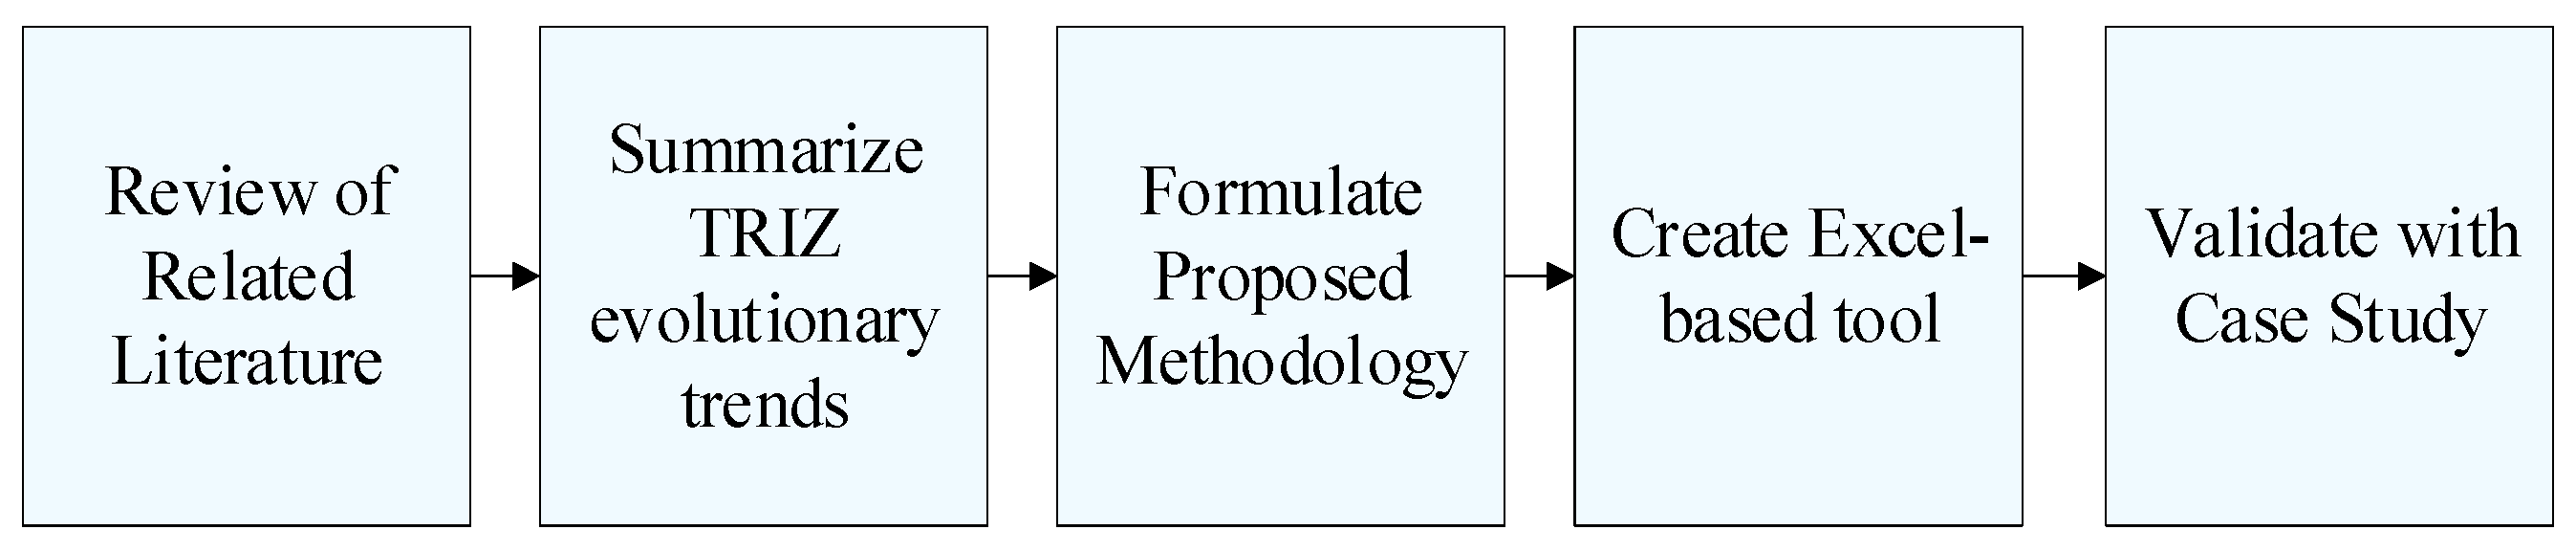
The research framework in this study is shown in Figure 1. It builds upon existing literature and identifies gaps that can be addressed. The focus is on developing effective, widely applicable, and user-friendly methodologies. TRIZ trends play a central role, and the literature review helps determine which specific evolutionary trends to use. The proposed methodology is based on classical TRIZ, with additional tools integrated to enhance efficiency. During the formulation of the methodology, it was identified that some parts may be difficult to follow. Thus, an Excel-based tool was also created to help users follow the iterative process discussed in the methodology. Finally, the researchers validated their efforts through case studies.

3.1. Proposed Methodology

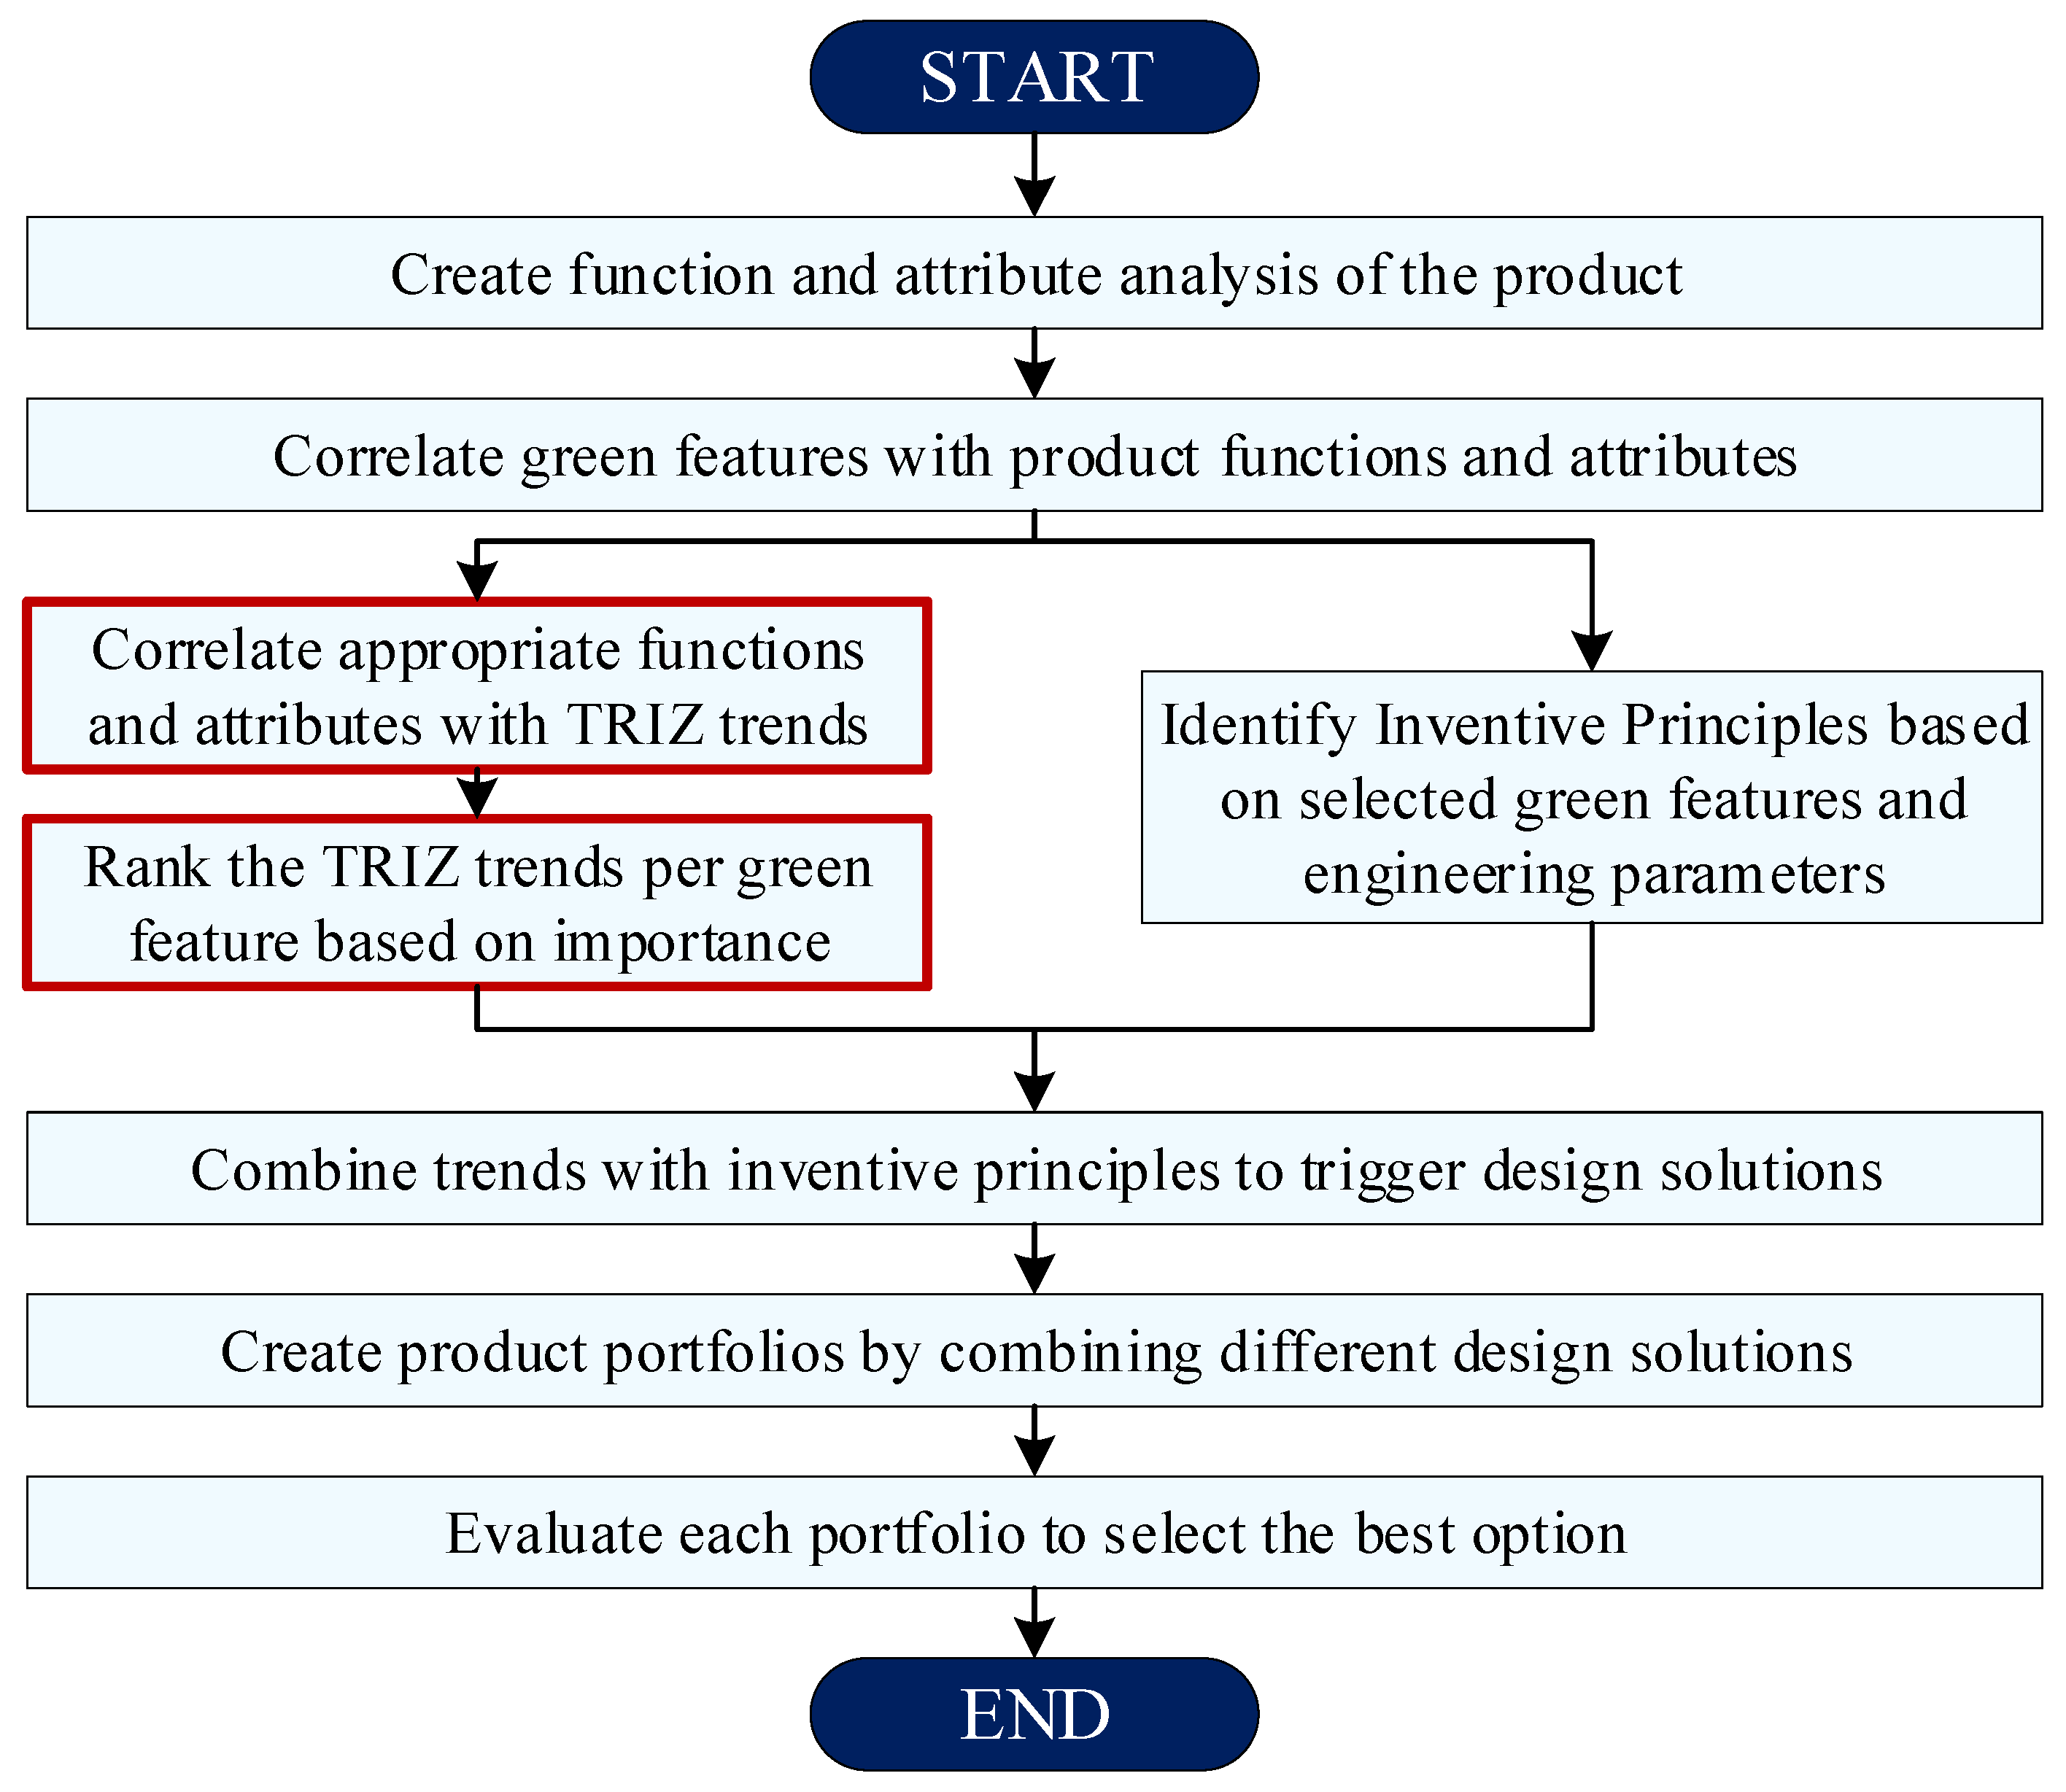
This section has two main focuses. First, it explains the rationale for the proposed methodology and its conceptualization. Second, it provides detailed guidelines and procedures for the proposal. Figure 2 presents the methodology. It begins with understanding product characteristics through function and attribute analysis, prioritizing aspects important to the user. Green features are then introduced to incorporate requirements for transforming the design into a green one. With the list of requirements on hand, the crucial step is identifying the TRIZ trends that will trigger design solutions. Correlation among green features, product function and attributes, and TRIZ trends are executed using a two-stage process (outlined in red in Figure 2). Given that the two-stage process is iterative and may be difficult to follow, an Excel-based template is used, as discussed in Section 3.2. In addition to TRIZ trends, inventive principles will also come into play to address contradictions arising from required improvements. The combination of TRIZ trends and inventive principles will finally determine the detailed design solutions. By combining these solutions, various product portfolios will be generated and assessed to determine the optimal design.

3.1.1. Create Product Function and Attribute Analysis

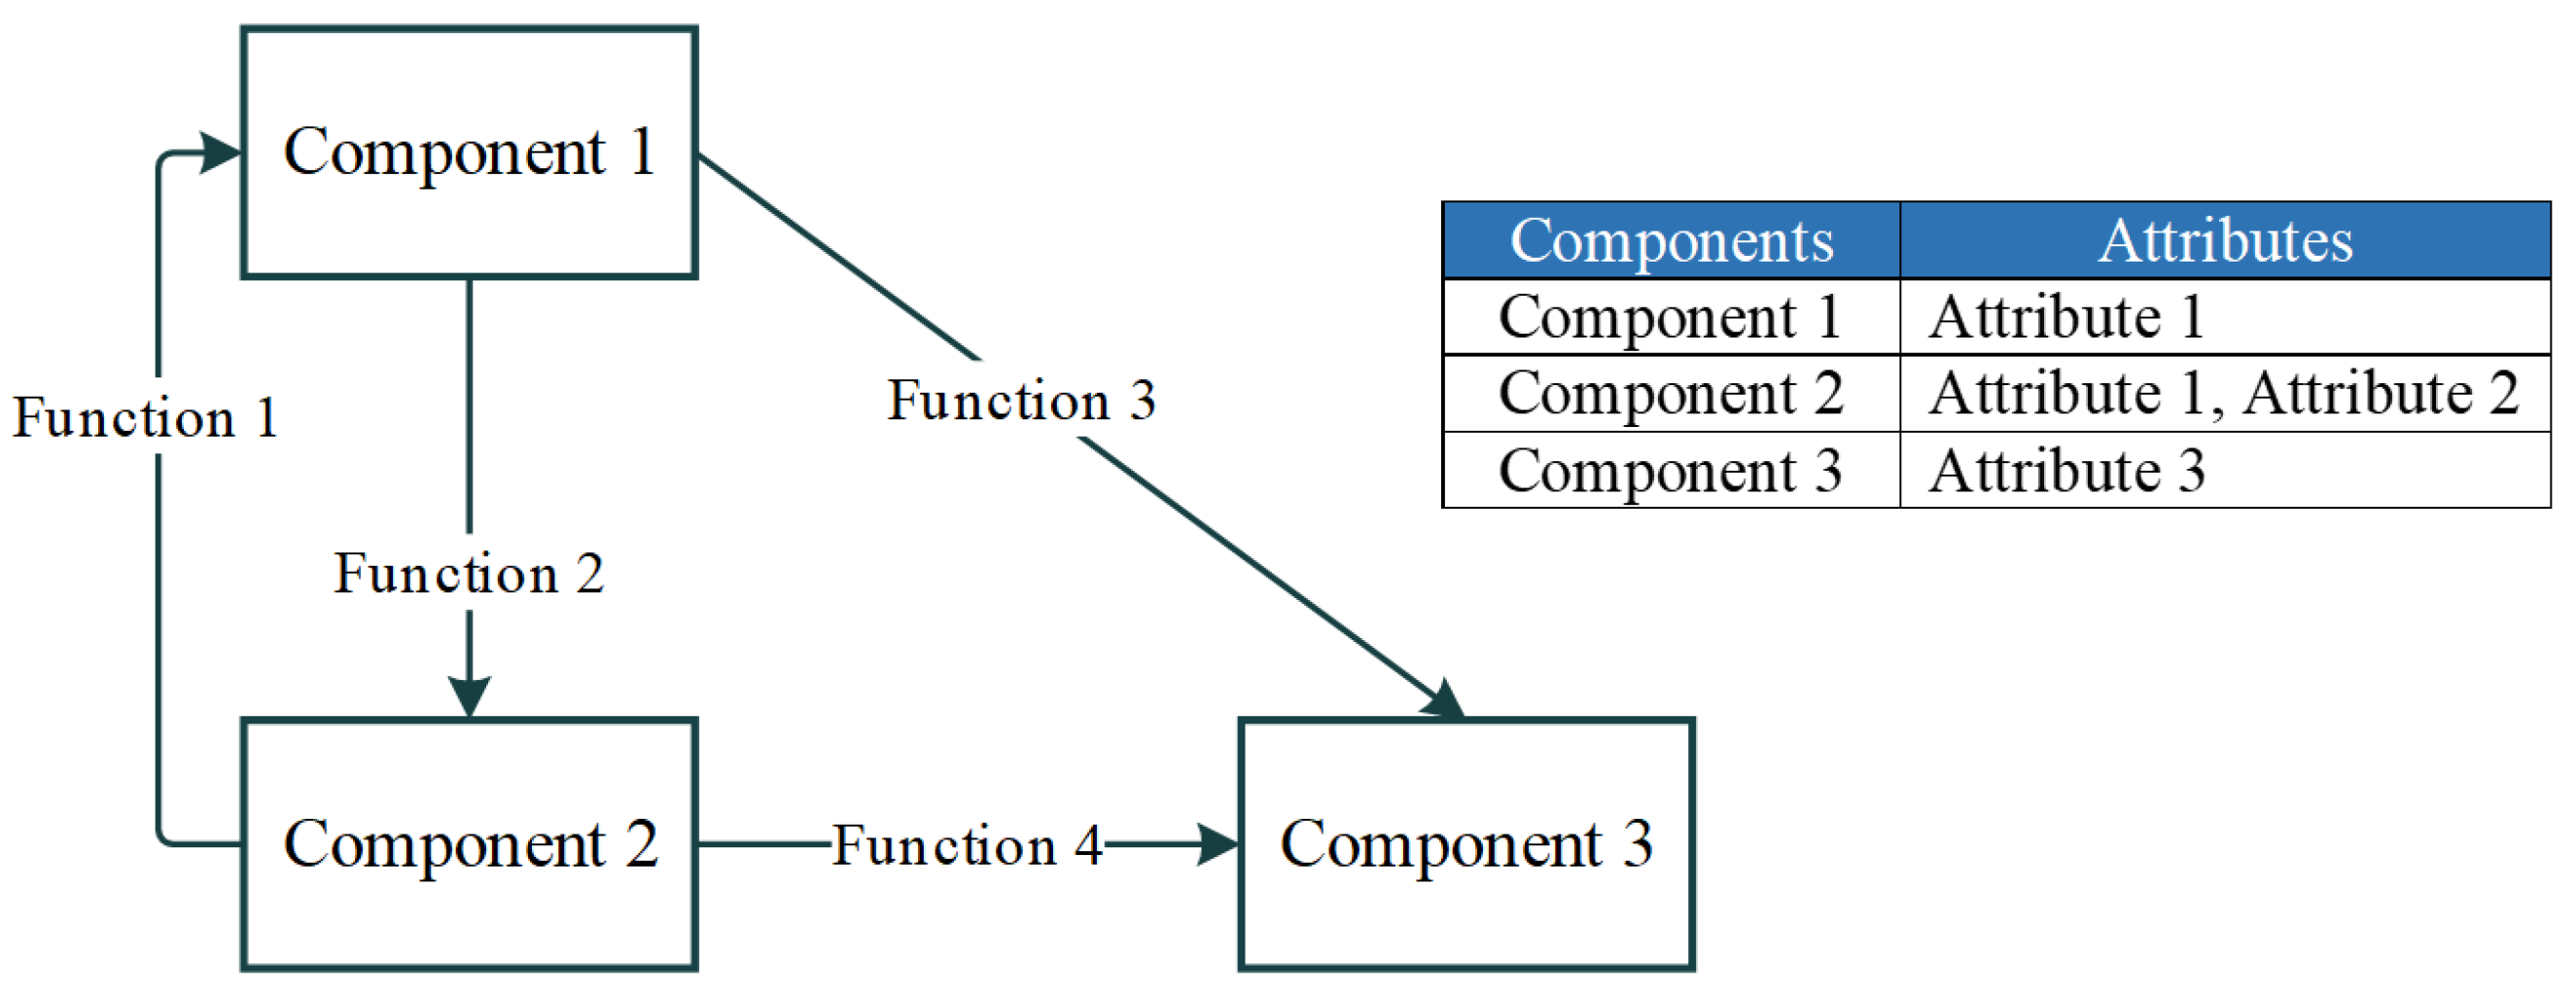
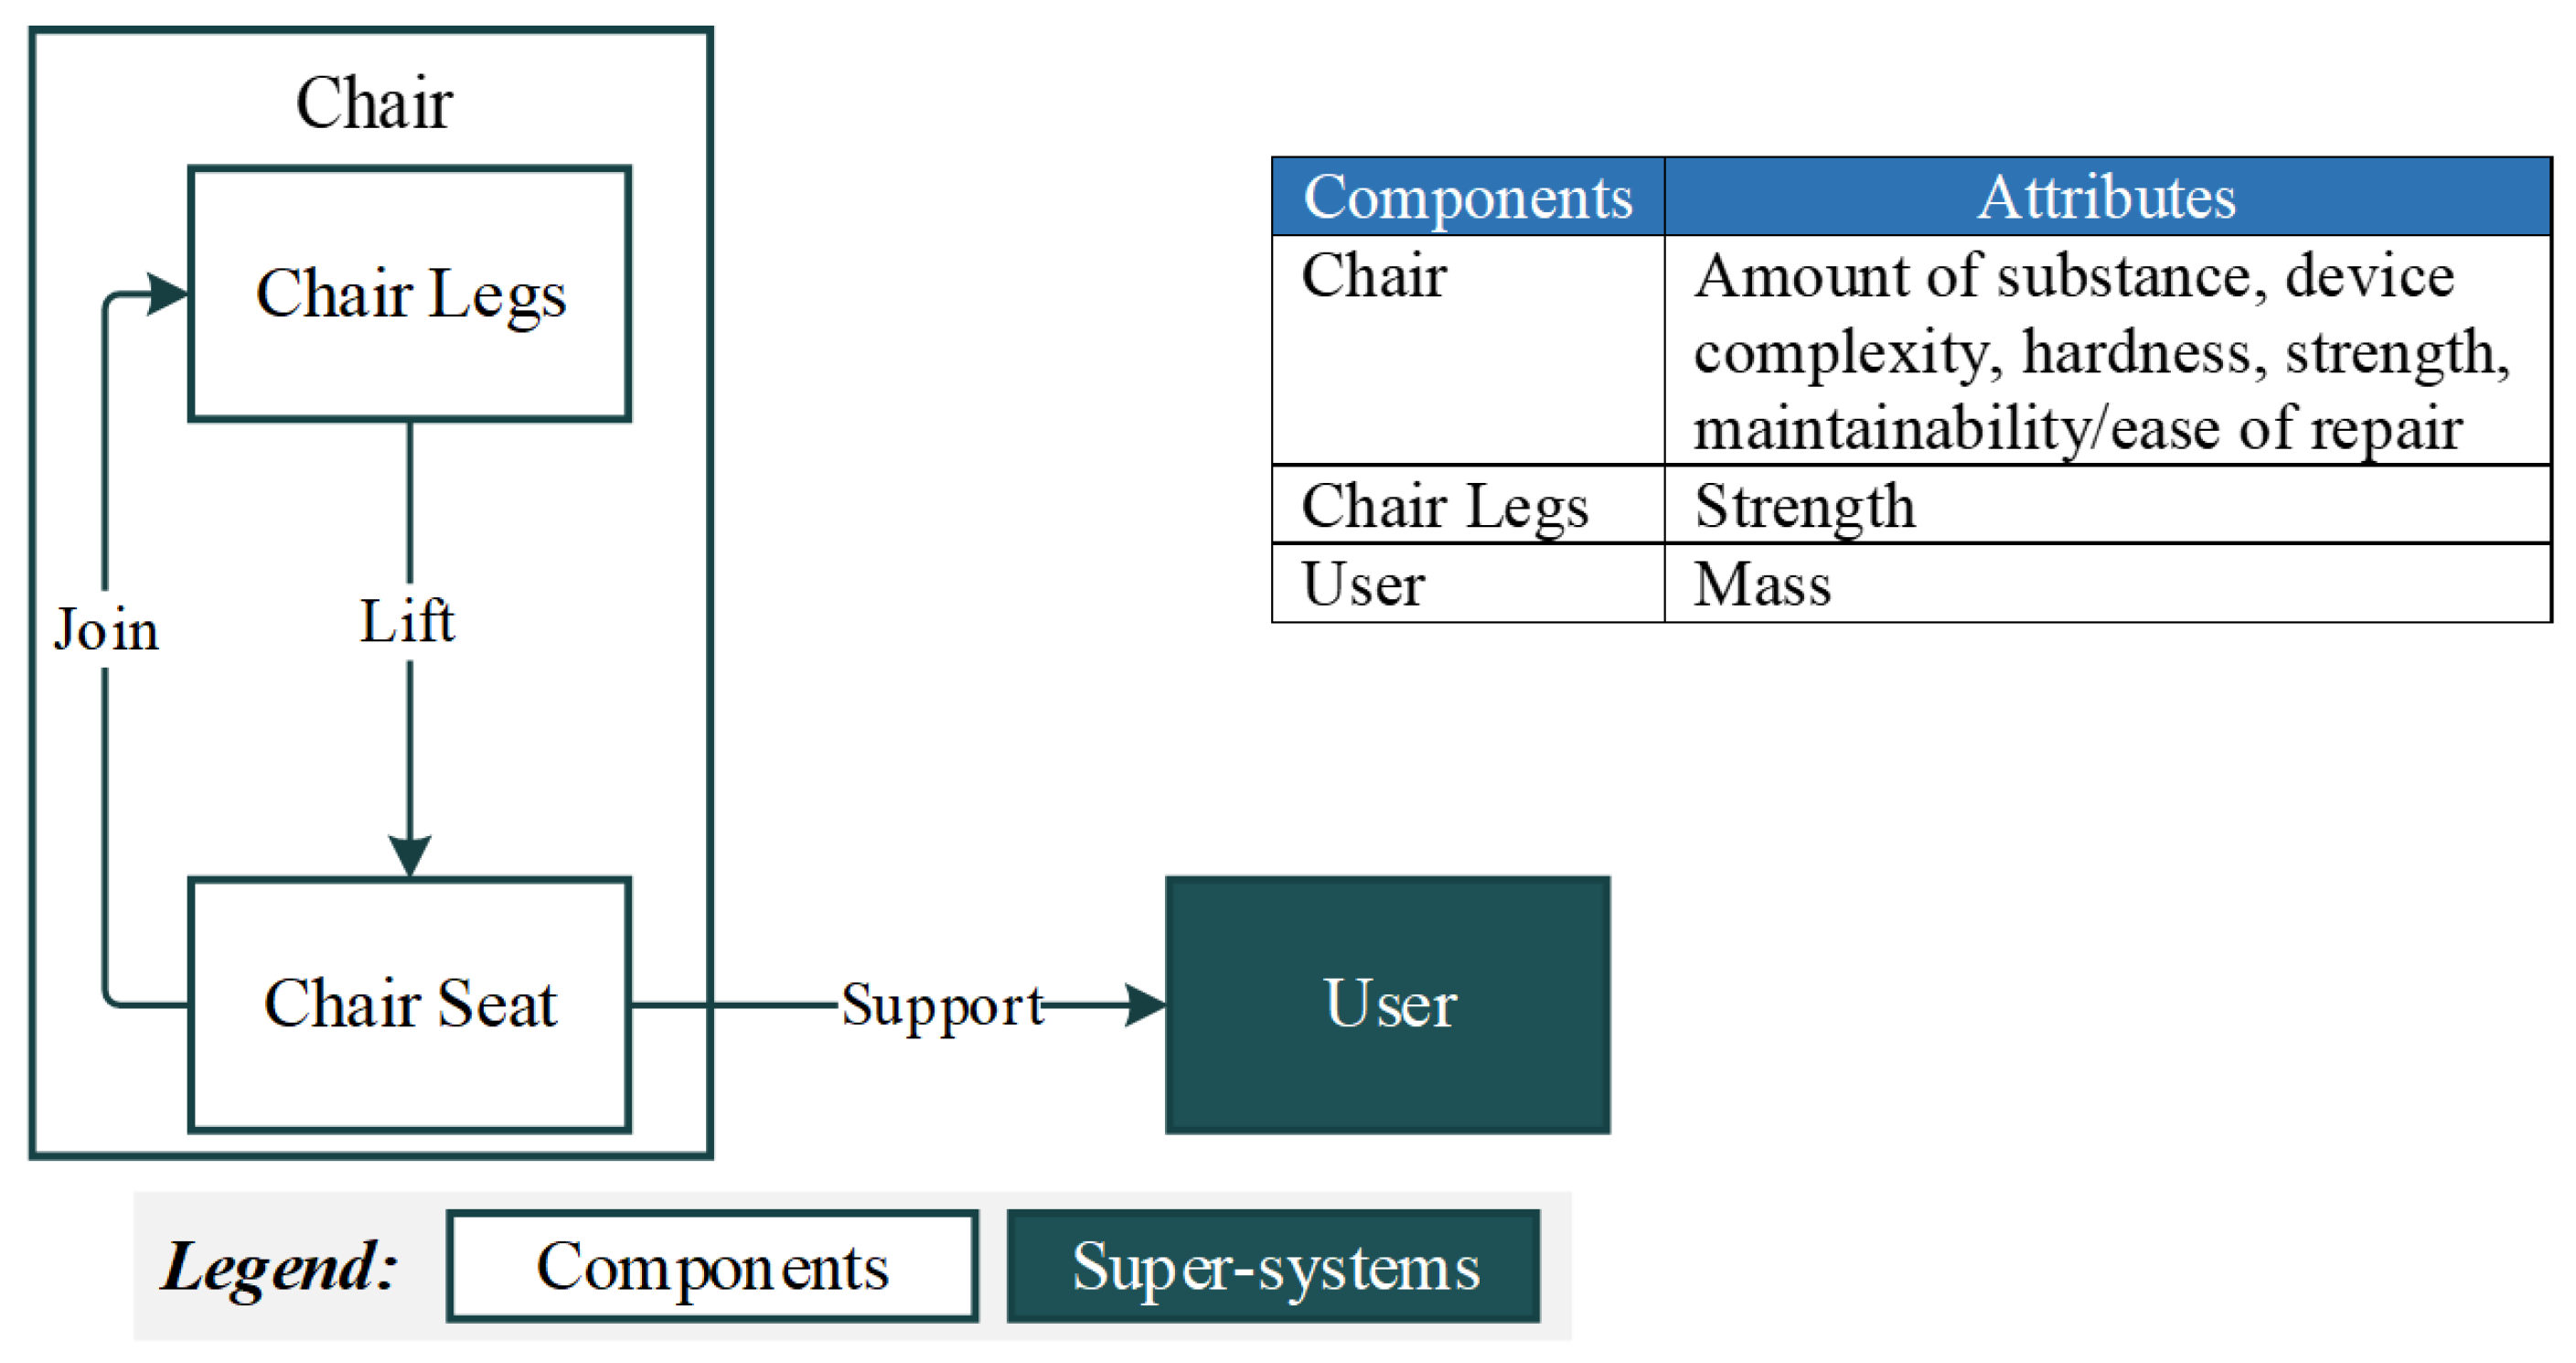
The TRIZ function and attribute analysis is the starting point. A diagram will be created to analyze the product as a system, breaking it down into components and including its interactions with the environment. Components will be connected by function, and attributes will be listed. The format in Figure 3 will be used in this research. The output is a list of functions and attributes that will be correlated to derive the appropriate TRIZ evolutionary trends.
The function and attribute analysis of a chair is used to demonstrate this step, illustrated in Figure 4. The chair consists of two components and one subsystem: the seat, the legs, and the user. The seat and legs are functionally interconnected, with the legs lifting the seat while the chair supports the user. Attributes are listed for each element, including both individual and system-wide attributes.
Chiu’s research [40] will serve as a reference for the list of functions and attributes, along with their corresponding definitions, as shown in Table 3. This will help establish consistency and reduce ambiguity.

3.1.2. Correlate Green Features with Product Functions and Attributes

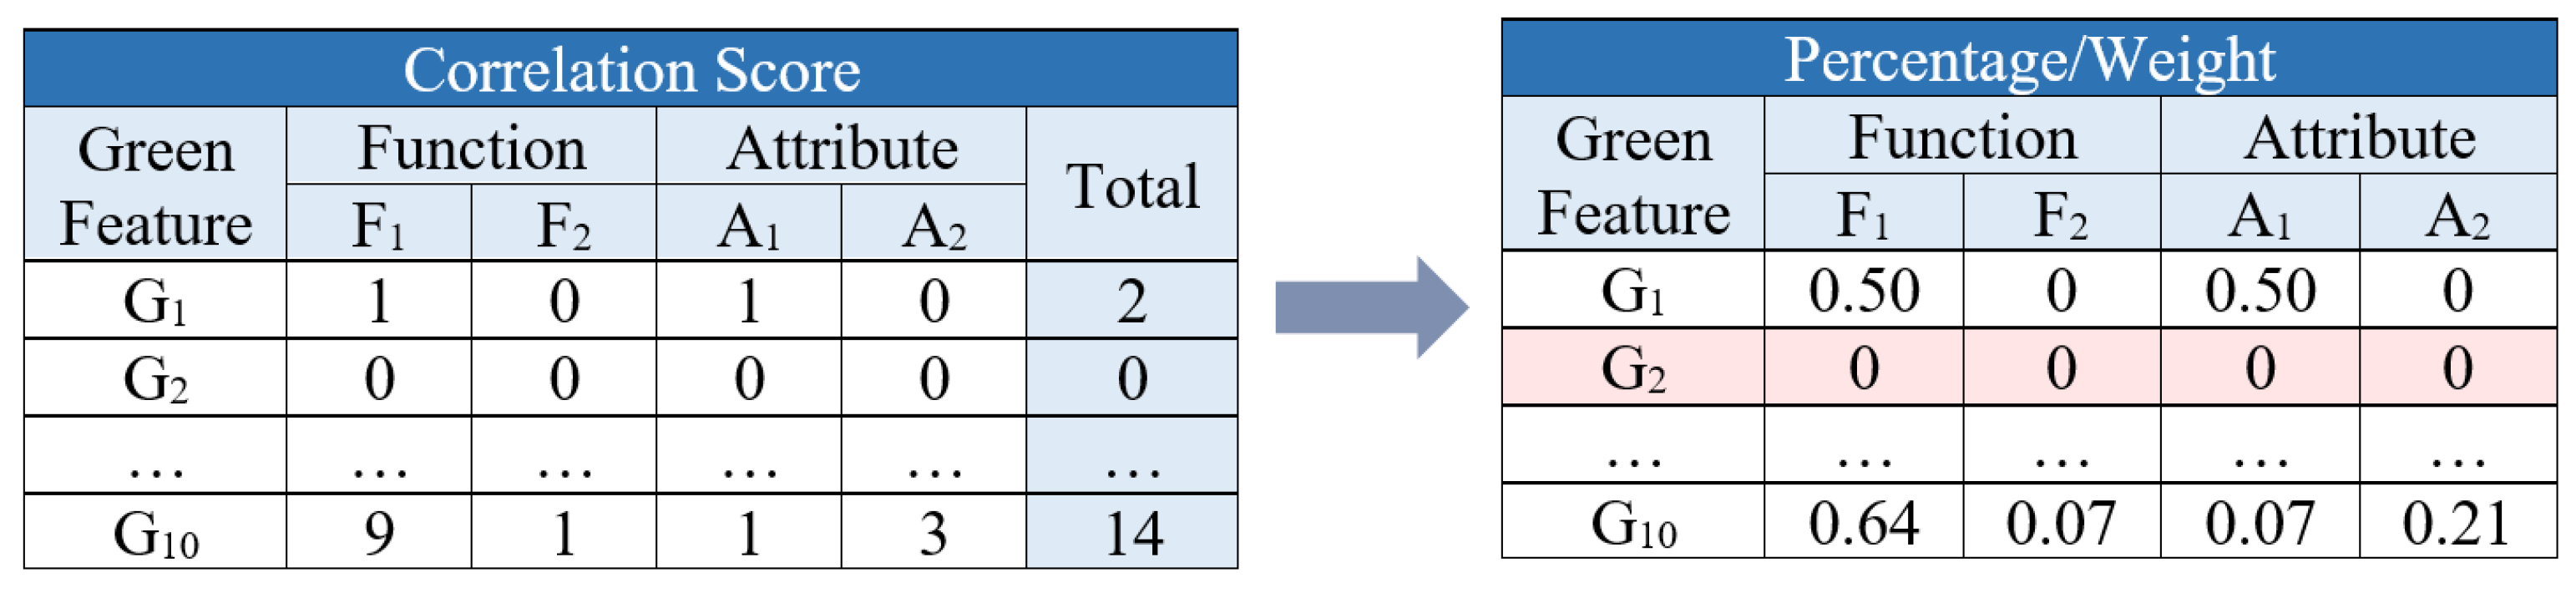
This and the next sections showcase the selection process for TRIZ evolutionary trends. It is a two-stage process that bridges green features to TRIZ trends by correlating product characteristics. First, green features are matched to the product’s functions and attributes to identify the relevant characteristics for their implementation. The correlation score is converted to percentages and used as a weight in the second stage. For each green feature, the function and attributes are correlated with the trends, and the features are ranked by score. This process highlights the opportunities for innovation.
Identifying green design requirements is crucial for triggering innovation. In this study, the green design requirements, referred to as “green features,” are adopted from Rau et al. [41]. These features consider industry standards and customer needs by incorporating eco-efficiency approaches and energy-related product (ErP) directives mandated by the European Union (EU). The list of green features includes:
(1)
Reduce the raw material used;
(2)
Reduce product weight and volume;
(3)
Reduce consumption of energy, water, and other resources throughout the product’s life cycle;
(4)
Choose materials that are not harmful to health and the environment;
(5)
Reduce the amount of waste;
(6)
Improve the recyclability of parts and raw materials;
(7)
Increase the ratio of renewable resources to energy consumption;
(8)
Make the product easier to maintain and repair;
(9)
Increase the durability of the product;
(10)
Improve product service availability or service performance of each product.
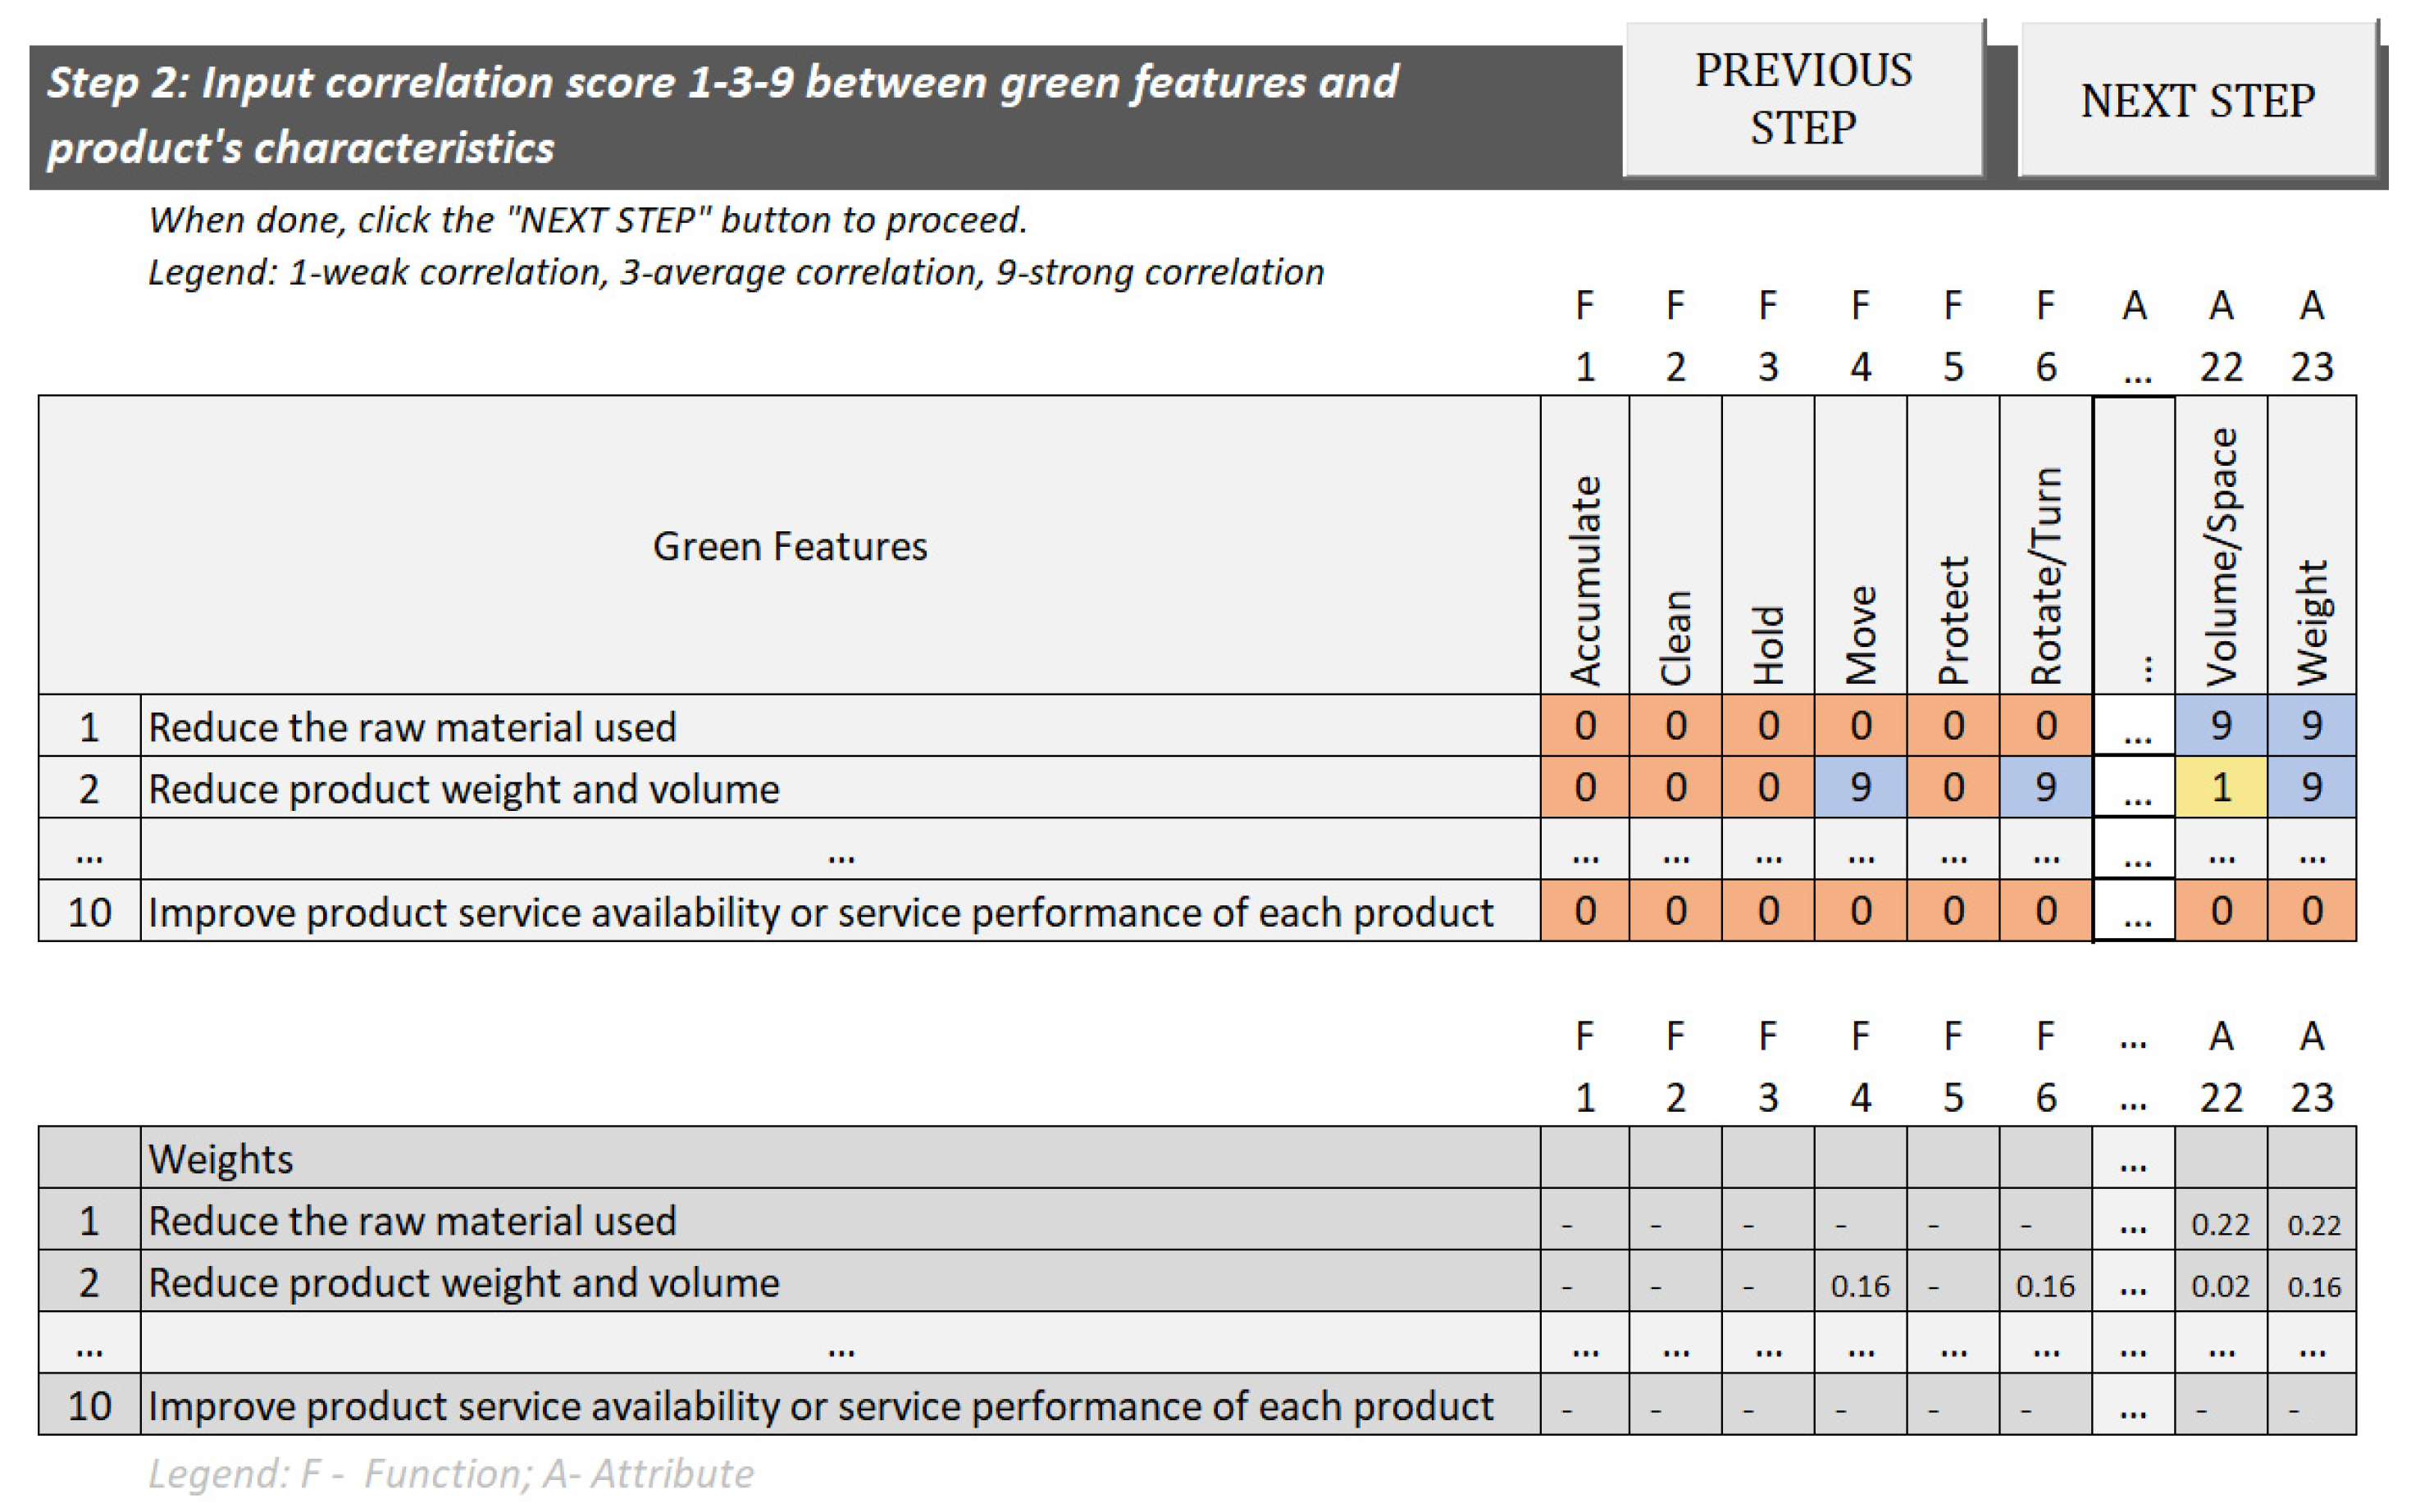
In the first stage, functions and attributes will be rated on a 1–3–9 scale to assess their correlation with green features, as shown in Figure 5 (left side). This scoring method, borrowed from QFD, assigns a rating of 9 for a strong correlation, 3 for an ordinary correlation, and 1 for a weak correlation [42,43,44]. The purpose of using this scoring system is to clearly distinguish between ratings and avoid narrow margins or ties. Green feature 10 has a total score of 14. When there is no correlation at all, a score of 0 can be assigned. For example, there is no correlation between green feature 2 and any of the functions or attributes. Consequently, green feature 2 will be excluded from subsequent steps, as it is no longer relevant to the design; certain green features may not be considered if deemed irrelevant to the product. Moreover, these scores will be converted into percentages for each green feature. The converted table on the right side of Figure 5 shows the calculated percentages for each green feature, along with its product characteristics (functions and attributes).

3.1.3. Correlate Functions and Attributes with TRIZ Trends

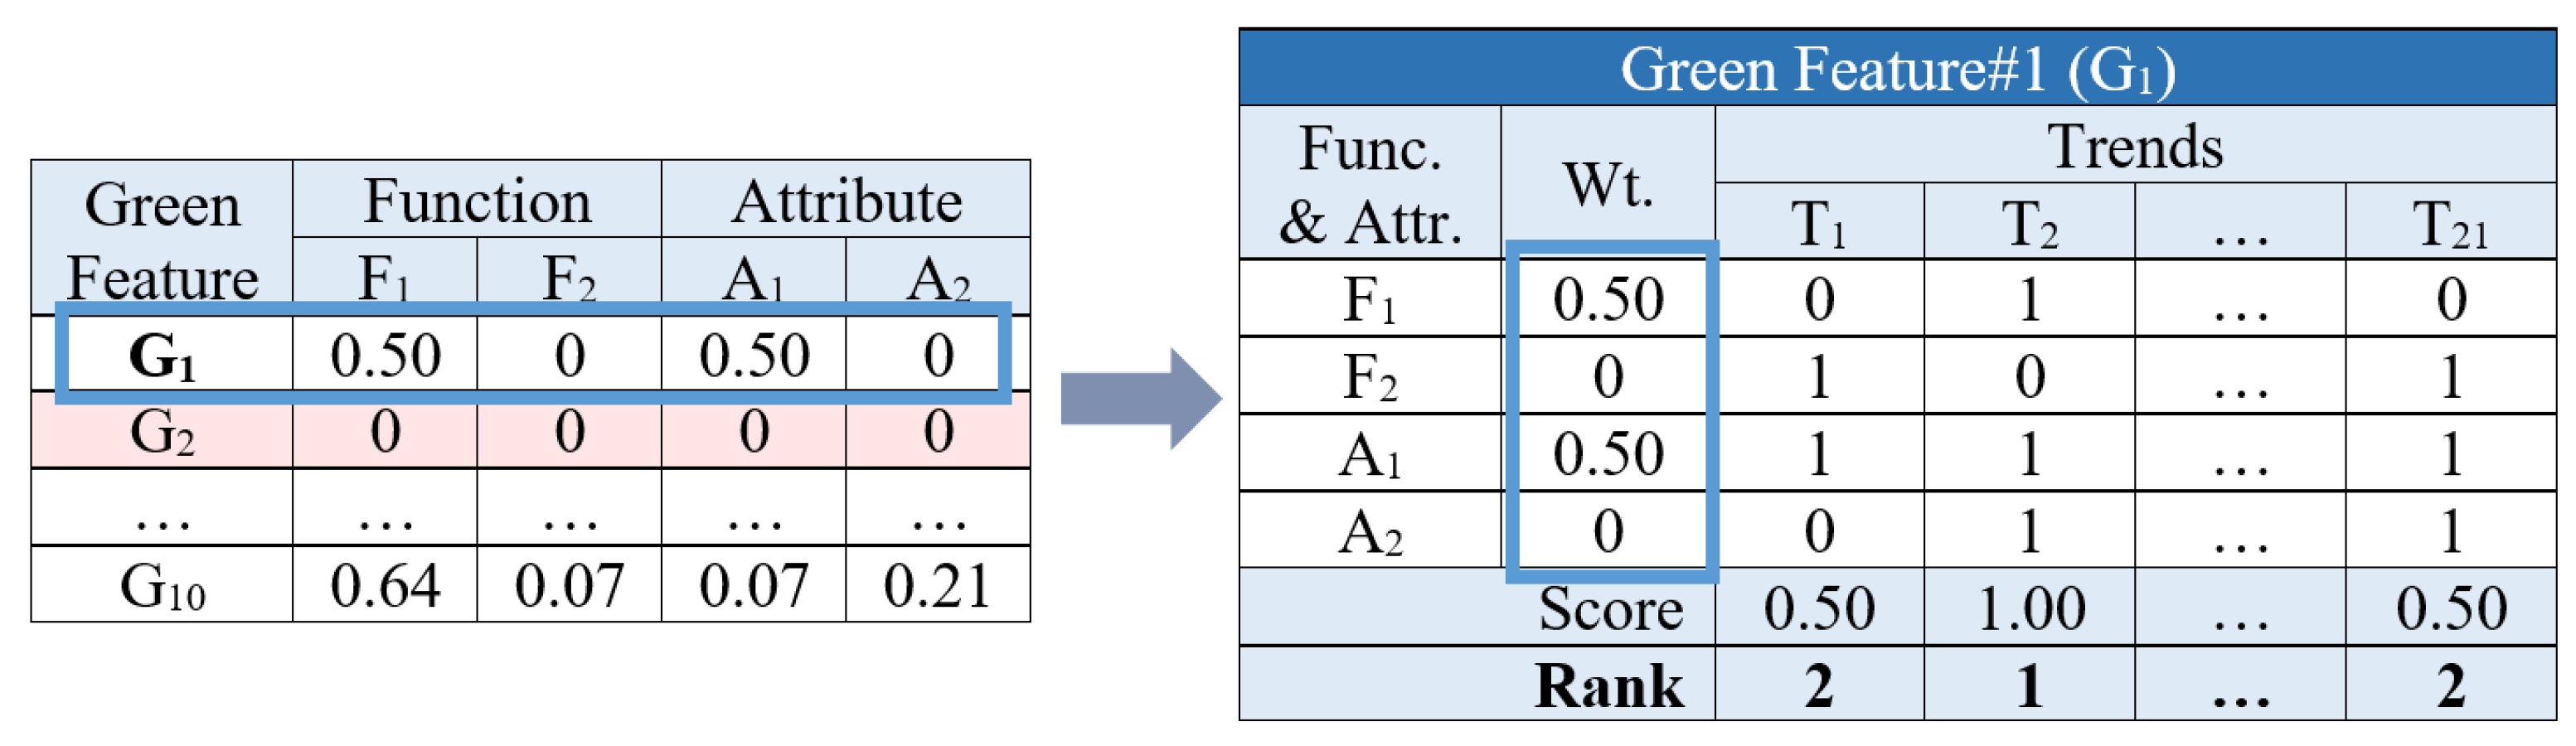
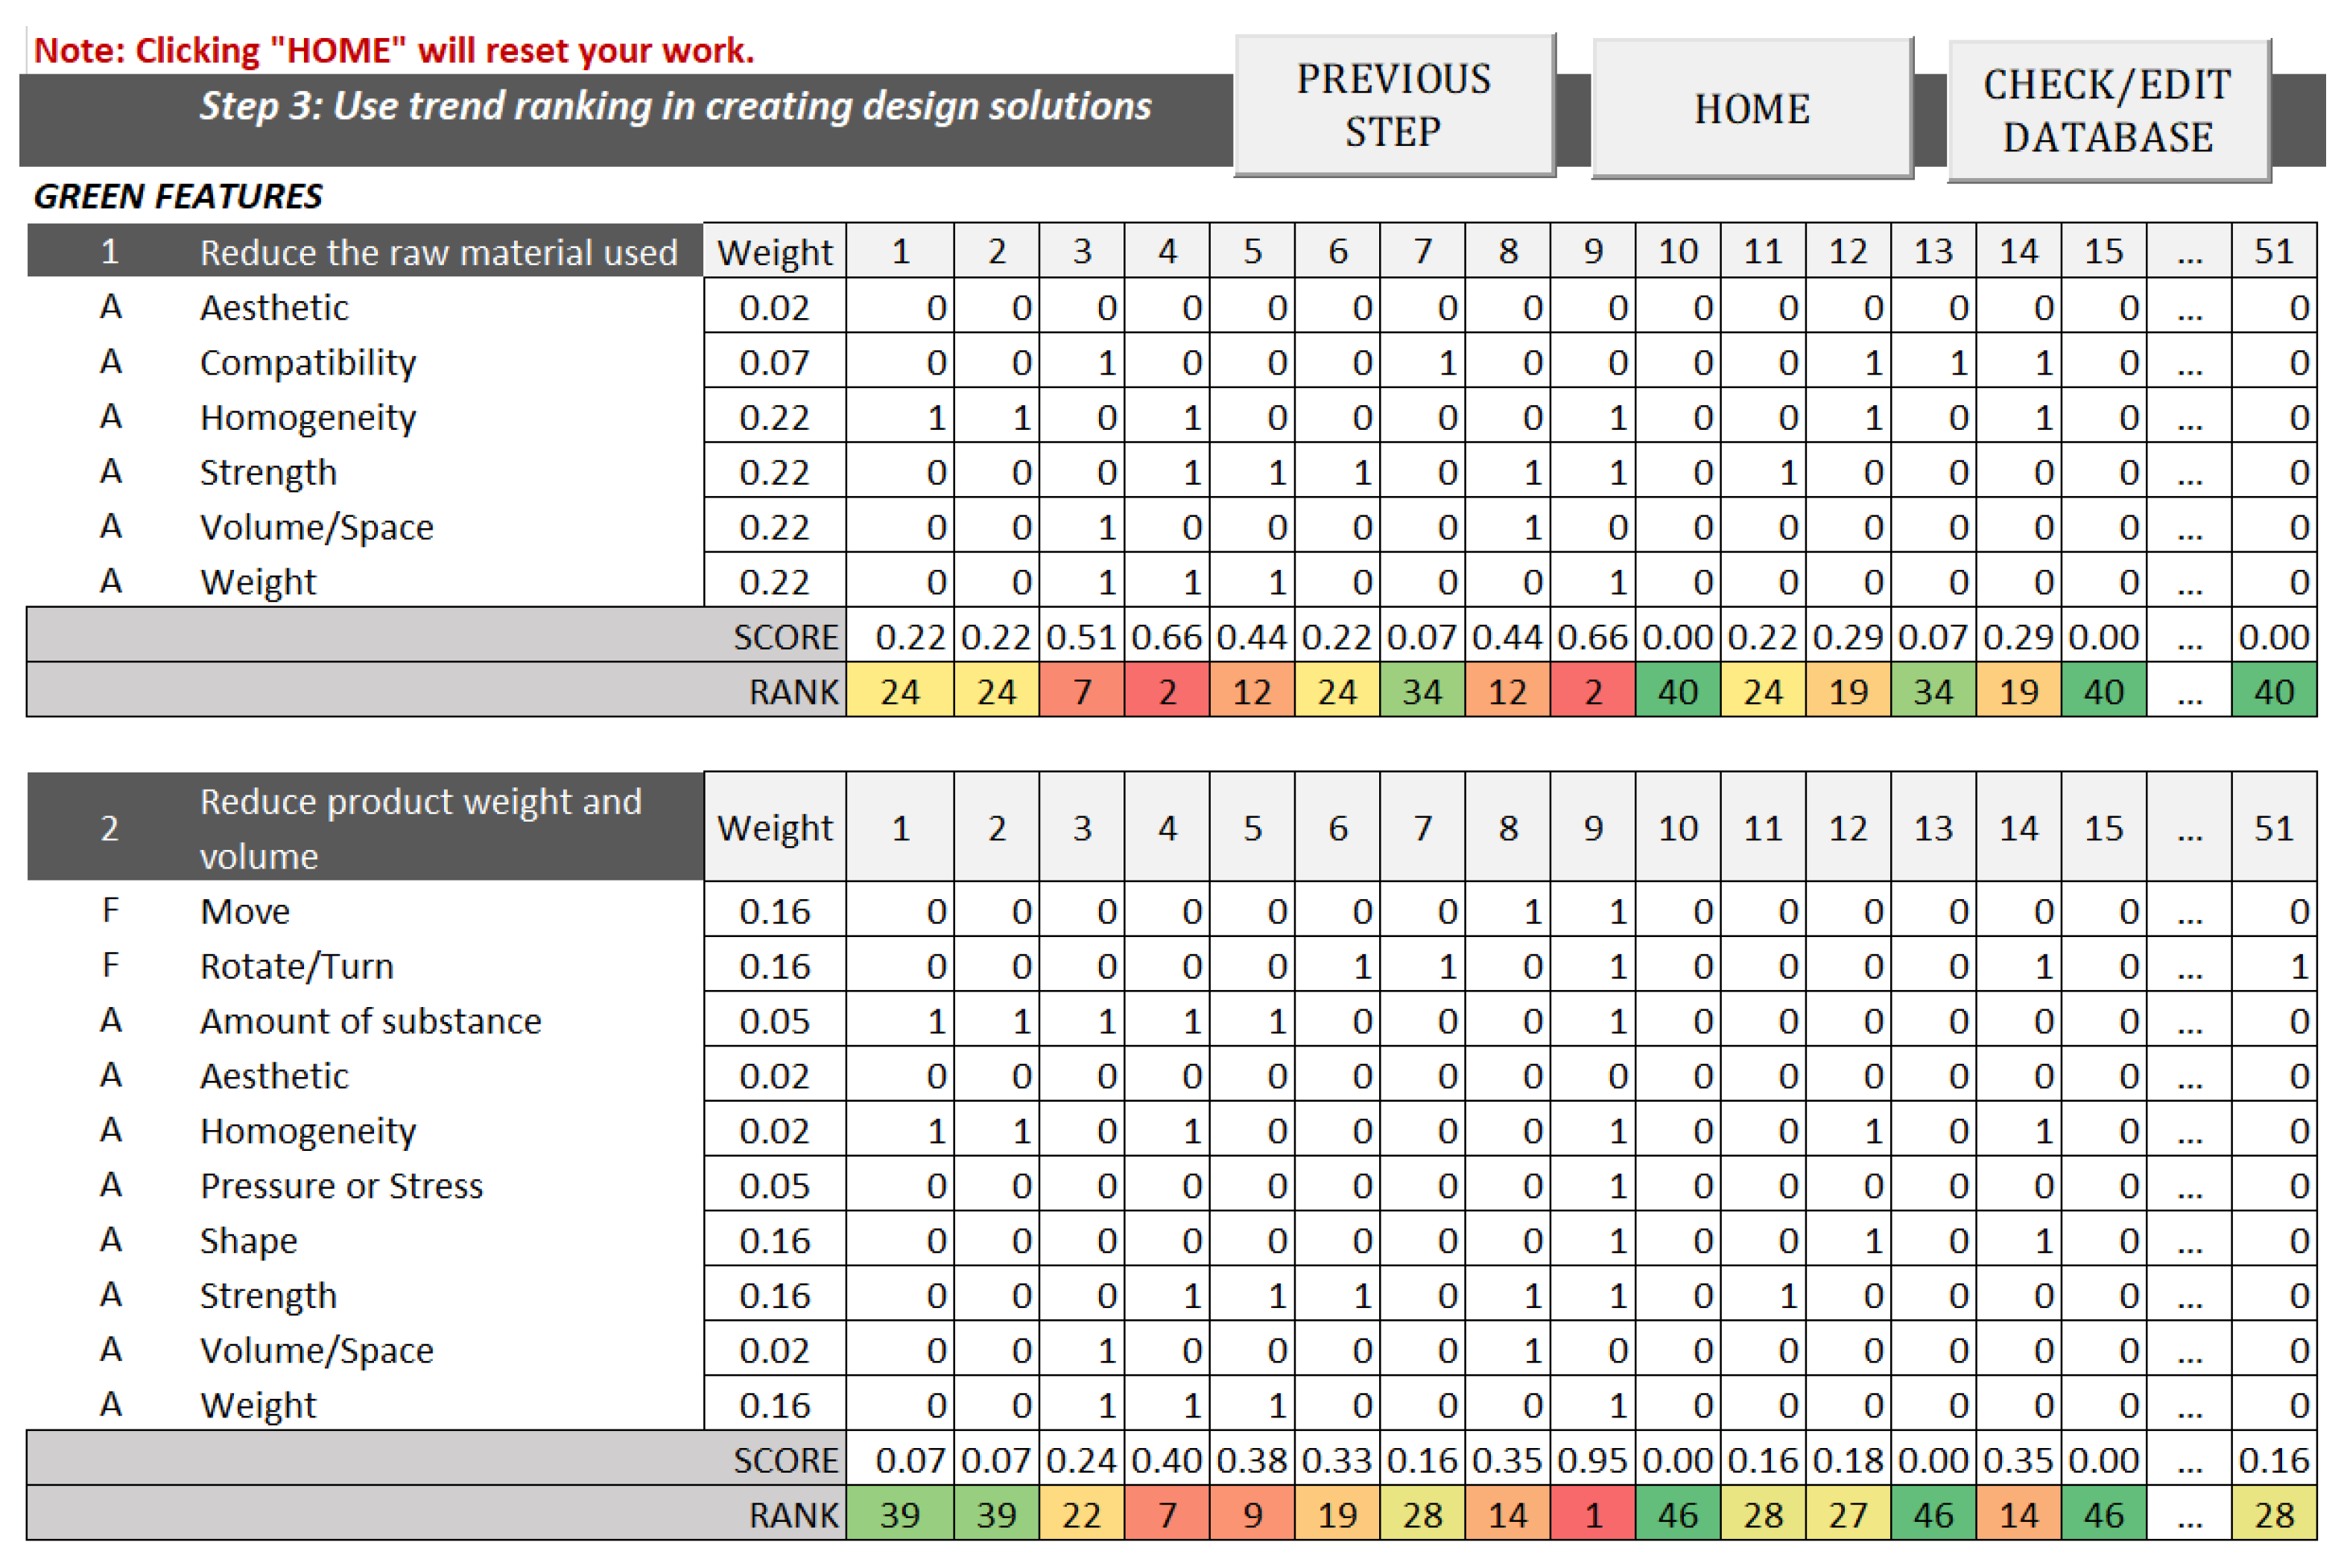
In the second stage of identifying the product trend, the percentage obtained from the first stage will be used as the weights for the functions and attributes. A new table will be created to establish the correlation between product characteristics and TRIZ trends. The resulting scores will help determine which trends (based on rank) should be used to trigger innovation in product design. This approach ensures a more intricate selection of trends, as they are directly linked to the functions and attributes influenced by the implementation of green design requirements. The table on the left in Figure 6 shows the output from the previous step (stage), while the table on the right shows an example of trend correlation for the first green feature.
The binary scoring in the right-hand table of Figure 6 indicates whether there is a correlation between the product characteristics and trends. In this study, a matrix is created to map each of the 51 trends to the 56 functions and 75 attributes, thereby identifying which product characteristics are influenced by specific TRIZ trends. This matrix simplifies the process and eliminates the need to exhaustively enumerate and analyze all 6,681 combinations.
Finally, the rank of the trends for each shown will be used to generate design solutions, along with the inventive principles discussed in the next section. Ranking the trends provides designers with targeted information, enabling them to prioritize trend selection rather than exhaustively or arbitrarily.

3.1.4. Identify Inventive Principles

After identifying the relevant trends, the next step is to determine the inventive principles. The inventive principles are selected using the template in Table 4, which is based on the classical TRIZ technique. This table shows that IF the green feature is implemented, THEN it changes one aspect of the system (improving the parameter), BUT it may compromise another aspect (worsening the parameter), creating a contradiction. The aspects referred to are engineering parameters (EPs). At this point, the inventive principles come into play. They are used to find solutions that simultaneously satisfy conflicting requirements rather than treating them as mere trade-offs.
At this point, users can already generate design solutions depending on the inventive principle suggested by the contradictions. However, incorporating TRIZ trends will provide a clearer understanding of areas for design improvement. The next step will demonstrate how the trends will be integrated into the process.

3.1.5. Formulate Design Solutions

Table 5 enumerates all the information gathered from the previous steps. Utilizing them to achieve meaningful results is the most crucial task. Each green feature is paired with its corresponding trend (with ranks) and inventive principles. This structured framework facilitates the development of design solutions.
Finally, with ranked trends and inventive principles on hand, designers can use them as guidelines for developing different design solutions. Multiple design solutions can be derived from different combinations, as shown in Table 6. In this research, patent analysis serves as a primary source of design ideas.

3.1.6. Create Product Portfolios

The design solutions from the previous step will be analyzed to identify the combinations that best meet the requirements. Product portfolios will be created, as shown in Table 7. It is essential to consider the evaluation criteria to ensure alignment with the goal envisioned. In this step, the design details will be generated.

3.1.7. Evaluate Alternative Options

The weight–sum model of Multi-criteria Decision Analysis (MCDA) is employed to evaluate the alternative options generated in the previous step. The evaluation criteria are derived from Schöggl et al. [4]. Originally, their checklist for sustainable product development was designed for the early phases of product design, where collaboration and information exchange among stakeholders are used to enhance the product’s sustainability performance. In this research, the checklist is used as an evaluation criterion to assess and compare the alternatives and determine the option with the best sustainability performance, as shown in Table 8. The criteria offer several advantages, including the ability to qualitatively assess environmental, economic, and social factors while accounting for the entire product’s life cycle. The criteria have 11 sub-categories to select to support decision-making for each alternative.
To start, evaluators need the consider the criteria in the checklist in Table 8 and assess their relevance and applicability to the product. Since the checklist is designed for a wide range of products and technologies, this review is crucial to filter out criteria that are not applicable. Once the selection is made, the chosen sub-categories will serve as the evaluation criteria. Table 9 provides an example in which 5 of the 11 sub-categories are considered.
As in Section 3.1.2, each criterion will be assigned a weight of 1–3, reflecting its relationship to the sustainability dimensions (environmental, social, and economic) [4]. A weight of 3 signifies the highest relationship, while a weight of 1 represents the least. This weighting process ensures consistency and transparency in the evaluation, as each criterion receives appropriate consideration. Next, each design will be rated using the 1–3–9 scoring system [42,43,44], as mentioned before. A score of 1 indicates similarity to the original product, a score of 3 denotes improvement over the original, and a score of 9 signifies a significant improvement compared to the original. Either quantitative data or a qualitative description can be provided for evidence. After scoring, the weighted sum product of the criterion weights and the design scores will be computed. The design with the highest score will be deemed the best option. In the example provided in Table 9, Design 2 is identified as the best alternative.

3.2. Automated TRIZ Trend Identification System

The TRIZ trend identification system utilizes Microsoft Excel to automate the steps covered in Section 3.1.1 and Section 3.1.2. Using Excel provides a user-friendly, cost-effective platform that does not require advanced technical expertise. This tool is designed to assist users by providing all the necessary information and instructions to execute these steps effectively. This system includes a comprehensive set of instructions, a list of functions and attributes with their definitions, and a matrix that maps functions and attributes to the applicable TRIZ trends. A case study will be used below to demonstrate its functionality.

4. Case Study

The washing machine is the subject of the case study. The subject is chosen based on three key factors: complexity, replicability, and environmental impact. In terms of complexity, a washing machine has various components, functions, and user requirements. Their global use enhances familiarity and relatability, increasing the potential to replicate the methodology. Additionally, doing laundry has a significant environmental impact, including the use of water and electricity and the release of hazardous chemicals. On average, a residential washing machine uses about 41 gallons of water per load and accounts for approximately 6% of home electricity use. Scented liquid detergents also emit volatile organic compounds, which are classified as carcinogens [45]. The succeeding sections will demonstrate the application of the proposed methodology. Specifically, this case study will analyze the basic structure of a high-efficiency washing machine that uses centrifugal force, aiming to identify trends for water-saving, power-saving, and durable washing machines [46,47].

4.1. Washing Machine: Function and Attribute Analysis

The use stage of a washing machine’s life cycle involves the discharge of wastewater and the continued consumption of electricity and water resources. At the end of its life cycle, the machine’s parts are dismantled, classified, and recycled according to their material properties. Recycling metal components such as nuts, grooves, copper wires, and motors requires substantial energy. In contrast, the plastic shell is decomposed and recycled into plastic pellets for future use.
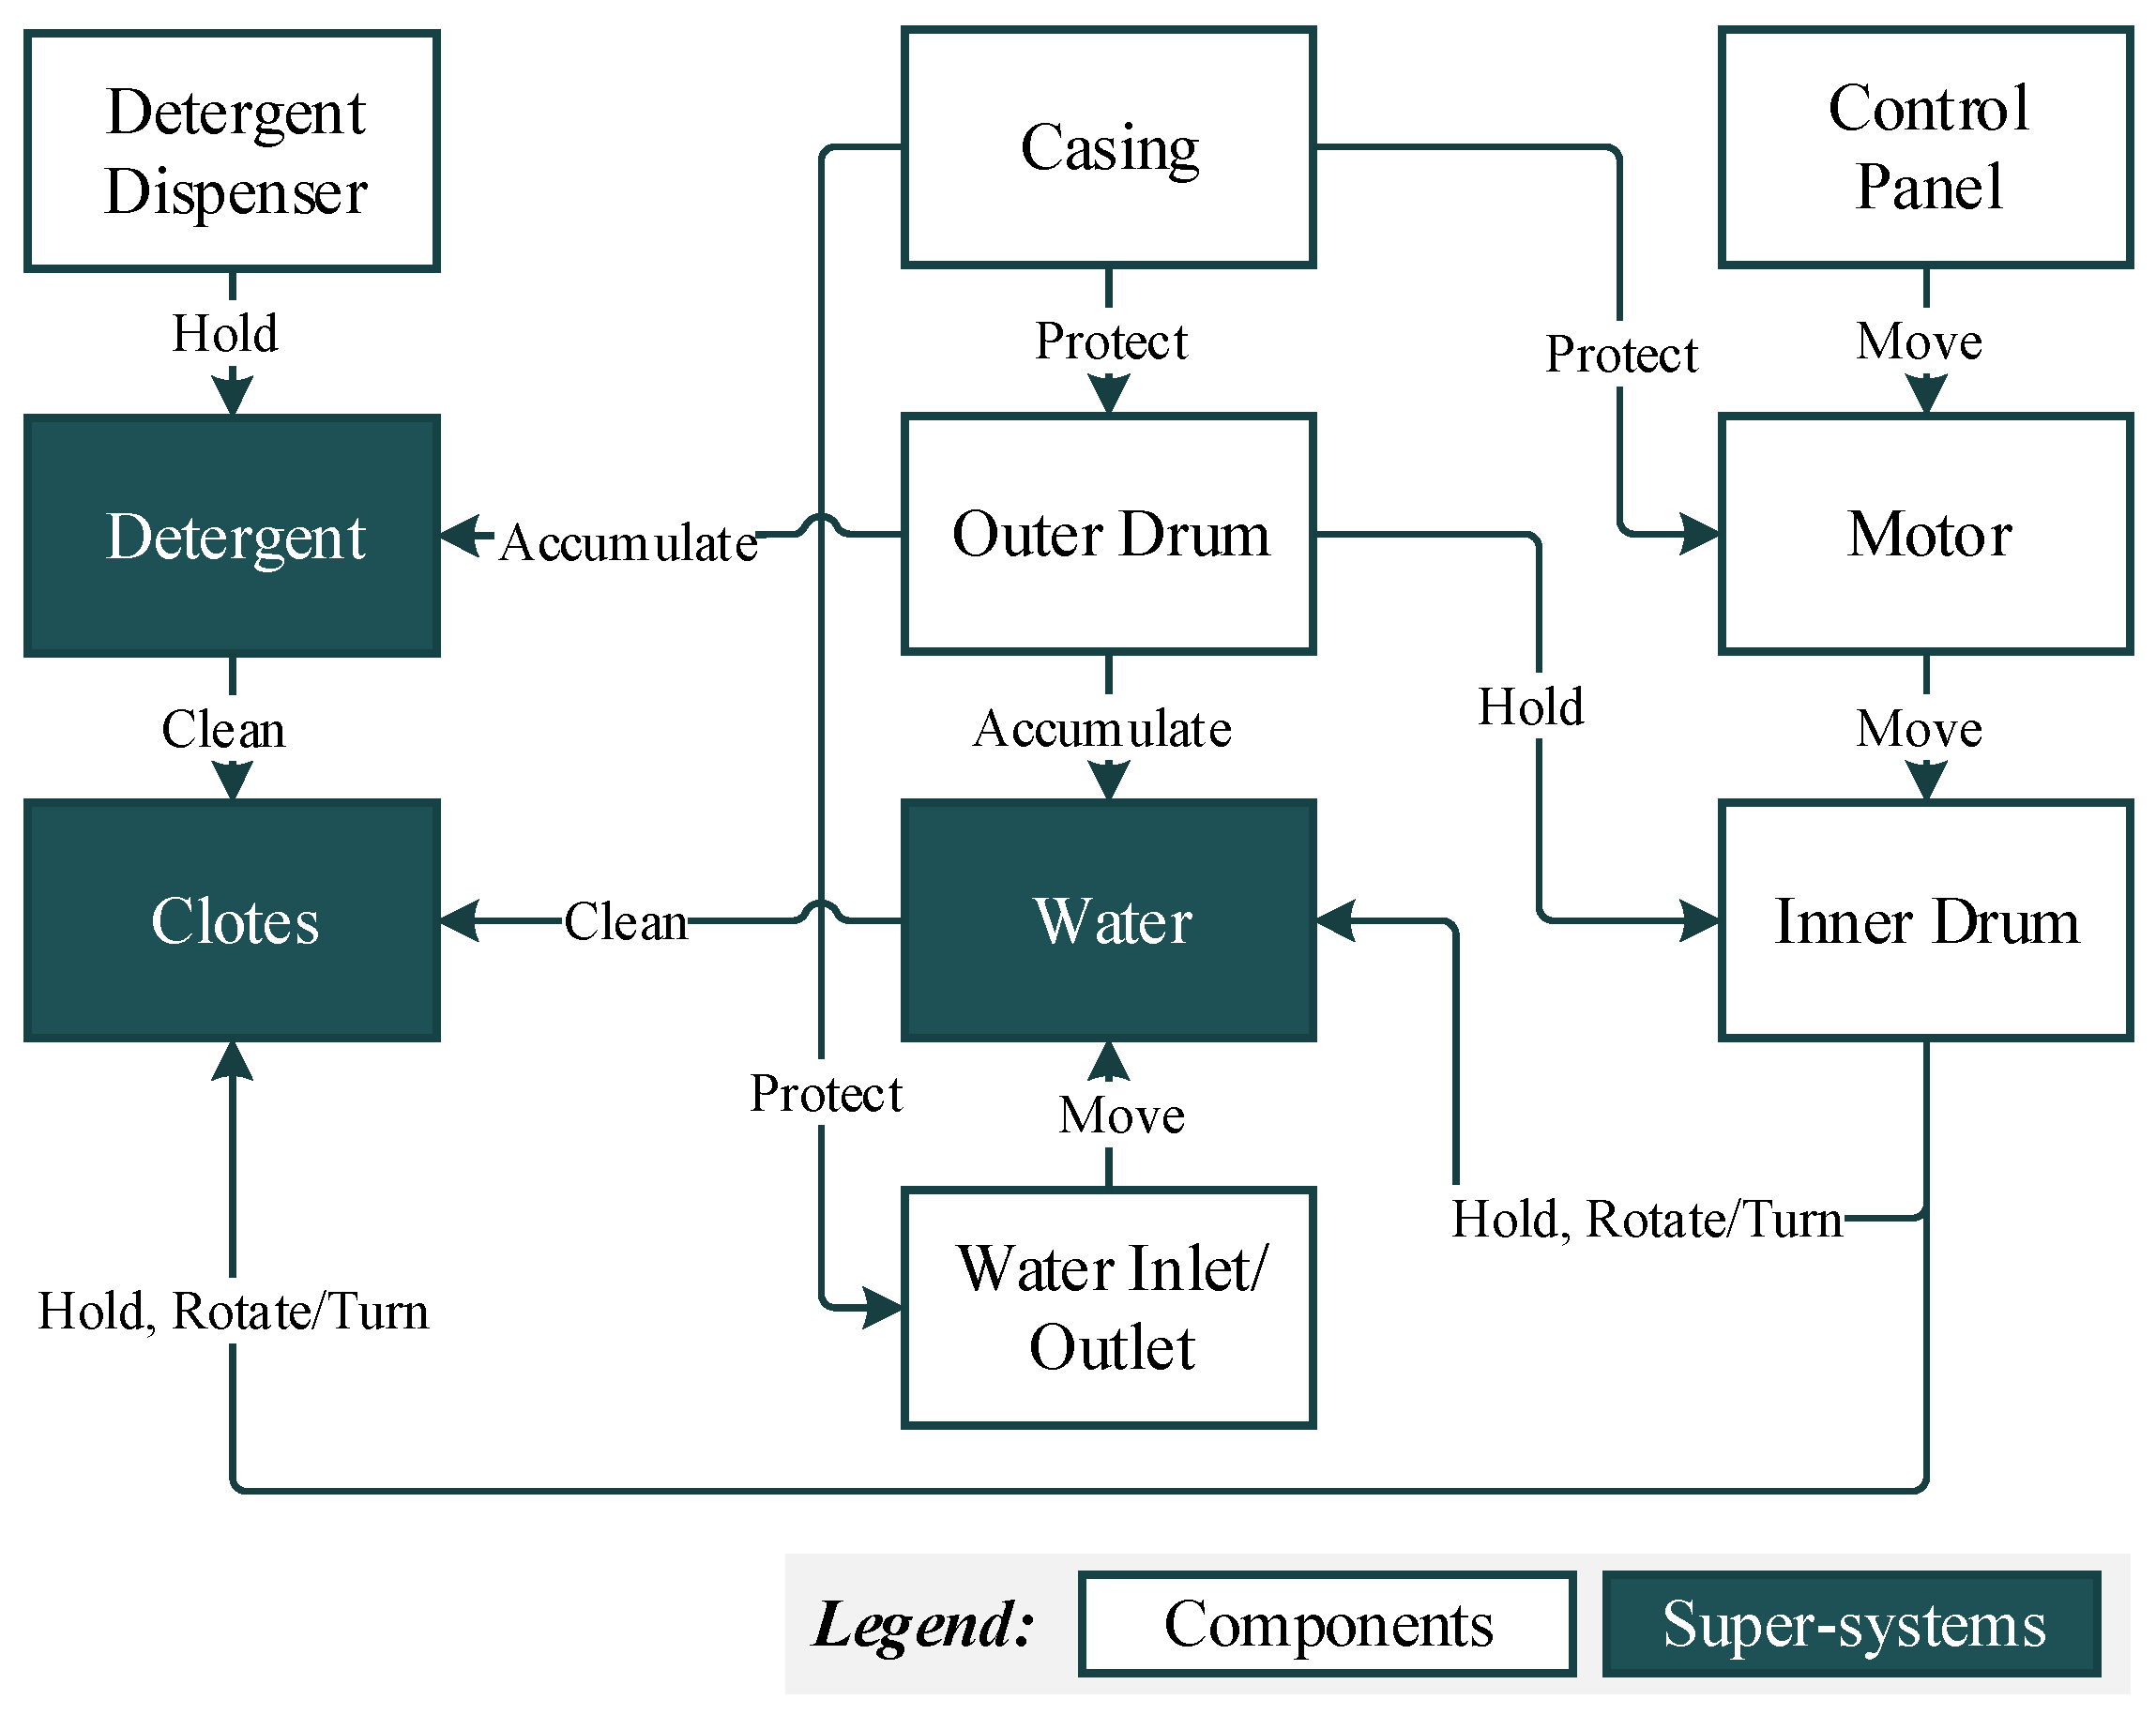
Structurally, a washing machine comprises the casing, outer drum, inner drum, control panel, detergent dispenser, water inlet/outlet, and motor. The casing provides structural support and holds all the components together. The machine has two cylindrical structures, the inner and outer drums. The inner drum holds the clothes and rotates to wash them; its surface features different patterns that help remove dirt. The outer drum remains stationary, holding the inner drum and collecting the used water and detergent during drying. The motor, typically located at the bottom, powers the inner drum’s rotation. The water inlet/outlet moves water inside the inner drum, while the detergent dispenser holds and deposits detergent. Overall, the control panel enables the user to select wash cycles and options.
With this analysis, the function and attribute analysis diagram for the washing machine is presented in Figure 7. It includes all the functions connecting each component, as well as super-systems or external variables, namely: water, clothes, and detergent. The attributes are discussed separately for better organization. Afterward, the list of attributes is shown in Table 10.
The following problem statements are formulated in this analysis.
(1)
Metal parts in the casing, outer drum, and motor are prone to rust and corrosion, compromising the machine’s structural integrity and leading to leaks, reduced functionality, and failure.
(2)
The rotating motion of the inner drum can cause imbalance, resulting in excessive vibration, noise pollution, and potential mechanical failure.
(3)
Increased detergent usage is often necessary to improve cleaning effectiveness, raising the question of whether the washing machine can be improved to facilitate better mixing of detergent and clothes during operation.
(4)
The washing machine requires different speeds for washing and drying processes, with a slower speed for washing and a faster speed for drying. Consideration is needed to provide variable speeds and manage energy consumption accordingly.
(5)
Environmental impacts, including energy and water consumption, need to be regulated throughout the entire life cycle, from production to disposal. Additionally, issues such as water pollution from detergent use and noise pollution should be addressed.

4.2. Washing Machine: Correlation of Green Features and Product Characteristics

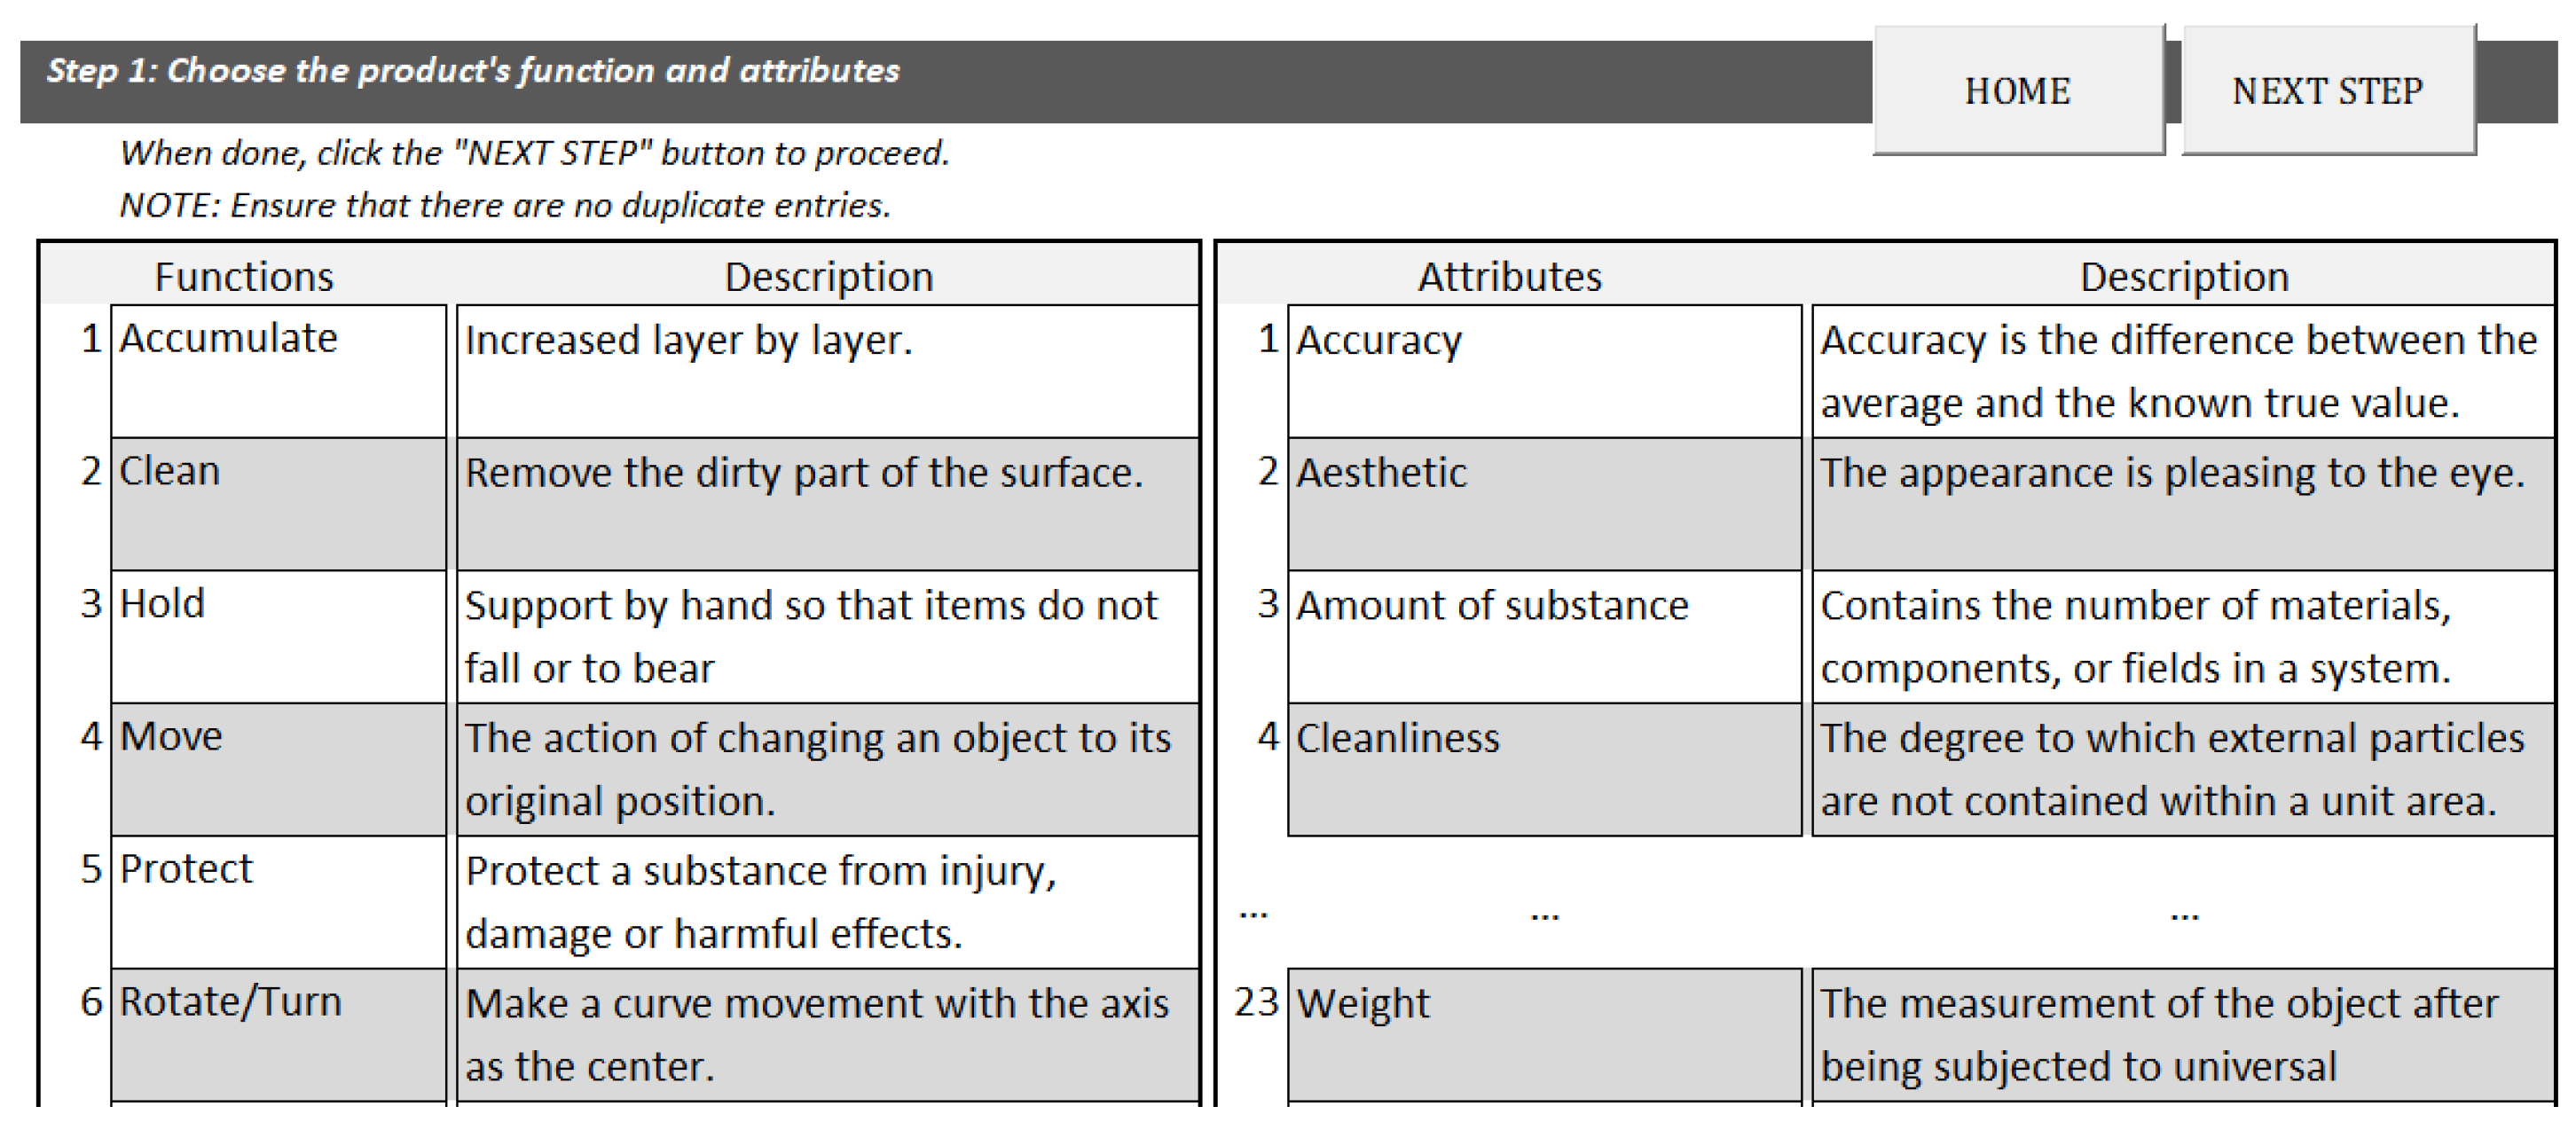
The Excel tool will be used in this and the succeeding steps. First, all the functions and attributes from Table 3 are selected, as shown in Figure 8. The description is automatically displayed beside each function and attribute for validation.
The tool will then proceed to the screen shown in Figure 9. This is where the user selects the correlation score for each green feature and product characteristic using the drop-down provided in the Excel tool. Figure 9 shows the selected functions and attributes from the previous step, along with their respective correlation scores (1, 3, or 9). The table below automatically calculates the weights for the next stage. To assist users in differentiating the correlation scores, the cells are color-coded, as there are multiple rows and columns that can sometimes be challenging to locate.
The designer evaluated the functions and attributes affected by the green features. For example, green feature 1 demonstrates a high correlation with four attributes. First, homogeneity is significant because it reduces the variety of raw materials. Second is strength, which is influenced by the amount of material and defines both the structure and the machine’s strength. Third is volume or space, which depends on the quantity of raw material and determines the machine’s size and the required space for the loads. Last is the machine’s weight, which depends on the raw material used. Thus, these four attributes obtained a rating of 9. Additionally, aesthetic, compatibility, and surface smoothness show weaker correlations with green feature 1.

4.3. Washing Machine: TRIZ Trends

The Excel tool processes user input, and automatically generates results. This includes the rating and rank of TRIZ trends for each green feature.
As seen in Figure 10, the functionality of the tool is as follows:
(1)
The importance score of TRIZ trends (1–51) is calculated and ranked from highest to lowest.
(2)
Only relevant functions and attributes with correlation scores to green features are displayed, for better readability. Irrelevant functions, attributes, and insignificant green features are hidden.
(3)
The ranked scores are based on the correlation between selected functions and attributes, presented as binary values, and are pre-determined in the paper and stored in the database. This provides additional information on which product characteristics can be improved using TRIZ trends.
(4)
The ranks are color-coded gradients from red to green, wherein the darkest red shade indicates the highest ranks, facilitating the identification of important trends among the 51 options.

4.4. Washing Machine: Identify Inventive Principles

All green features are covered in this case study because at least one function or attribute relates to them. Therefore, the 10 green features triggered the contradictions, and the corresponding inventive principles are identified in Table 11. The relationship between green features and TRIZ trends provides relevant information for determining which inventive principles can support the evolution of washing machines in line with green design requirements.

4.5. Washing Machine: Formulate Design Solutions

The design solutions are formulated according to the trends obtained through the two-stage product trend development, combined with green features and inventive principles derived from the IF–THEN–BUT template, as summarized in Table 12, wherein at least five TRIZ trends are shown.
From the list in Table 12, start with the green features, then select a TRIZ trend based on its rank and pair it with the inventive principles. Based on this information, research is conducted to develop different design solutions. Fifteen design solutions are generated, as multiple ideas will most likely emerge from the design triggers, as shown in Table 13.

4.6. Washing Machine: Create Product Portfolios

With several design solutions on hand, two product portfolios are created, as shown in Table 14. Several other product portfolios are generated, given that there are 15 design solutions. However, only two are shown to cite examples, and also for the reason that the focus of the research is on the innovation side and how to come up with unique design solutions.

4.7. Washing Machine: Evaluate Alternative Options

Based on the design concept and the nature of the case study, five criteria are selected from the checklist found in Table 8. Weighs are defined in Section 3.1.7, based on the sustainability dimensions of the criterion.
During evaluation, all scores for the existing design are set to 1 as the baseline. The scoring will be 1 if it matches the existing design, 3 if it is better, and 9 if it is significantly better. Given this information, the final scores are shown in Table 15. The results of the study indicate that both Design 1 and Design 2 significantly outperform the existing design. This suggests that the methodology used in this research yields significantly higher-quality design solutions.

4.8. Case Study Results and Implications

4.8.1. Case Study Results

The following insights are derived from the case study of the washing machine:
(1)
The focus of the research is to generate innovative solutions that are triggered and aligned with green features. The study yielded 15 design solutions demonstrating the effectiveness of the proposed approach.
(2)
The summary table of green features, ranked TRIZ trends, and applicable inventive principles is particularly valuable for designers. While additional resources may be needed for idea generation, the table provides a focused and relevant starting point. Designers can further research specific TRIZ trends and inventive principles by seeking publications with clear examples, such as those by Chang & Chen [50], Caplan et al. [51], Mann [52], Russo & Sprea [53], and Lee et al. [54].
(3)
For each design option, we can trace back which green features, trends, contradictive parameters, and inventive principles were involved for further review, as shown in Table 16.
(4)
The use of the Excel-based tool significantly reduces time and effort compared to manual organization and computation. Researchers saved approximately 2–4 h by using the tool, which not only aids computation but also improves visual presentation, enhancing usability.

Table 16. Traceability of green feature, trend, parameter, and IP for Design 1.
DesignDesign SolutionGreen
Feature
Trend
(Rank 1)
Improving/
Worsening
Parameters
Inventive Principle (IP)Trend/IP
1D1G4T9, T44EP27/EP41IP4, IP24, IP28, IP40T9/IP40
G1G7T19, T22EP45/EP36IP17, IP28, IP30, IP35T22/IP17

4.8.2. Practical Implications

From some perspectives, the design process is heavily biased by subjective evaluation. This implies that if the evaluators change, the product’s design may change as well. The proposed methodology provides a structured way with clear metrics to address this concern. However, users should put extra effort into detailing the methodology to make it as systematic as possible. For instance, in the evaluation criteria, each score should be assigned a quantifiable range to prevent selection based on subjective opinion. We conducted three case studies to test our methodology, involving a chair, an electric fan, and a washing machine, representing different industrial products. They all passed the procedure of our methodology. However, due to page limitations, we chose the washing machine as an example to illustrate our proposed methodology.

5. Conclusions

This research proposed a streamlined green design methodology using TRIZ trends for sustainable development. It addresses the importance of green design and challenges in implementation, and offers a solution for companies with limited resources. The methodology is anchored in TRIZ, particularly its evolutionary trends, to drive innovation and minimize environmental impact.
The proposed methodology begins with a function and attribute analysis to understand the product’s characteristics and prioritize user needs. Green features are then introduced in line with industry standards to transform the design into a green one. The main contribution of this research lies in identifying TRIZ trends through a two-stage process. The first stage correlates the product’s characteristics with the green features, identifying the necessary changes for green design. The second stage ranks the appropriate trends using a matrix of functions, attributes, and TRIZ trends. This research successfully bridges green features and TRIZ trends through product functions and attributes. To further streamline the process, an Excel-based tool was developed, eliminating the need for manual computation. The tool is user-friendly, accessible, and requires no additional resources. Detailed design solutions are generated by combining green features, TRIZ trends, and inventive principles. These solutions form product portfolios, evaluated using sustainability development metrics as proposed evaluation criteria.
In summary, this research leverages the evolutionary potential of products to drive innovation. TRIZ, as the foundation of methodology, has demonstrated its power as a problem-solving tool and catalyst for innovation. The effective use of TRIZ and efficient methodologies can make a substantial contribution to addressing sustainability challenges. It is important to recognize the significant impact of TRIZ, especially when applied to critical issues such as sustainability.
The researchers view this study as a valuable starting point for a structured, efficient design methodology that utilizes TRIZ concepts. However, there are further steps and improvements that were not covered in this research. Future studies could stress-test the methodology through academia–industry collaboration, gathering insights from experts to identify additional developments, such as usability tests; recruiting designers with varying levels of experience to track their learning curves and task error rates; and publishing the complete mapping matrix and operating guidelines to facilitate peer replication and verification. Moreover, integrating the methodology into a computer-aided tool could enhance accessibility and ease of use beyond the Excel tool used in this study. Additionally, the methodology can be applied across various domains, including industries, process and service design, and more detailed product design. In addition, a sensitivity analysis may be needed to assess the stability of the evaluation, including single-factor or Monte Carlo analyses for weights and scores. While this research focused on a product case study, exploring the application of the same concept to other product processes or services could yield interesting findings.

Author Contributions

Conceptualization, H.R. and J.-J.W.; Methodology, H.R., K.M.P. and J.-J.W.; Validation, H.R. and I.S.; Formal analysis, K.M.P. and J.-J.W.; Investigation, H.R. and J.-J.W.; Data curation, J.-J.W. and K.M.P.; Writing—original draft preparation, J.-J.W. and K.M.P.; Writing—review and editing, H.R., K.M.P. and I.S.; Visualization, K.M.P. and J.-J.W.; Project administration, H.R.; Supervision, H.R.; Funding acquisition, H.R. All authors have read and agreed to the published version of the manuscript.

Funding

This research was funded by the National Science and Technology Council of China, grant numbers NSTC 113-2221-E-033-051 and NSTC 114-2221-E-033-001.

Institutional Review Board Statement

Not applicable.

Informed Consent Statement

Not applicable.

Data Availability Statement

The original contributions presented in this study are included in the article. Further inquiries can be directed to the corresponding author.

Conflicts of Interest

The authors declare no conflicts of interest.

References

  1. Russo, D.; Regazzoni, D.; Montecchi, T. Eco-design with TRIZ laws of evolution. Procedia Eng. 2011, 9, 311–322. [Google Scholar] [CrossRef]
  2. Sdrolia, E.; Zarotiadis, G. A comprehensive review for green product term: From definition to evaluation. J. Econ. Surv. 2019, 33, 150–178. [Google Scholar] [CrossRef]
  3. Ahmad, S.; Wong, K.Y.; Tseng, M.L.; Wong, W.P. Sustainable product design and development: A review of tools, applications and research prospects. Resour. Conserv. Recycl. 2018, 132, 49–61. [Google Scholar] [CrossRef]
  4. Schöggl, J.P.; Baumgartner, R.J.; Hofer, D. Improving sustainability performance in early phases of product design: A checklist for sustainable product development tested in the automotive industry. J. Clean. Prod. 2017, 140, 1602–1617. [Google Scholar] [CrossRef]
  5. Verhaegen, P.A.; Vertommen, J.; D’hondt, J.; Dewulf, S.; Duflou, J.R. Relating properties and functions from patents to TRIZ trends. CIRP J. Manuf. Sci. Technol. 2009, 1, 126–130. [Google Scholar] [CrossRef]
  6. Zhang, J.; Liu, L.; Cao, G.; Sheng, P.; Jia, J.; Li, Y.; Guo, H.; Li, H. A product state expansion method integrating TRIZ and extenics for dynamic market adaptation. Adv. Mech. Eng. 2026, 18, 1–23. [Google Scholar] [CrossRef]
  7. Chistov, V.; Aramburu, N.; Carrillo-Hermosilla, J. Open eco-innovation: A bibliometric review of emerging research. J. Clean. Prod. 2021, 311, 127627. [Google Scholar] [CrossRef]
  8. Kuo, T.C.; Smith, S. A systematic review of technologies involving eco-innovation for enterprises moving towards sustainability. J. Clean. Prod. 2018, 192, 207–220. [Google Scholar] [CrossRef]
  9. Ma, Y.; Zhidebekkyzy, A.; Bilan, Y.; Kalmakova, D. Green technology integration in product design: A systematic literature review of challenges and approaches. Sustain. Futures 2025, 10, 101157. [Google Scholar] [CrossRef]
  10. Xavier, A.F.; Naveiro, R.M.; Aoussat, A.; Reyes, T.; Kuo, T.C.; Smith, S. Systematic literature review of eco-innovation models: Opportunities and recommendations for future research. J. Clean. Prod. 2017, 149, 1278–1302. [Google Scholar] [CrossRef]
  11. Alvarez, J.C.; Hatakeyama, K.; Carvalho, M.; Marçal, R.C.; Inche, J.; de Melo, N. A model for renewable energy-based product innovation based on TRIZ methodology, exergy analysis and knowledge management: Case study. Energy Rep. 2022, 8, 1107–1114. [Google Scholar] [CrossRef]
  12. Wang, Z.; Subramanian, N.; Gunasekaran, A.; Abdulrahman, M.D.; Liu, C. Composite sustainable manufacturing practice and performance framework: Chinese auto-parts suppliers’ perspective. Int. J. Prod. Econ. 2015, 170, 219–233. [Google Scholar] [CrossRef]
  13. Angtuaco, D.S.; Barria, N.M.A.; Lee, J.M.C.; Tangsoc, J.C.; Chiu, A.S.F.; Mutuc, J.E. A redesign of the toothpaste tube using green QFD II for improved usability and sustainability. J. Clean. Prod. 2023, 393, 136279. [Google Scholar] [CrossRef]
  14. Bai, Z.; Mu, L.; Lin, H.C. Green product design based on the BioTRIZ multi-contradiction resolution method. Sustainability 2020, 12, 4276. [Google Scholar] [CrossRef]
  15. Hoogmartens, R.; van Passel, S.; Van Acker, K.; Dubois, M. Bridging the gap between LCA, LCC and CBA as sustainability assessment tools. Environ. Impact Assess. Rev. 2014, 48, 27–33. [Google Scholar] [CrossRef]
  16. Hosseinpour, A.; Peng, Q.; Gu, P. A benchmark-based method for sustainable product design. Benchmarking Int. J. 2015, 22, 643–664. [Google Scholar] [CrossRef]
  17. Khodadadi, A.; von Buelow, P. Design exploration by using a genetic algorithm and the Theory of Inventive Problem Solving (TRIZ). Autom. Constr. 2022, 141, 104354. [Google Scholar] [CrossRef]
  18. Zhou, C.C.; Yin, G.F.; Hu, X.B. Multi-objective optimization of material selection for sustainable products: Artificial neural networks and genetic algorithm approach. Mater. Des. 2009, 30, 1209–1215. [Google Scholar] [CrossRef]
  19. Mesa, J.A.; Kwak, M.; Shevchenko, T.; Esparragoza, I.E.; Bris, J. Proposing a carbon reduction engineering framework for product design: A multi-scenario perspective. Res. Eng. Des. 2025, 36, 17. [Google Scholar] [CrossRef]
  20. Russo, D.; Rizzi, C.; Montelisciani, G. Inventive guidelines for a TRIZ-based eco-design matrix. J. Clean. Prod. 2014, 76, 95–105. [Google Scholar] [CrossRef]
  21. Song, W.; Sakao, T. A customization-oriented framework for design of sustainable product/service system. J. Clean. Prod. 2017, 140, 1672–1685. [Google Scholar] [CrossRef]
  22. Tamasna, E.M.; Mazouzi, M.; Maskaoui, Z.E.; Fahmy, H.; Youssoufi, S.E. Natural process design and optimization method based on TRIZ/eco-innovation. In Proceedings of the 5th European International Conference on Industrial Engineering and Operations Management, Rome, Italy, 26–28 July 2022. [Google Scholar]
  23. Wu, Y.H.; Ho, C.C. Integration of green quality function deployment and fuzzy theory: A case study on green mobile phone design. J. Clean. Prod. 2015, 108, 271–280. [Google Scholar] [CrossRef]
  24. Younesi, M.; Roghanian, E. A framework for sustainable product design: A hybrid fuzzy approach based on quality function deployment for environment. J. Clean. Prod. 2015, 108, 385–394. [Google Scholar] [CrossRef]
  25. Ferrer, J.B.; Negny, S.; Robles, G.C.; Le Lann, J.M. Eco-innovative design method for process engineering. Comput. Chem. Eng. 2012, 45, 137–151. [Google Scholar] [CrossRef]
  26. El Ouardi, B.; Boungab, S. From fragmented to unified: Redefining eco-innovation for interdisciplinary climate solutions. Front. Sustain. 2025, 6, 1531747. [Google Scholar] [CrossRef]
  27. Ghane, M.; Ang, M.C.; Cavallucci, D.; Kadir, R.A.; Ng, K.W.; Sorooshian, S. TRIZ trend of engineering system evolution: A review on applications, benefits, challenges and enhancement with computer-aided aspects. Comput. Ind. Eng. 2022, 174, 108833. [Google Scholar] [CrossRef]
  28. Buzuku, S.; Shnai, I. A systematic literature review of TRIZ used in Eco-Design. J. Eur. TRIZ Assoc. Innov. 2017, 4, 20–31. [Google Scholar]
  29. Lee, C.K.; Tsang, Y.P.; Chong, W.W.; Au, Y.S.; Liang, J.Y. Achieving eco-innovative smart glass design with the integration of opinion mining, QFD and TRIZ. Sci. Rep. 2024, 14, 9822. [Google Scholar] [CrossRef] [PubMed]
  30. Makino, K.; Sawaguchi, M.; Miyata, N. Research on functional analysis useful for utilizing TRIZ. Procedia Eng. 2015, 131, 1021–1030. [Google Scholar] [CrossRef]
  31. Filippi, S.; Barattin, D. Definition and exploitation of trends of evolution about interaction. Technol. Forecast. Soc. Change 2014, 86, 216–236. [Google Scholar] [CrossRef]
  32. Mansoor, M.; Mariun, N.; AbdulWahab, N.I. Innovating problem solving for sustainable green roofs: Potential usage of TRIZ—Theory of inventive problem solving. Ecol. Eng. 2017, 99, 209–221. [Google Scholar] [CrossRef]
  33. Ghane, M.; Ang, M.C.; Sorooshian, S.; Gunasekaran, S.S.; Zaman, H.B.; Ng, K.W. Navigating patent trends through the lens of system components completeness in trend of engineering system evolution. J. Eng. Des. 2026, 37, 1465–1492. [Google Scholar]
  34. Altshuller, G. 40 Principles: TRIZ Keys to Technical Innovation; Shulyak, L., Rodman, S., Eds.; Technical Innovation Center: Worcester, MA, USA, 1998. [Google Scholar]
  35. Altshuller, G. The Innovation Algorithm: TRIZ, Systematic Innovation and Technical Creativity; Technical Innovation Center: Worcester, MA, USA, 1999. [Google Scholar]
  36. Rantanen, K.; Domb, E. Simplified TRIZ: New Problem-Solving Applications for Engineers and Manufacturing Professionals; CRC Press: Boca Raton, FL, USA, 2002. [Google Scholar] [CrossRef]
  37. Mann, D. Hands-on Systematic Innovation, 2nd ed.; IFR Press: London, UK, 2007. [Google Scholar]
  38. Ikovenko, S. Training materials for MA TRIZ Level 1. GEN3 Partners. 2009. Available online: https://scholar.google.com/citations?user=J747YCwAAAAJ&hl=en (accessed on 1 January 2025).
  39. Lu, T.H. Analysis of TRIZ Trends and Their Applications. Master’s thesis, National Tsing Hua University, Hsinchu, Taiwan, 2012. [Google Scholar]
  40. Chiu, S.C. Using Similarity Measures to Identify TRIZ Model of Solutions: Examples of Relevant Trends Identification. Master’s thesis, National Tsing Hua University, Hsinchu, Taiwan, 2013. [Google Scholar]
  41. Rau, H.; Wu, J.J.; Procopio, K.M. Exploring green product design through TRIZ methodology and the use of green features. Comput. Ind. Eng. 2023, 180, 109252. [Google Scholar] [CrossRef]
  42. Franceschini, F.; Rupil, A. Rating scales and prioritization in QFD. Int. J. Qual. Reliab. Manag. 1999, 16, 85–97. [Google Scholar] [CrossRef]
  43. Hunt, D.O. Using a 1-3-9 Ranking System in Selecting a Project. 2015. Available online: https://davidhuntpe.files.wordpress.com/2015/10/use-of-a-1-3-9-scoring-system-for-evaluating-project-alternatives.pdf (accessed on 20 April 2026).
  44. Fargnoli, M.; Salvatori, E.; Tronci, M. A green marketing and operations management decision-making approach based on QFDE for photovoltaic systems. Sustainability 2024, 16, 5941. [Google Scholar] [CrossRef]
  45. U.S. National Park Service. Laundry Practices and Water Conservation. 2018. Available online: https://www.nps.gov/articles/laundry.htm (accessed on 20 April 2026).
  46. Mifflin, M. High-Efficiency vs Traditional Washing Machine. 2022. Available online: https://www.thespruce.com/high-efficiency-washer-versus-traditional-washer-1908401 (accessed on 20 April 2026).
  47. Maytag. Parts of a Washing Machine—Diagram & Pictures. 2023. Available online: https://www.maytag.com/blog/washers-and-dryers/parts-of-a-washing-machine.html (accessed on 20 April 2026).
  48. Wu, Z. CN105133246A: Intelligent Ion Washing Machine. Google Patents. 2015. Available online: https://patents.google.com/patent/CN105133246A/en (accessed on 20 April 2026).
  49. Lu, D. CN102454083A: Method and Device for Recycling Gray Water from Washing Machine. Google Patents. 2012. Available online: https://patents.google.com/patent/CN102454083A/en (accessed on 20 April 2026).
  50. Chang, H.-T.; Chen, J.L. Eco-innovative examples for 40 TRIZ inventive principles. TRIZ J. 2003. Available online: https://the-trizjournal.com/eco-innovative-examples-40-triz-inventive-principle (accessed on 25 April 2026).
  51. Caplan, S.; Tschirhart, M.; Hipple, J. 40 Inventive Principles with Examples: Human Factors and Ergonomics. TRIZ J. 2010. Available online: https://www.metodolog.ru/triz-journal/archives/2010/02/03/index.html (accessed on 25 April 2026).
  52. Mann, D. 40 inventive (food) principles with examples. TRIZ J. 2011. Available online: https://www.academia.edu/65702777/40_Inventive_Food_Principles_With_Examples (accessed on 25 April 2026).
  53. Russo, D.; Spreafico, C. TRIZ-based guidelines for eco-improvement. Sustainability 2020, 12, 3412. [Google Scholar] [CrossRef]
  54. Lee, C.K.M.; Liang, J.; Yung, K.-L.; Keung, K.L. Generating TRIZ-inspired guidelines for eco-design using generative artificial intelligence. Adv. Eng. Inform. 2024, 62, 102846. [Google Scholar] [CrossRef]
Figure 1. Research framework.
Sustainability 18 06865 g001
Figure 2. Proposed green design methodology.
Sustainability 18 06865 g002
Figure 3. Function and attribute analysis format.
Sustainability 18 06865 g003
Figure 4. Function and attribute analysis of a chair.
Sustainability 18 06865 g004
Figure 5. Correlation of green features with product function and attributes.
Sustainability 18 06865 g005
Figure 6. Correlation of product functions and attributes with trends.
Sustainability 18 06865 g006
Figure 7. Function analysis diagram of a washing machine.
Sustainability 18 06865 g007
Figure 8. Excel tool: selection of functions and attributes.
Sustainability 18 06865 g008
Figure 9. Correlation matrix of green feature and product characteristics (functions and attributes) of the washing machine.
Sustainability 18 06865 g009
Figure 10. Ranked TRIZ trends for the washing machine (for green features 1 and 2, as an example).
Sustainability 18 06865 g010
Table 1. Potential challenges in design.
PaperPotential ChallengesRemarks
REAC
Alvarez et al. [11], Wang et al. [12] X The study is intended for a specific application and may require extensive customization before use.
Angtuaco et al. [13]XX The level of detail and amount of information required for comparative, impact, and simulation analysis would require significant resources and expertise.
Bai et al. [14] XThe paper lacks clear, detailed guidelines. Some users might take more time to figure out the different steps.
Hoogmartens et al. [15]X The level of detail in the required data is critical to achieving insightful results. Some companies may have limited resources to apply this in practice.
Hosseinpour et al. [16] X Expertise in axiomatic design will greatly help users to efficiently apply the methodology
Khodadadi & von Buelow [17], Zhou et al. [18]XX XA significant amount of data and computational resources are needed to generate meaningful results. It is mainly applicable for detailed design solutions.
Mesa et al.
[19]
XXX It needs to accommodate dynamic lifecycle data and a wider range of products and industries.
Russo et al. [20]X The provided tool is not easily accessible and may require additional resources to use.
Song & Sakao [21] X 10 methods and techniques were integrated into the proposed framework. Technical expertise is vital for effective implementation.
Tamasna et al. [22] X XThe paper lacks clear, detailed guidelines. An application in a case study could have helped visualize the methodology and validate the results.
Wu & Ho [23] X Expertise in fuzzy logic will greatly help users to efficiently apply the methodology
Younesi & Roghanian [24] X XThe hybrid fuzzy approach will require expertise in fuzzy logic to correctly replicate the methodology
Table 2. The 37 Evolutionary trends [37].
TimeSpaceInterface
Movement CoordinationSmart MaterialNest Up
Rhythm CoordinationSpace SegmentationDamping
NonlinearSurface SegmentationIncrease the Senses
Single-Double-Multiple (Similar)Geometric Evolution-LinearSingle-Double-Multiple (Similar)
Single-Double-Multiple (Different)Geometry Evolution-VolumeSingle-Double-Multiple (Different)
Single-Double-Multiple (Diverse)From Macro to NanoscaleSingle-Double-Multiple (Diverse)
Density ReductionReduce Energy Conversion
Increase AsymmetryMarket Evolution
Break the BoundariesDesign Points
Nest DownDegrees of Freedom
DynamicBreak the Boundaries
Object SegmentationTrim Design
Mesh and FiberControlling
Reduce Human Involvement
Design Rules
Increased Use of Color
Increase Transparency
Customer’s Eyes
Table 3. List of functions and attributes [40].
No.NameDescription
Functions1AbsorbThe phenomenon of a substance passing from one medium phase to another.
2AccumulateIncreased layer by layer.
56WetIncreased moisture content of the target substance.
Attributes1AccelerationThe rate of change of the velocity vector with respect to time. It describes how fast the velocity’s direction and magnitude change.
2AccuracyAccuracy is the difference between the average and the known true value.
75WeightThe measurement of the object after being subjected to universal gravitation.
Table 4. IF–THEN–BUT template.
IFTHENBUTInventive Principle (IP)
Green Feature (G)Improving ParameterWorsening Parameter
G1EP1EP2IP1
G2EP3EP4, EP4IP1, IP2, IP3
Table 5. List of green features, trends, and inventive principles.
Green FeatureTrend with RankInventive Principle
G1Rank 1: T9, T15, T23
Rank 2: T22, T38
IP1
G3Rank 1: T4, T34IP3
G10Rank 1: T9
Rank 2: T1
IP3
Table 6. Design solutions.
Design SolutionGreen FeatureTrendInventive PrincipleTrigger Solution
1G1T9IP1DA, DB
2G5T45IP3DC
3G10T51IP3DD
Table 7. Product portfolio.
Product PortfolioDesign SolutionSpecific Details
1DA + DBMaterial: Material 1
Structure: Structure 1
Function and Special Features: A, B, C
2DA + DB + DDMaterial: Material 2
Structure: Structure 1
Function and Special Features: A, B, D
Table 8. Criteria checklist for best sustainability performance [4].
Life Cycle PhaseCriteria Checklist
EngineeringDesign for manufacturing
Optimization of the materials input
Resource efficiency
ProductionSocial and ethical issues in the supply chain
Health
UseResource consumption in the production
Total cost of ownership
Serviceability
End of lifeReuse
Recycling
Material labeling
Table 9. Evaluation of alternatives.
Evaluation CriteriaWeightDesign 1Design 2Design 3
Design for manufacturing1139
Optimization of the materials input2133
Resource efficiency2133
Recycling2191
Material labeling2111
Total Score93525
Table 10. List of attributes of a washing machine.
ComponentsAttributes
MotorPower, Device Complexity, Maintainability, Reliability, Duration of Action by an Object
Inner Drum and Outer DrumVolume/Space, Shape, Surface smoothness, Weight, Strength, Homogeneity, Friction
Water Inlet and OutletPressure or Stress, Controllability, Compatibility
Detergent DispenserAmount of substance, Viscosity, Accuracy, Compatibility, Cleanliness
Control PanelControllability, Information, Level of Automation, Compatibility, Precision
CasingShape, Surface smoothness, Strength, Maintainability, Weight, Aesthetic
Table 11. IF–THEN–BUT template for washing machine.
IFTHENBUTInventive Principle
Green FeatureImproving ParameterWorsening Parameter
G1Reduce the number of components (EP10)Reduce structural strength (EP20)IP9, IP14, IP17, IP35
G2Reduce the weight and volume of the casing (EP2)Reducing the weight can compromise the strength of the casing to protect the internal components (EP20)IP8, IP31, IP35, IP40
G3
The size of the inner drum is fixed and regardless the laundry load, it will fill the required amount of water. Reducing the volume of the inner drum can reduce the water volume (EP8)Reducing the available volume for the inner drum will also reduce the laundry capacity increasing the number of load, and in effect, decreasing the efficiency (EP24)IP1, IP2, IP5, IP7, IP19, IP28
Reduce power consumption (EP18)Reduced number of loads leading to reduced laundry efficiency (EP45)IP2, IP14, IP15, IP28
G4Choose alternative material for plastic components that are prone to releasing harmful substance when heated. (EP27)Changing materials can create issues in manufacturing (EP41)IP4, IP24, IP28, IP40
G5Reduce the amount of contaminated water discharged after laundry (EP31)Reducing overall water consumption can reduce laundry load and affect efficiency (EP24)IP2, IP25, IP28, IP35
G6Modularize the components of the machine (EP32)Using recycled parts may cause production problems due to wear and tear (EP42)IP16, IP29, IP30, IP35, IP40
G7Replace and redesign components to incorporate parts that utilize renewable resources (EP45)The increasing complexity of the product and reducing ease of repair (EP36)IP17, IP28, IP30, IP35
G8Reduce complexity of system making it easy to assemble, disassemble and repair (EP336, EP41, EP45)Making the product easy to repair and disassemble will enable more users to do it on their own which increases risk of human error (EP38)IP1, IP2, IP4, IP6, IP9, IP10, IP13, IP22, IP28, IP35, IP24, IP25, IP26
G9 Increase durability of the casing and the overall product (EP13, EP35)Changing component characteristics will result in manufacturing challenges (EP41)IP3, IP4, IP5, IP10, IP28, IP35, IP40
Change the materials to increase the strength of components are not easily deformed (EP20)
G10Increase degree of product automation by customizing the settings to the need of the user (EP43, EP46)Increasing control complexity (EP46)IP1, IP3, IP4, IP7, IP10, IP13, IP17, IP28, IP35,IP37
Table 12. Green feature, trend, and inventive principle summary for washing machine.
Green FeatureTrend with RankInventive Principle
G1Rank 1: T42
Rank 2: T4, T9, T31, T36, T45
Rank 3: T3, T20, T34
IP9, IP14, IP17, IP35
G2Rank 1: T9
Rank 2: T44
Rank 3: T34
Rank 4: T37
Rank 5: T26, T27
IP8, IP31, IP35, IP40
G3Rank 1: T44
Rank 2: T9
Rank 3: T8
Rank 4: T34, T36
IP1, IP2, IP5, IP7, IP19, IP28;
IP2, IP14, IP15, IP28
G4Rank 1: T9, T44
Rank 2: T34
Rank 3: T3, T4, T5, T19, T22, T36
IP4, IP24, IP28, IP40
G5Rank 1: T44
Rank 2: T36
Rank 3: T9
Rank 4: T3, T34
IP2, IP25, IP28, IP35
G6Rank 1: T43
Rank 2: T1, T2, T4, T9, T12, T14, T16, T20, T40, T42, T48
IP16, IP29, IP30, IP35, IP40
G7Rank 1: T19, T22
Rank 2: T21
Rank 3: T20
Rank 4: T23, T36, T39
IP17, IP28, IP30, IP35
G8Rank 1: T17
Rank 2: T6, T18, T24
Rank 3: T7, T9, T14, T29, T32, T33, T43, T49, T51
IP1, IP2, IP4, IP6, IP9, IP10, IP13, IP22, IP28, IP35, IP24, IP25, IP26
G9Rank 1: T9
Rank 2: T8
Rank 3: T44
Rank 4: T31, T34, T42
IP3, IP4, IP5, IP10, IP28, IP35, IP40
G10Rank 1: T1, T2, T4, T9, T20, T40IP1, IP3, IP4, IP7, IP10, IP13, IP17, IP28, IP35, IP37
Table 13. Design solutions for washing machine.
GFTRIZ Trend/IPDesign Solution
G1 T42/IP35A1 Enable the machine to customize the detergent amount and moisture control for laundry load optimization.
G2 T9/IP31 B1 Reinvent the outer casing with a strong, non-hollow structure (like the concept of gyroid structure) to prevent interference with increased strength. The size of openings is minimal to ensure that no foreign objects can interfere with the machine’s function.
T36 /IP35 B2 Adopt lightweight and durable materials like carbon fibers and shape memory alloys (SMA) technology. SMA can be programmed to change shape in response to temperature changes, which can be triggered by the washing machine’s system. This can make the size of the inner drum dynamic to efficiently use resources.
G3 T8 /IP25 C1 Utilize thermoelectric modules (heat exchanger) to convert generated heat into electricity to make the device self-sustaining, or piezoelectric materials to convert mechanical stress to electricity.
T44 /IP17 C2 Transition to an intelligent ion washing machine for detergent-free and water-saving operation [48]
C3 Use a curved inner drum with segmented compartments for adjustable load capacity.
T44 /IP14 C4 Implement spray dispersion on the inner drum surface instead of a single inlet for detergent and water.
G4 T9 /IP40 D1 Substitute plastic components with fiber-reinforced polymer composite material for the shell.
G5 T44 /IP2E1 Incorporate electrolysis, ozone, or reverse osmosis systems for wastewater reduction.
G6 T1 /IP16 F1 Introduce interchangeable components A and B with a layered design for prolonged use. It can be applied to the drums and the casings, or the inner surface structure of the drum.
G7 T22 /IP17 G1 Design a water retrieval system to reuse relatively clean laundry water. Add a motor at the wastewater discharge point to direct the relatively clean laundry water to the water storage tank for reuse in the next laundry.
G8 T17 /IP6 H1 Consolidate component functions to simplify the system and enhance maintenance. For example, originally, one screw joined two parts; after modification, one screw joined three parts.
G9 T8 /IP40 I1 Enhance casing and drum durability with graphene composite material to prolong the use life of the machine.
T9 /IP40 I2 Introduce a type of smart material called electrospun nanofibers. This material is strong, flexible, and resistant to deformation, and can be used to create a filter system that will improve the machine’s efficiency and durability.
G10 T1 /IP35 J1 Develop a spherical drum washing machine with multi-axis rotation for efficient cleaning using less water and detergent, incorporating a feedback system for monitoring and adjustments.
Table 14. Washing machine: product portfolio.
Product PortfolioDesign SolutionSpecific Details
1D1+G1Material: The shell is made of polymer carbon fiber composite material
Structure: Same as a generic washing machine
Function and special value: A wastewater tank is added inside so that the relatively clean gray water can be guided and stored through the water pipe, and then used for the next cleaning, as shown in the figure below, representing a washing machine with a water recycling system [49]
Sustainability 18 06865 i001
2C1+H1Material: Same as a generic washing machine
Structure: Same as a generic washing machine
Function and special value: Add a thermoelectric module, use the heat generated during operation to generate electricity, and reduce the electricity needed from the direct supply of power. Then, redesign the washing machine’s structure to merge certain components, such as screws and tubes.
Table 15. Evaluation criteria for washing machine designs.
Evaluation CriteriaWeightExisting DesignDesign 1Design 2
Optimization of the materials input2131
Resource efficiency2199
Serviceability2111
Reuse 2191
Recycling2199
Total Score106242
Disclaimer/Publisher’s Note: The statements, opinions and data contained in all publications are solely those of the individual author(s) and contributor(s) and not of MDPI and/or the editor(s). MDPI and/or the editor(s) disclaim responsibility for any injury to people or property resulting from any ideas, methods, instructions or products referred to in the content.