


Abstract
Announcements of major transport infrastructure can reorganize land markets long before construction begins, as expectations are capitalized into prices and building decisions—with direct implications for sustainable territorial planning. This study examines the real estate response to the 2024 announcement of the Torquemada airport project in the Valparaíso Region, Chile. We assemble a high-resolution microterritorial panel at the block–semester–land-use level, integrating three Chilean administrative registers: the SII cadastre (over 100 million construction lines across 16 semestral snapshots, 2018–2025), the F2890 conveyance records (1.49 million geolocated transactions), and the daily Unidad de Fomento series. We estimate a multi-outcome spatial difference-in-differences design, complemented by an event study, land-use heterogeneity analysis, local indicators of spatial association, placebo tests, spatial-weight sensitivity analysis, and the heterogeneity-robust Callaway–Sant’Anna estimator. We find a robust increase in new-parcel construction in the zone of influence—identified by an annual event study against never-treated controls whose pre-announcement coefficients are small and trendless, in sharp contrast to the uniformly positive pre-trends of the expansion and aggregate-stock series—together with selective appreciation of non-residential uses and no detectable effect on housing value. The expansion and aggregate-stock components are not separately identified: their pre-announcement trends are strongly non-parallel, so the corresponding fixed-effects coefficients are read as design-conditional associations. The evidence supports an activation of the extensive margin (new-parcel building) rather than a recomposition away from densification. We read the evidence as the anticipatory footprint of the announcement rather than a point causal effect. Detecting this footprint before construction enables anticipatory value capture and sprawl-containment policy while the planning window remains open.
1. Introduction
The relationship between transport infrastructure and land markets is a classic theme in urban economics that retains notable empirical relevance for sustainability science, where the environmental footprint of airport infrastructure is now an active research agenda [1]. The theoretical intuition is direct: a new facility modifies the relative accessibility of locations, and that accessibility is capitalized into land prices and into the building decisions of agents [2,3]. Less direct, and the focus of this work, is the timing and form of this capitalization. A substantial portion of the adjustment may anticipate the announcement of the works, long before the first cubic meter of concrete is poured, because durable-asset markets incorporate expectations about future flows [4]. Understanding this anticipation is essential for sustainable territorial planning, since the window between announcement and operation is precisely when public instruments for value capture and land-use regulation remain available.
The Chilean case offers an underexplored setting for studying this anticipation dynamic. Most evidence on the real estate impacts of airports comes from cities in the global North [5,6,7], where the availability of transactional microdata has allowed identification of both positive proximity effects (accessibility) and negative ones (noise and externalities). In the global South, the evidence is scarce, despite urban and logistic expansion dynamics that are frequently more intense [8,9]. Chile, however, possesses an administrative data infrastructure of unusual quality: the real estate cadastre of the Internal Revenue Service (SII) and the notarial conveyance records allow reconstruction, at the resolution of the census block, of both the built stock and the flow of transactions over time.
This work exploits that infrastructure to study the announcement of the Torquemada airport project, in the Valparaíso Region, formalized by the government in the first semester of 2024. Rather than asking whether the announcement caused a measurable increase in aggregate real estate activity—a causal claim the available design cannot sustain, as we show transparently below—we frame the study as an anticipation analysis and ask a more answerable pair of questions. First, what is the spatio-temporal footprint of the announcement on the composition of building activity? Does development shift between parcel types, land uses, and locations in the zone of influence? Second, does that footprint exhibit a structured, internally coherent pattern across economic land uses and across territories that allows inference of the underlying mechanism? These questions concern the direction and selectivity of market reorganization, which our evidence identifies robustly, rather than the magnitude of an aggregate treatment effect, which it does not.
To answer these questions, we build a high-resolution microterritorial panel integrating three sources. The SII cadastre, read across its sixteen semestral snapshots between 2018 and 2025, provides the built stock and, through the year of each construction line, the flow of new buildings, distinguishing new parcels from expansions of pre-existing parcels. The F2890 form provides 1.49 million conveyance records geolocated at the block level, converted to Unidades de Fomento using the indexer’s daily series. On the resulting panel—2.49 million block–semester–land-use cells—we estimate a multi-outcome spatial difference-in-differences design, complemented by an event study, a land-use heterogeneity analysis, local indicators of spatial association, and a set of placebo tests.
The contribution is threefold. Methodologically, we propose a replicable pipeline that resolves several non-trivial semantic problems of the Chilean cadastre—in particular, the distinction between stock and flow, and the classification of construction activity by parcel type—and that articulates three heterogeneous administrative registers into a coherent panel. Substantively, our central finding is a compositional one: following the announcement, building activity in the zone of influence is associated with a robust increase in new-parcel construction—clean against never-treated controls—while the decline in expansions is not separately identified; appreciation is concentrated in non-residential land uses, and a negative spatial spillover coincides with a redistribution of activity rather than its addition. The new-parcel and non-residential-appreciation signals are robust across every specification we estimate, whereas the expansion and aggregate-stock magnitudes are not. By contrast, and we state this plainly, the magnitude of any aggregate increase in activity is not robust: it attenuates to statistical insignificance once the comparison is restricted to never-treated controls. Regarding inference, we are therefore deliberately transparent: parallel-trends tests are rejected for several outcomes, so the estimated coefficients are reported as design-conditional associations, and the paper’s claim is about the anticipatory footprint of the announcement—its direction and selectivity—not about a point causal effect on the level of activity. Our design is quasi-experimental, and the term “effect” is used throughout in a predictive, compositional sense, not a structural-causal one. This delimitation is a feature, not a weakness: it is precisely the kind of early, pre-construction reorganization that sustainable territorial governance needs to detect.
The relevance for sustainability is direct. Land-use change around new transport nodes is among the most consequential and least reversible decisions a territory makes: it shapes commuting patterns, the spatial distribution of environmental externalities, and the long-run viability of compact, equitable urban form [10]. When the market reorganizes during the announcement window—before any environmental-impact instrument or land-use plan is updated—the public sector risks losing its capacity to steer development toward sustainable outcomes and to capture the land-value increments that infrastructure investment generates. Documenting the timing, direction, and land-use selectivity of this early reorganization is, therefore, a precondition for anticipatory, evidence-based territorial governance, and the low-cost monitoring infrastructure we develop is designed to serve exactly that purpose. We emphasize from the outset that our claim concerns the direction and selectivity of the anticipatory footprint, not a point estimate of its aggregate magnitude; the latter is not robustly identified by the available design.
The remainder of the article is organized as follows. Section 2 reviews the literature on the real estate impacts of airport infrastructure, the use of cadastral microdata, and recent advances in spatial difference-in-differences. Section 3 details the data, panel construction, and empirical strategy. Section 4 presents the results. Section 5 discusses them. Section 6 develops sustainability implications. Section 7 sets out the limitations. Section 8 concludes the paper.
2. Literature Review
2.1. Airports and Real Estate Markets: Accessibility Versus Externality
The literature on the effects of airport infrastructure on real estate prices turns on a tension between two forces of opposite sign. Proximity to an airport raises a location’s accessibility to national and international markets, making it more attractive for commercial, logistic, and service activities; this accessibility is capitalized positively into land value [4,11], and recent in-journal evidence confirms that aviation freight drives economic activity in spatial-econometric settings [12]. Working against it, airport operation generates negative externalities—noise, air pollution, road congestion—that depress residential value nearby [5,7]. Which force dominates is ambiguous a priori and hinges on the land use and the distance considered.
The seminal work of McMillen [5] on the expansion of Chicago’s O’Hare airport uses a hedonic approach to show that the price gradient with respect to noise exposure is markedly negative for housing, with discounts that intensify with proximity to approach paths. Tomkins et al. [6], for Manchester airport, find an analogous pattern and estimate noise-discount elasticities on the order of nine percent. The meta-analytic review of Nelson [7] consolidates this evidence and reports a mean airport-noise discount in the range of 0.5 to 1.1 percent per decibel above the annoyance threshold. These studies share a methodological feature: they concentrate on operating airports and on the residential effect of noise, leaving the accessibility effect on non-residential uses in the background.
A more recent body of literature shifts the focus toward the accessibility effect and toward commercial and logistic uses. Green [11] documents that airport proximity is a robust predictor of metropolitan employment growth, suggesting that the accessibility force dominates in the economic aggregate even when the noise externality dominates in the adjacent residential submarket. This distinction is central to the present work because the cadastral design allows separation of effects by economic land use and, therefore, direct observation of whether appreciation concentrates in the uses for which theory predicts positive capitalization of accessibility.
2.2. Anticipation and Capitalization of Expectations
A recurrent limitation of classical hedonic literature is that it estimates effects on already-built infrastructure, conflating the effect of the physical asset with that of the expectation that preceded it. Asset-pricing theory suggests, in contrast, that in efficient markets the value of an announced facility should be capitalized at the moment the information becomes credible, not at the moment of inauguration [4]. Event studies on transport-infrastructure announcements—particularly on urban rail extensions [13,14]—confirm that a substantial fraction of the price adjustment occurs in the announcement and planning window, before commissioning. Gibbons and Machin [14], for the British case, show that rail accessibility is capitalized in advance and that ignoring the announcement phase biases the estimate of the total effect downward.
This literature has a direct and problematic methodological implication for difference-in-differences designs: if agents anticipate treatment, the divergence between treated and controls begins before the nominal treatment date, which manifests empirically as a violation of parallel trends in the prior periods [15]. Anticipation is not, in this framework, a data defect but a feature of the economic phenomenon: precisely because the market works, the effect is brought forward. Recognizing this is essential for correctly interpreting the results of infrastructure events and bears directly on sustainability, since premature capitalization can foreclose planning options before authorities react.
Infrastructure information typically reaches markets in stages—rumor, pre-feasibility and environmental study, and formal announcement—each a potentially distinct shock. Asset-pricing logic implies that capitalization begins at the first credible signal rather than at the formal date, so a single nominal treatment date understates how early the response starts. We read the significant 2022S1 temporal placebo (Section 4.5) as consistent with a pre-feasibility-stage signal roughly two years before the 2024 formal announcement; semestral cadastral data cannot date the precise onset of each stage—a limitation we make explicit in Section 7—but this staged-information framework is exactly what the pre-announcement divergence in the event study reflects.
2.3. Cadastral Microdata and High-Resolution Panels
The use of administrative cadastral registers for real estate analysis has grown steadily, driven by the digitization of parcel registries and the availability of fine geographic identifiers [16,17]. Compared with surveys or real estate-portal listings, cadastres offer census coverage, temporal consistency, and a level of spatial disaggregation that permits control of unobserved heterogeneity through fixed effects of very small units. Their counterpart is semantic difficulty: cadastres are designed for tax, not analytical, purposes, and their variables require careful interpretation. A central problem, which we address explicitly in Section 3, is the distinction between the built stock that a cadastre reports in each snapshot and the flow of new buildings that the researcher seeks to measure; summing stocks across snapshots does not measure construction activity but mechanically over-represents it.
In the Chilean case, the SII cadastre has been used to study logistic sprawl [9], the segmentation of housing submarkets [18], and land-price dynamics. The present work extends that use by combining the cadastre with notarial conveyance records (form F2890), which provide the effective transacted price, a variable the cadastre lacks. This combination allows simultaneous observation of physical supply (construction) and revealed demand (transactions) at the block level, a resolution uncommon in the international literature.
2.4. Spatial Difference-in-Differences and Geographic Machine Learning
Methodological advances in difference-in-differences over the last decade have transformed empirical practice. The critique of two-way fixed-effects estimators with staggered treatment [19,20] and the heterogeneity-robust estimators [21,22] has established new standards of transparency. Particularly relevant for this work is the literature on sensitivity to parallel-trends violations: Rambachan and Roth [15] propose an inference framework that, instead of assuming parallelism, reports bounds on the effect under bounded deviations from the assumption, offering an honest route for working with designs whose prior trends are not perfectly flat.
The spatial dimension introduces additional complications. The spatial autocorrelation of outcomes [23,24] violates the assumption of independence across units and, more importantly, generates spillovers between treated and controls that can bias estimates if controls are contiguous to treated units. Recent applications published in this journal estimate the direct and spillover effects of transport infrastructure under multiple spatial-weight matrices, documenting that sign and significance can be sensitive to the weighting scheme adopted [25,26]. Spatial-econometric models [24] and local indicators of spatial association [27] allow diagnosis and, partially, modeling of this structure. The present work incorporates hybrid spatial weights—geographic and economic-gravitational—to capture spillovers and uses the local Moran statistic to characterize activity clusters. Finally, the growing application of geographic machine learning to real estate markets [17,28] offers predictive tools complementary to causal analysis; we report a gradient-boosting model as a reference for the explanatory capacity of geographic variables.
3. Materials and Methods
3.1. Data Sources
The analysis rests on three Chilean administrative registers, integrated at the census-block level. Table 1 summarizes their analytical role, level of disaggregation, and temporal coverage. The pipeline was implemented in Python 3.12 (pandas, polars, geopandas, libpysal, linearmodels), and the code is available as indicated in the Data Availability Statement.
Table 1.
Summary of administrative data sources, analytical roles, and temporal coverage.
3.2. From Cadastral Stock to Construction Flow
The SII cadastre reports, in each semestral snapshot, the accumulated built stock up to that date: a property built in 2017 appears with the same square meters in every later snapshot. Aggregating stock across snapshots therefore over-represents activity mechanically and leaves almost no temporal variance, which would invalidate a panel design. We measure construction activity as a flow in two complementary ways: (i) from the construction year of each line, attributing square meters to the year their line originates; and (ii) as the semestral variation in the stock, Δstock. The latter is valid as a flow only if snapshots are synchronic (point-in-time); an explicit diagnostic confirms this condition, as no snapshot contains lines dated after its own date.
3.3. New Parcels Versus Expansions
For each parcel, we compute the year of its first construction line; a line dated at that minimum signals a new parcel, while a later line signals an expansion of a pre-existing one. Formally, for a construction line ℓ of parcel p with construction year t:
Here, t(p, ℓ) denotes the construction year recorded on line ℓ of parcel p, and min over k ∈ p of t(p, k) is the earliest construction year recorded for that parcel; a line dated at that minimum identifies a new parcel and any later line an expansion.
NewParcelp,ℓ = 1 if tp,ℓ = mink∈p tp,k; expansion otherwise
Equation (1) makes the distinction operational—new parcels and expansions respond to different incentives—and lets us observe whether the announcement is associated with extensive (new parcels) or intensive (densification) development. Over 2018–2025, the cadastre records 60.0 million m2 of new construction (41.5 million on new parcels, 18.6 million on expansions) across 831,521 new parcels.
3.4. Transactions, Currency Conversion, and Coverage
The F2890 form records the total value of each sale (land plus construction), expressed indistinctly in Unidades de Fomento (UF) or pesos. We use the UF amount when valid (100–100,000 UF) and otherwise convert the peso amount with the indexer’s value on the deed date; invalid amounts are dropped. Of 2.96 million records extracted, roughly half were peso-denominated and converted with the daily series; after value and regional filtering, the panel retains 1.49 million geolocated deeds (median 1544 UF; P10–P90: 284–5590 UF). Each F2890 record corresponds to the conveyance of an individual property unit—a single rol (an apartment or a standalone parcel)—not the aggregate value of a multi-unit building: the deed-value distribution (median 1547 UF; P10–P90: 390–8065 UF; 86.7% of block–semester cells below 6000 UF) and the median of a single transaction per block–semester cell are magnitudes characteristic of individual units, so the block-level median is not mechanically driven by the number of apartments in a building.
One treatment decision is consequential: the transacted value is defined only in block–semester cells with at least one deed, and cells without a transaction are kept as missing rather than imputed to zero. Imputing zero would conflate the extensive margin (was there a sale?) with the intensive margin (at what value?) and inject a large mass of structural zeros that would bias the price estimate. This reduces the price sample from 934,000 to 123,319 block–semester observations but ensures the price coefficient is estimated on real transactions. Finally, the parcel shapefile extends only to 2022, so blocks first appearing in 2023 cannot be georeferenced; coverage nonetheless reaches 96.0% of panel blocks, and the 3948 non-georeferenced blocks (3.9% of the post-2023 set) are excluded only from analyses requiring coordinates—a marginal, transversal coverage gap rather than an evident selective bias.
3.5. The Resulting Panel and Megaregional Design
The master panel integrates the three sources into 2.49 million block–semester–land-use cells, over 59,277 georeferenced blocks, and sixteen semesters. The assignment of each block to its role in the megaregional design produces 9533 direct-treatment blocks, 15,450 metropolitan logistic treatment blocks, 4999 metropolitan-residential treatment blocks, 8154 control blocks in Valparaíso, and 21,141 control blocks in Biobío.
The zone of influence is defined in a multilevel manner. The direct-treatment zone comprises Valparaíso Region blocks within a thirty-kilometer radius of the site. Motivated by prior evidence on the logistic integration between the Metropolitan Region and the ports of Valparaíso [9], we additionally define two megaregional treatment zones in the Metropolitan Region: municipalities of logistic-industrial vocation (Pudahuel, Quilicura, Renca, Maipú, Cerrillos) and high-income residential municipalities (Las Condes, Vitacura, Lo Barnechea, Providencia, Ñuñoa, La Reina). The substitution hypothesis holds that, if the new airport reorients logistic functions toward the coastal macrozone, the metropolitan logistic municipalities that depended on proximity to Santiago’s airport could experience relative deceleration. Control municipalities are the Valparaíso Region fringe outside the direct radius and the Biobío Region (Greater Concepción) as a pure, geographically disconnected control: a coastal, port-industrial metropolitan area structurally comparable to Valparaíso—with its own pre-existing regional airport (Carriel Sur)—yet located roughly 480 km from the Torquemada focus and therefore unexposed to the announcement, its pre-existing airport posing no confound because it undergoes no contemporaneous shock and is absorbed by the block fixed effects. The intermediate regions (O’Higgins, Maule) are deliberately excluded because, lying along the Santiago–Valparaíso logistic corridor, they are at risk of indirect exposure through the megaregional substitution channel, which would contaminate the never-treated counterfactual. Figure 1 presents the experimental design.
Figure 1.
Megaregional experimental design. Each point is a georeferenced census block: direct-treatment blocks within 30 km of the Torquemada site (Valparaíso Region) and control blocks in the Valparaíso fringe, the Metropolitan Region, and the Biobío Region. The dashed and dotted circles mark the 30 km treatment radius and the 120 km economic half-life. The star marks the Torquemada site. This is a full-page portrait map; it should be reproduced at full column or page width without rescaling that would compress its vertical extent.
3.6. Empirical Strategy
3.6.1. Multi-Outcome Spatial Difference-in-Differences
Let yb,s be outcome y observed in block b in semester s, indexing the six outcomes analyzed: built-stock variation, annual construction flow, number of transactions, transacted value, new-parcel construction, and expansions. All outcomes are expressed in the transformed natural logarithm, ln(1 + y), to accommodate zeros and attenuate skewness. The baseline difference-in-differences specification with two-way fixed effects is:
yb,s = βdir(Dirb·Posts) + βlog(Logb·Posts) + βres(Resb·Posts) + γ Sb,s + δ COVIDs + αb + λs + εb,s
In Equation (2), Dir·Post is the direct-treatment interaction with Posts = 1{s ≥ 2024S1}; Log·Post and Res·Post are the analogous interactions for the metropolitan logistic and residential treatments; Sb,s is the spatial-spillover term defined below; COVIDs is an indicator for the 2020S1–2021S2 semesters; αb and λs are block and semester fixed effects; and εb,s is the error term. The primary coefficient of interest is βdir. Standard errors are clustered at the block level to accommodate within-unit serial correlation. Identification of βdir rests on the parallel-trends assumption, evaluated empirically in the event study.
The independent variables are measured as follows. Dir·Post is a dummy equal to one for blocks within 30 km of the Torquemada site and semesters s ≥ 2024S1; Log·Post and Res·Post are the analogous treated-municipality dummies for the metropolitan logistic group (Pudahuel, Quilicura, Renca, Maipú, Cerrillos) and the high-income residential group (Las Condes, Vitacura, Lo Barnechea, Providencia, Ñuñoa, La Reina). S(b, s) is the spatial-spillover exposure: the convex combination (α_geo = 0.6) of the row-standardized k-nearest-neighbors spatial lag of the treatment indicator and the exponential economic-distance impedance to Torquemada (120 km half-life), activated in the post period. COVID is a dummy for 2020S1–2021S2, and α_b, λ_s are block and semester fixed effects. All outcomes enter as ln(1 + y).
3.6.2. Event Study
To examine the temporal dynamics of the effect and to test the parallel-trends assumption, we estimate an event-study specification that replaces the binary post-treatment indicator with a set of time-relative indicators:
yb,s = Στ≠−1 βτ(Dirb·1{s = τ}) + γ Sb,s + δ COVIDs + αb + λs + εb,s
Here, τ indexes the semesters relative to the announcement, and τ = −1 is omitted as the reference. Under parallel trends, the βτ for τ < −1 should be statistically indistinguishable from zero. We formalize the parallel-trends test through a joint Wald statistic over the pre-treatment coefficients:
where pre is the vector of pre-treatment time-relative coefficients. Rejection of the null constitutes evidence against parallelism and, therefore, against the strict causal interpretation of the difference-in-differences coefficient.
3.6.3. Land-Use Heterogeneity
To examine whether the effect differs across land uses, we estimate the baseline specification separately for each economic land use u and a single outcome at a time (built-stock variation or transacted value):
yb,s(u) = βdir(u)(Dirb·Posts) + βlog(u)(Logb·Posts) + βres(u)(Resb·Posts) + Xb,s θ + αb + λs + εb,s
All land uses are estimated with the same two-way fixed-effects specification, without a level macroeconomic control. The semester fixed effects λ_s absorb every nationally common macroeconomic shock (the mortgage rate, the IMACEC activity index, the copper-price cycle, inflation), so a level macro control is redundant and, being constant across blocks within each semester, is mechanically collinear with λ_s; we verify that adding the semestral mortgage rate to the residential equation leaves the coefficient of interest unchanged to six decimals (β = −0.006481) and that the term is dropped as collinear. The specification is therefore uniform across uses by construction.
3.6.4. Spatial Spillovers and Autocorrelation
Geographic proximity between treated and control blocks generates spillovers that can contaminate estimates. We model the spillover through a spatial-exposure term built from hybrid weights combining a geographic and an economic-gravitational component. The geographic component is the row-standardized k-nearest-neighbors matrix Wknn, whose spatial lag of the treatment indicator measures how surrounded block b is by treated neighbors. The economic component defines each block’s exposure to the treatment focus through an exponential impedance function over the distance d (in km) to the Torquemada site:
so that exposure halves at the 120 km half-life. The spatial-spillover regressor that enters the baseline equation is the convex combination of the two components, activated in the post-announcement period:
with geographic weight αgeo = 0.6 in the baseline. The sensitivity of the results to αgeo and dhalf is examined in Section 4.6 and echoes recent multi-matrix spatial analyses in this journal [29]. Figure 2 illustrates the decay of the economic component with distance. To characterize the spatial autocorrelation of outcomes, we use the global Moran statistic,
and its local decomposition through the local indicators of spatial association [27]:
wbecon = exp(−φ db), φ = ln(2)/dhalf, dhalf = 120 km
Sb,s = [αgeo(Wknn Dir)b + (1 − αgeo) wbecon] · Posts, αgeo = 0.6
I = (n/ΣiΣj wij) · (ΣiΣj wij zi zj/Σi zi3), zi = yi − ȳ
Ii = zi Σj wij zj/(Σi zi3/n)
Figure 2.
Decay of economic exposure with distance to the treatment focus, with a 120 km half-life. Reference values are highlighted at Torquemada, the metropolitan logistic corridor, and the Biobío control region.
Equation (9) classifies each block into one of four association quadrants—high-high (HH), low-low (LL), high-low (HL), and low-high (LH)—with significance evaluated by permutation.
3.6.5. Placebo Tests, Robustness, and Predictive Reference
Robustness is evaluated through several complementary exercises. First, placebo tests: temporal tests re-estimate the baseline, assigning fictitious-treatment dates within the pre-announcement period (2019S1 and 2022S1); a placebo coefficient significantly different from zero indicates non-parallel prior trends. Spatial tests randomly permute the treatment label across blocks. Second, we assess the sensitivity of the spatial-spillover specification to the two free parameters of the hybrid weights—the geographic weight αgeo and the half-life bandwidth dhalf—re-estimating the construction equation across the resulting nine combinations. Third, we re-estimate the full design under an alternative treatment date (2022S1) to probe whether the results are an artifact of the chosen announcement semester.
Fourth, and most importantly for identification, we implement the Callaway and Sant’Anna [21] heterogeneity-robust difference-in-differences estimator. Because the design contains a single treatment cohort (all directly treated blocks become treated at 2024S1), the group-time average treatment effect ATT(g, t) reduces to a series of clean comparisons between the treated cohort and the never-treated control blocks (the Valparaíso fringe and Biobío), using the period immediately preceding the announcement as the baseline:
ATT(g, t) = E[Yt − Yg−1|G = g] − E[Yt − Yg−1|never-treated], g = 2024S1
Equation (10) defines the estimand. With a single treatment cohort, the TWFE estimator is not subject to the negative-weighting problem that arises under staggered adoption [19,20]; the relevant concern here is instead the composition of the control pool. The Callaway–Sant’Anna estimator addresses this directly by restricting the comparison to never-treated units, thereby excluding the megaregional treatment groups—which are not never-treated controls—from the counterfactual. The contrast between the TWFE and ATT(g, t) estimates is therefore diagnostic of whether the TWFE coefficient reflects a clean treatment effect or absorbs differences relative to improperly specified controls.
As a reference for the explanatory capacity of geographic variables, we estimate a gradient-boosting model over trees to predict transacted value, with a temporal train/test split (70/30) to avoid information leakage [26]. This component is deliberately predictive and not causal.
4. Results
4.1. Multi-Outcome Difference-in-Differences Estimates
Table 2 and Figure 3 report the estimates of the baseline specification, Equation (2), for the six outcomes. The pattern is clear and economically coherent. New-parcel construction activity in the direct-treatment zone is significantly higher after the announcement (βdir = 0.094, p < 0.01), while expansion activity on pre-existing parcels is significantly lower (βdir = −0.123, p < 0.01). The built-stock variation shows a positive and highly significant coefficient (βdir = 0.273, p < 0.01). Together, under two-way fixed effects, the new-parcel and expansion coefficients suggest a recomposition of construction activity. As Section 4.6 shows, however, only the new-parcel increase survives the never-treated comparison with trendless pre-coefficients; the expansion decline does not. Its pre-announcement trend is uniformly positive and significant, so we revise the reading from a symmetric recomposition to an activation of the extensive margin (new-parcel building), and we treat the aggregate built-stock coefficient, whose magnitude is likewise not robust, as a design-conditional association. We therefore read the TWFE estimates throughout as design-conditional associations and defer the causal assessment to the robustness analysis.
Table 2.
Multi-outcome spatial difference-in-differences estimates. Block-clustered standard errors. *** p < 0.01, ** p < 0.05, * p < 0.10.
Figure 3.
Direct-treatment coefficients by outcome, with 95% confidence intervals. Significant coefficients are shown in red and non-significant coefficients are shown in gray. The activation of the extensive margin—the increase in new-parcel construction—is the pattern that survives the never-treated robustness analysis in Section 4.6; the decline in expansions is not separately identified.
In contrast with the physical-supply response, revealed demand shows no effect. The median transacted value does not respond detectably to the announcement (βdir = −0.049, n.s.), nor does the number of deeds (βdir = 0.006, n.s.). The absence of a price effect, now estimated on real transactions after excluding structural zeros, is a clean result: the announcement is associated with a recomposition of new building without that translating, in the observed window, into a detectable capitalization in the transacted price.
The two flow measures of construction warrant a clarifying note, since their direct-treatment coefficients differ in sign. The semestral stock variation captures the change in built stock observed between consecutive snapshots and rises in the treated zone (βdir = 0.273). The annual-flow measure, derived from the construction year recorded on each line of the most recent snapshot, instead shows a small negative coefficient (βdir = −0.049, p < 0.10). The two are not contradictory but measure the flow on different time stamps: the line-year measure attributes area to the calendar year the cadastre assigns to the construction line, which, for recent activity, is frequently backdated or still in the process of registration. The negative line-year coefficient is therefore most plausibly an artifact of registration lag in the newest, post-announcement lines. We acknowledge that we cannot empirically validate this lag with the data at hand (a formal validation would require comparing the distribution of registration-year against snapshot-year across periods, which is beyond the present scope and is left for future work). Accordingly, our inference relies on the stock-variation measure and on the new-parcel/expansion decomposition, which share no such temporal stamping ambiguity; the line-year flow is reported in Table 2 for transparency only and should be read as corroborating context, not as a primary outcome.
The megaregional coefficients provide the most novel dimension. The Metropolitan Region’s logistic municipalities show negative and significant coefficients in construction (βlog = −0.101, p < 0.01) and in transacted value (βlog = −0.088, p < 0.01). The premium metropolitan-residential municipalities exhibit a marked contraction of transacted value (βres = −0.380, p < 0.01). This pattern is consistent with the megaregional substitution hypothesis: the anticipated reorientation of functions toward the coastal macrozone is associated with a relative deceleration of the metropolitan markets linked to Santiago’s airport accessibility.
4.2. Event Study: Evidence of Market Anticipation
The event study serves a dual purpose: it tests the parallel-trends assumption and, in doing so, directly documents the anticipation that motivates the study. Figure 4 presents the event study for the transacted value. The Wald tests on the pre-treatment coefficients reject parallelism for both outcomes examined: for transacted value, W = 29.94 with eleven degrees of freedom (p = 0.002); for built-stock variation, W = 780.80 with eleven degrees of freedom (p < 0.001). We read these rejections not merely as a limitation but as a substantive result: under the expectations-capitalization framework, a market that begins to diverge before the formal announcement is anticipating the project during its study and pre-feasibility phases—exactly the phenomenon this paper sets out to characterize.
Figure 4.
Event study for the log transacted value. Coefficients with 95% confidence intervals; τ = −1 is the reference. Pre-announcement coefficients deviate from zero, indicating a persistent level difference that is itself evidence of market anticipation. The Wald test rejects strict parallelism.
The shape of the prior trajectory is analytically informative. For transacted value, the prior coefficients are all negative and relatively stable (between −0.04 and −0.16), a pattern consistent with a persistent level difference between treated and controls rather than a divergent, accelerating trend—the treated coastal blocks simply sit at a lower transacted-value level throughout. The post-announcement coefficients are negative and significant in the first three semesters but lose significance at the fourth. Reported with their 95% confidence intervals, the post-treatment estimates carry intervals of [−0.570, −0.067], [−0.561, −0.057], and [−0.538, −0.032], with the fourth straddling zero at [−0.490, +0.015]. They do not exhibit the growing effect pattern that progressive price capitalization would predict; if anything, they attenuate. This reinforces the central reading: the announcement coincides with a change in the composition of activity without producing a detectable capitalization in the price level. Because strict parallelism does not hold, we do not interpret the difference-in-differences coefficients as point causal effects; we use them, together with the robustness analysis below, to characterize the direction and selectivity of the anticipatory footprint.
The negative post-announcement coefficients in the aggregate event study appear, at first, to contradict the positive appreciation documented for non-residential uses in Section 4.3. The resolution lies in the differential composition of the transacted-value sample across specifications. The event-study specification of Equation (3) pools all land uses and incorporates the spatial-spillover term, which captures the negative exposure of neighboring blocks; the resulting aggregate coefficient reflects the net of positive non-residential appreciation in the direct-treatment zone and the negative spillover in surrounding areas. By contrast, the land-use heterogeneity analysis of Equation (5) estimates separate equations for each use, removing the spillover term and thereby isolating the within-use effect. The residential coefficient in that specification is null (β = −0.006, n.s.), not negative and large, so there is no dominant negative residential effect that would offset the non-residential appreciation. The negative aggregate event-study coefficients are therefore driven primarily by the spatial-spillover term and by the lower baseline transacted-value level of the direct-treatment blocks documented in the pre-treatment period, not by a post-announcement contraction of residential value.
4.3. Land-Use Heterogeneity
Figure 5 and Table 3 report the effect’s heterogeneity by economic land use. The profile is markedly differentiated and constitutes, in our judgment, the most suggestive empirical finding. In the construction dimension, residential use shows a strong and significant contraction (β = −0.122, p < 0.01), as does warehousing (β = −0.020, p < 0.01); the remaining uses show no significant effect. In the transacted-value dimension, the pattern inverts: appreciation concentrates in non-residential uses—health (β = 0.313, p < 0.01), industry (β = 0.147, p < 0.10), office (β = 0.134, p < 0.01), education (β = 0.096, p < 0.05), warehousing (β = 0.086, p < 0.01), parking (β = 0.082, p < 0.01), and commerce (β = 0.056, p < 0.05)—while residential use shows no effect (β = −0.006, n.s.).
Figure 5.
Effect heterogeneity on the log transacted value by SII economic land use, with 95% confidence intervals. Appreciation concentrates in non-residential uses (health, office, commerce, warehousing); the effect on housing is null.
Table 3.
Effect heterogeneity by SII economic land use. Direct-treatment coefficients for construction and transacted value. *** p < 0.01, ** p < 0.05, * p < 0.10.
The joint reading of both dimensions is consistent with an anticipation mechanism oriented toward service and logistic uses: the announcement is associated with fewer residential buildings and with appreciation of non-residential properties, without affecting housing value. This profile connects directly with prior evidence on the location of logistic facilities in Chile’s central macrozone, which documents the sensitivity of logistic activity to airport accessibility [9].
To address the concern that land uses with few observations might display spurious significance, we re-estimate the transacted-value coefficients with a block-level (manzana) cluster bootstrap (499 replications) and report the number of clusters G. The appreciation coefficients are stable and rest on many clusters: health β = 0.313 (clustered p = 0.001, bootstrap p < 0.001; G = 580), office β = 0.134 (bootstrap p < 0.001; G = 2787), education β = 0.096 (bootstrap p = 0.048; G = 1740), and industry β = 0.147 (bootstrap p = 0.080; G = 916), the last only marginally significant under both methods; none is an artifact of few clusters. We further isolate the local component with a triple-difference specification (non-residential × treated × Post) on transacted value: the local non-residential appreciation is +0.077 (p < 0.001), while the national non-residential trend over the same period is negative (−0.113, p < 0.001) and the residential treated-Post term is null (+0.006, p = 0.69). The non-residential appreciation is therefore specific to the treated zone and runs against the national trend, rather than reflecting a general market movement.
4.4. Spatial Structure
The global Moran statistic confirms significant spatial autocorrelation of outcomes in the most recent snapshot (2025S2): I = 0.348 (p = 0.001) for transacted value and I = 0.159 (p = 0.001) for built-stock variation. The local decomposition identifies 769 blocks in high-value clusters (HH) and 865 in low-value clusters (LL) for transacted value, alongside 151 high-low and 135 low-high spatial outliers, confirming a pronounced spatial structure that justifies the incorporation of spatial weights and spillover terms in the design. Figure 6 maps the transacted-value surface in the zone of influence, where the high-value clustering near the metropolitan north-east and the coastal focus is visible, and Figure 7 maps the local indicators of spatial association, distinguishing hot spots (HH), cold spots (LL), and spatial outliers (HL, LH).
Figure 6.
Transacted value (F2890) across the study area. Each point is a census block, colored by its median transacted value in Unidades de Fomento. The spatial concentration of high values is consistent with the significant global Moran statistics. The star marks the Torquemada site. This is a full-page portrait map and should be reproduced at full height.
Figure 7.
Local indicators of spatial association (LISA) for transacted value. Blocks are classified into high-high hot spots, low-low cold spots, and high-low/low-high spatial outliers, with non-significant blocks shown in light gray. The clustered structure motivates the spatial-weights specification of the design. This is a full-page portrait map and should be reproduced at full height.
4.5. Placebo Tests and Predictive Reference
Table 4 reports the placebo tests. The 2019S1 temporal placebo is not significant (coef = 0.028, p = 0.252), but the 2022S1 placebo is (coef = 0.092, p < 0.001), confirming the presence of prior trends and consistent with the rejection of the Wald test. The three spatial placebos, in contrast, are not significant (p > 0.25 in all cases), indicating that the effect is not an artifact of the spatial assignment of treatment. The combination—spatial placebo passed, but the 2022 temporal placebo failed—localizes the identification problem in the temporal dimension, plausibly due to market signals prior to the formalization of the announcement (study and pre-feasibility phases), and not in the spatial dimension.
Table 4.
Placebo tests on the log-transacted value. Fictitious-treatment coefficients.
The asymmetry between the 2019S1 placebo (null) and the 2022S1 placebo (significant) is itself informative, but it admits more than one interpretation, and we are deliberately transparent about the alternatives. Under the anticipation reading, the asymmetry suggests that the response was triggered by a specific informational threshold reached during the pre-feasibility phase: market-relevant signals about the project plausibly became credible during 2022, two years before the formal announcement, while no comparable signal existed in 2019. Equally plausible alternative explanations exist; however, the design cannot adjudicate between them. The 2022 coefficient could partly reflect macro-level shocks that affected the central-coast real estate market through channels unrelated to the Torquemada project, including the post-pandemic copper-price cycle and its effects on Chilean construction demand, contemporaneous changes in mortgage rates and housing-finance policy, and broader central-coast growth trends linked to remote work and migration patterns. The available semestral, regional design does not separately identify these channels from a project-specific anticipation effect; we therefore read the 2022 placebo coefficient as evidence of pre-announcement divergence in the broad sense, leaving open whether its source is project-specific anticipation, contemporaneous macro shocks, or a combination of both.
The gradient-boosting model reaches a coefficient of determination of R3 = 0.456 on the temporal test partition over 397,584 observations, with a mean absolute error of 0.69 on the logarithmic scale. The most important variables are geographic—longitude squared, longitude, number of transactions, and the residential land-use indicator—confirming that geographic location dominates the prediction of transacted value and supporting the geographic machine-learning approach for predictive extensions.
4.6. Robustness: What Survives, and What Does Not
We subject the design to three robustness exercises. Together they draw a sharp line between the claim the data support—a robust compositional reorganization—and the claim they do not—an aggregate increase in the level of activity. Figure 8 reports the sensitivity of the construction equation to the two free parameters of the hybrid spatial weights. Across the nine combinations of geographic weight αgeo and half-life bandwidth dhalf, the direct-treatment coefficient remains positive and highly significant (all p < 0.01), and the spatial spillover remains negative and significant (all p < 0.01). The magnitudes scale monotonically with αgeo, as expected since a larger geographic weight loads more heavily on the strongly clustered nearest-neighbor structure, but neither the sign nor the significance of either coefficient is sensitive to the parameter choice. The baseline specification sits in the interior of this range. The persistently negative spillover is itself a compositional signature: exposure to the focus is associated with redistribution, not diffuse addition, of activity—an interpretation reinforced by recent multi-matrix spatial evidence on transport-infrastructure spillovers [25].
Figure 8.
Sensitivity of the construction equation to the spatial-weights parameters. (a) direct-treatment coefficient; (b) spatial spillover. Each point is one of nine combinations of geographic weight and half-life bandwidth. Sign and significance are invariant to the parameter choice.
Re-estimating the full design under an alternative treatment date (2022S1) yields coefficients that are uniformly negative for the direct-treatment term across outcomes, in contrast to the pattern under the true announcement date. A treatment date placed in the middle of the pre-announcement divergence does not reproduce the post-2024 recomposition, reinforcing that the documented compositional pattern is anchored to the 2024 announcement rather than to an arbitrary break.
The third exercise is the most consequential for interpretation. Figure 9 contrasts the Callaway–Sant’Anna group-time average treatment effects—estimated using only never-treated controls—with the TWFE baseline. For construction activity, the ATT(g, t) are not distinguishable from zero at any post-announcement period (all p > 0.10); for transacted value, they remain null throughout. We emphasize how this result should be read. It does not overturn a positive finding; rather, it establishes that there is no robust evidence of an aggregate increase in the level of construction activity once the comparison is restricted to never-treated controls. This is fully consistent with the paper’s central claim. What the announcement is associated with is a change in the composition of activity (new parcels relative to expansions; non-residential relative to residential; concentration on treated blocks at the expense of exposed neighbors), not a change in the aggregate volume of building. A transparent caveat is in order here: the Callaway–Sant’Anna estimator was applied to the aggregate outcomes (built-stock variation and transacted value), not separately to the new-parcel and expansion components. The robustness of the compositional pattern itself has therefore been evaluated through placebo tests and spatial-weight sensitivity (and the qualitative direction is invariant to those), but not through the never-treated comparison, which would require sufficient power on each component (Section 7). Two non-exclusive mechanics underlie the attenuation observed on the aggregate: the restricted comparisons use far fewer observations, inflating standard errors roughly fourfold; and the TWFE construction coefficient partially absorbed differences between the treatment zone and the megaregional comparison municipalities, which the design correctly excludes from the control pool. The price result—null—is identical across both estimators.
Figure 9.
Callaway–Sant’Anna group-time average treatment effects (red, with 95% confidence intervals) against never-treated controls, contrasted with the TWFE baseline (blue dashed). (a) construction activity; (b) transacted value. The construction effect attenuates to non-significance under never-treated controls; the price effect is null under both estimators.
We complement the aggregate estimator with a Callaway–Sant’Anna decomposition of the two construction sub-indicators, estimated on the annual (first-semester) frequency against never-treated controls with 2023S1 as the baseline (Figure 10). New-parcel construction passes the never-treated test: its pre-announcement coefficients are small and trendless, and a clear break appears at the announcement (ATT = +0.055, p < 0.01 at 2024S1; +0.139, p < 0.01 at 2025S1). Expansion construction does not: its pre-announcement coefficients are uniformly positive and significant, indicating a trend that predates the announcement. The aggregate built-stock series is likewise strongly non-parallel. A descriptive volume decomposition makes the direction precise: the new-parcel share of total construction in the treated zone moves from 74% (pre) to 71% (post). That three-point decline in share is not contradictory, because expansions were already on a strongly positive pre-announcement trend—a trend the CS estimator cannot attribute to the treatment—both series increase in absolute volume post-announcement, but expansion volume grows faster and mechanically reduces the new-parcel share. The robust claim is about the absolute level of new-parcel activity, not the relative share: the CS ATT estimates confirm a clear positive break in new-parcel construction with trendless pre-coefficients, while the expansion series shows no such break above its pre-existing trend. The announcement is therefore associated with additional new-parcel construction rather than a reallocation away from expansions.
Figure 10.
Annual event study against never-treated controls (reference = 2023S1) for new-parcel construction, expansion, and built-stock variation. New-parcel pre-announcement coefficients are small and trendless with a clear post-break; the expansion and built-stock series display strongly non-parallel pre-trends. Coefficients with 95% confidence intervals.
5. Discussion
The results admit integrated reading. The activation of the extensive margin is the construction pattern that survives every specification: after the announcement, the direct zone of influence records more new-parcel building (clean against never-treated controls), and the spatial spillover is consistently negative. The decline in expansions, by contrast, is not separately identified—its pre-announcement trend is non-parallel—so we do not claim a symmetric reallocation away from densification. This shift from intensive toward extensive development is consistent with a change in expectations about the future use of land: faced with the prospect of an accessibility transformation, agents prefer to initiate new developments rather than densify the existing. The magnitude of the aggregate construction effect, however, is not robust: it attenuates to statistical insignificance once the comparison is restricted to never-treated controls (Section 4.6), so the recomposition is best characterized as a robust change in the composition of building rather than a robustly estimated level effect. The simultaneous absence of an effect on transacted price and transaction volume—null across both the TWFE and the heterogeneity-robust estimators—suggests that, in the observed four-semester window, whatever adjustment occurred manifested in the type of physical supply rather than in revealed demand or prices.
The land-use heterogeneity profile adds an important interpretive layer. Appreciation concentrates on non-residential properties—health, office, commerce, warehousing—while housing shows no price effect and, in fact, exhibits a contraction of residential construction activity. This pattern is hardly compatible with a generalized residential-demand mechanism and instead fits a reorientation toward service and logistic uses. The connection with our prior evidence on logistic location in the central macrozone [9] is direct: if airport infrastructure attracts logistic and service activity more than residential, the observed selective appreciation is precisely the expected footprint of that mechanism, and it parallels recent evidence linking logistic sprawl to measurable urban externalities [30]. From a sustainability standpoint, this anticipated non-residential reorientation signals an early risk of logistic-externality concentration that territorial planning in the coastal zone should foresee.
The megaregional dimension is the most speculative but also the most original. The relative deceleration of the Metropolitan Region’s logistic and premium-residential municipalities is consistent with an accessibility substitution: the new coastal node would compete with the primacy of Santiago’s airport in regional logistic articulation. This interpretation aligns with recent spatial-econometric evidence in this journal that aviation and transport infrastructure act as significant, spatially mediated drivers of regional economic activity [12], which would predict exactly such a redistribution of activity between competing nodes. Nonetheless, it must be emphasized that this reading is conjectural; the metropolitan municipalities are subject to their own dynamics—price cycles, land-use regulation, credit-cost changes—that the design does not fully isolate.
The spatial-spillover term reinforces the territorial-recomposition narrative. For construction activity, it is large and negative (β = −0.469, p < 0.01), indicating that blocks more exposed to the treatment focus through the hybrid spatial weights record less construction, not more, relative to what their own treatment status would predict. Rather than a diffuse positive halo radiating from the project, the data describe a zero-sum reallocation: activity concentrates on the directly treated blocks while their spatially exposed neighbors decelerate. This negative spillover is the spatial counterpart of the new-parcel/expansion recomposition documented at the block level, and it is consistent with the substitution logic that also underlies the megaregional results. For transacted value, the spillover is negative but not significant (β = −0.103, n.s.), so no analogous price-side reallocation can be asserted. Methodologically, a negative spillover also implies that treating spatially contiguous controls as unaffected would bias the direct-treatment estimate; the explicit spillover term mitigates that concern.
Our finding of a negative spatial spillover—activity concentrates on directly treated blocks while exposed neighbors decelerate—aligns with the multi-matrix spatial evidence of Yin et al. [25] and Rimidis and Butkus [29], who document that transport-infrastructure effects are frequently redistributive rather than purely additive. In their framework, the sign and magnitude of spillovers depend on the spatial-weight specification; our hybrid-weight design confirms that the negative sign is invariant to parameter choice (Section 4.6), reinforcing the reading that the Torquemada announcement coincides with territorial recomposition rather than diffuse expansion.
The interpretive line that runs through these results is that the announcement is associated with a change in the composition of the land market without producing a robustly estimated increase in its aggregate level. From the perspective of expectations-capitalization theory, this is coherent. Because asset markets incorporate information about future flows, the response begins during the project’s study phases—visible here as pre-treatment divergence—rather than at a sharp post-announcement break. What survives every specification we estimate is the qualitative compositional pattern together with the null price effect; what does not survive is the magnitude of any aggregate-level effect. The full set of identification and data caveats that bound these conclusions is consolidated in Section 7. A natural methodological extension, following Rambachan and Roth [15], would report bounds on the effect under bounded violations of parallelism, formally delimiting the causal magnitude compatible with the observed prior trends.
6. Sustainability Implications
The anticipatory footprint we document has direct consequences for sustainable territorial governance, which we organize around three themes derived directly from the empirical results: the risk of urban sprawl, the timing of value-capture instruments, and the case for register-based anticipatory monitoring.
Urban sprawl and logistic externalities. The robust signal is an increase in new-parcel (extensive, land-consuming) construction; we do not find a cleanly identified offsetting decline in expansions, so the pattern is best read as additional extensive development rather than a wholesale reallocation from intensive to extensive building. Even in this weaker form, the sprawl concern holds: net new-parcel activity consumes peripheral land, the mechanism through which transport infrastructure has historically been associated with sprawl, with documented costs in vehicle-kilometers traveled, emissions, and loss of agricultural and ecological land [10]. The negative spatial spillover sharpens this concern: activity does not diffuse smoothly outward but redistributes toward the directly exposed coastal blocks, a pattern consistent with low-density expansion. The parallel selective appreciation of non-residential land uses—warehousing, industry, commerce—mirrors the logistic-location dynamics documented for the Metropolitan Region [9], where logistic facilities cluster around airport accessibility and have been linked to externalities (heavy-vehicle traffic, noise, air quality) that fall disproportionately on lower-income communities; recent evidence confirms that logistic sprawl is associated with measurable congestion and emission externalities [30]. Detecting both signatures before construction begins is precisely what gives planners the option to address them ex ante rather than reactively.
Land value capture in the announcement window. The fact that the announcement is associated with land-market change years before operation is the empirical premise for value-capture policy. The window between announcement and construction is when betterment levies, developer charges, and strategic public land assembly are particularly well placed to act, because the value increments they target are being created during this window by a public investment but accrue, absent intervention, to private landowners. The strength of this case depends on the legal and institutional setting and the magnitude of the value increments, neither of which our design pins down; what our results provide is the empirical dating of when the relevant window opens—here, in the pre-2024 anticipation already visible in the event study.
Anticipatory governance through register-based monitoring. The core methodological message is that markets price infrastructure on announcement, not on completion. Environmental-impact assessment, regulatory plan updates, and land-use rezoning that wait for the operational phase to arrive after the market has already reorganized. The low-cost, replicable instrument we built—a near-real-time, register-based monitoring system at the resolution of the census block—allows the public sector to move from reactive to anticipatory governance and can feed directly into land-use-conflict identification and territorial spatial zoning frameworks [31]. Whether and how authorities act on such signals is a political-economy question beyond our data; what we contribute is the empirical infrastructure that makes such action evidence-based at the earliest possible stage.
Operationally, the system rests on three families of block-level indicators: (i) construction-margin indicators—Δ built-stock m3, the new-parcel-to-expansion ratio, and new-parcel m3 by land use—to flag extensive-margin activation; (ii) value indicators—median transacted value (UF) and its local Moran/LISA cluster classification—to flag selective appreciation and emerging hot spots; and (iii) an exposure indicator—the hybrid spatial-spillover term—to delimit the zone of influence. The update frequency is semestral, synchronized with the SII cadastre release and the continuous F2890 feed, so the system refreshes automatically as administrative data arrive. Three application scenarios follow: early-warning triggers for speculative pressure (a value cluster rising beyond a pre-set threshold), detection of a residential-to-logistic land-use shift via the non-residential appreciation profile, and ex-ante calibration of value-capture instruments during the announcement-to-construction window. The pipeline is an open, executable Python notebook and can feed a public-sector dashboard, turning the academic model into a low-cost, replicable land-planning instrument.
7. Limitations
We make the limitations of the study explicit, both because they bound the claims and because several of them are intrinsic to the anticipation phenomenon rather than defects of the data.
Anticipation rather than strict causality. The study identifies the spatio-temporal footprint of an announcement, not a point causal effect on the level of activity. The parallel-trends assumption underlying the difference-in-differences design is rejected for several outcomes (Section 4.2), and the aggregate construction magnitude attenuates to non-significance under never-treated controls (Section 4.6). The coefficients we report are therefore design-conditional associations. As argued throughout, the pre-treatment divergence is itself partly substantive—a market anticipating the project during its study phases—so the limitation and the phenomenon are entangled; but the consequence for inference is unavoidable, and we do not claim clean causal magnitudes.
Selection of the treatment date and semestral aggregation. The 2024S1 announcement semester is the date of formal public announcement, yet study, pre-feasibility, and rumor phases plausibly transmitted information earlier, as the significant 2022S1 temporal placebo (Section 4.5) and the pre-trends suggest. The precise onset of anticipation cannot be pinned down with semestral data, which blurs the boundary between “pre” and “post” and contributes to the parallel-trends rejection. A related point concerns the within-semester position of the announcement: if the formal announcement occurred near the end of 2024S1 rather than at its start, the “post” window effectively includes pre-announcement months, which would attenuate the estimated coefficient toward zero. We assume that the relevant information reached the market within the 2024S1 window in its broad sense—consistent with the pre-feasibility signals already visible in the 2022S1 placebo—but a monthly or weekly design that could date the onset with higher precision is infeasible with available cadastral data, which are only released in semestral snapshots.
Short post-treatment window. Only four post-announcement semesters (2024S1–2025S2) are observed. This short horizon limits statistical power—especially in the restricted Callaway–Sant’Anna comparisons, where standard errors are roughly fourfold those of the pooled design—and prevents observation of the medium-run dynamics that would distinguish a transient announcement response from a durable reorganization. It also means the operation-phase effect cannot yet be separated from the announcement footprint; only continued tracking of the panel will allow that.
Callaway–Sant’Anna estimates for the parcel-type decomposition. We now estimate the heterogeneity-robust estimator separately for new-parcel and expansion construction, on the annual (first-semester) frequency at which these flows are recorded, against never-treated controls (Figure 10, Section 4.6). The two components behave differently: the new-parcel increase passes the never-treated test with trendless pre-coefficients and a clear post break (ATT = +0.055, p < 0.01 at 2024S1; +0.139, p < 0.01 at 2025S1), whereas the expansion series exhibits a uniformly positive, individually significant pre-trend and the aggregate built-stock series is strongly non-parallel in the pre-period. We therefore restrict the robust compositional claim to the extensive margin—the announcement is associated with additional new-parcel construction, not with a recomposition away from expansions—and report the expansion and aggregate coefficients as design-conditional associations. The new-parcel pre-trends, while small and trendless, are not exactly flat in a joint Wald sense (W = 18.60, p = 0.002), as is common at this panel size; the substantive evidence is the sharp asymmetry between the trendless new-parcel pre-period and the strongly trending expansion and aggregate pre-periods.
Georeferencing coverage gap. The SII parcel shapefile extends only to 2022, so blocks first appearing in the cadastre from 2023 onward cannot be georeferenced and are excluded from the spatial analysis. Coverage nonetheless reaches 96.0% of panel blocks (96,708 of 100,718); the 3948 non-georeferenceable blocks (3.9%) and the 121 blocks that disappear after 2022 are documented as coverage figures. The gap affects recent blocks across the study area rather than a specific treatment or control zone, so it is most plausibly a coverage limitation rather than a strong selective bias. We cannot fully rule out a subtler concern; however, newly subdivided peripheral blocks, which the gap disproportionately omits, may be precisely those most responsive to the announcement, which would bias the construction footprint toward zero.
A sensitivity check restricting the panel to blocks already present by 2022S2 leaves every coefficient essentially unchanged (Δstock 0.272, new parcels 0.095, expansions −0.123, transacted value −0.051, n.s.), and a balance check shows the non-georeferenced blocks differ only in being smaller (mean stock 1199 vs. 1751 m3; 17.5 vs. 20.3 parcels) rather than selected on the outcome. The coverage gap is therefore a marginal limitation rather than a driver of the results.
Potential spatial selection, bounded. Treatment status is defined geographically (proximity to the Torquemada site), which could, in principle, confound the announcement with pre-existing coastal-development trends. Two pieces of evidence bound this concern: the three spatial placebos, which randomly permute the treatment label, are all non-significant (Section 4.5), indicating the result is not an artifact of spatial assignment; and the never-treated-control design of the Callaway–Sant’Anna estimator excludes the megaregional groups from the counterfactual. These do not eliminate spatial selection, but they localize the identification problem in the temporal rather than the spatial dimension.
Data scope. The F2890 records a single total value (land plus construction) per conveyance without decomposition, so we cannot separate land price from structure-price dynamics. The land component cannot be recovered by reweighting with the SII cadastral avalúo (assessed value), because the avalúo is a tax appraisal updated on a four-year administrative cycle and does not track market prices; combining it with observed transaction prices would mix incommensurable valuations. A transaction-level hedonic decomposition would additionally require unit-specific attributes—floor level, interior area, vintage—that the F2890 does not record at the individual-deed level. Separating land-price from structure-price dynamics therefore constitutes a methodologically independent inquiry that requires different data, not an extension of the present design. The cadastre captures formal, declared construction only; the analysis covers three Chilean regions, so external validity to other institutional or geographic settings is not established.
8. Conclusions
This work constructed a high-resolution microterritorial panel that integrates the real estate cadastre, notarial conveyance records, and the Chilean indexer series, and used it to characterize the anticipatory footprint of the Torquemada airport announcement on the land market. The central finding is directionally robust and compositional. Across the specifications we estimate, building activity in the zone of influence is associated with a robust increase in new-parcel construction (clean against never-treated controls, with trendless pre-trends), without a symmetrically identified decline in expansions; appreciation is concentrated in non-residential land uses while housing value is unaffected; and a negative spatial spillover coincides with a redistribution of activity toward the directly exposed coastal blocks rather than its diffusion outward. A secondary, more conjectural pattern is a relative deceleration of the Metropolitan Region municipalities linked to Santiago’s airport accessibility, consistent with a megaregional rebalancing. What evidence does not support—and we state this plainly—is an aggregate increase in the level of construction activity: that magnitude attenuates to statistical insignificance under never-treated controls. The robust claim is about the direction and selectivity of the anticipatory footprint, not its aggregate size.
These findings must be interpreted with the caution imposed by the identification limitation. Prior trends are not parallel for several outcomes, so the reported coefficients are design-conditional associations and not point causal effects. The heterogeneity-robust Callaway–Sant’Anna estimator makes this explicit: against never-treated controls, the aggregate construction effect attenuates to non-significance, so what is robust is the compositional shift rather than the magnitude of an aggregate level effect, while the null price effect holds across estimators. The market anticipation documented by the placebo and event-study evidence does not invalidate the analysis but precisely delimits its scope: what the design identifies is the spatio-temporal footprint of an announcement on a market already reacting to its preparatory phases.
The policy relevance, developed in detail in Section 6, follows directly from the anticipatory nature of the footprint. Because the market reorganizes before construction—indeed, before the formal announcement, as the event study shows—the window for sustainable intervention (sprawl containment, logistic-externality zoning, land value capture) opens early and is easily missed by instruments that wait for the operational phase. The replicable, register-based monitoring infrastructure developed here is designed to date and locate that window empirically, supporting anticipatory rather than reactive territorial governance and feeding the territorial spatial zoning instruments that operationalize it [31]. Future extensions include formal sensitivity analysis to parallel-trends violations [15], the application of additional heterogeneity-robust estimators [21,22], and longitudinal tracking of the panel as the project materializes, which will allow distinguishing the announcement footprint from the eventual operation effect.
Author Contributions
Conceptualization, G.U.; methodology, G.U.; software, G.U.; validation, G.U., Á.P.F. and M.F.; formal analysis, G.U.; investigation, G.U.; data curation, G.U.; writing—original draft preparation, G.U.; writing—review and editing, Á.P.F. and M.F.; visualization, G.U.; supervision, Á.P.F. and M.F. All authors have read and agreed to the published version of the manuscript.
Funding
This research received no external funding.
Institutional Review Board Statement
Not applicable.
Informed Consent Statement
Not applicable.
Data Availability Statement
The data presented in this study are derived from public-domain administrative resources: the real estate cadastre and F2890 conveyance records of the Chilean Internal Revenue Service (Servicio de Impuestos Internos). The processing pipeline (Python) that supports the findings of this study is openly available as an executable notebook at https://www.kaggle.com/code/gerardoureta/nb1-geoai-propiedades-chile (accessed on 3 June 2026). Restrictions apply to the redistribution of the raw cadastral microdata in accordance with the source’s terms of use.
Acknowledgments
The authors thank the Doctorate in Intelligent Industry program of the Pontificia Universidad Católica de Valparaíso for institutional support. During the preparation of this manuscript, the authors used a large language model (LLM; Claude, Anthropic) for the purposes of language editing and drafting assistance. The authors have reviewed and edited the output and take full responsibility for the content of this publication.
Conflicts of Interest
The authors declare no conflicts of interest.
References
- Raimundo, R.J.; Baltazar, M.E.; Cruz, S.P. Sustainability in the Airports Ecosystem: A Literature Review. Sustainability 2023, 15, 12325. [Google Scholar] [CrossRef] [Scilit]
- Rosen, S. Hedonic Prices and Implicit Markets: Product Differentiation in Pure Competition. J. Polit. Econ. 1974, 82, 34–55. [Google Scholar] [CrossRef] [Scilit]
- Fujita, M.; Krugman, P.; Venables, A.J. The Spatial Economy: Cities, Regions, and International Trade; MIT Press: Cambridge, MA, USA, 2001. [Google Scholar] [CrossRef] [Scilit]
- Cohen, J.P.; Coughlin, C.C. Spatial Hedonic Models of Airport Noise, Proximity, and Housing Prices. J. Reg. Sci. 2008, 48, 859–878. [Google Scholar] [CrossRef] [Scilit]
- McMillen, D.P. Airport Expansions and Property Values: The Case of Chicago O’Hare Airport. J. Urban Econ. 2004, 55, 627–640. [Google Scholar] [CrossRef] [Scilit]
- Tomkins, J.; Topham, N.; Twomey, J.; Ward, R. Noise versus Access: The Impact of an Airport in an Urban Property Market. Urban Stud. 1998, 35, 243–258. [Google Scholar] [CrossRef] [Scilit]
- Nelson, J.P. Meta-Analysis of Airport Noise and Hedonic Property Values. J. Transp. Econ. Policy 2004, 38, 1–27. [Google Scholar] [CrossRef] [Scilit]
- Guerin, L.; Vieira, J.G.V.; de Oliveira, R.L.M.; de Oliveira, L.K.; de Miranda Vieira, H.E.; Dablanc, L. The Geography of Warehouses in the São Paulo Metropolitan Region and Contributing Factors to This Spatial Distribution. J. Transp. Geogr. 2021, 91, 102976. [Google Scholar] [CrossRef] [Scilit]
- Ureta, G.; Hurtubia, R.; Giesen, R. Preferencias de localización y segmentación de agentes logísticos en la Región Metropolitana de Santiago, Chile. Rev. Estud. Transp. 2023, 24, 1–20. [Google Scholar]
- Ewing, R.; Hamidi, S. Compactness versus Sprawl: A Review of Recent Evidence from the United States. J. Plan. Lit. 2015, 30, 413–432. [Google Scholar] [CrossRef] [Scilit]
- Green, R.K. Airports and Economic Development. Real Estate Econ. 2007, 35, 91–112. [Google Scholar] [CrossRef] [Scilit]
- Shi, J.; Bai, T.; Zhao, Z.; Tan, H. Driving Economic Growth through Transportation Infrastructure: An In-Depth Spatial Econometric Analysis. Sustainability 2024, 16, 4283. [Google Scholar] [CrossRef] [Scilit]
- Billings, S.B. Estimating the Value of a New Transit Option. Reg. Sci. Urban Econ. 2011, 41, 525–536. [Google Scholar] [CrossRef] [Scilit]
- Gibbons, S.; Machin, S. Valuing School Quality, Better Transport, and Lower Crime: Evidence from House Prices. Oxf. Rev. Econ. Policy 2008, 24, 99–119. [Google Scholar] [CrossRef] [Scilit]
- Rambachan, A.; Roth, J. A More Credible Approach to Parallel Trends. Rev. Econ. Stud. 2023, 90, 2555–2591. [Google Scholar] [CrossRef] [Scilit]
- Kok, N.; Koponen, E.-L.; Martínez-Barbosa, C.A. Big Data in Real Estate? From Manual Appraisal to Automated Valuation. J. Portf. Manag. 2017, 43, 202–211. [Google Scholar] [CrossRef] [Scilit]
- Glaeser, E.L.; Kominers, S.D.; Luca, M.; Naik, N. Big Data and Big Cities: The Promises and Limitations of Improved Measures of Urban Life. Econ. Inq. 2018, 56, 114–137. [Google Scholar] [CrossRef] [Scilit]
- Cox, T.; Hurtubia, R. Subdividing the Sprawl: Endogenous Segmentation of Housing Submarkets in Expansion Areas of Santiago, Chile. Environ. Plan. B Urban Anal. City Sci. 2021, 48, 1770–1786. [Google Scholar] [CrossRef] [Scilit]
- de Chaisemartin, C.; D’Haultfœuille, X. Two-Way Fixed Effects Estimators with Heterogeneous Treatment Effects. Am. Econ. Rev. 2020, 110, 2964–2996. [Google Scholar] [CrossRef] [Scilit]
- Goodman-Bacon, A. Difference-in-Differences with Variation in Treatment Timing. J. Econom. 2021, 225, 254–277. [Google Scholar] [CrossRef] [Scilit]
- Callaway, B.; Sant’Anna, P.H.C. Difference-in-Differences with Multiple Time Periods. J. Econom. 2021, 225, 200–230. [Google Scholar] [CrossRef] [Scilit]
- Sun, L.; Abraham, S. Estimating Dynamic Treatment Effects in Event Studies with Heterogeneous Treatment Effects. J. Econom. 2021, 225, 175–199. [Google Scholar] [CrossRef] [Scilit]
- Anselin, L. Spatial Econometrics: Methods and Models; Springer: Dordrecht, The Netherlands, 1988. [Google Scholar] [CrossRef] [Scilit]
- LeSage, J.; Pace, R.K. Introduction to Spatial Econometrics; Chapman and Hall/CRC: Boca Raton, FL, USA, 2009. [Google Scholar] [CrossRef] [Scilit]
- Yin, F.; Qian, Y.; Zeng, J.; Wei, X. The Spatial Spillover Effects of Transportation Infrastructure on Regional Economic Growth—An Empirical Study at the Provincial Level in China. Sustainability 2024, 16, 8689. [Google Scholar] [CrossRef] [Scilit]
- Chen, T.; Guestrin, C. XGBoost: A Scalable Tree Boosting System. In Proceedings of the 22nd ACM SIGKDD International Conference on Knowledge Discovery and Data Mining, San Francisco, CA, USA, 13–17 August 2016; pp. 785–794. [Google Scholar] [CrossRef] [Scilit]
- Anselin, L. Local Indicators of Spatial Association—LISA. Geogr. Anal. 1995, 27, 93–115. [Google Scholar] [CrossRef] [Scilit]
- Credit, K. Spatial Models or Random Forest? Evaluating the Use of Spatially Explicit Machine Learning Methods to Predict Employment Density around New Transit Stations in Los Angeles. Geogr. Anal. 2022, 54, 58–83. [Google Scholar]
- Rimidis, M.; Butkus, M. Can Regional Infrastructure Predict Its Economic Resilience? Limited Evidence from Spatial Modelling. Sustainability 2025, 17, 7046. [Google Scholar] [CrossRef] [Scilit]
- El Yadari, M.; Jawab, F.; Moufad, I.; Arif, J. Logistics Sprawl and Urban Congestion Dynamics Toward Sustainability: A Logistic Regression and Random-Forest-Based Model. Sustainability 2025, 17, 5929. [Google Scholar] [CrossRef] [Scilit]
- He, Q.; Cai, H.; Chen, L. Concept and Method of Land Use Conflict Identification and Territorial Spatial Zoning Control. Sustainability 2024, 16, 11177. [Google Scholar] [CrossRef] [Scilit]
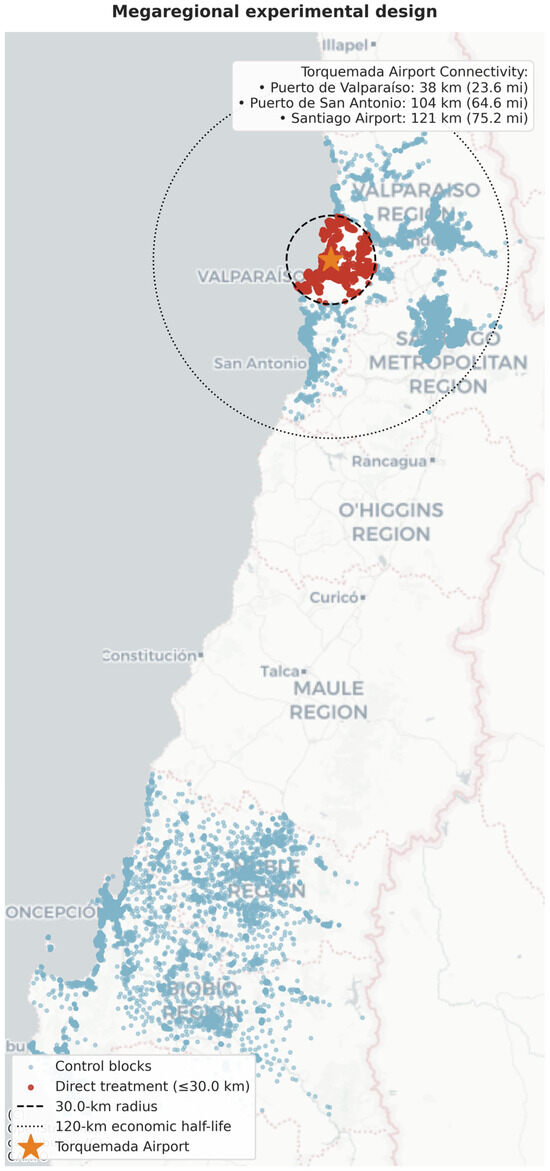
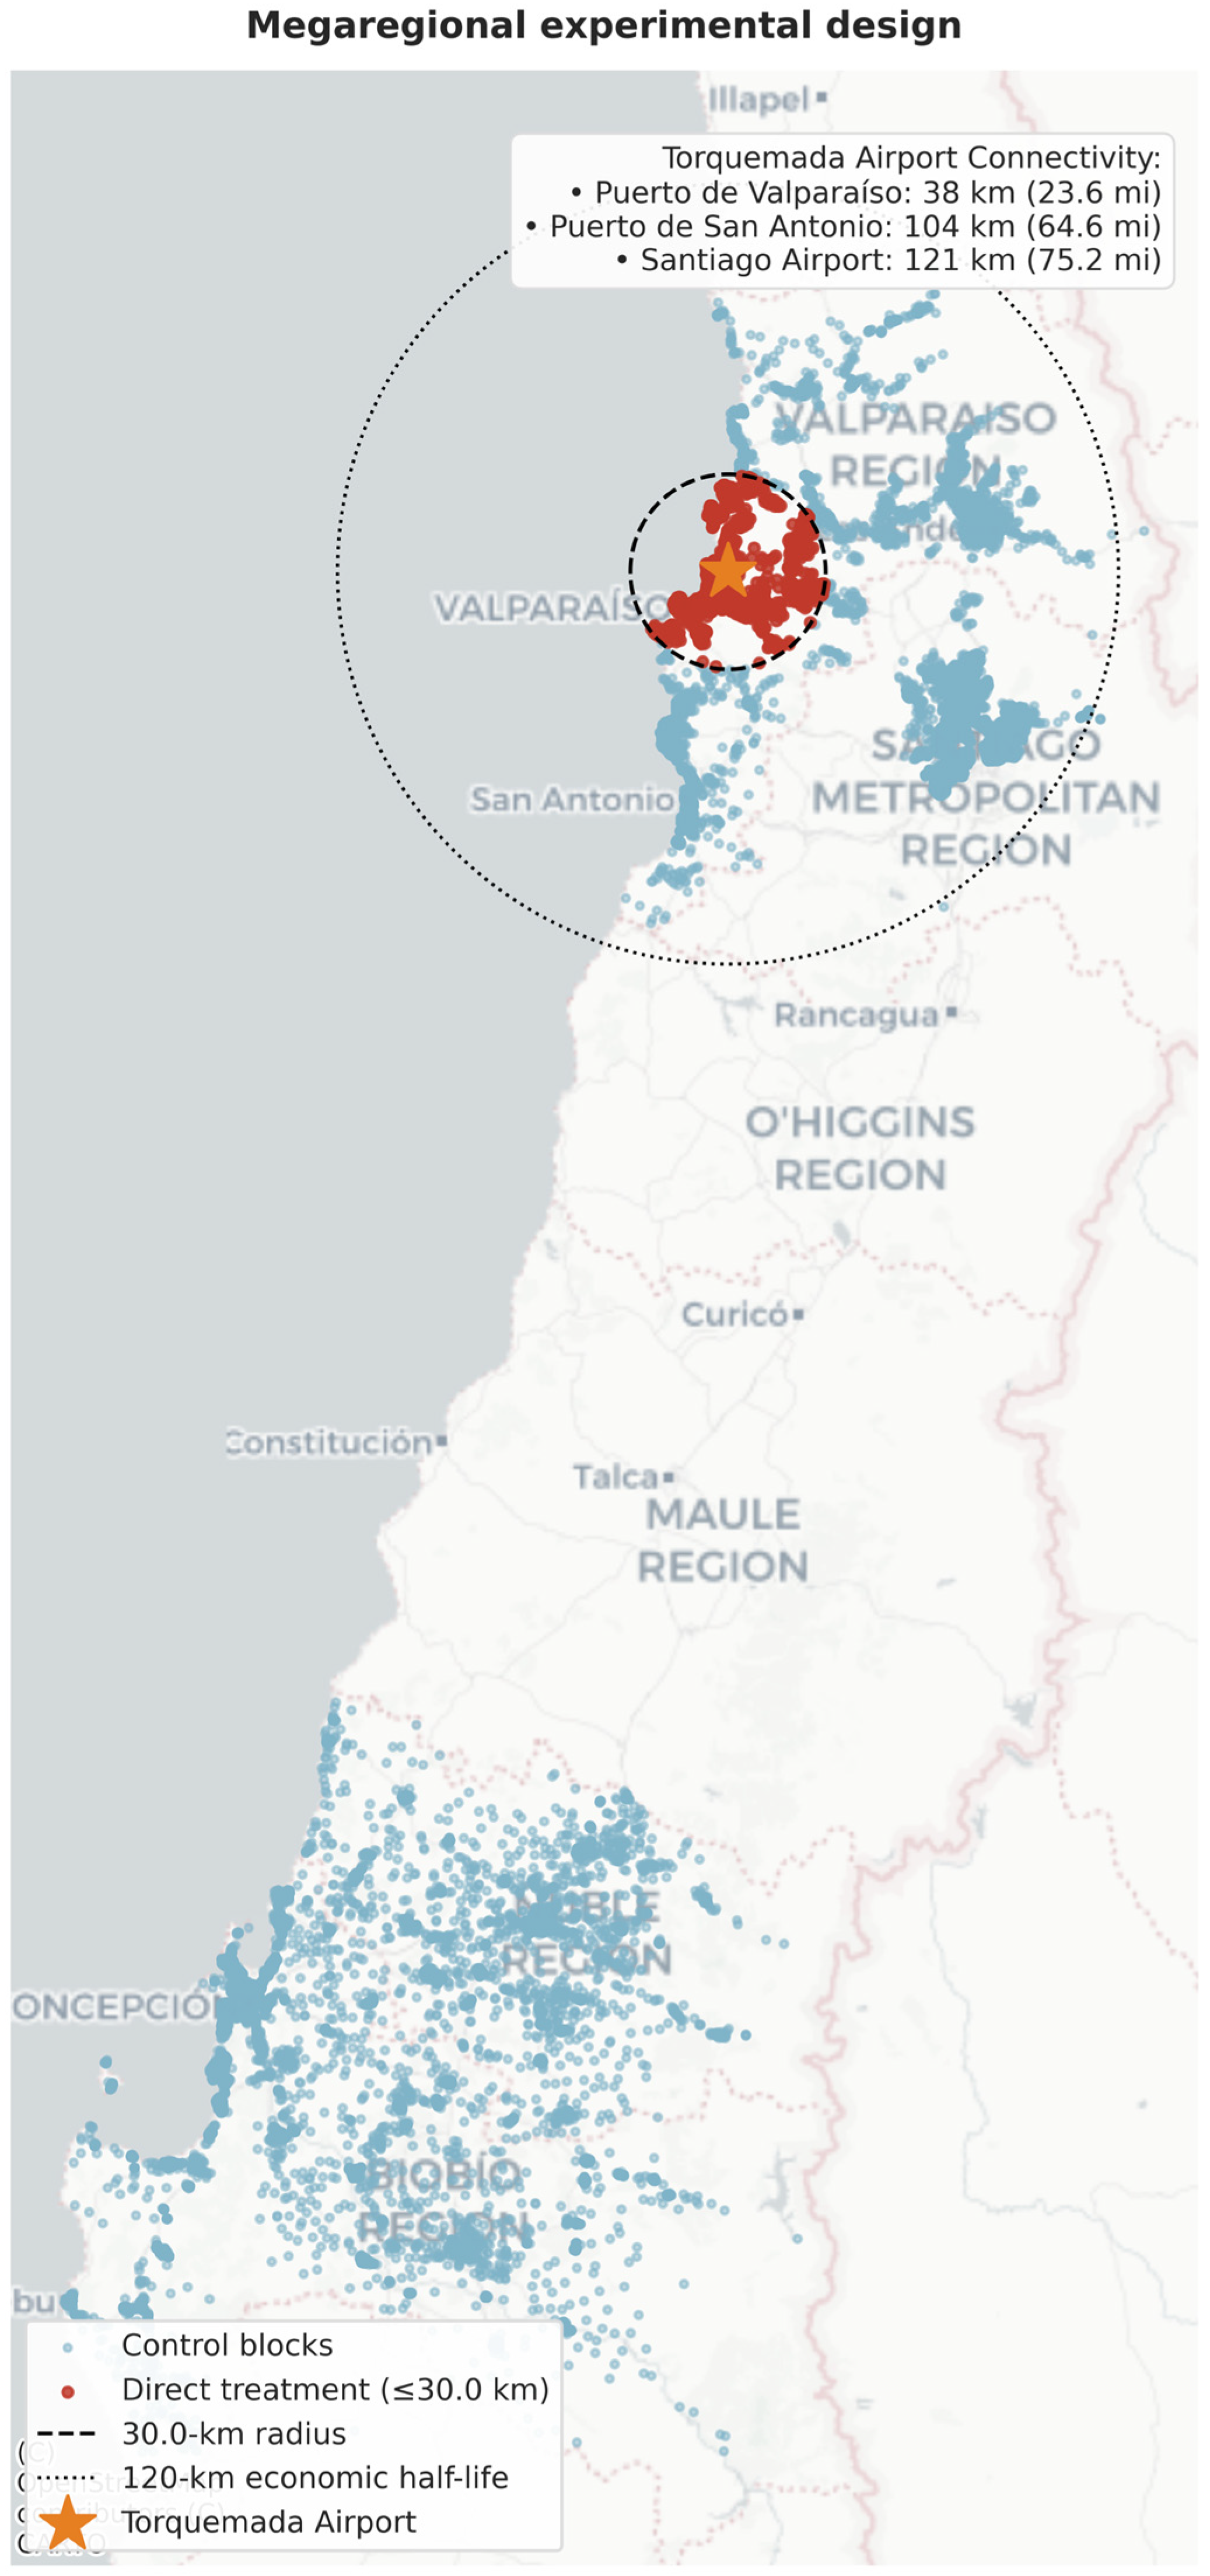
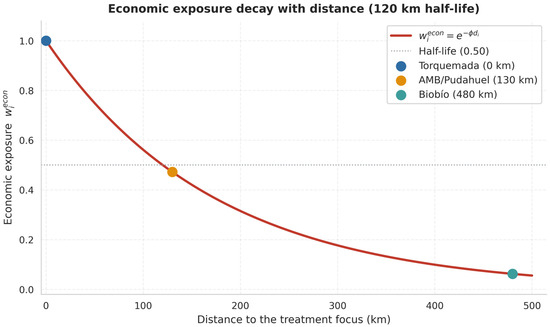
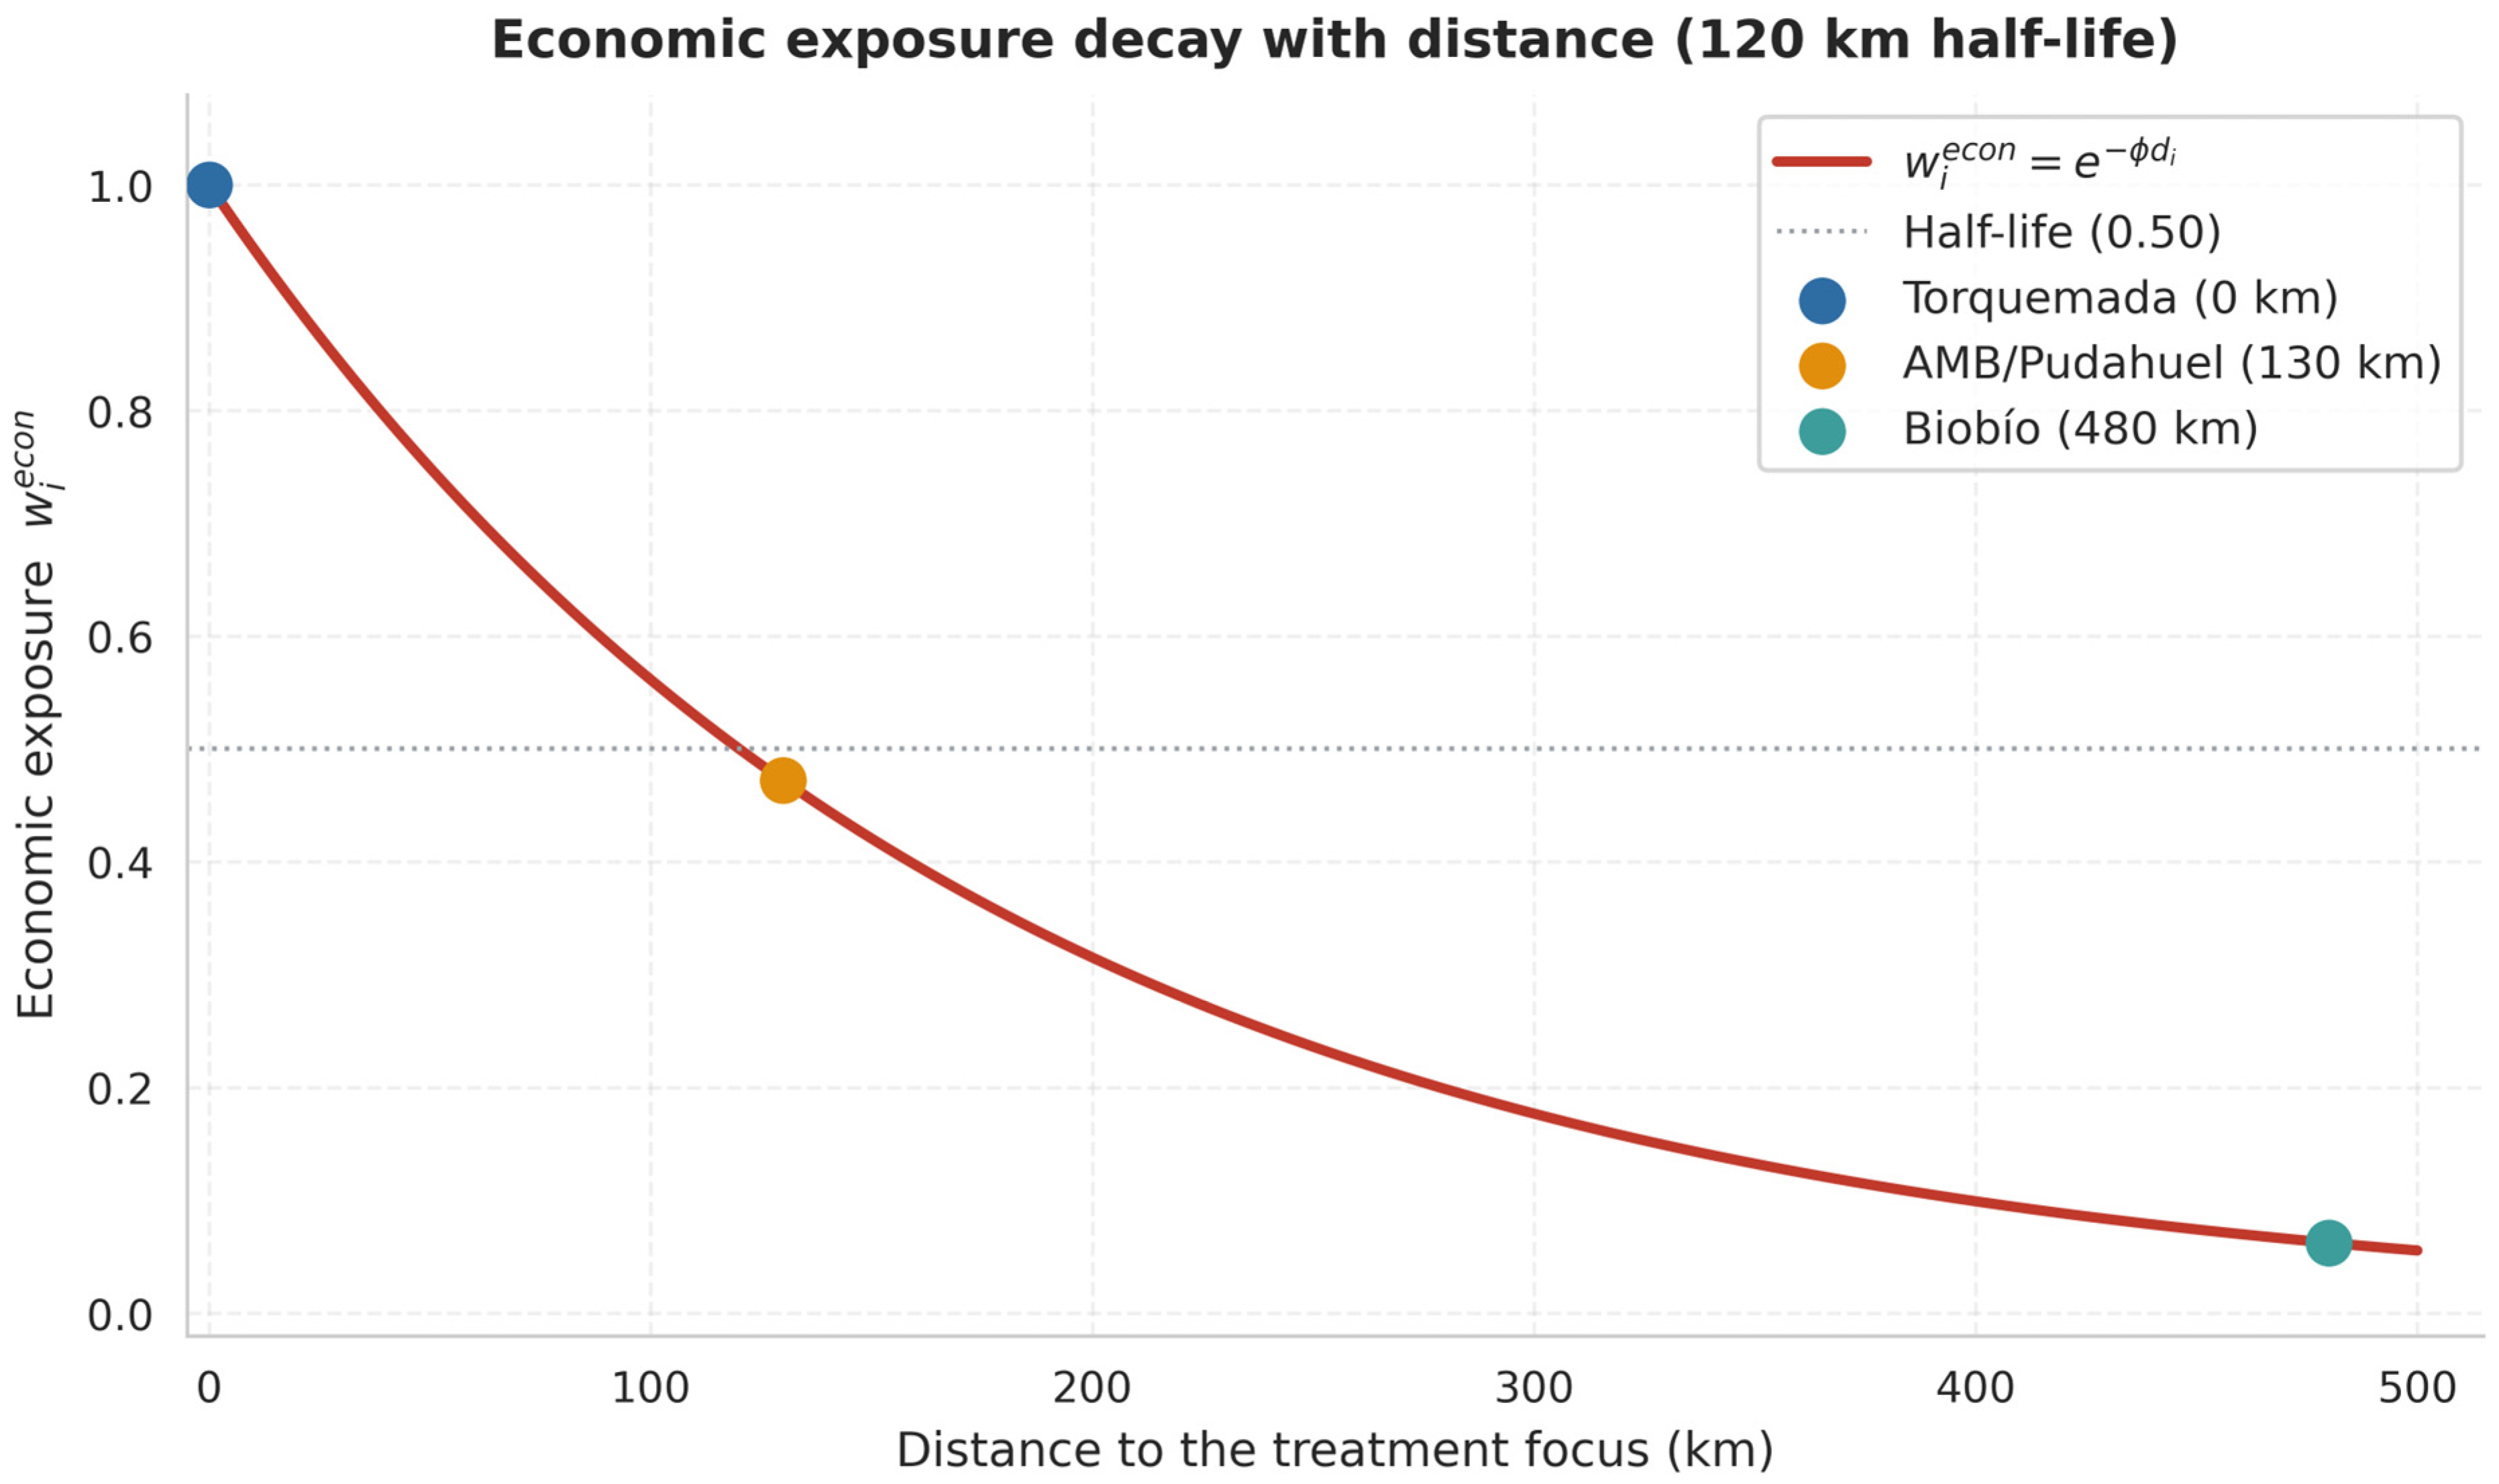
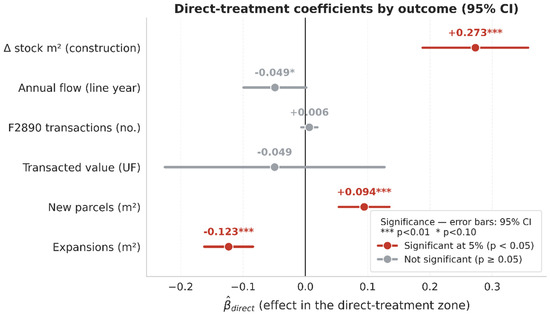
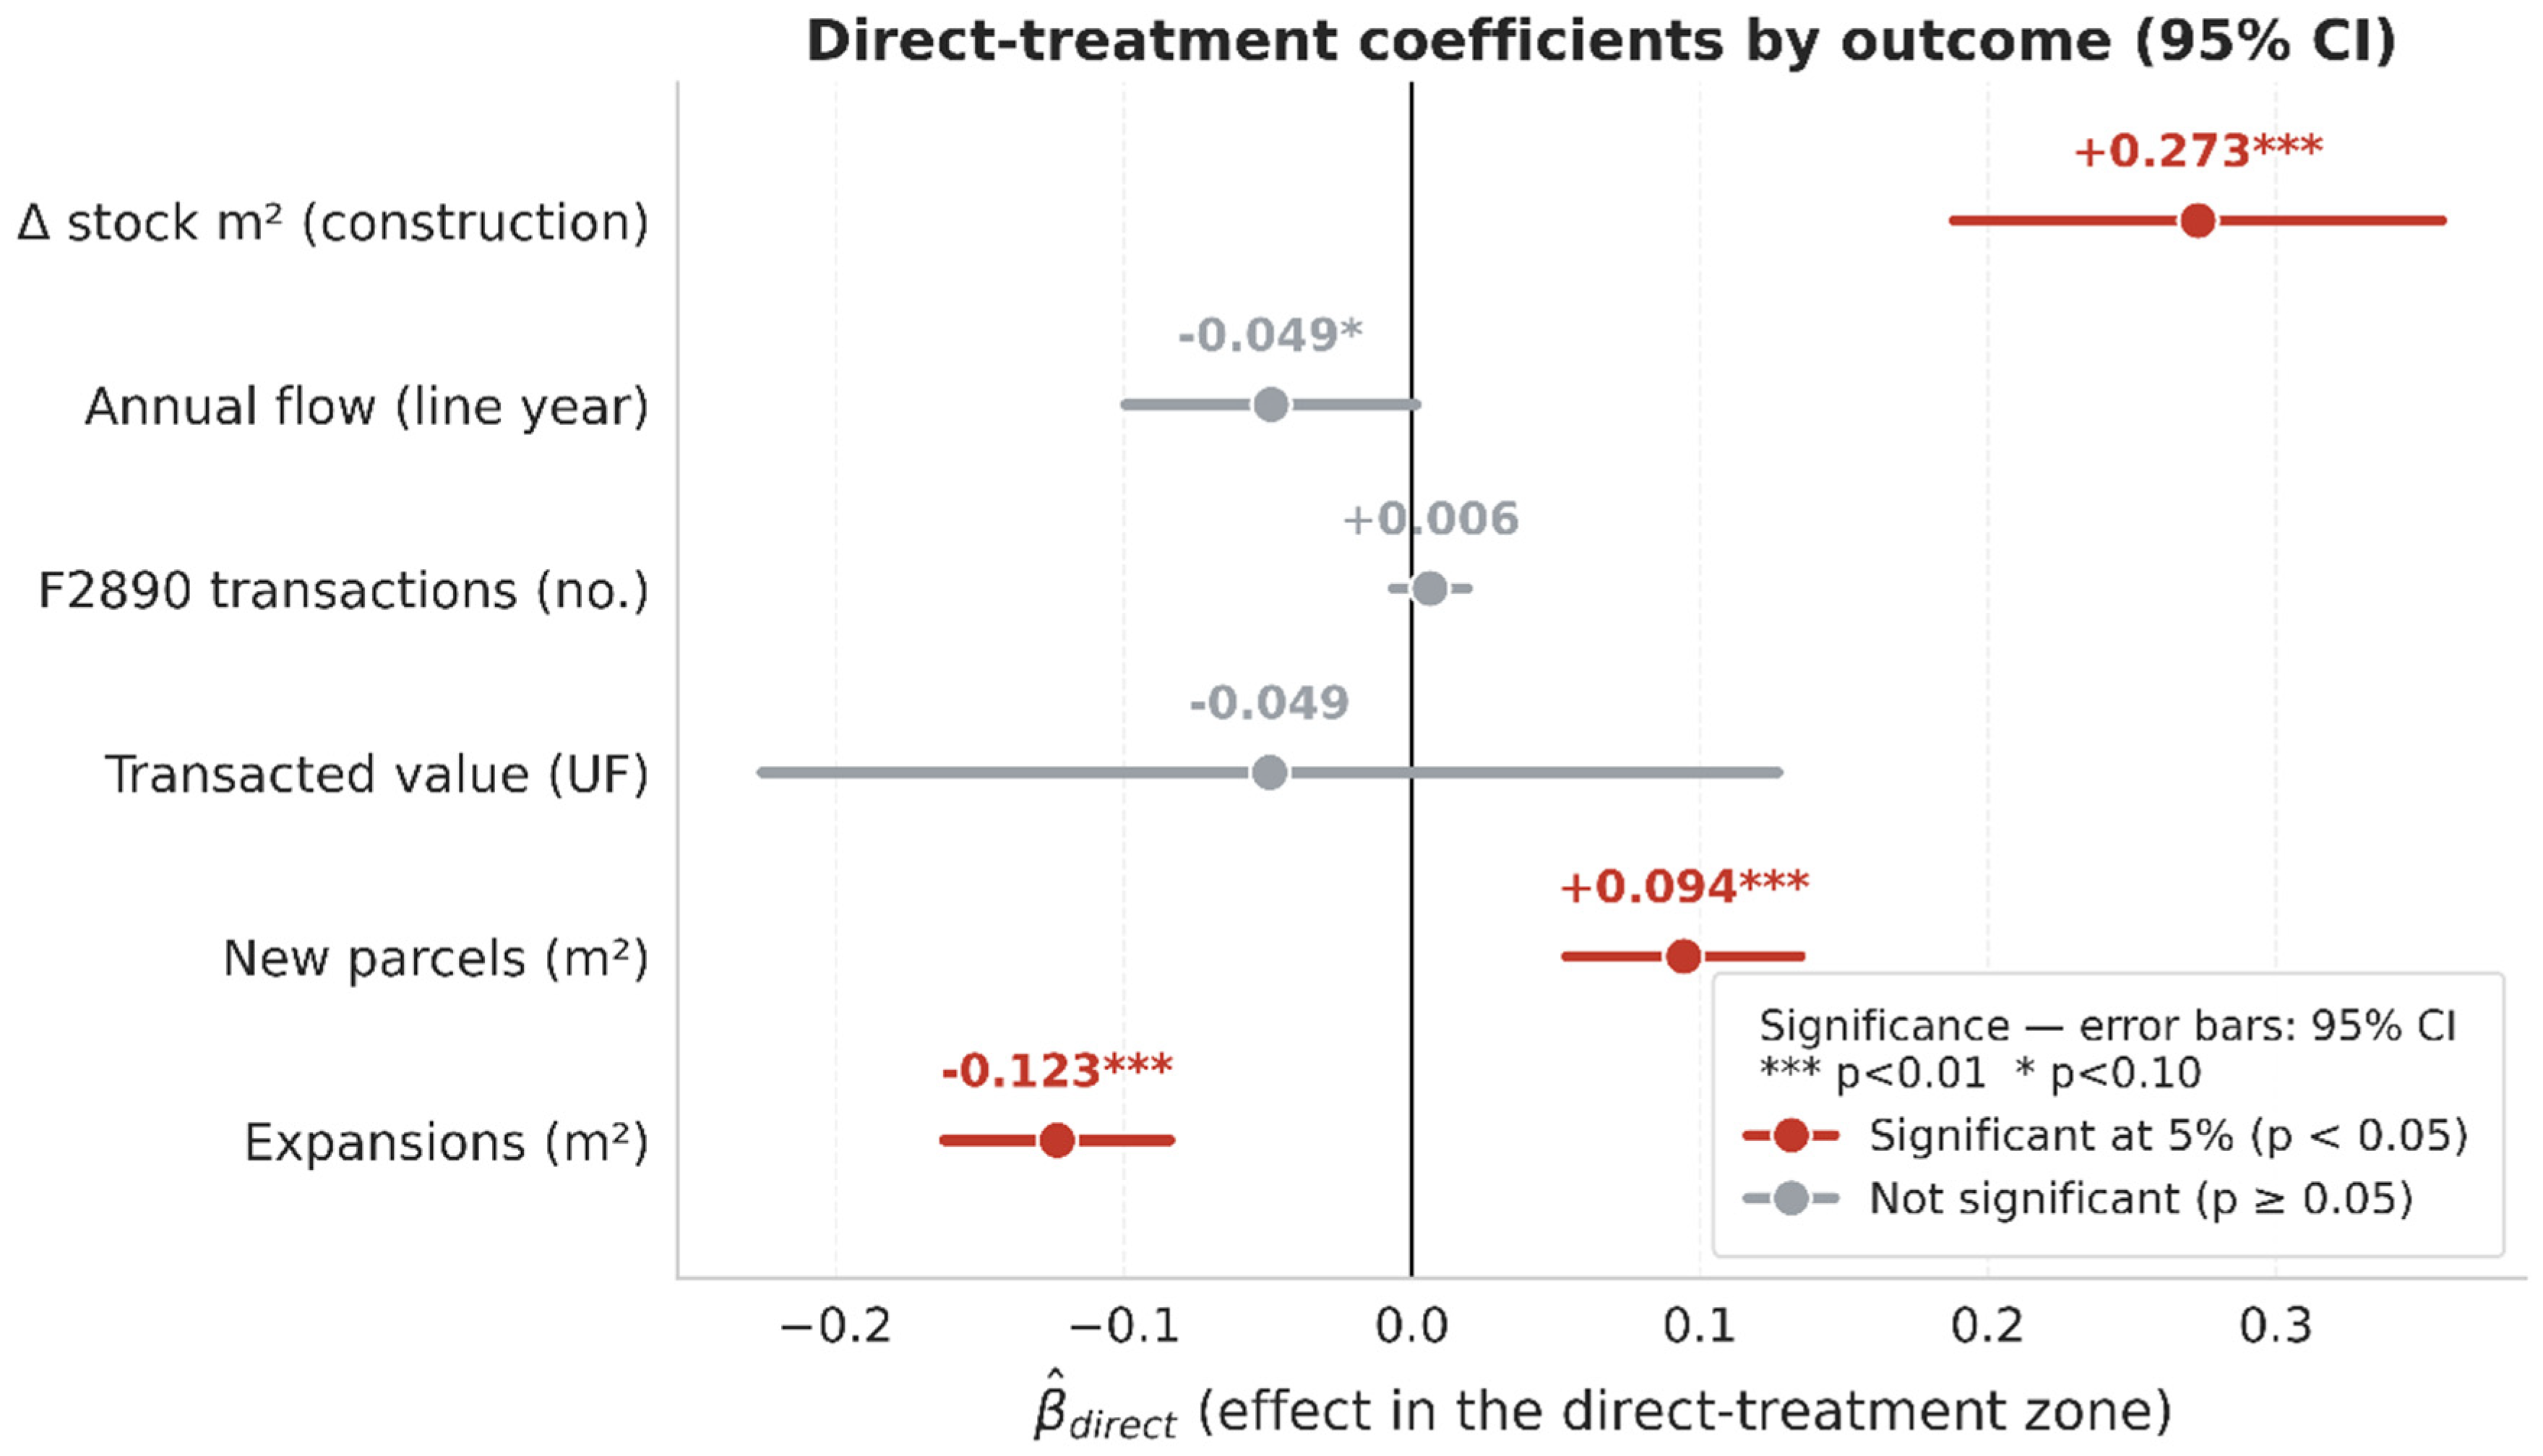
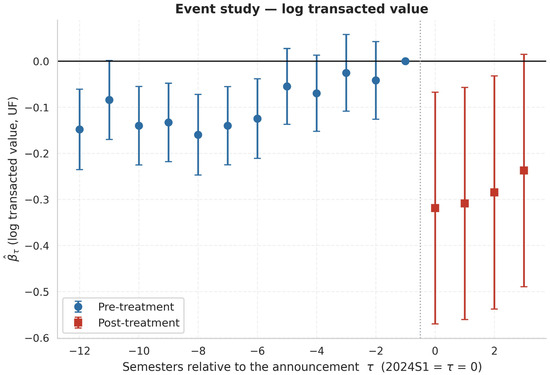
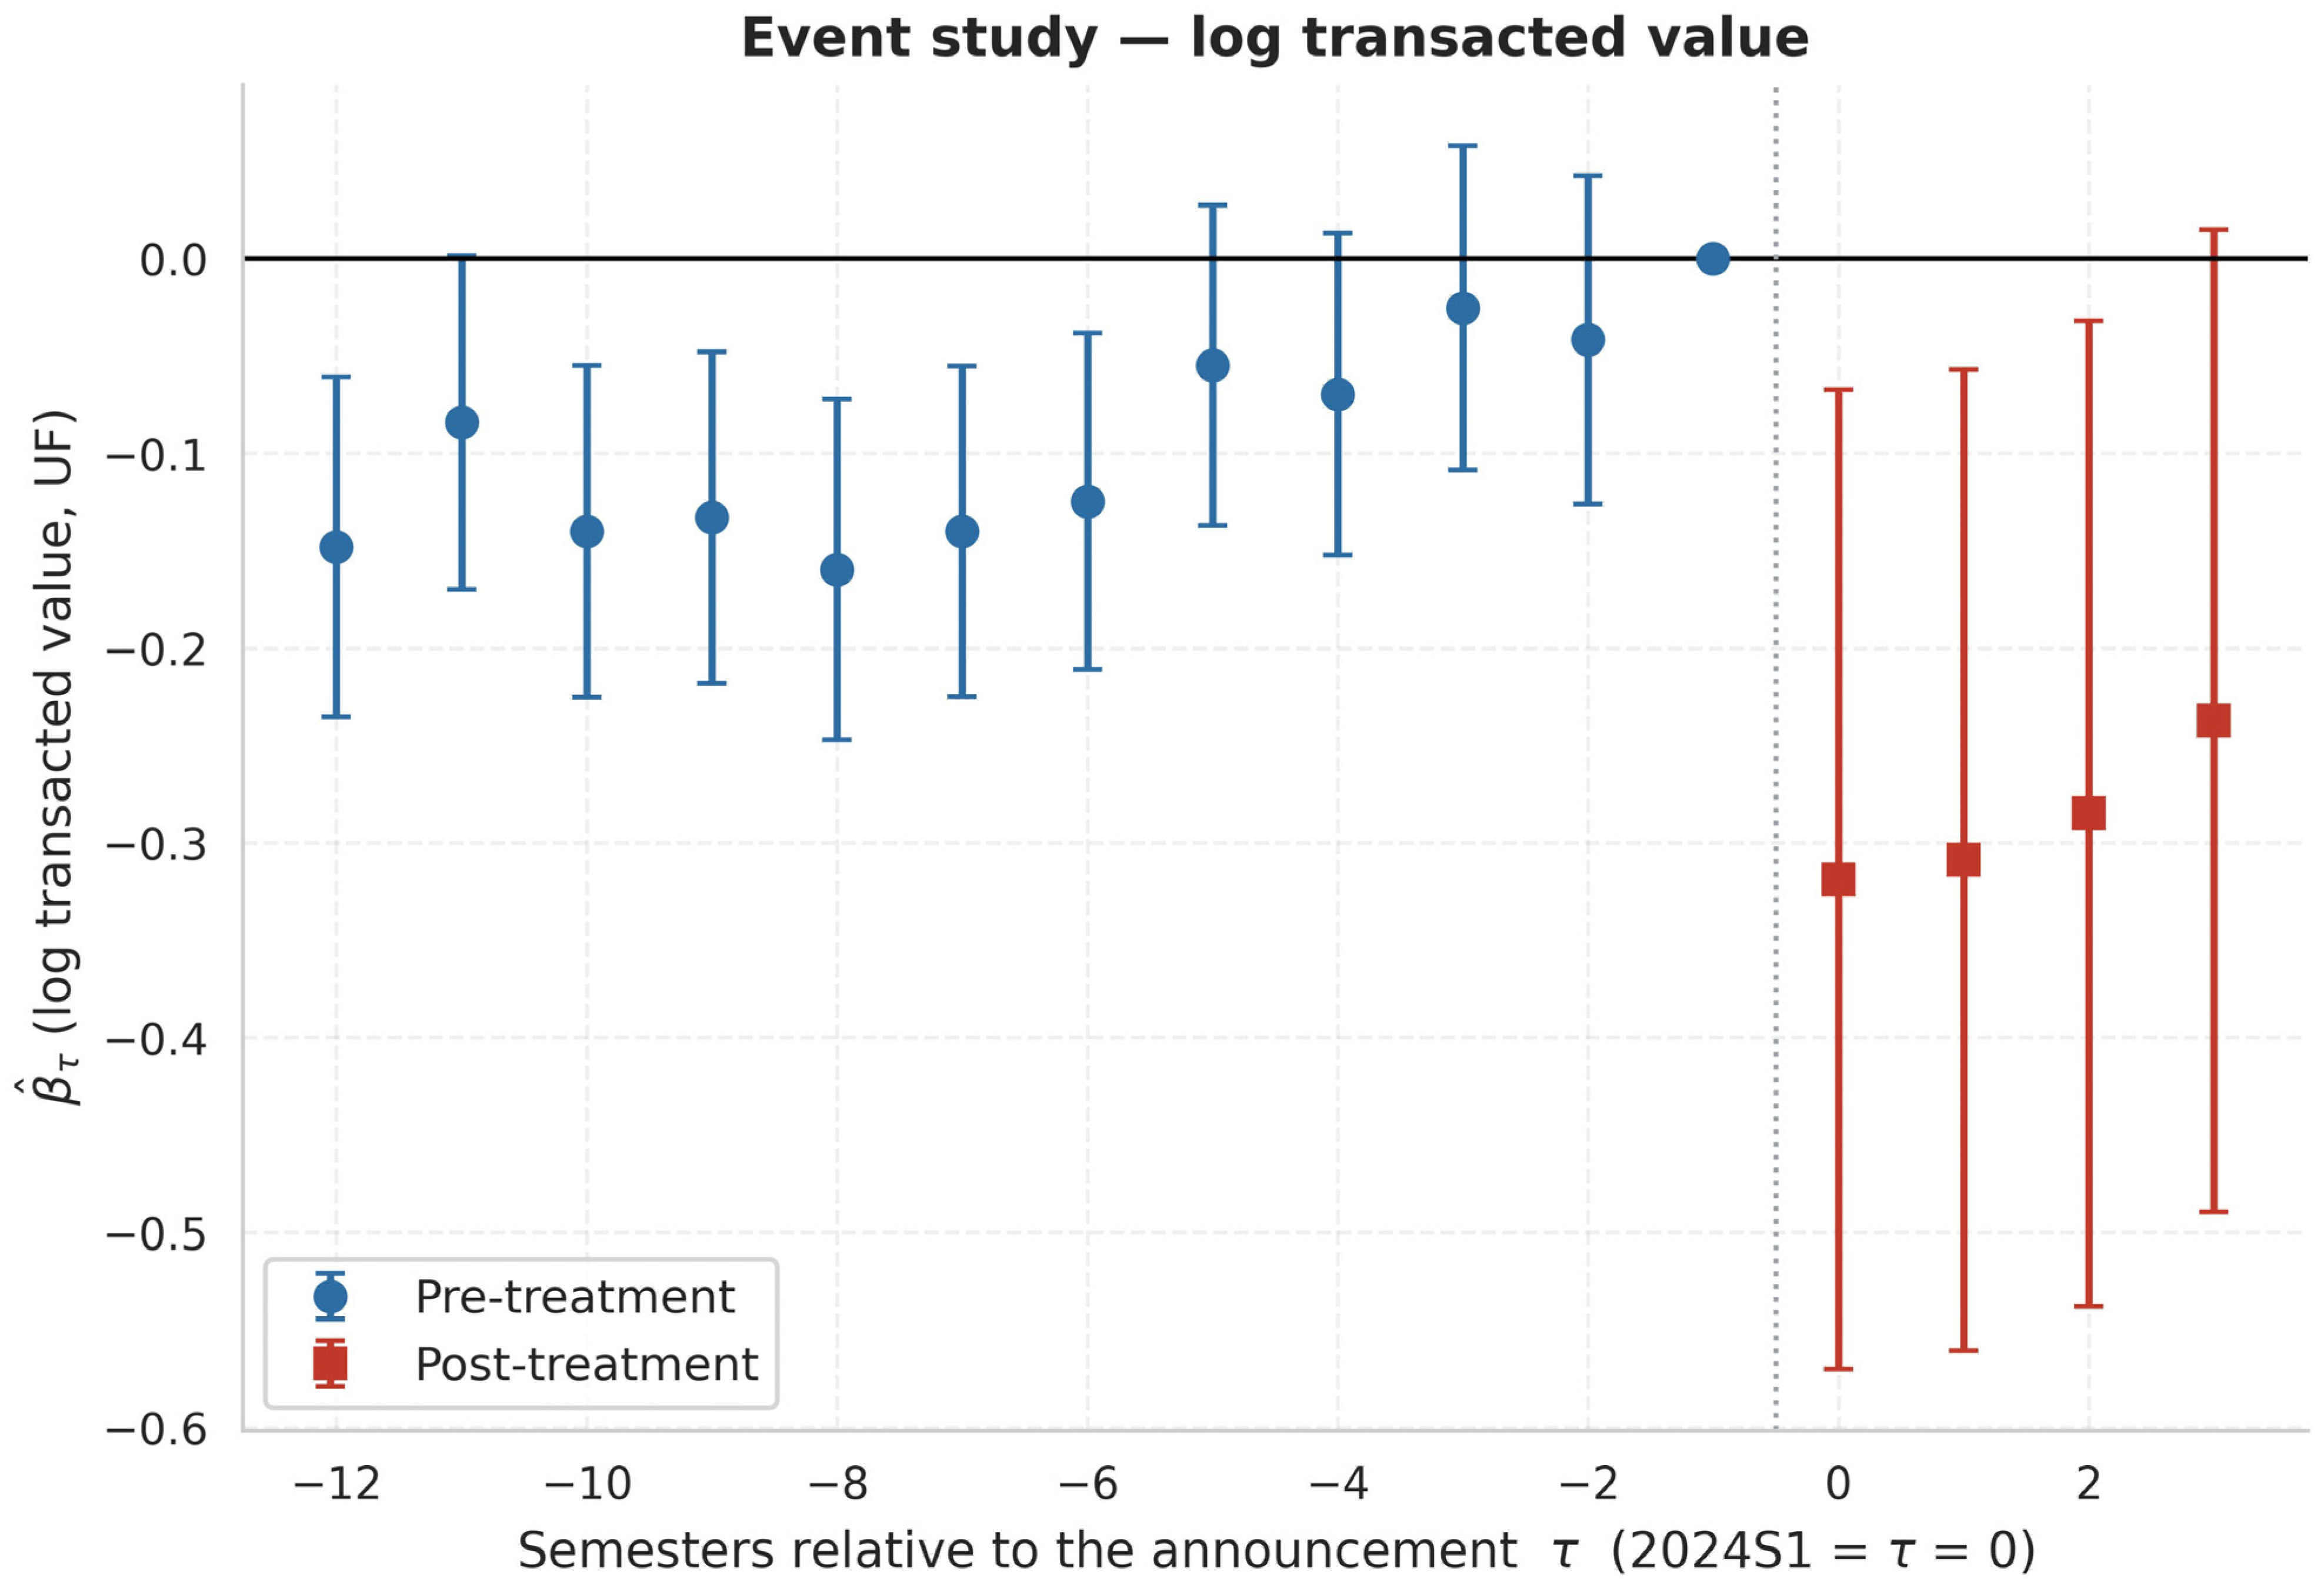
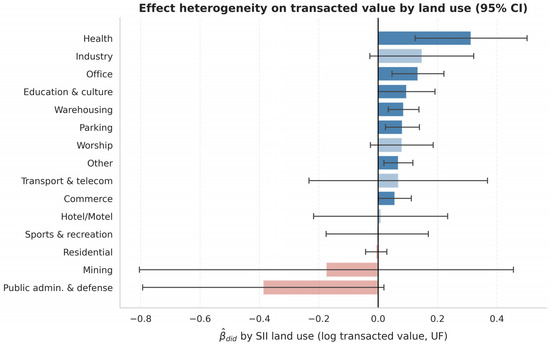
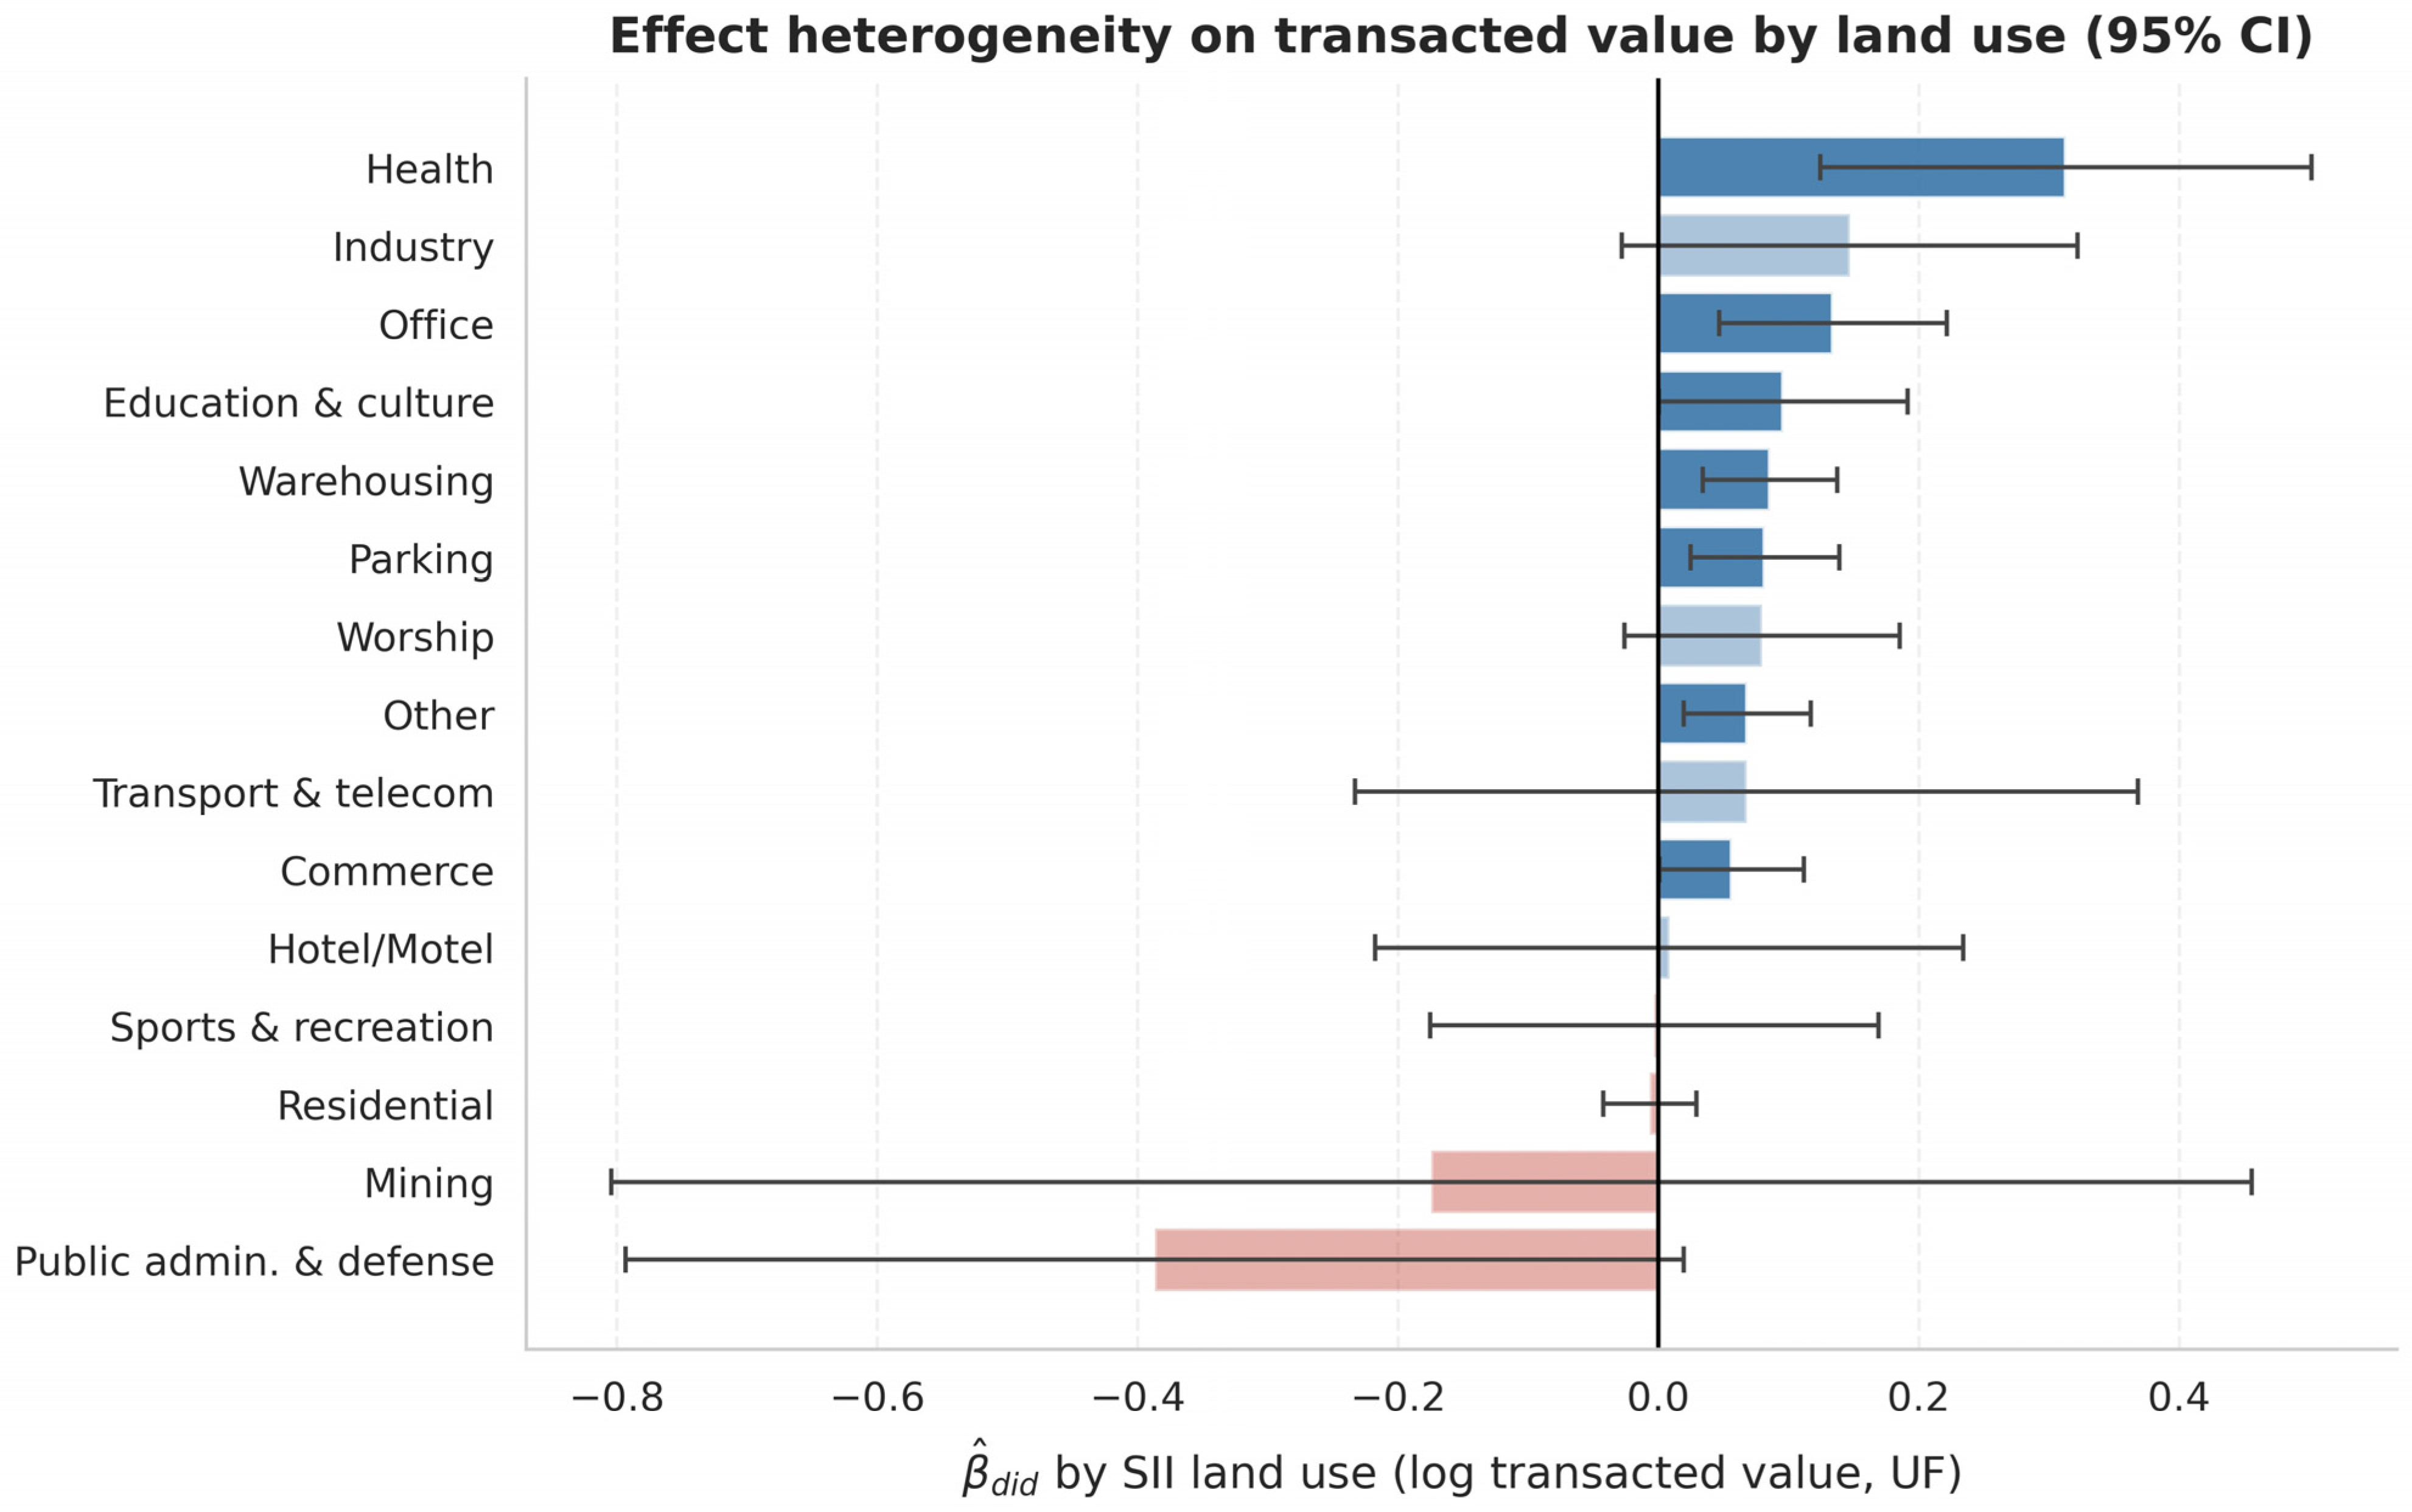
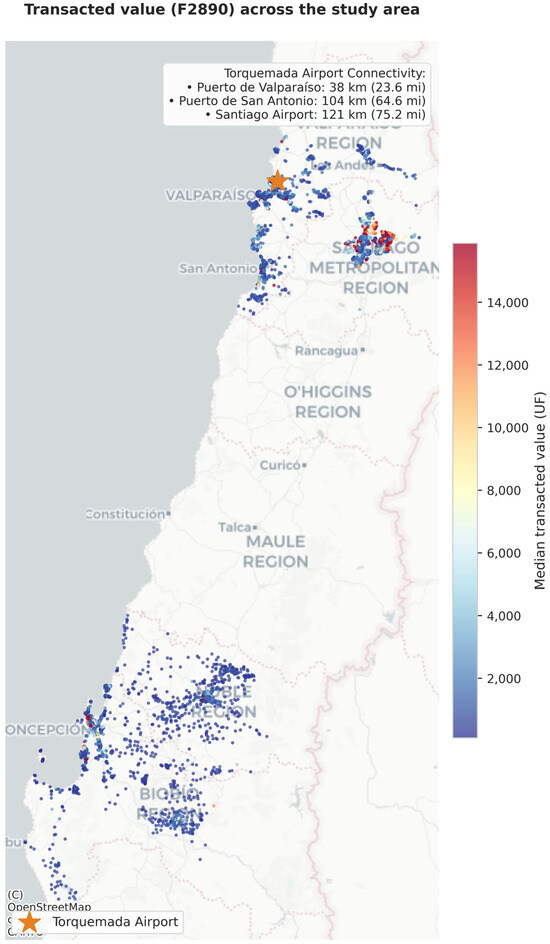
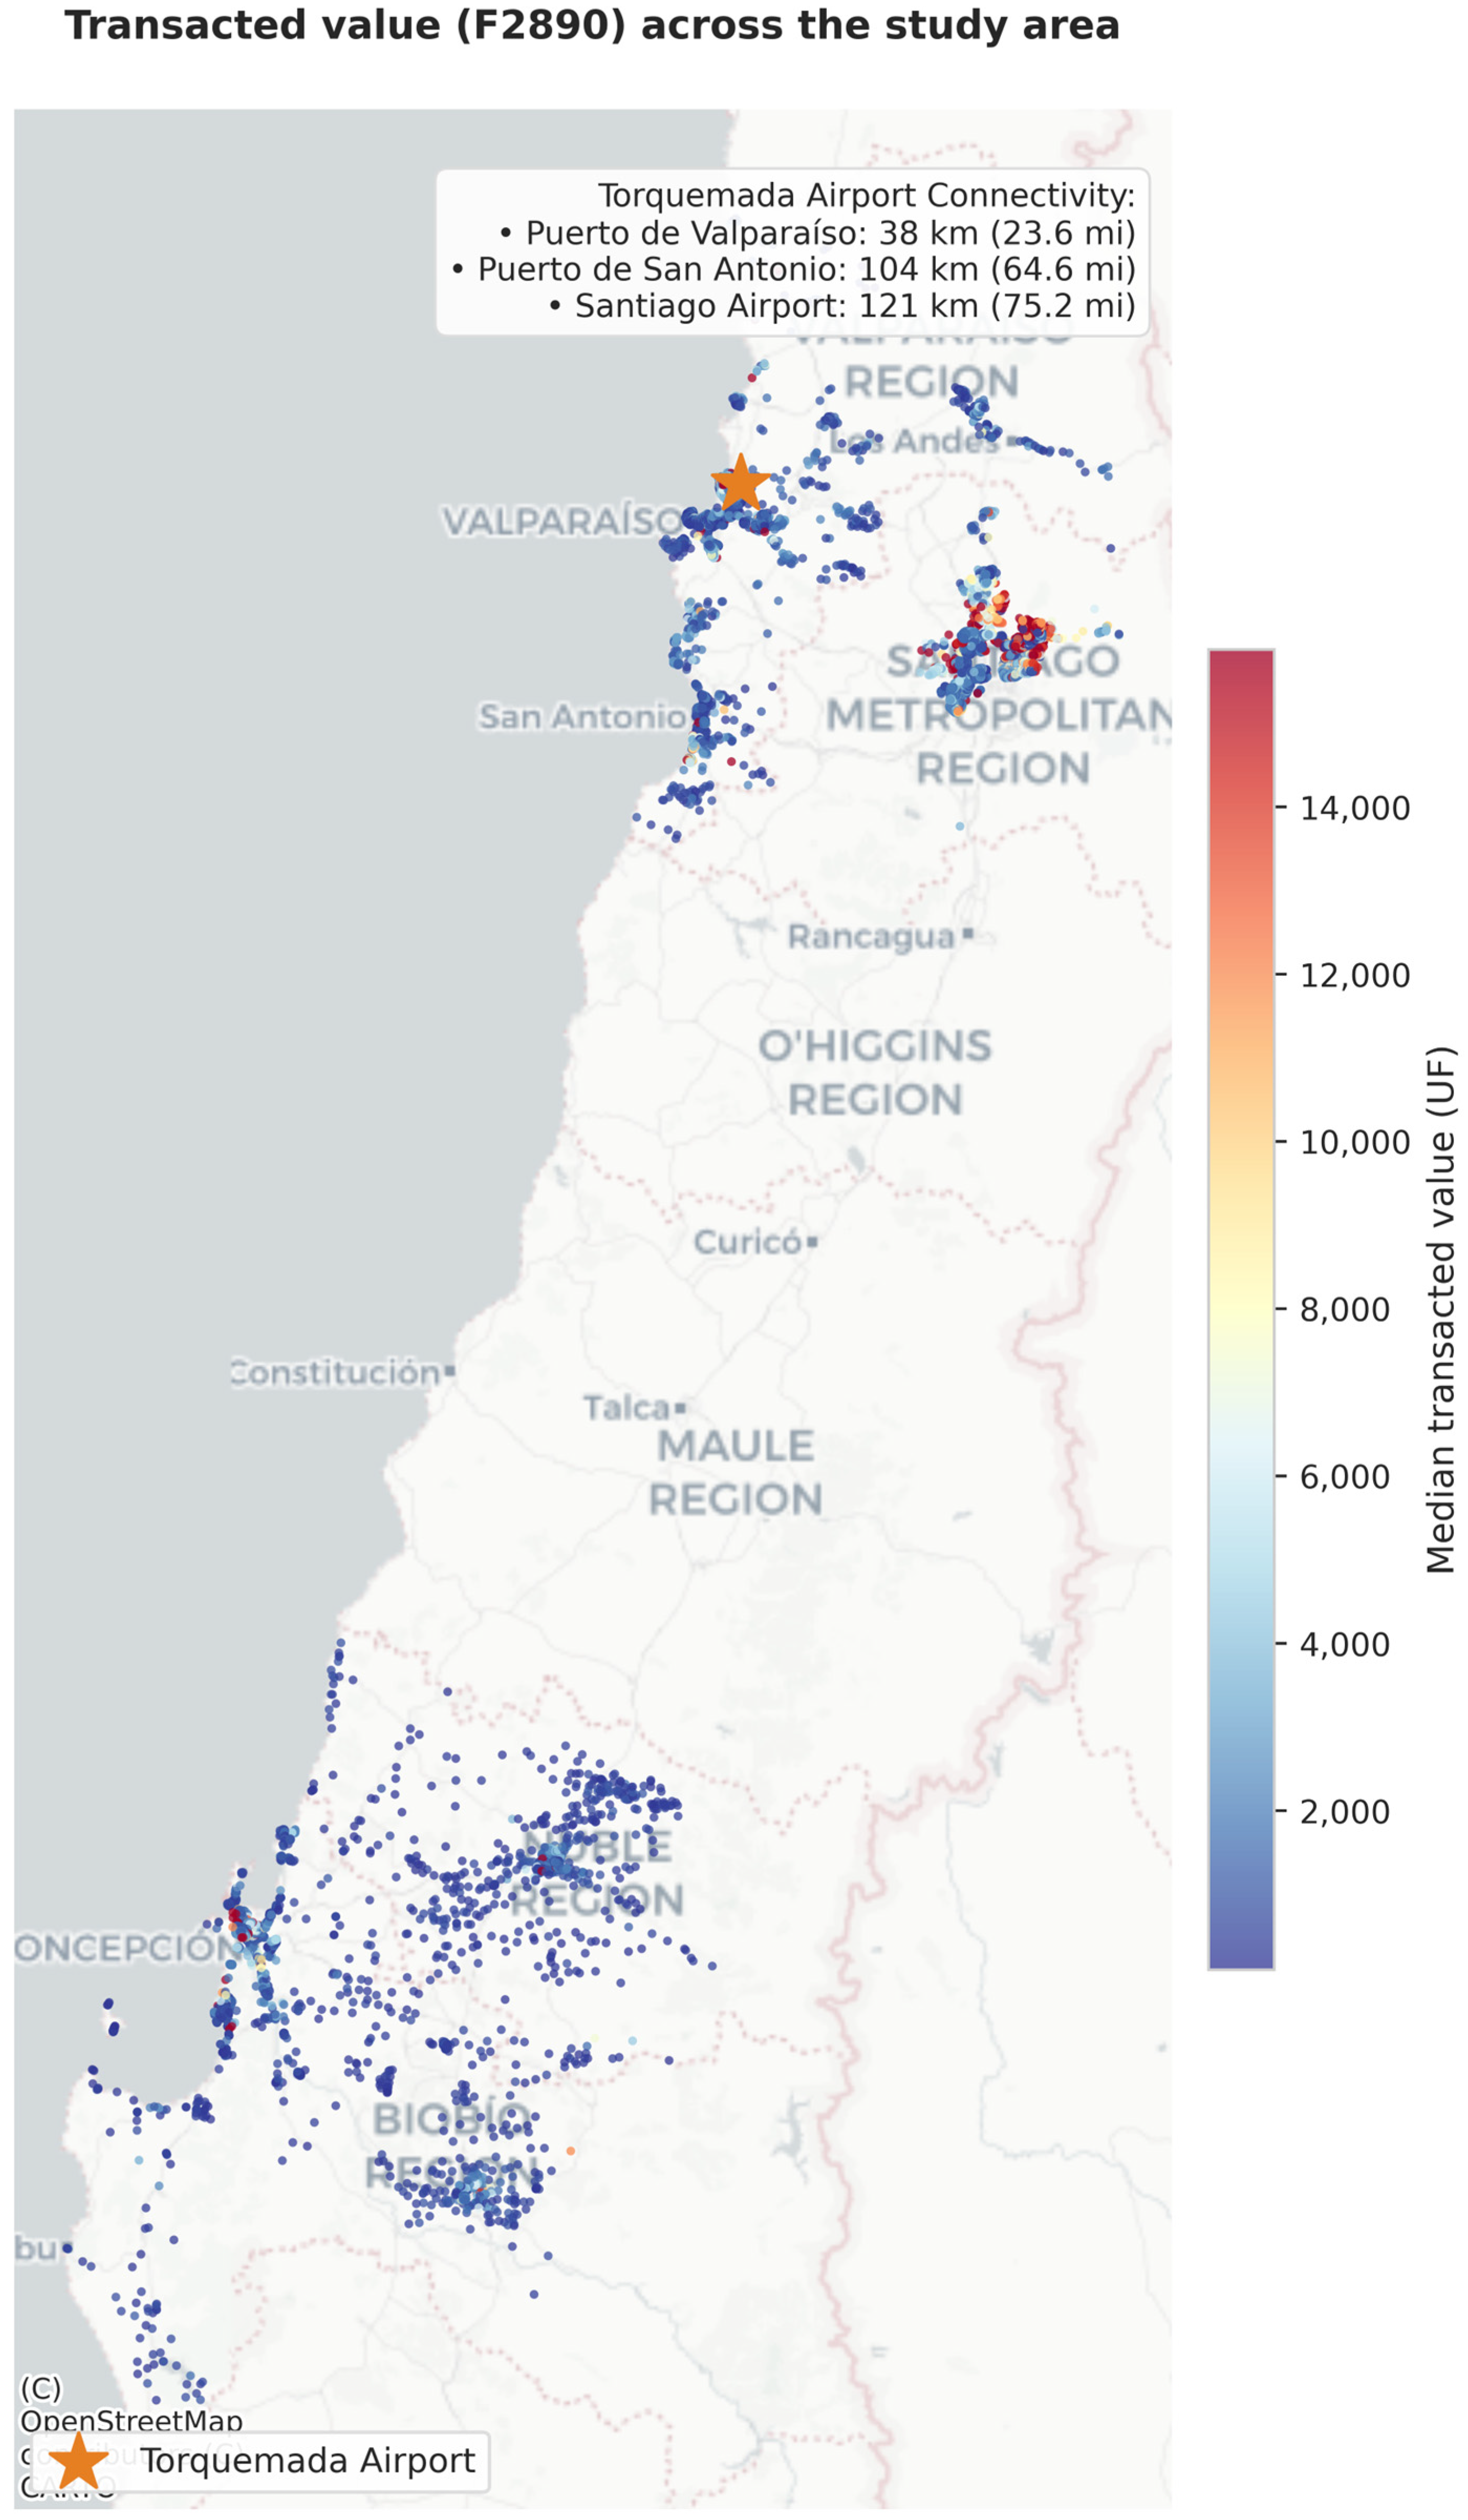
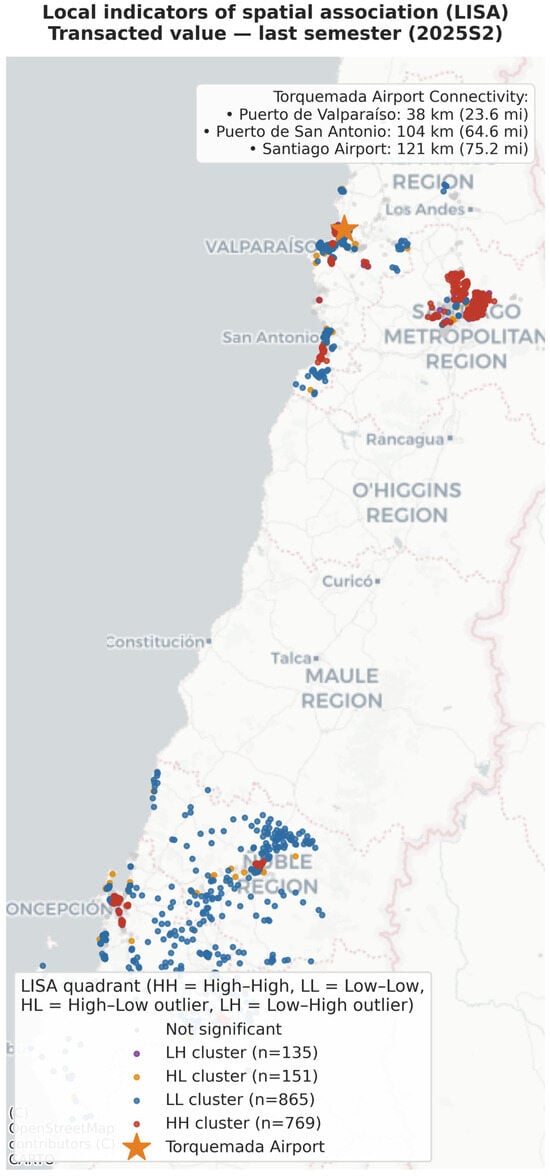
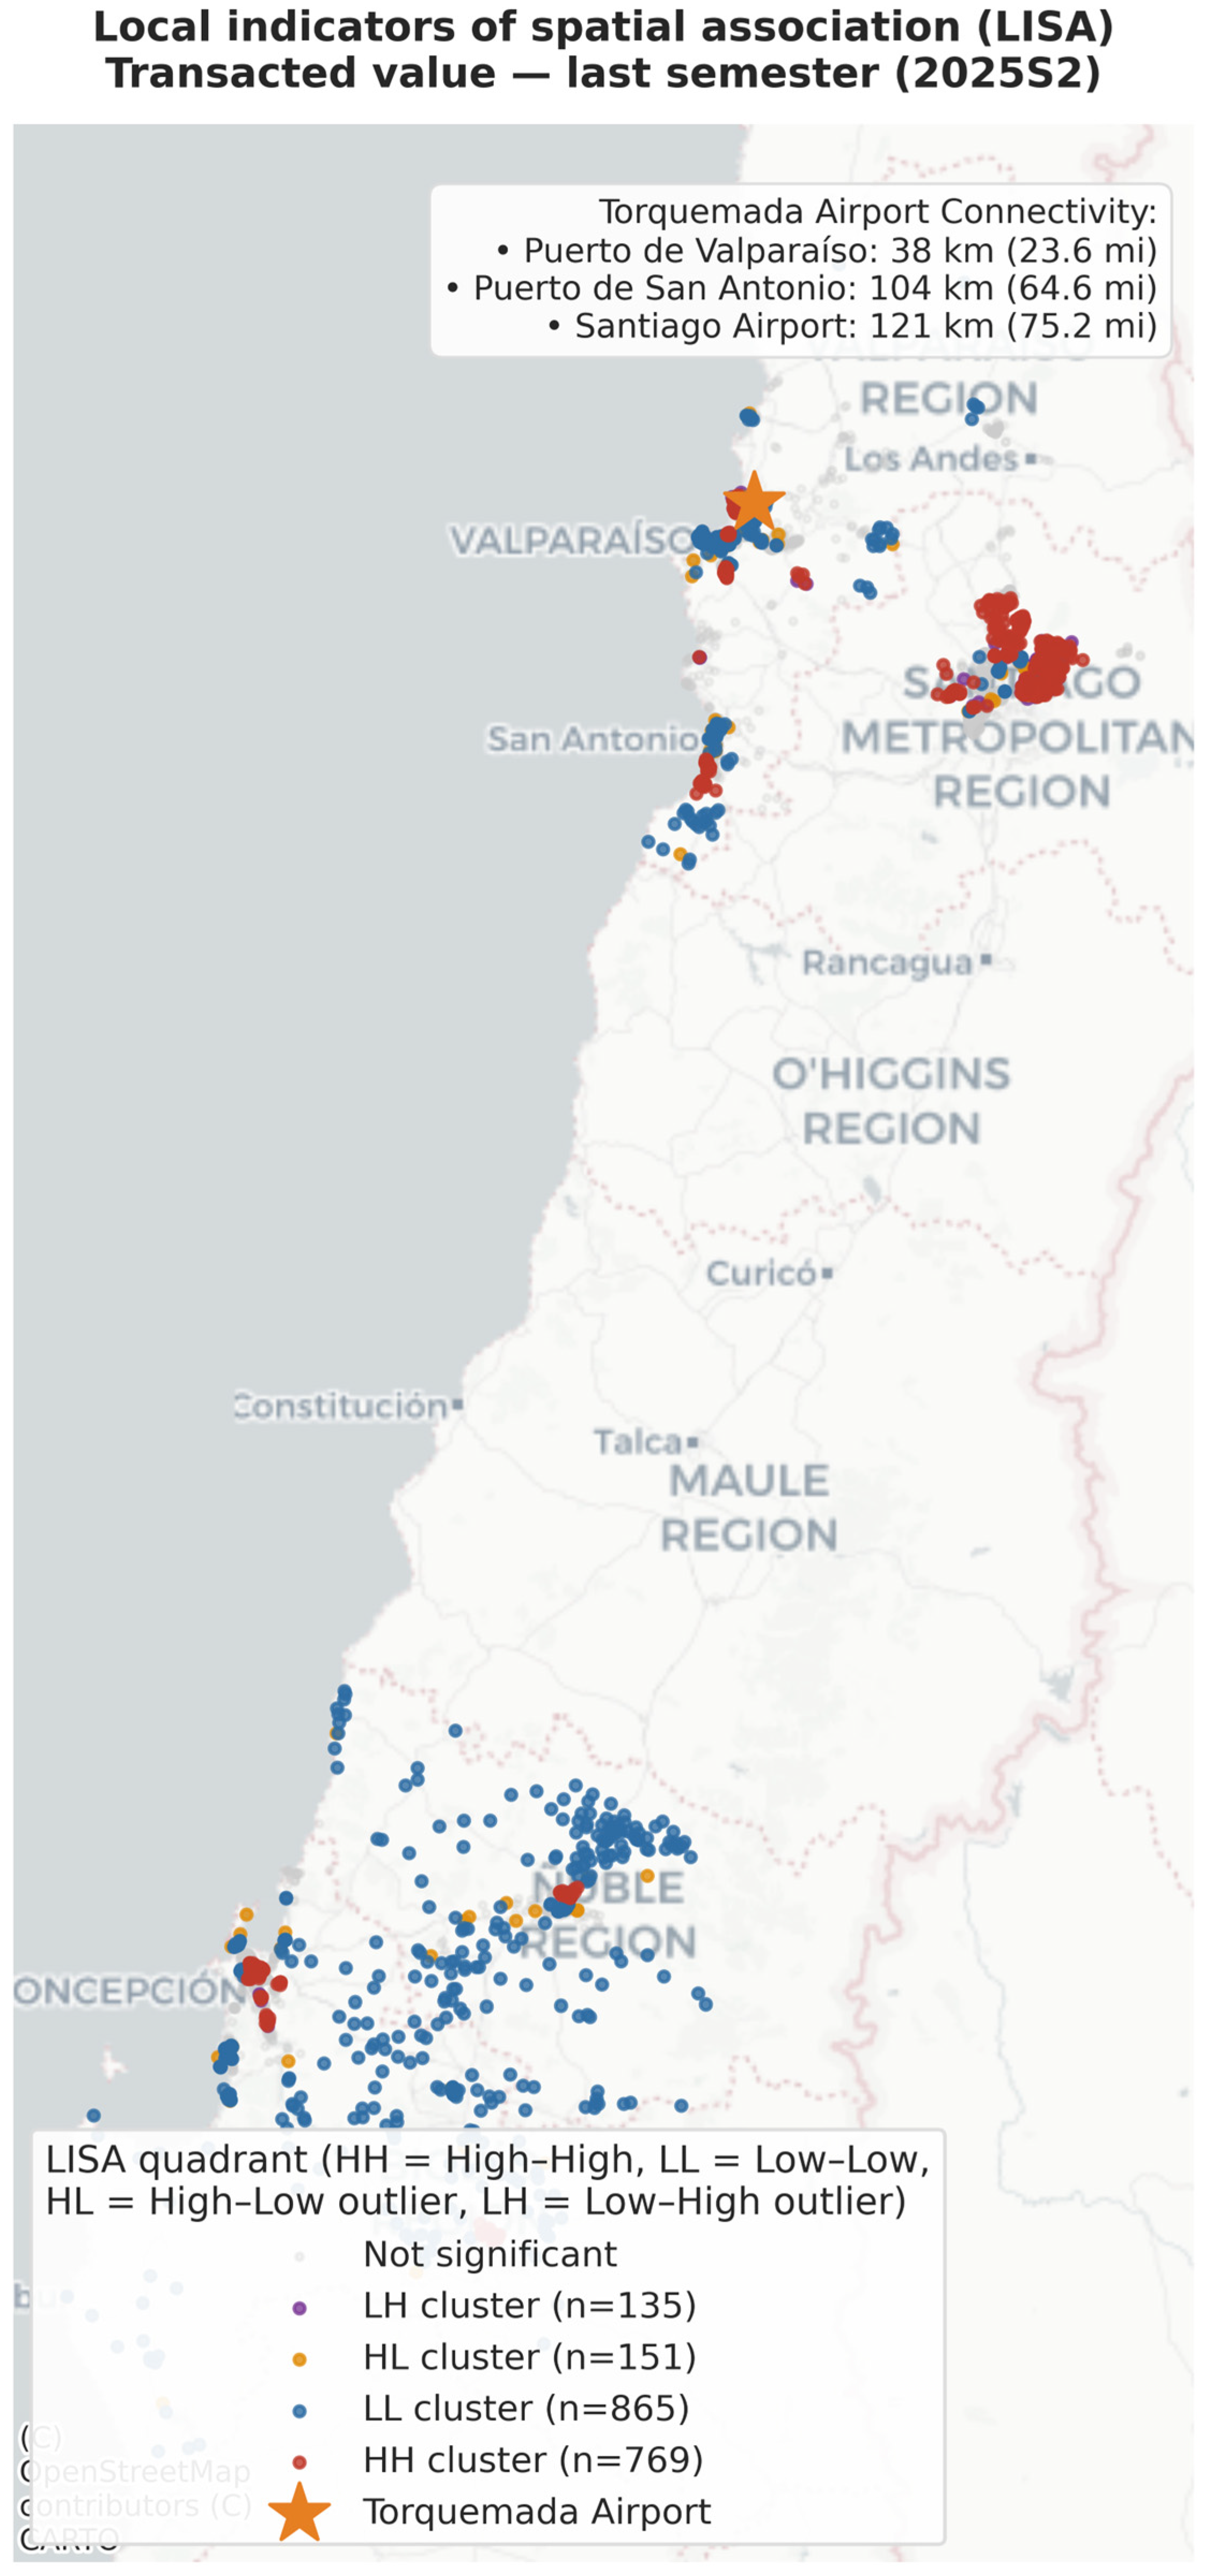
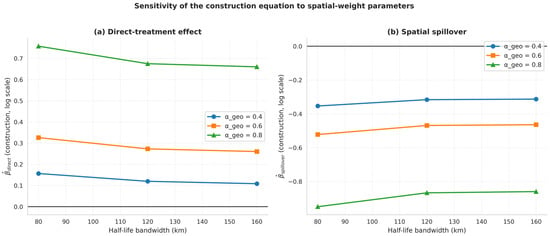
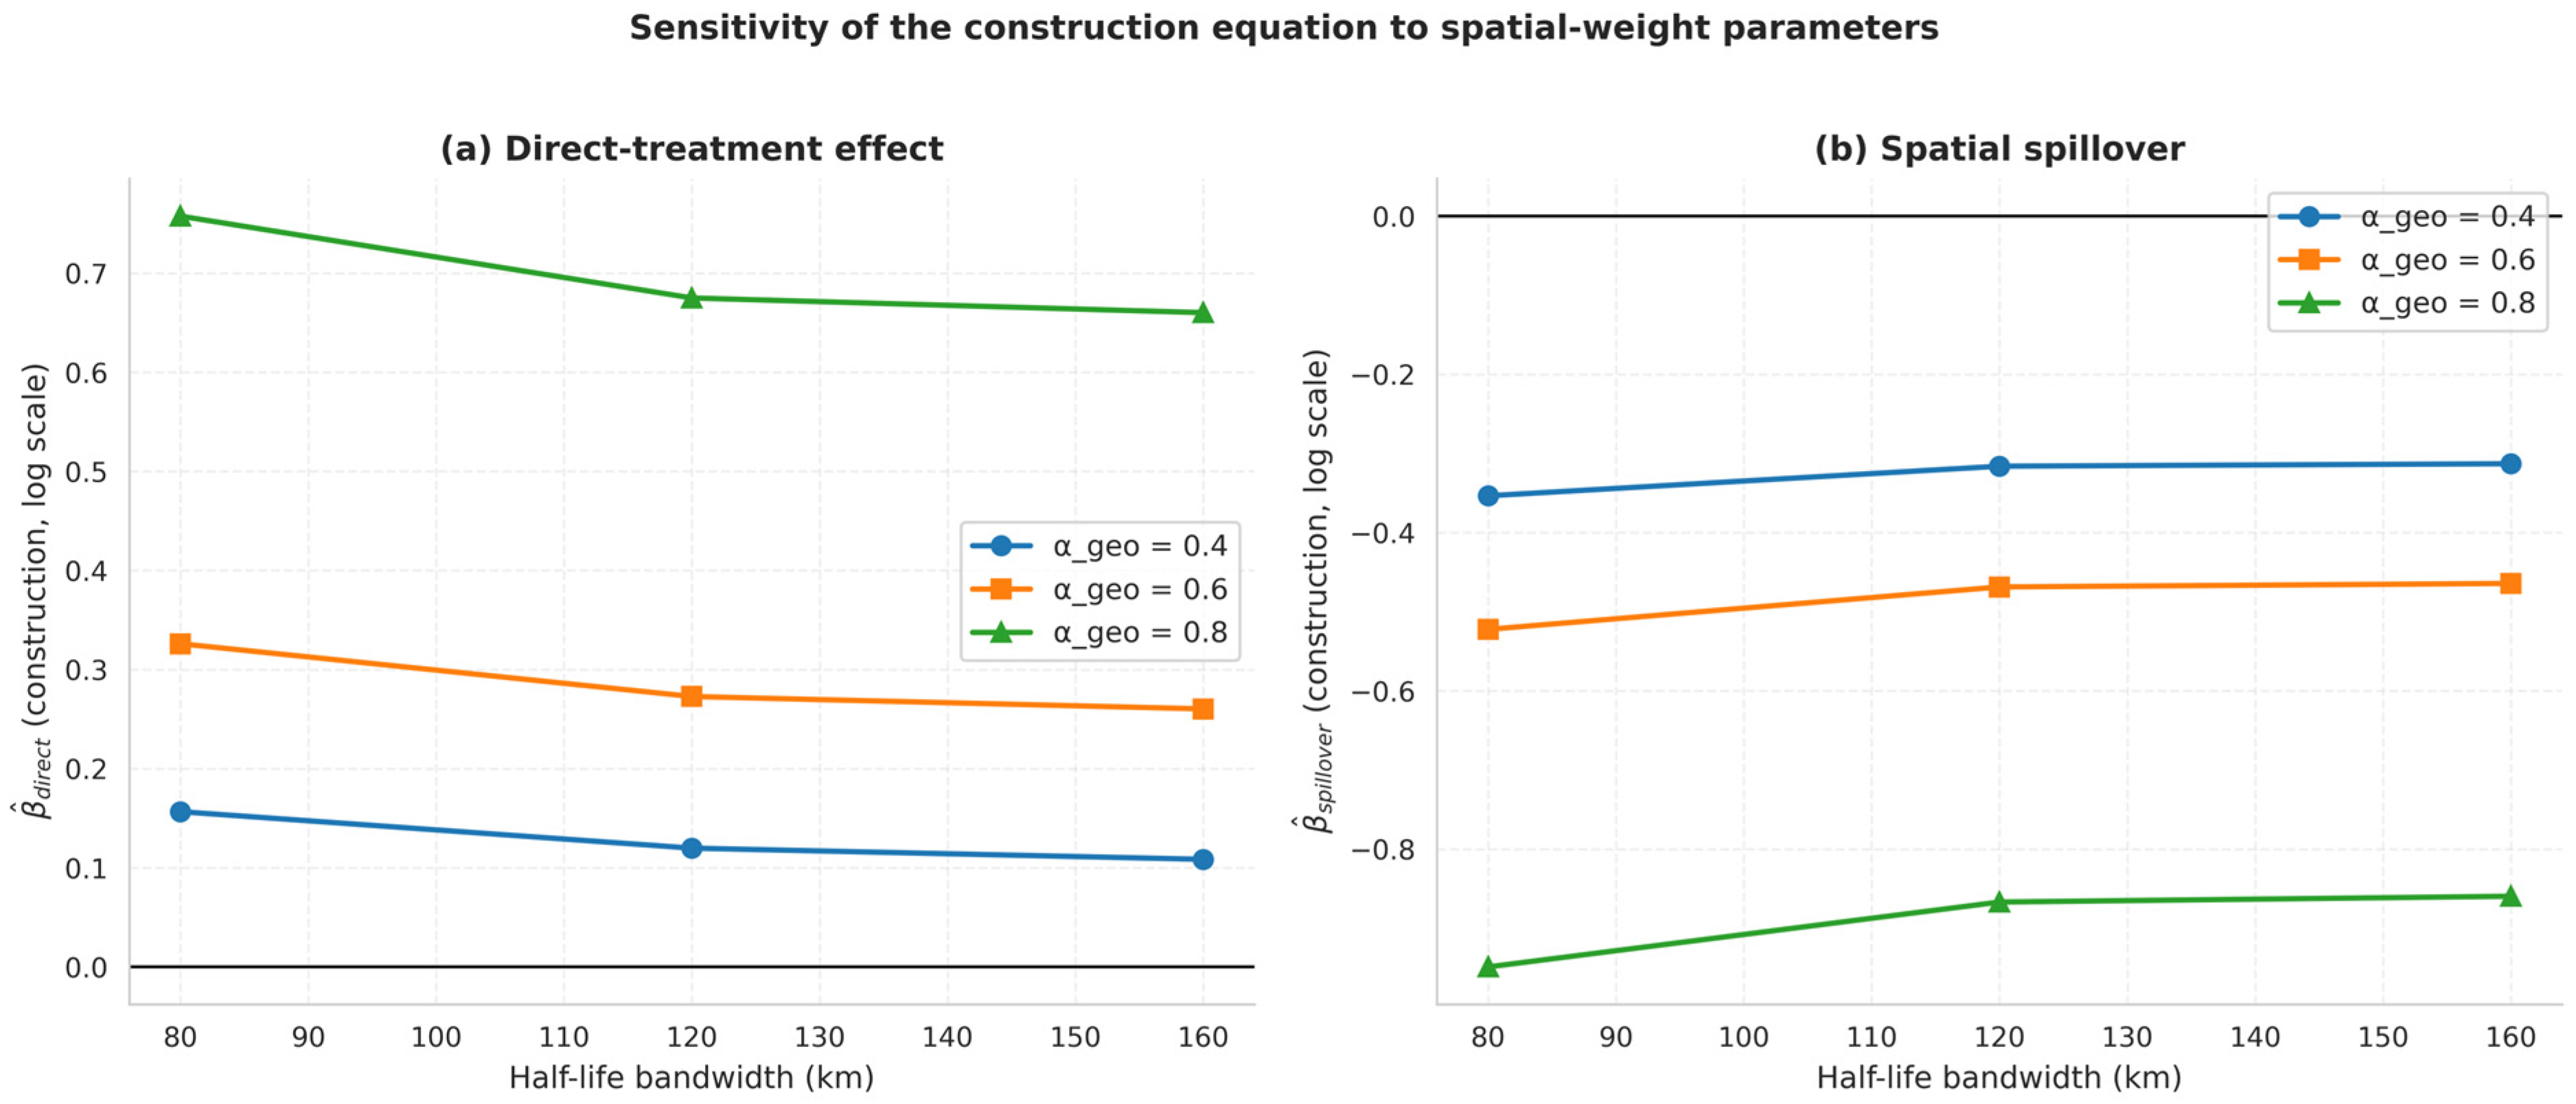
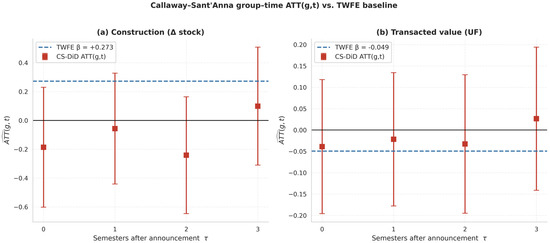
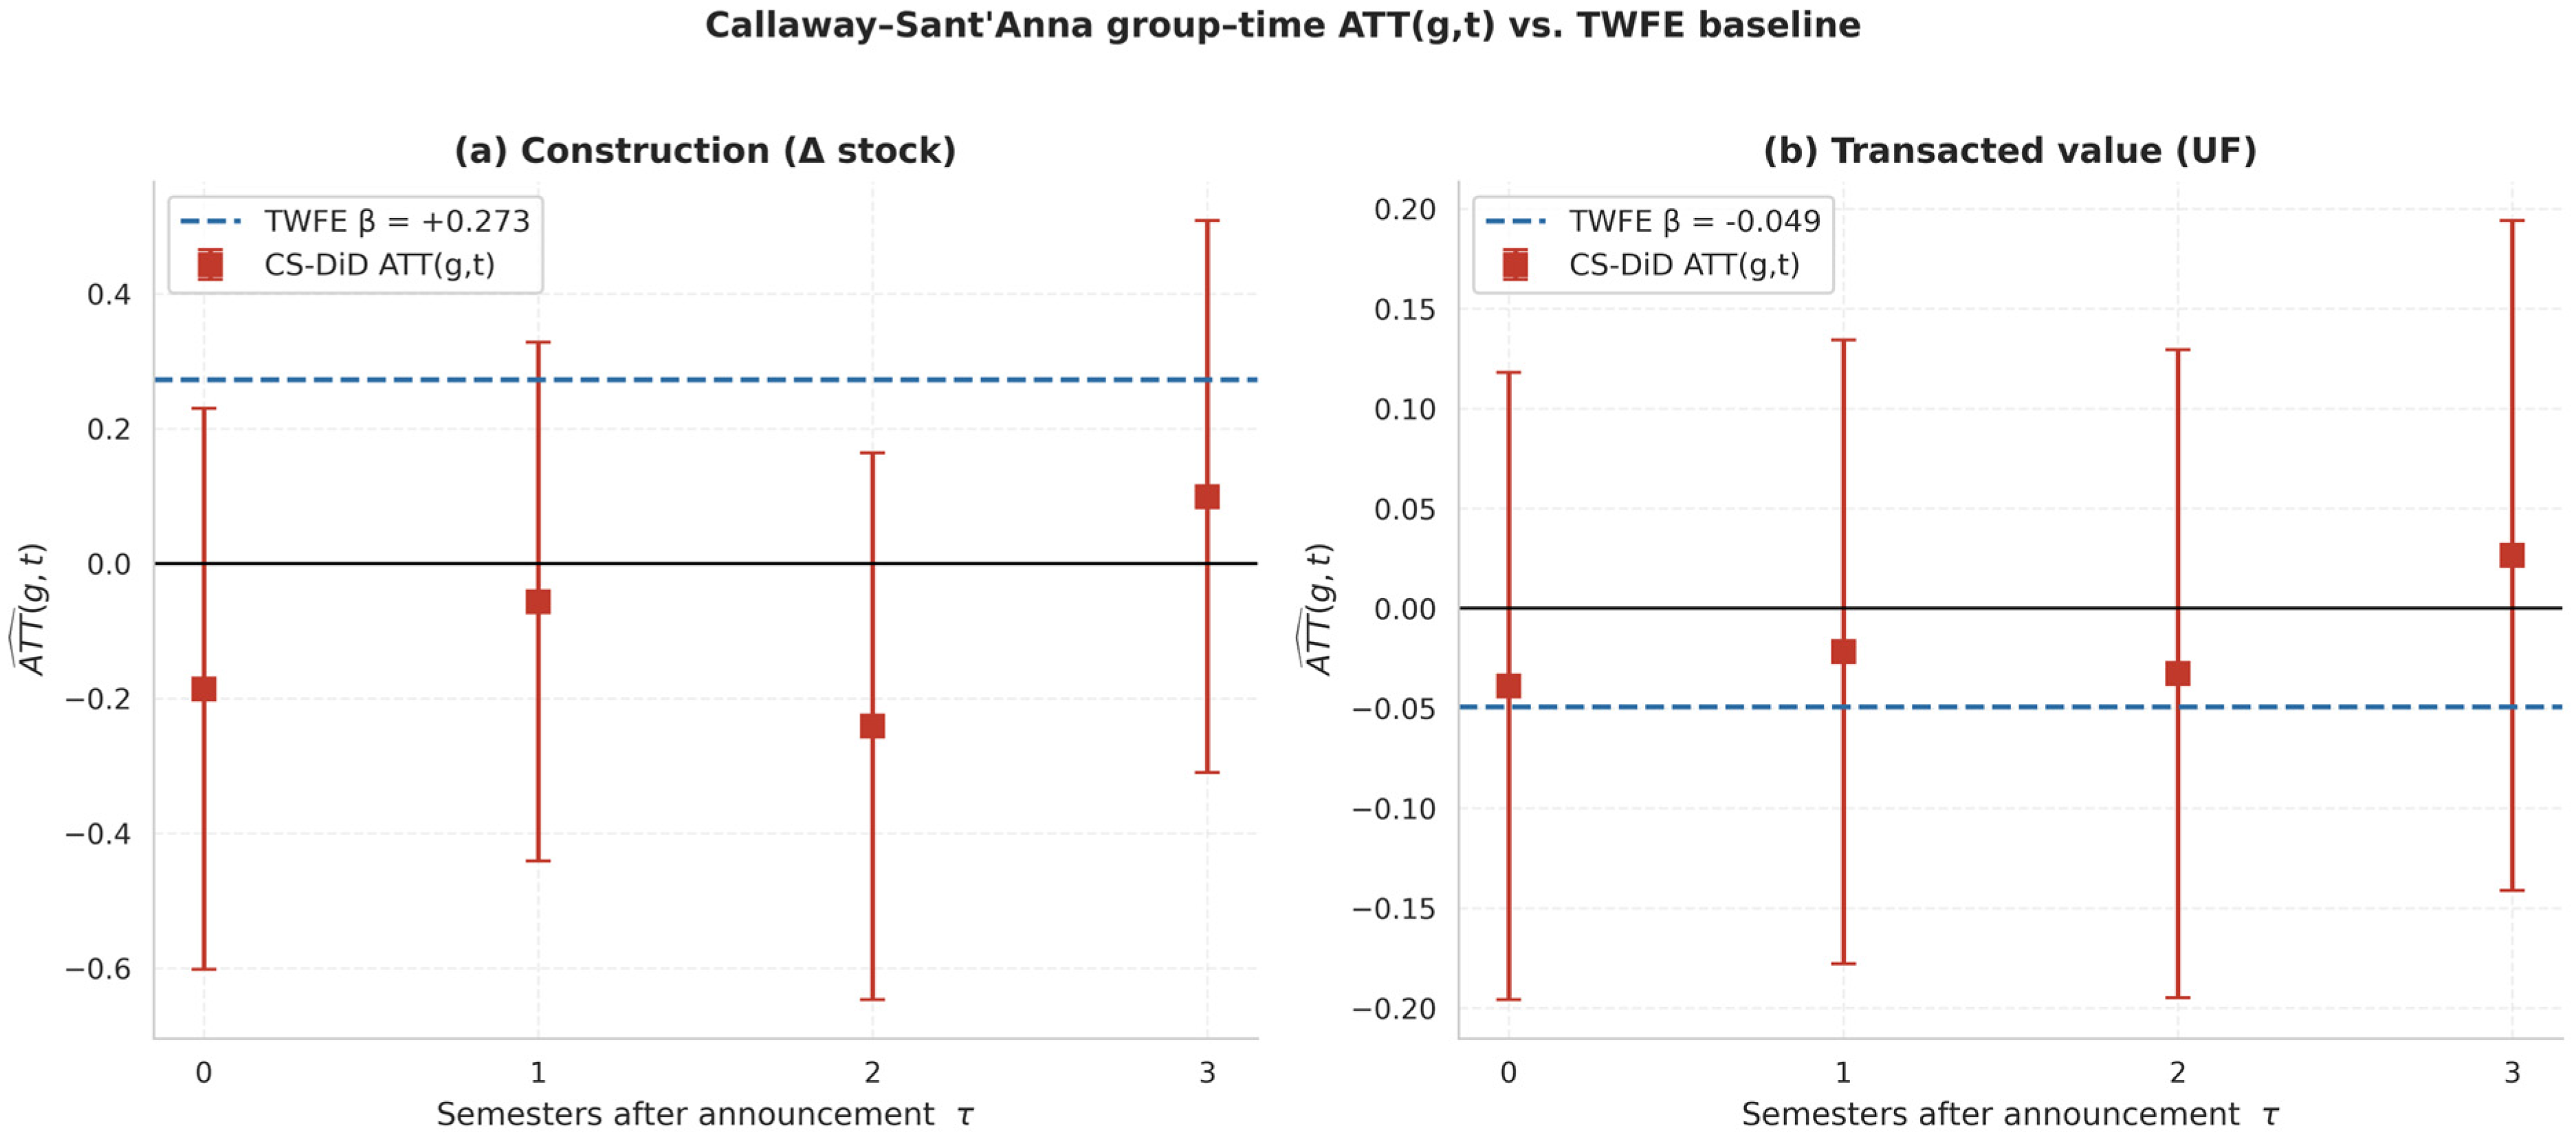
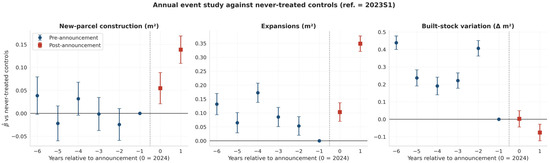
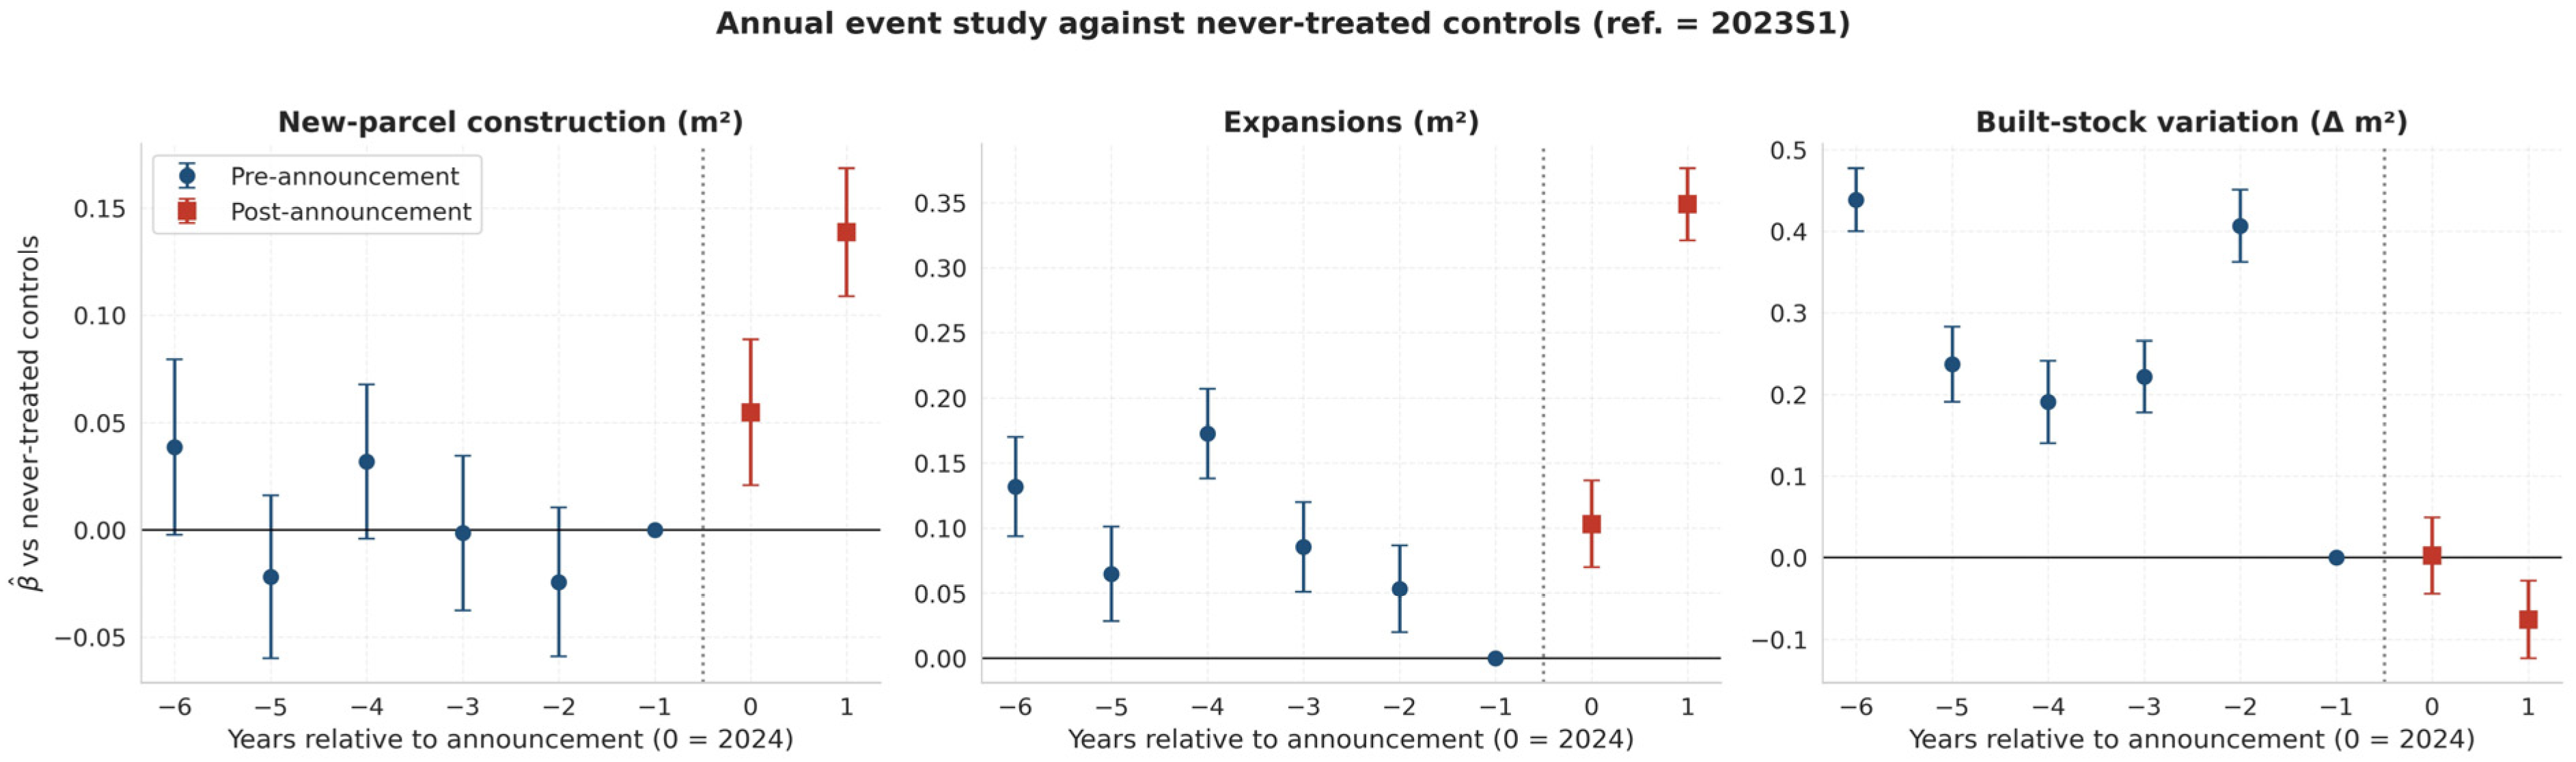

Disclaimer/Publisher’s Note: The statements, opinions and data contained in all publications are solely those of the individual author(s) and contributor(s) and not of MDPI and/or the editor(s). MDPI and/or the editor(s) disclaim responsibility for any injury to people or property resulting from any ideas, methods, instructions or products referred to in the content. |
© 2026 by the authors. Licensee MDPI, Basel, Switzerland. This article is an open access article distributed under the terms and conditions of the Creative Commons Attribution (CC BY) license.