


Abstract
The purpose of this paper is to present a techno-economic methodology for assessing the economic sustainability of offshore wind energy development within the Romanian exclusive economic zone (EEZ) of the Black Sea. The methodology illustrates nine key cases in this area that are grouped into three classes, each positioned at a greater distance from the Romanian coast and thus generating different environments given the water depth and wind climate. The data used for the analysis came from the ERA5 database and covered a 20-year span. Six types of wind turbines with capacities ranging from 5 to 9.5 MW were considered. In determining the levelized cost of energy (LCOE), the turbine with the highest production was considered, which turned out to be the Seimens Gamesa 8 MW, and for the economic model, the components related to both capital and operating costs were considered. Following the analysis, it was observed that the B2 site presents the best wind resources, also leading to the highest energy production of x. Regarding the LCOE analysis, values between 66.86 EUR/MWh and 87.39 EUR/MWh were obtained if the entire energy production is considered. Following the simulation with losses, the LCOE increases to values between 92.19 EUR/MWh and 121.85 EUR/MWh. Finally, an optimization calculation was also performed for the site with the highest LCOE considering another foundation time, after which the LCOE decreased to approximately 111.09 EUR/MWh, if we refer to energy production with losses. The results contribute to the economic sustainability evaluation of offshore wind projects in the Romanian Black Sea and influence future investment plans, sustainable energy planning, and renewable energy infrastructure development.
1. Introduction
Wind energy has become an important component of government strategies for developing renewable sources and supporting the decarbonization of the global electricity industry. The European Union is a leader in this global initiative. In 2020, the EU proposed reducing emissions by at least 55% by 2030 and achieving net zero emissions by 2050 [1]. The offshore wind industry is a well-known renewable resource that has seen continuous growth in recent years, reaching 79.43 GW by the end of 2024. However, this growth only represents about 7% of the total installed wind energy capacity [2]. There is greater preference for onshore wind energy, which accounts for the remaining 97% because of its technology maturity and lower initial infrastructure costs [3].
The field of offshore wind energy is vast and has been studied extensively over time. Research addresses a wide range of topics, which can be grouped into eight major categories. These include: investigation of wind resource potential and model validation [4,5], analysis of the structures used for on-site placement, whether floating or fixed or other components [6,7,8], grid integration methods [9], production costs and levelized cost of energy (LCOE) [10], the impact of wind farms on the environment and biodiversity [11], operation and maintenance [12], spatial planning [13], and legal framework [14].
LCOE integrates all the previously mentioned factors, with an emphasis on the economic aspect. The primary aim of calculating LCOE is to support the sustainable development of offshore wind energy by identifying economically viable projects and locations. The process includes a thorough evaluation of both initial and ongoing expenses, as well as the expected income from electricity generation. Consequently, LCOE serves as a useful metric for assessing the economic efficiency and economic sustainability of offshore wind energy projects, as well as for comparing renewable and conventional energy sources. Lower LCOE values indicate a more competitive and economically sustainable utilization of available wind resources.
Many studies conducted in this area primarily concentrate on pinpointing the best sites for farm placement. These locations could offer specific benefits, like cost reduction for various economic factors, or showcasing the potential advantages they may provide for the offshore wind sector. Such topics are explored in the referenced works [15]. There are studies that focus on replacing certain components and presenting various possible solutions—for instance, those related to different types of foundations. The LCOE simulation in the study [16] shows the implications of all types of foundations. Additionally, ref. [17] offers a similar analysis, but it focuses solely on floating foundations. This topic is frequently examined through spatial analysis [18]. This analysis also enables the understanding of other fundamental factors, such as the influence of distance from the shore, which results in significant increases in costs in relation to the various components and particularly on the transmission, a topic that can be examined in the work [19]. Furthermore, a wide variety of turbines are seen to be employed in research, enabling a more comprehensive understanding of the effects they have, particularly on production, which can have a positive or negative impact on LCOE. This is done by analyzing similar locations in various studies using turbines of varying capacities. Thus, in work [20] and in work [21], we can observe an analysis that intersects a similar area, such as the North Sea, but the effects of different choices can be identified in the results obtained for the LCOE.
Operating and maintenance (OPEX) costs are an essential characteristic of the LCOE component, and more accurate calculation approaches have been explored to reduce uncertainty [22]. The paper [23] discusses different policies and identifies the optimal number of turbines that could be installed, as well as proposing an algorithm that aims to maximize the benefits obtained from each inspection by planning the specific turbines to be inspected at each visit. Another well-studied and important issue is the wake effect, a physical phenomenon that influences wind turbine performance. This phenomenon was researched in [24], and its impacts were found to result in significant changes in LCOE, which is more noticeable in bigger wind farms. The wake effect is essential because it allows for the optimization of farm layout, which may have a direct impact on the LCOE, as examined in [25].
This study aims to determine the LCOE for the Romanian exclusive economic zone on the Black Sea, using historical data available in the literature. The costs were expressed in reference units (EUR/MW, EUR/m, EUR/unit) and, where necessary, costs were converted into EUR from the currency considered in the reference study. The wind speed data were taken from the ERA5 database considering a 20-year period from 2006 to 2025. In this regard, this work will be guided by the following research questions: (a) How does the local wind regime influence the energy performance (AEP) of turbines for different locations? (b) What is the impact of site conditions and infrastructure costs on the LCOE? (c) Can the economic feasibility of an offshore site be improved by optimizing the foundation type?
Similar to any other analysis based on data and economic hypotheses, the work also presents a series of constraints, among which we can mention the spatial resolution of the data obtained from the database, the uncertainty of certain costs, the simplified model used in determining certain costs and aspects not included in the analysis due to the difficulties in determining them.
2. Materials and Methods
2.1. Target Area
There are six exclusive economic zones (EEZs) in the Black Sea. Each one belongs to a coastal state and gives exclusive rights and privileges over natural resources and economic activities.
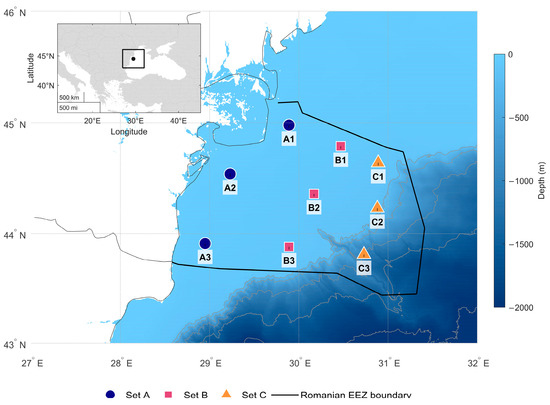
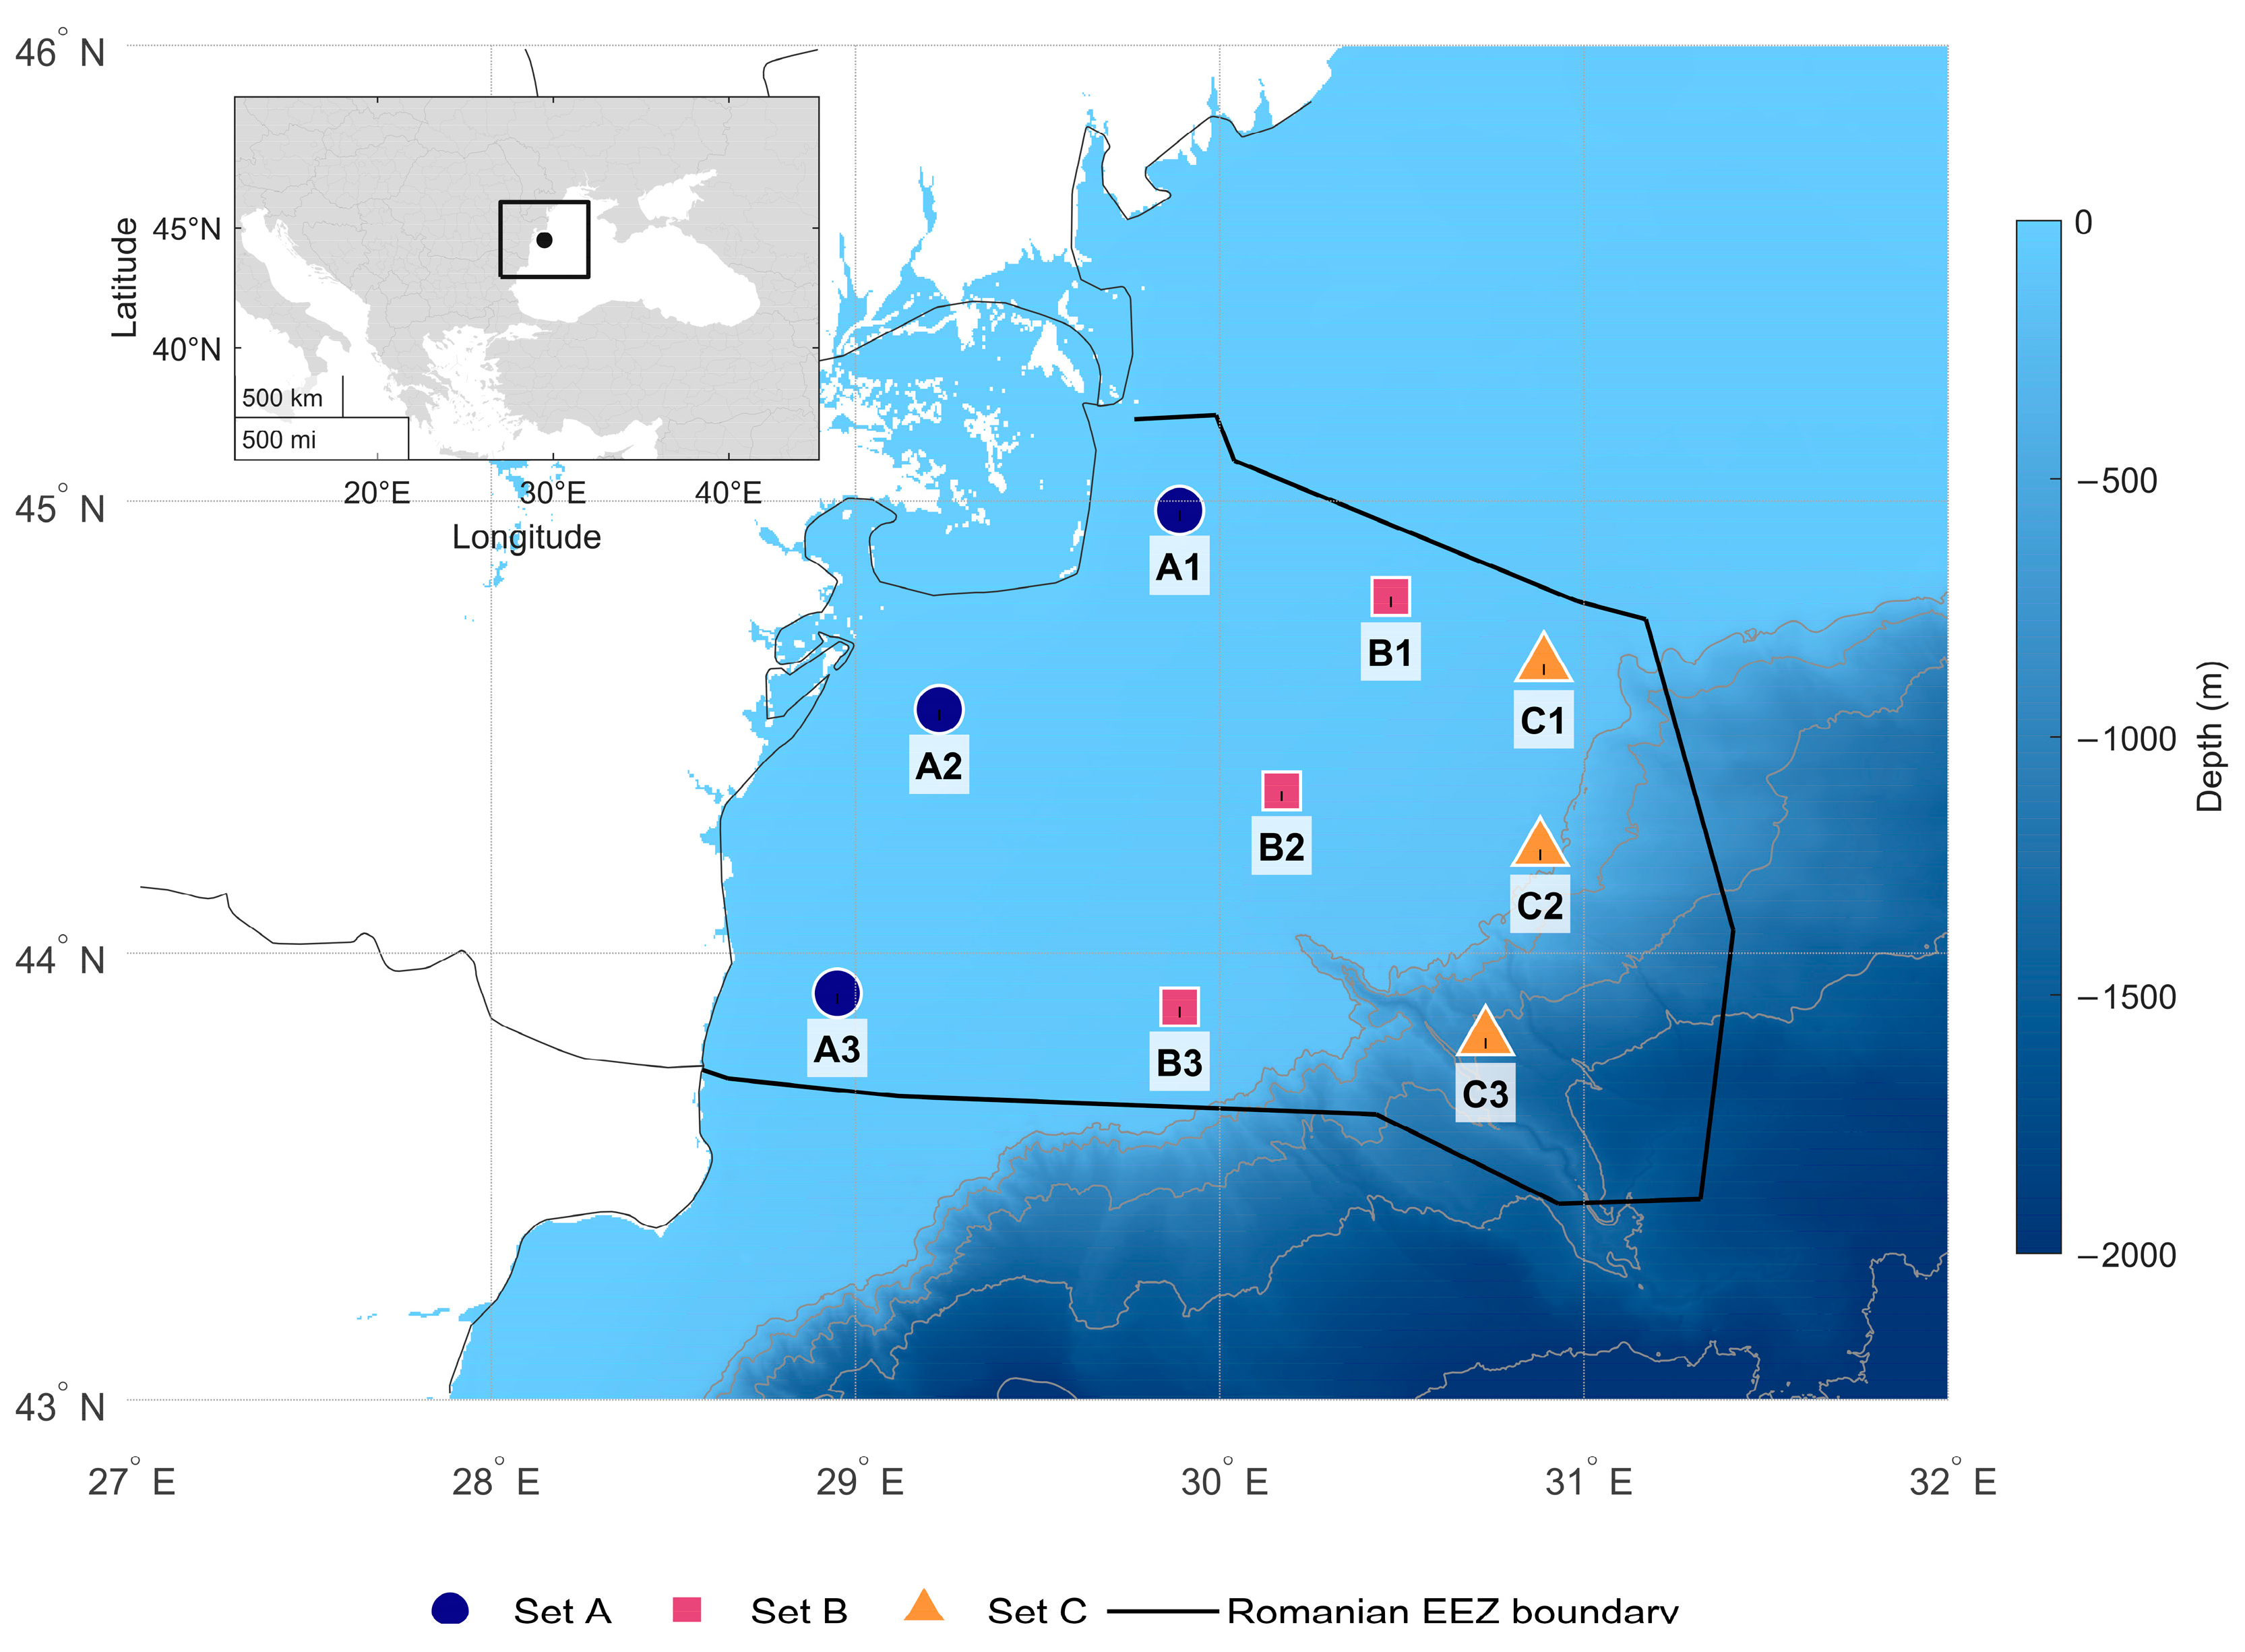
Romania’s EEZ was selected for this study, which is presented in Figure 1. This critical location in the Black Sea’s western sector has been identified as important for wind speed research.
Figure 1.
The selected sites for the Black Sea wind study.
Nine important sites were selected for this area based on several factors that would be examined and could affect the research. The sites were separated into three groups, A, B, and C (Table 1). The sites in category A are the ones that are nearest to the shore and are therefore implied to be at shallower water locations. In category B, the water depth and distance from the shore both increase, enabling the installation of foundations other than monopiles or those recommended for shallow water depths. Among the sites in category C, which includes the most isolated locations and the deepest sea depths, one with a 1000 m water depth was selected.
Table 1.
Specific characteristics of each site.
2.2. Wind Resource Characterization
ERA5 is a database developed by the European Center for Medium-Range Meteorological Forecasts (ECMWF) [26,27]. The reanalysis methodologies have been upgraded with a new Integrated prediction system model cycle (IFS Cycle 47r3) to significantly increase prediction accuracy and computing efficiency after years of advancements in modeling and data assimilation [28]. Several atmospheric, land surface, and sea state variables are estimated for each hour of the day using the ERA5 dataset on 0.25° × 0.25° latitude–longitude grids [29]. ERA5 data, which covers the years 1940 to the present, is frequently updated and error-checked to provide a trustworthy source of historical data. The ERA5 is one of the many reanalysis databases that researchers often use. This decision is supported by the availability of a few meteorological indicators, which are distinguished by their wide geographical and temporal coverage [30].
For this study, wind speed data were downloaded for the 9 locations for which a 20-year period (from 2005 to 2024) was considered for a 3 h interval.
The logarithmic wind law is an empirical relationship that characterizes the variation in wind speed with height above the Earth’s surface in the planetary boundary layer (PBL). The atmospheric layer nearest to the ground, known as the PBL, is where wind speed is most affected by the Earth’s surface. This parameter’s formula is as follows [31]:
The kind of terrain affects the roughness coefficient . It describes the surface roughness and, as a result, considers ground obstructions and factors that can affect wind speed. For instance, a rough, urbanized landscape will have a larger value of than a smooth, open ocean surface. This parameter in this instance will be 0.0002 m [32]. The height of is 100 m, and is 10 m. Wind speed at 10 m is represented by (in m/s).
2.3. Selected Wind Turbines
In this study, turbines with much higher power ratings were selected for analysis within the Black Sea setting. This research examines turbines with significantly greater power ratings in the context of the Black Sea. This technological advancement has several advantages, including improved wind energy capture efficiency and, indirectly, higher energy output. In this study, turbines with nominal powers between 5 and 9.5 MW and hub heights between 92 and 100 m above sea level were selected. Notably, other offshore wind farms in Europe have already successfully implemented these turbines, proving their dependability and effectiveness. All six turbines were estimated to have a hub height of 100 m above sea level to standardize future computations and properly compare the performance of these turbines. The establishment of a competitive and sustainable offshore wind business in the Black Sea’s bright future is facilitated by this shared foundation for assessing and contrasting the performance of these cutting-edge technologies.
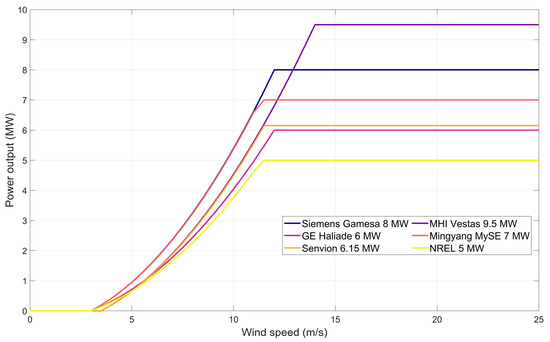
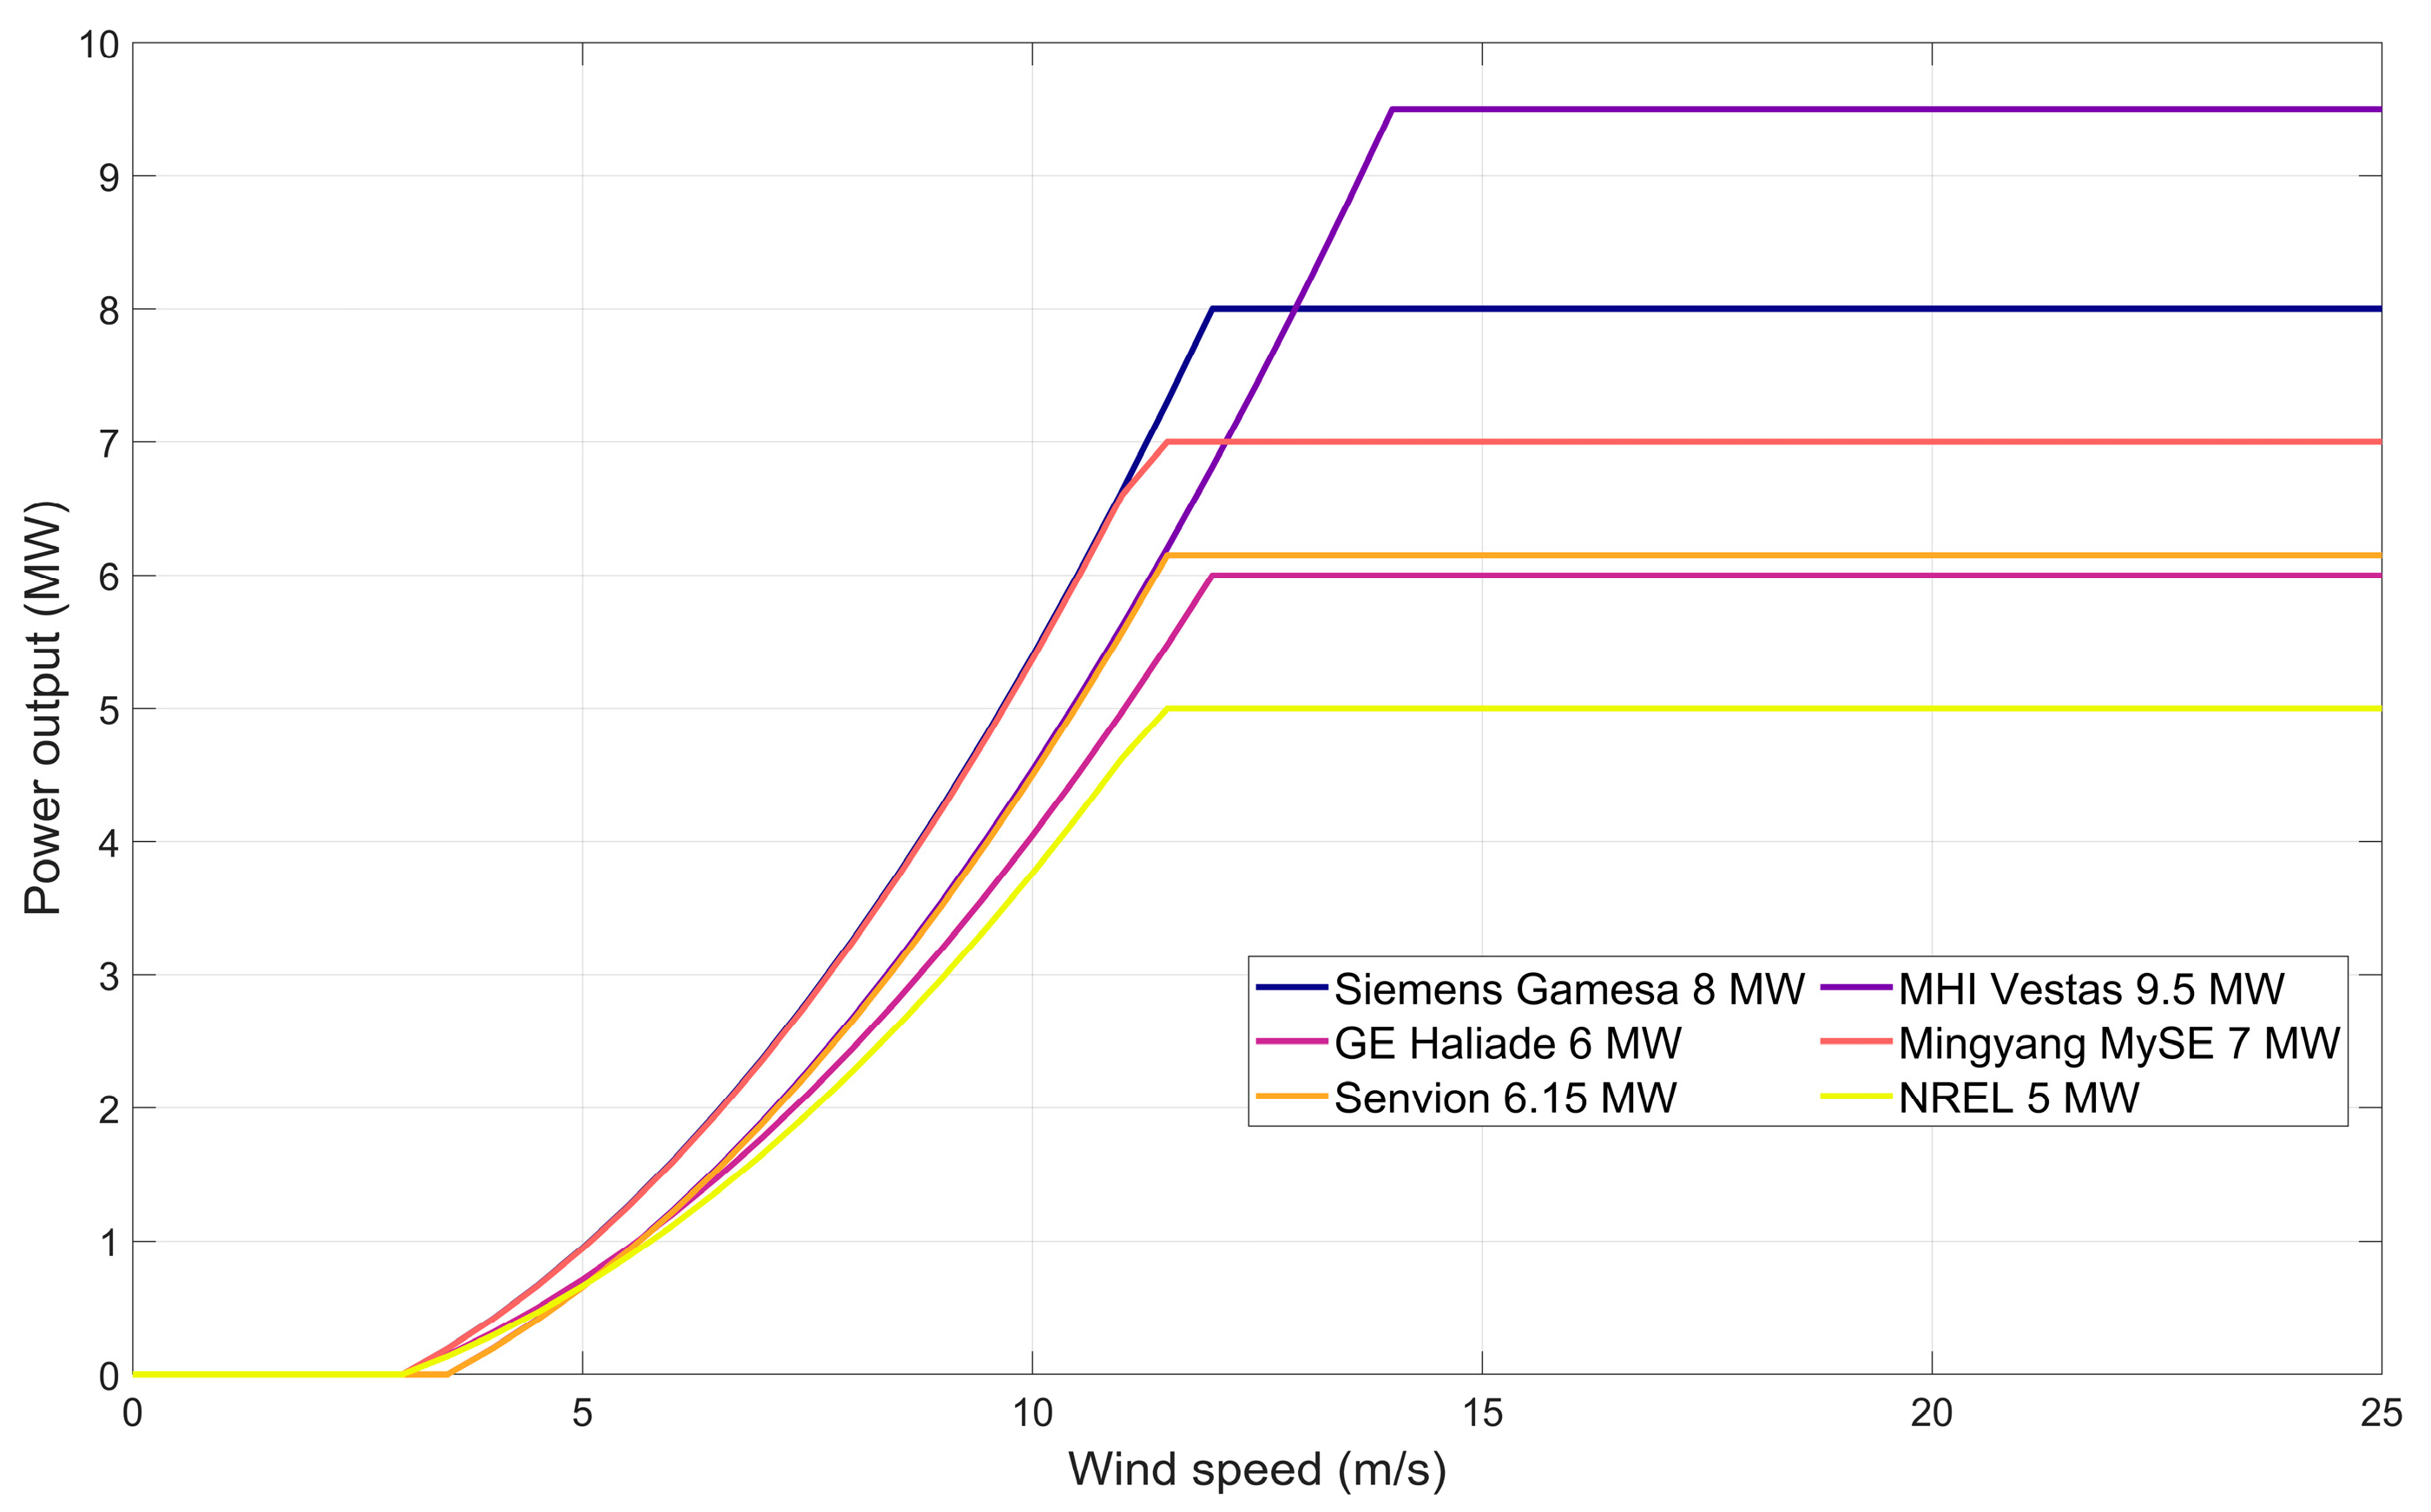
Figure 2 displays the power curves for the six turbines. This shows that all turbines have cut-in speeds of about 3 m/s and rated speeds of about 11.5–12 m/s; the MHI Vestas 9.5 MW turbine is the only one that exceeds this, with a rated speed of 14 m/s.
Figure 2.
Power curves of the chosen wind turbines.
2.4. Wind Farm Layout and Sizing
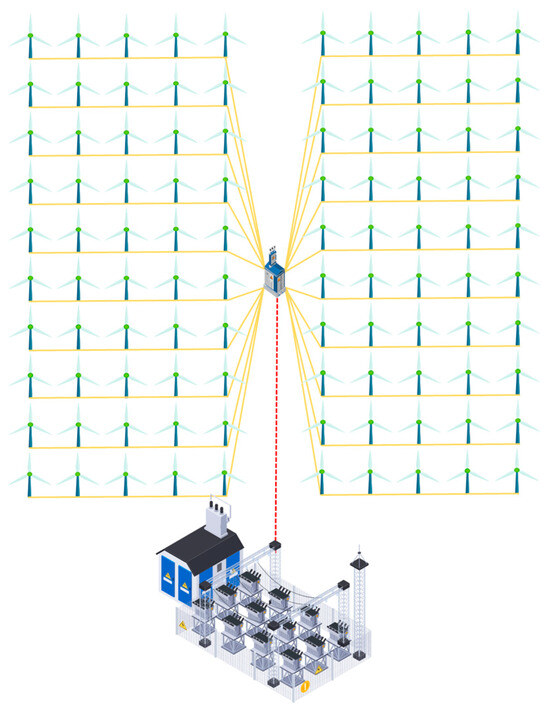
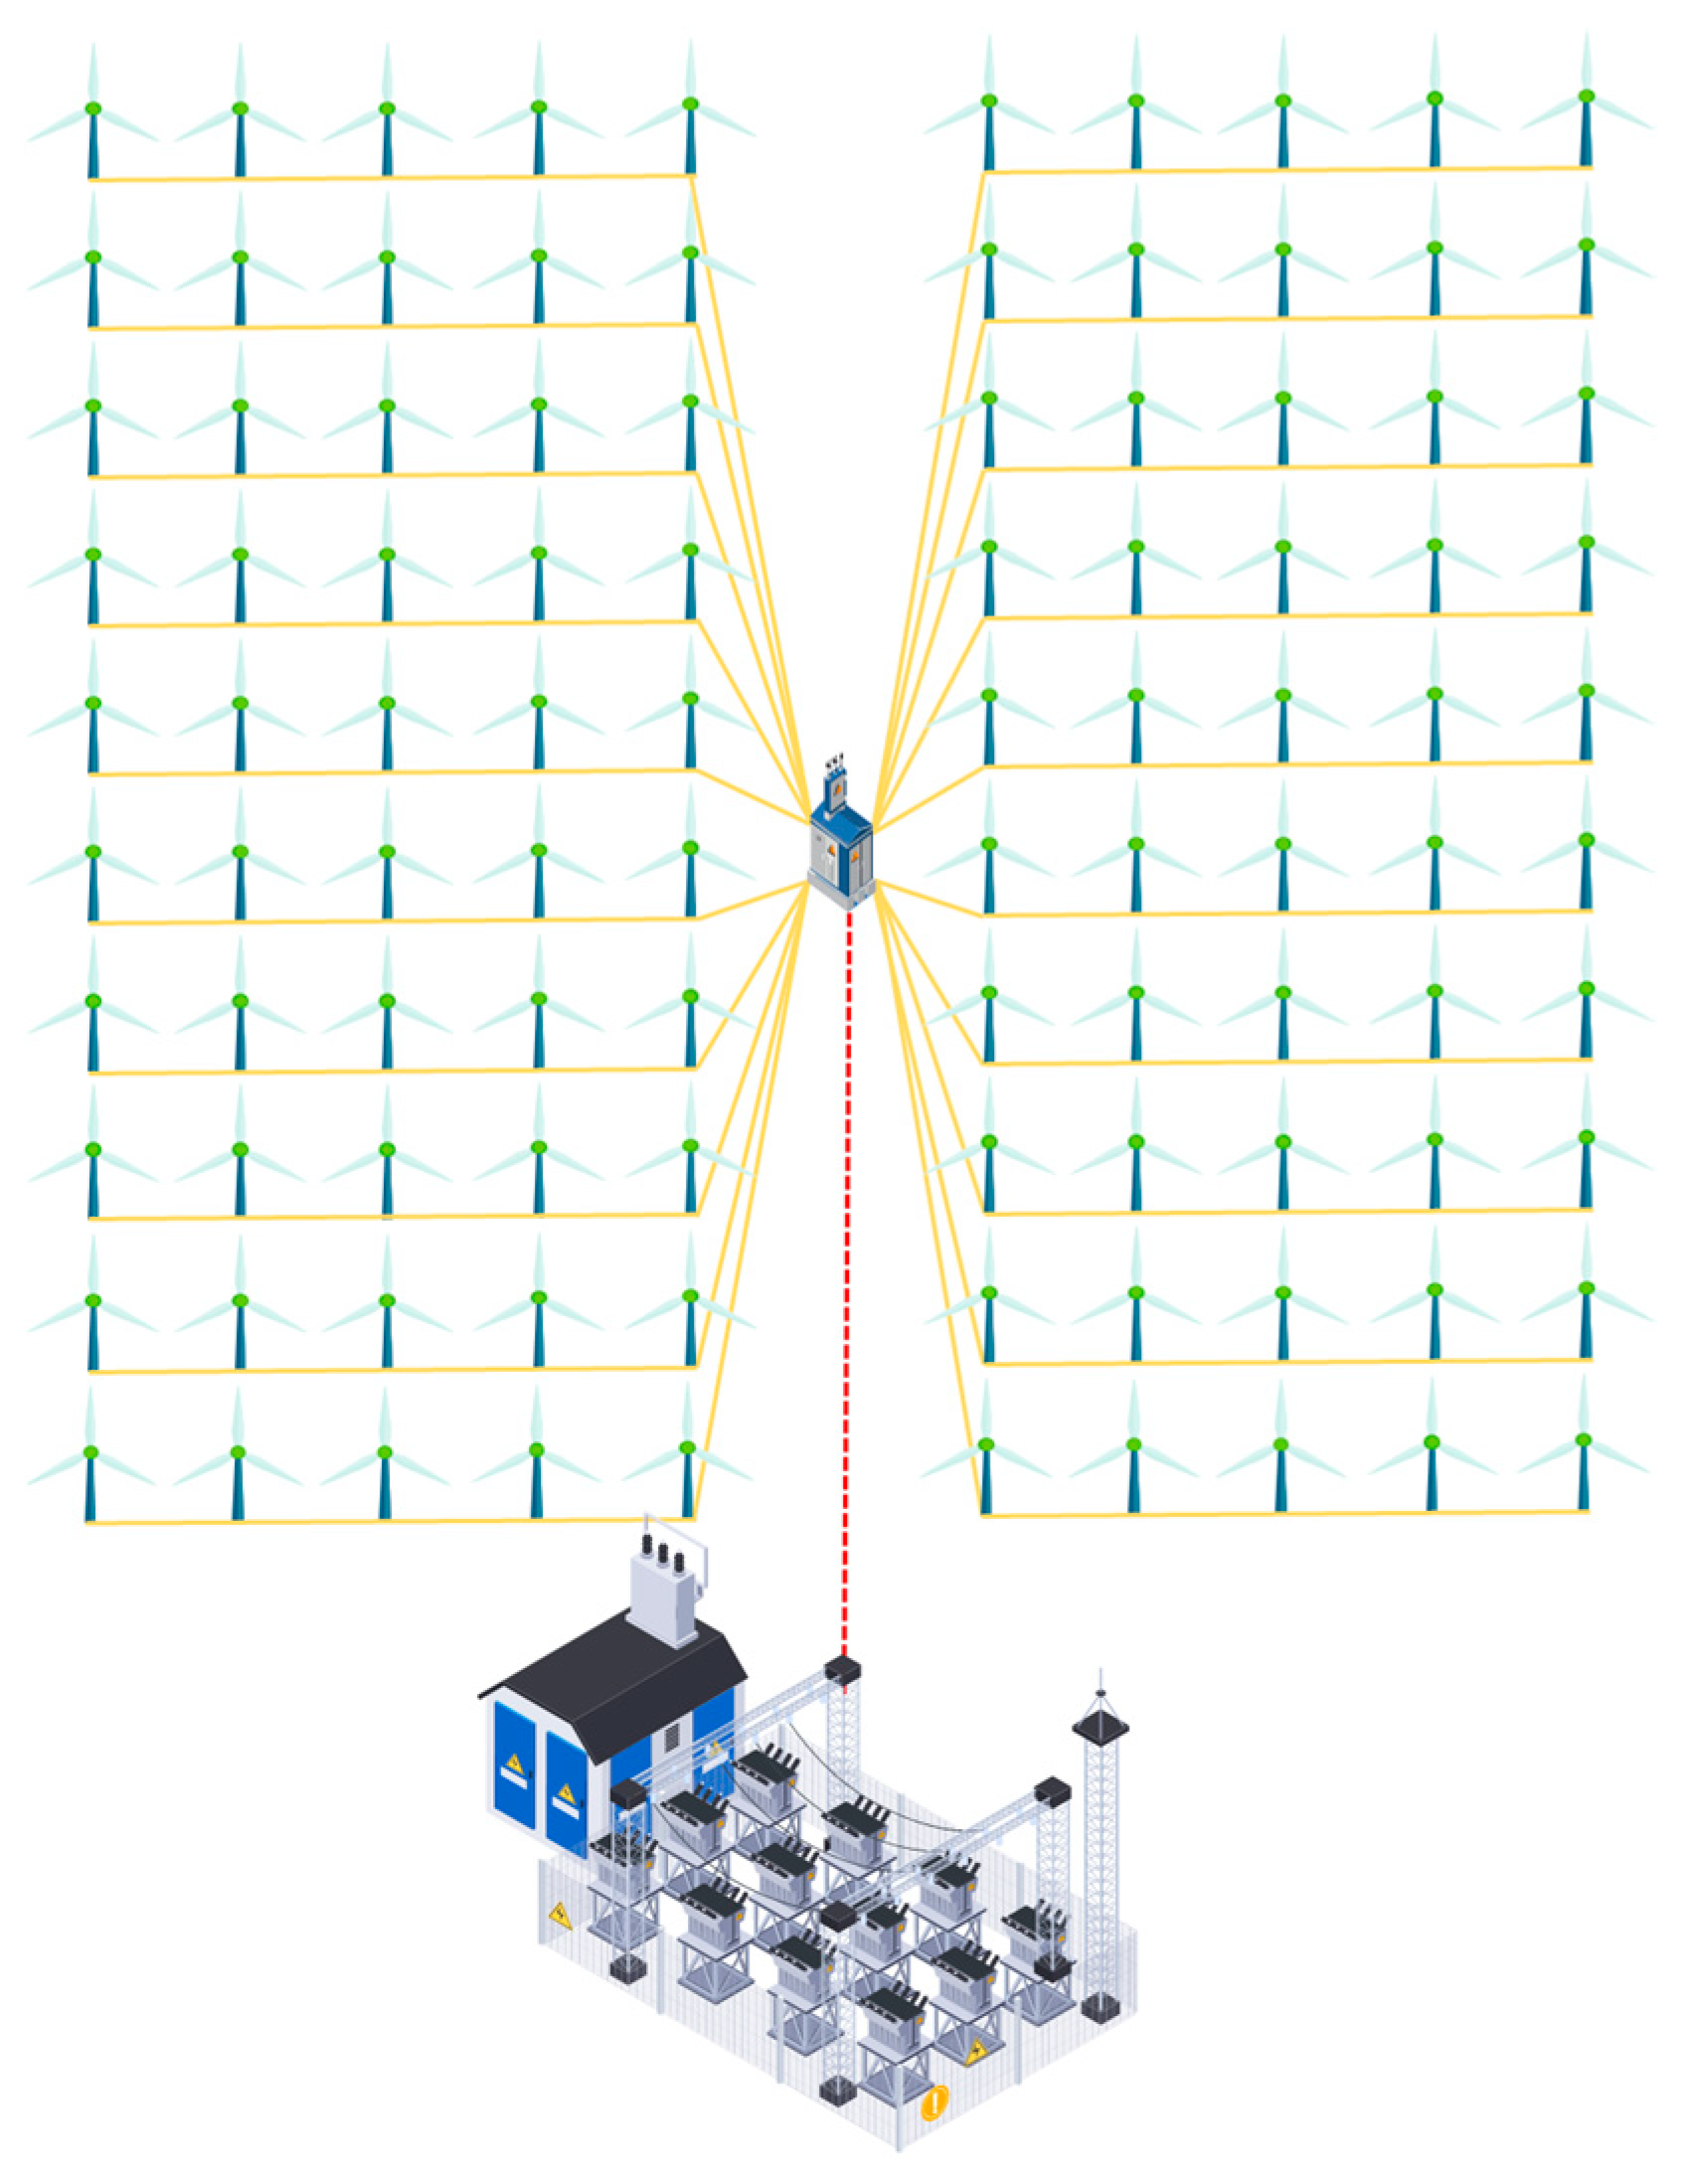
A rectangular arrangement of two columns, each with five turbines, and ten rows, totaling 100 turbines, can be used to frame the offshore wind farm structure. Under this configuration, as shown in Figure 3, the offshore electrical substation will be placed in the middle of the farm to enable the effective collection and transfer of the energy produced. In this study, a uniform wind farm configuration was used for all nine analyzed sites. Although optimizing the layout according to the local distribution of wind speed and direction can lead to reduced wake losses and increased annual energy production, such an approach may generate different configurations for each site. These changes can influence not only energy production, but also the length of internal cables, electrical infrastructure costs and final LCOE values. To ensure comparability of results and to directly assess the influence of wind resource, water depth and distance from shore, it was decided to use the same configuration in all analyzed cases. Investigating the effects associated with layout optimization and explicit modeling of the wake phenomenon is a future research direction, which can provide additional information on the technical and economic performance of each site.
Figure 3.
Offshore wind farm structure.
The distance between turbines is assumed to be 1 km, while a more precise estimate can be achieved by taking into account rotor diameters ranging from 4 to 10. Optimizing this spacing reduces turbine interference, but it also means higher capital and operating expenses.
Depending on the water depth, a different type of foundation will be used at each site. According to the technical literature, every foundation has a functional limit. For example, monopile foundations are recommended for depths up to 50 m, whereas jacket foundations are recommended for depths between 25 and 60 m. Floating foundations, such as tension leg platforms, can function at depths of up to 200 m, whereas spar and semi-submersible foundations are deemed capable of installation at far larger depths, ranging from 700 to 1300 m, though most research suggests a more acceptable upper limit of 1000 m [33,34]. Taking these factors into account, a specific type of foundation was selected for each site, as shown in Table 2. It should be noted that a location with a significant depth of around 1000 m was also chosen to observe the progression of the LCOE in this situation.
Table 2.
The type of foundation chosen for each site.
2.5. Energy Production Modeling
To determine the energy production of the simulated farm, the formula for annual electricity production will be used, a parameter denoted by AEP. This parameter helps developers and operators to quantify the electrical energy produced by a certain type of wind turbine. AEP can be calculated with the formula [35]:
where T = 8760 h/year is the annual operating time of a turbine. Cut-in and cut-out are the parameters presented in Section 2.3 and are different for each wind turbine. is the specific power curve of a turbine. is the Weibull distribution function.
Once the energy production for a turbine is determined, the result obtained can be multiplied by 100, compared to the total number considered in the wind turbine farm component.
Another parameter that helps to evaluate the performance of a wind turbine is represented by the capacity factor denoted by and which is expressed in percentages. It is expressed as the ratio between the total power in a certain period and the maximum nominal power . It has the following mathematical expression [36]:
For offshore wind installations, the capacity factor should be in the range of 29–52% [37], and this value provides an idea of how long the turbines operate close to their rated power in real wind conditions.
2.6. LCOE Calculation and Cost Modeling
The LCOE is the theoretical price at which electricity must be sold in order to break even. As such, it is critical in determining the economic feasibility of energy projects and provides a consistent approach for evaluating prices across different energy sources. The LCOE can be defined as the ratio of an energy project’s costs to its power production during its lifetime, generally stated as [38,39].
This formula divides expenditure into two categories: capital expenditure (CAPEX), which comprises costs incurred prior to the project’s start-up, and operating expenditure (OPEX), which covers the costs of power production and energy infrastructure maintenance. AEP is the annual electricity production, while r represents the discount rate.
Development and Consent (D&C): Environmental studies, seabed surveys, meteorological stations, project management, and development occur during this period. Some estimates put this value at 4% of CAPEX. D&C expenses average 187.2 k EUR/MW [40].
Wind turbine: Multiple sources put the average cost of a generic wind turbine at 950 k–1.6 M EUR/MW [41,42]—for example, the GE-Haliade X 14 MW turbines (GE Renewable Energy, Paris, France). On average, one MW of these turbines costs 0.79–0.9 M EUR to produce [43]. The following equation may estimate the price of such a turbine, according to reference [44]:
where represents the installed capacity or turbine capacity in MW.
By applying the above formula to determine the price of an 8 MW turbine, we will obtain a price of 6.33 M EUR (representing approximately 800 k EUR/MW). This price is below the range mentioned in the references above and so a price of 963 k EUR will be used in this study.
Foundation: The price of the foundation differs from one type to another. To determine the price for these, the model in ref. [45] will be used. Table 3 shows how to approximate the costs for foundations, referring to the consumption of materials, the price of materials and the production price.
Table 3.
Estimated costs of different foundation types [45].
Mooring: Floating constructions also include mooring systems, which are considered independent expenditures. Mooring lines may be made from a variety of materials, including synthetic ropes, chains, and metal cables. Synthetic ropes are often constructed of polyester or polyethylene, ensuring strength and endurance in a marine environment. The research considers two kinds of mooring systems: catenary and vertical. In catenary systems, mooring lines are placed horizontally on the water’s bottom, and anchors such as Stevshark Mk5 (Vryhof Anchors B.V., Krimpen aan den IJssel, The Netherlands) are utilized for anchoring [45]. Vertical mooring methods include lowering mooring lines vertically to the water’s bottom and securing them using suction-type anchors. This method offers a reliable mooring for floating constructions [46]. The cost estimates for the three kinds of floating foundations are shown in Table 4.
Table 4.
The costs of anchoring system components for the three kinds of floating foundations [16].
To determine the length of the anchor lines, the principle from ref. [47] will be used, at which, for a depth of 100 m, a length of 500 m is considered, and for each 100 m, another 150 m is added to the length. For semi-submersibles, another 60 m is added to these values. The length of the catenary anchor line may be estimated using a different approach that involves multiplying the water depth by 2.6 [48].
Grid connection: In this study, high-voltage alternating current (HVAC) and high-voltage direct current (HVDC) transmission systems were used. HVDC technology is substantially more efficient at distances of more than 55–80 km from the shoreline. Table 5 shows the costs for the components used in the transmission calculation, which are applied to the configuration described in Section 2.4.
Table 5.
The technologies used for transmission and the associated prices [49].
Installation and commissioning: This phase includes several expenses, including those associated with setting up the structures, the cost of the ships and equipment needed to move and set up the farm, and the costs related to the installation of the electrical infrastructure. The primary components’ costs are shown in Table 6. They are approximate using data that have previously been published in the literature and will be modified depending on the transmission component and foundation type. Innovative procedures and equipment have facilitated successful installations globally; yet, installation costs remain high, and there is much potential for improvement.
Table 6.
Estimated installation costs for various components of the offshore wind farm [16,50].
Decommissioning: In order to reduce the possibility of damage, this step involves an inverted installation process, in which the components are handled less carefully. Because scrap metal has value, decommissioning expenses for onshore projects are often minimal. However, the lack of viable projects that have reached this level makes it difficult to estimate these costs for offshore wind farms. Decommissioning expenses are often computed as a percentage of installation costs [51]. Ref. [50] provides a detailed estimate of the final deconstruction costs. The decommissioning cost estimates considered in this study are presented in Table 7.
Table 7.
Decommissioning prices for different types of foundations [45].
OPEX: Because operating and maintenance expenses are unexpected and hard to forecast, there are two basic types of costs associated with wind farms: variable and flexible. Fixed expenditures are expenses that do not change over time, such as scheduled maintenance and repairs, committed staff, port infrastructure, equipment, and replacement parts. Depending on the farm’s demands and actual output, variable expenses change. Because these expenses are hard to pinpoint, they will be calculated in this article according to the nature of the foundation. For a fixed foundation, the approximate cost is 63.7 M EUR, and for a floating one, it is 73.8 M EUR.
3. Results
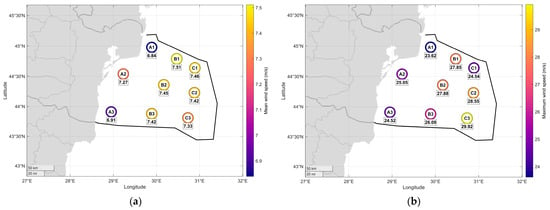
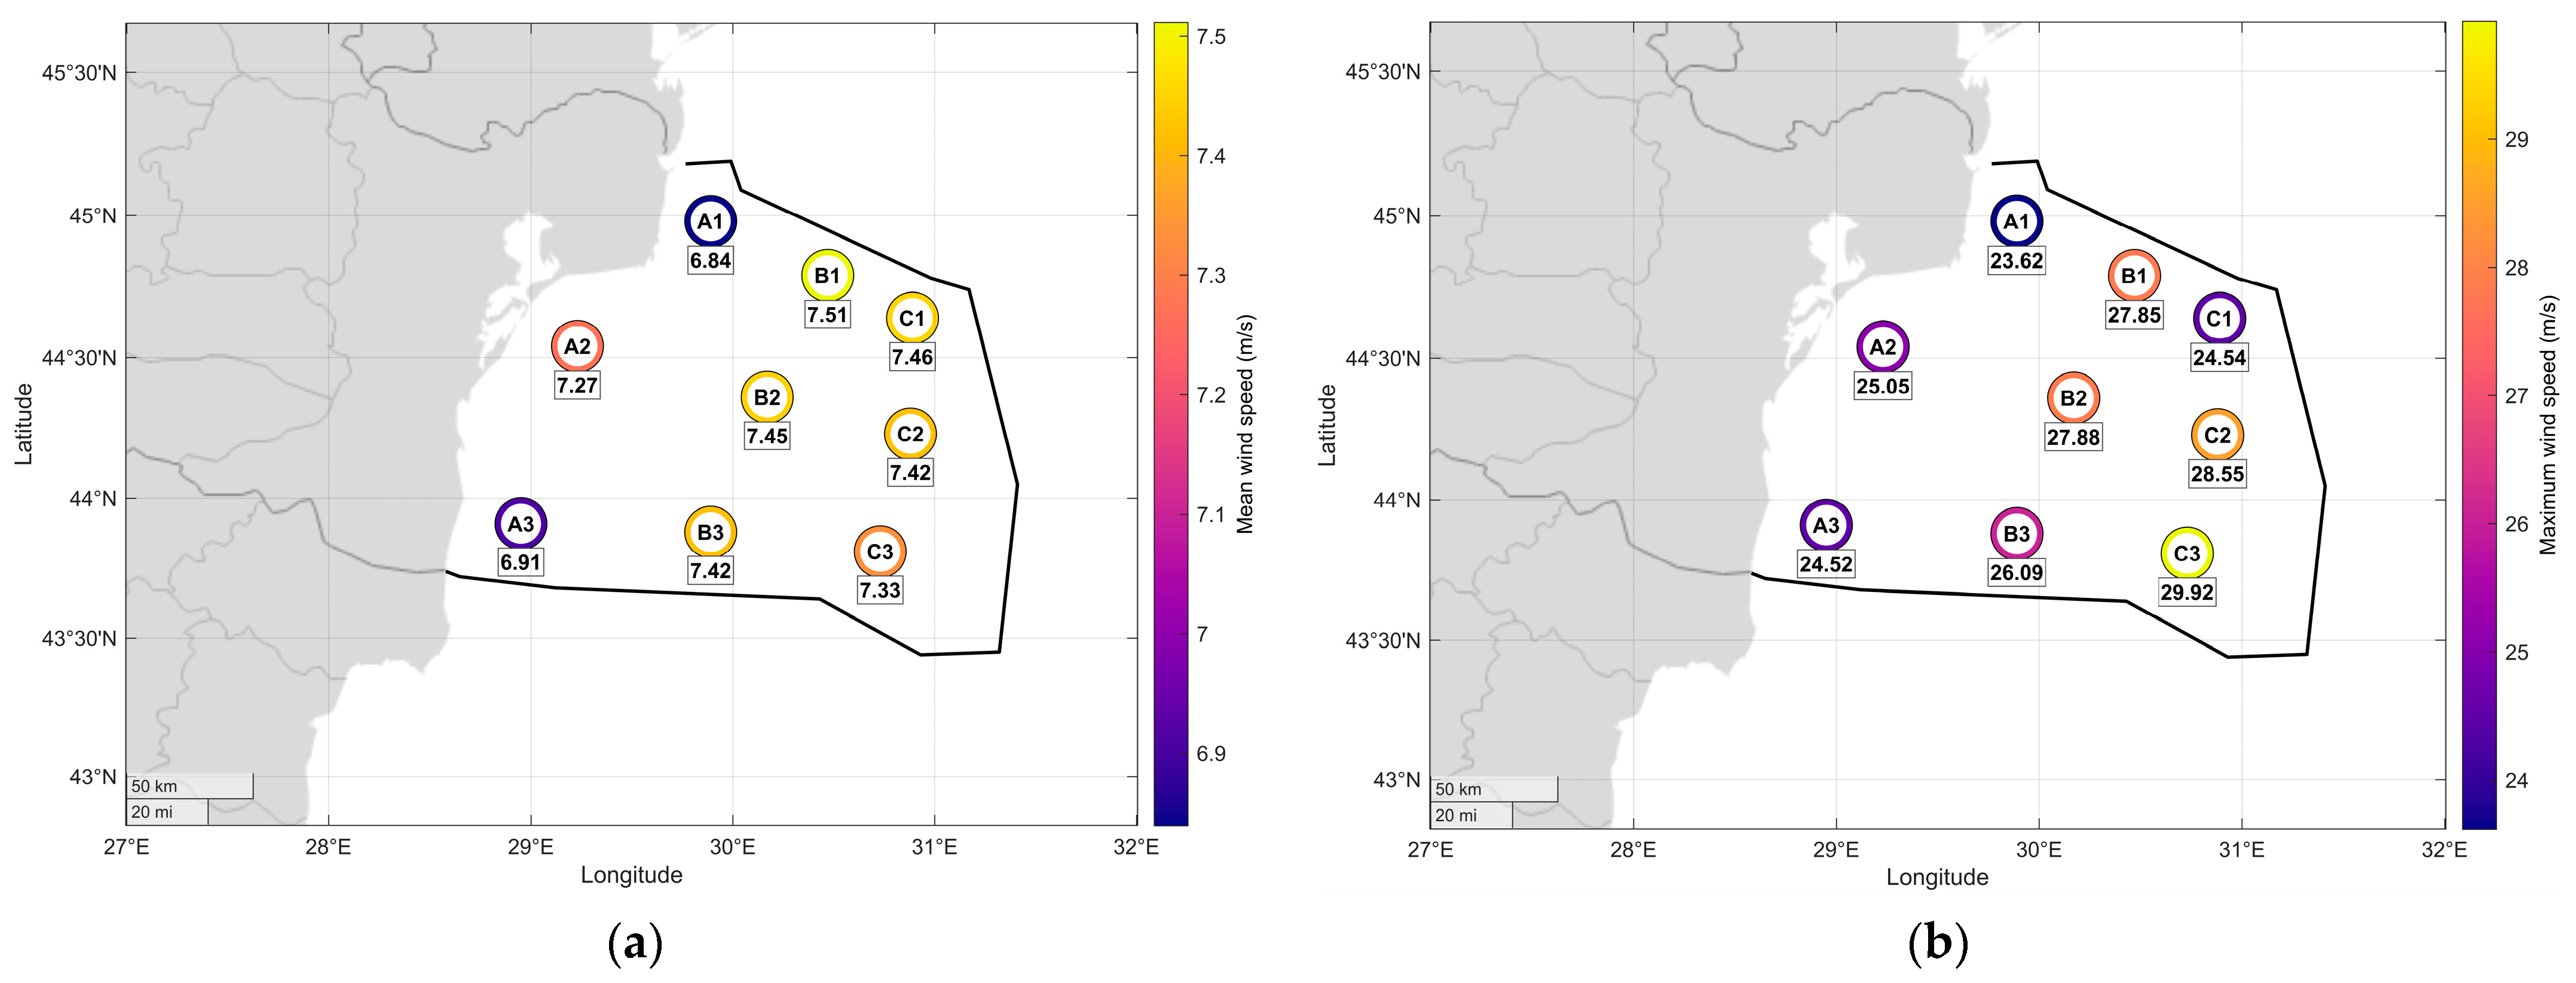
Figure 4 shows the average and maximum wind speed at a height of 100 m for the nine locations analyzed, grouped into three sets (A, B, and C), arranged progressively further from the shore.
Figure 4.
Wind speed in m/s: (a) average and (b) maximum at 100 m height considering the period 2006–2025.
The average wind speed values vary between 6.84 m/s and 7.51 m/s, with a general increasing trend from set A (regions in proximity to the coastline) to set C (areas further away). The highest average value was recorded at site B1, which indicates a slight deviation from the general trend, possibly determined by local particularities of the atmospheric circulation. However, the maximum speeds show a clear increase with the distance from the shore, the highest value being recorded at the most distant location and with the greatest depth in set C.
The ratio between the maximum and average speed varies between 23.62 m/s and 29.92 m/s, indicating a moderate variability of the wind regime between locations.
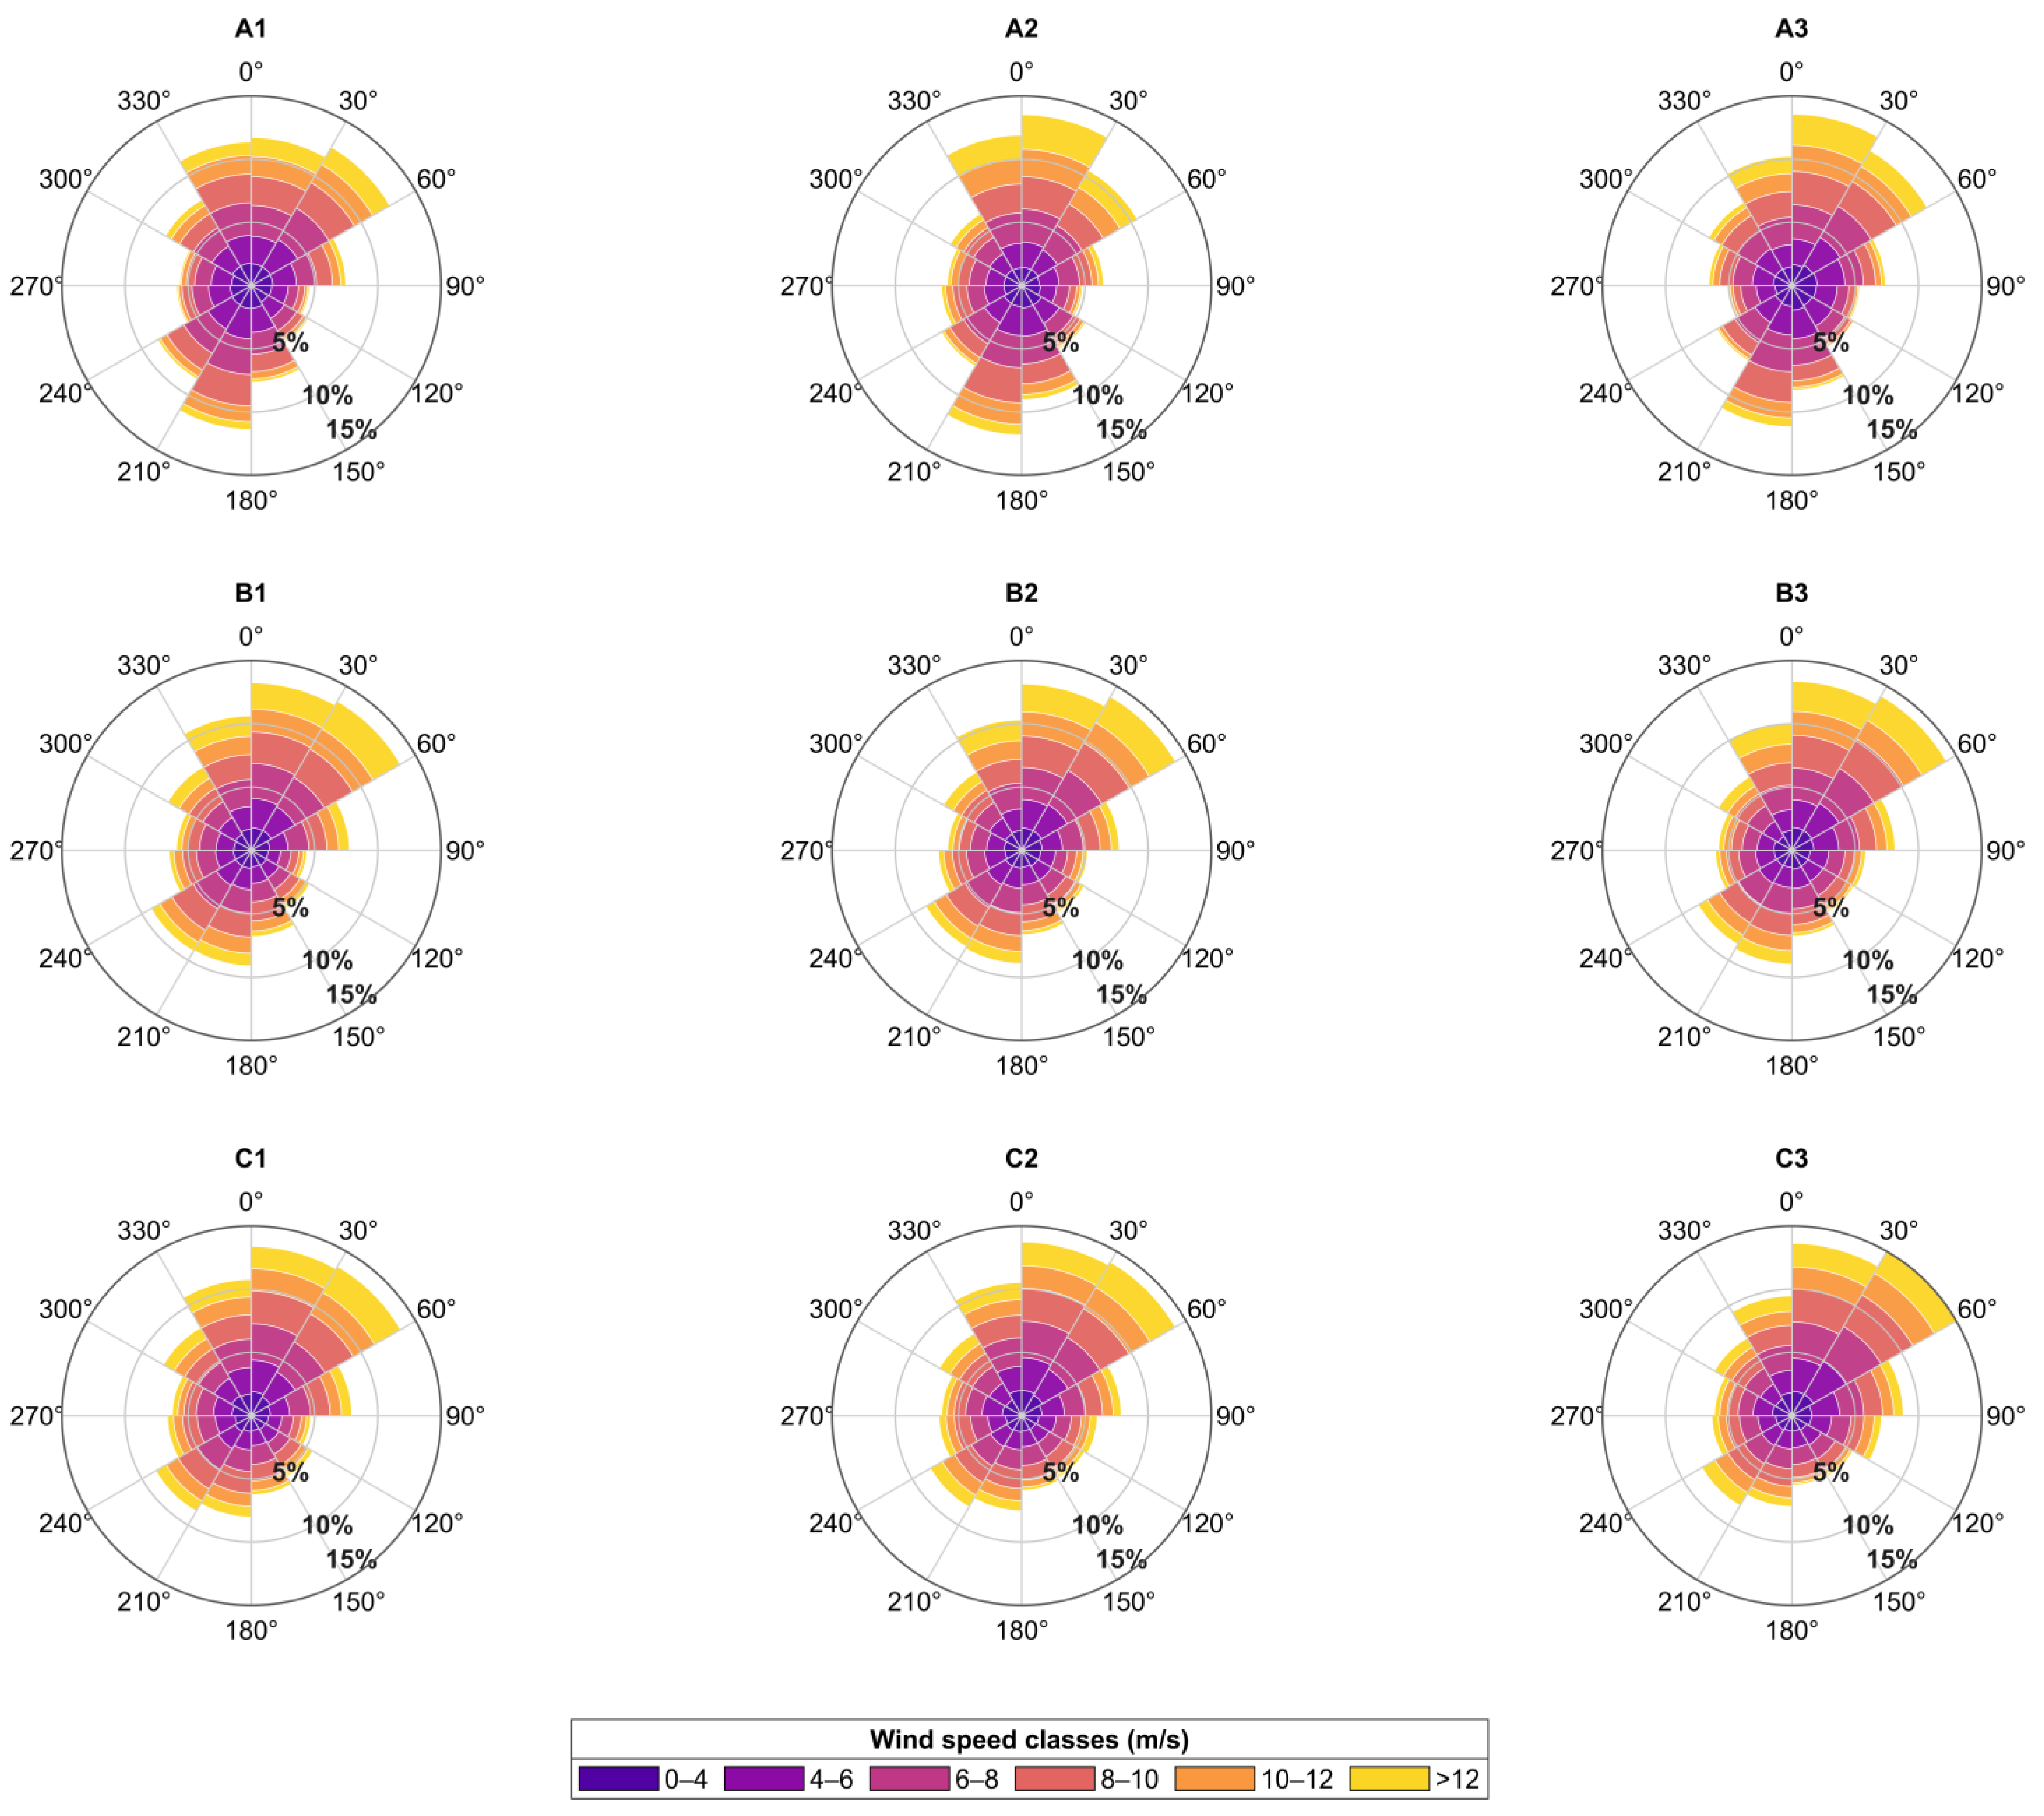
Figure 5 illustrates the directional wind distribution for the nine analyzed sites with the same speed classes and % scale for all locations. The major directions are found to be predominantly centered in the northeast and southwest sectors, suggesting a rather well-defined directional wind regime. The wind rose analysis indicates that the wind regime is dominated by medium wind speed classes, with the highest occurrence generally associated with the 6–8 m/s interval. The 8–10 m/s class also exhibits a significant contribution across all locations, while wind speeds above 12 m/s occur less frequently. This distribution confirms that the analyzed sites are characterized predominantly by moderate-to-high wind conditions, which are favorable for offshore wind energy exploitation.
Figure 5.
Wind rose representation of wind direction frequency and wind speed distribution at the analyzed locations.
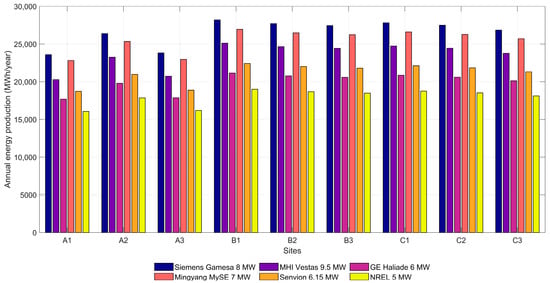
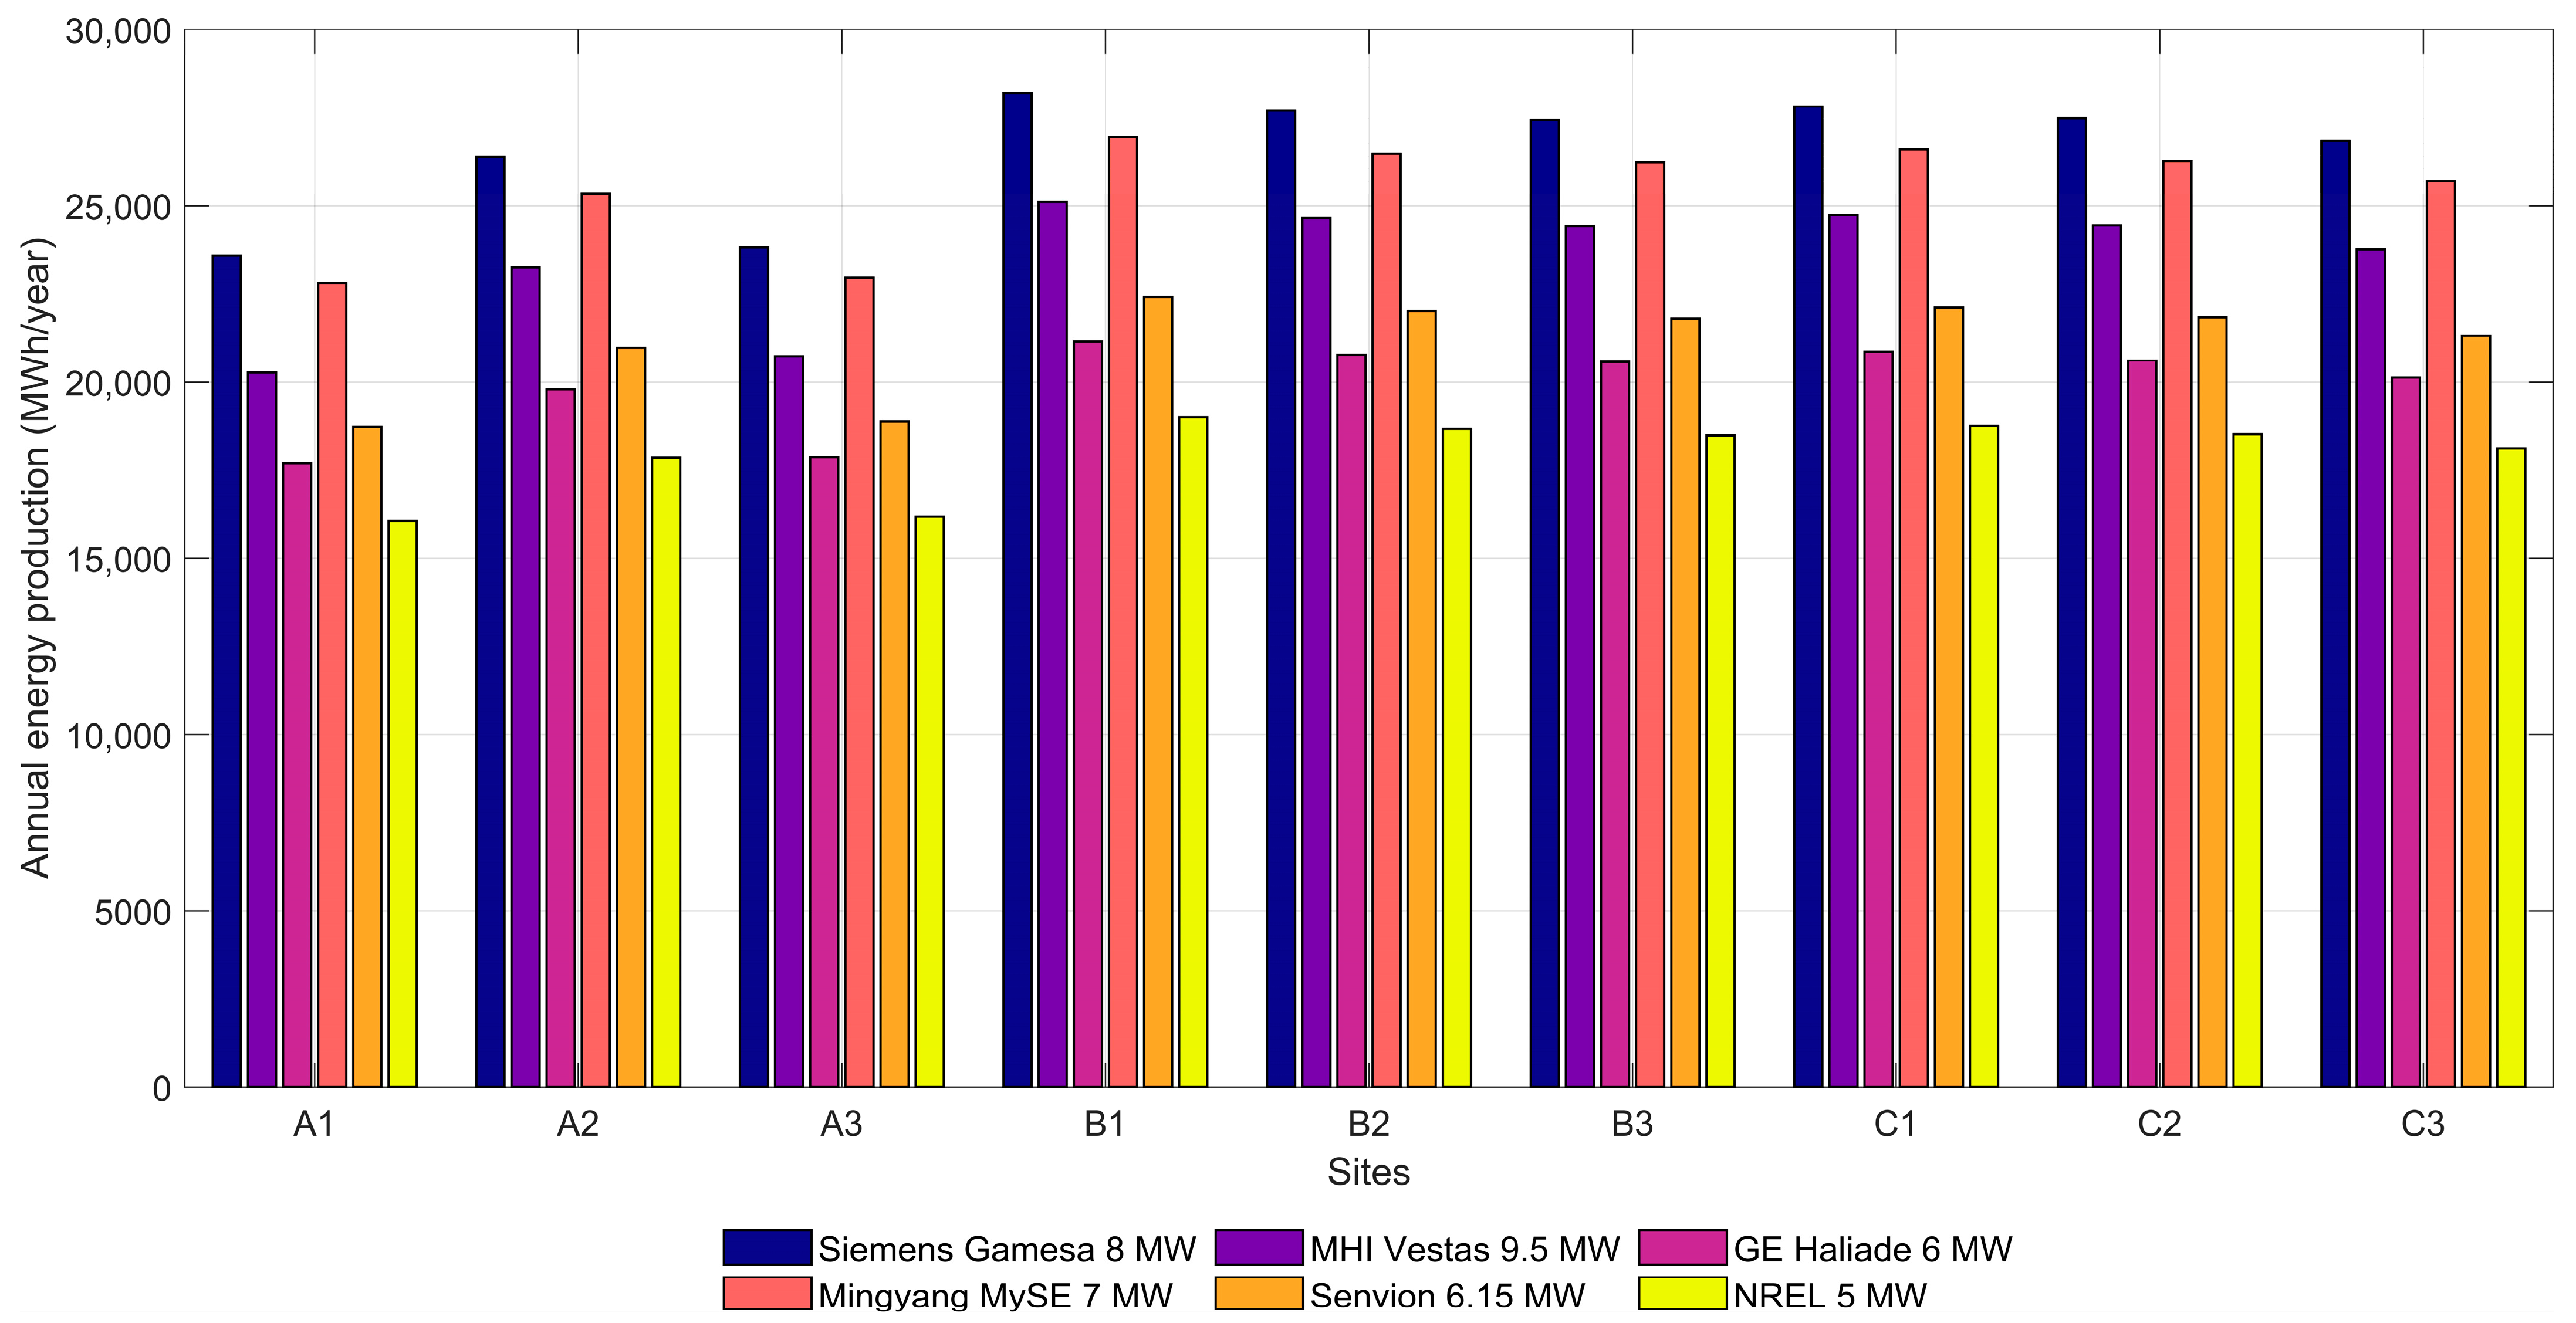
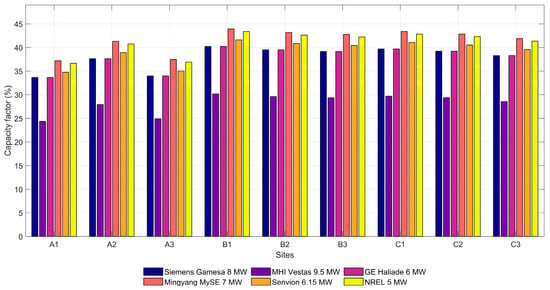
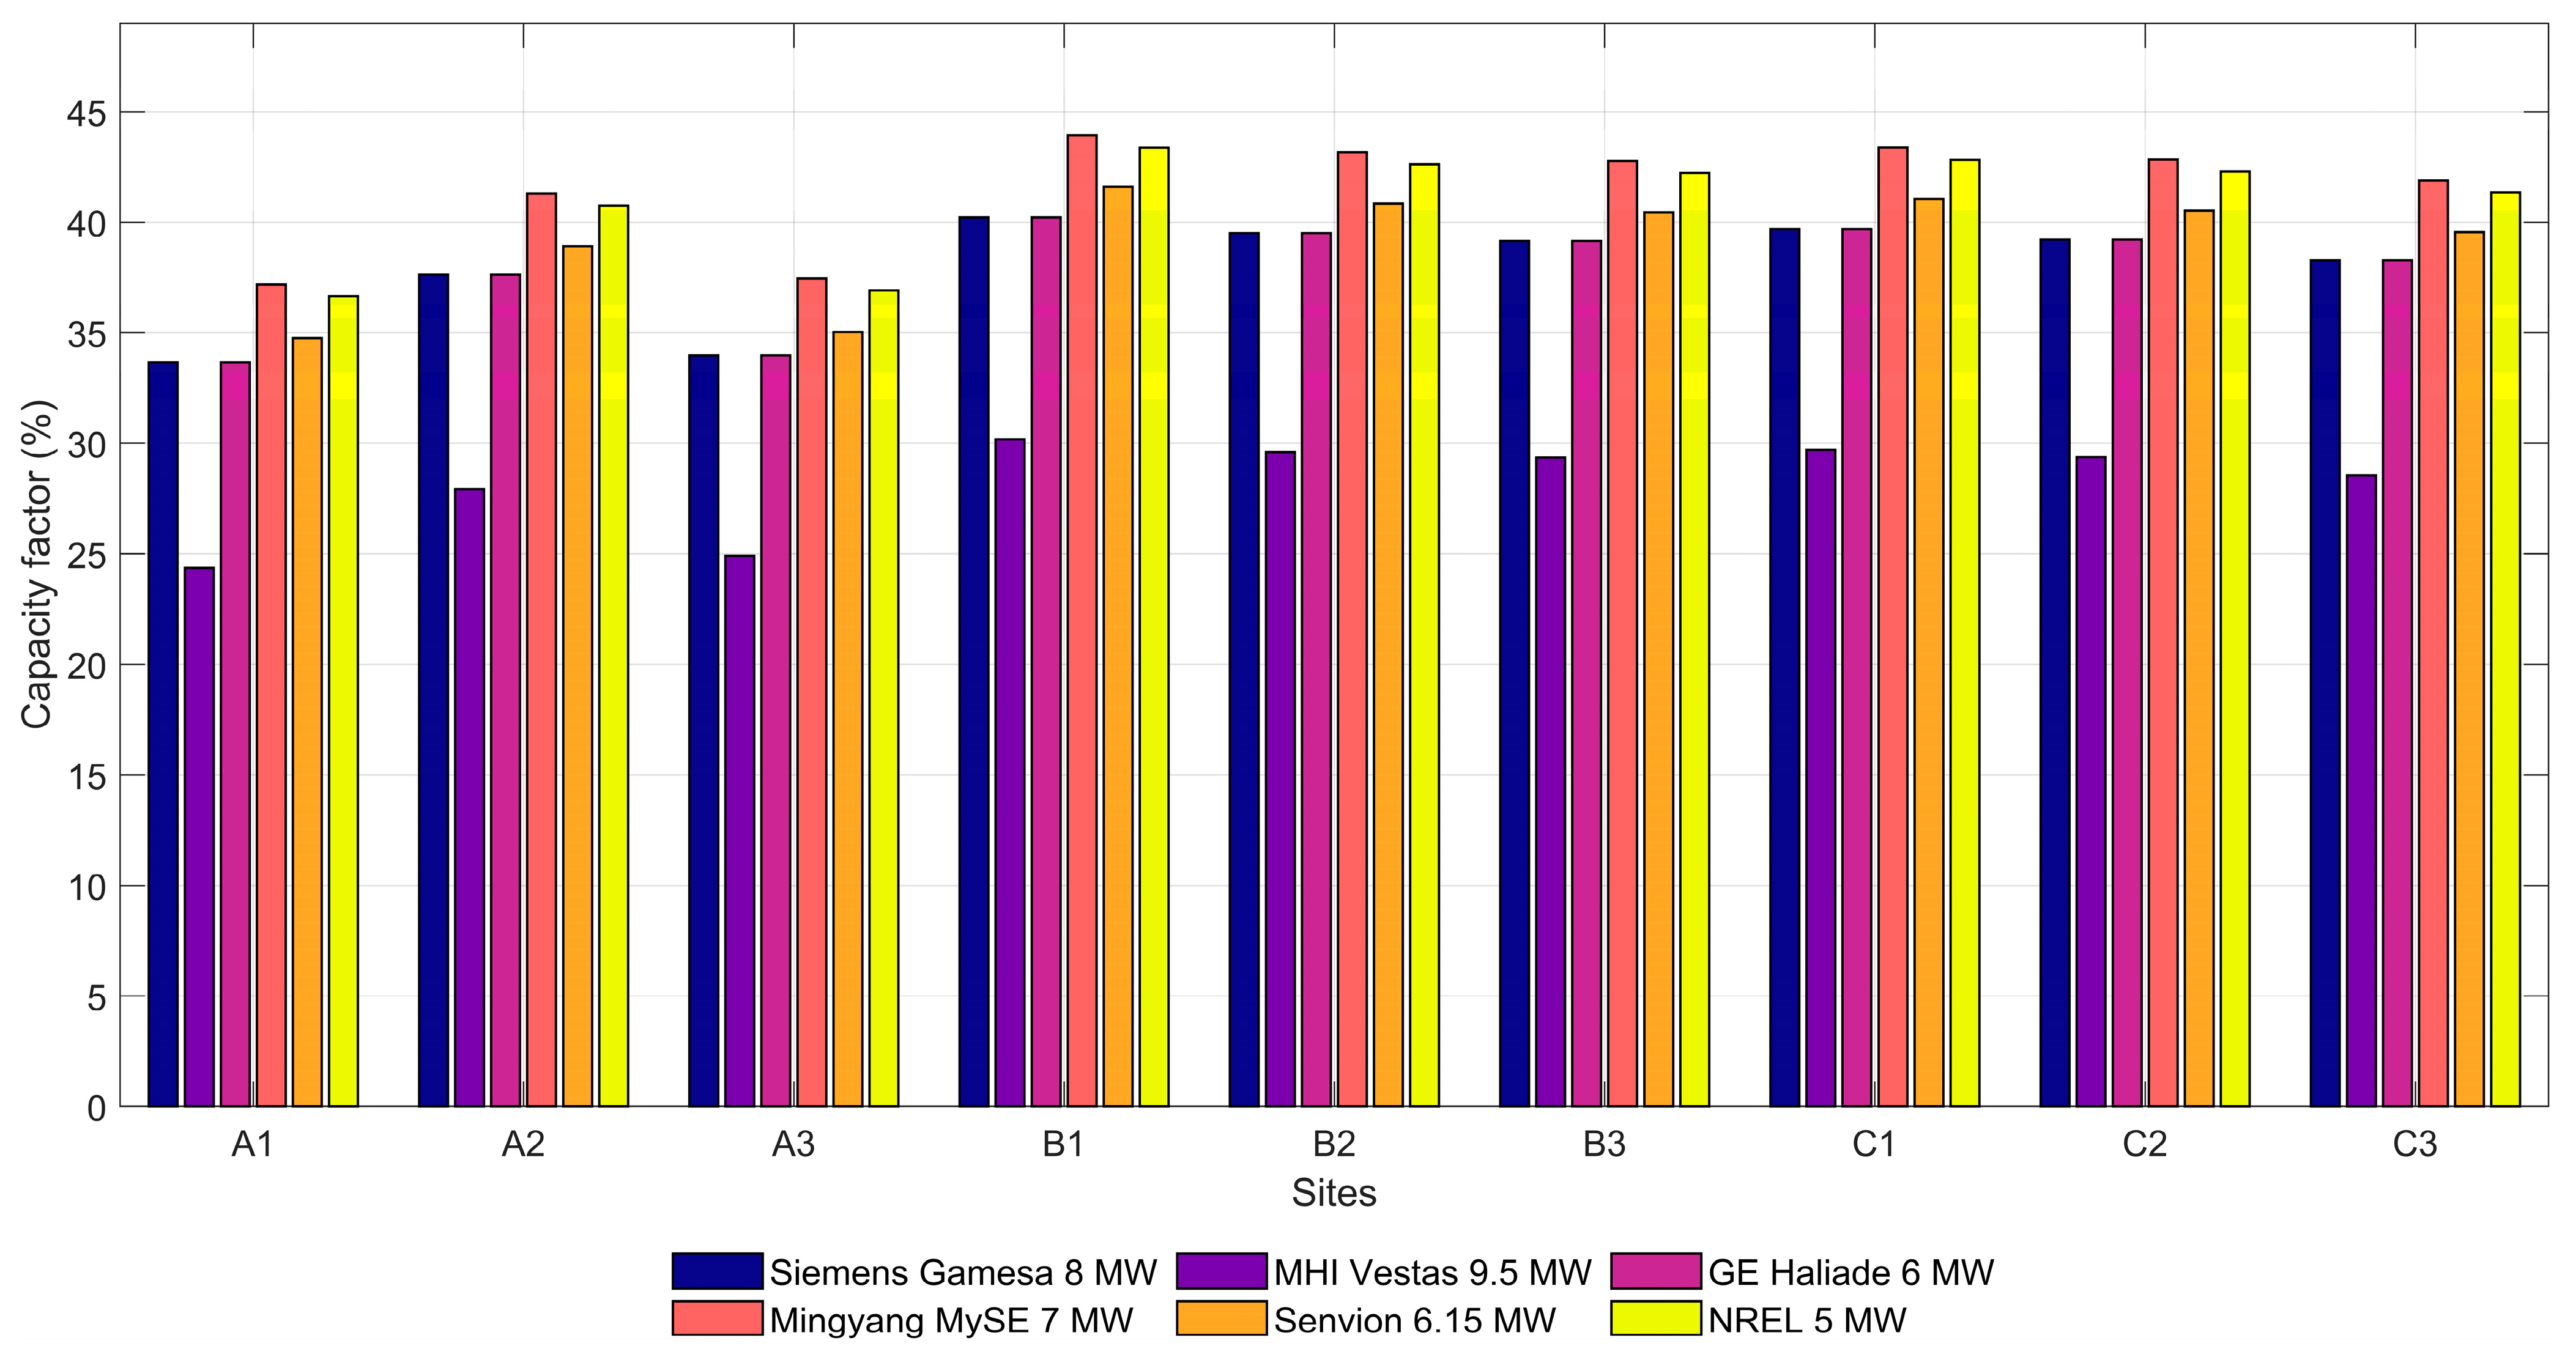
Figure 6 presents the values of the annual energy production (AEP) and Figure 7 presents the capacity factor (Cf) for the six types of turbines analyzed, applied to the nine locations in the Romanian offshore area. The results show significant differences between the turbine performances, determined both by the individual technical characteristics (nominal power, start and stop speeds) and by the local wind regime.
Figure 6.
Annual energy production for the nine sites reported to the six turbines chosen considering the period 2006–2025.
Figure 7.
Capacity factor considering the six chosen turbines simulated for the nine sites, considering the period 2006–2025.
The Siemens turbine records the highest AEP values in most locations, although it does not have the highest nominal power. The superior performance is explained by the reduced start (cut-in) speed, which allows it to operate for a greater number of hours during the year. As a result, the capacity factor of this turbine is also among the highest (Figure 7). In terms of CF, the Mingyang MySE 7 MW turbine (MingYang Smart Energy Group Co., Ltd., Zhongshan, China) slightly outperforms the Siemens Gamesa 8 MW model, due to an even lower cut-in, which gives it a slightly extended operating period, even in low wind conditions. However, the differences between the two models remain moderate, both being well-adapted to the wind conditions in the area.
In contrast, the MHI Vestas 9.5 MW turbine (MHI Vestas Offshore Wind, Aarhus, Denmark), although it has the highest nominal power among the models analyzed, records a lower annual production, ranking third in terms of AEP. This lower performance is mainly due to the higher starting speed, which limits the effective operating duration under the average wind speeds in the region. When it comes to capacity factor, the MHI Vestas 9.5 MW turbine has the lowest percentages, ranging from around 25% to about 30%. The MHI Vestas 9.5 turbine is consequently unsuitable for category A sites.
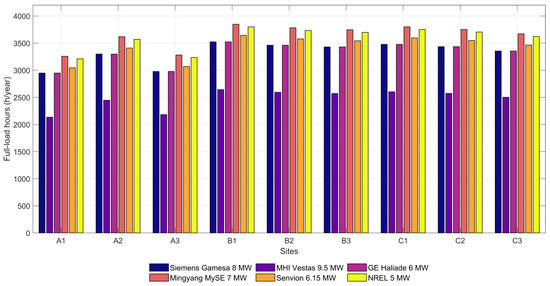
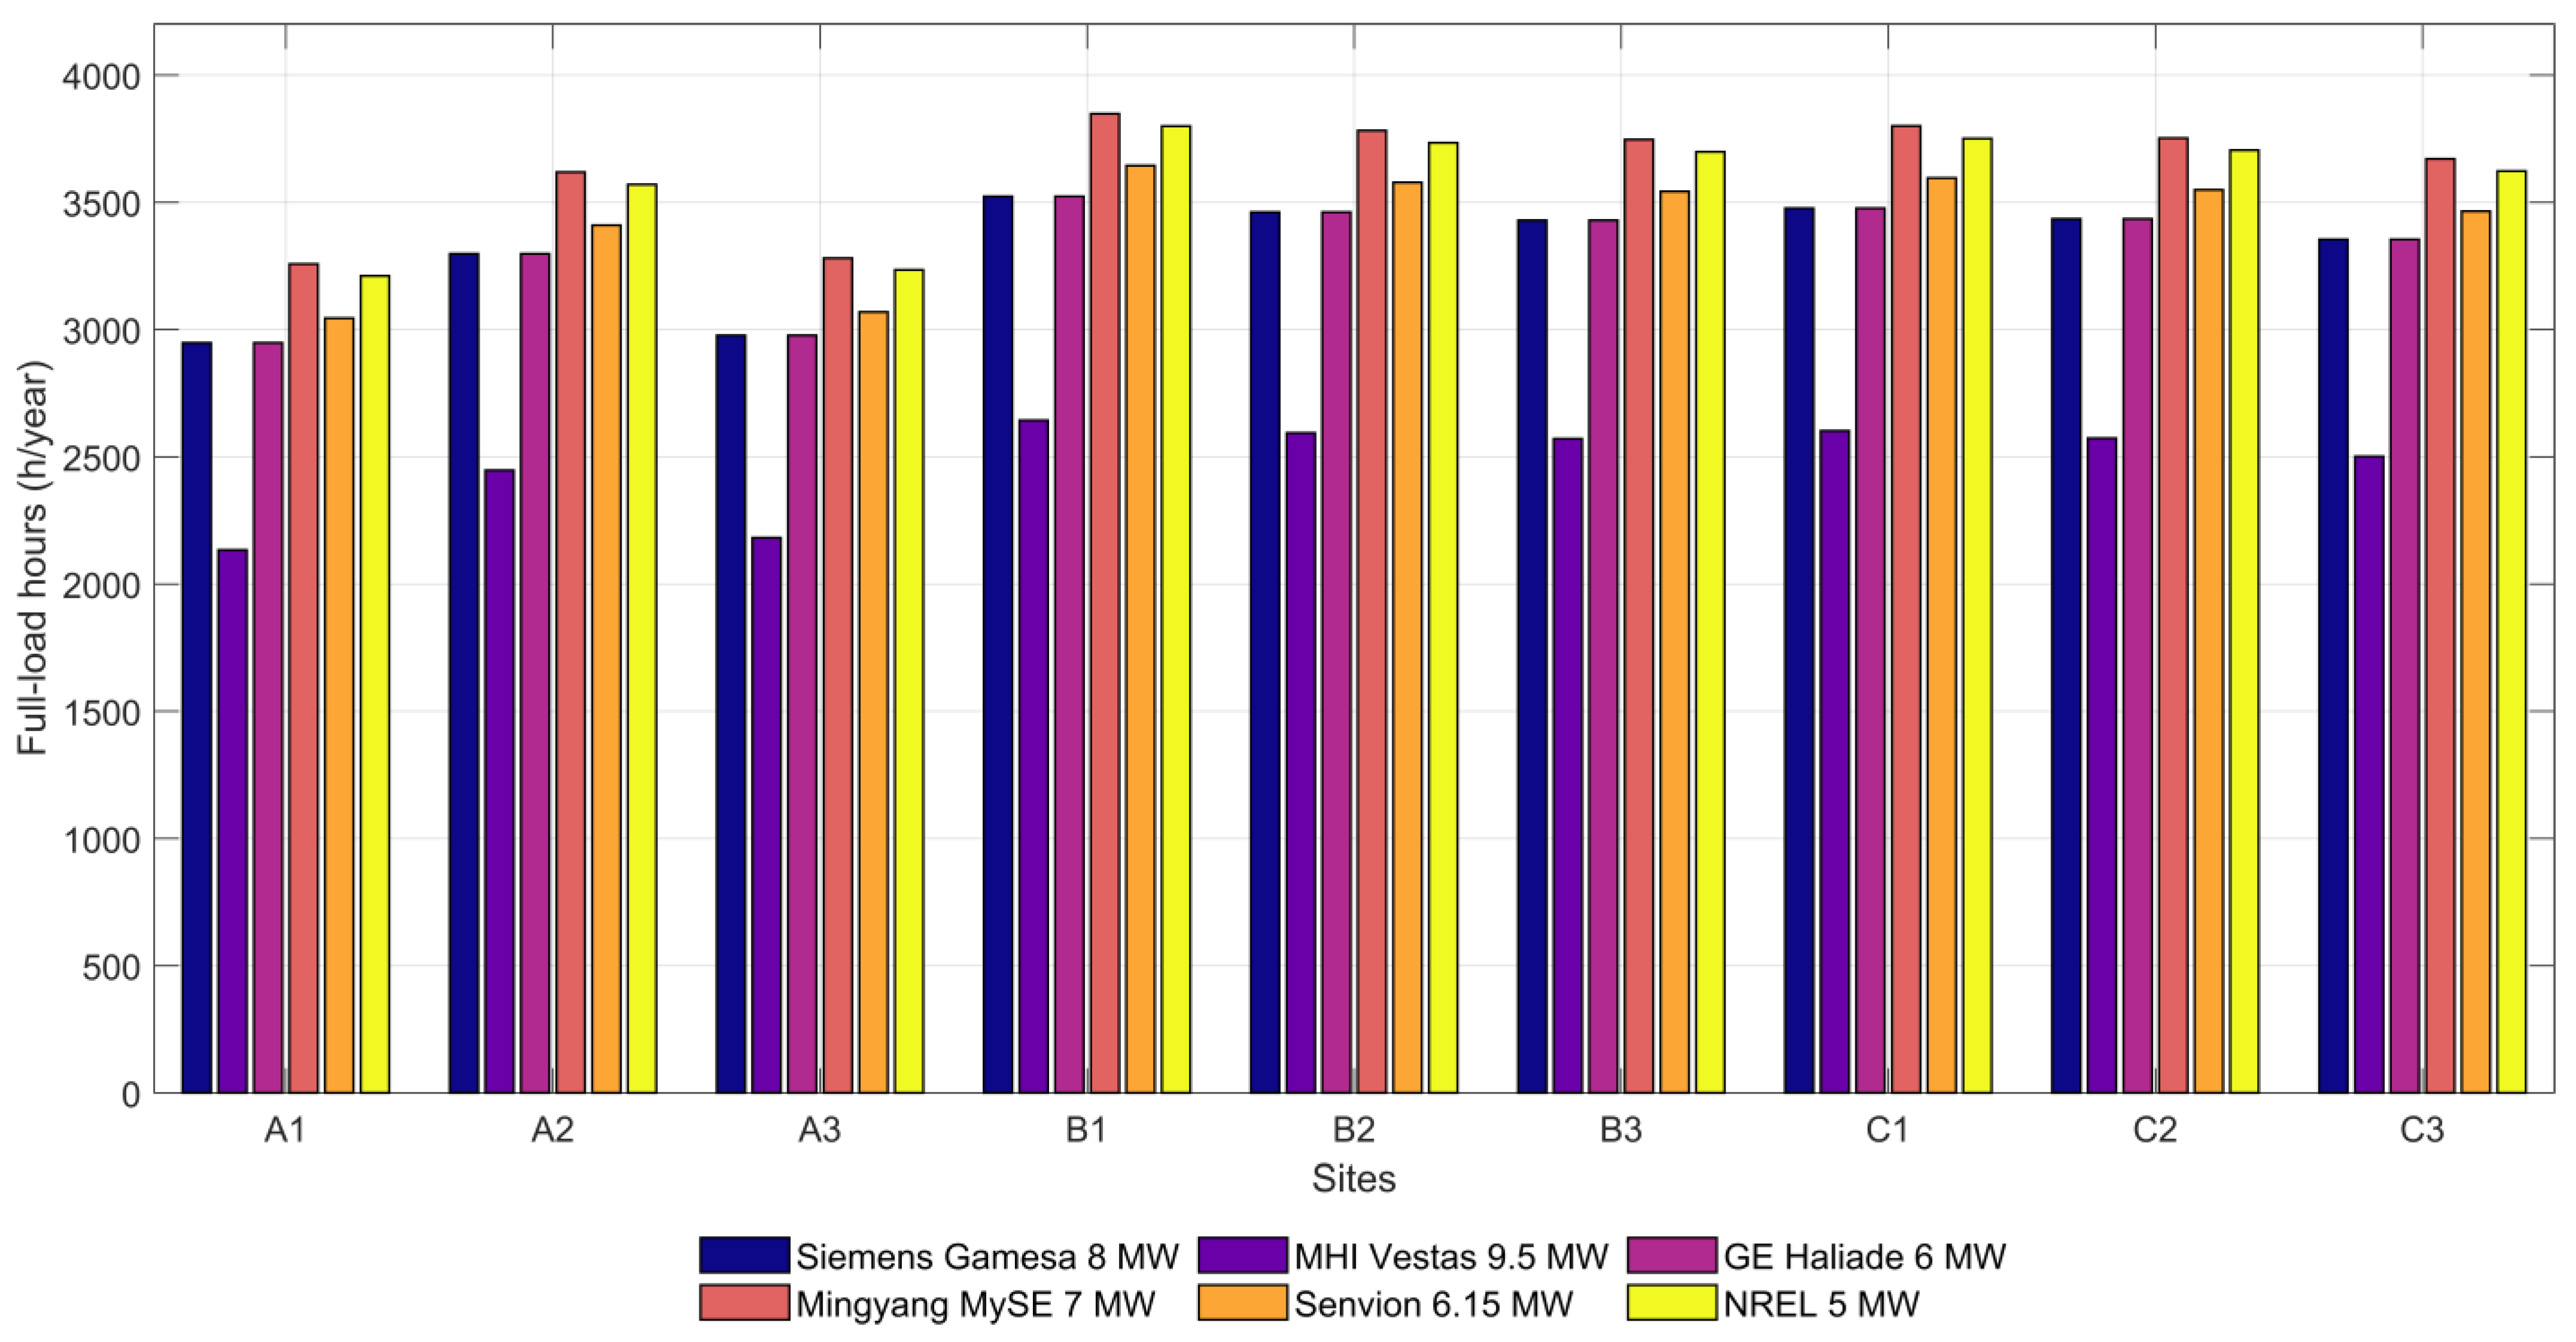
Figure 8, which depicts the annual values of the equivalent hours of operation at nominal load (full-load hours, or FLHs) for each turbine–site combination, demonstrates that these values vary from around 2134.18 to 3848.48 h/year.
Figure 8.
Energy performance (full-load hours) of the six turbines selected across the nine sites, 2006–2025.
To generate the same AEP under actual wind conditions, the turbine should have run at nominal power for the number of hours represented by FLH. As a result, greater FLH values suggest stronger wind potential and an improved energy performance of the location in question. A clear relationship between the wind regime and the turbine’s technical efficiency is shown by the comparison study, which shows that Mingyang MySE 7 MW records the greatest values of FLH in the B1 zones. This demonstrates that the corresponding locations provide favorable conditions for the use of offshore wind power.
Although the values of AEP and CF varied among the investigated sites due to differences in wind resource availability, the relative ranking of turbine models remained unchanged throughout the study area. The Siemens Gamesa 8 MW turbine (Siemens Gamesa Renewable Energy, Zamudio, Spain) consistently achieved the highest annual energy production at all nine sites, while the Mingyang MySE 7 MW turbine exhibited the highest capacity factor. Considering these aspects for the economic analysis, one turbine was chosen from the nine locations, the one that produced the highest amount of energy during the analyzed period. This turbine was the Siemens Gamesa 8 MW, and the estimates below regarding the cost of the turbine were made considering its capacity.
Table 8 provides the data needed to analyze the costs associated with the three wind farm site categories. The CAPEX ranges from 2114 M EUR for site A1 to 3472 M EUR for site C2, showing an increase of over 60% from onshore/nearshore to deep offshore scenarios. Fixed components, such as D&C and turbine, contribute significantly to the total cost, with turbine cost being among the largest contributors to CAPEX. What makes each site unique, however, is the structure, mooring and transmission, which reflect the site conditions. For example, the costs for the structure increase from 126.6 M EUR (B2–B3) for the tension leg structure to 990 M EUR (C1–C2) for the semi-submersible structure, and those for transmission from 381.9 EUR M (A1) to 1109.4 M EUR (C3). In addition, the emergence of mooring costs in scenarios B2–C3 (up to EUR 230 M EUR) confirms the transition to floating turbines and the higher complexity of projects of this type. Installation costs follow the same trend, increasing from ~303 M EUR (A1) to ~326 M EUR (C3).
Table 8.
The values for the costs considered in the LCOE analysis.
Although OPEX is constant within each site and varies only by structure type, a slight increase is observed associated with more difficult sea conditions. Negative decommissioning values for C sites (up to 184.8 M EUR) may indicate material recovery or a low net cost of decommissioning.
Overall, sites in category A are the most economical and suitable for conventional solutions, those in zone C are the most expensive but can offer high energy potential, and zone B represents a compromise between cost and technical performance.
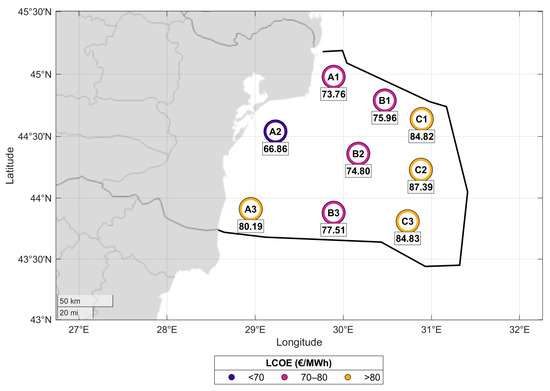
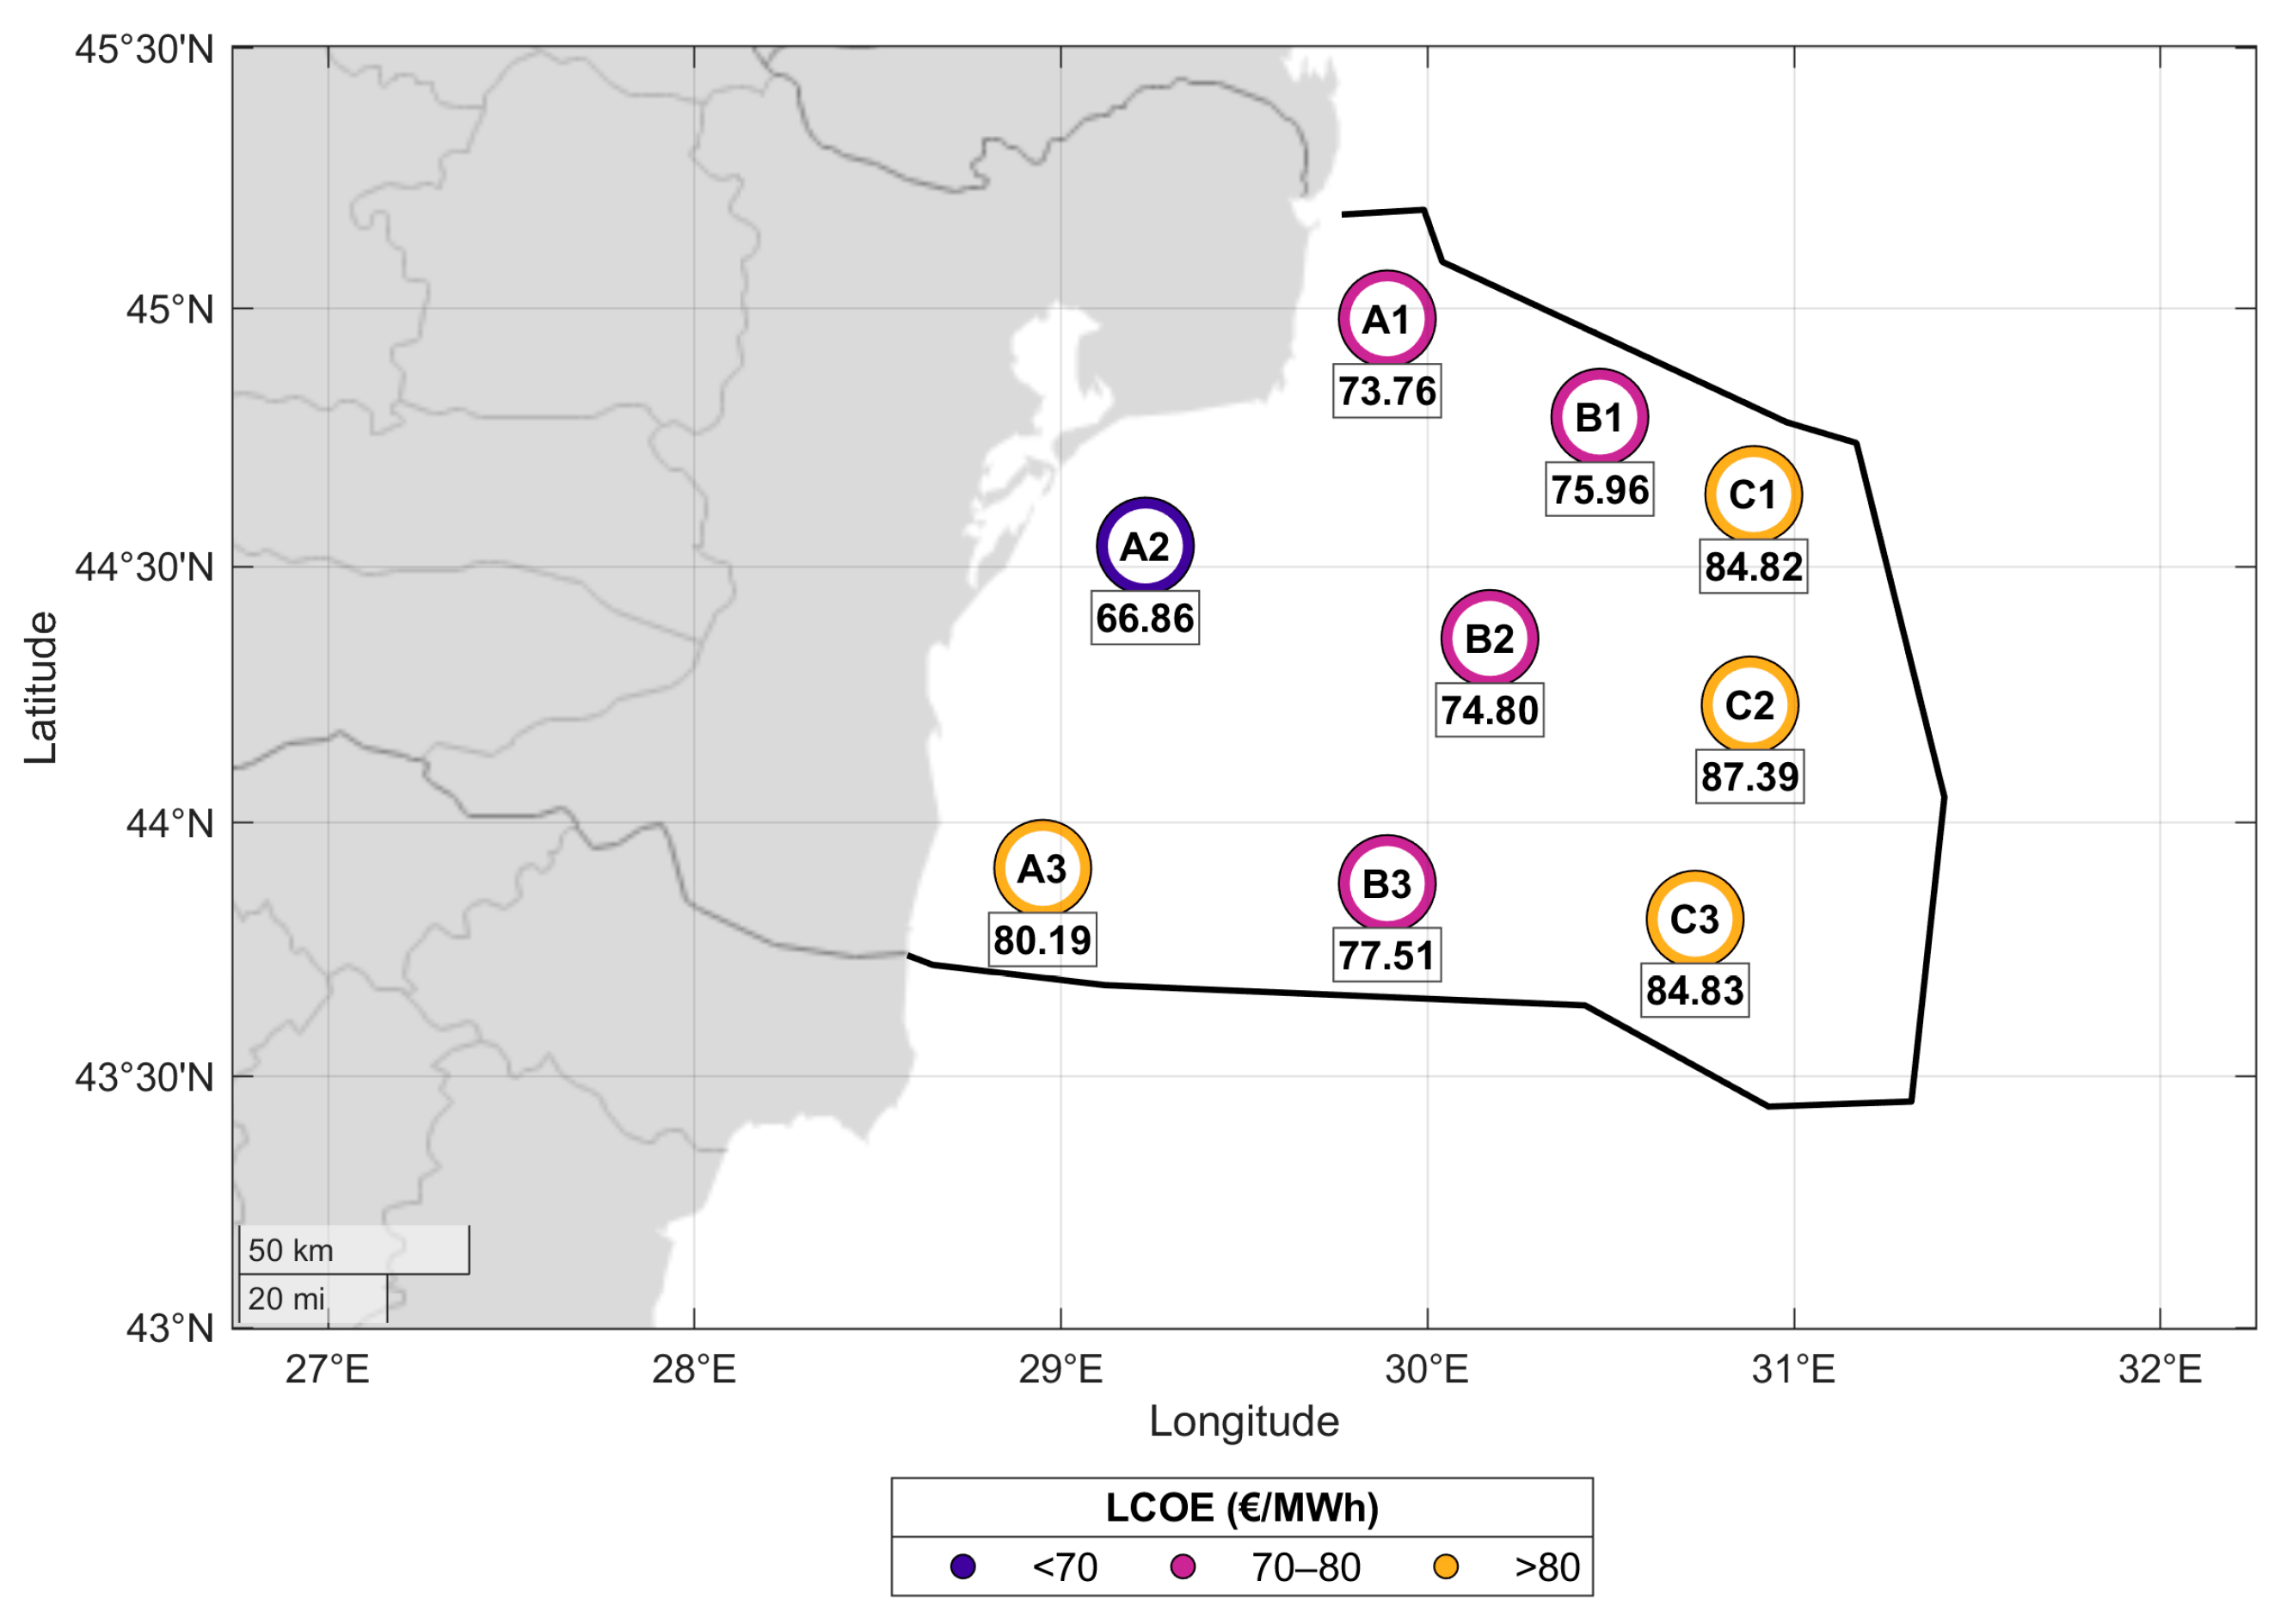
Figure 9 illustrates the LCOE values for the nine sites, ranging from 66.86 EUR/MWh to 87.39 EUR/MWh. This shows that there are large differences between sites due to unique conditions and cost structures. Sites in area A (A2–66.86 EUR/MWh) have the lowest LCOE values. This is because the costs of installing and operating the sites are low and the conditions are good. Sites in area C (C2–87.39 EUR/MWh), on the other hand, have the highest values. This is due to the high costs of infrastructure, transportation and installation. Sites in area B have average values, between 74.8 and 77.51 EUR/MWh. This is a balance between costs and production potential. In general, LCOE increases as you move from nearshore to deep offshore locations. This is consistent with the increase in CAPEX and OPEX.
Figure 9.
The LCOE obtained for the nine sites.
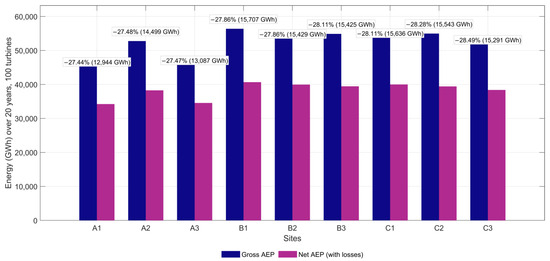
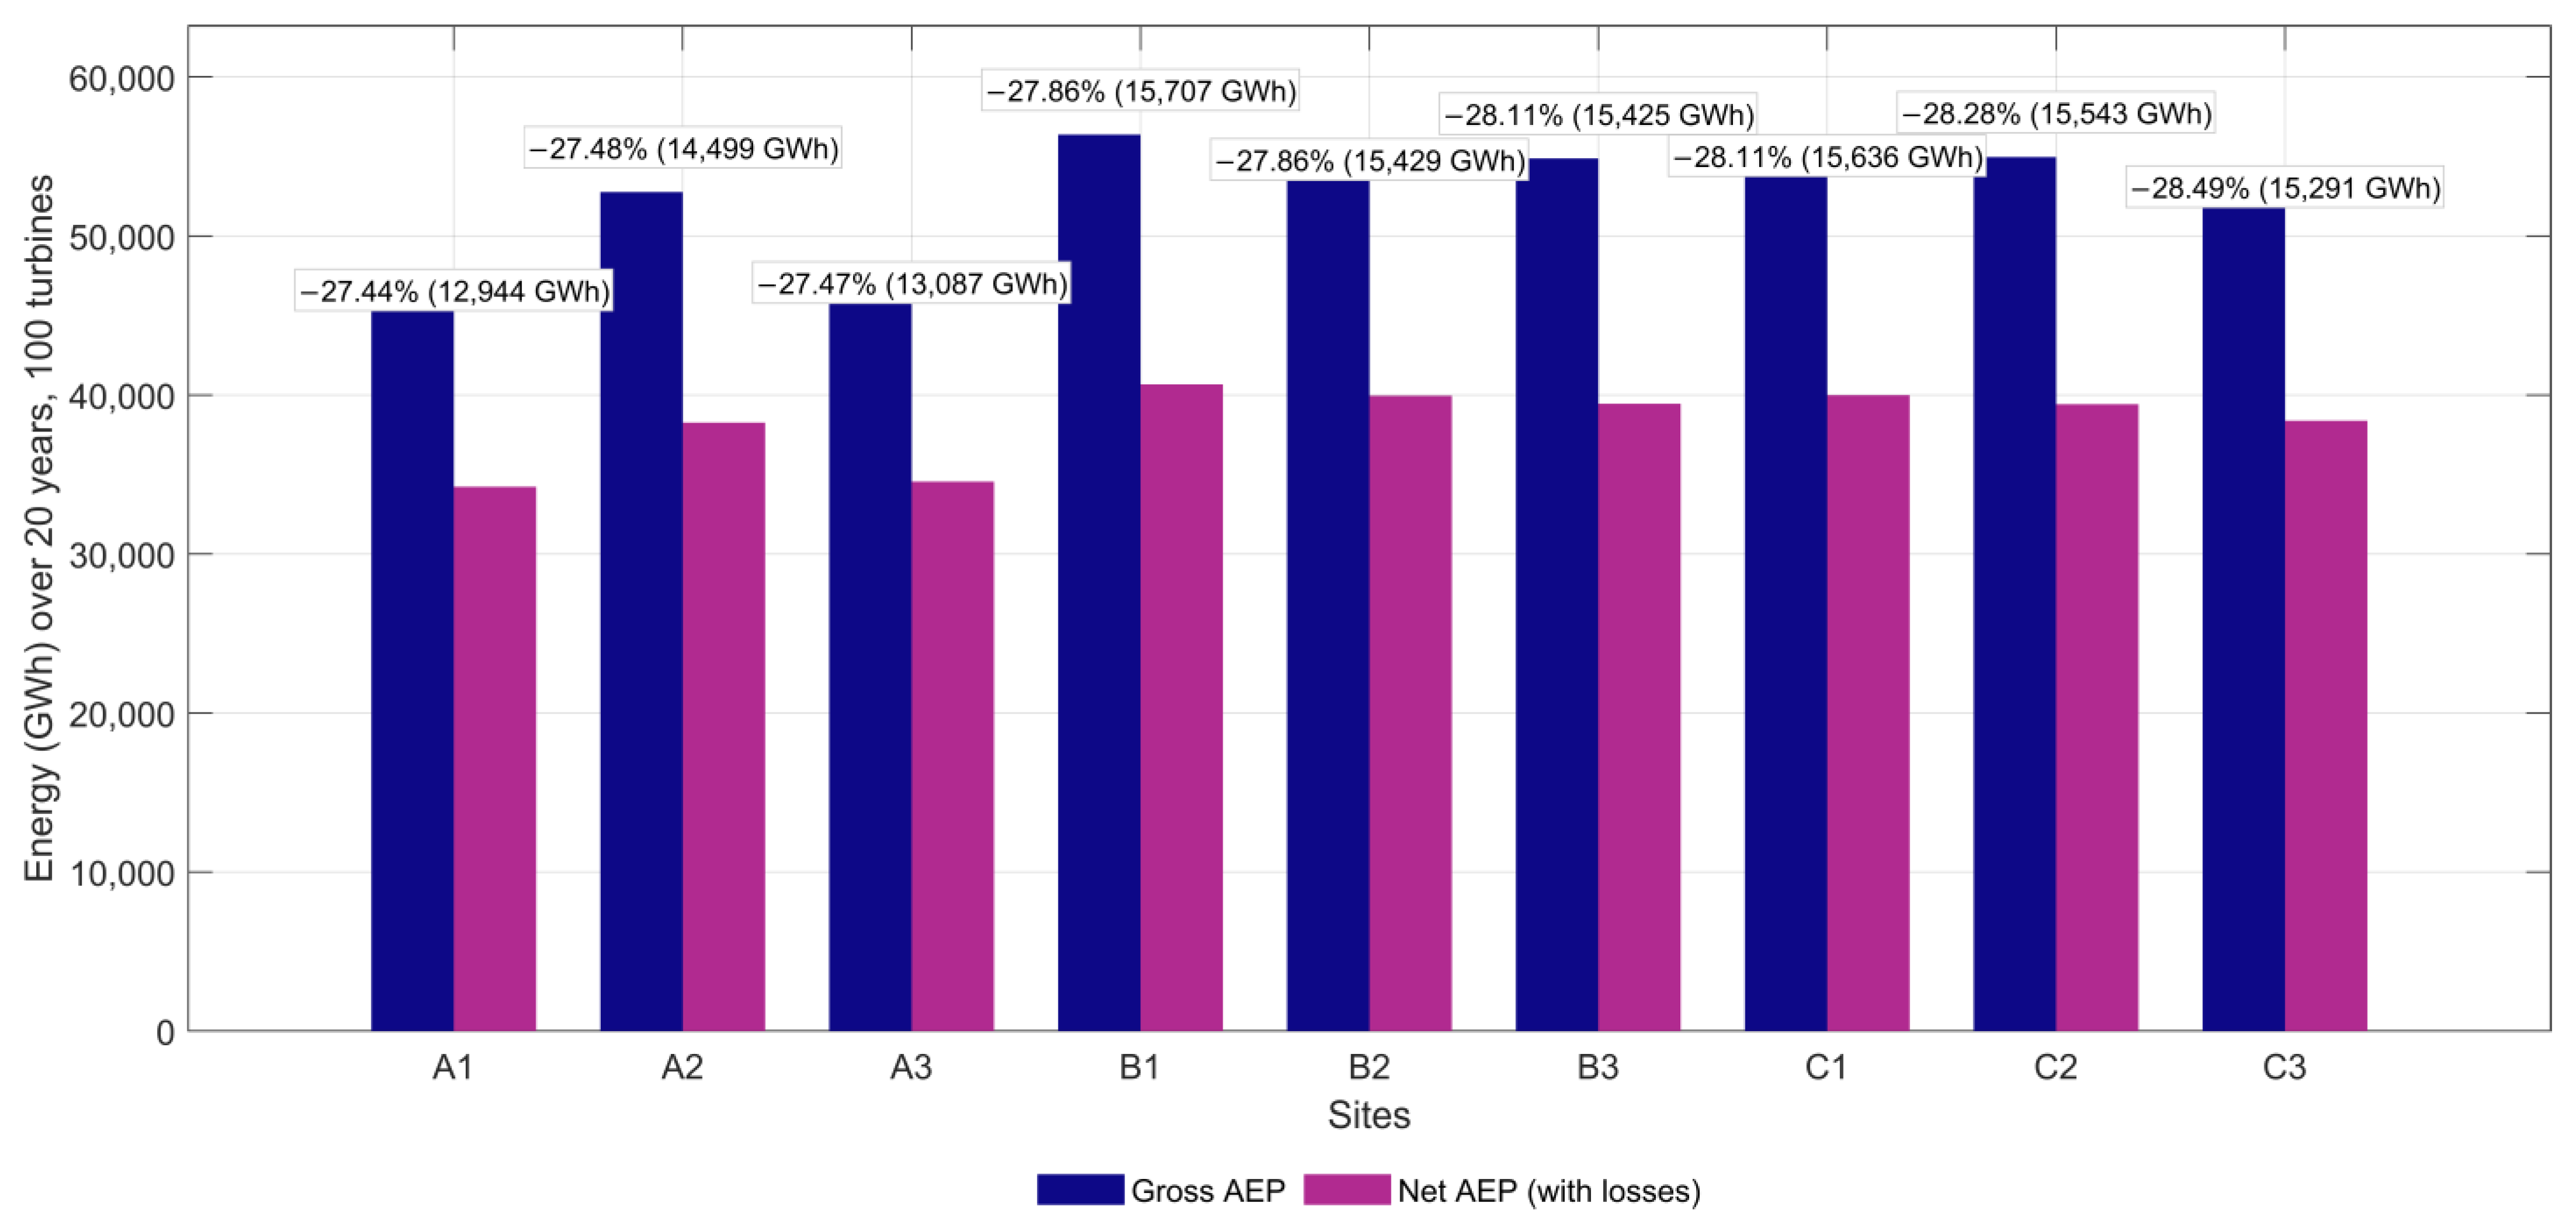
Figure 10 shows the AEP before and after losses were applied. This was done to show how different types of losses affect the energy delivered to the grid. The raw AEP values give an idea of how much each site could theoretically produce, but to really judge the system’s performance and the turbines’ technical efficiency, you need to look at the losses. Electrical losses, annual availability, aerodynamic losses, hysteresis losses, performance losses, internal cable losses, and losses associated with the equipment’s lifespan were all considered in this analysis, resulting in a total of losses that have a substantial impact on the net energy produced. The values obtained suggest a theoretical production between approximately 47.2 GWh and 56.4 GWh, while the actual production, after the application of losses, varies between 34.2 GWh and 40.7 GWh, which corresponds to a reduction of approximately 27–29% of the total energy. This decrease highlights the importance of considering real losses in assessing the energy and economic performance of wind farms, and the graphical representation allows a clear visualization of the differences between sites and the influence of each factor on the results.
Figure 10.
Energy production for simulated sites considering 100 turbines for a period of 20 years considering both gross and loss production (2006–2025).
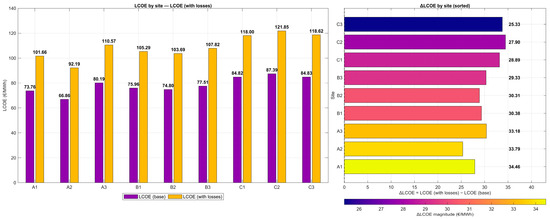
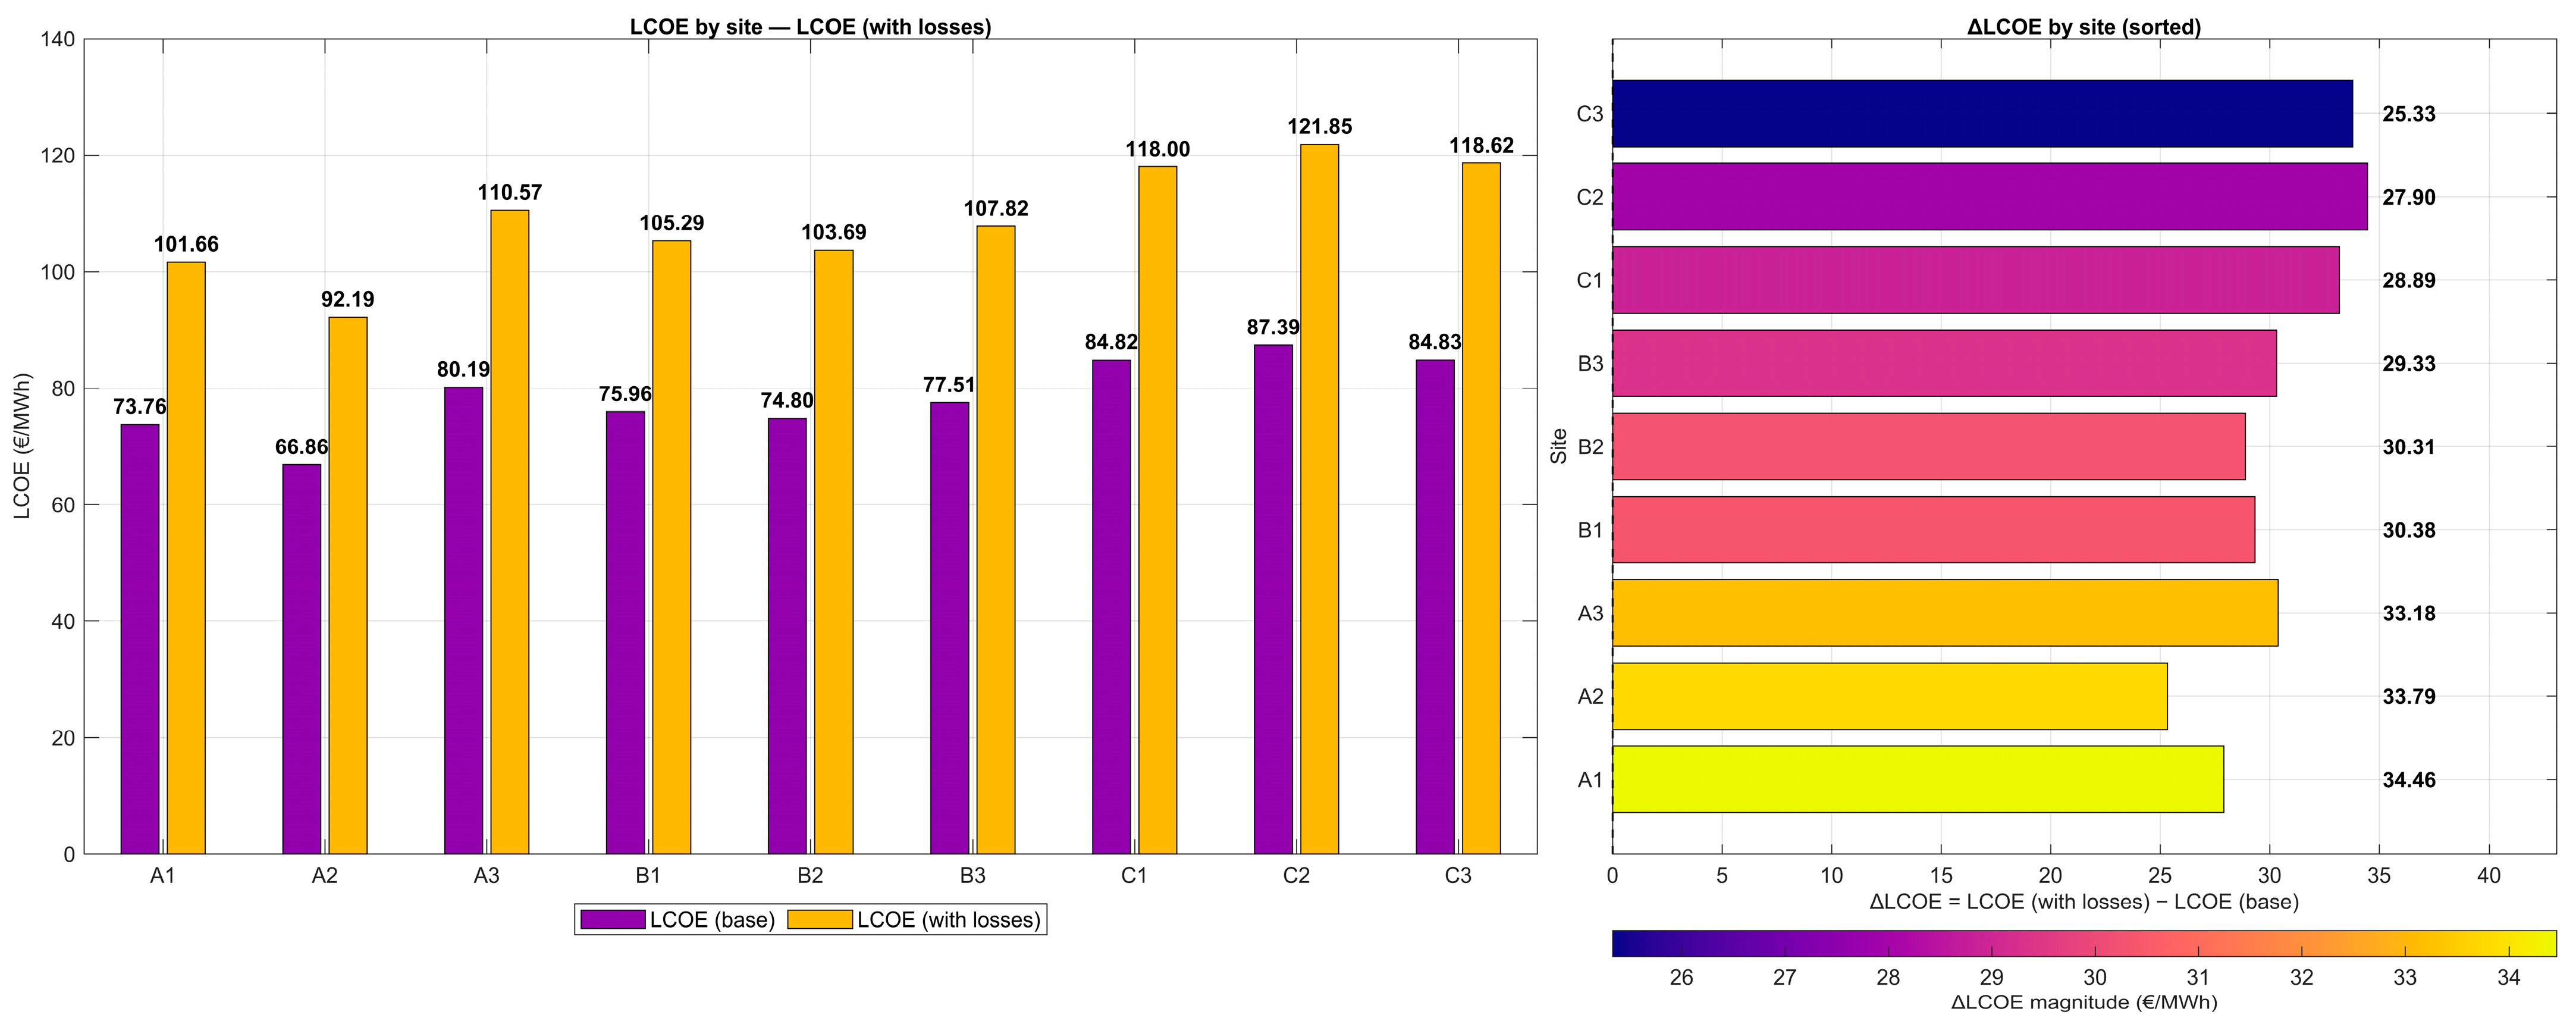
Figure 11 presents the LCOE for the two simulated cases for gross AEP and net AEP (for the Siemens Gamesa 8 MW turbine), from which a clear increase in LCOE is observed from values between 66.86 and 87.39 EUR/MWh in the ideal scenario to 92.19 and 121.85 EUR/MWh. The graph on the right, which illustrates the price difference between the two situations, highlights the direct economic impact of losses on each site and the importance of considering them in the analysis of the competitiveness of offshore wind projects.
Figure 11.
Comparative analysis of the LCOE with all energy produced and that determined based on energy production with losses.
The graph on the right shows the absolute increase in LCOE due to the application of the losses considered in the analysis. The difference between the LCOE values calculated under ideal conditions and those obtained after including losses varies between 25.33 EUR/MWh for site C3 and 34.46 EUR/MWh for site A1. Although sites in area C have the highest absolute LCOE values, the additional impact of losses is relatively lower compared to sites in areas A and B.
4. Discussion
The analysis of the previous figure reveals that the Black Sea, particularly at the selected locations, exhibits relatively low wind speeds. However, these conditions may still present a viable environment for wind energy production. It is essential to recognize that there is a lack of competitive edge when compared to other regions, notably the North Sea and the Baltic Sea. The data indicate that the average wind speed at a height of 100 m in the North Sea ranges from approximately 8.5 to 11 m/s, while in the Baltic Sea, it is observed to be around 8 to 9.5 m/s [52,53]. The analysis of electricity production and capacity factors reveals distinct characteristics among the selected turbines. Notably, the turbine with the highest power output does not perform optimally in this region, exhibiting the lowest capacity factor. In contrast, the Siemens Gamesa 8 MW and Mingyang MySE 7 MW turbines emerge as the most suitable options for this context.
In the context of the LCOE analysis, it has been determined that a singular turbine type will be employed, specifically the one that demonstrates optimal performance. Among the components that exhibit significant effects are the expenses associated with the turbine. Furthermore, for floating foundations, considerable costs have been noted for the semi-submersible foundation, which are comparably higher. Other major costs are those related to transmission, thus highlighting the fact that the distance from the shore has a greater effect than depth, so that farms located at smaller distances from the shore are more suitable.
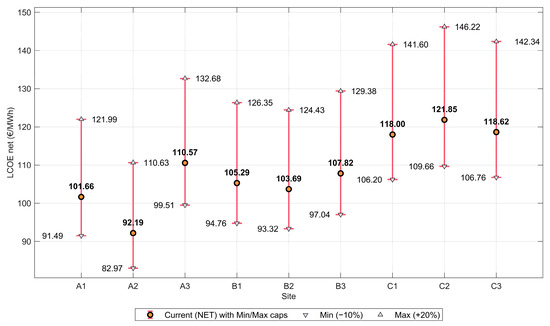
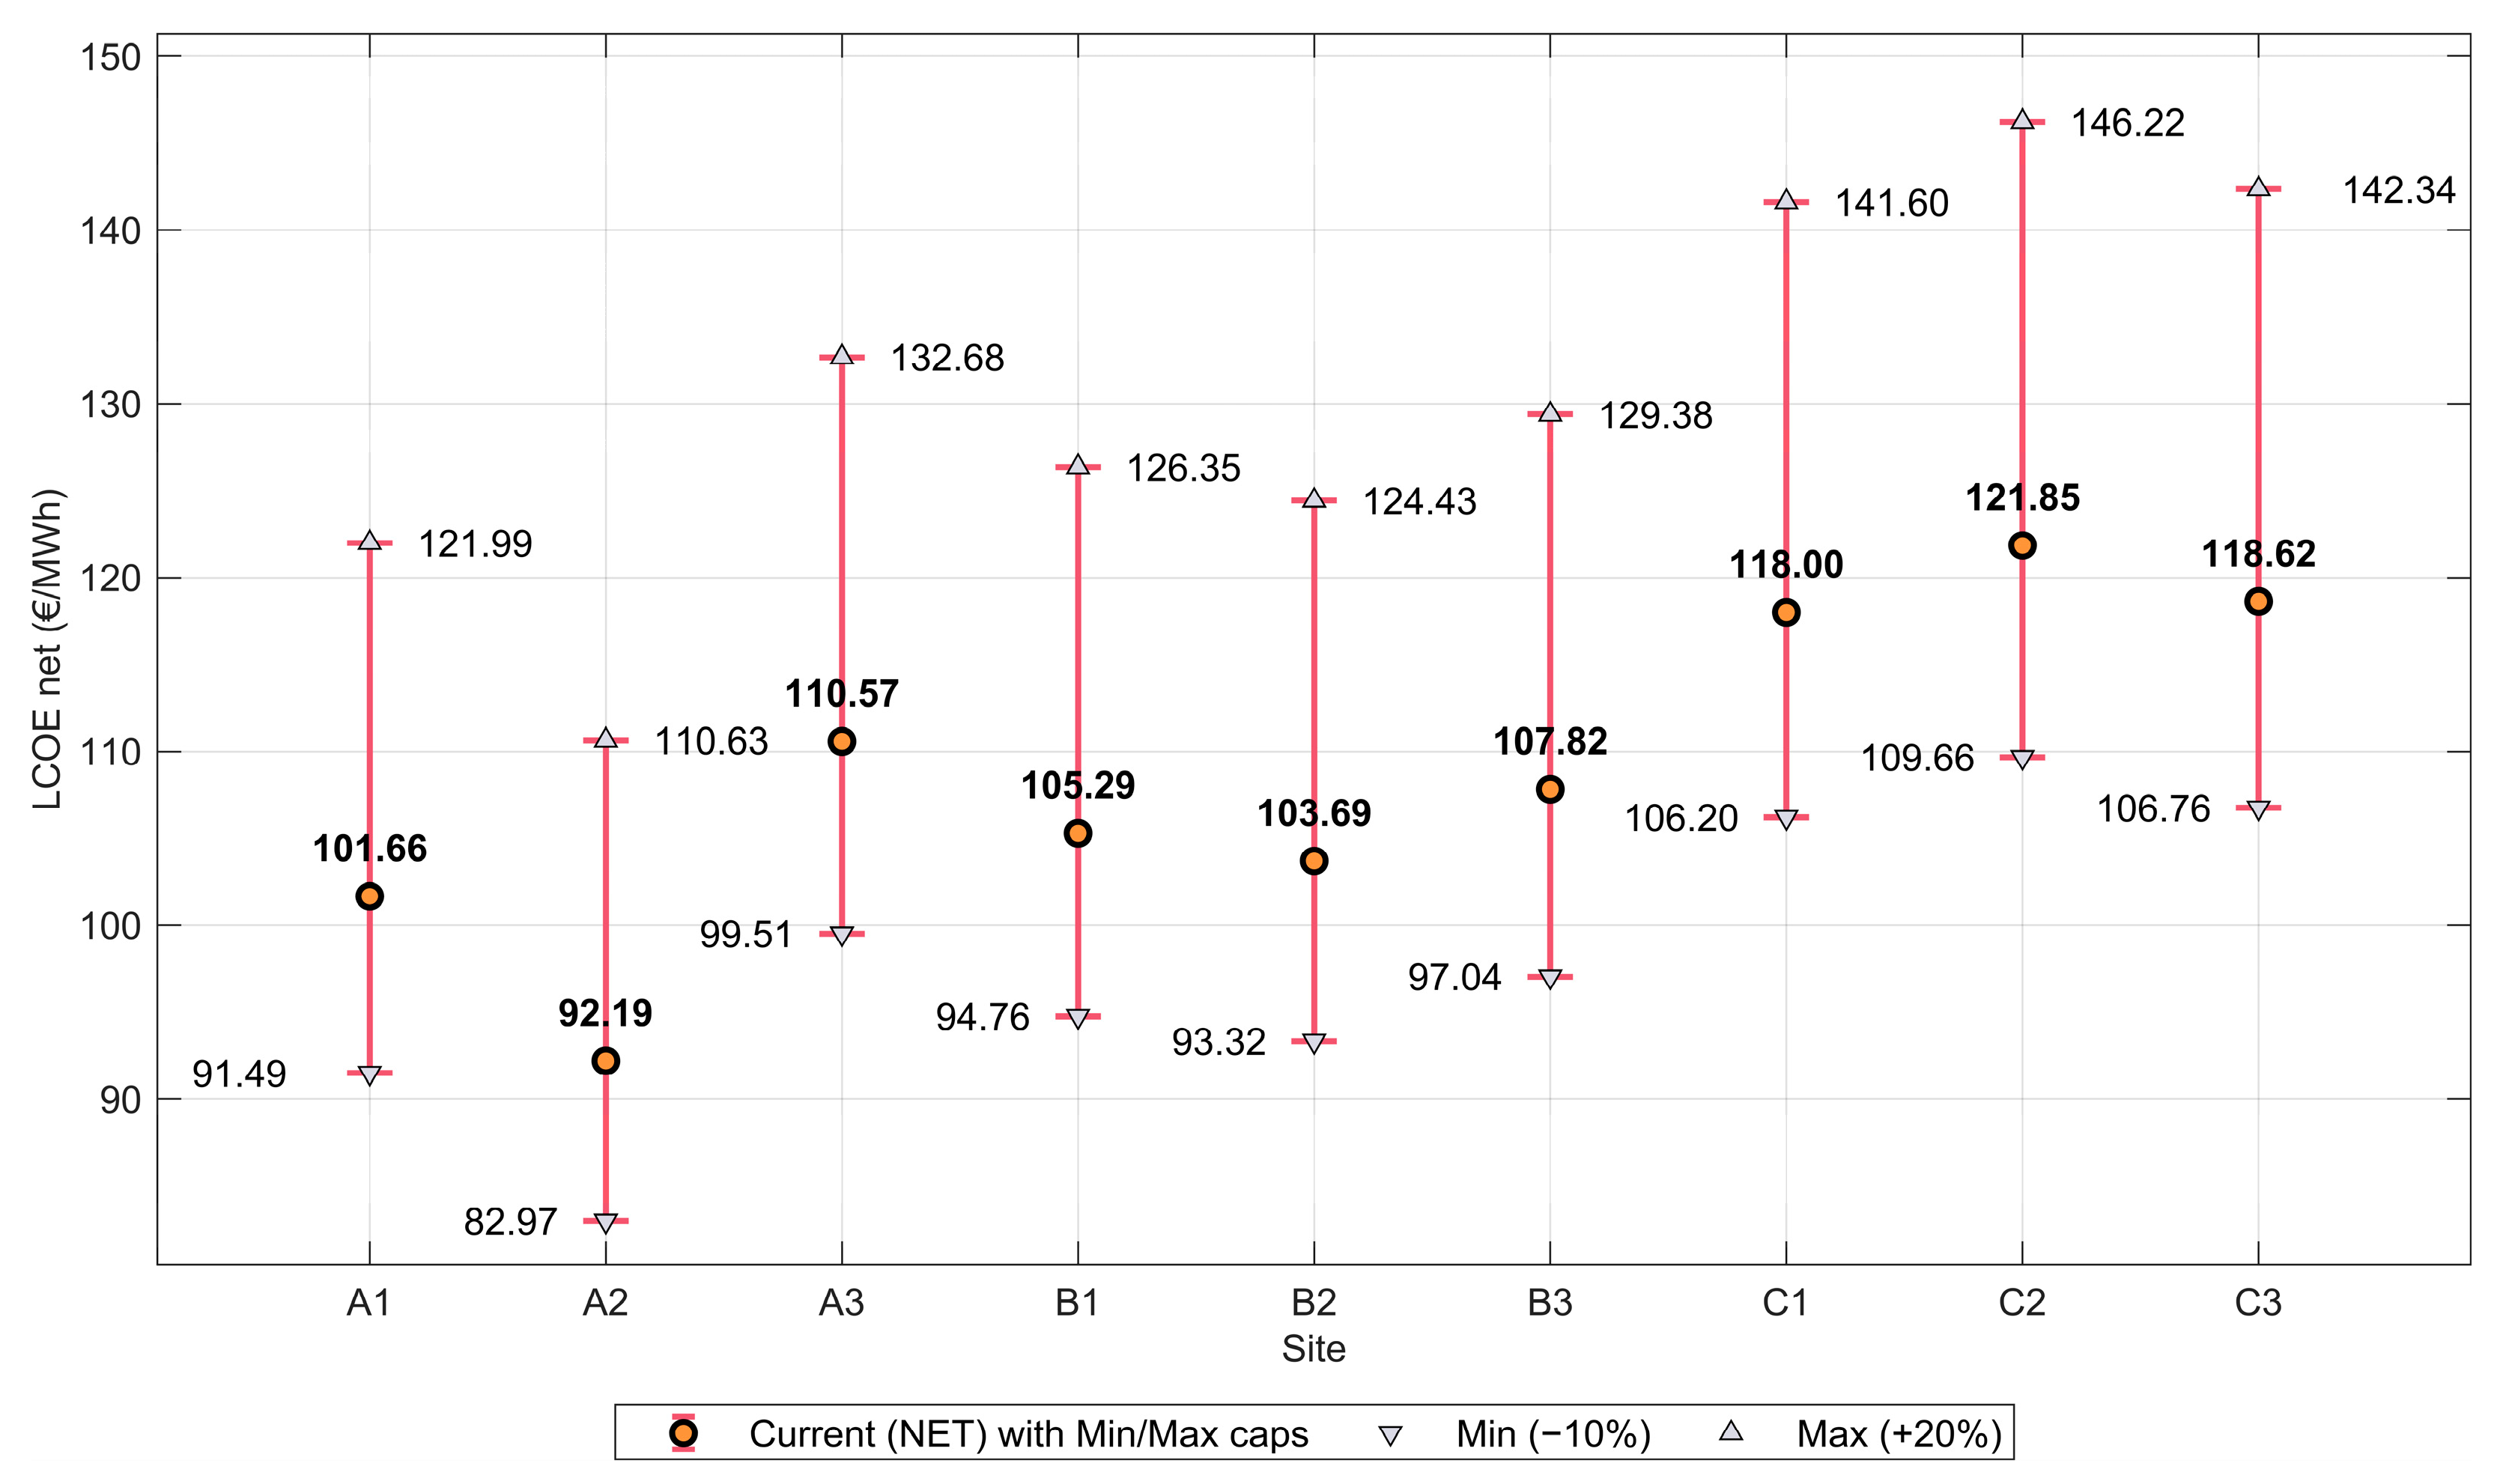
However, there is no precise way to determine the LCOE without having data provided by manufacturers or from wind farms already installed, but even so, each location presents special characteristics, due to which, certain costs can be reduced or may be higher. Also, certain costs could not be considered in the analysis or were taken roughly, and for the LCOE analysis, existing data in the literature were used that were converted to EUR. This interval considers the potential influence of technological, economic, and market-related factors that may affect project costs throughout the lifetime of an offshore wind farm. Taking all these aspects into account, an analysis was carried out considering a change in the LCOE of −10% and +20%; thus, having a possible maximum and minimum range, the analysis was carried out only for the LCOE with gross AEP (Figure 12). The wider upper bound was selected to capture possible increases in expenditures associated with materials, installation activities, financing conditions, and operation requirements. It is observed that the variation range for the site with the lowest LCOE is 82.97–110.63 EUR/MWh (for A2) and that for the highest LCOE is 109.66–146.22 EUR/MWh (for C2).
Figure 12.
The LCOE range limits for the nine sites considering errors in its determination.
Comparing the results obtained in this study with those from the works used as references in the cost estimation, as well as from other sources, we can say that the results are consistent with the data published in recent works, which suggests a good correlation of the model used. Thus, in [47], an LCOE ranging between 90 and 160 EUR/MWh was determined for a farm with 100 turbines of 100 MW and a spar-type foundation in the European Atlantic. Among the main differences, a much higher cost for the turbines is observed compared to the current work. In the work [54] for the Black Sea, an LCOE approximated at 120–170 EUR/MWh is observed. Paper [16] estimates an LCOE between 152.5 EUR/MWh for a monopile structure and 189.2 EUR/MWh for a semi-submersible structure. Here too, we observe a distribution of costs similar to those in the current study.
Also, comparing the results obtained for the monopile structure with those in the work mentioned in reference [55], which obtained, for a distance from the shore of 32 km and an operating height of 115 m, an LCOE of approximately 114 €/MWh, we can see a similarity in the values obtained. Sites A1 and A2 have a distance from the shore of 20 and 25 km, respectively, and an operating height of 100 m. For these operating conditions, an LCOE value between 101.66 and 92.19 €/MWh was obtained, results that are competitive with those obtained in the previously mentioned work.
It should be highlighted that the loss assumptions utilized in the baseline study may underestimate the effect of wake interactions in large offshore wind farms. Previous studies have indicated that wake effects are generally more significant offshore than onshore due to the lower ambient turbulence levels, enabling velocity deficits to persist over significantly longer distances [56,57]. Reported wake-related energy losses in offshore wind farms are commonly in the range of 11–28% of the annual energy production [58], while values exceeding 30% have been reported for very large developments affected by both intra-farm and inter-farm wake interactions [59]. Furthermore, wake effects may extend tens of kilometers downstream of large offshore arrays [60], highlighting their importance for both energy yield and economic assessments. Considering these findings, an additional scenario was investigated by increasing the aerodynamic losses in order to better represent the potential impact of wake effects under Black Sea conditions and for the considered 100-turbine layout. Under these circumstances, the predicted LCOE values increase significantly, ranging from 140.69 EUR/MWh to 187.05 EUR/MWh (Table 9), which underlines the tremendous effect of wake-induced energy losses on the economic performance of offshore wind projects. The obtained results highlight the importance of site selection in improving the economic sustainability of offshore wind projects, as significant differences in LCOE were observed among the investigated locations.
Table 9.
Impact of enhanced wake-related losses on the estimated LCOE values.
Following the cost and performance analysis for the studied sites, it was observed that the C2 site records high CAPEX and LCOE values, mainly influenced by the large water depth and the complexity of the infrastructure used. This raised the question of whether the chosen constructive solution—a semi-submersible foundation—is the most suitable from a technical and economic point of view for the specific conditions of the site. Starting from this observation, we proposed an optimization of the C2 site by testing an alternative foundation, the spar type, which is frequently mentioned in the literature as having better performance at great depths, due to its lowered center of gravity and superior hydrodynamic stability. The purpose of this analysis was to evaluate whether replacing the semi-submersible configuration with a spar type can lead to a reduction in total costs and, implicitly, to an improvement in the economic competitiveness of the C2 site. Table 10 presents comparative results for the two types of foundations, and the analysis shows that, by replacing the semi-submersible platform with a spar platform, the CAPEX decreases by approximately 18%, which is reflected in a reduction in the LCOE by 7.91 EUR/MWh. This decrease suggests an improvement in the economic feasibility of the project, indicating that the choice of foundation type can significantly influence the total cost of energy production. The result is in line with the observations reported in the recent literature, where spar structures are considered efficient solutions for depths above 100 m, offering a better balance between construction costs, hydrodynamic stability and long-term performance. In conclusion, the analysis shows that an appropriate technological optimization of the foundation can directly contribute to reducing the LCOE and increasing the competitiveness of offshore wind projects in deep areas.
Table 10.
LCOE difference for site C2 by changing the foundation used.
5. Conclusions
The conducted analysis facilitated a comprehensive evaluation of the technical and economic performance across the nine proposed sites, starting with the characterization of the wind regime to the estimation of the LCOE. In the first stage, the statistical analysis of wind speed using ERA5 data highlighted variations between sites 6.84–7.51 m/s, confirming the importance of local conditions on energy potential. The analysis of speed distributions facilitated the determination of the AEP, and the results showed differences of over 30% between the different turbine types, thus helping to determine the most and least favorable sites. Overall, the results suggest that the wind regime becomes more intense and uniform as one move offshore, confirming the higher wind potential in the offshore area compared to the proximity of the shore.
Correlating these values with the cost analysis, LCOE values ranging between approximately 66.86 and 87.39 EUR/MWh were obtained for the base scenarios, reflecting the cumulative influence of production, initial investments (CAPEX) and operating costs (OPEX). The sites in area A proved to be the most competitive, benefiting from simpler installation conditions and reduced infrastructure costs, while the sites in area C, although characterized by high wind potential, presented significantly higher costs, due to the great depths and structural complexity. It was observed that water depth has a relatively small impact on costs, except for mooring costs, which are influenced by the length of mooring lines. However, this influence of water depth on mooring line costs is mitigated by other expenses, such as those related to the mooring system. But a factor that influences a large part of the costs is related to the distance from the shore, which both influences transmission and represents an important component in estimating installation costs as well as OPEX.
Sensitivity analysis applied to LCOE values, using −10% and +20% variations in economic parameters, reveals a relative uncertainty of about ±30% for the LCOE. The resulting ranges (e.g., 82.97–110.63 EUR/MWh for the cheapest site and 109.66–146.22 EUR/MWh for the most expensive) show that the order of competitiveness between sites may become unclear under cumulative variation in parameters, which highlights the need to use probabilistic analyses or multi-criteria evaluation methods in the early design stages.
For site C2, which has been identified as exhibiting the highest LCOE, an optimization strategy was proposed involving a modification of the foundation type, specifically substituting the original semi-submersible design with a spar-type foundation. This change resulted in a decrease in LCOE of 10.76 EUR/MWh. This optimization suggests that careful selection of foundation type can transform an economically marginal site into a feasible one.
In conclusion, the analysis demonstrates that the economic sustainability of offshore wind projects depends simultaneously on the wind resource, the technological solutions adopted, and the control of economic uncertainties. Deep-water locations can become competitive through structural optimization and reduced infrastructure costs, while a sensitivity and benchmarking approach provides a more robust framework for investment decisions and supports the sustainable deployment of offshore wind energy in the Romanian Black Sea.
As a future research direction, it is desired to use these costs in conjunction with those for green hydrogen production to determine the possibility of using offshore wind in this direction as well.
Author Contributions
Conceptualization, M.M., A.I.M. and G.A.; writing—original draft preparation, M.M., A.I.M. and G.A.; writing—review and editing, M.M. and A.I.M.; visualization, A.I.M.; supervision, G.A. All authors have read and agreed to the published version of the manuscript.
Funding
This research received no external funding.
Institutional Review Board Statement
Not applicable.
Informed Consent Statement
Not applicable.
Data Availability Statement
The data presented in this study are available on request from the corresponding author.
Conflicts of Interest
The authors declare no conflicts of interest.
References
- Brożyna, J.; Strielkowski, W.; Fomina, A.; Nikitina, N. Renewable Energy and EU 2020 Target for Energy Efficiency in the Czech Republic and Slovakia. Energies 2020, 13, 965. [Google Scholar] [CrossRef] [Scilit]
- IRENA. Renewable Capacity Statistics 2025; International Renewable Energy Agency: Abu Dhabi, United Arab Emirates, 2025. [Google Scholar]
- Tumse, S.; Bilgili, M.; Yildirim, A.; Sahin, B. Comparative Analysis of Global Onshore and Offshore Wind Energy Characteristics and Potentials. Sustainability 2024, 16, 6614. [Google Scholar] [CrossRef] [Scilit]
- Guo, Q.; Xu, X.; Zhang, K.; Li, Z.; Huang, W.; Mansaray, L.R.; Liu, W.; Wang, X.; Gao, J.; Huang, J. Assessing Global Ocean Wind Energy Resources Using Multiple Satellite Data. Remote Sens. 2018, 10, 100. [Google Scholar] [CrossRef] [Scilit]
- Elshafei, B.; Peña, A.; Popov, A.; Giddings, D.; Ren, J.; Xu, D.; Mao, X. Offshore Wind Resource Assessment Based on Scarce Spatio-Temporal Measurements Using Matrix Factorization. Renew. Energy 2023, 202, 1215–1225. [Google Scholar] [CrossRef] [Scilit]
- Diaconita, A.I.; Andrei, G.; Rusu, E. Estimation of the Tower Shape Effect on the Stress–Strain Behavior of Wind Turbines Operating under Offshore Boundary Conditions. Inventions 2022, 7, 11. [Google Scholar] [CrossRef] [Scilit]
- Partovi-Mehr, N.; DeFrancisci, J.; Minaeijavid, M.; Moaveni, B.; Kuchma, D.; Baxter, C.D.; Hines, E.M.; Bradshaw, A.S. Fatigue Analysis of a Jacket-Supported Offshore Wind Turbine at Block Island Wind Farm. Sensors 2024, 24, 3009. [Google Scholar] [CrossRef] [Scilit] [PubMed]
- Li, Y.; Yin, W.; Leng, S.; Meng, Y.; Zhang, Y. Dynamic Analysis of a Spar-Type Floating Offshore Wind Turbine Under Extreme Operation Gust. Sustainability 2025, 17, 5655. [Google Scholar] [CrossRef] [Scilit]
- Wu, D.; Seo, G.-S.; Xu, L.; Su, C.; Kocewiak, L.; Sun, Y.; Qin, Z. Grid Integration of Offshore Wind Power: Standards, Control, Power Quality and Transmission. IEEE Open J. Power Electron. 2024, 5, 583–604. [Google Scholar] [CrossRef] [Scilit]
- Benabadji, A.S.; Rahmoun, K.; Bahar, F.A.; Dahani, A.; Martinez, A.; Iglesias, G. Geospatial LCOE Analysis for Floating Offshore Wind Energy in SW Mediterranean Sea. Renew. Energy 2025, 245, 122797. [Google Scholar] [CrossRef] [Scilit]
- Watson, S.C.L.; Somerfield, P.J.; Lemasson, A.J.; Knights, A.M.; Edwards-Jones, A.; Nunes, J.; Pascoe, C.; McNeill, C.L.; Schratzberger, M.; Thompson, M.S.A.; et al. The Global Impact of Offshore Wind Farms on Ecosystem Services. Ocean Coast. Manag. 2024, 249, 107023. [Google Scholar] [CrossRef] [Scilit]
- Li, M.; Jiang, X.; Carroll, J.; Negenborn, R.R. Operation and Maintenance Management for Offshore Wind Farms Integrating Inventory Control and Health Information. Renew. Energy 2024, 231, 120970. [Google Scholar] [CrossRef] [Scilit]
- Abramic, A.; Garcia Mendoza, A.; Cordero-Penin, V.; Magalhães, M.; Fernández-Palacios, Y.; Andrade, C.; Calado, H.; Kaushik, S.; Carreira, G.; Nogueira, N.; et al. Site Selection within the Maritime Spatial Planning: Insights from Use-Cases on Aquaculture, Offshore Wind Energy and Aggregates Extraction. Ocean Coast. Manag. 2024, 251, 107051. [Google Scholar] [CrossRef] [Scilit]
- Salvador, S.; Ribeiro, M.C. Socio-Economic, Legal, and Political Context of Offshore Renewable Energies. WIREs Energy Environ. 2023, 12, e462. [Google Scholar] [CrossRef] [Scilit]
- Castro-Santos, L.; Diaz-Casas, V. Economic Influence of Location in Floating Offshore Wind Farms. Ocean Eng. 2015, 107, 13–22. [Google Scholar] [CrossRef] [Scilit]
- Myhr, A.; Bjerkseter, C.; Ågotnes, A.; Nygaard, T.A. Levelised Cost of Energy for Offshore Floating Wind Turbines in a Lifecycle Perspective. Renew. Energy 2014, 66, 714–728. [Google Scholar] [CrossRef] [Scilit]
- Ghigo, A.; Cottura, L.; Caradonna, R.; Bracco, G.; Mattiazzo, G. Platform Optimization and Cost Analysis in a Floating Offshore Wind Farm. J. Mar. Sci. Eng. 2020, 8, 835. [Google Scholar] [CrossRef] [Scilit]
- Hdidouan, D.; Staffell, I. The Impact of Climate Change on the Levelised Cost of Wind Energy. Renew. Energy 2017, 101, 575–592. [Google Scholar] [CrossRef] [Scilit]
- Martinez, A.; Iglesias, G. Site Selection of Floating Offshore Wind through the Levelised Cost of Energy: A Case Study in Ireland. Energy Convers. Manag. 2022, 266, 115802. [Google Scholar] [CrossRef] [Scilit]
- Sørensen, J.N.; Larsen, G.C.; Cazin-Bourguignon, A. Production and Cost Assessment of Offshore Wind Power in the North Sea. J. Phys. Conf. Ser. 2021, 1934, 012019. [Google Scholar] [CrossRef] [Scilit]
- Caglayan, D.G.; Ryberg, D.S.; Heinrichs, H.; Linßen, J.; Stolten, D.; Robinius, M. The Techno-Economic Potential of Offshore Wind Energy with Optimized Future Turbine Designs in Europe. Appl. Energy 2019, 255, 113794. [Google Scholar] [CrossRef] [Scilit]
- Rinaldi, G.; Garcia-Teruel, A.; Jeffrey, H.; Thies, P.R.; Johanning, L. Incorporating Stochastic Operation and Maintenance Models into the Techno-Economic Analysis of Floating Offshore Wind Farms. Appl. Energy 2021, 301, 117420. [Google Scholar] [CrossRef] [Scilit]
- Yeter, B.; Garbatov, Y.; Guedes Soares, C. Risk-Based Maintenance Planning of Offshore Wind Turbine Farms. Reliab. Eng. Syst. Saf. 2020, 202, 107062. [Google Scholar] [CrossRef] [Scilit]
- Thomas, B.; Costoya, X.; deCastro, M.; Carvalho, D.; Gómez-Gesteira, M. Wake Effect Impact on the Levelized Cost of Energy in Large Floating Offshore Wind Farms: A Case of Study in the Northwest of the Iberian Peninsula. Energy 2024, 304, 132159. [Google Scholar] [CrossRef] [Scilit]
- Wade, B.; Pereira, R.; Wade, C. Investigation of Offshore Wind Farm Layouts Regarding Wake Effects and Cable Topology. J. Phys. Conf. Ser. 2019, 1222, 012007. [Google Scholar] [CrossRef] [Scilit]
- ERA-Interim|ECMWF. Available online: https://www.ecmwf.int/en/forecasts/datasets/archive-datasets/reanalysis-datasets/era-interim (accessed on 18 August 2018).
- Venuti, F.; Rabier, F.; Andersson, E.; Modigliani, U.; English, S.; Kitchen, C.; Berrone, M.; Pinsault, D.; Debrux, J.; Jarraud, M. ECMWF’s Societal Impact through Service Provision, Partnerships and Collaborations. J. Eur. Meteorol. Soc. 2025, 2, 100013. [Google Scholar] [CrossRef] [Scilit]
- Bell, B.; Hersbach, H.; Simmons, A.; Berrisford, P.; Dahlgren, P.; Horányi, A.; Muñoz-Sabater, J.; Nicolas, J.; Radu, R.; Schepers, D.; et al. The ERA5 Global Reanalysis: Preliminary Extension to 1950. Q. J. R. Meteorol. Soc. 2021, 147, 4186–4227. [Google Scholar] [CrossRef] [Scilit]
- Gleixner, S.; Demissie, T.; Diro, G.T. Did ERA5 Improve Temperature and Precipitation Reanalysis over East Africa? Atmosphere 2020, 11, 996. [Google Scholar] [CrossRef] [Scilit]
- Hu, W.; Scholz, Y.; Yeligeti, M.; Bremen, L.V.; Deng, Y. Downscaling ERA5 Wind Speed Data: A Machine Learning Approach Considering Topographic Influences. Environ. Res. Lett. 2023, 18, 094007. [Google Scholar] [CrossRef] [Scilit]
- Manolache, A.I.; Chirosca, A.-M.; Rusu, L. Assessment of Wind and Wave Climate Dynamics in the Mediterranean and Black Seas for Renewable Energy Potential Analysis. In Trends in Clean Energy Research: Selected Papers from the 9th International Conference on Advances on Clean Energy Research (ICACER 2024); Chen, L., Ed.; Springer Nature: Cham, Switzerland, 2024; pp. 83–90. [Google Scholar]
- Jarraud, M. Guide to Meteorological Instruments and Methods of Observation (WMO-No. 8); World Meteorological Organisation: Geneva, Switzerland, 2008; p. 29. [Google Scholar]
- Vázquez, A.; Izquierdo, U.; Enevoldsen, P.; Andersen, F.-H.; Blanco, J.M. A Macroscale Optimal Substructure Selection for Europe’s Offshore Wind Farms. Sustain. Energy Technol. Assess. 2022, 53, 102768. [Google Scholar] [CrossRef] [Scilit]
- Kim, Y.; Lim, J.S.; Kim, H.J.; Choi, S.-W. A Comprehensive Review of Foundation Designs for Fixed Offshore Wind Turbines. Int. J. Nav. Archit. Ocean Eng. 2025, 17, 100643. [Google Scholar] [CrossRef] [Scilit]
- Diaconita, A.I.; Andrei, G.; Rusu, L. An Overview of the Offshore Wind Energy Potential for Twelve Significant Geographical Locations across the Globe. Energy Rep. 2022, 8, 194–201. [Google Scholar] [CrossRef] [Scilit]
- Onea, F.; Diaconita, A.; Ganea, D. Assessment of the Black Sea High-Altitude Wind Energy. J. Mar. Sci. Eng. 2022, 10, 1463. [Google Scholar] [CrossRef] [Scilit]
- Offshore Wind Outlook 2019—Analysis. Available online: https://www.iea.org/reports/offshore-wind-outlook-2019 (accessed on 27 November 2025).
- Kumar, R.; Stallard, T.; Stansby, P.K. Large-Scale Offshore Wind Energy Installation in Northwest India: Assessment of Wind Resource Using Weather Research and Forecasting and Levelized Cost of Energy. Wind Energy 2021, 24, 174–192. [Google Scholar] [CrossRef] [Scilit]
- Manolache, M.; Manolache, A.I.; Andrei, G. Floating Solar Energy Systems: A Review of Economic Feasibility and Cross-Sector Integration with Marine Renewable Energy, Aquaculture and Hydrogen. J. Mar. Sci. Eng. 2025, 13, 1404. [Google Scholar] [CrossRef] [Scilit]
- Johnston, B.; Foley, A.; Doran, J.; Littler, T. Levelised Cost of Energy, A Challenge for Offshore Wind. Renew. Energy 2020, 160, 876–885. [Google Scholar] [CrossRef] [Scilit]
- He, Q.; Chen, H.; Lin, Z.; Dai, X.; Huang, Y.; Cai, W. A Cost-Based Life-Cycle Pricing Model for Offshore Wind Power Plants within China’s Carbon Trading Scheme. Energy Rep. 2022, 8, 147–155. [Google Scholar] [CrossRef] [Scilit]
- Wind Farm Costs—Guide to an Offshore Wind Farm. Available online: https://guidetoanoffshorewindfarm.com/wind-farm-costs (accessed on 28 August 2023).
- Wind Turbine Cost—The Economics of Wind Energy in 2023. Available online: https://weatherguardwind.com/wind-turbine-cost-and-roi-considerations-in-2023/ (accessed on 16 October 2025).
- Cali, U.; Erdogan, N.; Kucuksari, S.; Argin, M. Techno-Economic Analysis of High Potential Offshore Wind Farm Locations in Turkey. Energy Strategy Rev. 2018, 22, 325–336. [Google Scholar] [CrossRef] [Scilit]
- Bjerkseter, C.; Ågotnes, A. Levelised Costs of Energy for Offshore Floating Wind Turbine Concepts. Master’s Thesis, Norwegian University of Life Sciences, Ås, Norway, 2013. [Google Scholar]
- Wang, T.; Jin, H.; Wu, X. Coupled Dynamic Analysis of a Tension Leg Platform Floating Offshore Wind Turbine. J. Offshore Mech. Arct. Eng. 2019, 142, 011901. [Google Scholar] [CrossRef] [Scilit]
- Martinez, A.; Iglesias, G. Mapping of the Levelised Cost of Energy for Floating Offshore Wind in the European Atlantic. Renew. Sustain. Energy Rev. 2022, 154, 111889. [Google Scholar] [CrossRef] [Scilit]
- Díaz, H.; Guedes Soares, C. Cost and Financial Evaluation Model for the Design of Floating Offshore Wind Farms. Ocean Eng. 2023, 287, 115841. [Google Scholar] [CrossRef] [Scilit]
- Cavazzi, S.; Dutton, A.G. An Offshore Wind Energy Geographic Information System (OWE-GIS) for Assessment of the UK’s Offshore Wind Energy Potential. Renew. Energy 2016, 87, 212–228. [Google Scholar] [CrossRef] [Scilit]
- Kerkvliet, H. Offshore Wind Farm Decommissioning: Introducing a Multi-Criteria Decision Aid Approach. Master’s Thesis, Uppsala University, Uppsala, Sweden, 2015. [Google Scholar]
- Kikuchi, Y.; Ishihara, T. Upscaling and Levelized Cost of Energy for Offshore Wind Turbines Supported by Semi-Submersible Floating Platforms. J. Phys. Conf. Ser. 2019, 1356, 012033. [Google Scholar] [CrossRef] [Scilit]
- Geyer, B.; Weisse, R.; Bisling, P.; Winterfeldt, J. Climatology of North Sea Wind Energy Derived from a Model Hindcast for 1958–2012. J. Wind Eng. Ind. Aerodyn. 2015, 147, 18–29. [Google Scholar] [CrossRef] [Scilit]
- Hasager, C.B.; Hahmann, A.N.; Ahsbahs, T.; Karagali, I.; Sile, T.; Badger, M.; Mann, J. Europe’s Offshore Winds Assessed with Synthetic Aperture Radar, ASCAT and WRF. Wind Energy Sci. 2020, 5, 375–390. [Google Scholar] [CrossRef] [Scilit]
- Vilajuana Llorente, S.; Rapha, J.I.; Domínguez-García, J.L. Development and Analysis of a Global Floating Wind Levelised Cost of Energy Map. Clean. Technol. 2024, 6, 1142–1168. [Google Scholar] [CrossRef] [Scilit]
- Liang, Y.; Ma, Y.; Wang, H.; Mesbahi, A.; Jeong, B.; Zhou, P. Levelised Cost of Energy Analysis for Offshore Wind Farms—A Case Study of the New York State Development. Ocean Eng. 2021, 239, 109923. [Google Scholar] [CrossRef] [Scilit]
- Barthelmie, R.J.; Frandsen, S.T.; Nielsen, M.N.; Pryor, S.C.; Rethore, P.-E.; Jørgensen, H.E. Modelling and Measurements of Power Losses and Turbulence Intensity in Wind Turbine Wakes at Middelgrunden Offshore Wind Farm. Wind Energy 2007, 10, 517–528. [Google Scholar] [CrossRef] [Scilit]
- Zhang, X.; Li, T.; Yang, Q.; Zhou, X.; Benini, E. A Novel Non-Dimensional Multiple Operating Conditions Physics-Informed Neural Networks for Wind Turbine Wake and Power Prediction in Complex Terrains. Energy 2026, 358, 141301. [Google Scholar] [CrossRef] [Scilit]
- Barthelmie, R.J.; Larsen, G.C.; Pryor, S.C. Modeling Annual Electricity Production and Levelized Cost of Energy from the US East Coast Offshore Wind Energy Lease Areas. Energies 2023, 16, 4550. [Google Scholar] [CrossRef] [Scilit]
- Pryor, S.C.; Barthelmie, R.J. Power Production, Inter- and Intra-Array Wake Losses from the U.S. East Coast Offshore Wind Energy Lease Areas. Energies 2024, 17, 1063. [Google Scholar] [CrossRef] [Scilit]
- Pryor, S.C.; Barthelmie, R.J. Wind Shadows Impact Planning of Large Offshore Wind Farms. Appl. Energy 2024, 359, 122755. [Google Scholar] [CrossRef] [Scilit]

Disclaimer/Publisher’s Note: The statements, opinions and data contained in all publications are solely those of the individual author(s) and contributor(s) and not of MDPI and/or the editor(s). MDPI and/or the editor(s) disclaim responsibility for any injury to people or property resulting from any ideas, methods, instructions or products referred to in the content. |
© 2026 by the authors. Licensee MDPI, Basel, Switzerland. This article is an open access article distributed under the terms and conditions of the Creative Commons Attribution (CC BY) license.