


Abstract
In the pursuit of sustainable development, it is crucial to examine whether technological innovation (TI) creates equitable economic distribution or widens income inequality (II). The study aims to investigate TI’s impact on II in BRICS-T and BRICS PLUS-T countries within the context of the technological Kuznets curve (TKC). Along with TI, financial development is a driving force for economic development, and the research explores FD’s influence on II. To analyze these relationships while accounting for globalization (G), the method of moments quantile regression (MMQR) is used. The study’s findings validate the U-shaped TKC, suggesting that TI, in the initial stage, reduces II. However, beyond a certain threshold, TI2 significantly widens II in both country groups. We found that the impact of TI on II was more pronounced in BRICS-T countries than in BRICS-PLUS-T countries, and the inclusion of newly added countries did not significantly affect the U-shaped relationship. Additionally, by enhancing financial inclusion, FD had a substantial and negative effect on II. In contrast, G, which concentrates wealth, was associated with higher II in both groups. This study offers a significant contribution by introducing the TKC in the context of BRICS-T and BRICS PLUS-T countries. Furthermore, the research contributes to the literature by evaluating the influence of FD and G within the context of TKC and applying novel MMQR. The study highlights a pathway to achieving the Sustainable Development Goals (SDGs 1, 7, and 10) and provides a policy framework for strategically allocating funds to technological advancements to reduce II.
1. Introduction
Technology has become an inseparable part of daily life and work in today’s information age. Technological innovation (TI) is a crucial driver of the global economy, enhancing productivity and efficiency. While TI disrupts traditional economic structures, it simultaneously creates new markets and consumers, transforms industrial production, and reshapes overall economic activities [1]. Despite being the backbone of economic development, it may inadvertently favor the wealthy and contribute to income inequality (II) by enabling skill-biased job creation [2]. This raises a crucial dilemma regarding the extent to which TI promotes economic equity. Consequently, this study aims to explore how TI impacts II in BRICS-T and BRICS PLUS-T countries.
II reveals the uneven distribution of income and the disparity between lower- and upper-income groups in society [3]. The United Nations emphasizes that II is closely linked to uncertainty, which further exacerbates vulnerability, insecurity, and distrust in government, ultimately increasing social discord and potentially leading to chaos and violence [4]. To address these challenges, the UN introduced the Sustainable Development Goals (SDGs) in 2015, with SDG 10 specifically targeting the reduction in inequality by 2030. TI plays an important role in advancing SDG 10 through its potential to reduce II [5,6]. Similarly, TI, which improves efficiency and productivity, decreases poverty levels [7,8]. It shows a pathway to achieving SDG 1 (ending poverty) and SDG 10 (reducing II). In addition, TI, with sustained economic growth and quality education, helps achieve clean and affordable energy [9]. In this context, TI promotes SDG 7 for the equal right to clean energy [10,11].
The BRICS PLUS-T countries face significant challenges with II, which continues to rise. These countries exhibit higher levels of inequality compared to those in the Organization for Economic Co-operation and Development (OECD) [12]. Among them, South Africa has the highest II globally, with a Gini coefficient of 63 in 2025 [13]. Similarly, Brazil, Russia, India, and China also experience substantial inequality, with Gini coefficients of 52, 35.1, 32.8, and 35.7, respectively [14]. Given the complex economic dynamics of BRICS PLUS-T countries, this study aims to address several key questions: Does the technological Kuznets curve (TKC) hold in BRICS-T and BRICS PLUS-T countries? How does TI influence II in these country groups? Additionally, the study examines whether TI creates any differences between BRICS-T and BRICS PLUS-T countries. Has the inclusion of newly added countries to BRICS-T significantly affected the technological Kuznets curve? Finally, it investigates how financial development (FD) reshapes II.
Over the years, BRICS countries have undergone expansion and redefinition. Initially established as BRIC in Russia in 2009, the group was later renamed BRICS when South Africa joined in 2010 [15]. A decade later, in 2024, Egypt, Ethiopia, Iran, Indonesia, and the United Arab Emirates further expanded BRICS to BRICS PLUS countries [16]. The BRICS PLUS countries now account for approximately 45% of the global population and contribute 37.3% of global GDP. They also control 30% of the world’s oil reserves [17]. The BRICS PLUS-T countries, which include Türkiye alongside the BRICS PLUS nations, now surpass the G7 countries in their contribution to the global economy [18].
The empirical evidence indicates that TI significantly reduces II at lower and medium quantiles of inequality within BRICS-T and BRICS PLUS-T countries. However, at higher levels of II, TI does not appear to have a meaningful impact. Contrarily, the exponential growth of TI worsens inequality across all quantiles in both country groups, except the highest (Q8 and Q9), rather than reducing it. These findings highlight that while the early stages of TI promote economies by creating jobs and increasing productivity, technology-driven growth intensifies inequality by favoring capital- and skill-intensive sectors. The results identify a U-shaped relationship between TI and II. Furthermore, financial development (FD) plays a critical role in mitigating II across country groups.
This study makes several significant contributions to the literature. First, it explores TKC, a topic that has rarely been studied, and is among the first to investigate it. Second, the scope of our analysis extends beyond the BRICS countries to include the expanded BRICS PLUS-T countries, providing a more comprehensive understanding of this relationship in a significant portion of the global economy. It also investigates the impact of newly joined countries on BRICS-T. Additionally, the study employs an advanced econometric technique, moments quantile regression (MMQR), to examine this relationship. This method provides efficient, unbiased results that surpass the limitations of traditional econometric approaches. The MMQR has advantages over conventional econometric techniques for addressing the distributional heterogeneity of the dependent variable [19]. Additionally, the MMQR method can analyze the asymmetric effects of independent variables on dependent variables, overcoming cross-sectional dependence and dynamic issues to provide accurate policy guidelines [20].
The following sections cover the literature review, data and methods, results analysis, and the robustness of the results.
Theoretical Background
Technological innovation (TI) fundamentally transforms industrial production by replacing traditional methods and introducing new processes. While TI generates new employment opportunities, it simultaneously displaces conventional jobs, embodying the concept of creative destruction [21]. In the short-term, this structural change often results in unemployment within older sectors, even as it fosters job creation in emerging industries [22]. Building on this, the foundation for the skill-biased technological change hypothesis was laid, emphasizing the complementarity of TI with skilled labor [23,24]. This dynamic increases the demand for skilled workers who command higher wages, thereby exacerbating II.
Unlike the traditional Kuznets hypothesis, which predicts an inverted-U relationship between economic growth and II, the TKC focuses on the distributional consequences of TI. In the early stages of TI, innovation may reduce inequality by increasing productivity, lowering production costs, expanding access to information, and creating new employment opportunities. However, as TI advances, innovation increasingly favors skilled labor and capital-intensive production processes. Consequently, the benefits of technological change become concentrated among highly skilled workers, technology-intensive firms, and regions with superior innovation capacity, resulting in rising II. This theoretical mechanism provides the basis for expecting a U-shaped relationship between TI and II.
It is further argued that TI disproportionately benefits high-skilled workers relative to low-skilled workers [25]. However, this pattern is more pronounced in developed countries where TI adoption has surpassed a critical threshold. In contrast, for emerging economies, TI offers new opportunities for low-cost labor, facilitating a shift in production from developed to developing countries and promoting economic inclusion. Additionally, TI expands access to information and financial services, enabling digital technologies to overcome economic barriers faced by disadvantaged populations [26]. The relationship between TI and II is thus contingent on three factors: access to information and technology, labor market transformation, and financial inclusion.
FD may influence II through several channels. Expanded access to credit enables lower-income households and small enterprises to invest in education, entrepreneurship, and productive activities. Improved savings opportunities facilitate wealth accumulation and financial resilience, while deeper financial markets contribute to more efficient capital allocation and employment creation. Nevertheless, the strength of these channels may differ across countries depending on institutional quality, financial inclusion, and the accessibility of financial services.
The notion that labor-intensive TI can reduce II by creating jobs and fostering local development, operating as a bottom-up process that fosters learning and skill development, was introduced [27]. When TI is endogenous, its practical implementation requires investments in education and training, which improve labor productivity and efficiency, ultimately reducing II. However, as TI surpasses a certain threshold, the focus shifts from labor-intensive to capital-intensive technologies, leading to increased II by disproportionately benefiting high-skilled workers while displacing low-skilled labor [28].
The distributional effects of TI, FD, and G are also expected to vary across BRICS-T and BRICS PLUS-T countries due to differences in economic structures, institutional capacities, labor market compositions, and innovation systems. BRICS-T economies generally show higher levels of industrialization and domestic innovation, while several BRICS PLUS-T economies rely more on technology adoption and labor-intensive production structures. Similarly, differences in social protection systems, labor market institutions, and integration into global value chains may influence how G and FD affect II across the two groups. These structural differences provide a theoretical basis for expecting heterogeneous effects across country groups.
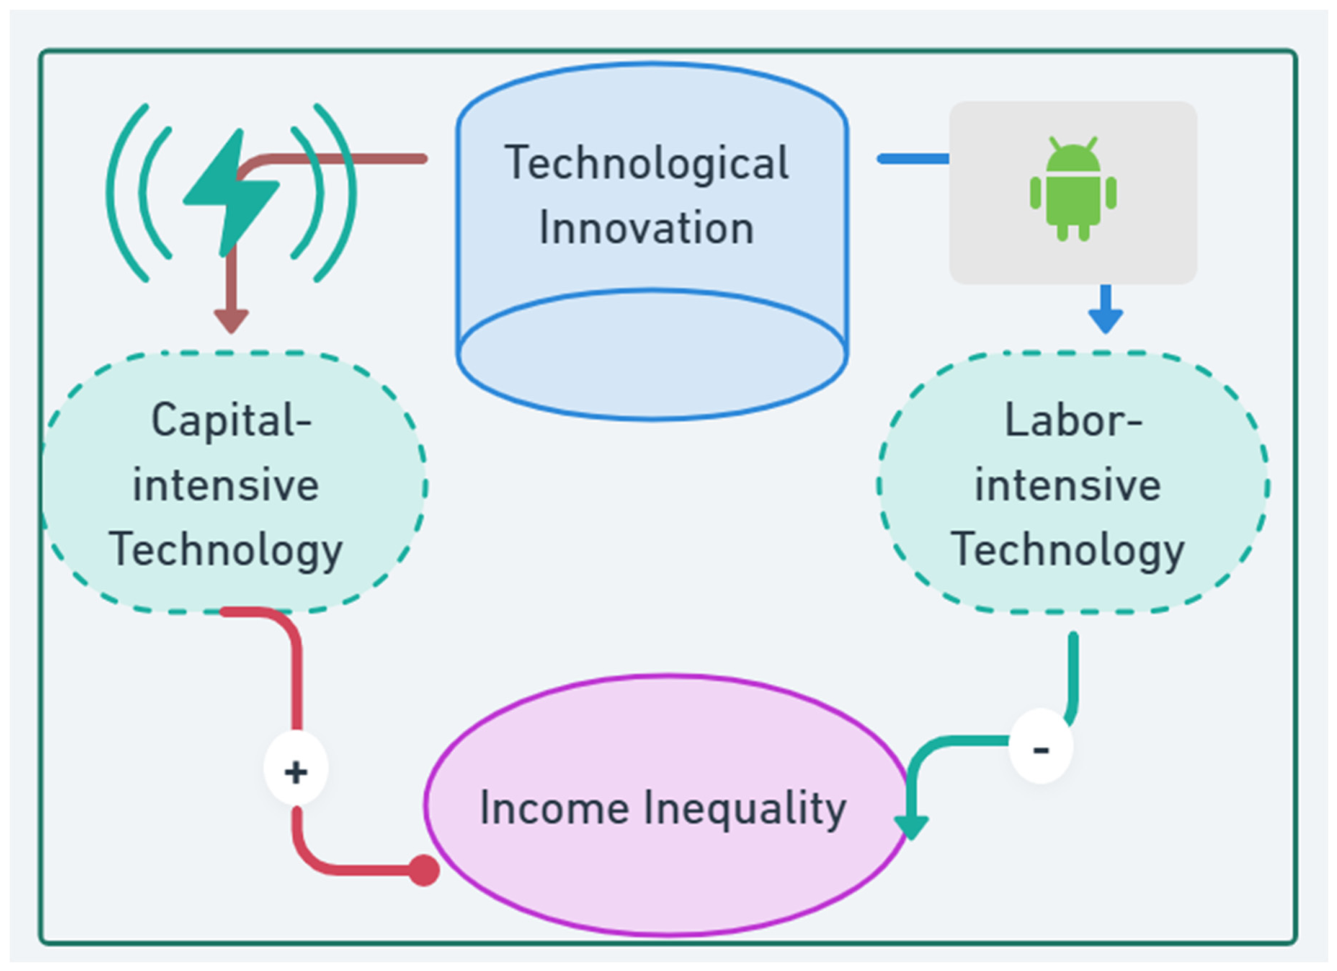
The findings of this study align with these theoretical frameworks. Initially, TI reduces II, but its later-stage growth widens the inequality gap, consistent with the U-shaped Kuznets curve. The theoretical linkages between TI and II have been further supported. While some explored the interplay among II, human capital, and innovation [24], others demonstrated that TI can enhance workers’ wages and productivity, potentially reducing inequality [29]. The impact of unexpected technical improvements on II in a competitive, overlapping-generations economy was also examined, and it was concluded that technological improvements indirectly affect income distribution by altering the factor price ratio, even if those improvements are predicted [30]. From a different perspective, the relationship among inequality, the labor market, and TI was also examined, emphasizing TI’s effects on the labor market and wage and income distributions [31]. He concluded that technical change will immediately benefit skilled workers, depress returns to schooling, and raise within-group inequality; however, it will eventually increase both returns to schooling and within-group inequality. Figure 1 depicts the conceptual framework.
Figure 1.
Conceptual framework, Source: Authors.
2. Literature Review
The existing literature has extensively explored the nexus among financial development, economic growth, and II; however, comparatively few studies have explicitly focused on the technological Kuznets curve and its relationship with II. TI was emphasized as the principal driver of economic growth [32,33]. Concurrently, the impact of innovation on II has gained increasing scholarly attention [34,35,36].
Empirical evidence suggests that TI can generate income and alleviate poverty, thereby reducing II [37]. Digitalization facilitates greater access to information and enhances cost efficiency, positioning TI as a vital component of economic progress [38]. Moreover, TI-driven labor productivity improvements reduce income disparities [39]. TI also promotes welfare improvements in rural areas by expanding market access, increasing bargaining power, raising incomes, and collectively reducing poverty and II [40]. For instance, one study, employing panel quantile regression, confirmed that TI growth diminished II across 39 countries [34]. Similarly, in Mexico, expanded Internet access has been shown to reduce II in both rural and urban contexts [41], while another study documented poverty reduction through information technology across 46 African countries [42]. Furthermore, digitalization significantly decreased II in 97 countries, with particularly pronounced effects in lower-middle-income and low-income nations [43]. A parallel outcome was observed in Indonesia, where investments in TI have contributed to inequality reduction [37].
Conversely, a body of literature reports a positive association between TI and II. One study analyzing 109 countries found that information and communication technologies (ICT) have increased income disparities, as evidenced by significant increases in the Gini coefficient [44]. This positive correlation is further supported, and it is argued that TI exacerbates II [36,45,46]. The impact of TI on II depends on the type and application of technology, as suggested in a nuanced perspective [47]. For example, communication equipment may initially reduce II by boosting productivity, but it tends to widen disparities over time.
The BRICS countries were studied using panel data analysis, and it was found that GDP per capita and TI positively correlated with II. Still, financial development is associated with decreased II [48]. After examining the relationships among G, TI, and II across most countries, one study found that TI had a greater impact on inequality than globalization [49]. Technology significantly increases inequality, and financial globalization is strongly associated with II. One of their findings is that G and TI increase returns to human capital and help address rising inequality.
In Turkey, while economic growth has fostered more equitable resource distribution and reduced inequality, TI from 1987 to 2018 was positively associated with II, as evidenced by the VECM, Granger causality, DOLS, CCR, and FMOLS methods [50]. A similar methodological approach applied to China confirmed the validity of an inverted-U-shaped technological Kuznets curve, indicating that rising TI has widened the rural–urban income gap [51]. The impact of TI on income distribution was assessed using interquartile regression techniques on quarterly data for BRICS-T countries from 1992 to 2019. The results show that TI positively affects II [52]. However, the distribution of TI negatively affects the distribution of II, and TI’s effects on income distribution are uneven. However, when moderated by financial development, ICT has contributed to mitigating income disparities [53]. Additionally, for high-income and higher-middle-income countries, TI has been associated with long-term reductions in II [54].
The OECD data were used, and the relationship between TI and the Gini index was examined [55]. The findings show that the Kuznets curve will continue to rise and fall as technology progresses; each technological invention increases the II. However, as that technology spreads across the economy, the II declines. On the other hand, financial inclusion, technology, and II were investigated using generalized method of moments (GMM) regression models for European countries, and the findings indicated that fintech adoption and financial inclusion strongly reduced II [56]. Furthermore, the quantile regression was used, and it was found that TI increases II in most quantiles. However, the FMOLS and DOLS techniques indicate that TI reduces II over time in high-income and lower-middle-income countries. Government spending reduces II at all percentiles [54].
Apart from TI, factors such as human capital, population dynamics, migration, institutional quality, social welfare, access to education, and credit systems significantly influence II [57,58]. Multiple studies have investigated the causal links between TI and II in diverse contexts, including developing countries, OECD nations, the United States, and 29 countries [2,34,59,60]. However, prior research has not adequately addressed the BRICS-PLUS-T countries—a gap this study aims to fill.
Previous studies have not reached a consensus on the effect of TI on II. Some studies suggest that TI generally contributes to higher inequality through skill-biased technological change [49]. However, this evidence does not necessarily contradict the TKC framework. While average effects may indicate an inequality-enhancing role of technology, the impact of innovation may vary across stages of TI and levels of II. Consequently, TI may initially reduce inequality before generating inequality-increasing effects once a certain threshold of TI is reached.
Within the environmental Kuznets curve (EKC) framework, this study empirically examines the relationship between TI and II in BRICS-T and BRICS-PLUS-T countries from 1990 to 2021. This research makes a unique contribution by being the first, to the best of our knowledge, to test the technological Kuznets curve hypothesis within these groups and to confirm the validity of a U-shaped Kuznets curve. Moreover, it analyzes the impact of TI across the full distribution of II using the MMQR. The study advances the critical literature by focusing on BRICS-PLUS-T countries and offers valuable policy implications for these emerging economies.
3. Data
This study employed annual data from 1990 to 2021 to empirically analyze the effects of globalization (G), financial development (FD), and technological innovation (TI) on income inequality (II). The study period ended in 2021 because consistent and complete data for all variables and countries were not available in subsequent years. Restricting the sample to 1990–2021 ensured a balanced panel and maintained cross-country comparability. The BRICS-T group comprises Brazil, Russia, India, China, South Africa, and Turkey, while the BRICS PLUS-T group adds Egypt, Ethiopia, Indonesia, Iran, and the United Arab Emirates. A detailed summary of the variables employed in the analysis, including their definitions, abbreviations, sources, and time coverage, is provided in Table 1.
Table 1.
Data definition and sources.
The dependent variable in the study was income inequality (II), measured using the standardized Gini index obtained from the Standardized World Income Inequality Database (SWIID). This dataset is widely used in inequality research due to its harmonized methodology and broad country coverage. Technological innovation (TI) is proxied by the number of patent applications filed by residents. Patent applications were selected because they provide a consistent and internationally comparable measure of innovation output across all BRICS-T and BRICS PLUS-T countries over the entire sample period, thereby facilitating cross-country analysis despite differences in national innovation systems. This indicator reflects a country’s level of domestic innovation and technological capability. Data for this variable were sourced from the World Bank. Financial development (FD) was captured by the Financial Development Index published by the International Monetary Fund (IMF). This index comprehensively reflects financial institutions’ depth, access, and efficiency, which may influence inequality through credit allocation, capital formation, and savings behavior. Globalization (G) is based on a composite index (such as the KOF Globalization Index) and is included to capture the effects of global economic integration on income distribution. All variables were transformed as appropriate (e.g., logarithmic transformations or standardizations) before empirical estimation to reduce skewness.
Table 2 presents the descriptive statistics for key variables across BRICS-T countries. The mean values of the variables II, TI, TI2, and G were positive. In contrast, the variable FD exhibited a negative mean. In terms of dispersion, TI2 had the highest standard deviation (4.085), indicating considerable variability and greater volatility across BRICS-T countries. Conversely, the variable G displayed the lowest standard deviation (0.193), suggesting a more consistent pattern. When examining skewness, TI and TI2 were positively skewed, suggesting a right-tailed distribution in which a few countries exhibit much higher values. Meanwhile, FD and G exhibited negative skewness, with G showing a highly left-skewed distribution (−1.222), indicating a concentration of values below the mean.
Table 2.
Descriptive statistics of BRICS-T.
The kurtosis values revealed that most variables had distributions with heavier tails than the normal distribution. In particular, G had the highest kurtosis (3.772), suggesting a distribution with a tendency toward extreme values. II, with a kurtosis close to 3, aligned more closely with the properties of a normal distribution. These characteristics were further confirmed by the Jarque–Bera test results, which rejected the null hypothesis of normality for all variables except II. The most extreme deviation was observed in G, with a p-value of 0.0000, strongly indicating non-normality. Overall, these findings highlight significant differences in the behavior of economic indicators across BRICS-T countries. Variables such as TI2 and G exhibit strong deviations from normality and are highly sensitive to outliers.
Table 3 summarizes the descriptive statistics of five economic indicators for BRICS PLUS-T countries. As with the key variables across the BRICS-T countries in Table 2, the mean values of variables II, TI, TI2, and G were positive. However, the variable FD revealed a negative mean. Regarding dispersion, TI2 had the highest standard deviation (5.578), indicating considerable variability across countries. This variability may point to technological disparities among BRICS PLUS-T nations. In contrast, II and G exhibited the lowest standard deviations, suggesting more stable and consistent behavior.
Table 3.
Descriptive statistics of BRICS PLUS-T.
As for skewness, II was positively skewed, indicating a longer right tail and a few high values. Meanwhile, FD and G were negatively skewed, particularly G, with a skewness of −1.247, indicating a heavy left tail and a higher concentration of values below the mean. Kurtosis values indicate that all variables were leptokurtic (kurtosis > 3), suggesting distributions with fat tails and potential for outliers. This is especially true for G, which had a kurtosis of 4.015 and an extremely high Jarque–Bera statistic (96.65), strongly rejecting the null hypothesis of normality. FD also denotes substantial deviation from normality, with a Jarque–Bera value of 41.87. The results of the Jarque–Bera test confirm that all variables, except II, significantly deviated from normality. Overall, these findings suggest that the economic indicators for BRICS PLUS-T countries exhibit non-normal distributions and outliers. The assumption of normality was violated for all variables. Therefore, MMQR is more appropriate for capturing the underlying distributional characteristics and mitigating the influence of outliers for BRICS-T and BRICS PLUS-T economies.
4. Methodology
The research investigated the impact of the technological Kuznets curve (TKC) and financial development (FD) on income inequality (II) in BRICS-T and BRICS PLUS-T countries. The pioneering studies laid the foundation for TKC and II [5,64,65]. The study expands the idea of TKC, FD, G, and II in these country groups from the perspective of panel data [66] as:
In our model, i and t respectively denote the BRICS PLUS-T economies and the years. β0, β1, β2, β3, β4, and uit indicate the constant, coefficients of II, TI, TI2, G, and disturbance term, respectively. To identify the threshold level of TI at which its effect on II changes sign, the turning point (TP) of the quadratic specification was computed as TP = −β1/(2β2), where β1 and β2 represent the coefficients of the linear and squared TI terms, respectively [23]. A negative coefficient on TI, combined with a positive coefficient on TI2, indicates a U-shaped relationship consistent with the TKC hypothesis.
4.1. Pre-Estimation Techniques:
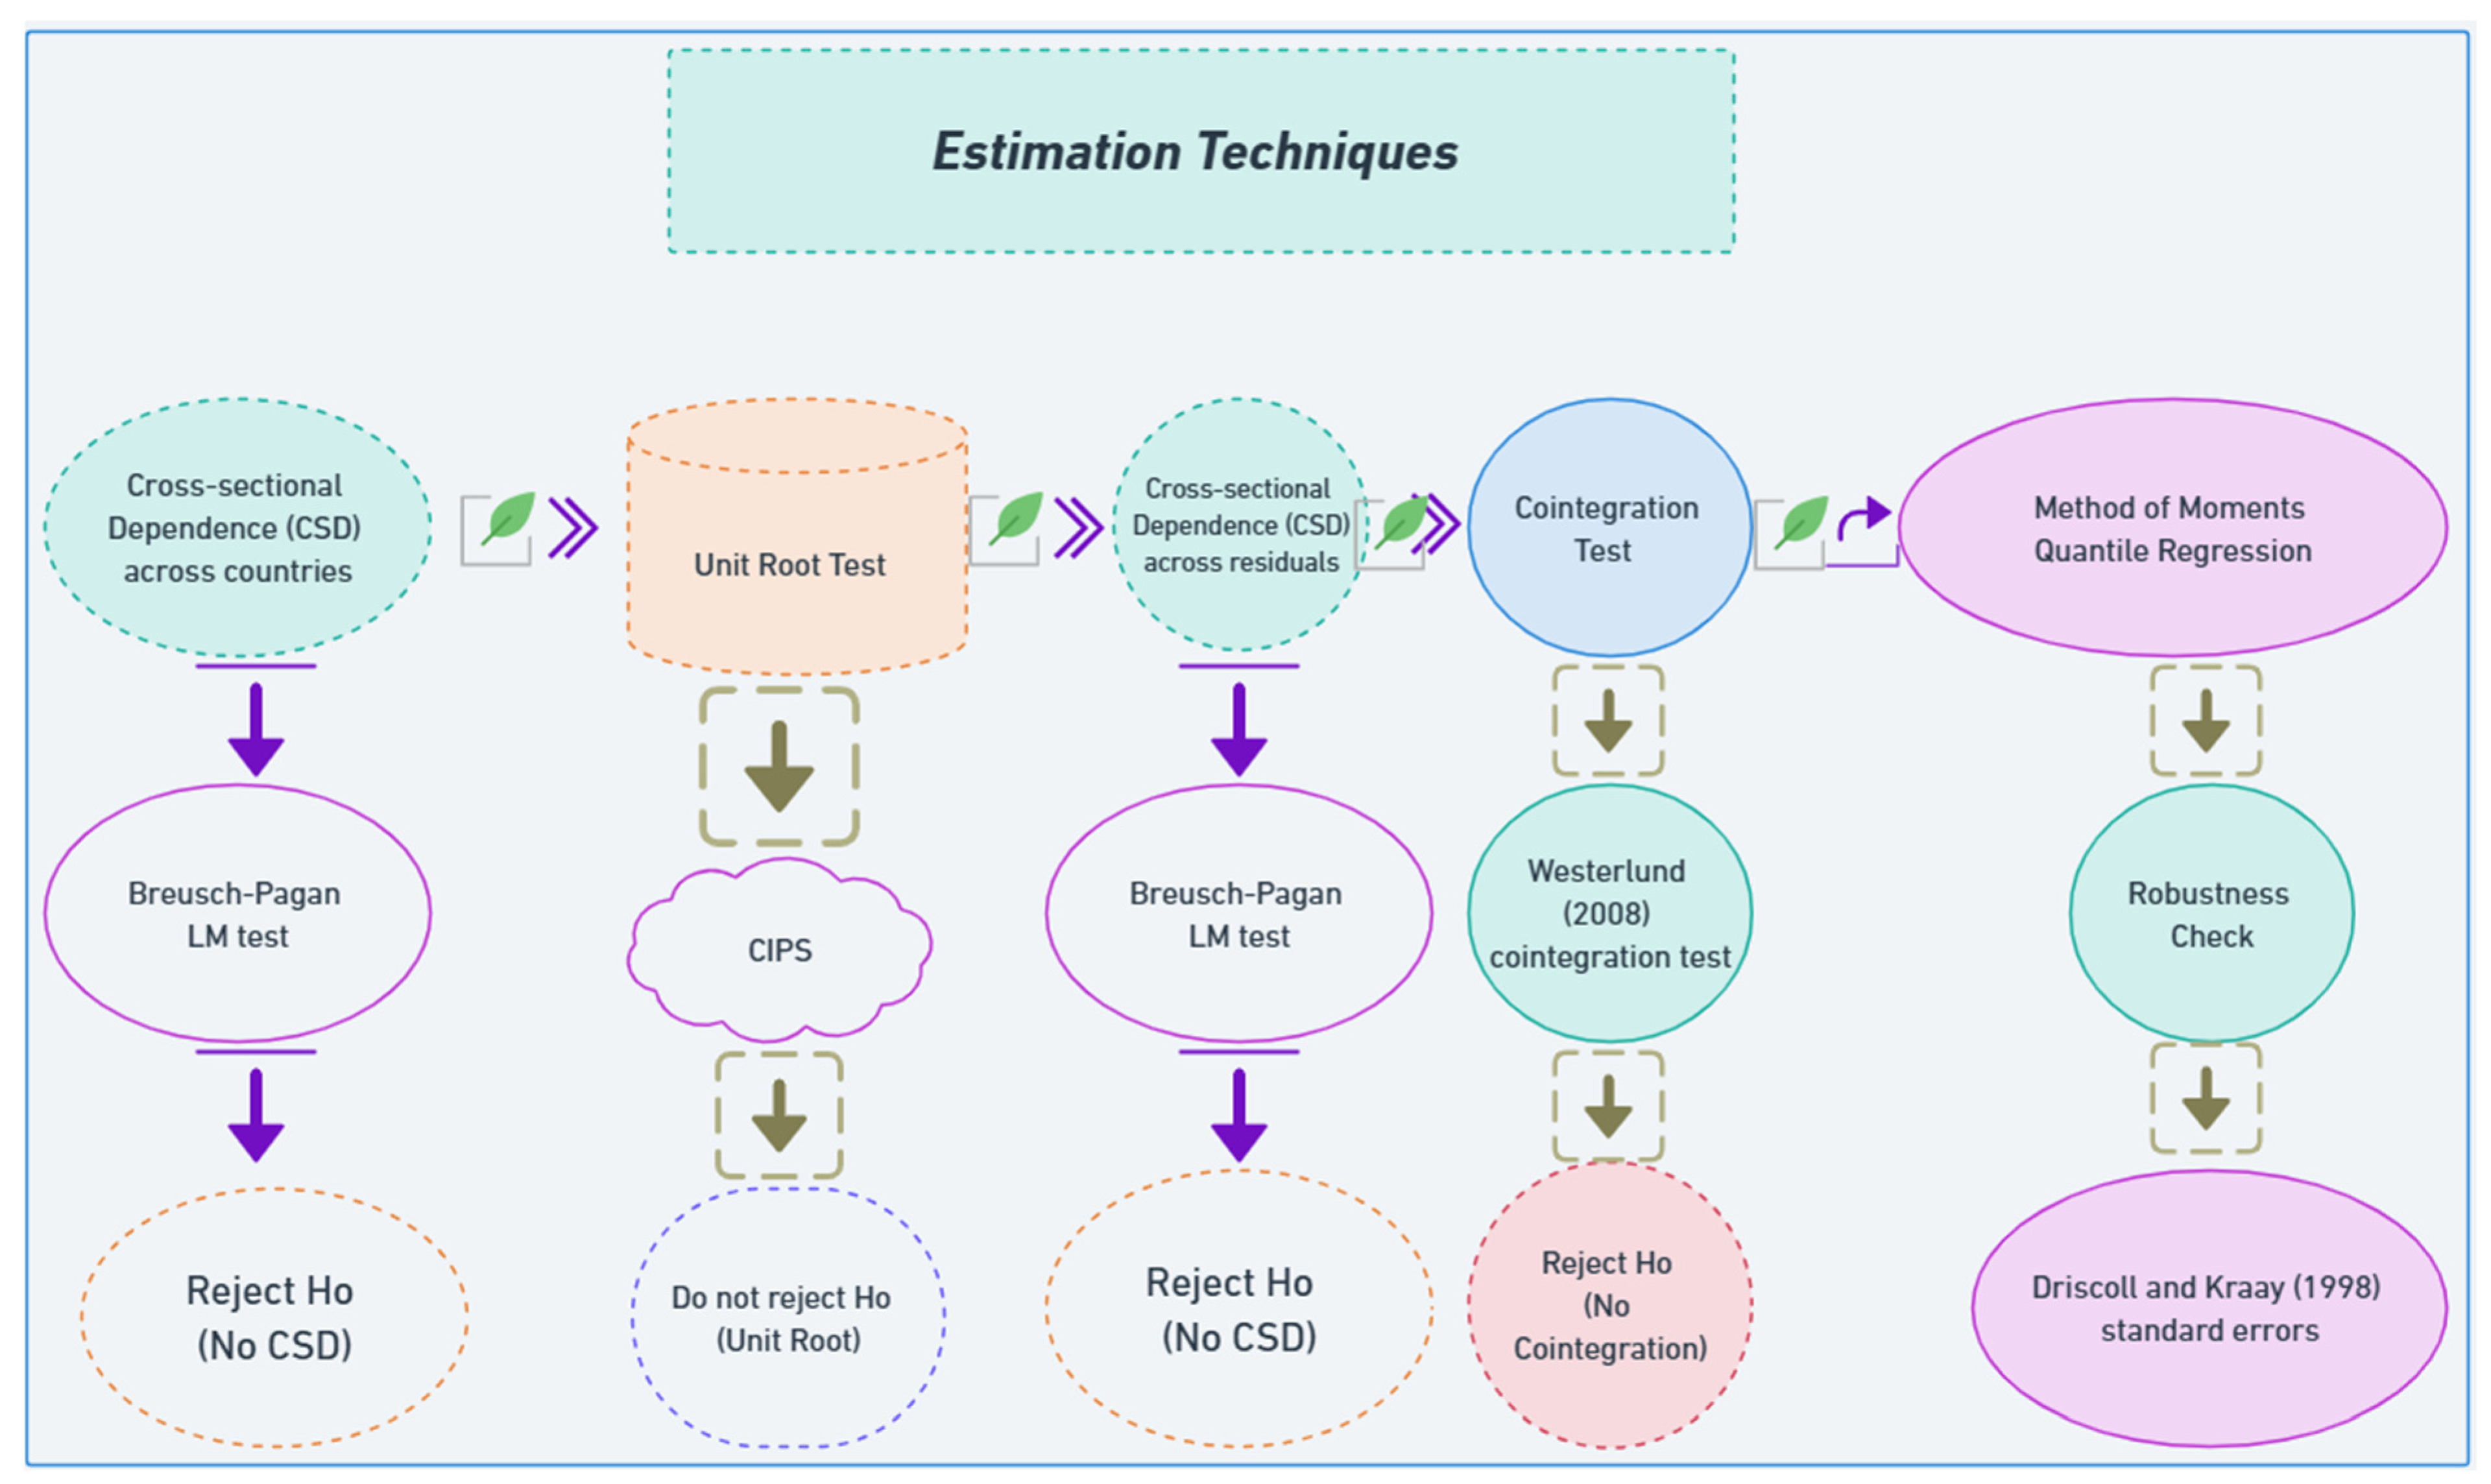
This study examines cross-sectional dependence (CSD) among BRICS-T and BRICS PLUS-T countries, motivated by the increasing interconnectedness driven by international trade and technological diffusion. To assess CSD, the Breusch–Pagan LM test was employed, and the results strongly reject the null hypothesis of cross-sectional independence, confirming significant interdependencies across countries [67]. In response to this finding, second-generation unit root tests were applied to account for CSD in the stationarity analysis, specifically the cross-sectionally augmented Im–Pesaran–Shin (CIPS) test [68], which offers robust insights under cross-sectional dependence.
Having checked the unit root, we examined the cross-sectional dependence in the residuals to determine the appropriate panel cointegration technique. For this purpose, the Breusch–Pagan LM [67] test for residuals was used, given the large T in the data, with the null hypothesis of no cross-section dependence in the residuals. Subsequently, the Westerlund panel cointegration test, which allows for cross-sectional dependence in the residuals under the null hypothesis of no cointegration, was used to evaluate the long-run relationships among II, TI, TI2, FD, and G in BRICS-T and BRICS PLUS-T countries [69]. The outcomes of these diagnostic tests justify applying the MMQR to assess the validity of the technological Kuznets curve across various quantiles. The MMQR framework addresses distributional heterogeneity and provides unbiased results against non-normal error structures, making it a methodologically sound choice for this empirical analysis. Although the MMQR framework provides robust estimates of heterogeneous effects across the conditional distribution of II, it is not primarily designed as a causal identification strategy [19]. Therefore, the estimated relationships should be interpreted as conditional associations rather than strict causal effects. In particular, potential reverse causality between TI and II, as well as omitted variable bias arising from unobserved country-specific factors, cannot be fully ruled out. The estimation strategy is illustrated in Figure 2.
Figure 2.
Estimation techniques (It’s related to Westerlund (2008) [69] Cointegration Test; Driscoll and Kraay (1998) [70]). Source: Authors.
4.2. Method of Moments Quantile Regression
The Jarque–Bera test in the descriptive statistics identifies that the data are not normally distributed. In such cases, traditional estimation techniques may fail to produce unbiased and efficient results. To address this limitation, the moments quantile regression (MMQR) method, which estimates data based on distributional location [71], offers advantages over traditional methods [72]. The MMQR estimates regression parameters by distributing the conditional mean across quantiles [19]. This approach effectively captures issues related to skewness and kurtosis in panel datasets. Furthermore, MMQR mitigates the incidental parameter problem by incorporating individual effects across the entire distribution. This study employed nine quantiles to address heterogeneity across the panel: Q1, Q2, and Q3 represent low-income inequality; Q4, Q5, and Q6 indicate medium-income inequality; while Q7, Q8, and Q9 reflect high-income inequality.
4.3. Robustness: Driscoll–Kraay Standard Error (DKSE) Method
The study cross-validates the MMQR results by employing the Driscoll–Kraay standard error (DKSE) approach [70]. This method effectively addresses key issues such as cross-sectional dependence, heteroskedasticity, and autocorrelation, while MMQR accounts for non-normal data distributions. In this context, the DKSE enhances the robustness of the MMQR findings by providing consistent standard errors that correct for these complexities. Additionally, DKSE is particularly well-suited for panel data where the time dimension (T) exceeds the number of cross-sectional units (N), a condition met by our data. This alignment confirms DKSE as a robustness check, ensuring the reliability of the results across different specifications and error structures.
5. Results
The study presents the results of the cross-sectional dependence (CSD) test in Table 4 for both BRICS-T and BRICS PLUS-T countries, applying the Breusch–Pagan LM test. The test results reject the null hypothesis of no CSD, indicating that the BRICS-T and BRICS PLUS-T countries are cross-sectionally dependent on each other due to globalization, financial development, and trade openness. Consequently, to address this issue, we employed a second-generation unit root test to investigate the stationarity of II, TI, TI2, FD, and G.
Table 4.
Cross-section dependence test.
The panel unit root test results are presented in Table 5 and do not reject the null of a unit root at the level for both country groups, regardless of the inclusion of intercepts or intercepts and trend. The findings reveal that all five variables—II, TI, TI2, FD, and G—were non-stationary. This indicates that at this level, the series for these five variables do not exhibit stationary behavior. This result suggests that further differencing or transformation may be required before proceeding with subsequent analyses, such as cointegration tests.
Table 5.
Panel unit root test.
The panel cointegration test revealed a long-term relationship among the variables under study. Before conducting the cointegration analysis, the study first addressed CSD by applying the Breusch–Pagan LM test [67] to the residuals. The results in Table 6 indicate that we reject the null hypothesis of no CSD among the residuals in BRICS-T and BRICS PLUS-T countries. Therefore, the Westerlund cointegration test, which accounts for CSD in the residuals, was applied, and the results are presented in Table 6 [69]. The DHg and DHp tests reject the null hypothesis of no cointegration in nearly all cases, except for the DHg test statistic for BRICS PLUS-T nations. Consequently, the findings confirm that the variables—income inequality (II), technological innovation (TI), squared technological innovation (TI2), financial development (FD), and globalization (G)—are cointegrated in both BRICS-T and BRICS PLUS-T economies.
Table 6.
Panel cointegration test.
This study examined the technological Kuznets curve (TKC) in BRICS-T and BRICS PLUS-T countries, employing both linear and nonlinear measures of technological innovation (TI). The study applied the MMQR to estimate the impact of TI on income inequality (II). The results in Table 7 and Table 8 reveal that TI significantly reduced II across all quantiles. In particular, TI showed a more robust impact at lower and moderate levels of II, while its influence diminished at higher quantiles, suggesting greater inequality. However, as technological advancement increases, it intensifies II in both BRICS-T and BRICS PLUS-T economies. This finding suggests a U-shaped relationship between TI and II in both BRICS-T and BRICS PLUS-T countries. The results indicate that TI improves economic conditions by reducing II to a certain threshold. Beyond this threshold, TI appears to increase II, especially in lower and medium quantiles. Furthermore, technological advancement reduces income disparities more rapidly in BRICS-T countries than in BRICS PLUS-T countries. In contrast, the squared term of TI (TI2) contributes to widening II at a faster rate in BRICS-T economies than in BRICS PLUS-T nations. This implies that the impact of TI on II is more pronounced in BRICS-T countries.
Table 7.
Quantile regression results for BRICS-T.
Table 8.
Quantile regression results for BRICS PLUS-T.
The estimated coefficients of TI and its squared term indicate a statistically significant nonlinear relationship with II across most quantiles, consistent with the TKC hypothesis. However, given the potential for bidirectional interactions between TI and II, these results should be interpreted as conditional distributional associations rather than strict causal effects. The estimated coefficients of TI and TI2 support the existence of a U-shaped relationship between TI and II. To further evaluate the TKC hypothesis, the TPs implied by the quadratic specification were calculated. For the BRICS-T countries, the estimated thresholds ranged from 4.29 to 9.67, while for the BRICS PLUS-T countries, they ranged from 3.00 to 11.25. Since TI is measured as the logarithm of resident patent applications, the TP reflects the level of innovation intensity at which the inequality-reducing effect of innovation reverses and becomes inequality-increasing. Given that the observed TI values ranged from 4.93 to 14.17, most estimated thresholds fell within this range, suggesting that the nonlinear relationship is economically meaningful. These findings indicate that TI initially reduces II; however, beyond the estimated threshold, further technological progress may increase inequality. Thus, the results provide additional support for the TKC hypothesis.
Furthermore, financial development (FD) significantly reduced income disparity across quantiles for both country groups. FD brought a fair distribution of income irrespective of the level of II. However, the impact of FD on income inequality was more pronounced in BRICS-T countries compared to BRICS PLUS-T countries. In addition, the influence of FD was stronger at the lower quantiles of II, suggesting that financial development facilitates easier access to financial resources, which is more effective when inequality is relatively low. As the level of II increases in medium and upper quantiles, the effect of FD on II diminishes for both country groups. However, globalization (G) significantly widens II. Notably, the impact of G was more pronounced in BRICS-T countries, where globalization contributed more robustly to increasing II than in BRICS PLUS-T nations. This suggests that globalization possibly concentrates wealth in the hands of a few, exacerbating inequality as it advances.
6. Robustness Check
The DKSE findings in Table 9 align with the MMQR results. It reveals that TI significantly reduces II in BRICS-T, while TI2 substantially increases II in BRICS-T and BRICS PLUS-T countries. The result also validates the U-shaped technological Kuznets curve. Similar to TI, FD substantially reduces II in BRICS-T countries. On the other hand, G widens II by concentrating resources on a few wealthy people. The DKSE result complements the MMQR findings.
Table 9.
Regression with Driscoll and Kraay (1998) [70] standard errors.
7. Discussion
This study examined the technological Kuznets curve (TKC) hypothesis and the heterogeneous effects of TI, FD, and G on II across BRICS-T and BRICS PLUS-T countries using the MMQR framework. The empirical findings revealed a robust nonlinear relationship between TI and II, consistent with a U-shaped pattern across most quantiles in both country groups.
The estimated coefficients of TI and its squared term (TI2) indicate that at lower levels of TI, innovation tends to reduce II. This finding is consistent with the diffusion of basic technologies, the expansion of employment opportunities, productivity gains, and improved access to information, which initially benefit broader segments of the labor force [7,8]. However, as TI surpasses a certain threshold, its marginal effect becomes inequality-increasing, supporting the TKC hypothesis. The computed TPs further substantiate this nonlinear relationship. For BRICS-T countries, the estimated thresholds ranged between 4.29 and 9.67, while for BRICS PLUS-T countries, they ranged between 3.00 and 11.25. Since most of these values fell within the observed range of TI, the results suggest that the turning mechanism is economically meaningful rather than merely statistical.
The observed nonlinearity can be explained by the changing nature of TI. During the initial stages of innovation, TIs facilitate productivity growth, employment creation, and wider access to economic opportunities. However, as innovation becomes increasingly skill-intensive and capital-intensive, the benefits tend to build up disproportionately to highly skilled workers, technology-intensive firms, and regions with stronger innovation ecosystems. This mechanism is consistent with the literature on skill-biased technological change, which argues that TIs raise the demand for skilled labor while reducing the relative demand for low-skilled workers [73,74]. Furthermore, the persistence of the digital divide reinforces these disparities, as individuals and regions with limited access to digital infrastructure and technological capabilities are less able to benefit from TI [22].
A comparison across country groups revealed important heterogeneity in the strength and shape of the TKC relationship. The curve appeared steeper in BRICS-T countries, where TI was more concentrated in skill-intensive sectors and urban centers. In these economies, limited diffusion of digital infrastructure and uneven access to advanced technologies contribute to a stronger skill premium and widening wage dispersion. As a result, the inequality-increasing effect of TI beyond the threshold level is more pronounced. In contrast, the TKC relationship is relatively flatter in BRICS PLUS-T countries. This may reflect differences in economic structure, innovation capacity, and labor market absorption. Several BRICS PLUS-T economies remain more reliant on technology adoption than technology creation and tend to exhibit larger labor-intensive sectors, which generate broader employment opportunities across skill groups [75]. Consequently, TIs may play a more reproductive than transformative role in shaping II in these economies.
The findings also provide an explanation for the apparent differences between our results and those reported in previous studies. For example, a major research findings argue that TIs generally increase II through skill-biased technological change and technological upgrading [49]. Our results suggest that such conclusions may primarily capture the average effect of TI. In contrast, the MMQR framework revealed substantial heterogeneity across the conditional distribution of II. TIs may reduce inequality during earlier stages of development and at lower levels of inequality while becoming inequality-enhancing once innovation surpasses the estimated threshold. Therefore, the present findings complement rather than contradict previous evidence by highlighting the nonlinear and distribution-dependent nature of the technology–inequality relationship [22,73].
FD consistently exhibited a negative and statistically significant effect on II across most quantiles in both country groups. This finding highlights the important role of financial systems in promoting inclusive growth and reducing distributional disparities. The inequality-reducing effect of FD may operate through several channels. Expanded access to credit enables lower-income households and small enterprises to invest in education, entrepreneurship, and productive activities. Improved savings opportunities strengthen financial resilience and wealth accumulation among disadvantaged groups, while deeper financial markets facilitate more efficient capital allocation and employment creation. These mechanisms are consistent with the financial inclusion and financial deepening literature [76]. The stronger effect observed in BRICS-T countries may reflect relatively more developed financial sectors and greater financial intermediation capacity, which allow the benefits of financial deepening to reach a larger share of the population.
G was associated with higher II in both country groups, although its magnitude and statistical significance differed considerably. In BRICS-T countries, G exerted a positive and significant effect across all quantiles, suggesting that the gains from global integration may be concentrated among higher-income groups and internationally competitive sectors. In BRICS PLUS-T countries, however, the effect was statistically significant only at lower and middle quantiles and became insignificant at higher quantiles. This asymmetry may be explained by differences in production structures, labor market characteristics, and institutional frameworks. Many BRICS PLUS-T economies are more integrated into labor-intensive and export-oriented production networks that create employment opportunities across a broader range of skill groups. Moreover, social protection mechanisms and redistributive policies may partially offset the inequality-enhancing effects of G. As inequality rises, domestic structural factors such as labor market segmentation, educational disparities, and institutional quality may become more influential than external integration in determining II [3,49].
Overall, the heterogeneous effects identified in this study demonstrate that the relationship between TI, FD, G, and II is highly context-dependent. Institutional structures, labor market composition, innovation capacity, and the stage of economic development jointly shape how technological and global integration processes translate into distributional outcomes. The findings further illustrate the value of the MMQR approach, which captures important distributional heterogeneity that would remain hidden under conventional mean-based estimation techniques.
It is important to note that while the MMQR framework captures heterogeneous effects across the conditional distribution of II, it is not designed to provide strict causal identification. Therefore, the estimated relationships should be interpreted as conditional associations rather than definitive causal effects. Potential reverse causality between TI and II, as well as omitted variable bias arising from unobserved institutional or structural factors, cannot be fully ruled out. Future studies may employ instrumental variable approaches, dynamic panel techniques, or spatial econometric models to further strengthen causal inference [77].
Policy Implications
The findings of this study have important implications for policies aimed at reducing II and achieving Sustainable Development Goals (SDGs), particularly SDG 10 (Reduced Inequalities) and SDG 9 (Industry, Innovation, and Infrastructure). Reduced inequality contributes to SDG 10, while broader access to TI and financial inclusion supports poverty reduction under SDG 1. Furthermore, innovation policies that facilitate the diffusion of clean technologies may indirectly contribute to SDG 7.
First, the existence of a TKC implies that policymakers should not only promote TI, but also ensure inclusive access to its benefits. In the early stages of development, innovation can be encouraged, as it contributes to productivity gains and reduces inequality. However, beyond the estimated threshold levels, complementary policies are required to prevent innovation from exacerbating II. These include investments in digital infrastructure, education, and skill development to reduce the skill gap associated with TI.
Second, the stronger TKC effect observed in BRICS-T countries suggests that these economies require more targeted redistributive and inclusionary policies. Expanding access to high-quality education, vocational training, and digital literacy programs can help mitigate the skill-biased effects of TI. The TKC’s inequality-increasing phase may be mitigated in particular by policies targeted at reducing regional differences in technology access.
Third, the less pronounced G effect in BRICS PLUS-T countries indicates that G does not uniformly increase inequality across all economies. Policymakers in these countries should therefore focus on strengthening labor market institutions and ensuring that integration into global value chains continues to generate inclusive employment opportunities.
Finally, the consistently mitigating role of FD highlights the importance of inclusive financial systems. Expanding access to credit, improving financial literacy, and promoting fintech solutions can enhance the equalizing effects of FD, particularly for lower-income households and underserved regions.
Overall, the results suggest that achieving inclusive growth in BRICS-T and BRICS PLUS-T countries requires a balanced policy approach that simultaneously promotes TI, manages G, and strengthens financial inclusion while addressing inequalities in access to economic opportunities.
8. Conclusions
Our study analyzed the main factors shaping income inequality (II) in BRICS-T and BRICS PLUS-T countries using the moments quantile regression (MMQR) approach. The analysis revealed that the determinants of II are not homogeneous throughout the distribution. The main finding of our study is that the relationship between technological innovation (TI) and II is not linear but follows a U-shaped structure. While TI reduces II at low and medium levels of inequality, this effect reverses above a threshold. It can deepen income gaps at high levels of II [22,74]. This result is consistent with the literature on how technological advancement distinguishes between countries with low and high II.
The reduced effect of financial development (FD) on II suggests that the integration of low-income individuals into the financial system should be strengthened. It should be noted that globalization (G) is not equally effective across countries, and that policies determine the extent of its effect. Our findings indicate different levels of application areas for policymakers. Technology policies should focus on innovative production and fair dissemination to the public. In this context, practices such as expanding digital skills training, developing technology access infrastructure, and promoting regional R&D incentives come to the fore.
Regarding FD, inclusive policies such as integrating low-income groups into the banking system, adopting microcredit practices, implementing interest-free financing models, and leveraging fintech innovations are recommended. To balance the inequality-generating aspects of globalization, it is necessary to reorganize distribution policies through taxation, social transfers, minimum-wage policies, and related measures.
Our study makes several important contributions to the literature on II. Firstly, it evaluates the technological Kuznets curve (TKC), a topic that has rarely been examined, and is one of the first studies to assess this issue. Second, the scope of our analysis extends beyond the BRICS countries to include newly joined countries, namely BRICS PLUS-T countries, providing a more comprehensive understanding of this relationship in a significant portion of the global economy. It also investigates the impact of newly joined countries on BRICS-T. Additionally, the study employed an advanced econometric technique, MMQR, to examine this relationship.
Our study also has some limitations. In particular, the effects of external shocks, such as structural breaks, crises, or pandemics, were not controlled for in the dataset. Second, although the MMQR approach captures heterogeneous effects across the conditional distribution, it does not explicitly address potential endogeneity arising from reverse causality between TI and II or from omitted-variable bias. Future research may consider instrumental variable approaches, dynamic panel models, or spatial econometric models to further strengthen causal identification. Third, the analysis relies on patent-based measures of TI, which capture innovation output but may not fully reflect other dimensions such as innovation diffusion or digital adoption. Patent applications capture innovation output and technological capability but do not directly measure technology diffusion, digital adoption, or ICT penetration. Therefore, the results should be interpreted as reflecting innovation intensity rather than the broader digital transformation process. In addition, some structural factors affecting II, such as institutional quality, education level, and labor market structure, were excluded from the model. In future studies, more in-depth analyses can be conducted by eliminating these limitations, using micro-based datasets, and accounting for sectoral separations. In addition, applying dynamic versions of the estimation method may help examine the dynamics of II over time [77].
Author Contributions
Conceived and designed the analysis: M.G., U.U., M.S.U. and A.G. Collected the data: U.U. and S.A. Methodology: M.G., M.S.U. and A.K. Performed the analysis: M.G., U.U. and A.K. Wrote the paper: M.G., U.U., S.A., M.S.U., A.K. and A.G. All authors have read and agreed to the published version of the manuscript.
Funding
This research received no external funding.
Institutional Review Board Statement
Not applicable.
Informed Consent Statement
Not applicable.
Data Availability Statement
Data are available upon request.
Conflicts of Interest
On behalf of all authors, I, Ali Kabasakal, as a corresponding author, state that there are no conflicts of interest.
References
- Mariani, M.M.; Machado, I.; Magrelli, V.; Dwivedi, Y.K. Artificial intelligence in innovation research: A systematic review, conceptual framework, and future research directions. Technovation 2023, 122, 102623. [Google Scholar] [CrossRef] [Scilit]
- Mnif, S. Bilateral relationship between technological changes and income inequality in developing countries. Atl. Rev. Econ. 2016, 1, 4. [Google Scholar]
- Asteriou, D.; Dimelis, S.; Moudatsou, A. Globalization and income inequality: A panel data econometric approach for the EU27 countries. Econ. Model. 2014, 36, 592–599. [Google Scholar] [CrossRef] [Scilit]
- United Nations. New UN Report Warns of Global Social Crisis Driven by Insecurity, Inequality, and Distrust. United Nations. Available online: https://www.un.org/en/desa/new-un-report-warns-global-social-crisis-driven-insecurity-inequality-and-distrust (accessed on 30 April 2025).
- Elfaki, K.E.; Ahmed, E.M. Testing technological Kuznets curve implications on achieving Sustainable Development Goal 10 in seven Asian countries. Technol. Forecast. Soc. Change 2024, 209, 123785. [Google Scholar] [CrossRef] [Scilit]
- Fullbrook, E. The three options: An introduction. Real.-World Econ. Rev. 2020, 92, 2–3. [Google Scholar]
- Lechman, E.; Popowska, M. Harnessing digital technologies for poverty reduction. Evidence for low-income and lower-middle income countries. Telecommun. Policy 2022, 46, 102313. [Google Scholar] [CrossRef] [Scilit]
- Tang, C.S. Innovative technology and operations for alleviating poverty through women’s economic empowerment. Prod. Oper. Manag. 2022, 31, 32–45. [Google Scholar] [CrossRef] [Scilit]
- Sinha, A.; Sengupta, T.; Saha, T. Technology policy and environmental quality at crossroads: Designing SDG policies for select Asia Pacific countries. Technol. Forecast. Soc. Change 2020, 161, 120317. [Google Scholar] [CrossRef] [Scilit]
- Lee, C.-C.; He, Z.-W.; Xiao, F. How does information and communication technology affect renewable energy technology innovation? International evidence. Renew. Energy 2022, 200, 546–557. [Google Scholar] [CrossRef] [Scilit]
- Zheng, S.; Yang, J.; Yu, S. How renewable energy technological innovation promotes renewable power generation: Evidence from China’s provincial panel data. Renew. Energy 2021, 177, 1394–1407. [Google Scholar] [CrossRef] [Scilit]
- Ivins, C. Inequality Matters: BRICS Inequalities Fact Sheet; Oxfam: Oxford, UK, 2013. [Google Scholar]
- World Population Review. Wealth Inequality by Country 2025. 2025. Available online: https://worldpopulationreview.com/country-rankings/wealth-inequality-by-country (accessed on 30 April 2025).
- World Bank. World Bank Open Data. 2025. Available online: https://data.worldbank.org (accessed on 30 April 2025).
- BRICS. Leaders’ Declaration: BRICS Summit, 15 April 2010. Available online: http://www.brics.utoronto.ca/docs/100415-leaders.html (accessed on 15 May 2025).
- European Parliament. Expansion of BRICS: A Quest for Greater Global Influence? EPRS: European Parliamentary Research Service. 2025. Available online: https://www.europarl.europa.eu/thinktank/en/document/EPRS_BRI(2024)760368 (accessed on 30 April 2025).
- Patrick, S.; Hogan, E.; Stuenkel, O.; Gabuev, A.; Tellis, A.J.; Zhao, T.; de-Carvalho, G.; Gruzd, S.; Hamzawy, A.; Kebret, E.; et al. BRICS Expansion and the Future of World Order: Perspectives from Member States, Partners, and Aspirants. (n.d.). Carnegie Endowment for International Peace. 2025. Available online: https://carnegieendowment.org (accessed on 30 April 2025).
- Statista. BRICS Plus and G7 countries’ Share of the World’s Total Gross Domestic Product (GDP) in Purchasing Power Parity (PPP) from 2000 to 2024. 2025. Available online: https://www.statista.com (accessed on 30 April 2025).
- Machado, J.A.F.; Santos Silva, J.M.C. Quantiles via Moments. J. Econom. 2019, 213, 145–173. [Google Scholar] [CrossRef] [Scilit]
- Kadir, M.O.; Deka, A.; Seraj, M.; Ozdeser, H. Capitalizing on natural resources rent and renewable energy in enhancing economic growth—New evidence with MMQR method. Nat. Resour. Forum 2025, 49, 3421–3441. [Google Scholar] [CrossRef] [Scilit]
- Schumpeter, J.A. Capitalism, Socialism, and Democracy; Harper & Row: New York, NY, USA, 1942. [Google Scholar]
- Brynjolfsson, E.; McAfee, A. The Second Machine Age: Work, Progress, and Prosperity in a Time of Brilliant Technologies; WW Norton & Company: New York, NY, USA, 2014. [Google Scholar]
- Kuznets, S. Economic Growth and Income Inequality. Am. Econ. Rev. 1955, 45, 1–28. [Google Scholar]
- Tinbergen, J. Income Distribution: Analysis and Policies; North Holland Pub. Co.: Amsterdam, The Netherlands, 1975. [Google Scholar]
- Autor, D.H. Skills, education, and the rise of earnings inequality among the other 99 percent. Science 2014, 344, 843–851. [Google Scholar] [CrossRef] [Scilit] [PubMed]
- Goldfarb, A.; Tucker, C. Digital economics. J. Econ. Lit. 2019, 57, 3–43. [Google Scholar] [CrossRef] [Scilit]
- Antonelli, C.; Tubiana, M. The rate and direction of technological change and wealth and income inequalities in advanced countries. Technol. Forecast. Soc. Change 2023, 191, 122–508. [Google Scholar] [CrossRef] [Scilit]
- Antonietti, R.; Burlina, C.; Rodríguez-Pose, A. Digital technology and regional income inequality: Are better institutions the solution? Pap. Reg. Sci. 2025, 104, 100079. [Google Scholar] [CrossRef] [Scilit]
- Katz, L.F.; Murphy, K.M. Changes in relative wages, 1963–1987: Supply and demand factors. Q. J. Econ. 1992, 107, 35–78. [Google Scholar] [CrossRef] [Scilit]
- Karni, E.; Zilcha, I. Technological progress and income inequality. Econ. Theory 1995, 5, 277–294. [Google Scholar] [CrossRef] [Scilit]
- Acemoglu, D. Technical change, inequality, and the labor market. J. Econ. Lit. 2002, 40, 7–72. [Google Scholar] [CrossRef]
- Pece, A.M.; Simona, O.E.O.; Salisteanu, F. Innovation and economic growth: An empirical analysis for CEE countries. Procedia Econ. Financ. 2015, 26, 461–467. [Google Scholar] [CrossRef] [Scilit]
- Ferreira, J.J.M.; Fernandes, C.I.; Ferreira, F.A.F. Technology transfer, climate change mitigation, and environmental patent impact on sustainability and economic growth: A comparison of European countries. Technol. Forecast. Soc. Change 2020, 150, 119770. [Google Scholar] [CrossRef] [Scilit]
- Antonelli, C.; Gehringer, A. Technological change, rent and income inequalities: A Schumpeterian approach. Technol. Forecast. Soc. Change 2017, 115, 85–98. [Google Scholar] [CrossRef] [Scilit]
- Chu, A.C.; Cozzi, G. Effects of patents versus R&D subsidies on income inequality. Rev. Econ. Dyn. 2018, 29, 68–84. [Google Scholar] [CrossRef] [Scilit]
- Risso, W.A.; Carrera, E.J.S. On the impact of innovation and inequality in economic growth. Econ. Innov. New Technol. 2019, 28, 64–81. [Google Scholar] [CrossRef] [Scilit]
- Faizah, C.; Pratomo, D.S.; Yamada, K. Information and communication technology, inequality change, and regional development in Indonesia. J. Socioecon. Dev. 2021, 4, 224–235. [Google Scholar] [CrossRef] [Scilit]
- Noh, Y.H.; Yoo, K. Internet, inequality and growth. J. Policy Model. 2008, 30, 1005–1016. [Google Scholar] [CrossRef] [Scilit]
- Lloyd-Ellis, H. Endogenous technological change and wage inequality. Am. Econ. Rev. 1999, 89, 47–77. [Google Scholar] [CrossRef] [Scilit]
- Mushtaq, R.; Bruneau, C. Microfinance, financial inclusion and ICT: Implications for poverty and inequality. Technol. Soc. 2019, 59, 101154. [Google Scholar] [CrossRef] [Scilit]
- Mora-Rivera, J.; García-Mora, F. Internet access and poverty reduction: Evidence from rural and urban Mexico. Telecommun. Policy 2021, 45, 102076. [Google Scholar] [CrossRef] [Scilit]
- Adams, S.; Akobeng, E. ICT, governance and inequality in Africa. Telecommun. Policy 2021, 45, 102198. [Google Scholar] [CrossRef] [Scilit]
- Wang, F.; Shen, S. Does the digital economy development improve or exacerbate income inequality? International evidence. Manag. Decis. Econ. 2024, 45, 4012–4038. [Google Scholar] [CrossRef] [Scilit]
- Richmond, K.; Triplett, R.E. ICT and income inequality: A cross-national perspective. Int. Rev. Appl. Econ. 2018, 32, 195–214. [Google Scholar] [CrossRef] [Scilit]
- Lee, N. Are innovative regions more unequal? Evidence from Europe. Environ. Plan. C Gov. Policy 2011, 29, 2–23. [Google Scholar] [CrossRef] [Scilit]
- Permana, M.Y.; Lantu, D.C.; Suharto, Y. The effect of innovation and technological specialization on income inequality. Probl. Perspect. Manag. 2018, 16, 51–63. [Google Scholar] [CrossRef] [Scilit]
- Xiao, A.; Xu, Z.; Skare, M.; Qin, Y.; Wang, X. Bridging the digital divide: The impact of technological innovation on income inequality and human interactions. Humanit. Soc. Sci. Commun. 2024, 11, 809. [Google Scholar] [CrossRef] [Scilit]
- Biyase, M.; Zwane, T.; Mncayi, P.; Maleka, M. Do technological innovation and financial development affect inequality? Evidence from BRICS countries. Int. J. Financ. Stud. 2023, 11, 43. [Google Scholar] [CrossRef] [Scilit]
- Jaumotte, F.; Lall, S.; Papageorgiou, C. Rising income inequality: Technology, or trade and financial globalization? IMF Econ. Rev. 2013, 61, 271–309. [Google Scholar] [CrossRef] [Scilit]
- Cetin, M.; Demir, H.; Saygin, S. Financial development, technological innovation and income inequality: Time series evidence from Turkey. Soc. Indic. Res. 2021, 156, 47–69. [Google Scholar] [CrossRef] [Scilit]
- Wang, L.-M.; Wu, X.-L.; Chu, N.-C. Financial development, technological innovation and urban-rural income gap: Time series evidence from China. PLoS ONE 2023, 18, e0279246. [Google Scholar] [CrossRef] [Scilit] [PubMed]
- Adebayo, T.S. Exploring the heterogeneous impact of technological innovation on income inequality: Formulating the SDG policies for the BRICS-T economies. Energy Environ. 2024, 35, 1773–1792. [Google Scholar] [CrossRef] [Scilit]
- Tchamyou, V.S.; Erreygers, G.; Cassimon, D. Inequality, ICT and financial access in Africa. Technol. Forecast. Soc. Change 2019, 139, 169–184. [Google Scholar] [CrossRef] [Scilit]
- Tang, T.; Cuesta, L.; Tillaguango, B.; Alvarado, R.; Rehman, A.; Bravo-Benavides, D.; Z’arate, N. Causal link between technological innovation and inequality moderated by public spending, manufacturing, agricultural employment, and export diversification. Sustainability 2022, 14, 8474. [Google Scholar] [CrossRef] [Scilit]
- Shin, I.; Kim, H.; Yamamura, E. Technological Progress and the Future of Kuznets Curve’s; University Library of Munich: Munich, Germany, 2008. [Google Scholar]
- Horobet, A.; Dalu, M.A.; Marinescu, I.; Belascu, L.; Dumitrescu, S.A.; Kostakis, I. Financial Inclusion, Technology, and Income Inequality in Europe. Amfiteatru Econ. 2025, 27, 93–110. [Google Scholar] [CrossRef] [Scilit]
- Li, H.; Zou, H.F. Income inequality is not harmful for growth: Theory and evidence. Rev. Dev. Econ. 1998, 2, 318–334. [Google Scholar] [CrossRef] [Scilit]
- Barro, R.J. Inequality and growth in a panel of countries. J. Econ. Growth 2000, 5, 5–32. [Google Scholar] [CrossRef] [Scilit]
- Aghion, P.; Akcigit, U.; Bergeaud, A.; Blundell, R.; Hemous, D. Innovation and top income inequality. Rev. Econ. Stud. 2019, 86, 1–45. [Google Scholar] [CrossRef] [Scilit]
- Benos, N.; Tsiachtsiras, G. Innovation and Income Inequality: World Evidence. MPRA Paper No. 92050. 2019. Available online: https://mpra.ub.uni-muenchen.de/92050/ (accessed on 20 May 2025).
- Solt, F. Measuring income inequality across countries and over time: The standardized world income inequality database. Soc. Sci. Q. 2020, 101, 1183–1199. [Google Scholar] [CrossRef] [Scilit]
- Internatiıonal Monetary Fund. Financial Development Index (FDI). 2025. Available online: https://data.imf.org/en/datasets/IMF.MCM:FDI (accessed on 30 April 2025).
- Gygli, S.; Haelg, F.; Potrafke, N.; Sturm, J.-E. The KOF Globalisation Index—Revisited. Rev. Int. Organ. 2019, 14, 543–574. [Google Scholar] [CrossRef] [Scilit]
- Fointuna, J.I.; Susamto, A.A.; Afifah, E.N. The effect of internet diffusion on income inequality: Cross-regional analysis in Indonesia. Inf. Technol. Dev. 2025, 31, 1222–1242. [Google Scholar] [CrossRef] [Scilit]
- Kassouri, Y.; Majok, A.P.G.; Bilgili, F.; Alola, A.A. Abating income inequality with financial and institutional quality instruments in Sub-Saharan Africa region. Soc. Indic. Res. 2025, 177, 1161–1191. [Google Scholar] [CrossRef] [Scilit]
- Baltagi, B.H. Econometric Analysis of Panel Data; John Wiley & Sons: Chichester, UK, 2008; Volume 4, pp. 135–145. [Google Scholar]
- Breusch, T.S.; Pagan, A.R. The LaGrange multiplier test and its applications to model specification in econometrics. Rev. Econ. Stud. 1980, 47, 239–253. [Google Scholar] [CrossRef] [Scilit]
- Pesaran, M.H. A simple panel unit root test in the presence of cross-section dependence. J. Appl. Econom. 2007, 22, 265–312. [Google Scholar] [CrossRef] [Scilit]
- Westerlund, J. Panel cointegration tests of the Fisher effect. J. Appl. Econom. 2008, 23, 193–233. [Google Scholar] [CrossRef] [Scilit]
- Driscoll, J.C.; Kraay, A.C. Consistent covariance matrix estimation with spatially dependent panel data. Rev. Econ. Stat. 1998, 80, 549–560. [Google Scholar] [CrossRef] [Scilit]
- Awan, A.; Abbasi, K.R.; Rej, S.; Bandyopadhyay, A.; Lv, K. The impact of renewable energy, internet use and foreign direct investment on carbon dioxide emissions: A method of moments quantile analysis. Renew. Energy 2022, 189, 454–466. [Google Scholar] [CrossRef] [Scilit]
- Shin, Y.; Yu, B.; Greenwood-Nimmo, M. Modelling Asymmetric Co-integration and Dynamic Multipliers in a Nonlinear ARDL Framework. In Festchrift in Honor of Peter Schmidt: Econometric Methods and Applications; Horrace, W., Sickles, R., Eds.; Springer: New York, NY, USA, 2014; pp. 281–314. [Google Scholar] [CrossRef] [Scilit]
- Acemoglu, D.; Autor, D. Chapter 12—Skills, tasks and technologies: Implications for employment and earnings. In Handbook of Labor Economics; Card, D., Ashenfelter, O., Eds.; Elsevier: Amsterdam, The Netherlands, 2011; Volume 4, pp. 1043–1171. [Google Scholar]
- Goldin, C.; Katz, L.F. The Race Between Education and Technology; Harvard University Press: Cambridge, MA, USA, 2008. [Google Scholar]
- Archibugi, D.; Pietrobelli, C. The globalization of technology and its implications for developing countries: Windows of opportunity or further burden? Technol. Forecast. Soc. Change 2003, 70, 861–883. [Google Scholar] [CrossRef] [Scilit]
- Beck, T.; Demirgüç-Kunt, A.; Levine, R. Finance, inequality and the poor. J. Econ. Growth 2007, 12, 27–49. [Google Scholar] [CrossRef] [Scilit]
- Essayem, A.; Gormus, S.; Guven, M.; Erdal, F.; Uygun, U. The global risk trinity of hydrocarbon economies: Evidence from the method of moments quantile regression. Energy Rep. 2024, 12, 3412–3421. [Google Scholar] [CrossRef] [Scilit]

Disclaimer/Publisher’s Note: The statements, opinions and data contained in all publications are solely those of the individual author(s) and contributor(s) and not of MDPI and/or the editor(s). MDPI and/or the editor(s) disclaim responsibility for any injury to people or property resulting from any ideas, methods, instructions or products referred to in the content. |
© 2026 by the authors. Licensee MDPI, Basel, Switzerland. This article is an open access article distributed under the terms and conditions of the Creative Commons Attribution (CC BY) license.