Article

Toward Sustainable Intensification: The Impact of the Chemical-Fertilizer-Use Zero-Growth Policy on Grain Production in China


School of Geography and Ocean Science, Nanjing University, Nanjing 210023, China
*
Authors to whom correspondence should be addressed.
Sustainability 2026, 18(13), 6763; https://doi.org/10.3390/su18136763
Submission received: 25 May 2026 / Revised: 25 June 2026 / Accepted: 29 June 2026 / Published: 3 July 2026
(This article belongs to the Section Sustainable Agriculture)

Abstract

Sustainable intensification of agriculture (SIA) aims to increase agricultural output while reducing or not increasing negative environmental impacts, yet evidence on the production effects of reduced chemical inputs remains limited. To narrow this gap, this study examines how SIA impacts grain production by treating China’s “Chemical Fertilizer Use Zero-Growth Policy” (Zero-Growth Policy) as a natural experiment, by using provincial-level data from 2008 to 2022. The study indicates the following: Firstly, the policy exerted no negative impact on grain production and even boosted grain production. Secondly, this production grain operated mainly through an increased grain sown-area share and higher cropping intensity, while yield per unit area remained statistically unchanged. Thirdly, heterogeneity analysis suggests that the positive association between the policy and grain production is relatively stronger in non-main grain production areas than in main grain production areas. These findings provide preliminary evidence that policy-oriented sustainable intensification may be compatible with grain output growth in the sample period.

1. Introduction

The idea of sustainable intensification of agriculture (SIA) has been theoretically well developed to achieve both economic sustainability and environmental sustainability. Over the past half-century, global food production has witnessed substantial growth. However, large-scale exploitation of chemical agriculture has led to a series of environmental challenges, e.g., biodiversity loss [1], greenhouse gas emissions [2], and soil degradation [3]. In response to these issues, extensive research has sought to address the complex challenge of feeding a rapidly growing world population amid climate change and environmental degradation [4]. And since the 1980s, the concept of ‘sustainable intensification of agriculture’ has been proposed and promoted in several studies. SIA has gained widespread attention as a means to simultaneously achieve the goal of enhancing agricultural production while conserving and protecting the environment [5,6].
Since the 21st century, numerous countries and international organizations have undertaken extensive explorations into the practical implementation of SIA. The Food and Agriculture Organization (FAO), for instance, promoted the conservation of ecosystem services through strategies such as conservation tillage, crop diversification, legume intensification, and biological pest control—approaches designed to achieve yields comparable to the high-input intensive farming system [7]. Empirical investigations and case studies have provided evidence for transformative methodologies in SIA. These include no residue burning, staying diverse, integrating livestock, and using small amounts of P mineral fertilizers [8], the substitution of synthetic nitrogen fertilizers with organic compost [9], and the development of legume intercropping systems [10]. In Asia and sub-Saharan Africa in particular, the environmental costs of the legacy of the Green Revolution have prompted a range of interventions in these regions [5]. In Kenya, initiatives that foster collaborations between large grain traders and farmers have proven effective in promoting the adoption of SIA input [11]. From 2008 to 2014, Tanzania improved agricultural productivity through the National Agricultural Input Voucher Scheme, promoting inorganic fertilizers and sustainable soil management practices [9].
China has made an effort to promote agricultural transition towards SIA in the past decade. From 2004 to 2014, more than 40% of the increase in China’s total grain output can be attributed to the intensive application of chemical fertilizers and pesticides [12]. To address the over-application of chemical fertilizers and pesticides, the Ministry of Agriculture (MOA) introduced the Chemical Fertilizer Use Zero-Growth Policy and Pesticide Use Zero-Growth Policy in 2015. Its core measures include the promotion of advanced technologies and the adoption of new or green agrichemical products. To ensure the effectiveness of policy implementation, China has developed a series of supportive measures, including legislative, financial, and technical promotion support [13]. The implementation of this policy also provides us with a window to observe the environmental effects of SIA.
Based on previous research, there are still three major research gaps in the field of SIA. This research has made the following contributions to the study of SIA assessment. First, most of the existing research on SIA mainly focuses on how and whether “fewer inputs” are achieved, but ignores the impact on “more outputs” in the pursuit of fewer inputs. In reality, however, SIA should first and foremost ensure stable agricultural output while mitigating environmental impacts. Second, agronomic strategies for enhancing productivity at plot and farm scales have dominated discussions on SIA. However, research remains scarce on the practical feasibility of SIA approaches at national and sub-national levels. This study is a valuable addition to the field based on the analysis of top-down macro policies implemented in China. Third, this study sheds light on the mechanisms of action of the Zero-Growth Policy affecting grain production. Previous studies have contributed to identifying the causal relationship between chemical fertilizer zero growth and food production at the farmland and farm household scales. However, no study has yet systematically analyzed the impacts of food production on regulatory agricultural policy implementation in developing countries. To this end, using Chinese provincial-level data from 2008 to 2022, this study examines how SIA impacts grain production by using the Zero-Growth Policy as a natural experiment. In addition, this study analyzes the internal mechanisms underlying the differences in grain production impacts due to the policy and explores the heterogeneity of this result across regions.

2. Background and Research Hypothesis

2.1. Background: The Zero-Growth Policy and Its Implementation in China

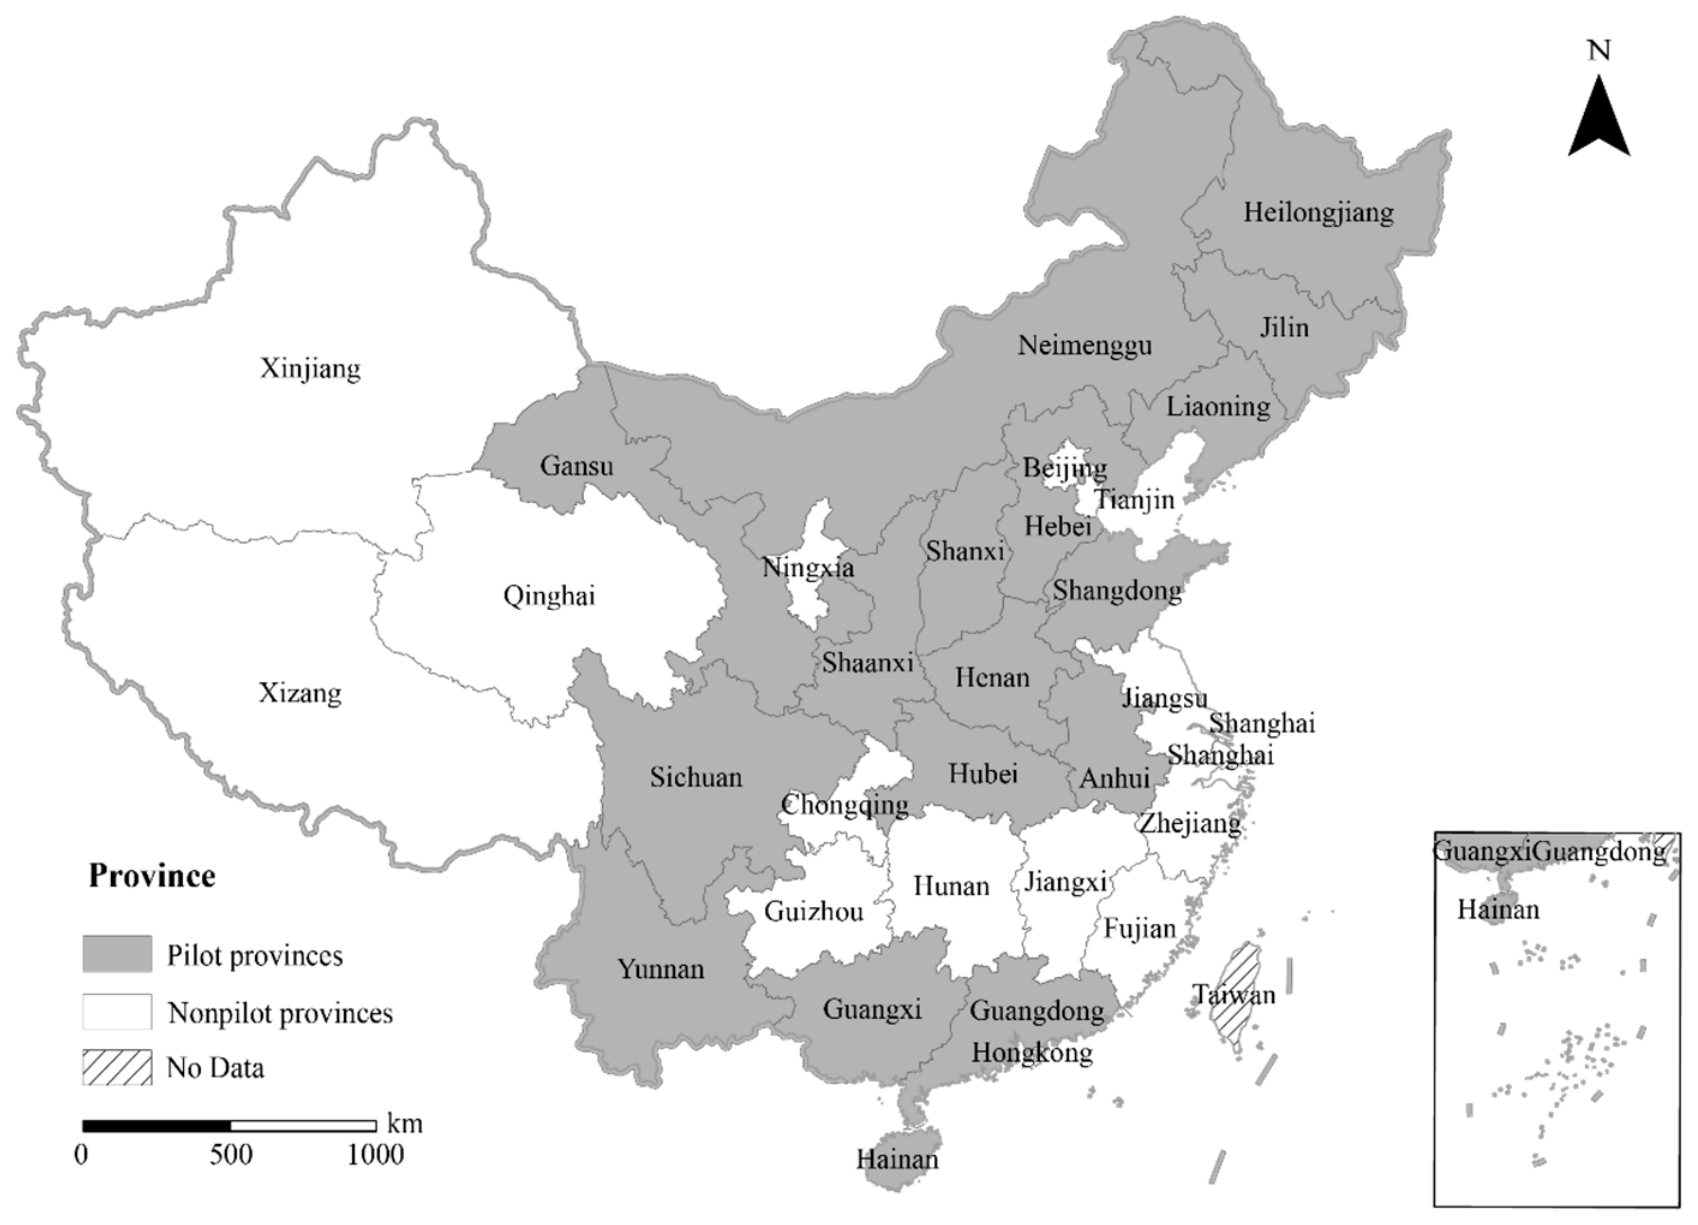
The Zero-Growth Policy is an important action initiative for China to explore the green transformation of agriculture. In February 2015, the Ministry of Agriculture (MOA) issued a notice on the Zero Growth Action Plan for Chemical Fertilizer Use by 2020 (www.moa.gov.cn), which sets the goal of zero growth in chemical fertilizer use. In April of the same year, the MOA further issued an implementation plan to promote the Zero-Growth Policy. This plan proposes to implement the program in 17 provinces initially (Figure 1), providing a basic guideline for the pilot work. In the pilot provinces implementing the Zero-Growth Policy, each has established a leading group to drive implementation, headed by the principal official of the provincial Department (Commission or Bureau) of Agriculture. By extending performance evaluations, refining support policies, and strengthening accountability, these provinces have worked to ensure that their target objectives are met. Based on the coordination of many policies, by 2020, China had achieved a five-year consecutive decline in the total amount and intensity of chemical fertilizer application. The goal of the Zero-Growth Policy has been successfully achieved. According to the requirements of the implementation plan, the annual increase in crop chemical fertilizer use should be reduced to 1% in 2016 and gradually decelerate, to ultimately achieve zero growth in 2020. Afterward, the MOA has continued to promote the quality and efficiency of chemical fertilizers used in pilot provinces.

2.2. The Path of Zero-Growth Policy Influencing Grain Production

2.2.1. The Rationality of Implementing the Zero-Growth Policy of Chemical Fertilizer Under Excessive Fertilization in China

When chemical inputs are applied above optimal levels in grain production, they show potential for reduction in both the ecological and economic dimensions. From the ecological perspective of crop nutrient balances, soil compaction and acidification caused by the over-application of chemical fertilizers are the key reasons for the decline in the quality of arable land and the reduction in crop yields [14]. Studies have shown that crops can take up only 30–50% of chemical fertilizers, thus a great amount of the applied components is lost in the soil [15]. When chemical fertilizer application is at saturation, the efficiency of chemical fertilizer use will decrease [16]. However, with 9% of the world’s arable land, China is responsible for the food demand of roughly one-fifth of the world’s population and also uses nearly 30% of the world’s agrochemicals [17]. The average nitrogen fertilizer application rate in nearly half of China’s rural areas exceeds the internationally recognized threshold of 225 kg per hectare, with widespread improper chemical fertilizer use [17]. Therefore, available data on chemical fertilizer use suggests that there is still considerable room for China to reduce chemical fertilizer use while ensuring stable food production [18].
From the perspective of marginal cost–benefit in economics, the implementation of chemical fertilizer use zero growth under the existing production model may help optimize the allocation of agricultural resources. The law of diminishing marginal cost states that, under certain technological conditions, the use of any factor of production is subject to the phenomenon of diminishing margins [19]. As the most basic and key material input in agricultural production, the fertilization of crops accounts for a significant proportion of variable production costs [20]. This means that farmers’ chemical fertilizer input decisions are directly related to the economic efficiency and sustainability of agricultural production. Therefore, excessive chemical fertilizer input may contribute little to further grain output growth while generating soil and environmental pressures, thereby affecting the realization of crop yield potential and the effective control of nutrient loss. On the other hand, when resources have already been intensively utilized, additional inputs may fail to further improve output and may instead lead to resource waste and unnecessary cost increases. Therefore, under conditions of excessive fertilizer use, the Zero-Growth Policy may help reduce unnecessary fertilizer expenditure and create room for reallocating resources toward other productive inputs. Resources saved from excessive fertilizer use may be reallocated to technological improvement, better management, or other complementary production adjustments, which may help support broader agricultural productivity.
Based on the above analysis, this study proposes Hypothesis 1: Under excessive fertilization, the implementation of the Zero-Growth Policy need not reduce grain production and may even be associated with improved grain output through more efficient input use and complementary production adjustments.

2.2.2. Potential Mechanisms of the Zero-Growth Policy on Grain Production

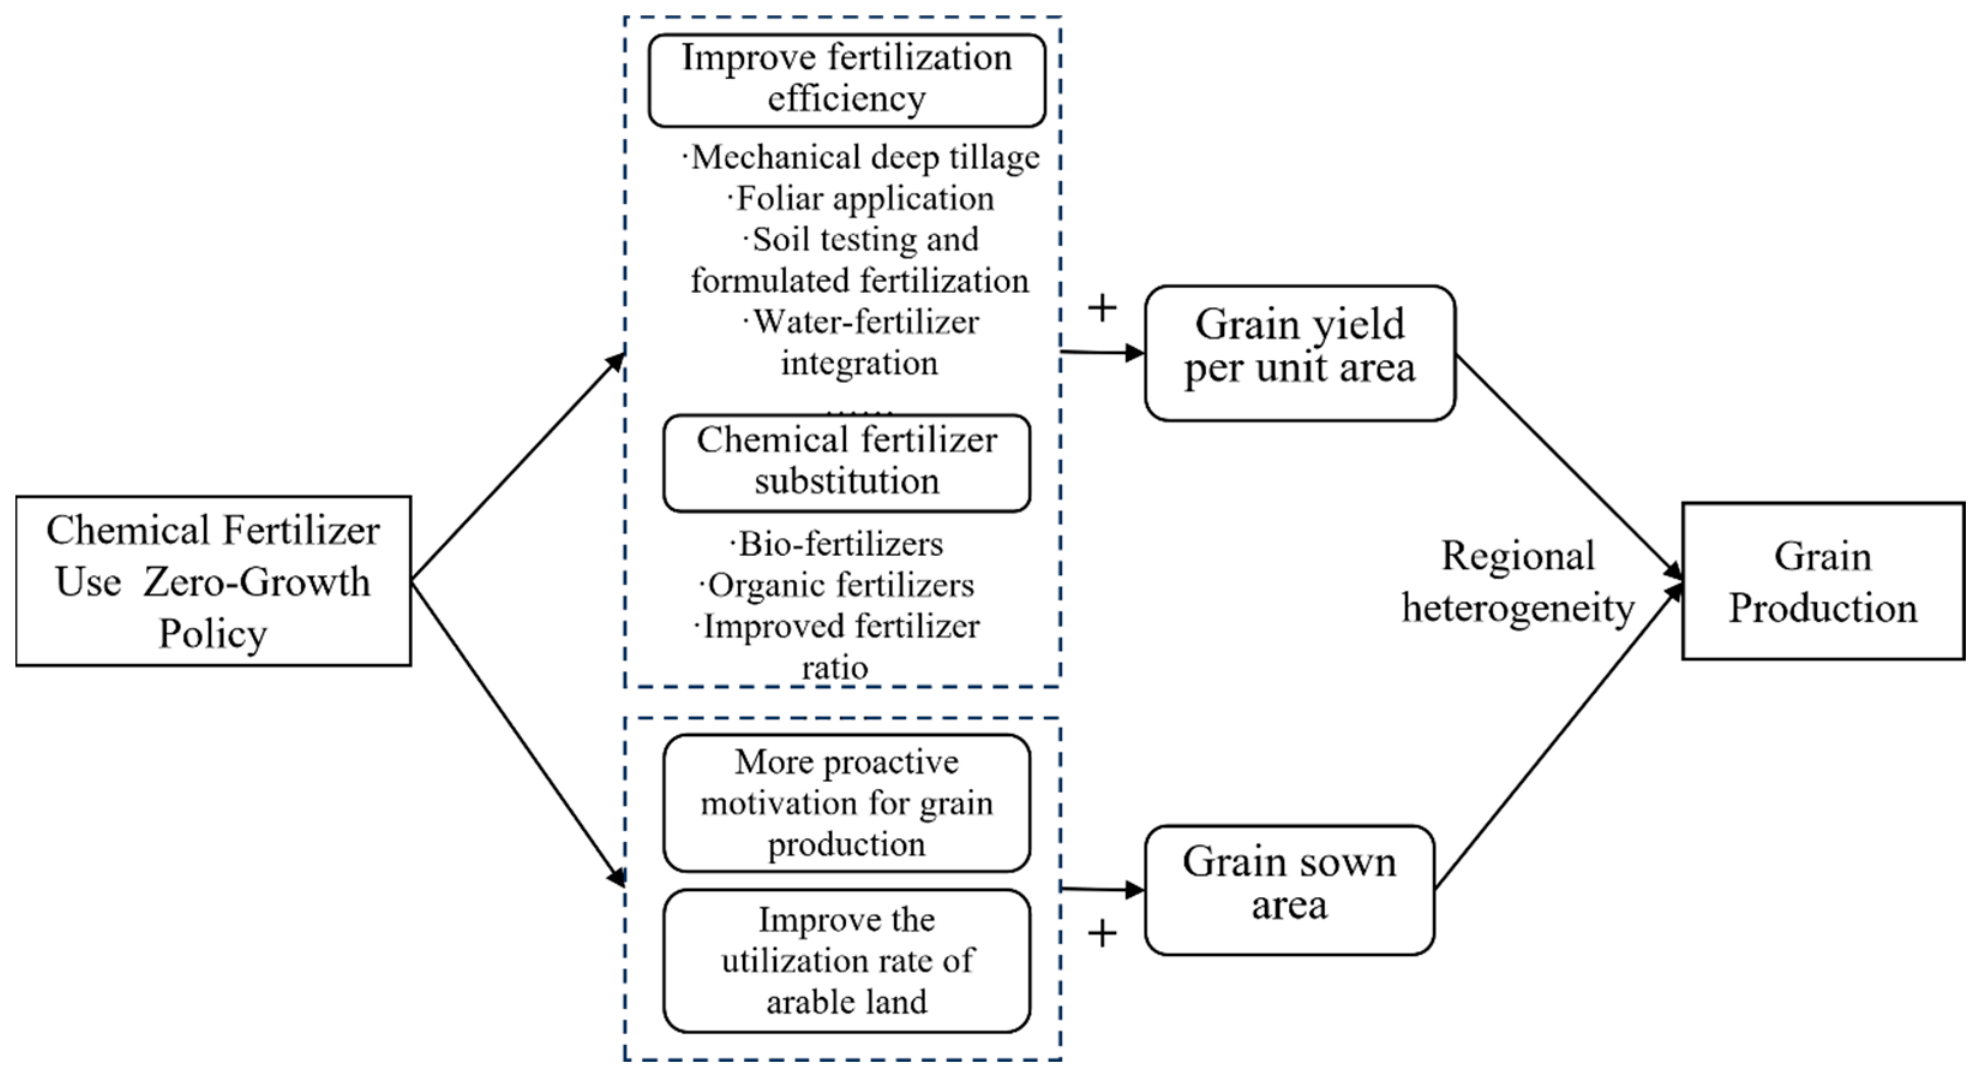
The growth of food production in the long term mainly consists of two aspects: the increase in grain production per unit area on the one hand, and the expansion of the sown area of food on the other hand [21]. Under the traditional intensive production model, improvements in food yield have often been associated with large-scale inputs of agrochemicals, especially fertilizers [22]. As an increasing number of countries tend to reduce agricultural inputs such as synthetic fertilizers [23], clean production alternative technologies, including substituting chemical fertilizers with organic alternatives [24], improving chemical fertilizers use efficiency [25], and optimizing chemical fertilizers consumption structure [26] have also been gradually applied in agricultural production with the aim of enhancing ecological health and while sustaining—rather than necessarily increasing—agricultural productivity. The Zero-Growth Policy is a mandatory agri-environmental regulation that includes a series of administrative, economic, and legal measures designed to ensure the achievement of its intended objective. Its core measures include the promotion of advanced technologies and the adoption of new or green agrochemical products [13]. On the one hand, the Zero-Growth Policy encourages the adoption of more efficient fertilization techniques. On the other hand, it promotes the use of new types of fertilizer and greener input practices aimed at mitigating the environmental pressure associated with conventional fertilizer use (Figure 2).
At the same time, the Zero-Growth Policy may drive local governments to adjust their existing production structure. The food security governance system in China is characterized by a central government that makes clear that it is responsible for overseeing national food security policies, and by provincial and local governments that have primary responsibility for safeguarding local food availability and access [27]. A system of accountability for food security linked to the promotion of officials will urge localities to adopt a variety of policy tools to ensure adequate food supply and stabilize food prices [28,29]. In the implementation of the Zero-Growth Policy, the Ministry of Agriculture has incorporated the target task of zero growth in chemical fertilizer consumption into the extended performance management for local governments (https://zzys.moa.gov.cn/gzdt/201505/t20150525_6309954.htm (accessed on 13 June 2025)). The production pressure to ensure stable grain production has also transformed into political pressure for local governments to fulfill their responsibilities in grain production. For this reason, local governments are likely to adopt more proactive food production practices. Furthermore, the intensity of fertilizer application was significantly higher for cash crops than for food crops [30]. Among them, increasing the multiple cropping index is a feasible measure to maintain and increase soil organic carbon content [31], and scientifically improving the multiple cropping index can help promote agricultural yield increase [32]. Therefore, in the new situation where it is difficult to increase grain production per unit area, local governments may stabilize grain production by increasing the multiple cropping index.
Accordingly, this study proposes Hypothesis 2: The Zero-Growth Policy may contribute to maintaining or improving grain production per unit area through more efficient input use and complementary production adjustments.
Hypothesis 3.
The Zero-Growth Policy may support grain production through adjustments in cropping structure and more intensive use of existing cultivated land.

2.2.3. Regional Heterogeneity in the Impact of the Zero-Growth Policy

Due to regional differences in geography, economic development status, and other factors, there may be heterogeneity in how different regions of China are affected by the Zero-Growth Policy in terms of grain production. Among them, the main grain production areas (MGPAs) policy is a special institutional arrangement established in China to guarantee food security. At the end of 2003, China’s 13 provinces, which together account for 64% of China’s total arable land area and contribute 75% of its total grain output, were identified as China’s main grain production areas and received policy support and investment to achieve China’s agricultural production targets [19]. Generally speaking, relative to non-main grain production areas (NMGPAs), main grain production areas are more dependent on chemical fertilizer application in the process of grain production [33]. Main grain production areas are also facing increased pressure on food production under resource and environmental constraints. However, a larger share of cash crops in the cropping structure of the non-main grain production areas compared to the main grain production areas makes the use of fertilizers more intensive. Thus, the impact of the Zero-Growth Policy on food production may vary in its implementation in different functional food zones (Figure 2).
Therefore, this study proposes Hypothesis 4: The Zero-Growth Policy of chemical fertilizers has a regionally heterogeneous impact on grain production.

3. Materials and Methods

3.1. Methodology

3.1.1. Baseline Model

The Zero-Growth Policy, which was launched in 2015, can be seen as a quasi-natural experiment. Following the release of the policy, we found no subsequent national-level documents within our sample period that formally incorporated additional provinces into the action plan. Thus, its impact on China’s food production can be effectively assessed using the DID method. Based on the 17 provinces covered by the Zero-Growth Policy implementation program released by the MOA in 2015, this study distinguished between treatment and control groups. The treatment group included Hebei, Shanxi, Inner Mongolia, Liaoning, Jilin, Heilongjiang, Shandong, Anhui, Henan, Hubei, Guangdong, Guangxi, Hainan, Sichuan, Yunnan, Shaanxi, and Gansu. Figure 1 presents the geographical distribution of these pilot provinces. The baseline models are set as follows:
Ln G r a i n P r o d u c t i o n i t = α 0 + α 1 P o l i c y i t + α 2 X i t + μ i + γ t + ε i t
where subscript i and t represent provinces and years, respectively. In Equation (1), the dependent variable, ln G r a i n P r o d u c t i o n i t , is the natural logarithm of the grain production in the province. The variable P o l i c y i t it is the policy dummy variable, defined as P o l i c y i t = T r e a t i × P o s t t . T r e a t i equals 1 if province i is the pilot province and 0 otherwise. P o s t t represents the period dummy variable. Generally, a policy takes considerable time to move from initial release through to full implementation at every administrative level. Moreover, in the case of agricultural production, the current year’s cropping patterns, chemical fertilizer procurement contracts, and input plans are typically determined in the preceding year, which limits the immediate impact of newly issued policy measures on agricultural production within the same year. Given this inherent time lag, this study takes 2016, the year following the rollout of the Zero-Growth Policy, as the starting point of the policy’s implementation. P o s t t = 1 indicates the year after the policy was implemented, otherwise P o s t t = 0 . X i t represents a set of control variables. We control province and year-fixed effects through μ i and γ t respectively. ε i t is the standard error clustered at the province level.

3.1.2. Parallel Trend Test

The key identification assumption of the DID model is that the policy in pilot provinces provides effective counterfactual changes to grain production in non-pilot provinces. A potential challenge of this assumption is that the variability between the pilot and non-pilot provinces may be driven by pre-existing time trends. An event analysis is employed to conduct a parallel trends test. The formula is given in Equation (2):
Ln G r a i n P r o d u c t i o n i t = β 0 + β t t = 2008 2015 t r e a t i j × y e a r t + λ t 2022 2017 t r e a t i j × y e a r t + α 2 X i t + μ i + γ t + ε i t
where y e a r t is a year dummy variable. It takes the value of 1 in the year t and 0 in the other year. β 0 is the intercept term and β t and λ t are the corresponding coefficients. Other variables are consistent with Equation (1). The data used in this study spans the period 2008–2022, covering 7 years before and 7 years after the implementation of the policy. To avoid the problem of multicollinearity, data with the first period as the base period were excluded from the regression.

3.1.3. Mechanism Model

Referring to the two-step approach proposed by Jiang [34], we conduct a decomposition exercise through Equation (3). The specific model expression is as follows:
Mechanism it = θ 0 + θ 1 p o l i c y i t + θ 2 X i t + μ i + γ t + ε i t
In Equation (3), the variable M e c h a n i s m i t represents the mechanism variable in year t in province i . θ 0 is the intercept term, and θ 1 are the key coefficients to be estimated. Other variables are consistent with the baseline model.

3.1.4. Heterogeneity Model

The impact of the Zero-Growth Policy on grain production may show differences depending on the differences in food functional zones brought about by the Zero-Growth Policy system. For this reason, these heterogeneities need to be further examined to understand the effectiveness of the Zero-Growth Policy and to provide important information for future policy decisions. To this end, this study constructed Equation (4) and Equation (5) to test for heterogeneity based on whether each province is a major grain-producing area or not:
ln GrainProduction it MGPA = ρ 0 M G P A + ρ 1 M G P A P o l i c y i t M G P A + ρ 2 M G P A X i t M G P A + μ i M G P A + γ t M G P A + ε i t M G P A
ln GrainProduction it NMGPA = ρ 0 N M G P A + ρ 1 N M G P A P o l i c y i t N M G P A + ρ 2 N M G P A X i t N M G P A + μ i N M G P A + γ t N M G P A + ε i t N M G P A
The heterogeneous effects of the policy on the impact of grain production are revealed by group regressions on samples from main grain production areas and non-main grain production areas. Specifically, there are 13 main grain production areas among 31 provinces. The other variables are the same as in Equation (1).

3.2. Data

3.2.1. Variable

Food production is one of the most important indicators of the success of implementing SIA methods [35]. Using grain production to represent the food security of a region is also a common practice in relevant studies [28]. To this end, this study designates grain production as the key dependent variable. The variable GrainProduction is used to represent the level of food production in each province. According to classification in the Chinese Statistical Yearbook, grain production mainly includes the sum of three categories: cereals, pulses, and tubers.
The Policy is the central explanatory variable of this study, which is coded as a dummy variable consisting of an individual dummy variable and a time dummy variable. If a province belongs to the policy pilot province, then T r e a t i equals 1, otherwise it equals 0. When the province is observed in the post-pilot period, P o s t i equals 1 for policy implementation, otherwise it is coded as 0, representing non-implementation.
Grain production is shaped by a range of potential driving factors [36]. To control the impact of other variables that may affect grain production, a series of control variables was identified based on prior research. Notably, studies indicate that investment in agricultural infrastructure positively contributes to food security [37]. To reflect this, the variable “invest” is introduced to capture rural basic production conditions related to rural electricity, natural gas, water, and transportation, and this variable is measured by the fixed asset investment of rural households in provinces. Agricultural planting structure also exerts a profound impact on grain production [38]. Accordingly, the variable “structure” represents this structure, operationalized as the ratio of vegetable and fruit planting areas to grain sown area. Moreover, to mitigate potential reverse causality between agricultural planting structure and grain production, a lag term for agricultural planting structure was used in the analysis. The variable “disaster” represents the impact of natural disasters on food production [39], and this variable is measured by the ratio of the affected area to the total cultivated land area. Prior research has shown that agricultural mechanization significantly enhances agricultural production efficiency and crop yield [40]. Thus, the variable “machine” is used to capture changes in grain production driven by agricultural technological progress, reflected by the total power of agricultural machinery in each province. Meanwhile, farmers’ income is a key determinant of technological innovation in grain production [41]. Hence, the variable “income” represents rural residents’ net income, indicating their capacity to subsidize agricultural production through earnings. Furthermore, the scale of agricultural operations influences grain production [42]. To this end, the variable “land per worker” is employed to denote labor operational scale, calculated by dividing the regional grain sown area by the labor force engaged in grain cultivation. Previous studies have shown that agricultural subsidies play an important role in stimulating agricultural production [43]. Therefore, the variable “subsidy” is used to represent agricultural subsidy policies, measured by the fiscal expenditures of each province on agriculture, forestry, and water affairs.

3.2.2. Data Source

The data used in this paper is obtained from multiple sources, whereas China’s official statistical yearbooks are the primary source. First, data on grain production, agricultural fixed assets investment, grain sown area, agricultural disaster, rural residents’ income, and other variables for each province between 2008 and 2022 were obtained through the China Statistical Yearbook. For grain production statistics, agricultural production data adjusted after China’s Third National Agricultural Census (2016) were used. Second, due to inconsistencies in statistical standards between the 2009 and 2019 National Land Surveys, arable land area changes were measured using a dataset developed by Tsinghua University’s Department of Earth System Science, which is based mainly on remotely sensed data (https://www.dess.tsinghua.edu.cn/info/1108/6151.htm (accessed on 15 June 2025)). Third, the data on the main grain production areas were from the National Food and Strategic Reserves Administration. Specifically, there are 13 main grain production areas among 31 provinces (Heilongjiang, Henan, Shandong, Sichuan, Jiangsu, Hebei, Jilin, Anhui, Hunan, Hubei, Inner Mongolia, Jiangxi, and Liaoning). Finally, all continuous variables were log-transformed to normalize distributions. For the limited missing data, linear interpolation was applied to ensure dataset completeness.

3.2.3. Descriptive Statistics

Table 1 reports the descriptive statistics of all variables. On average, the logarithm of grain production is 7.68 and 6.23 in pilot provinces and nonpilot provinces, respectively. It is found that the mean values of grain production in pilot provinces are significantly larger than those in nonpilot provinces. For the control variables, the fixed assets investments, agricultural technological progress, per capita arable land area and agricultural subsidies in pilot provinces are significantly higher than those in non-pilot provinces. However, the mean values of the structure of agricultural planting and rural residents’ income are higher in nonpilot provinces than in pilot provinces. The above analysis provides preliminary evidence for this study, but a more stringent multiple regression analysis is needed.

4. Results

4.1. Baseline Results

After confirming the absence of multicollinearity in the regression model using Variance Inflation Factor (VIF) test (see Appendix B, Table A1 for details), this study used a fixed-effects model to estimate the impact of the Zero-Growth Policy on food production (Table 2). To ensure the reliability of the findings, stepwise regression analysis was utilized. Initially, the logarithm of grain production was regressed on policy while controlling for year and province-fixed effects only. In subsequent analyses, from column (2) through column (8), this study incrementally incorporated additional control variables pertinent to each province. Notwithstanding minor fluctuations, the coefficients for policy stabilized, consistently manifesting significant positivity at a minimum threshold of 10%. This indicates that the implementation of the policy has not suppressed grain production. Column (8) reports that compared to the control group provinces that were not included in the scope of policy implementation, the treatment group provinces that implemented the policy had an average net increase of 9.7% in grain production after policy implementation.
As for the control variables, lninvest, lnincome, and ln(land per worker) are positively correlated with the increase in grain production, which is consistent with the speculation of the study. The impact of machinery is not statistically significant, which may be due to China’s rural labor exodus. Machinery mainly plays the role of maintaining production, but the utility of grain production is not obvious. It has also been illustrated in previous studies that when serious land fragmentation exists, a lack of a socialized service system, or agricultural machinery is not applied to the actual needs, it may also lead to a situation where agricultural machinery cannot effectively contribute to the output enhancement. There is a negative correlation between structure, disaster, and the dependent variable, which is also consistent with this study’s speculation. That is, when the structure of agricultural cultivation is skewed toward vegetable cultivation, or when crop cultivation is affected by natural disasters, there is a negative impact on food production. Although the negative coefficient and statistical significance coefficient of agricultural subsidies may seem counterintuitive, they are actually consistent with relevant research conclusions. Public subsidies may weaken incentives, reduce agricultural production efficiency, and thus have adverse effects on food production [44]. Although subsidies may increase yield per unit, they can lead to factor mismatches and a decrease in the proportion of agricultural output [45].
It is worth noting that our DID identification strategy relies on the assumption that control provinces were not affected by similar policies during the sample period. However, under China’s nationwide “Zero-Growth Action for Fertilizer” launched in 2015, non-pilot provinces may have also undertaken voluntary reduction efforts. Compared with the pilot provinces, these voluntary actions typically lacked the standardized technical guidance, central fiscal support, and performance evaluation mechanisms that accompanied the formal pilot program, and were therefore considerably weaker in scope and less systematic. Such “partial treatment” of the control group introduces attenuation bias and pushes our DID estimate toward zero. Accordingly, the baseline estimate reported in Table 2, namely that the pilot policy raised grain production by 9.7%, should be interpreted as a conservative lower bound of the true policy effect. The actual magnitude of the policy impact may well be larger than the estimate reported here.

4.2. Robustness Test

4.2.1. Parallel Trend Estimation Results

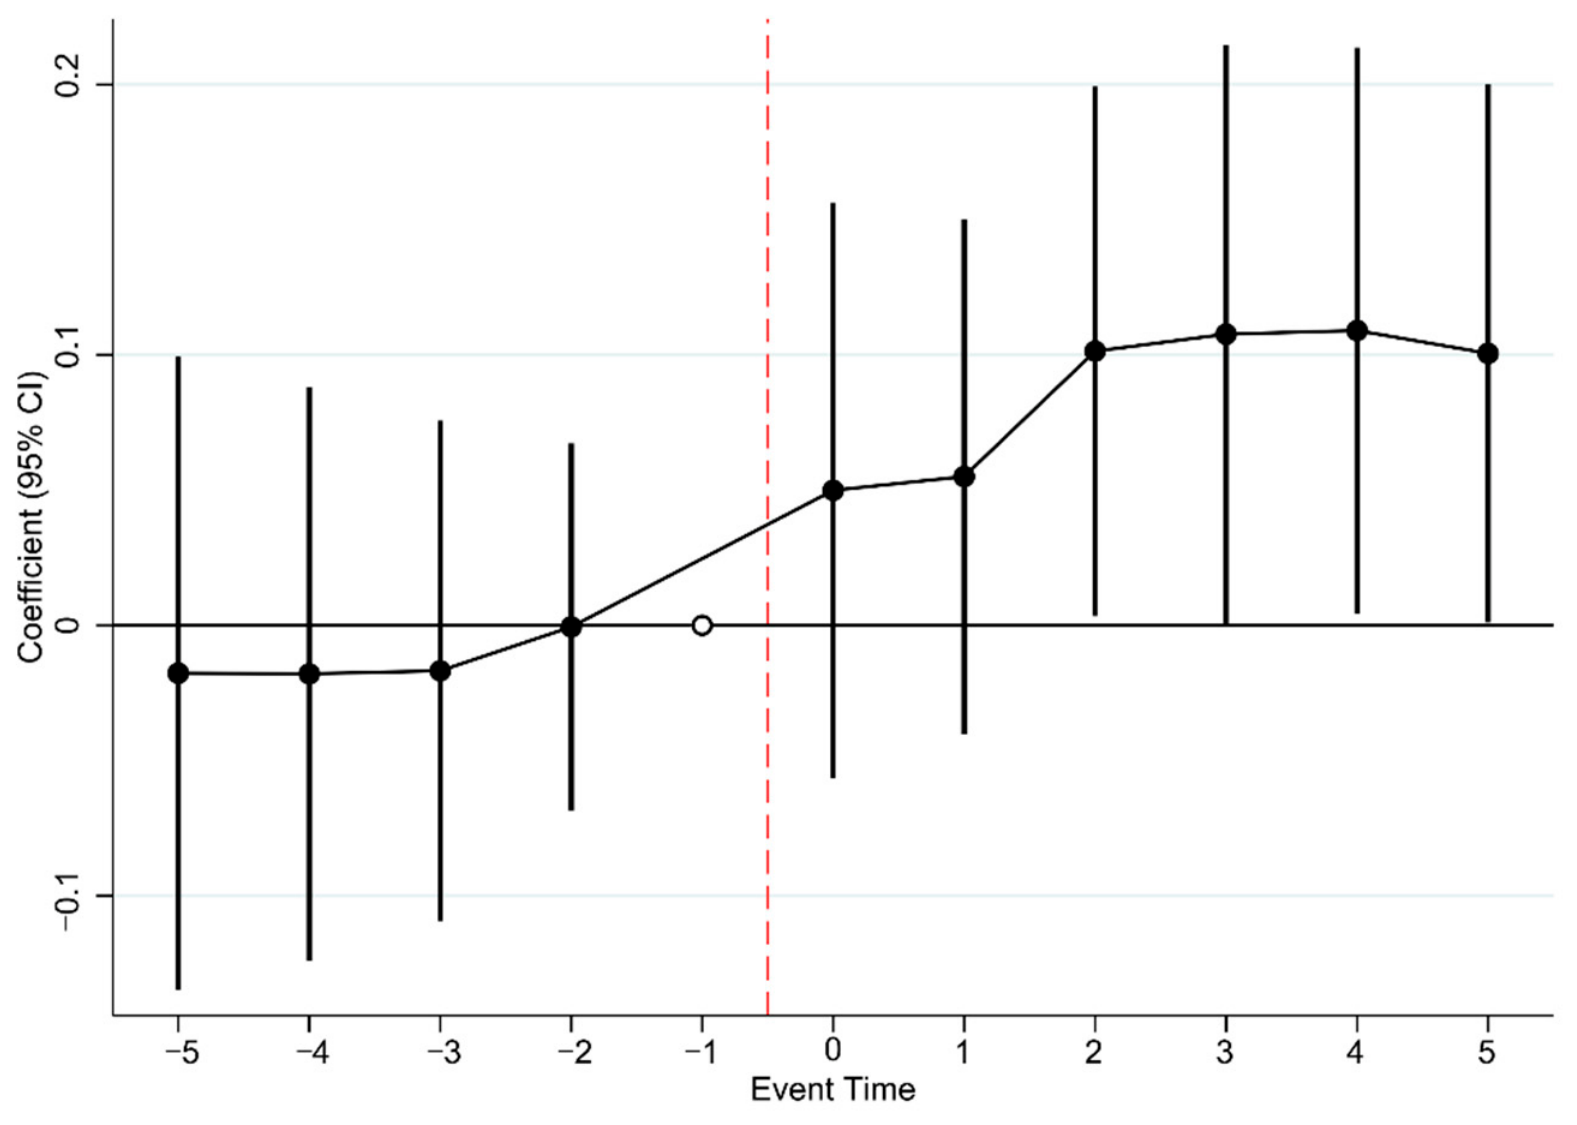
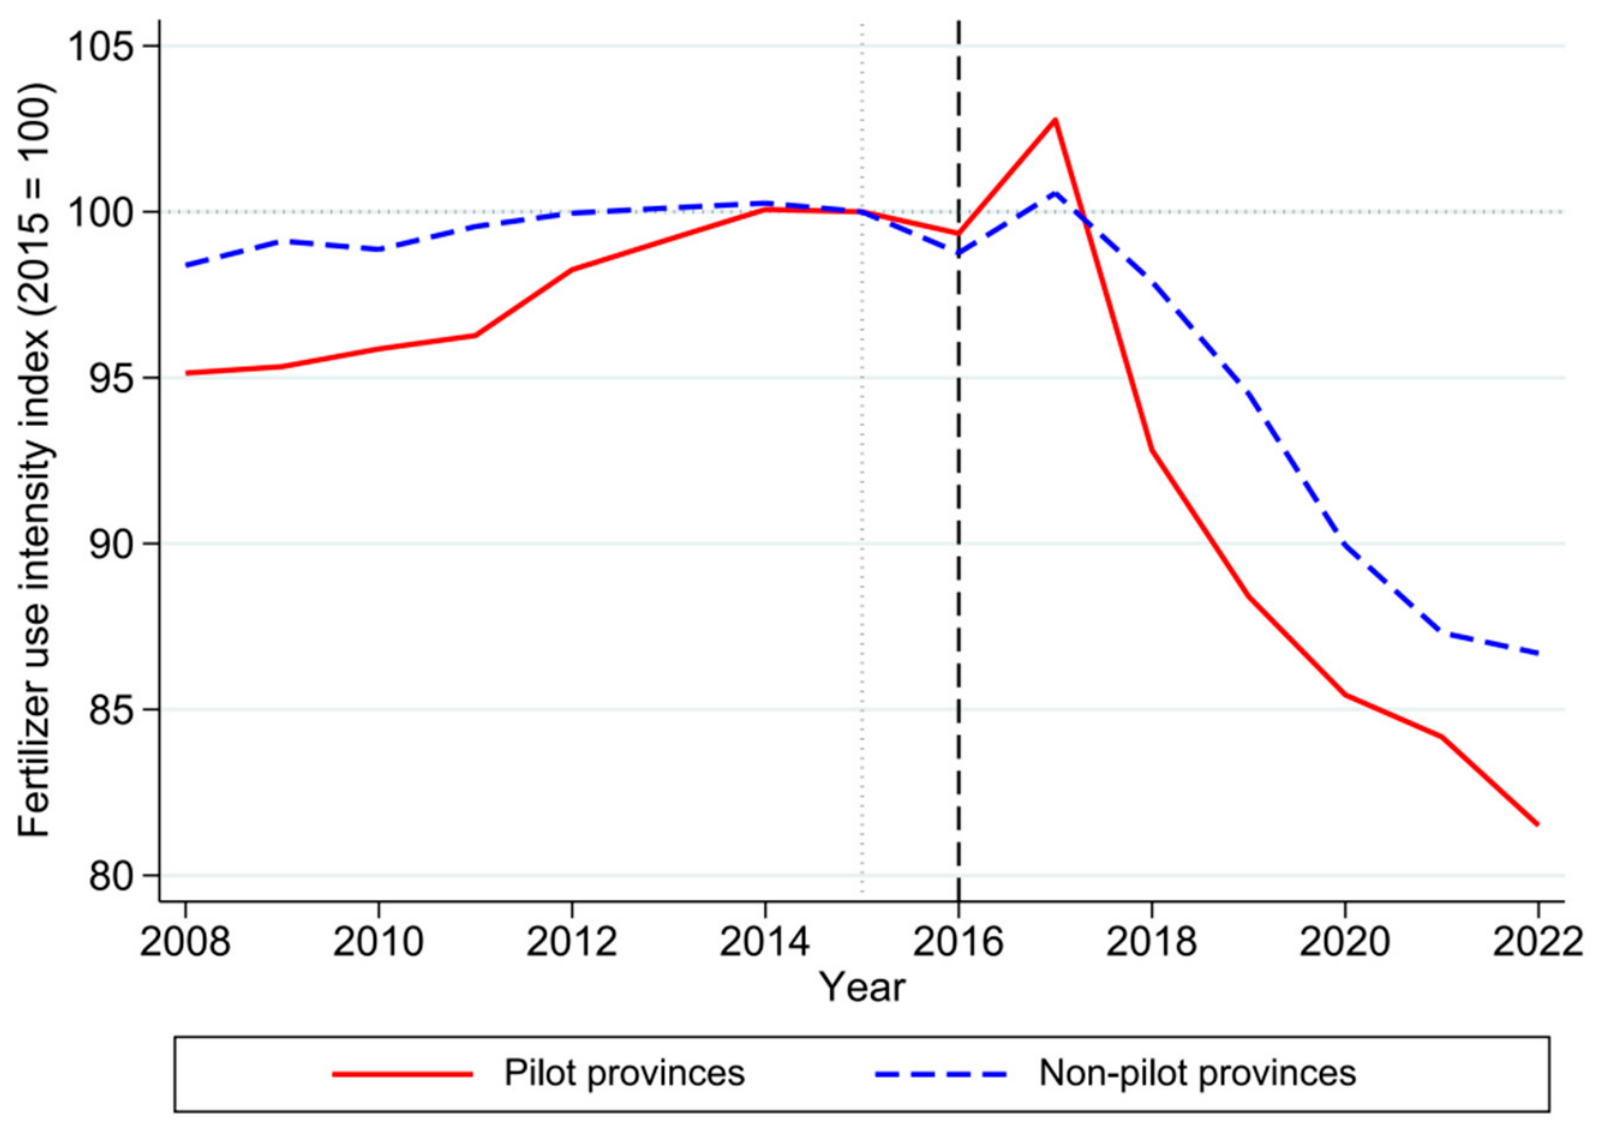
The relative trend line of fertilizer application intensity between the treatment group and the control group from 2008 to 2022 shows that the treatment group achieved a more significant reduction in fertilizer use (Appendix A Figure A1). This study further validated the validity of baseline results through a parallel trend test. To avoid the effect of multicollinearity, this study set the first period before the policy (2015) as the base period and excluded it, after which the estimated coefficients are plotted against the dynamic trend. Figure 3 shows that before the policy was introduced, the coefficients of the time dummy variables were not significant, indicating that there was no significant difference in grain production levels between the treatment and control groups before the policy occurred, satisfying the parallel trend hypothesis. In terms of dynamic effects, the impact coefficient of the Zero-Growth Policy is significantly positive one year after the policy was implemented, indicating that the Zero-Growth Policy can have a policy effect of promoting grain production, and this effect has a certain degree of lag. Building on the parallel-trends test, we further conduct a joint F-test on the pre-treatment coefficients. The test yields F = 0.86 (p = 0.552 > 0.10), indicating that the pre-treatment coefficients are jointly insignificant and thereby lending additional support to the parallel-trends assumption.
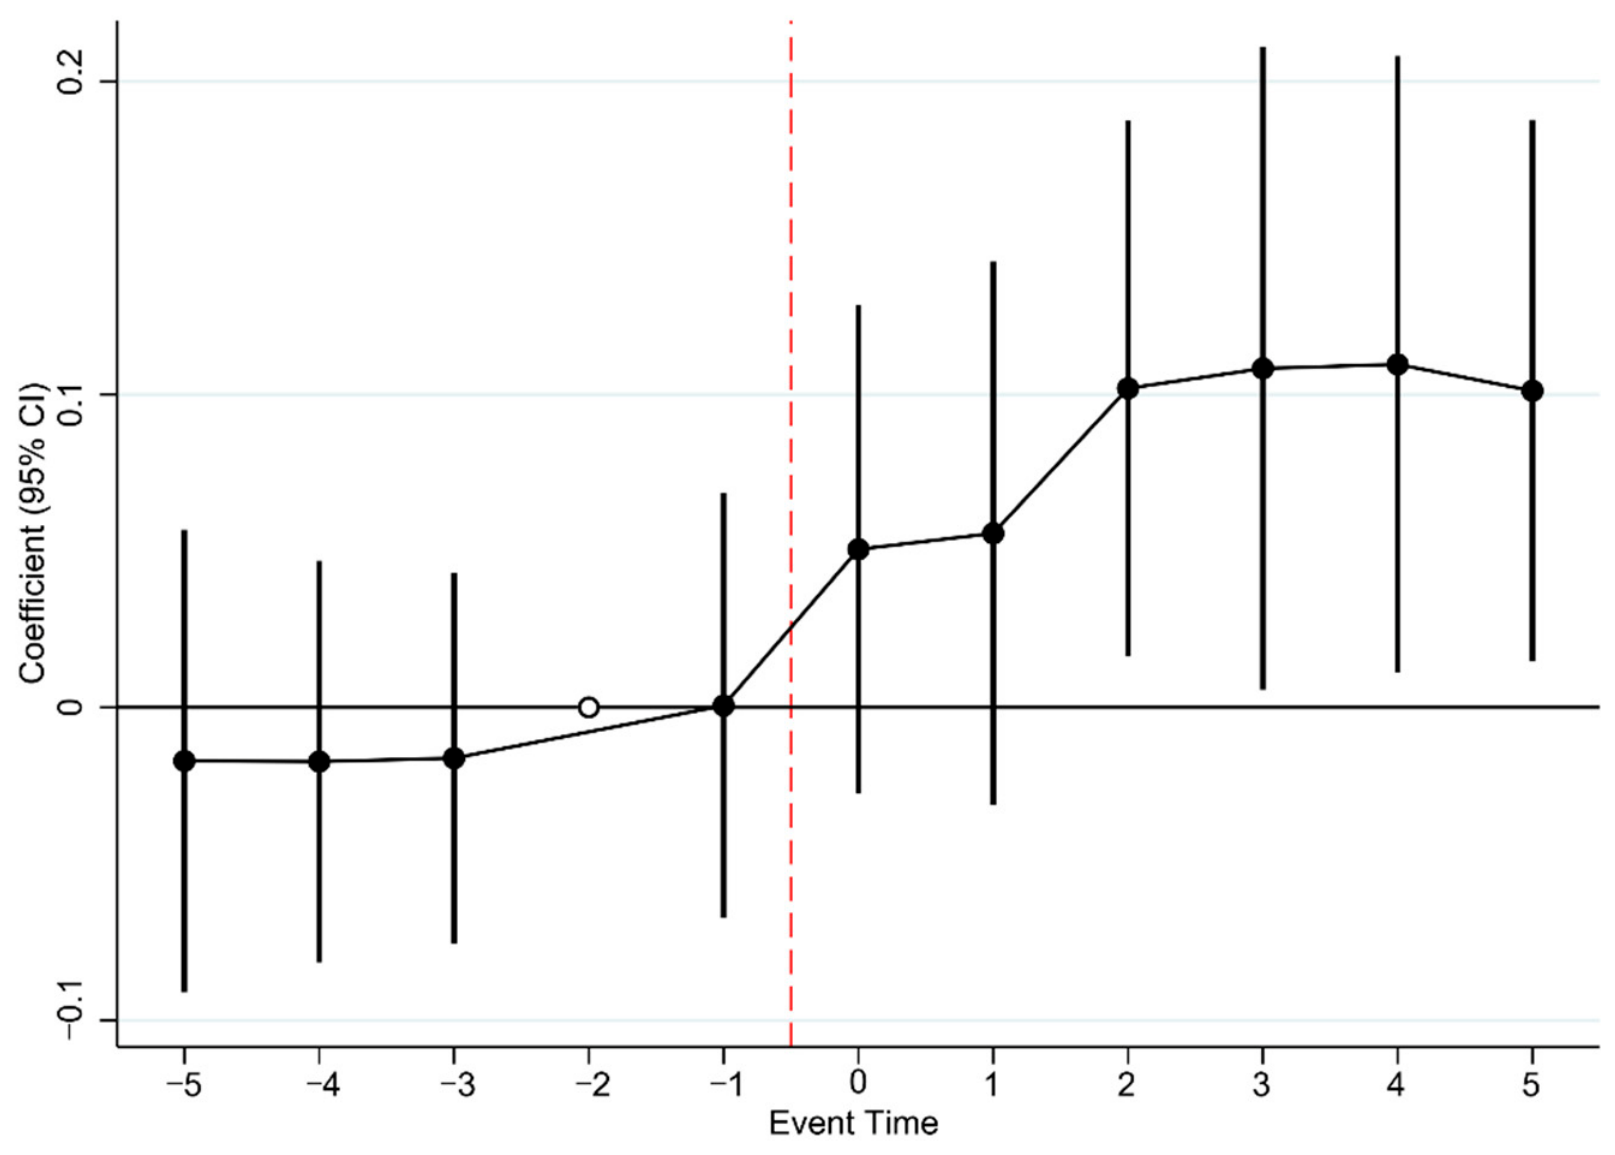
To address the concern that anticipation effects may have been present in 2015, we re-estimate the event-study specification using 2014 (t = −2) as the baseline period instead of 2015 (t = −1), thereby allowing the 2015 coefficient to enter the regression as a direct test for anticipation. As shown in Figure 4, the estimated coefficient at t = −1 is statistically indistinguishable from zero (β ≈ 0, with the 95% confidence interval comfortably straddling zero), indicating the absence of any significant anticipation effect in 2015. This confirms that our choice of 2016 as the policy implementation year is robust. Moreover, the treatment effect becomes statistically significant from t = 2 onward and stabilizes at around 0.10, further corroborating the baseline results. The widening of the confidence intervals in later periods reflects the smaller number of observations available over longer horizons; nevertheless, the point estimates remain stable at approximately 0.10, suggesting that the economic magnitude of the effect is sustained.

4.2.2. Placebo Test

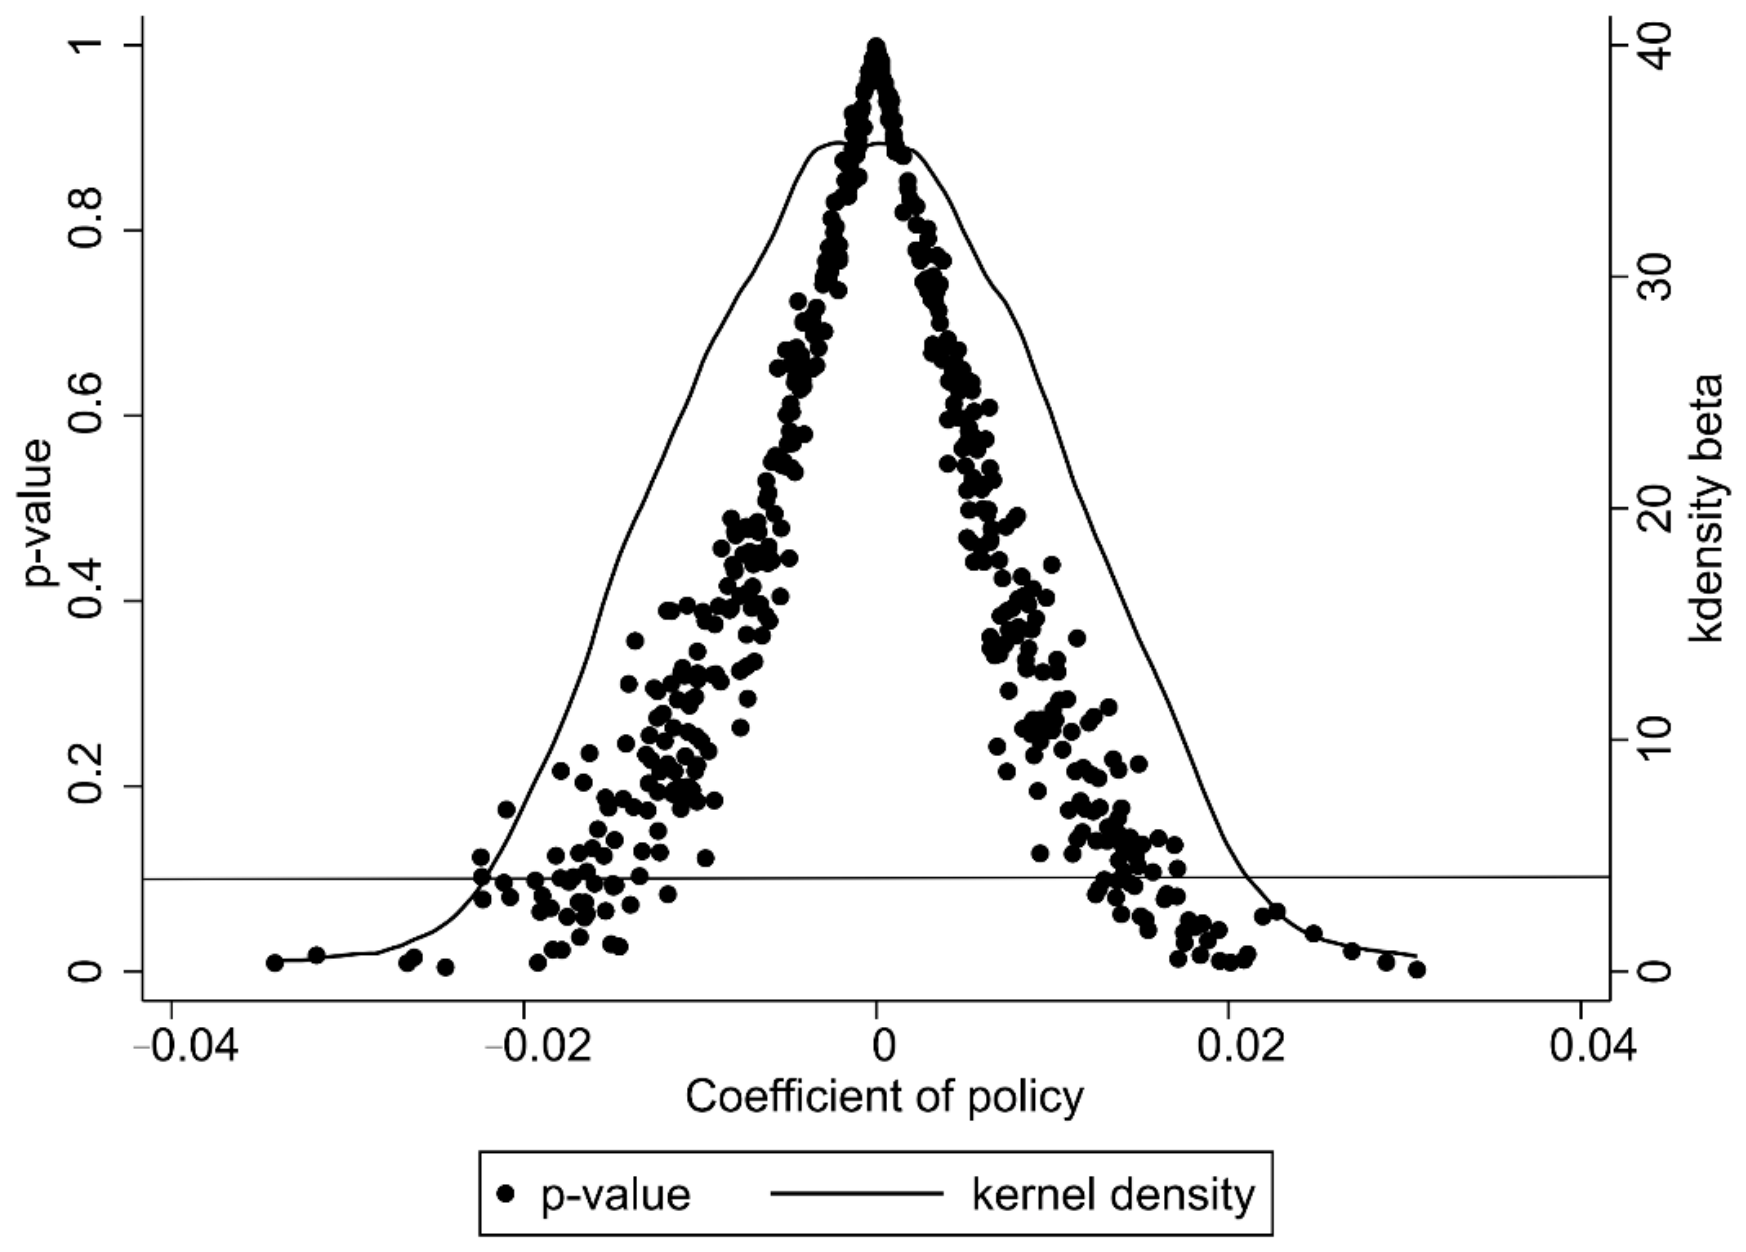
To avoid the influence of unobserved variables on the results of the study, the robustness of the results was further examined in this study using a placebo test. There are two common types of placebo tests, including fictitious treatment groups or fictitious policy times. Given that this study uses short panel data, randomizing fictitious treatment groups typically allows for better testing of result robustness. Thus, a placebo test was conducted by randomizing the treatment groups among the sample provinces. In this case, if the Zero-Growth Policy is indeed the causal factor for the increase in food production, then the effect of the randomly assigned “treated group” on food production should not show a significant effect. To this end, this study repeated the random sampling process 500 times, and the results are shown in Figure 5. It is clear from the figure that the distribution of the regression coefficients for the policy is mainly concentrated around 0, while most of the p-values of this study randomly selected samples lie above 0.1, but the results of the randomly sampled fictitious treatment group are not significant. Therefore, this result proves that the results of baseline regressions are robust.

4.2.3. Wild Cluster Bootstrap

Given the limited number of province-level clusters, we further conduct inference using the wild cluster bootstrap-t procedure. As shown in Table 3, the bootstrap p-value for the policy coefficient is 0.0156, and the corresponding 95% confidence interval is [0.0204, 0.1723], which excludes zero. This suggests that the baseline result remains robust after accounting for finite-cluster concerns.

4.2.4. Replacing the Independent Variable

In this section, this study tests the robustness of the baseline results by replacing the independent variable. Specifically, this study expresses the level of grain production in each province through the ratio of cereal production relative to the production of other plant-based foods, including vegetable production, fruit production, and sugar production. The results of the study are displayed in column (1) of Table 4. By comparing the results of this substitution-dependent variable with the original dependent variable, the analysis consistently demonstrates the significant positive impact of the Zero-Growth Policy. The fact that this result shows consistency under different measures surfaces the high robustness of the results of this study and shows that this conclusion does not depend on the specific choice of the dependent variable.

4.2.5. Excludes Special Samples

In this section, in order to exclude the influence that some particular samples may have on the existence of the results of the study, this study excludes certain special samples from the analysis, dividing them into two distinct groups. The first part includes autonomous regions of ethnic minorities (AREM). The second part includes municipalities that are directly administered by the central government (DAM). The third part includes neighboring provinces that may be affected by policy spillover effects from pilot provinces. Previous studies have highlighted that the political economy environment in these provinces differs significantly from that of other provinces. For instance, officials in autonomous regions of ethnic minorities are evaluated mainly based on criteria such as ethnic unity and social stability, while top leaders from municipalities that are directly ethnic minorities are considered rising stars in the political arena [46]. If pilot provinces reduces the planting of fertilizer intensive economic crops, neighboring non-pilot provinces may “absorb” the transferred yield, thereby polluting the control group through inter provincial spillover effects. The results on excluding ethnic minority autonomous areas and municipalities directly managed by the central government are shown in columns (2) and (3) of Table 4. After excluding these regions, it can be observed that the coefficients of the different terms change only slightly. Given the limited number of provinces in our sample, it is infeasible to drop every control province that shares a border with any treated province. We therefore adopt the following screening criterion: we identify control provinces that are adjacent to three or more treated provinces and treat them as those facing the most severe spillover exposure. This procedure yields five high-risk control provinces (HRCP)—Jiangxi, Hunan, Guizhou, Chongqing, and Ningxia—which are subsequently removed from the sample. We then re-estimate the DID specification on this reduced sample. The column (4) of Table 4 shows that the policy coefficient is basically stable. These results suggest that the results of the benchmark regression in this study are robust.

4.2.6. Winsorization Treatment

Finally, this study uses the robustness test of winsorization to process the data in order to avoid outliers from adversely affecting the results [47]. Column (5) of Table 4 shows the regression results after shrinking the tails up and down by 1% for all continuous variables. As can be seen from the results, the Zero-Growth Policy continues to have a positive impact on grain production, with only a slight change in the regression coefficients. This result indicates that the results of this study are robust.

4.3. Decomposition of the Production Effect

Having found that the implementation of the Zero-Growth Policy has a positive effect on the growth of grain production, this study further investigates the underlying mechanism. Firstly, the study estimates the impact of the policy on grain production per unit area. As shown in Column (1) of Table 5, the policy has no significant effect on grain production per unit area, indicating that yield per unit area did not decline following the policy. Then, this study estimates the impact of the policy on the grain sown area. Column (2) of Table 5 shows that compared with the control group provinces that were not included in the scope of policy implementation, the treatment group provinces that implemented the policy had an average net increase of 9.5% in grain sown area after the policy was implemented.
To identify the driving forces behind the growth in grain sown area reported in Column (2) of Table 5 and distinguish two potential channels including aggregate agricultural expansion and structural transformation toward grain crops, this study first estimates the impact of the Zero-Growth Policy on the total sown area of crops. Column (1) of Table 6 shows that the total crop sown area in pilot provinces increases by 6% relative to non-pilot provinces following policy implementation, yet this outcome cannot distinguish between expanded cultivated land and higher multiple cropping intensity as the source of growth. We therefore re-run the regression using cultivated land area and the multiple cropping index as dependent variables. The multiple cropping index is defined as the ratio of grain sown area to cultivated land area. Columns (2) and (3) of Table 6 show that the policy did not lead to an expansion of cultivated land area in the pilot provinces, but it raised the multiple-cropping index by 5.9%. Further testing of the proportion of grain planting area in the total crop planting area in column (4) of Table 6 shows that the proportion of grain planting in pilot provinces has significantly increased. Collectively, these findings suggest that, constrained by grain production accountability assessments and fertilizer reduction regulations, the expansion of grain sown area in pilot provinces does not rely on extensive expansion of cultivated land. Instead, such growth is achieved through two intensive pathways, namely adjusting cropping structures toward grain crops and elevating multiple cropping intensity on existing farmland.

4.4. Heterogeneity Analysis

The policy effect of the Zero-Growth Policy can vary significantly in practice. China is a vast country, and such differences may depend on a number of factors that exist in terms of the economic endowment and agricultural production base of each region. This study focuses on the differences in resource endowment and the historical tradition of food production, which are closely related to agricultural production, and conducts regressions based on the differences in China’s functional areas of food production. The results in columns (1) and (2) of Table 7 show that the Zero-Growth Policy has a significant positive effect on food production in both main grain production areas and non-main grain production areas. Column (3) pools the major and non-major grain-producing areas and introduces the interaction term Policy × NonMain to formally test whether the policy effect differs across the two groups. The estimated coefficient on Policy × NonMain is 0.072 and is marginally significant at the 10% level, with a sign consistent with the difference between the subsample coefficients reported in Columns (1) and (2). This result suggests that the policy effect may be relatively larger in non-major grain-producing areas. However, since the cross-group difference does not reach the conventional 5% significance level, this regional heterogeneity should be interpreted with caution and viewed only as suggestive evidence rather than a robust conclusion.
A possible explanation for this pattern is that non-major grain-producing areas may have had greater room for policy-induced adjustment in agricultural production. Because grain production traditionally accounts for a smaller share of agricultural activity in these regions, local production structures may be more responsive to policy signals aimed at strengthening grain supply and optimizing planting decisions. Under the Zero-Growth Policy, farmers and local governments in non-major grain-producing areas may therefore have had stronger incentives to reallocate cropping decisions toward grain production, generating a relatively larger increase in grain output in numerical terms. By contrast, in major grain-producing areas, where grain production has long occupied a dominant position in agricultural activity, the scope for further policy-induced expansion may be more limited due to the larger initial production base and the greater stability of existing production patterns. Nevertheless, these interpretations remain tentative and should be understood as plausible explanations rather than as formally identified mechanisms.

5. Discussions

5.1. In the Context of Excessive Fertilization, a Reasonable Reduction in Chemical Fertilizer Application Is Feasible

Reducing the use of nitrogen-based fertilizers is an important aspect of reducing carbon emissions from agriculture. Some past field trial studies based on small-scale plots have shown that a 10–39% reduction in nitrogen fertilizer application did not affect grain production and quality in the plots [48,49]. The results of the model projections also indicate that a 27% reduction in national nitrogen fertilizer consumption is possible while achieving the national rice production target in 2030 [50]. Several studies have also concluded that N reduction potentials exist for different food crop varieties and that these potentials show differences among crops [50,51]. For this reason, even though some studies have found adverse effects of chemical fertilizer reduction on food production due to experimental differences [52]. However, the results of most of the available studies show a trend that an effective reduction in nitrogen fertilizer application will be a viable SIA measure while ensuring the current level of food production [48,49].
Previous field trial results support the conjecture presented in this paper. This study, which analyzes the impact of SIA tools on grain production based on the Zero-Growth Policy in China, reaches similar conclusions. Compared to the control group provinces that were not included in the scope of policy implementation, the treatment group provinces that implemented the policy had an average net increase of 9.7% in grain production after policy implementation (Table 2). Notably, our estimated policy effect of 9.7% is likely a lower bound of the true impact. Control provinces also voluntarily cut fertilizer use under the national zero-growth mandate, meaning nationwide pilot expansion could yield greater welfare gains than we estimate, reinforcing our policy proposal. This conclusion remains valid after a series of robustness tests (Table 3 and Table 4, Figure 3 and Figure 4). In a study based on a breakpoint regression methodology to assess the impact of the Zero-Growth Policy on food security, the results also show a boosting effect of this policy on food production [33]. Another study examined the dynamic relationship between chemical fertilizer application and food production using decoupling models. The conclusions suggest that chemical fertilizers and food production will be in a superposition of “strong decoupling” and “declining decoupling” for a long period of time, i.e., when chemical fertilizer application declines, food production rises or declines slowly [53]. Therefore, various research findings suggest that a reasonable zero growth in chemical fertilizer use would be a feasible measure under the current grain production conditions in China.

5.2. Integrating Substitution Measures Matters

The positive impact of the Zero-Growth Policy on food production needs to be based on the implementation of substitution measures. In practice, chemical fertilizer reduction under the Zero-Growth Policy is typically accompanied by a range of complementary substitution measures. Relevant literature has analyzed the realization of chemical fertilizer reductions, often accompanied by the use of other substitution measures, such as providing subsidies for the reduction in chemical fertilizers or the use of organic fertilizers, increasing taxes on chemical fertilizers, and providing extension services for the reduction in chemical fertilizers or the use of organic fertilizers [54]. When discussing how to balance chemical fertilizer reduction with rice yield and quality, relevant studies have also pointed out that the key lies in the implementation of measures such as soil testing and fertilization [55], organic fertilizer substitution for chemical fertilizers [56], etc., based on variables such as traditional nitrogen fertilizers use, soil fertility, varietal characteristics, and climatic environment.
Institutional support from national and local governments is indispensable to translating environmental principles or food production responsibilities into large-scale, well-coordinated action items. For example, as early as 1990, the United States enacted the Organic Food Production Act, which cuts the use of chemical fertilizers through organic product certification, geographic indications certification, and agricultural product quality certification [57]. Through the EU scheme, the EU supports farmers in adopting or maintaining environmentally and climate-friendly agricultural practices such as enhanced crop diversification, precision agriculture, etc. [58]. Also in Vietnam, the Ministry of Agriculture and Rural Development (MARD) has adopted the One Must Do, Five Reductions (OMR) agricultural technology package for rice crop management practices [59], which relies on the government to promote fertilizer reduction in rice crops. In our analysis, the Zero-Growth Policy was associated with both reduced fertilizer use and higher grain output. While the policy was implemented through national-level incentives and various technical measures, our data do not allow us to isolate the contribution of specific technical measures to the observed output gains. But it is also important to note that reliance on state-imposed regulatory measures in agriculture is never a blanket policy ban. When agrochemicals and synthetic fertilizers are completely phased out without complementary policies, it will lead to severe agricultural and economic crises.

5.3. Improving Arable Land Multiple Cropping Efficiency Is Key to Sustaining Grain Production

Between 2000 and 2020, China’s multiple-cropping index shows an upward trend. The application of multiple cropping systems between cropping systems is becoming more frequent [41]. Intriguingly, this study suggests that the implementation of the Zero-Growth Policy has promoted local governments to take more proactive actions in grain production, promoting the proportion of grain sowing and increased the multiple cropping index (Table 6). The shift in cropping efficiency guided by this policy reflects a strategic balance among crop production, land resource management, and environmental protection, aligning with previous findings that reducing the use of fertilizers and pesticides would not lead to a decrease in crop yields, but would significantly increase the demand for land for crop production [12]. Confronted with China’s burgeoning population and finite arable land resources, the enhancement of sustainable arable land efficiency is of paramount importance [60]. When the available land is limited, increasing the multiple-cropping index will play a positive role in stabilizing food production.
The main grain production areas serve as the core region of China’s grain production and staple food supply, contributing 78.25% of the nation’s total grain production [61]. These areas have long been the focal points of national subsidy policies [62]. This study considered the spatial variability of the policy implementation effect when analyzing mainly in terms of China’s grain functional area system. The results show that the policy has a positive impact on grain production in the main grain production areas (Table 7). This is related to the multiple subsidies and technology promotion implemented by the Zero-Growth Policy, which is consistent with the role played by subsidies for food production in previous studies. Meanwhile, the Zero-Growth Policy also has a positive impact on food production in non-main grain production areas, and its impact on non-main grain production areas (0.137) is significantly larger than that on main grain production areas (0.063). Past research has shown that increasing the profitability of cultivation based on policy subsidies is essential for reducing arable land abandonment [63]. Then, for non-food-producing regions with higher levels of cropland abandonment [64], policy regulation to reduce fertilizer application would be more likely to reduce the abandonment or inefficient use of cropland in the region. For this reason, when the main grain production areas play a role in consolidating the overall situation of national grain production, it is also possible to actively consider the potential of grain cultivation in non-main grain production areas, to jointly guard the responsibility of China’s grain production.

6. Conclusions

In this paper, the impact of SIA on grain production is questioned concerning the real need to reduce chemical fertilizer application in the context of SIA goals in agriculture, using the example of the Zero-Growth Policy in China. The results show that the implementation of the policy exerted no negative impact on grain production and even boosted it. The empirical findings further suggest that this positive effect operates mainly through land-use intensification and cropping-structure adjustment rather than through changes in yield per unit area. Specifically, yield per unit area remained statistically unchanged, while the increase in grain output was associated with a higher multiple-cropping index and a larger share of grain in total sown area.
This study offers a plausible explanation for how the goal of zero growth in chemical fertilizer use can coexist with rising grain production. Specifically, at the level of grain production, the empirical findings suggest that the observed increase in output may be related to improvements in land-use efficiency and adjustments in cropping structure, which could help offset the potential negative effects of constrained fertilizer use on yield growth. Under the double constraints of chemical fertilizer application and food production pressure, the improvement of land-use efficiency promoted the growth of total grain output by expanding the sown area of grain crops under limited total arable land resources.
More broadly, the findings provide preliminary evidence that policy-oriented sustainable intensification may be associated with gains in grain production in the Chinese context. While China is facing the increasingly prominent problem of “Non-agriculturalization” and “Non-grain conversion” of arable land, the implementation of the Zero-Growth Policies provides empirical evidence for achieving increased food production under environmentally sustainable conditions. However, these results should be interpreted as associational rather than causal, and they do not directly establish long-term environmental sustainability or public health outcomes. For countries with arable land resource constraints, the key to achieving sustainable food production lies in transforming traditional resource inputs into sustainable ones. Sustainability goals can be achieved by reducing the use of industrial chemicals and increasing the efficiency of food production. For countries with large amounts of fragmented arable land and large differences in resource endowments, financial, technological, and social service support to local governments or farmers through regulatory agricultural policies can be an effective means of achieving sustainable agricultural production.
This study provides empirical evidence on sustainable intensification practices under policy-oriented objectives, but there remains room for further improvement in terms of sample coverage, mechanism identification, and methodological refinement. Future research could expand the sample scope, employ a more systematic causal mediation analysis to better uncover the pathways through which the policy operates, and further strengthen identification by exploring additional empirical strategies such as spatial DID. These efforts will constitute important directions for the continued development of this line of research.

Author Contributions

Conceptualization, X.Z. and Y.C.; methodology, X.Z.; software, X.Z.; validation, X.Z.; formal analysis, X.Z.; investigation, X.Z.; resources, X.Z.; data curation, X.Z.; writing—original draft preparation, X.Z.; writing—review and editing, X.Z. and Y.C.; visualization, X.Z. and Y.C.; supervision, X.Q. and T.Z.; project administration, X.Q. and T.Z.; funding acquisition, T.Z. All authors have read and agreed to the published version of the manuscript.

Funding

This research was supported by the National Natural Science Foundation of China (NSFC) under grant numbers 42571318 and 42261144750.

Institutional Review Board Statement

Not applicable.

Informed Consent Statement

Not applicable.

Data Availability Statement

Data are contained within the article.

Conflicts of Interest

The authors declare no conflicts of interest.

Appendix A

Figure A1. Chemical fertilizer use intensity by group, 2008–2022. Notes: The vertical dotted line at 2015 marks the base year for indexation (2015 = 100). The black vertical dashed line in 2016 represents the implementation year of the Zero Growth Policy determined by the study.
Sustainability 18 06763 g0a1

Appendix B

Table A1. Variance Inflation Factor (VIF) test results.
VariableVIF1/VIF
lnmachine4.750.211
lnsubsidy3.980.251
lnincome3.510.285
lninvest2.050.488
structure2.010.498
lnlabor1.640.610
disaster1.480.675
policy1.370.728
Mean VIF2.60
Notes: VIF = Variance Inflation Factor. All VIFs are well below the conventional threshold of 10 (strict threshold of 5), indicating no multicollinearity concern.

References

  1. Boakes, E.H.; Dalin, C.; Etard, A.; Newbold, T. Impacts of the Global Food System on Terrestrial Biodiversity from Land Use and Climate Change. Nat. Commun. 2024, 15, 5750. [Google Scholar] [CrossRef] [Scilit] [PubMed]
  2. Li, L.; Awada, T.; Shi, Y.; Jin, V.L.; Kaiser, M. Global Greenhouse Gas Emissions From Agriculture: Pathways to Sustainable Reductions. Glob. Chang. Biol. 2025, 31, e70015. [Google Scholar] [CrossRef] [Scilit] [PubMed]
  3. Prăvălie, R.; Borrelli, P.; Panagos, P.; Ballabio, C.; Lugato, E.; Chappell, A.; Miguez-Macho, G.; Maggi, F.; Peng, J.; Niculiță, M.; et al. A Unifying Modelling of Multiple Land Degradation Pathways in Europe. Nat. Commun. 2024, 15, 3862. [Google Scholar] [CrossRef] [Scilit] [PubMed]
  4. Zhao, J.; Zhang, Z.; Zhao, C.; Liu, Z.; Guo, E.; Zhang, T.; Chen, J.; Olesen, J.E.; Liu, K.; Harrison, M.T.; et al. Dissecting the Vital Role of Dietary Changes in Food Security Assessment under Climate Change. Commun. Earth Environ. 2024, 5, 440. [Google Scholar] [CrossRef] [Scilit]
  5. Denning, G. Sustainable Intensification of Agriculture: The Foundation for Universal Food Security. npj Sustain. Agric. 2025, 3, 7. [Google Scholar] [CrossRef] [Scilit]
  6. Kamau, H.; Roman, S.; Biber-Freudenberger, L. Nearly Half of the World Is Suitable for Diversified Farming for Sustainable Intensification. Commun. Earth Environ. 2023, 4, 446. [Google Scholar] [CrossRef] [Scilit]
  7. FAO. Save and Grow: A Policymaker’s Guide to the Sustainable Intensification of Smallholder Crop Production; Collette, L., Ed.; FAO: Rome, Italy, 2011; ISBN 978-92-5-106871-7. [Google Scholar]
  8. Epper, C.A.; Paul, B.; Burra, D.; Phengsavanh, P.; Ritzema, R.; Syfongxay, C.; Groot, J.C.J.; Six, J.; Frossard, E.; Oberson, A.; et al. Nutrient Flows and Intensification Options for Smallholder Farmers of the Lao Uplands. Agric. Syst. 2020, 177, 102694. [Google Scholar] [CrossRef] [Scilit]
  9. Kim, J.; Mason, N.M.; Mather, D.; Wu, F. The Effects of the National Agricultural Input Voucher Scheme (NAIVS) on Sustainable Intensification of Maize Production in Tanzania. J. Agric. Econ. 2021, 72, 857–877. [Google Scholar] [CrossRef] [Scilit]
  10. Adelhart Toorop, R.; Lopez-Ridaura, S.; Bijarniya, D.; Kalawantawanit, E.; Jat, R.K.; Prusty, A.K.; Jat, M.L.; Groot, J.C.J. Farm-Level Exploration of Economic and Environmental Impacts of Sustainable Intensification of Rice-Wheat Cropping Systems in the Eastern Indo-Gangetic Plains. Eur. J. Agron. 2020, 121, 126157. [Google Scholar] [CrossRef] [Scilit]
  11. Mulwa, C.K.; Muyanga, M.; Visser, M. The Role of Large Traders in Driving Sustainable Agricultural Intensification in Smallholder Farms: Evidence from Kenya. Agric. Econ. 2021, 52, 329–341. [Google Scholar] [CrossRef] [Scilit]
  12. Hu, Y.; Liu, Y. Impact of Fertilizer and Pesticide Reductions on Land Use in China Based on Crop-Land Integrated Model. Land Use Policy 2024, 141, 107155. [Google Scholar] [CrossRef] [Scilit]
  13. Cheng, Z.; Zhu, M.; Cai, J. Reducing Fertilizer and Pesticide Application through Mandatory Agri-Environmental Regulation: Insights from “Two Zero” Policy in China. Environ. Impact Assess. Rev. 2025, 110, 107716. [Google Scholar] [CrossRef] [Scilit]
  14. Liu, L.; Zheng, X.; Wei, X.; Kai, Z.; Xu, Y. Excessive Application of Chemical Fertilizer and Organophosphorus Pesticides Induced Total Phosphorus Loss from Planting Causing Surface Water Eutrophication. Sci. Rep. 2021, 11, 23015. [Google Scholar] [CrossRef] [Scilit] [PubMed]
  15. Wang, Y.; Zhu, Y.; Zhang, S.; Wang, Y. What Could Promote Farmers to Replace Chemical Fertilizers with Organic Fertilizers? J. Clean. Prod. 2018, 199, 882–890. [Google Scholar] [CrossRef] [Scilit]
  16. Zhu, X.; Hu, R.; Zhang, C.; Shi, G. Does Internet Use Improve Technical Efficiency? Evidence from Apple Production in China. Technol. Forecast. Soc. Chang. 2021, 166, 120662. [Google Scholar] [CrossRef] [Scilit]
  17. Zhang, Y.; Long, H.; Wang, M.Y.; Li, Y.; Ma, L.; Chen, K.; Zheng, Y.; Jiang, T. The Hidden Mechanism of Chemical Fertiliser Overuse in Rural China. Habitat Int. 2020, 102, 102210. [Google Scholar] [CrossRef] [Scilit]
  18. Wu, Y.; Xi, X.; Tang, X.; Luo, D.; Gu, B.; Lam, S.K.; Vitousek, P.M.; Chen, D. Policy Distortions, Farm Size, and the Overuse of Agricultural Chemicals in China. Proc. Natl. Acad. Sci. USA 2018, 115, 7010–7015. [Google Scholar] [CrossRef] [Scilit] [PubMed]
  19. Zhang, L.; Pang, J.; Chen, X.; Lu, Z. Carbon Emissions, Energy Consumption and Economic Growth: Evidence from the Agricultural Sector of China’s Main Grain-Producing Areas. Sci. Total Environ. 2019, 665, 1017–1025. [Google Scholar] [CrossRef] [Scilit] [PubMed]
  20. Tröster, M.F.; Sauer, J. Characteristics of Cost-Efficient Fertilization Plans at the Farm Level. NJAS Impact Agric. Life Sci. 2022, 94, 184–216. [Google Scholar] [CrossRef] [Scilit]
  21. Jiang, L.; Chen, X.; Meng, L.; Zhang, G.; Pan, Z.; An, P. Increased Grain Production of Cultivated Land by Closing the Existing Cropping Intensity Gap in Southern China. Food Secur. 2021, 13, 385–398. [Google Scholar] [CrossRef] [Scilit]
  22. Struik, P.C.; Kuyper, T.W. Sustainable Intensification in Agriculture: The Richer Shade of Green. A Review. Agron. Sustain. Dev. 2017, 37, 39. [Google Scholar] [CrossRef] [Scilit]
  23. Ahvo, A.; Heino, M.; Sandström, V.; Chrisendo, D.; Jalava, M.; Kummu, M. Agricultural Input Shocks Affect Crop Yields More in the High-Yielding Areas of the World. Nat. Food. 2023, 4, 1037–1046. [Google Scholar] [CrossRef] [Scilit] [PubMed]
  24. Jiang, Z.; Zheng, H.; Xing, B. Environmental Life Cycle Assessment of Wheat Production Using Chemical Fertilizer, Manure Compost, and Biochar-Amended Manure Compost Strategies. Sci. Total Environ. 2021, 760, 143342. [Google Scholar] [CrossRef] [Scilit] [PubMed]
  25. He, G.; Liu, X.; Cui, Z. Achieving Global Food Security by Focusing on Nitrogen Efficiency Potentials and Local Production. Glob. Food Secur. 2021, 29, 100536. [Google Scholar] [CrossRef] [Scilit]
  26. Tian, S.; Xu, Y.; Wang, Q.; Zhang, Y.; Yuan, X.; Ma, Q.; Feng, X.; Ma, H.; Liu, J.; Liu, C.; et al. The Effect of Optimizing Chemical Fertilizers Consumption Structure to Promote Environmental Protection, Crop Yield and Reduce Greenhouse Gases Emission in China. Sci. Total Environ. 2023, 857, 159349. [Google Scholar] [CrossRef] [Scilit] [PubMed]
  27. Dong, K.; Prytherch, M.; McElwee, L.; Kim, P.; Blanchette, J.; Hass, R. China’s Food Security: Key Challenges and Emerging Policy Responses; Center for Strategic and International Studies: Washington, DC, USA, 2024; Available online: https://www.strategicstudyindia.com/2024/03/chinas-food-security-key-challenges-and.html (accessed on 13 June 2025).
  28. Zhang, Y.; Lu, S. Food Politics in China: How Strengthened Accountability Enhances Food Security. Food Policy 2024, 128, 102692. [Google Scholar] [CrossRef] [Scilit]
  29. Zhong, T.; Crush, J.; Si, Z.; Scott, S. The Nanjing Model: Comprehensive Food System Governance, Localization and Urban Food Security in China. Glob. Food Secur. 2023, 38, 100709. [Google Scholar] [CrossRef] [Scilit]
  30. Huang, Y.; Yang, Y.; Xiong, Z. The Synergy of Fertilizer and Pesticide Reductionin China: Measurement and Driving Factors. Pol. J. Environ. Stud. 2024, 33, 3665–3675. [Google Scholar] [CrossRef] [Scilit]
  31. Huang, Q.; Tang, S.; Fan, X.; Huang, J.; Yi, Q.; Zhang, M.; Pang, Y.; Huang, X.; Li, P.; Fu, H. Higher Economic Benefits and Changes in Soil Fertility Due to Intensifying Winter Crop Rotation in Double-Rice Cropping Systems. Appl. Soil Ecol. 2021, 157, 103773. [Google Scholar] [CrossRef] [Scilit]
  32. Yan, H.; Liu, F.; Niu, Z.; Gu, F.; Yang, Y. Changes of Multiple Cropping in Huang-Huai-Hai Agricultural Region, China. J. Geogr. Sci. 2018, 28, 1685–1699. [Google Scholar] [CrossRef] [Scilit]
  33. Lin, S.; Yu, F.; Dai, M. Will Fertilizer “Zero-Growth” Poicy Affect Food Security: RD Test Based on Quasi-Natural Experiment. China Soft Sci. 2024, 1, 12–23. (In Chinese) [Google Scholar]
  34. Jiang, T. Mediating Effect and Moderating Effects in Causal Inference. China Ind. Econ. 2022, 5, 100–120. (In Chinese) [Google Scholar] [CrossRef]
  35. Cassman, K.G.; Grassini, P. A Global Perspective on Sustainable Intensification Research. Nat. Sustain. 2020, 3, 262–268. [Google Scholar] [CrossRef] [Scilit]
  36. Pan, J.; Chen, Y.; Zhang, Y.; Chen, M.; Fennell, S.; Luan, B.; Wang, F.; Meng, D.; Liu, Y.; Jiao, L.; et al. Spatial-Temporal Dynamics of Grain Yield and the Potential Driving Factors at the County Level in China. J. Clean. Prod. 2020, 255, 120312. [Google Scholar] [CrossRef] [Scilit]
  37. Zhang, Y.; Lei, M.; Lan, X.; Zhang, X.; Fan, S.; Gao, J. The Multiple Effects of Farmland Infrastructure Investment on Agrifood Systems in China—An Interdisciplinary Model Analysis. China Agric. Econ. Rev. 2024, 16, 320–339. [Google Scholar] [CrossRef] [Scilit]
  38. Li, Y.; Xie, X.; Liu, G.; Xu, D. How Does the Improvement of Farmers’ Financial Literacy Affect Food Production? Analysis of Behavior and Constraints Based on Element Substitution and Planting Structure Adjustment. Food Secur. 2024, 16, 721–733. [Google Scholar] [CrossRef] [Scilit]
  39. Sun, Y.; Xie, L.; Huang, M.; Hu, R. Understanding Multi-Disaster Impacts on China’s Grain Production for Food Security: An XGBoost-SHAP Approach. Food Energy Secur. 2026, 15, e70237. [Google Scholar] [CrossRef] [Scilit]
  40. Zhou, Z.; A, Z.; Qu, L.; Cao, Z.; Zhang, Y.; Zhao, D. Enhancing Agricultural Production and Environmental Benefits through Full Mechanization: Experimental Evidence from China. Habitat Int. 2025, 157, 103332. [Google Scholar] [CrossRef] [Scilit]
  41. Wang, W.; Huang, Z.; Fu, Z.; Jia, L.; Li, Q.; Song, J. Impact of Digital Technology Adoption on Technological Innovation in Grain Production. J. Innov. Knowl. 2024, 9, 100520. [Google Scholar] [CrossRef] [Scilit]
  42. Yin, G.; You, Y.; Han, X.; Chen, D. The Effect of Agricultural Scale Management on Farmers’ Income from a Dual-Scale Perspective: Evidence from Rural China. Int. Rev. Econ. Financ. 2024, 94, 103372. [Google Scholar] [CrossRef] [Scilit]
  43. Chen, Y.; Chen, M.; Mishra, A.K. Subsidies under Uncertainty: Modeling of Input- and Output-Oriented Policies. Econ. Model. 2020, 85, 39–56. [Google Scholar] [CrossRef] [Scilit]
  44. Minviel, J.J.; Latruffe, L. Effect of Public Subsidies on Farm Technical Efficiency: A Meta-Analysis of Empirical Results. Appl. Econ. 2017, 49, 213–226. [Google Scholar] [CrossRef] [Scilit]
  45. Huang, W.; Mishra, A.K. Understanding Agricultural Subsidies and Factor Allocation: A General Equilibrium Analysis. Econ. Model. 2025, 153, 107340. [Google Scholar] [CrossRef] [Scilit]
  46. Wu, X. From Assimilation to Autonomy: Realizing Ethnic Minority Rights in China’s National Autonomous Regions. Chin. J. Int. Law 2014, 13, 55–90. [Google Scholar] [CrossRef] [Scilit]
  47. Cao, N.; Sun, P.; Luo, H.; Gao, X. The Impact of Urban Shrinkage on Agricultural Production Efficiency—A Case Study of the Lower Yellow River Region in China. J. Rural Stud. 2025, 119, 103755. [Google Scholar] [CrossRef] [Scilit]
  48. Liu, J.; Yang, T.; Zou, J.; Wu, L.; Bao, X.; Zhang, B. Effects of Reduced Nitrogen Fertilizer Application Rates on Grain Yield and Rice Quality of Early- and Late-Season Dual-Use Rice in South China. J. Agric. Sci. 2025, 163, 99–109. [Google Scholar] [CrossRef] [Scilit]
  49. Zhang, D.; Wang, H.; Pan, J.; Luo, J.; Liu, J.; Gu, B.; Liu, S.; Zhai, L.; Lindsey, S.; Zhang, Y.; et al. Nitrogen Application Rates Need to Be Reduced for Half of the Rice Paddy Fields in China. Agric. Ecosyst. Environ. 2018, 265, 8–14. [Google Scholar] [CrossRef] [Scilit]
  50. Cai, S.; Zhao, X.; Pittelkow, C.M.; Fan, M.; Zhang, X.; Yan, X. Optimal Nitrogen Rate Strategy for Sustainable Rice Production in China. Nature 2023, 615, 73–79. [Google Scholar] [CrossRef] [Scilit] [PubMed]
  51. Fu, Y.; Zhong, X.; Zeng, J.; Liang, K.; Pan, J.; Xin, Y.; Liu, Y.; Hu, X.; Peng, B.; Chen, R.; et al. Improving Grain Yield, Nitrogen Use Efficiency and Radiation Use Efficiency by Dense Planting, with Delayed and Reduced Nitrogen Application, in Double Cropping Rice in South China. J. Integr. Agric. 2021, 20, 565–580. [Google Scholar] [CrossRef] [Scilit]
  52. Ju, C.; Zhu, Y.; Liu, T.; Sun, C. The Effect of Nitrogen Reduction at Different Stages on Grain Yield and Nitrogen Use Efficiency for Nitrogen Efficient Rice Varieties. Agronomy 2021, 11, 462. [Google Scholar] [CrossRef] [Scilit]
  53. Xiong, C.; Zhao, X. Impacts of Chemical Fertilizer Reduction on Grain Yield: A Case Study of China. PLoS ONE 2024, 19, e0298600. [Google Scholar] [CrossRef] [Scilit] [PubMed]
  54. Li, Y.; Zhang, W.; Ma, L.; Huang, G.; Oenema, O.; Zhang, F.; Dou, Z. An Analysis of China’s Fertilizer Policies: Impacts on the Industry, Food Security, and the Environment. J. Environ. Qual. 2013, 42, 972–981. [Google Scholar] [CrossRef] [Scilit] [PubMed]
  55. Ni, B.; Liu, M.; Lü, S.; Xie, L.; Wang, Y. Environmentally Friendly Slow-Release Nitrogen Fertilizer. J. Agric. Food Chem. 2011, 59, 10169–10175. [Google Scholar] [CrossRef] [Scilit] [PubMed]
  56. Huang, L.; Cheng, S.; Liu, H.; Zhao, Z.; Wei, S.; Sun, S. Effects of Nitrogen Reduction Combined with Organic Fertilizer on Growth and Nitrogen Fate in Banana at Seedling Stage. Environ. Res. 2022, 214, 113826. [Google Scholar] [CrossRef] [Scilit] [PubMed]
  57. Youngberg, G.; DeMuth, S.P. Organic Agriculture in the United States: A 30-Year Retrospective. Renew. Agric. Food Syst. 2013, 28, 294–328. [Google Scholar] [CrossRef] [Scilit]
  58. Toma, E.; Stoicea, P.; Dobre, C.; Iorga, A. The Effect of Eco-Scheme Support on Romanian Farms—A Gini Index Decomposition by Income Source at Farm Level. Agriculture 2023, 13, 1656. [Google Scholar] [CrossRef] [Scilit]
  59. Stuart, A.M.; Devkota, K.P.; Sato, T.; Pame, A.R.P.; Balingbing, C.; My Phung, N.T.; Kieu, N.T.; Hieu, P.T.M.; Long, T.H.; Beebout, S.; et al. On-Farm Assessment of Different Rice Crop Management Practices in the Mekong Delta, Vietnam, Using Sustainability Performance Indicators. Field Crops Res. 2018, 229, 103–114. [Google Scholar] [CrossRef] [Scilit]
  60. Hu, X.; Dong, C.; Zhang, Y. Impacts of Cropland Utilization Patterns on the Sustainable Use Efficiency of Cropland Based on the Human–Land Perspective. Land 2024, 13, 863. [Google Scholar] [CrossRef] [Scilit]
  61. Wang, S.; Wu, H.; Li, J.; Xiao, Q.; Li, J. Assessment of the Effect of the Main Grain-Producing Areas Policy on China’s Food Security. Foods 2024, 13, 654. [Google Scholar] [CrossRef] [Scilit] [PubMed]
  62. Zhang, D.; Wang, H.; Lou, S. Research on Grain Production Efficiency in China’s Main Grain-Producing Areas from the Perspective of Grain Subsidy. Environ. Technol. Innov. 2021, 22, 101530. [Google Scholar] [CrossRef] [Scilit]
  63. Zhang, Y.; Li, X.; Shi, T.; Li, H.; Zhai, L. Understanding Cropland Abandonment from Economics within a Representative Village and Its Empirical Analysis in Chinese Mountainous Areas. Land Use Policy 2023, 133, 106876. [Google Scholar] [CrossRef] [Scilit]
  64. Song, H.; Li, X.; Zhang, F.; Gu, P.; Chen, Y.; Wu, H.; Xin, L.; Lu, Y.; Liu, Y.; Wang, X. Understanding the Spatial Distribution Patterns and Dominant Determinants of Farmland Abandonment in China. Habitat Int. 2025, 156, 103298. [Google Scholar] [CrossRef] [Scilit]
Figure 1. Distribution of pilot provinces and non-pilot provinces. Notes: This figure is produced using the standard map with the approval number GS (2023) 2767 from the Ministry of Natural Resources.
Sustainability 18 06763 g001
Figure 2. Analytical framework.
Sustainability 18 06763 g002
Figure 3. Event study on parallel trends and dynamic impacts of the Zero-Growth policy. Notes: Exclude the period before policy implementation as the base period for parallel trend testing. Each vertical line corresponding to a year represents the 95% confidence interval of the estimated coefficient of the policy effect for that year. The red dot line marks the timing of the policy implementation, separating the pre-treatment periods (to its left) from the post-treatment periods (to its right). A joint F-test on all pre-treatment coefficients fails to reject the null hypothesis of parallel pre-trends (F = 0.86, p = 0.552).
Sustainability 18 06763 g003
Figure 4. Event study with 2014 as the baseline period: robustness check for anticipation effects. Notes: Event time t = −2 (i.e., 2014, indicated by the hollow circle) is set as the baseline period, with its coefficient normalized to zero. The red dot line marks the timing of the policy implementation, separating the pre-treatment periods (to its left) from the post-treatment periods (to its right). The vertical bars denote the corresponding 95% confidence intervals, and the red dashed line marks the timing of policy implementation.
Sustainability 18 06763 g004
Figure 5. Result of the Placebo test. Notes: The black dots represent the p-values of the policy-related estimated coefficients from each of the 500 random placebo simulations. The black curve is the kernel density estimation of these coefficients. The horizontal axis denotes their simulated values via the placebo method.
Sustainability 18 06763 g005
Table 1. Descriptive statistics of variables.
VariablesAll Sample Pilot ProvincesNonpilot Provinces
(N = 465) (N = 255)(N = 210)
MeanSDMaxMinMeanSDMeanSD
(1)(2)(3)(4)(5)(6)(7)(8)
lnGrainProduction7.021.328.973.367.680.876.231.33
Policy0.260.441.000.000.470.500.000.00
lninvest3.611.527.19−1.204.121.132.971.71
structure0.290.221.010.020.230.200.360.22
disaster0.020.010.070.000.020.010.020.02
lnmachine7.611.109.404.618.160.736.951.15
lnincome9.260.5510.468.039.170.499.360.60
ln(land per worker)7.413.9329.362.097.614.577.172.95
lnsubsidy5.980.727.213.656.170.625.740.76
Table 2. Baseline regression results.
Dependent VariablelnGrainProduction
(1)(2)(3)(4)(5)(6)(7)(8)
Policy0.157 *0.143 *0.105 **0.110 **0.098 **0.103 **0.101 **0.097 ***
(0.082)(0.077)(0.049)(0.048)(0.044)(0.046)(0.042)(0.033)
lninvest 0.024 ***0.024 **0.026 ***0.023 ***0.017 **0.013 *0.009
(0.009)(0.010)(0.008)(0.007)(0.007)(0.006)(0.006)
structure −1.130 **−1.190 **−1.164 ***−1.207 ***−1.089 ***−1.038 ***
(0.459)(0.447)(0.353)(0.337)(0.299)(0.248)
disaster −2.940 ***−2.548 ***−1.837 ***−1.961 ***−1.857 ***
(0.974)(0.639)(0.413)(0.381)(0.490)
lnmachine 0.2220.1700.1370.138 *
(0.136)(0.101)(0.087)(0.076)
lnincome 0.568 *0.626 *0.836 ***
(0.317)(0.311)(0.295)
ln(land per worker) 0.021 **0.023 ***
(0.009)(0.007)
lnsubsidy −0.291 ***
(0.089)
Constant6.938 ***6.668 ***6.955 ***7.017 ***5.272 ***0.9700.6220.357
(0.034)(0.101)(0.133)(0.126)(0.960)(3.168)(3.039)(2.556)
Provincial-fixed effectYesYesYesYesYesYesYesYes
Year-fixed effectYesYesYesYesYesYesYesYes
R-squared0.1560.1910.4250.4620.5250.5540.5880.640
Observations465.000465.000434.000434.000434.000434.000434.000434.000
Notes: Standard errors are clustered at the province level. The parentheses are the robust standard error and * p < 0.1, ** p < 0.05, *** p < 0.01. To mitigate potential mechanical endogeneity issues, one-period lagged values are adopted for the structural variables.
Table 3. Small-cluster robustness check using wild cluster bootstrap.
VariableCoefficientClustered SEConventional p-ValueWild Bootstrap p-Value95% Bootstrap CI
Policy0.0970.0340.0060.0156[0.0204, 0.1723]
Notes: This table reports inference based on the wild cluster bootstrap-t procedure for the key explanatory variable policy (or did) in the baseline regression. Bootstrap clustering is conducted at the province level (id) with 9999 replications and Rademacher weights.
Table 4. Robustness testing results.
Dependent VariablelnGrainProduction
(1)(2)(3)(4)(5)
ProportionAREMsDAMsHRCPsWinsor Variables
Policy0.034 **0.100 *0.068 ***0.103 **0.093 **
(0.014)(0.037)(0.021)(0.046)(0.030)
Constant2.932 ***0.0535.512 ***0.5141.176
(0.600)(3.000)(1.246)(2.318)(2.227)
Control variableYesYesYesYesYes
Provincial-fixed effectYesYesYesYesYes
Year-fixed effectYesYesYesYesYes
R-squared0.5430.6480.5590.6650.649
Observations434.000364.000378.000364.000434.000
Notes: Standard errors are clustered at the province level. The parentheses are the robust standard error and * p < 0.1, ** p < 0.05, *** p < 0.01.
Table 5. Analysis of policy path mechanism. Decomposition of the production effect: yield and grain sown area.
Dependent Variablelnpergrainlngrain_sow_area
(1)(2)
Policy0.0130.095 ***
(0.021)(0.025)
Control variableYesYes
Constant9.370 ***0.711
(0.816)(2.024)
Provincial-fixed effectYesYes
Year-fixed effectYesYes
R-square0.6100.774
Observations434.000434.000
Notes: Standard errors are clustered at the province level. The parentheses are the robust standard error and * p < 0.1, ** p < 0.05, *** p < 0.01.
Table 6. Analysis of policy path mechanism. Decomposition of the production effect: land use and cropping intensity.
Dependent Variablelncrop_sow_arealncultivated_landReplantIndexGrainSownRatio
(1)(2)(3)(4)
Policy0.067 **0.0090.059 *0.019 *
(0.025)(0.025)(0.031)(0.010)
Control variableYesYesYesYes
Constant0.2568.657 ***−0.3641.415 *
(1.784)(1.203)(1.127)(0.451)
Provincial-fixed effectYesYesYesYes
Year-fixed effectYesYesYesYes
R-square0.7250.1910.5490.642
Observations434.000434.000434.000434.000
Notes: Standard errors are clustered at the province level. The parentheses are the robust standard error and * p < 0.1, ** p < 0.05, *** p < 0.01.
Table 7. Analysis of heterogeneity.
Dependent VariablelnGrainProduction
(1)(2)(3)
Main Grain Production AreasNon-Main Grain Production AreasFull Sample
Policy0.063 **0.137 **0.077 **
(0.023)(0.057)(0.029)
Policy × NonMain 0.072 *
(0.041)
Control variableYesYesYes
Constant5.902 ***−1.6301.124
(1.598)(3.155)(2.192)
Provincial-fixed effectYesYesYes
Year-fixed effectYesYesYes
R-square0.8090.6340.651
Observations182.000252.000434.000
Notes: Standard errors are clustered at the province level. The parentheses are the robust standard error and * p < 0.1, ** p < 0.05, *** p < 0.01. As a provincial time-invariant covariate, NonMain’s main effect is absorbed by provincial fixed effects and omitted from the results.
Disclaimer/Publisher’s Note: The statements, opinions and data contained in all publications are solely those of the individual author(s) and contributor(s) and not of MDPI and/or the editor(s). MDPI and/or the editor(s) disclaim responsibility for any injury to people or property resulting from any ideas, methods, instructions or products referred to in the content.