


Abstract
The Ningxia Yellow River Urban Agglomeration, located in the ecologically fragile arid and semi-arid zone of the upper Yellow River, serves as a critical spatial carrier for maintaining the ecological security of the Yellow River Basin and supporting the regional economy and population agglomeration in Ningxia. Driven by rapid urbanization, intensified human–land conflicts have induced widespread ecological degradation and unbalanced water–soil resource allocation across the region. Based on land use data from 2010, 2015, 2020 and 2023, we applied the land use transition matrix, land use dynamic degree and standard deviational ellipse to characterize the spatiotemporal patterns of spatial expansion of the Ningxia Yellow River Urban Agglomeration over the past decade. The Patch-generating Land Use Simulation (PLUS) model was further employed to predict the land use demand and spatial distribution of the study area under diverse scenarios in 2035. The research results reveal three key findings. First, grassland, cropland and unused land constitute the dominant land use types across the study region, jointly occupying more than 90% of the total territorial area. Over the past decade, regional land use has undergone noticeable changes: grassland area has continuously declined, cropland and built-up land have sustained steady expansion, and water areas have experienced a mild reduction. Land use conversions mainly occur among grassland, cropland and built-up land. Second, driving factors vary substantially in their spatial contributions to the expansion of different land use types. The spatial growth of cropland and built-up land is comprehensively shaped by terrain conditions, economic development and transportation location superiority. In comparison, the distribution and dynamic changes in forestland, grassland and water areas are predominantly restricted by natural elements, including precipitation, temperature and soil characteristics. Third, multi-scenario simulation results verify that differentiated territorial spatial planning and regulatory policies profoundly affect the evolutionary trajectory of regional territorial patterns. The natural development scenario experienced the most intensive expansion of built-up land, with a newly increased area of 181.11 km2. The ecological protection scenario can effectively curb the loss of ecological land and minimize the shrinkage of grassland resources. The cropland protection scenario is conducive to stabilizing cropland scale to the greatest extent and restraining the disorderly sprawl of urban land. The sustainable development scenario realizes coordinated and balanced changes in all land use types and delivers mutually beneficial progress between regional ecological conservation and socioeconomic development.
1. Introduction
Against the backdrop of accelerated global climate change, mismatched supply and demand of land resources, and intensified human–land contradictions, balancing urban expansion and ecological protection has become a universal challenge for countries worldwide. The spatial evolution and targeted governance of ecologically fragile arid and semi-arid regions represent a core research hotspot in the fields of land science and ecological geography. As a typical ecologically sensitive and human–land vulnerable zone, the arid inland of Asia features low precipitation and fragile ecological carrying capacity. Urban construction and land exploitation in this region easily trigger long-term ecological problems, including ecosystem degradation and water–soil resource imbalance. Dynamic shifts in land use patterns substantially determine regional ecological security and sustainable development prospects [1,2,3,4]. China’s urbanization is currently in a high-quality transformation stage. Rapid urbanization and industrialization continuously reshape the country’s territorial spatial structure, accompanied by prominent problems such as unregulated land expansion, shrinking ecological space, and unreasonable resource allocation. In this context, territorial spatial governance and human–land coordination have become core priorities of national spatial planning in the new era. As an advanced spatial organization form of urbanization, urban agglomerations serve as strategic hubs for global competition, core carriers of China’s new-type urbanization, and key drivers of regional high-quality development [5]. As China advances the construction of the dual-circulation development pattern, the philosophy of territorial spatial governance is undergoing a fundamental shift from scale-oriented incremental expansion to efficiency-oriented refined governance. Accordingly, the development of urban agglomerations no longer relies on blind land expansion but focuses on stock optimization and quality upgrading, aiming to coordinate economic growth, social progress, and ecological conservation within limited territorial resources. Therefore, systematically exploring the spatiotemporal evolution of land use in urban agglomerations and identifying the driving mechanisms behind land use changes in depth is of great practical significance for optimizing regional territorial spatial patterns and promoting high-quality regional development.
Currently, global scholars have established a systematic research framework for examining the spatiotemporal evolution of territorial spatial patterns. Existing studies predominantly focus on three interrelated themes: spatiotemporal evolution and pattern analysis of land-use change, the underlying driving mechanisms of land-use transformation, and multi-scenario simulation and predictive modeling. These studies cover multiple spatial scales, ranging from provincial and watershed levels to urban agglomerations and municipal jurisdictions. Scholars such as Bian Rui and Wei Le have systematically investigated land-use evolution, associated eco-environmental responses, and multi-scenario simulations in several key urban agglomerations, including the Hohhot–Baotou–Ordos–Yulin, Lanzhou–Xining, Guanzhong Plain, and Chengdu–Chongqing regions [1,2,3,6,7,8]. In terms of methodology, researchers widely integrate remote sensing (RS) and geographic information system (GIS) technologies with mathematical statistics and spatial econometric methods to quantitatively examine temporal variations in land use structure and spatial differentiation patterns [3,4,9,10]. A range of modeling techniques, including multiple regression, system dynamics, grey prediction, Markov chains, CLUE-S, and FLUS, have been extensively adopted for multi-scenario land use simulation and forecasting [10,11,12,13,14,15,16]. Nevertheless, these conventional models present notable limitations, such as distorted patch-level simulation results and insufficient accuracy in quantifying the relative contributions of underlying driving factors. The PLUS model, developed from the FLUS framework, is a high-precision land use simulation tool operating at the raster scale. It adopts the Land Expansion Analysis Strategy (LEAS) and the CA-based random patch seeding (CARS) mechanism, which enables it to accurately quantify the relative contributions of diverse driving factors and conduct fine-grained simulations at the patch level. This model outperforms conventional approaches in simulation accuracy and has gained extensive application in current research [7,16,17]. In terms of driving mechanisms, scholars including Zhu Xiaoyu and Hu Rongfei have explored key factors shaping land use configurations, which are generally divided into natural and socioeconomic categories [14,15,18]. Focusing on the Ningxia Yellow River Urban Agglomeration, Ma Caihong, Lyu Wenqing and other researchers have carried out relevant investigations from multiple perspectives, such as production–living–ecological spatial patterns, ecological land distribution and the evolutionary characteristics of carbon storage [19,20,21,22,23,24]. Although the previous literature has laid a solid theoretical basis for the present study, systematic explorations concerning its long-term continuous spatiotemporal dynamics, quantitative assessment of human–land coupling mechanisms, and territorial spatial simulations under multi-policy scenarios remain inadequate. Such research gaps fail to meet the practical requirements for refined territorial spatial governance and high-quality regional development.
The Yellow River Basin serves as a crucial ecological barrier in China. As the only urban agglomeration in the upper reaches of the Yellow River that is entirely situated within the basin, the Ningxia Yellow River Urban Agglomeration acts not only as a core carrier of urbanization in arid Northwest China, but also as a pivotal node for the ecological security barrier in the upper Yellow River reaches [22]. Currently, Ningxia undertakes the major mission of building a pilot zone for ecological conservation and high-quality development in the Yellow River Basin. Meanwhile, it embraces tremendous development opportunities brought by national strategies including the Belt and Road Initiative and the Western Development Program. Against this backdrop, this study takes the Ningxia Yellow River Urban Agglomeration as the research area. It systematically analyzes the spatiotemporal evolution characteristics of territorial spatial patterns since the establishment of urban agglomeration, and further clarifies the driving mechanisms of natural and human factors behind land use changes. On this basis, the PLUS model is adopted to simulate territorial spatial patterns in 2035 under four scenarios, namely natural development, ecological protection, cultivated land protection and sustainable development. The research findings can help reveal the evolutionary laws of land use in urban agglomerations during urbanization across arid and semi-arid regions. They also provide a scientific reference for territorial spatial planning formulation, ecological environmental protection and refined land resource management of the study area. Furthermore, this study offers implications for the region to better integrate into national strategies and promote coordinated, high-quality and sustainable development between ecology and economy [25].
2. Materials and Methods
2.1. Study Area
The Ningxia Yellow River Urban Agglomeration was launched in 2009 and subsequently included in the national 13th Five-Year Plan, becoming one of 19 key urban agglomerations prioritized for national development and one of six regional-level agglomerations designated for guided cultivation. Located in the northern Ningxia Hui Autonomous Region, it lies in an inland mid-latitude zone at the convergence of the Loess Plateau, the Mongolian Plateau, and the Qinghai–Tibet Plateau, serving as a crucial transitional area connecting central and western China. Bordered by the Tengger Desert to the west, the Mu Us Desert to the east, and the Ulan Buh Desert to the north [26], it features a distinctive “mountain–oasis–desert” composite geographical pattern and an arid to semi-arid climate.
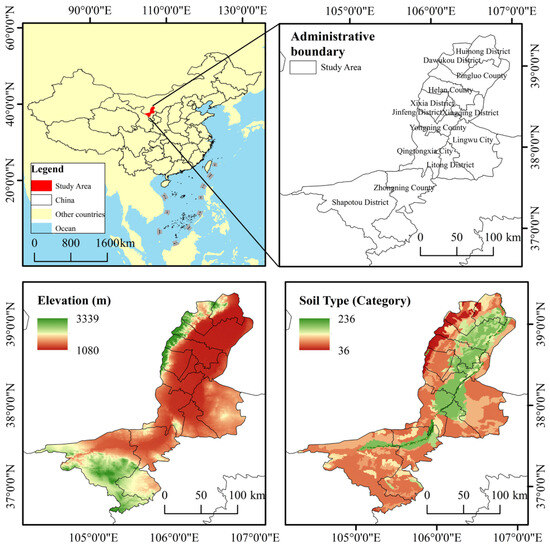
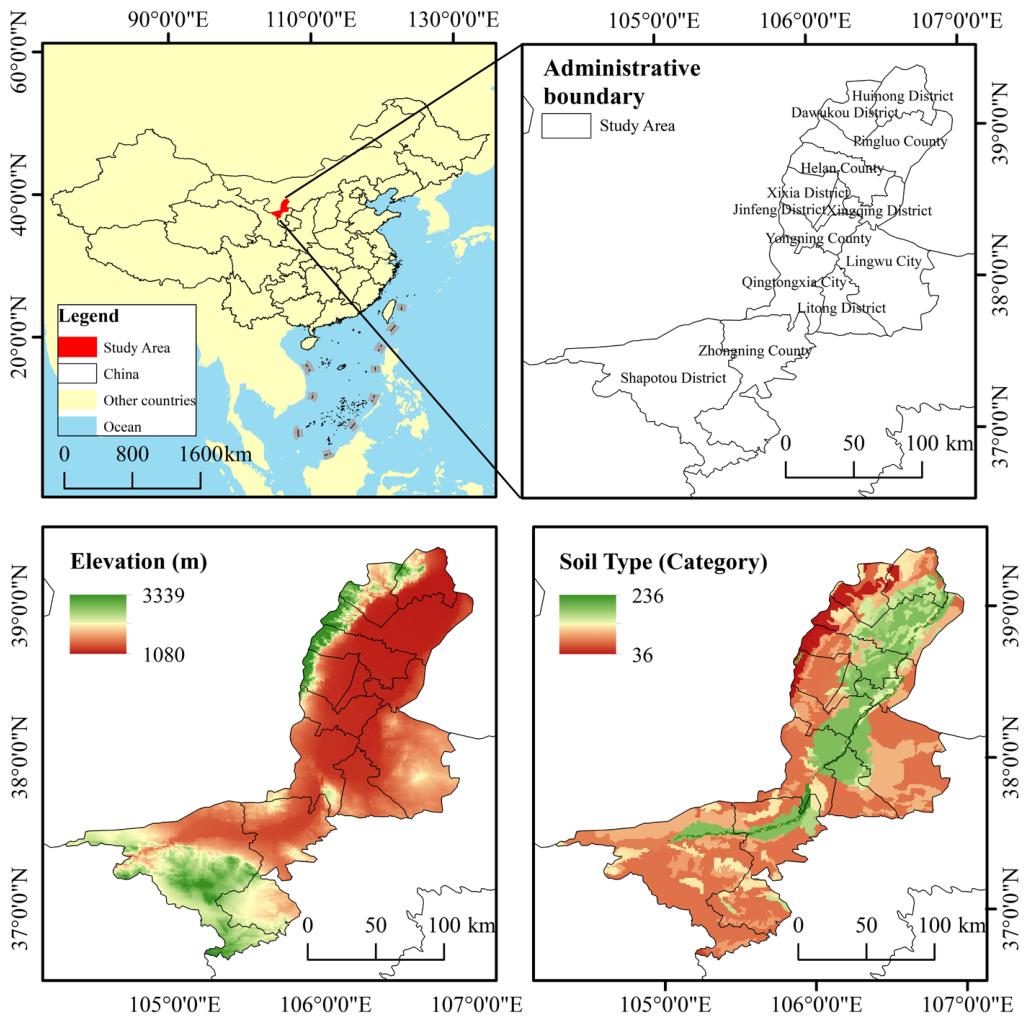
The agglomeration comprises the municipal districts of four prefecture-level cities: Yinchuan, Shizuishan, Wuzhong, and Zhongwei and six counties (county-level cities): Helan, Yongning, Lingwu, Pingluo, Qingtongxia, and Zhongning, totaling 13 county-level units [22]. While occupying only 44% of the autonomous region’s land area, it hosts 70% of its permanent resident population (including 80% of its urban population) and contributes 82% of its economic output. By the end of 2023, the permanent resident population had reached 5.109 million, with an urban population of 3.927 million, translating to a high urbanization rate of 74.37%. Over the past decade (2013–2023), the permanent resident population has increased by 864,000, with the urban population growing by 1.16 million and the urbanization rate rising by 13.16 percentage points. These trends underscore consolidated advantages for high-quality development, establishing the agglomeration as a core engine for regional economic growth and population concentration. Its sustainable development holds demonstrative significance for safeguarding regional ecological security and promoting high-quality development across the Yellow River Basin. This study took these 13 county-level units as the basic analytical units (Figure 1).
Figure 1.
Location of the study area.
2.2. Data Sources
The datasets adopted in this study mainly include land use data, climatic and environmental data, as well as socioeconomic and fundamental geographic data. The land use data are obtained from Wuhan University, which contains nine primary categories: cropland, forest, shrubland, grassland, water body, ice and snow, bare land, impervious surface and wetland. As a domestically produced land cover dataset with a 30 m resolution, it features the longest time series, highest precision and best temporal continuity among existing similar products. Combined with the local geographical conditions of Ningxia, the original land use categories were reclassified into six types: cultivated land, forest land, grassland, water area, construction land, and unused land [3,16].
Thirteen driving factors closely associated with land use patterns are selected based on the development status of the study area and previous literature. These factors include five natural environmental variables: soil type, digital elevation model (DEM), slope, annual average temperature and annual precipitation. The remaining eight are socio-economic variables covering population, GDP, and traffic network data (distances to roads at different levels, railways and rivers). In compliance with the data input specifications of the PLUS model, all datasets are unified to a spatial resolution of 30 m ×30 m and aligned with the coordinate system of land use data [7,9,17,22]. Detailed information on data sources is presented in Table 1.
Table 1.
Data Classification and Sources.
2.3. Research Methodology
- (1)
- Land Use Transfer Matrix: The land use transfer matrix is a method rooted in the Markov model, commonly used in land use change research [7]. It provides a clear representation of both the direction and magnitude of conversions among different land use types over a given period. In this study, we apply the land use transfer matrix method. The calculation formula is as follows:
- (2)
- Land use dynamics metrics: Research on land use change requires not only analyzing the quantitative fluctuations of different land use types but also exploring the mechanisms of mutual conversion between them. The land use dynamic degree is a key metric for quantifying the intensity of human impact on each land use type and characterizing its rate of change. In this paper, we employ both the single land use dynamic degree and the comprehensive land use dynamic degree to investigate the dynamic evolution trends of land use [25].
The single land use dynamic degree characterizes the changes in area, spatial distribution, and other attributes of a specific land use type over a given time period and within a defined region [28]. The formula is as follows:
where represents the land use dynamic degree; and are the areas of a given land use type at the initial and final stages, respectively; and refers to the time interval of the study period [29]. A larger value of K indicates more intense land use changes across the study area during the research period.
The comprehensive land use dynamic degree is a key metric for measuring the overall intensity and activity level of land use change across a region. It characterizes the integrated process of mutual conversion among multiple land use types, structural evolution, and spatial pattern reorganization over a given period within the entire study area. This metric emphasizes the conversion relationships between different land types (e.g., cultivated land converted to built-up land, forestland converted to grassland), the optimization or degradation of the overall structure (e.g., changes in the proportion of ecological land), and the functional evolution of the regional land use system. As such, it reflects the comprehensive rate of change across all land use types within the region [25,30]. The calculation formula is as follows:
where represents the comprehensive land use dynamic degree; refers to the area of the i-th land use type at the initial stage of the study period; denotes the absolute value of the area transferred out from the i-th land use type to other categories during the study period; and is the time interval of the research period.
- (3)
- Standard deviation ellipse. This method is commonly used to assess spatial distribution patterns of land use. It constructs an ellipse based on the standard deviation and covariance of a dataset, thereby characterizing the data distribution range. The approach reveals centroid migration paths and spatiotemporal changes in different land types across periods, expressing the central tendency, dispersion, and directional trends of geographic elements. In this study, we apply the standard deviation ellipse method to analyze the patterns and directions of land use change [4,7,30,31].
- (4)
- PLUS model. The PLUS model consists of two main modules: the Land Expansion Analysis Strategy (LEAS) and the CA-based patch generation simulation (CARS). In the LEAS module, expansion areas for each land use type are extracted from two periods of land use data and randomly sampled. These sampling points are then matched with various driving factors to build a sample dataset. A random forest classification algorithm (RFC) is used to estimate the development probability of each land use type and to quantify the contribution of each driving factor to land expansion during the study period [25]. In the CARS module, scenario-driven land use simulation is carried out. This module integrates top-down global land use demand constraints with bottom-up regional land competition characteristics. By adjusting key parameters such as land use demand, transfer matrix, and neighborhood weights under different scenarios, the model simulates and predicts both the demand for land use area and the spatial pattern of land use evolution across different time periods in the study area [5,32].
3. Analysis of Spatiotemporal Pattern Evolution Characteristics of the Ningxia Yellow River Urban Agglomeration
3.1. Analysis of Spatiotemporal Characteristics of Land Use Change
3.1.1. Analysis of Quantitative Land Use Structure
An analysis of land use data from four time points (2010, 2015, 2020 and 2023), as shown in Table 2, revealed that the land use structure of the Ningxia Yellow River Urban Agglomeration between 2010 and 2023 was consistently characterized by the following area hierarchy: grassland > cropland > unused land > construction land > water area > forestland. Grassland, cropland, and unused land remained the dominant categories, together accounting for over 90% of the total regional area throughout the study period. This pattern represented a typical outcome of human-induced land reallocation, driven by the combined forces of oasis-based economic activities, policy interventions, and rapid urbanization in an arid region.
Table 2.
Area and Proportion of Land Use Types in the Ningxia Yellow River Urban Agglomeration from 2010 to 2023.
The period from 2010 to 2023 witnessed distinct regional land use dynamics, marked by grassland-to-cropland conversion, urban expansion and water area shrinkage. This trend reflected a continuous contraction of ecological land and a rapid expansion of land for production. Specifically, grassland and water area decreased, while cropland, construction land, and unused land increased [33], along with a minor increase in forestland. As the primary land type undergoing conversion, grassland experienced a net loss of 998.57 km2, representing a decrease of 7.25%. This reduction was primarily due to its conversion into construction land and cropland. Water area shrank from 318.95 km2 to 302.98 km2, a net decrease of 15.96 km2 (or 5.0%). This decline can be attributed to the compounding environmental pressures in the arid region, including limited precipitation, soil erosion, and severe desertification, which collectively reduced available water space.
In contrast, cropland and construction land exhibited concurrent expansion. The net increase in cropland area was 648.67 km2 (a 10.39% rise), with the period from 2010 to 2020 accounting for the most significant growth—98.7% of the total increase over the 13 years. The northern Yellow River irrigation district, benefiting from favorable water and soil conditions, emerged as the primary area of cropland expansion. Construction land expanded rapidly, with a cumulative increase of 315.89 km2, marking a substantial growth of 40.43%. This trend clearly reflects the processes of rapid urbanization and industrial agglomeration. Changes in forestland and unused land were relatively modest. Forestland saw a marginal increase of 1.94 km2, while unused land increased by 48.12 km2. However, these slight gains were insufficient to counter the overarching trend of overall ecological space contraction (Table 2).
From a county-scale perspective, all counties (county-level cities and districts) within the Ningxia Yellow River Urban Agglomeration experienced varying degrees of construction land expansion, indicating robust yet spatially heterogeneous regional development. Among them, Lingwu City exhibited the most significant expansion, with its construction land area increasing by 1.18-fold. Yongning County and Litong District followed closely, both with growth exceeding 80%. The increase in Jinfeng District and Helan County surpassed 50%, while Qingtongxia City grew by approximately 48%. As key development zones within the region, these areas demonstrated rapid construction land expansion and strong urban growth momentum. Particularly, Yinchuan City, the core city of the urban agglomeration, further accentuated its spatial agglomeration effect, leading the overall regional development pattern.
In contrast, growth was more moderate in Huinong District, Xixia District, and Dawukou District. This primarily stemmed from their already high urbanization levels (exceeding 70%), where urban spatial patterns stabilized. Consequently, the expansion of construction land in these areas is gradually shifting from outward, extensive growth to inward, intensive development.
3.1.2. Analysis of Spatial Land Use Structure
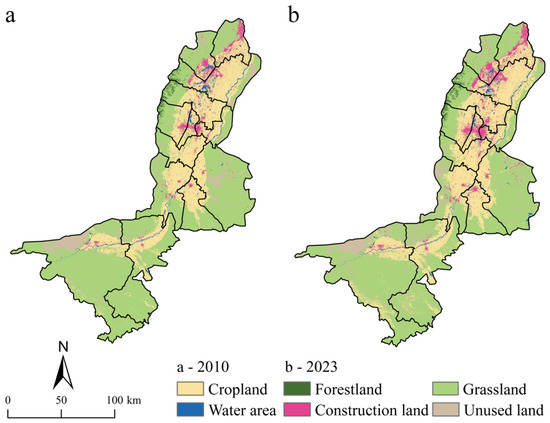
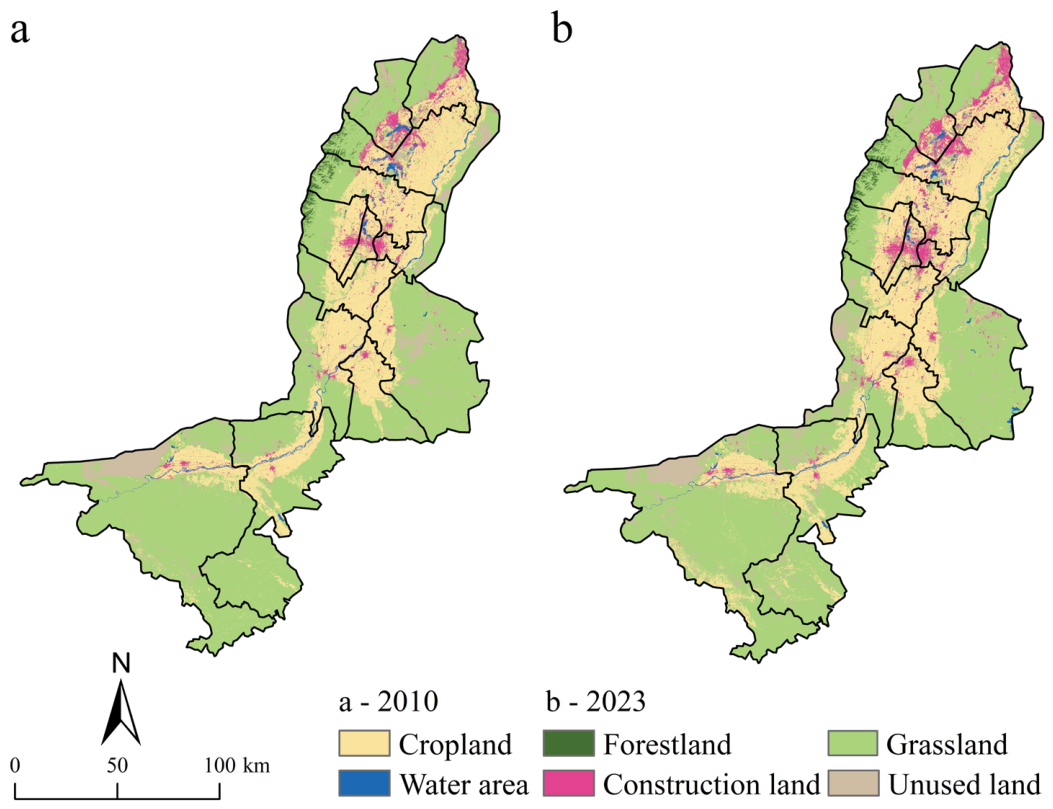
Land use in the Ningxia Yellow River Urban Agglomeration exhibited distinct spatial heterogeneity (Figure 2). Analysis showed that cropland is primarily distributed along both banks of the Yellow River, where flat terrain and gravity-fed irrigation have established this area as Ningxia’s most productive breadbasket. Grassland is the dominant land use type in the region, with the largest concentrations found in Lingwu City, Shapotou District, and Zhongning County. Forestland forms a narrow, elongated belt along the eastern slopes of the Helan Mountains. Benefiting from orographic precipitation and the cooler, more humid conditions of shaded slopes, Pingluo, Helan, and Xixia have developed a green barrier nestled between the mountains and urban areas. Water area and unused land are the most spatially fragmented. The main channel of the Yellow River traverses the region from south to north, complemented by scattered wetlands and lakes in the two major “lake cities” of Yinchuan and Shizuishan. Unused land, predominantly consisting of sandy and saline–alkali patches interspersed among the oases, is concentrated in areas such as Lingwu–Baijitan and Shapotou–Tengger Desert. Construction land displays a pattern of being dispersed overall yet locally clustered. While patches exist in all counties and districts, they are highly concentrated in the central urban areas of Yinchuan, Shizuishan, and Wuzhong, outlining the rapidly growing skeleton of the urban agglomeration.
Figure 2.
Spatial Distribution of Land Use in the Ningxia Yellow River Urban Agglomeration in 2010 and 2023.
Overall, the Yellow River flows longitudinally through the entire Ningxia Yellow River Urban Agglomeration, serving as a lifeline for cropland, water area, and urban areas. Cropland, water area, and construction land are highly concentrated within the plains adjacent to the Yellow River, forming a composite water–cropland–urban corridor. Forestland and grassland are predominantly distributed in the peripheral mountainous areas and transitional desert zones. Unused land is sporadically embedded along the edges of oases. Together, these elements constitute a belted-zonal composite structure, where multiple land use types—water area, cropland, urban, forestland, and unused land—coexist.
3.2. Analysis of Land Use Change
3.2.1. Analysis of Land Use Conversion Characteristics
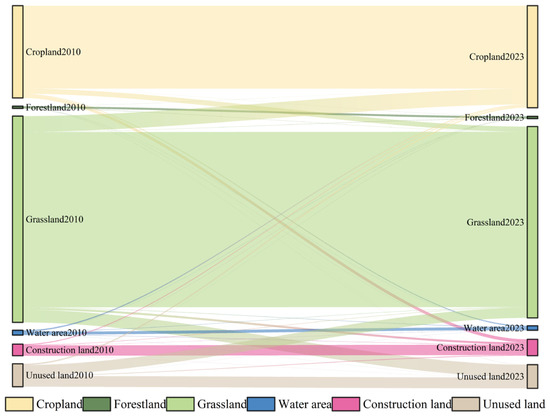
In the Ningxia Yellow River Urban Agglomeration, land use conversions are centered on the interchanges among grassland, cropland, and construction land. Grassland acted as the main source of converted land for other types, showing a net outflow. Cropland and construction land, by comparison, exhibited net inflow as their dominant feature. The main findings were as follows (Figure 3):
Figure 3.
Land Use Conversion Map of Sangshentou, 2010–2023.
- (1)
- Major Land Use Types with Net Area Loss: Grassland was the primary land type experiencing net conversion outflows in the study area, with a total net reduction of 998.65 km2. During the study period, a total of 2072.05 km2 of grassland was converted to other land types. Of this, 50.66% transitioned to cropland, 40.7% to unused land, and 6.55% to construction land. Concurrently, grassland received an inflow of 1073.39 km2 from other types, reflecting the dual effects of ecological restoration and agricultural structural adjustment. Water area experienced a net reduction of 15.96 km2, with a total outflow of 121.35 km2, primarily to cropland (for agricultural reclamation) and grassland (for ecological restoration). The inflow to the water area was 105.39 km2, mainly originating from the conversion of cropland (through wetland restoration) and grassland (via ecological transformation).
- (2)
- Major Land Use Types with Net Area Gain: Cropland area showed a net increase of 648.67 km2, characterized by dynamic features of “high inflow and high outflow.” Its total inflow (1264.93 km2) significantly exceeded its outflow (616.26 km2). Outflows from cropland were mainly found in construction land (due to urbanization) and water area (for water conservancy projects or wetland restoration). Construction land exhibited a strong “net inflow” characteristic, with a net increase of 315.89 km2. Its total inflow (407.22 km2) primarily originated from the conversion of cropland (for non-agricultural use) and grassland (for urban expansion), clearly delineating the spatial pathways of urban expansion. The area of unused land achieved a net increase of 48.12 km2. Its total transferred-out area reached 811.85 km2, which was mainly converted into grassland and cropland, while the transferred-in area was 859.97 km2. Such net area gain was primarily derived from land consolidation.
In summary, the interconversion among grassland, cropland, and construction land represents the dominant process of land use change in the Ningxia Yellow River Urban Agglomeration. Within this dynamic, grassland serves as the primary source for conversion, experiencing net loss, while cropland and construction land are characterized by net gains.
3.2.2. Analysis of Land Use Dynamics
The calculated results indicated that construction land exhibited the highest dynamic degree, reflecting a pronounced process of urban expansion within the agglomeration during the study period. In contrast, forestland and unused land showed the lowest dynamic degrees, suggesting their overall relative stability.
The dynamic evolution of various land use types displayed distinct temporal phases. For construction land, the dynamic degree was highest during the 2010–2020 period, corresponding to rapid urban spatial expansion. After 2020, the dynamic degree gradually declined, indicating effective control over the expansion momentum. Notably, while the underlying pressure for continued construction land expansion persists, a series of policy interventions emphasizing ecological conservation and cropland protection have significantly curbed disordered land use sprawl. Consequently, the pattern of territorial development and utilization in the region is progressively evolving towards a more orderly, coordinated, and sustainable trajectory. Cropland entered a phase of rapid growth from 2015 to 2020, with a dynamic degree reaching 0.6%. Concurrently, the grassland experienced its most substantial reduction. Post-2020, the rate of grassland loss slowed, and forestland maintained a slight but steady increase, highlighting the notable effects of regional ecological protection and restoration efforts. The evolution of the water area showed an overall decreasing trend after 2015, with the rate of reduction continuously accelerating.
The comprehensive land use dynamic degree serves as a key indicator for assessing the overall intensity and activity level of land use change in a region [6]. The calculation results showed that the comprehensive land use dynamic degree in the Ningxia Yellow River Urban Agglomeration was 0.63% from 2010 to 2023, indicating that the study area exhibited rapid changes in land use overall, with frequent conversions among various land types. Analyzing the phased evolution characteristics, the period from 2015 to 2020 witnessed the most intense comprehensive land use change in the study area (with a dynamic degree of 0.40%), during which both the intensity and frequency of conversions among land types peaked. From 2020 to 2023, the comprehensive dynamic degree showed a decline (0.37%), reflecting an overall slowdown in the rate of land use change. This trend suggests that, under a series of territorial space management policies, land use change is transitioning from disordered expansion to regulated management.
During the study period, the large-scale and persistent transformation of grassland to cropland and construction land enhanced the productive function of regional ecosystems. However, it significantly impaired ecosystem regulatory functions (e.g., water conservation, climate regulation, and soil and water retention) and supporting functions (e.g., biodiversity maintenance), thereby threatening the stability and security of oasis ecosystems. Furthermore, such land use transitions exerted continuous ecological pressure on the upper reaches of the Yellow River Basin. The persistent shrinkage of grassland and unchecked expansion of cropland aggravated surface bare coverage, which increased sediment transport into the Yellow River. Although the study area is located in the upper basin, the cumulative impacts of regional soil erosion substantially disrupt the water–sediment balance of the entire watershed. In addition, the sprawling expansion of urban and agricultural land has introduced excessive land-based pollutants, which enter the tributaries and mainstream of the Yellow River through surface runoff and continuously degrade basin water quality. Overall, the prevailing land use evolutionary trend conflicts with the core objectives of the Yellow River Basin’s ecological protection and high-quality development strategy. If the existing extensive development pattern continues, regional sustainable development will be severely constrained, and the ecological security of the entire Yellow River Basin will face potential long-term risks.
3.2.3. Analysis of Gravity Center Shift
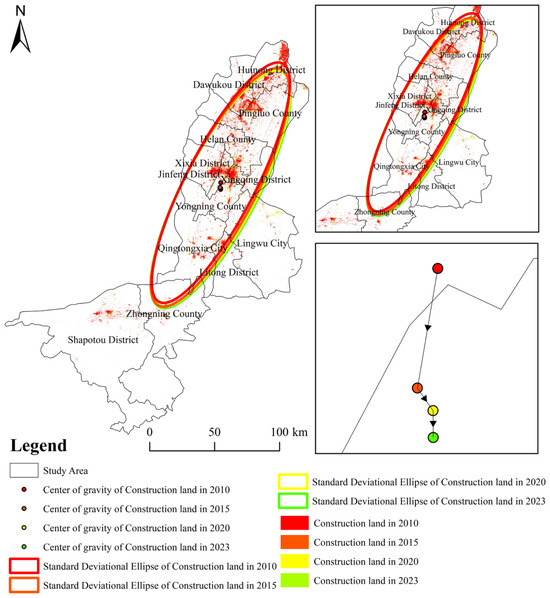
This study specifically analyzed the change in the center of gravity of construction land in the Ningxia Yellow River Urban Agglomeration from 2010 to 2023. The results (Figure 4) showed that across the three sub-periods within 2010–2023, the overall displacement of the construction land gravity center was not substantial. Its migration path exhibited a directional trend of “southwest→southeast→south,” with an overall shift toward the southwest. The respective migration distances were 3.7 km, 0.84 km, and 0.82 km, gradually converging toward the geometric center of the region. This pattern indicates accelerated development in the southern cities (e.g., Wuzhong and Zhongwei) relative to a moderate pace in the northern areas (e.g., Shizuishan City). Notably, the migration distance from 2010 to 2015 was significantly greater than in the subsequent two periods, primarily attributable to the rapid expansion of construction land area during that phase, which resulted in the most pronounced gravity center shift during this interval.
Figure 4.
Spatial Pattern of Urban Expansion in the Ningxia Yellow River Urban Agglomeration.
3.3. Analysis of Driving Mechanisms for Spatiotemporal Pattern Evolution in the Ningxia Yellow River Urban Agglomeration
The evolution of land use patterns resulted from the complex interplay of multiple driving forces, with dominant factors exhibiting significant spatial heterogeneity across regions. This process was shaped by natural conditions, socioeconomic development, and policy interventions. The Ningxia Yellow River Urban Agglomeration is located in the arid and semi-arid zone of the upper Yellow River Basin, covering the overlapping area of the Northern Sand Prevention Belt and the core ecological barrier of the upper Yellow River. This region presented distinct geomorphological stratification, with evaporation far exceeding precipitation and uneven spatiotemporal distribution of rainfall, which leads to a severe spatial mismatch between water and soil resources [19]. Restricted by inherent natural disadvantages, including water scarcity, fragile ecological conditions, and unreasonable water–soil spatial distribution, local land use patterns were strongly constrained by the drought-prone environmental background. As the core area carrying population aggregation and socioeconomic activities in Ningxia, the study area witnessed continuous population concentration in central cities and riverine plains, which drove the steady expansion of urban construction land. Economic growth, population agglomeration, and infrastructure construction collectively constitute the dominant anthropogenic factors altering regional land use structures.
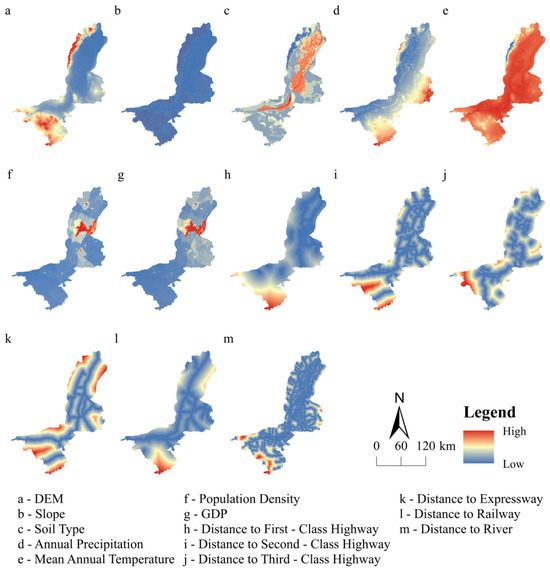
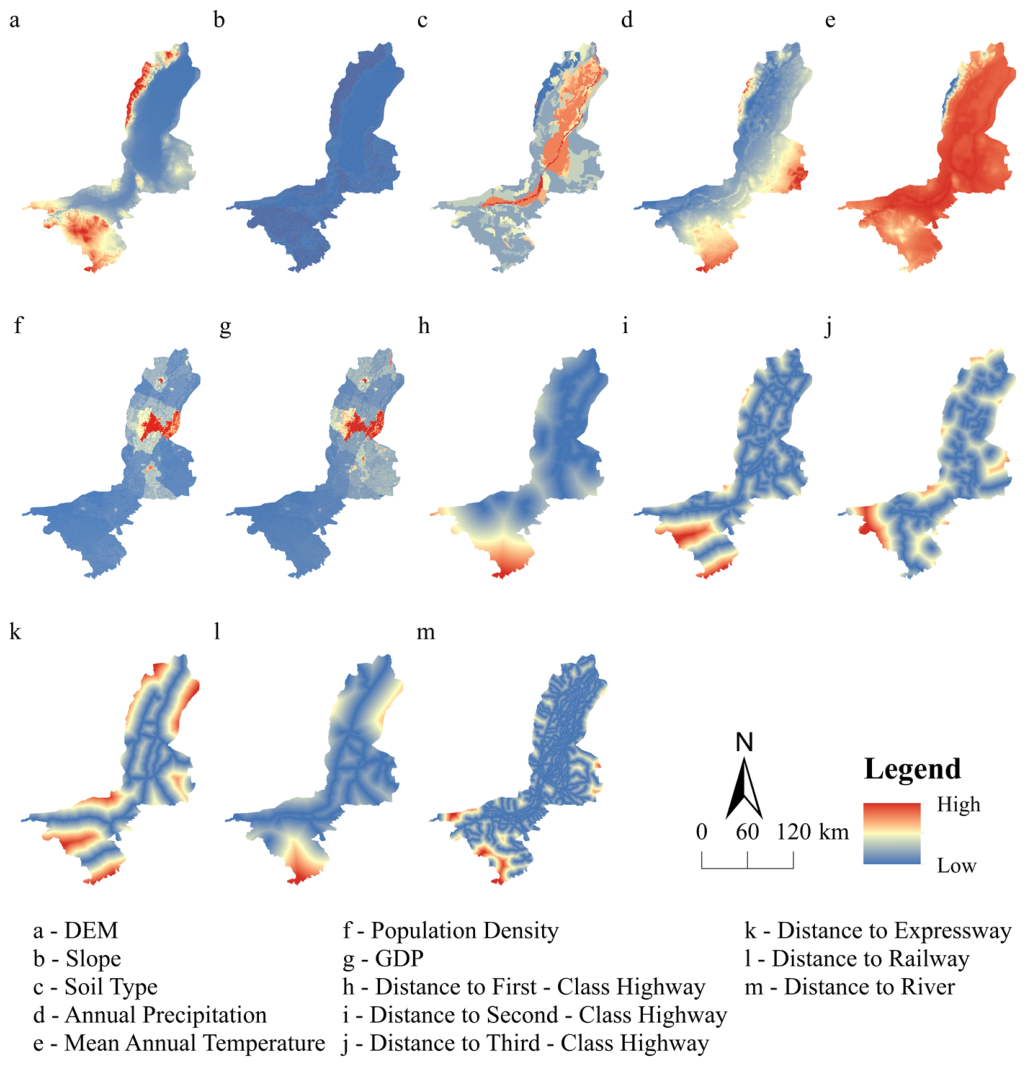
Considering the unique ecologically fragile background and socioeconomic development characteristics of the study area, this study selected driving factors based on data availability, quantifiability, and regional representativeness to avoid homogeneous indicator settings. A total of 13 factors covering natural environment, socioeconomic conditions, and traffic location (Figure 5) were adopted for the driving mechanism analysis [7,20,25].
Figure 5.
Driving Factors of Land Use Change in the Ningxia Yellow River Urban Agglomeration.
In terms of natural environmental factors, DEM and slope were utilized to characterize the topographic constraints on territorial spatial development. Soil type data were applied to identify suitable areas for cultivated land utilization, as soil properties dominate the spatial differentiation of forest and grassland distribution. Mean annual temperature and annual precipitation were selected to reflect the spatial heterogeneity of regional hydrothermal conditions and further explain how the unbalanced distribution of water and heat induces land desertification and secondary soil salinization. Regarding water resource constraints, the distance to rivers was adopted to indicate the rigid influence of water resource endowments on the spatial layout of cultivated land and urban and rural settlements in arid regions.
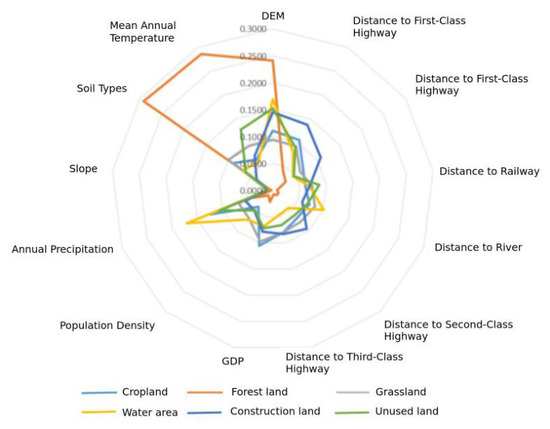
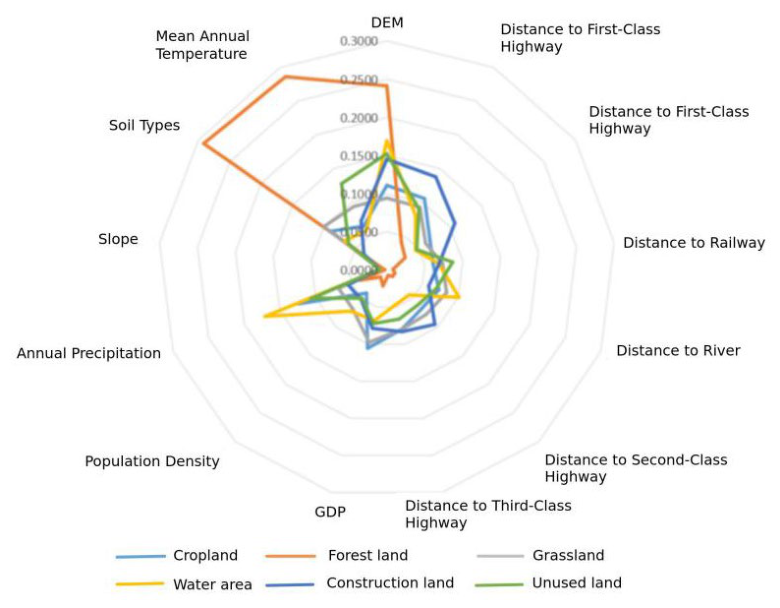
In terms of socioeconomic and locational factors, GDP and population density were employed to quantify the impacts of economic development and population aggregation on construction land expansion and cultivated land transformation. Distances to expressways, railways, and primary, secondary, and tertiary roads were also incorporated to distinguish the differential radiation effects of multi-level traffic networks on land use evolution (Figure 6). On this basis, the contributions of various driving factors to the expansion of different land use types were systematically clarified.
Figure 6.
Contribution of Driving factors to Land Use Expansion in the Ningxia Yellow River Urban Agglomeration, 2010–2023.
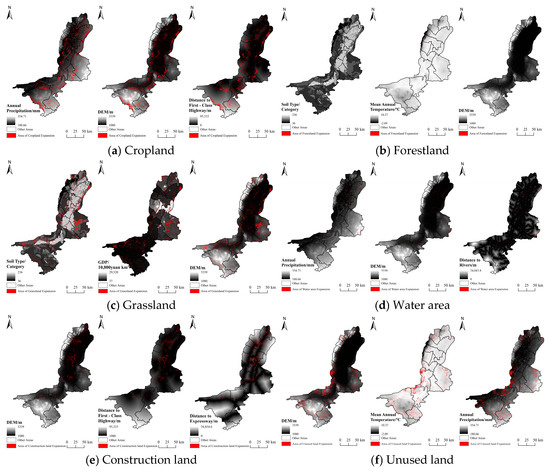
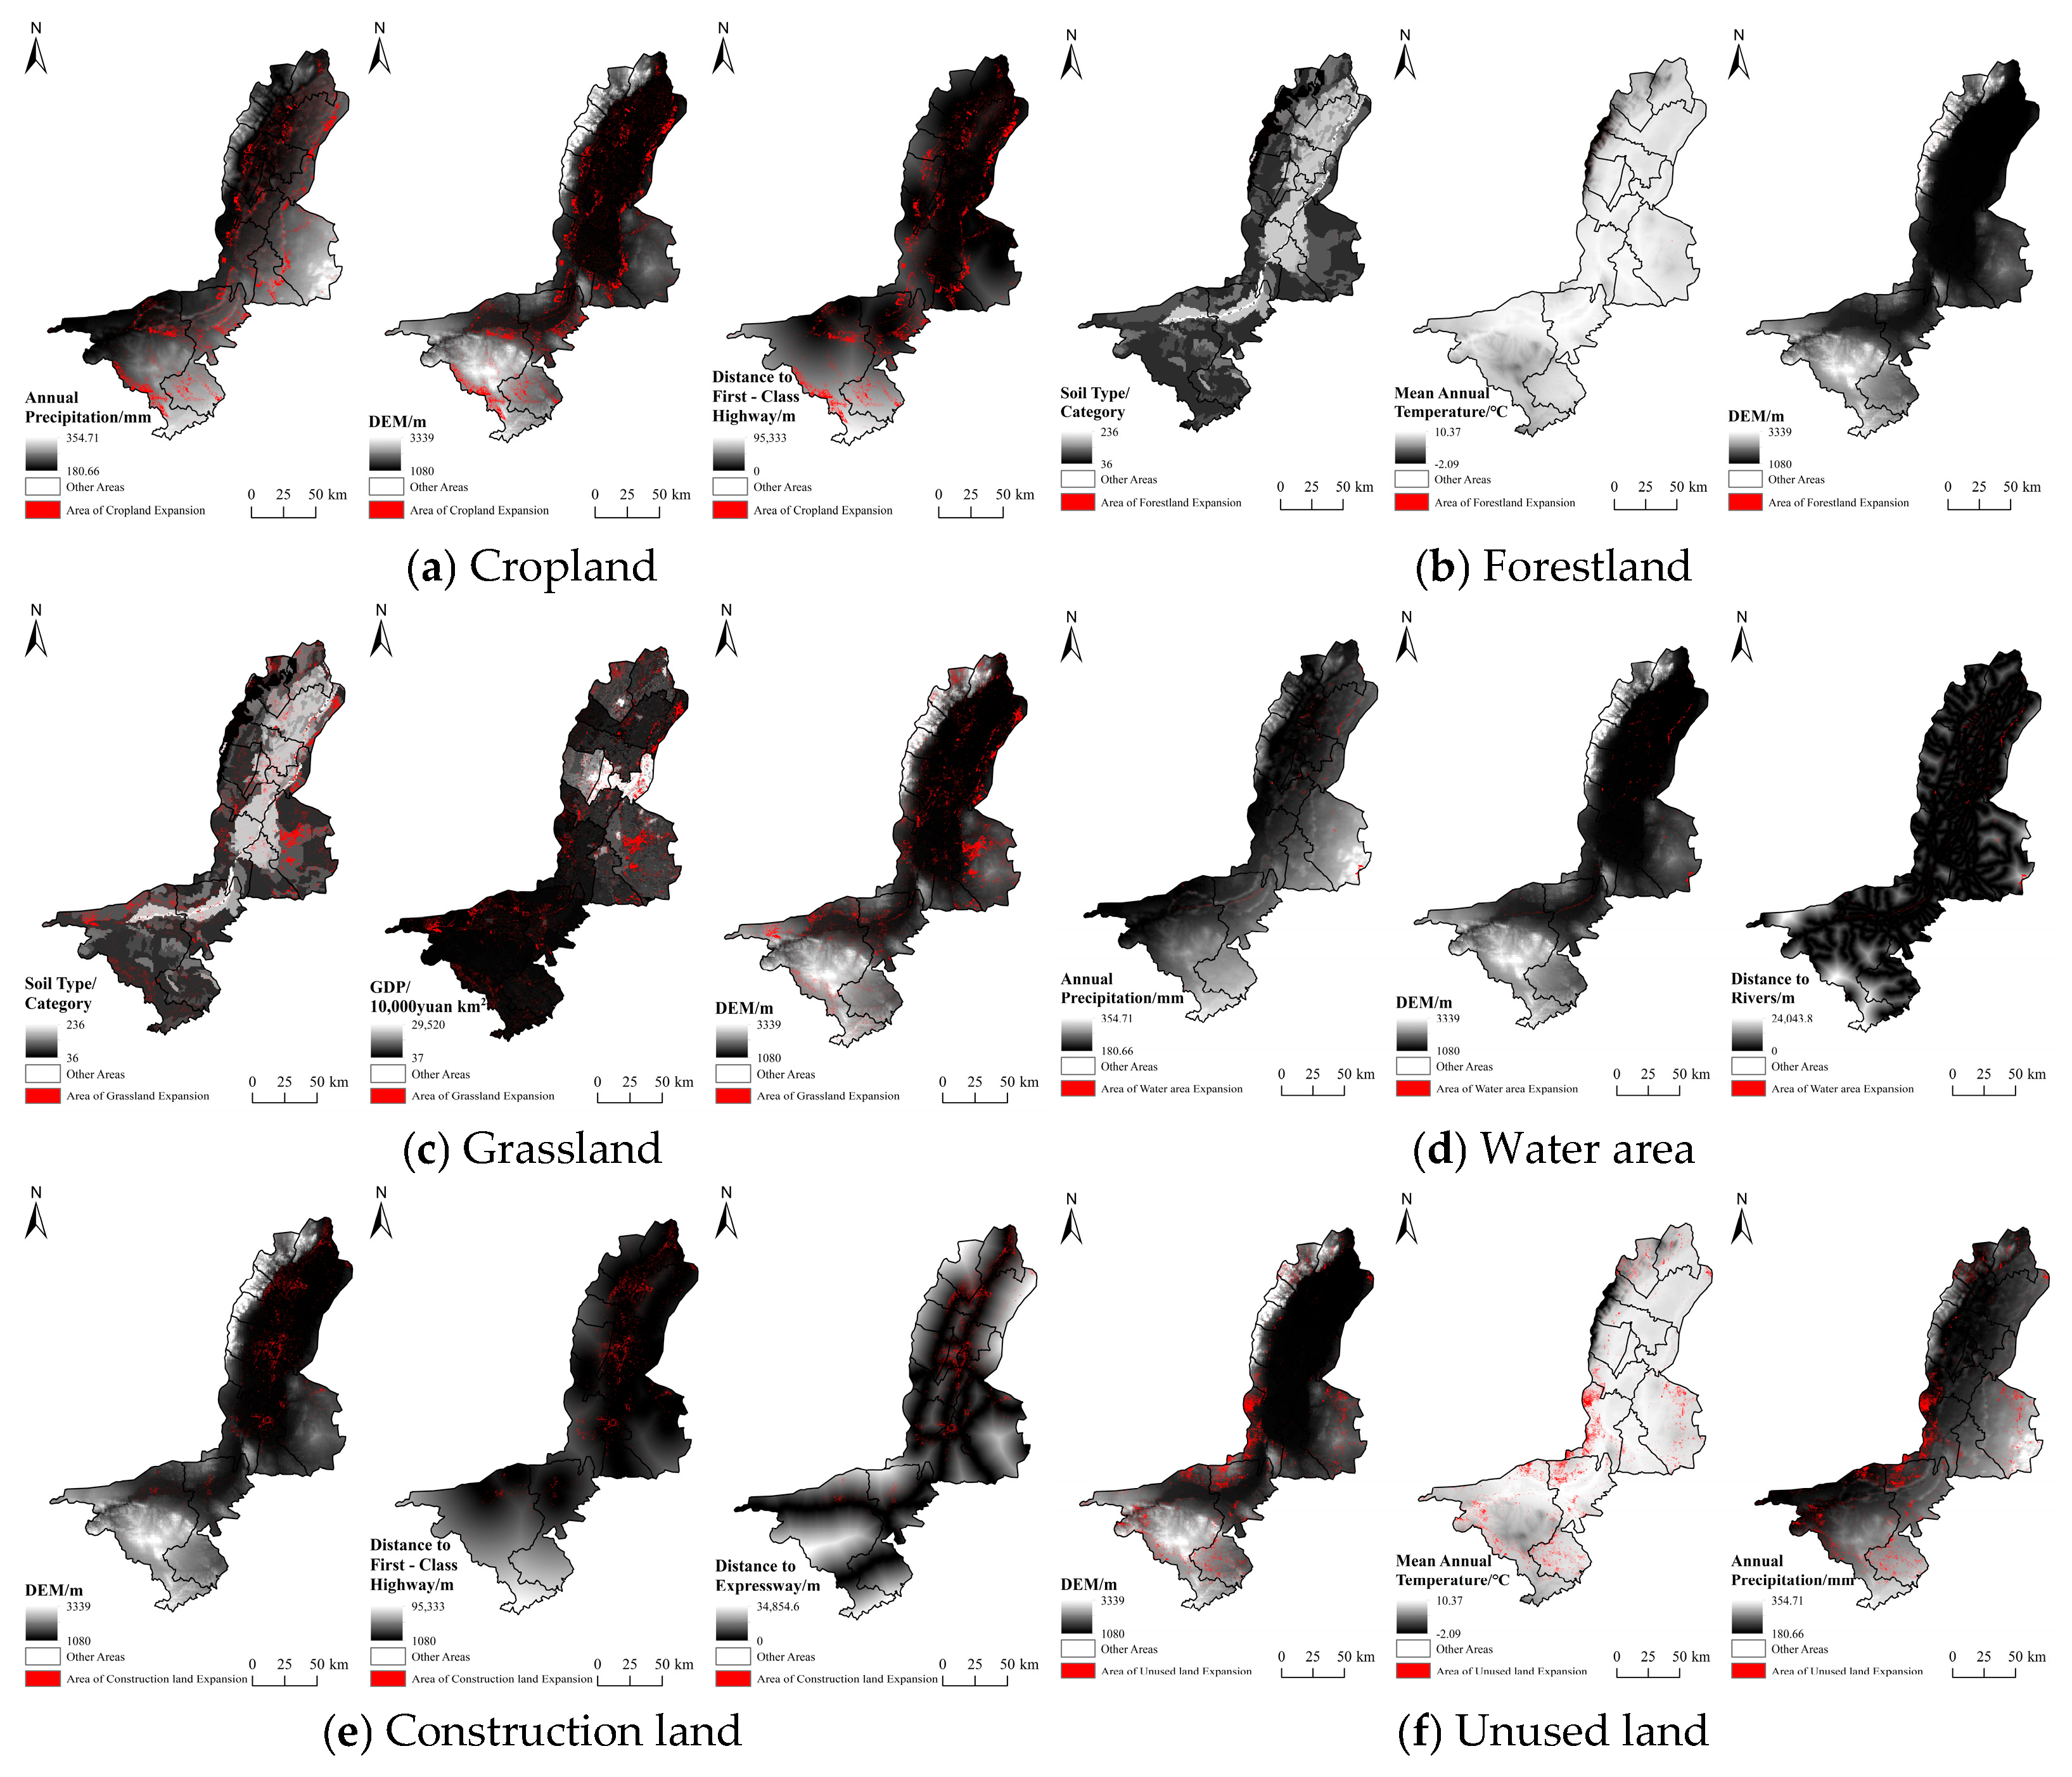
Analysis of Land Expansion Contribution (Figure 7) further revealed the following:
Figure 7.
Overlay Map of Land Use Expansion and Driving Factors.
Cropland expansion was primarily driven by factors such as elevation (DEM), distance to First-class Highway, and GDP, highlighting its sensitivity to topography, transport accessibility, and economic activity.
The spatial distribution of forestland and grassland cover was significantly controlled by natural factors including soil types, mean annual temperature, and elevation, reflecting the high dependence of vegetation growth on the natural environment and shaping the region’s distinctive forestland–grassland patterns.
Changes in water area resulted from the combined effects of multiple factors such as annual precipitation, elevation, and distance to a river. In the context of water scarcity, the formation and persistence of water areas heavily rely on external water sources (precipitation and rivers) and the water storage capacity of local topography. Proximity to a river directly determines the accessibility of surface water supply. These factors collectively regulate the distribution and dynamics of the water area.
Construction land expansion was significantly constrained by transport accessibility, economic development level, and topographic conditions. The region’s core is the plains along the Yellow River, flanked by mountains/hills (e.g., Helan Mountains, Luo Mountains) and marginal desert platforms. This topographic structure fundamentally limits the available space for construction land, forming a “hard constraint” on its expansion. Together with transport conditions, this contributes to a “corridor-node” spatial layout.
Changes in unused land were mainly limited by natural conditions such as elevation (DEM), mean annual temperature, and annual precipitation, demonstrating sensitivity to high-altitude/cold, arid, and steep-slope environments (Figure 7).
4. Projection of Spatiotemporal Patterns of Territorial Space in the Ningxia Yellow River Urban Agglomeration Under Multiple Scenarios
Based on the PLUS model, a multi-scenario land use simulation framework is constructed for the year 2035. Using land use data from the Yellow River Urban Agglomeration for 2010 and 2015, along with 13 driving factors, neighborhood weights, and related parameters, the PLUS model was applied to simulate the evolution of land use patterns in 2035 under four scenarios: Natural Development, Cropland Protection, Ecological Protection, and Sustainable Development [1]. The expected outcomes will provide a scientific basis and scenario references for formulating and implementing regional coordinated development strategies.
4.1. Multi-Scenario Parameterization
Based on existing research findings and empirical evidence on land use evolution and taking into account the differentiated effects of multiple driving factors—including the natural ecological baseline, urbanization processes, and regional economic development—in the Ningxia Yellow River Urban Agglomeration, this study designed four land use scenarios. These scenarios also strictly follow the regulatory requirements of the Territorial Spatial Planning of Ningxia Hui Autonomous Region (2021–2035), as well as the policy orientation of building a pilot zone for ecological protection and high-quality development in the Yellow River Basin. In addition, the historical characteristics of land use transitions and the varying conversion activity levels of different land use types over the study period were incorporated into the parameter setting in scenario design. The four designed scenarios included natural development, cropland protection, ecological protection, and sustainable development.
Natural Development Scenario: Under this scenario, no restrictive policy interventions (e.g., cropland red lines and ecological red lines) were implemented. Land use evolution was driven entirely by natural factors (e.g., topography and climate) and market-based socioeconomic drivers (e.g., urbanization, industrial development, and population growth). All historical land use conversion probabilities are retained. This scenario reflected the increased land use conversion activity driven by positive factors in arid regions, including accelerated urbanization, the spread of expanded water-saving agriculture, and economic expansion.
Ecological Protection Scenario: This scenario prioritized the consolidation of regional ecological security barriers and restrained the disorderly occupation of forest and grassland ecological space by construction land. It focused on the rigid conservation of forestland, grassland, and water bodies in typical arid ecological units, covering the Helan Mountain range and wetlands along the Yellow River. Compared with the natural development scenario, the conversion threshold of ecological land to construction land was substantially elevated [7,34]. Specifically, the conversion probability of forestland and grassland to construction land was reduced by 50%. Considering the superior farming conditions in the Yellow River irrigation zone, the conversion probability of cropland to construction land decreased by 30% [5].
Cropland Protection Scenario: This scenario fully reflected the practical effects of local cropland protection initiatives in Ningxia, including the construction of high-standard farmland and the implementation of the cropland occupancy–compensation balance policy. In this scenario, the conversion probability of cropland to construction land was reduced by 60%. The protection intensity for forestland and grassland was relatively lower than that for cropland, with their conversion probabilities to construction land decreased by 20%.
Sustainable Development Scenario: This scenario targeted the construction of the Yellow River Basin pilot zone for ecological protection and high-quality development, realizing a balanced coordination between ecological conservation and socioeconomic development in arid regions. It restrained the unregulated expansion of construction land toward forest and water ecological spaces. Internal conversions among forestland, grassland, and water bodies were allowed under the guidance of ecological restoration and water system management policies. The conversion probabilities of cropland and forestland to construction land were reduced by 10%, while those of grassland and water bodies to construction land were decreased by 20% [34]. Meanwhile, the reverse transformation of construction land was strictly constrained: the conversion probability of construction land to forestland was reduced by 20%, and the conversion probabilities to grassland, water bodies, and unused land were reduced by 10%.
The land use demand values, land use transfer matrices, and neighborhood weight parameters under the four scenarios are summarized in Table 3, Table 4, and Table 5, respectively.
Table 3.
Land Use Demand for 2035 under Multiple Scenarios.
Table 4.
Multi-Scenario Transition Matrix.
Table 5.
Neighborhood Weight.
4.2. Accuracy Validation
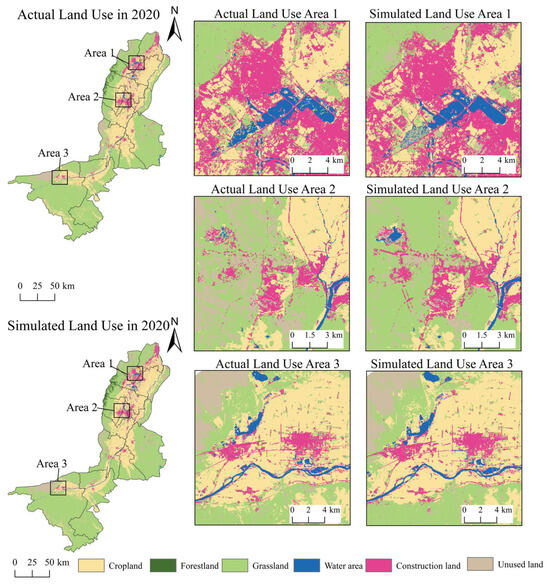
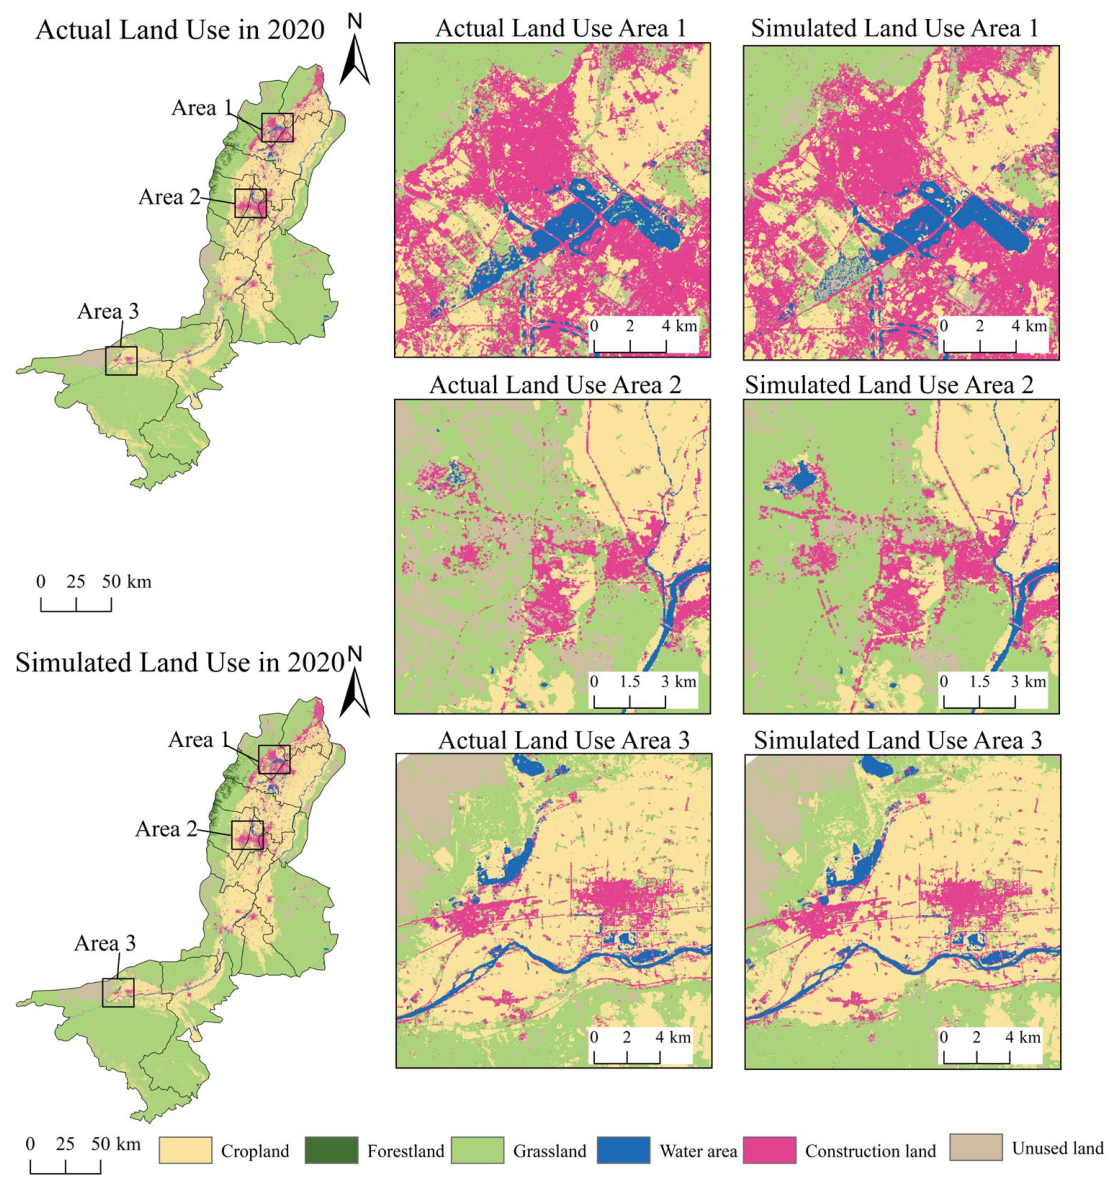
The Kappa coefficient ranges from 0 to 1, with values closer to 1 indicating higher simulation accuracy [7]. Using land use data from Ningxia for 2010 and 2015 as the baseline, the PLUS model was employed to simulate the land use pattern for 2020. The simulation results were then compared against the actual 2020 land use data. The simulation achieved a Kappa coefficient of 0.813 and an overall accuracy of 0.891 (Figure 8), indicating high consistency between the simulated and observed data. This validated the reliability of the model for future projections.
Figure 8.
Comparison of Actual and Simulated Land Use in 2020.
4.3. Analysis of Multi-Scenario Land Use Simulation Results
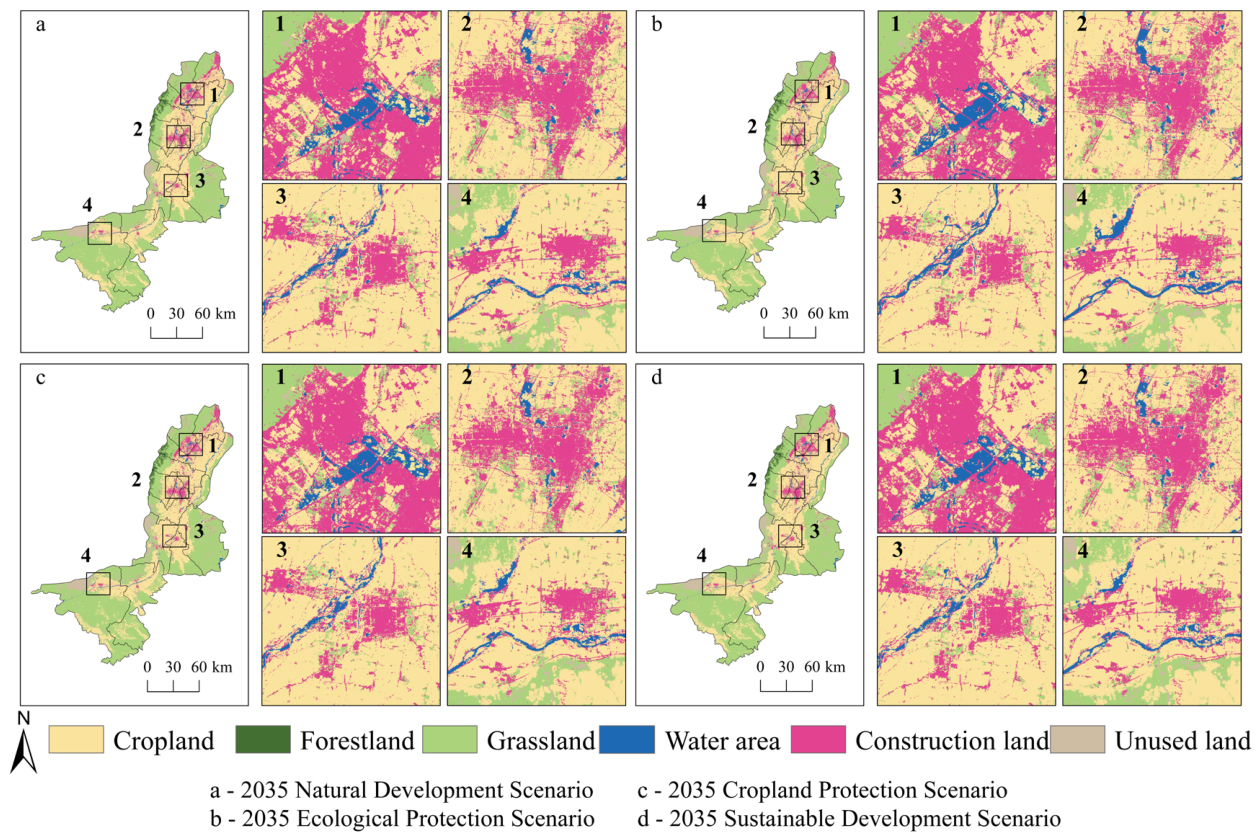
The simulation results (Table 6, Figure 9) showed that, under all four scenarios, the land use structure of the Ningxia Yellow River Urban Agglomeration would remain dominated by grassland, cropland, and unused land by 2035. However, substantial variations existed in the direction and magnitude of change for different land use types across the scenarios. Overall, the area of grassland and unused land showed a declining trend, whereas the area of forestland, cropland, and construction land generally increased. Changes in water area varied depending on the specific policy focus of each scenario.
Table 6.
Projected Land Use in the Ningxia Yellow River Urban Agglomeration under Multiple Scenarios for 2035 (Unit: km2).
Figure 9.
Simulation of Territorial Space Patterns in the Ningxia Yellow River Urban Agglomeration under Multiple Scenarios.
Under the Natural Development Scenario, land use types evolved according to their historical transition probabilities. Compared to 2023, construction land exhibited the most dramatic expansion, increasing by 181.11 km2. Cropland area also rose substantially, by 1185.85 km2, while grassland and water area were significantly converted. Grassland area decreased notably by 1237.88 km2, and water area registered its largest reduction among all four scenarios, declining by 44.13 km2. This pattern indicated that, under this scenario, construction land expanded outward from fast-growing economic urban centers, primarily at the expense of grassland and water areas. Consequently, this scenario would likely exert the greatest pressure on ecosystems and could negatively impact the ecosystem of the Ningxia Yellow River Urban Agglomeration.
Under the Ecological Protection Scenario, implementing restrictions on the conversion of forestland, grassland, and water area effectively curbed the loss of ecological land. Grassland experienced the smallest reduction among the scenarios, decreasing by 1204.17 km2. Water area achieved a net increase of 4.07 km2, while forestland also expanded, indicating effective conservation of ecological land. This improvement contributed to water retention and biodiversity conservation, promoting the sustainable development of the ecosystem. The expansion of construction land was significantly restrained, increasing by only 110.27 km2. Guided by ecological protection, this scenario directly implemented the principle that “clear waters and green mountains are as good as mountains of gold and silver.” It was the most effective in supporting improvements in regional ecological resilience and living environment quality.
Under the Cropland Protection Scenario, the strictest cropland protection policies were implemented, resulting in the largest increase in cropland area—up by 1244.65 km2—primarily due to the conversion of grassland and unused land. In contrast, the expansion of construction land was constrained, rising by only 96.56 km2. However, overly rigid protection was found to potentially create an inherent conflict with the population agglomeration trend associated with urbanization.
Under the Sustainable Development Scenario, an optimal balance among cropland, grassland, and construction land was achieved by integrating the regulation of conversions across various land use types. The changes in land use categories were more balanced, reflecting a comprehensive development philosophy. This approach not only aligned with national strategies but also offered an optimal pathway for the long-term sustainable development of the region.
In summary, the model achieved an overall accuracy of 0.891 and a Kappa coefficient of 0.813, indicating a high level of predictive reliability. These results provided a valuable reference for future territorial spatial planning in the region. The multi-scenario simulations revealed distinct territorial patterns under different development philosophies and policy choices: The Natural Development Scenario continued the system’s historical trajectory but failed to adequately account for regional development needs and ecological constraints, leading to an accumulation of ecological risks. The Cropland Protection Scenario safeguards cropland quantity and food security but may come at the cost of diminished ecosystem service functions.
The Sustainable Development Scenario, by coordinating conversions among land use types and optimizing the land system structure, achieved a synergistic enhancement of both ecological security and economic development. This aligns with the strategic orientation of ecological conservation and high-quality development in the Yellow River Basin, offering a new pathway for the sustainable development of the Ningxia Yellow River Urban Agglomeration.
The multi-scenario analysis further demonstrated that prioritizing any single objective may exacerbate imbalances in the trade-offs between ecological and economic objectives. Therefore, the future optimization of territorial space in the Ningxia Yellow River Urban Agglomeration must adopt a holistic social–ecological system perspective and implement refined spatial governance. Moving forward, the Ningxia Yellow River Urban Agglomeration should transition its development model from “rapid growth” to “high-quality development”. Efforts should focus on building intensive and efficient production spaces, livable and appropriately scaled living spaces, and beautiful ecological spaces characterized by clear waters and green mountains, ultimately shaping a sustainable urban agglomeration with distinct characteristics along the Yellow River.
5. Discussion
This study systematically elaborates the territorial spatial evolution and multi-scenario evolutionary mechanism of the Ningxia Yellow River Urban Agglomeration. The results confirm that human activities such as urban expansion, agricultural reclamation, and water and soil resource exploitation dominate short-term territorial spatial restructuring in arid oasis regions. The dynamic trade-offs among grassland, cropland, and construction land further reveal intensified human–land conflicts under regional aridification. Multi-scenario simulations quantitatively identify the deficiencies of single-objective governance and verify the comprehensive advantages of coordinated ecological, production, and living development, providing solid empirical evidence for refined territorial spatial optimization and differentiated governance in arid urban agglomerations. In practical terms, this study offers scientific references for refined territorial spatial management in ecologically fragile arid regions. Rigid spatial policies, including the delineation of “three zones and three lines” and standardized water resource management, can effectively regulate land development and restrain disorderly ecological degradation. Nevertheless, remaining ecological degradation risks and unbalanced spatial development indicate that the current territorial governance system still requires further improvement. For arid oasis urban agglomerations constrained by water scarcity and ecological fragility, future spatial governance should comprehensively coordinate ecological conservation, food security, and intensive urban development. The integration of rigid spatial regulation and market-oriented ecological resource allocation mechanisms can effectively mitigate core human–land contradictions and promote the high-quality and sustainable development of territorial spaces in inland arid regions.
Methodologically, the PLUS model adopted in this study can effectively capture the spontaneous evolution and competitive conversion of fine-scale land use patches, ensuring reliable simulation outcomes. However, constrained by data availability, algorithm limitations, and the complexity of human–land systems, this study has several deficiencies. First, the selection of driving factors is limited to quantifiable natural and socioeconomic variables, while implicit institutional and policy interventions, such as ecological compensation, water rights allocation, and industrial regulation, are not incorporated. These subtle human-mediated interventions profoundly affect fine-scale land use transitions in arid oases, restricting the model’s capacity to fully interpret the comprehensive driving mechanism of territorial spatial evolution. Second, the calibration of core model parameters, including the land use transfer matrix, neighborhood weights, and conversion thresholds, relies on empirical debugging and regional geographical characteristics. Although such parameterization ensures reasonable simulation results, the experience-dependent calibration introduces subjective biases and reduces the model’s cross-regional applicability and generalizability. Future research can adopt long-term localized observation data and comparative simulation experiments to optimize parameter settings and improve model stability in arid urban agglomeration simulations. Third, the model lacks sufficient quantitative characterization of policy spatial heterogeneity. Macro policies serve as critical exogenous drivers of territorial spatial change, yet the inherent framework of the PLUS model cannot effectively quantify or internalize implicit policy tools such as ecological compensation, total water resource control, and cropland conversion constraints. The spatially differentiated effects of policy implementation cannot be fully reflected in the simulation process, weakening the model’s responsiveness to refined policy constraints and lowering the accuracy of fine-grained land use simulations. Future studies can couple spatial econometric methods and policy quantification approaches with the PLUS model to achieve precise identification and refined simulation of policy-driven territorial spatial changes, thereby improving the simulation and governance framework for arid land systems.
6. Conclusions
This study selected the Ningxia Yellow River Urban Agglomeration—a typical representative of the arid and semi-arid ecologically fragile area in the upper reaches of the Yellow River—as the research object. It systematically analyzed the spatiotemporal evolution patterns and multi-source driving mechanisms of territorial space from 2010 to 2023. The PLUS model was adopted to dynamically simulate the territorial spatial patterns under multiple policy scenarios for 2035. The main conclusions are as follows, and the corresponding implications are proposed.
- (1)
- The spatiotemporal evolution characteristics of territorial spatial patterns in the Ningxia Yellow River Urban Agglomeration are summarized as follows. During the study period, the regional land use structure, dominated by grassland, cropland, and unused land, remained generally stable. Driven by urban construction and water–soil resource exploitation, the region exhibited an irreversible evolutionary trend of ecological land contraction and continuous expansion of production and construction spaces. Land use transitions were mainly manifested in the dynamic trade-offs among grassland, cropland, and construction land. Such evolutionary characteristics are reflected in the typical human–land interactions of arid oasis urban agglomerations in inland Asia against the background of global warming and aridification. A series of territorial governance policies effectively curbed disorderly land expansion and promoted the transformation of regional land development from an extensive sprawl to intensive and orderly utilization. In the future, strict territorial spatial regulations should be further strengthened. The delineation achievements of “three zones and three lines” should be fully implemented to restrict the arbitrary conversion of ecological land (e.g., grassland and water bodies) to cropland and construction land. Urban development boundaries should be regarded as rigid constraints to inhibit unregulated spatial expansion, facilitate the connotative improvement of construction land efficiency, and guide urban development from incremental expansion to stock optimization. The redevelopment of inefficient construction land and urban renewal should be vigorously promoted, and a dynamic monitoring and evaluation mechanism should be established to maintain the long-term stability of territorial spatial development and protection patterns. Furthermore, rigid water resource constraints and market-oriented allocation mechanisms need to be further deepened. Water resources saved through irrigation district water-saving renovation could be allocated to ecological water replenishment via market-oriented approaches, fundamentally alleviating the prominent conflict between agricultural water consumption and ecological water demand. Meanwhile, the realization mechanism of ecological product value requires further improvement, and pilot practices for the accounting and trading of ecological service functions, including wetland carbon sinks and water conservation, need to be explored. The coordinated implementation of the above policy measures could effectively curb the degradation trend of ecological land while guaranteeing the reasonable demands of urbanization development and food security.
- (2)
- The driving mechanisms of land use evolution in the Ningxia Yellow River Urban Agglomeration were found to be complex and multi-factorial. Natural geographical factors constituted the rigid baseline of regional territorial spatial patterns. Environmental conditions, including soil properties, climate, and topography, largely determined the distribution and dynamic evolution of ecological background spaces (e.g., forestland, grassland, water bodies, and unused land) and defined the inherent fragility of ecological land in arid regions, which featured high degradation vulnerability and poor recoverability. Anthropogenic factors, including socioeconomic development and traffic location advantages, reshaped regional production and living spatial patterns through urbanization and industrialization processes. The differentiated coupling effects of natural constraints and human driving forces jointly formed the unique land use evolution logic of the study area, which was characterized by constrained ecological space, expanding construction space, and intensified water–soil resource pressure. This study provides localized empirical evidence for exploring land use driving mechanisms in similar arid regions worldwide.
- (3)
- Multi-scenario simulations offered quantitative and visualized decision-making references for territorial spatial governance under diverse policy orientations and clarified the optimal high-quality development pathway for the study area. The sustainable development scenario was identified as the optimal pathway for high-quality regional development. The natural development scenario, free of policy constraints, exhibited severe disorderly urban expansion and potential risks of continuous ecosystem degradation, which failed to meet the ecological protection demands of this ecologically fragile arid region. The single-target cropland protection and ecological protection scenarios could independently guarantee regional food security and strengthen ecological security barriers, respectively; however, they suffered from unitary development objectives and insufficient human–land coordination. Neither scenario balanced the multiple demands of urban construction, ecological conservation, and cropland protection. In contrast, the sustainable development scenario realized coordinated and balanced evolutionary trends among production, living, and ecological spaces, effectively relieving the core contradiction between socioeconomic development and ecological protection in arid regions. This pathway is highly consistent with the dual strategic requirements of the United Nations Sustainable Development Goals and the ecological protection and high-quality development strategy of the Yellow River Basin, making it the most suitable development pathway for future territorial spatial optimization and high-quality development of the Ningxia Yellow River Urban Agglomeration.
Author Contributions
Conceptualization, T.S. and X.T.; methodology, T.S. and X.T.; software, T.S.; validation, X.T. and T.S.; formal analysis, T.S. and X.T.; investigation, T.S.; resources, T.S. and X.T.; data curation, T.S.; writing—original draft preparation, T.S. and X.T.; writing—review and editing, X.T.; visualization, T.S.; supervision, X.T.; project administration, X.T.; funding acquisition, X.T. All authors have read and agreed to the published version of the manuscript.
Funding
This research was funded by the National Natural Science Foundation of China (grant number 52068040).
Data Availability Statement
The data presented in this study are available on request from the corresponding author, subject to restrictions related to participant privacy.
Conflicts of Interest
The authors declare no conflict of interest.
References
- Wen, R.; Gao, Y.Y.; Wu, Z.H.; Qian, H. Impacts of land use change on the spatiotemporal pattern of carbon storage in the Guanzhong Plain urban agglomeration. Chin. J. Eco-Agric. 2024, 32, 592–604. [Google Scholar]
- Wei, L.; Zhou, L.; Sun, D.Q.; Tang, X. Spatiotemporal pattern evolution and scenario simulation of urban agglomeration expansion in the Yellow River Basin: A case study of Hohhot-Baotou-Ordos-Yulin urban agglomeration. Geogr. Res. 2022, 41, 1610–1622. [Google Scholar]
- Luo, J.; Zhang, X.B.; Shi, P.J. Territorial spatial evolution characteristics and zonal optimization of Lanzhou-Xining urban agglomeration. J. Desert Res. 2024, 44, 182–193. [Google Scholar]
- Song, Y.Y.; Xue, D.Q.; Xia, S.Y.; Mi, W. Spatiotemporal changes and formation mechanism of territorial spatial patterns in the Yellow River Basin over the past 40 years. Geogr. Res. 2021, 40, 1445–1463. [Google Scholar]
- Yuan, X. Scenario Simulation of Land Use Change and Landscape Ecological Risk Assessment in Wuhan City Based on PLUS Model. Master’s Thesis, East China University of Technology, Nanchang, China, 2022. [Google Scholar]
- Bian, R.; Zhao, A.Z.; Liu, X.F.; Xu, R.H.; Li, Z.Y. Impact of land use change on carbon storage in the Guanzhong Plain urban agglomeration. Environ. Sci. 2024, 45, 3260–3269. [Google Scholar]
- Wang, C.Y. Spatiotemporal Simulation of Territorial Space and Carbon Storage Changes in Chengdu-Chongqing Urban Agglomeration Based on PLUS-InVEST Model. Master’s Thesis, Chongqing Three Gorges University, Chongqing, China, 2023. [Google Scholar]
- Xin, X. Territorial Spatial Structure Evolution and Ecological Security Pattern Construction of Hohhot-Baotou-Ordos-Wuhai Urban Agglomeration. Master’s Thesis, Inner Mongolia Normal University, Hohhot, China, 2023. [Google Scholar]
- Song, S.; Liu, Z.; He, C.; Lu, W. Evaluating the effects of urban expansion on natural habitat quality by coupling localized shared socioeconomic pathways and the land use scenario dynamics-urban model. Ecol. Indic. 2020, 112, 106071. [Google Scholar] [CrossRef] [Scilit]
- Feng, X.G.; Li, R.; Mo, H.W. Urban expansion and its driving forces based on RS and GIS: A case study of Xi’an City. Remote Sens. Technol. Appl. 2010, 25, 202–208. [Google Scholar]
- Liang, X.; Liu, X.; Chen, G.; Leng, J.; Wen, Y.; Chen, G. Coupling fuzzy clustering and cellular automata based on local maxima of development potential to model urban emergence and expansion in economic development zones. Int. J. Geogr. Inf. Sci. 2020, 34, 1930–1952. [Google Scholar] [CrossRef] [Scilit]
- Zhang, J.D.; Mei, Z.X.; Lv, J.H.; Chen, J. Application of FLUS model incorporating spatial autocorrelation in multi-scenario simulation of land use change. J. Geo-Inf. Sci. 2020, 22, 531–542. [Google Scholar]
- Hu, R.M.; Du, S.; Li, P.F.; Yao, Y.; Wang, R.; Teng, K. Landscape fragmentation and driving force analysis of ecologically fragile semi-arid regions based on moving window method. J. Agric. Resour. Environ. 2021, 38, 502–511. [Google Scholar]
- Fu, C.Y.; Dong, X.F. Application of grey model with background value correction in land population carrying capacity: A case study of Hexi Corridor. J. Lanzhou Univ. (Nat. Sci.) 2020, 56, 477–485. [Google Scholar]
- Gu, H.L.; Ma, T.J.; Qian, F.K.; Ca, Y. County-scale land use scenario simulation and carbon emission effect analysis based on CLUE-S model. Trans. Chin. Soc. Agric. Eng. 2022, 38, 288–296. [Google Scholar]
- Wu, J.M.; Wang, L.W. Multi-scenario simulation of land use pattern evolution based on PLUS model. J. Hebei Acad. Sci. 2022, 39, 71–78. [Google Scholar]
- Ma, J.J. Spatiotemporal Evolution and Prediction of Carbon Storage in Urban Spaces Around the Yellow River Beach Area Based on PLUS-InVEST Model. Master’s Thesis, Beijing Forestry University, Beijing, China, 2023. [Google Scholar]
- Gou, M.M.; Liu, C.F.; Li, L.; Xiao, W.; Ouyang, S.; Wang, N.; Hu, J. Spatiotemporal evolution characteristics and scenario simulation of habitat quality in typical watersheds of the Three Gorges Reservoir area. Chin. J. Ecol. 2023, 42, 180–189. [Google Scholar]
- Zhou, R.R. Urbanization Quality and Spatiotemporal Pattern Evolution of Ningxia Urban Agglomeration Along the Yellow River. Master’s Thesis, Ningxia University, Yinchuan, China, 2017. [Google Scholar]
- Wang, X.T. Simulation and driving factor analysis of regional land use change based on LUCC model: A case study of Ningxia. Real Estate World 2025, 20, 25–27. [Google Scholar]
- Cong, H.; Ma, C.H.; An, S.W.; Yang, H. Ecosystem service response and scenario simulation of production-ecological-living land changes in Ningxia ecological economic belt along the Yellow River. Remote Sens. Nat. Resour. 2025, 37, 155–163. [Google Scholar]
- Lv, W.Q.; Mo, N.; Ma, M.Q. Spatiotemporal pattern and gravity center migration of carbon emissions in Ningxia urban agglomeration along the Yellow River from 2000 to 2020. Water Saf. 2024, 9, 64–66. [Google Scholar]
- Ma, C.H.; An, S.W.; Hua, Y.Q.; Li, C. Spatial pattern evolution and driving mechanisms of ecological land in Ningxia economic belt along the Yellow River. Econ. Geogr. 2022, 42, 179–187. [Google Scholar]
- Shu, R.; Guo, N.; Zhang, J.H.; Zou, Y.; Chen, R. Spatiotemporal differentiation of urban expansion and coupling coordination of population and economy in Ningxia ecological economic belt along the Yellow River. J. Arid Land Resour. Environ. 2025, 39, 39–50. [Google Scholar]
- Cheng, Z. Spatiotemporal Evolution and Scenario simulation of LUCC in Fengjie County. Master’s Thesis, Chongqing University, Chongqing, China, 2022. [Google Scholar]
- Lin, J.T. Response of Microclimate to Plant Configuration Patterns in Urban Parks of Ningxia along the Yellow River. Master’s Thesis, Ningxia University, Yinchuan, China, 2021. [Google Scholar]
- Yalikun, A.; Maimaitinuer, A.; Abdukayimu, N. Spatiotemporal characteristics of land use change in Artux City of Xinjiang in recent 20 years. Henan Sci. Technol. 2026, 53, 90–97. [Google Scholar]
- Wang, W.; Yang, S.T.; Hai, Y.R. Spatiotemporal evolution and influencing factors of land use carbon emissions in Ningxia. Arid Zone Res. 2025, 42, 545–555. [Google Scholar] [CrossRef]
- Yang, L.; Wang, B.; Liu, Y.X. Research on calculation method of land use change transfer matrix data processing. Autom. Appl. 2024, 65, 199–204. [Google Scholar]
- Qin, C.B.; Lv, X.L.; Li, Y. Spatiotemporal evolution characteristics of land use in Mengyin County, Shandong Province. Nat. Resour. Inf. 2025, 5, 18–25. [Google Scholar]
- Liu, W.Q.; Ma, J.T.; Zhao, X.C.; Kou, W. Spatiotemporal evolution characteristics of land use in Gansu section of the Yellow River Basin from 2000 to 2020. Green Sci. Technol. 2026, 28, 181–186. [Google Scholar]
- Zhong, J. Effects of Land Use Change on Habitat Quality and Carbon Storage in Poyang Lake Basin. Master’s Thesis, Jiangxi Normal University, Nanchang, China, 2024. [Google Scholar]
- Chen, W.N. Spatiotemporal Change and Simulation of Ecological Risk in Baota District. Master’s Thesis, Chang’an University, Xi’an, China, 2022. [Google Scholar]
- Xie, X.D.; Lin, X.S.; Wang, Y.; Tu, R.; Zhang, J. Multi-scenario simulation of land use in Nanchuan District of Chongqing based on PLUS model. J. Yangtze River Sci. Res. Inst. 2023, 40, 86–92+113. [Google Scholar]

Disclaimer/Publisher’s Note: The statements, opinions and data contained in all publications are solely those of the individual author(s) and contributor(s) and not of MDPI and/or the editor(s). MDPI and/or the editor(s) disclaim responsibility for any injury to people or property resulting from any ideas, methods, instructions or products referred to in the content. |
© 2026 by the authors. Licensee MDPI, Basel, Switzerland. This article is an open access article distributed under the terms and conditions of the Creative Commons Attribution (CC BY) license.