


Abstract
Conventional static indicators such as passenger car equivalent (PCE) factors cannot adequately capture the dynamic bottleneck effects caused by truck speed degradation on long steep freeway upgrades. To address this issue, this study proposes an operational efficiency analysis framework integrating truck crest-speed reliability and microscopic simulation. Vehicle trajectory data were collected using unmanned aerial vehicles, and truck power-to-mass ratio data were obtained from the Chinese truck market to establish a representative truck model. Monte Carlo simulation was employed to quantify crest-speed reliability, whose complement (failure probability) characterizes the likelihood of truck bottlenecks arising. A calibrated VISSIM simulation model was then developed to reproduce truck climbing speed degradation and microscopic driving behavior on long upgrades. Finally, a response surface model was constructed using average delay as the operational efficiency indicator. The results indicate the following: (1) As grade length increases, the probability of truck bottleneck occurrence gradually rises, and the marginal effect of this increase becomes more pronounced with steeper grades. Specifically, truck crest-speed reliability exhibits a nonlinear decreasing trend with increasing grade length. For example, under a design speed of 120 km/h and a 95% reliability threshold, the corresponding grade length for a 2.5% grade is 1367 m, whereas for a 4% grade it drops to 232 m, representing a reduction of 83%. (2) Under high traffic volume conditions, an increase in truck proportion leads to a significant rise in average delay (up to 17.54 s). Although improving crest-speed reliability reduces the probability of truck bottleneck occurrence and partially mitigates delay, it cannot fully offset the traffic pressure induced by high traffic demand. Grade and grade length remain the most critical factors driving operational efficiency deterioration, with a maximum impact on average delay of 38.72 s. (3) The response surface model reveals significant interaction effects between traffic volume and truck proportion, as well as between traffic volume and crest-speed reliability, indicating that traffic demand plays a dominant role in amplifying the impact of truck bottlenecks. The framework proposed in this paper provides probabilistic quantitative decision support for sustainable longitudinal grade design and freight traffic management on mountainous freeways.
1. Introduction
1.1. Background
With the rapid development of China’s freight economy, mountainous highway mileage and truck traffic have increased substantially. By 2024, China’s total road length had surpassed 5,490,400 km, with an addition of approximately 292,300 km over the past five years [1]. Concurrently, the number of trucks on expressways has grown significantly. Due to powertrain limitations, truck speed on upgrades is strongly influenced by grade characteristics. On long steep upgrades, truck speed can degrade considerably and remain low for extended periods [2]. Under high traffic volume or a high truck proportion, slow-moving trucks tend to form platoons, creating bottleneck effects that substantially degrade operational efficiency, increase unnecessary fuel consumption, and worsen traffic-related emissions on mountainous freeways [3,4].
Most existing studies have examined truck impacts on efficiency and analyzed car-following and lane-changing behaviors via simulation. However, research scenarios are largely confined to merging/diverging zones, weaving segments, and other special geometries [5,6,7]; in-depth investigations of these behaviors on long steep upgrades remain limited. Moreover, traditional studies attribute truck bottleneck occurrence to factors such as traffic volume and truck proportion [3], assuming a deterministic threshold beyond which bottlenecks emerge. In reality, the root cause of bottleneck formation [8] lies in truck speed being lower than the prevailing traffic stream speed, and truck speed itself exhibits stochastic characteristics. Therefore, existing research insufficiently accounts for the probabilistic nature of truck bottleneck formation on long upgrades.
1.2. Related Work
1.2.1. Truck Impacts on Operational Efficiency
Research on truck impacts on efficiency falls into two categories: traditional level-of-service (LOS)-based methods and dynamic microsimulation-based approaches.
Traditional methods, exemplified by the “Highway Capacity Manual” (HCM) and China’s “Highway Engineering Technical Standards”, convert mixed traffic flow into passenger car equivalents (PCE) and indirectly reflect efficiency via speed and density. Subsequent studies have refined this method: Alshabibi [9] proposed modified PCE values based on truck proportion and traffic volume; Purkrábková et al. [10] used k-means clustering of floating car data, showing that PCE fails to accurately characterize traffic states when truck proportion exceeds 25%; Çelík et al. [11] developed a high-precision time-headway model using computer vision to calibrate PCE values. Many other studies [12,13,14,15,16,17] have estimated PCE values via regression from empirical truck data. However, these approaches remain at the level of static PCE adjustment; they do not incorporate dynamic driving behaviors (e.g., lane-changing, car-following) into efficiency analysis, instead averaging their effects into a static parameter.
Consequently, increasing research has turned to microsimulation, explicitly embedding driving behavior. Wang et al. [18] used cellular automata to model truck impacts on efficiency in tunnels; Lyu et al. [3] employed an improved KKSW model to investigate the effect of climbing lanes under different truck proportions; Kong et al. [5] developed an enhanced cellular automaton model considering both car-following and lane-changing under car-truck combination effects; Shi et al. [19] used Gaussian mixture models to classify driving styles and Bayesian optimization to calibrate desired speed parameters, improving simulation accuracy; Chen et al. [20] developed a car-following model incorporating driver dynamic reaction time and visual angle on grades, analyzing traffic flow stability and the impacts of driving style and lane-changing on traffic and emissions.
In summary, traditional PCE adjustments cannot capture dynamic truck–car interactions. While microsimulation studies have included car-following and lane-changing, most focus on tunnels [18], climbing lanes [3], basic segments [5], or driving style and grade perspective [19,20]. Systematic modeling and simulation of these behaviors on long steep upgrades—where truck speed continuously declines, speed differentials with cars widen significantly, and low-speed platooning bottlenecks may form—remain lacking.
1.2.2. Driver Behavior Simulation Modeling
Microscopic driving behavior (especially car-following and lane-changing) is central to operational efficiency on basic expressway segments, yet on long steep upgrades its efficiency implications are more complex. Existing research focuses on three aspects: parameter calibration and heterogeneous traffic adaptation, connected and automated vehicle (CAV) cooperative behavior modeling, and driving-style effects on lane-changing decisions.
First, regarding calibration, researchers generally recognize that default VISSIM driving behavior parameters (e.g., Wiedemann CC1, CC2) are not directly transferable to specific traffic environments. Afshari et al. [21] and Ranpura et al. [22] calibrated VISSIM models using high-resolution trajectory data and heterogeneous traffic characteristics via genetic algorithms, significantly reducing simulation error. Azam et al. [23] proposed a systematic, vehicle-class-specific calibration workflow for heterogeneous traffic at dense urban intersections, demonstrating that smaller vehicle spacing must be reflected through parameter adjustment. Qawasmeh et al. [24] explicitly noted that car-following parameters (CC1, CC2) affect operational efficiency much more than lane-changing parameters in work zone management strategy comparisons. Hafram et al. [25] similarly showed that locally calibrated VISSIM models better reflect actual traffic characteristics.
Second, with increasing CAV penetration, cooperative lane-changing optimization has attracted interest. Monteiro et al. [26] developed an optimal control framework for CAV platoon lane-changing on highways, improving success rates. Liu et al. [27] designed an optimization framework for connected vehicles at freeway merging areas, showing reductions in delay and stops. Li et al. [28] integrated CAV car-following and lane-changing with different cooperative characteristics, systematically analyzing the impact of penetration rate and cooperation parameters on mixed traffic flow. Although these studies involve efficiency analysis, they mostly focus on level terrain or merging areas, not considering the superimposed effect of grade conditions on driving behavior and bottleneck formation.
Third, the influence of driving style heterogeneity on lane-changing decisions is increasingly studied. Liu et al. [29] developed a two-vehicle simulation model and game-theoretic control strategy incorporating driving styles in high-density heterogeneous traffic, finding that different styles correspond to different safety distance thresholds and lane-changing timing; compared with traditional models, their approach advanced lane-changing positions and reduced delays. Farooq et al. [30] used a calibrated VISSIM model to explore factors affecting lane-changing frequency on two-lane highways, finding that desired speed, traffic volume, and speed distribution—especially the latter—are positively correlated with lane-changing frequency. These studies collectively demonstrate quantifiable relationships between driving style and lane-changing behavior that affect operational efficiency.
In summary, while progress has been made in simulation calibration, CAV cooperative lane-changing, and driving-style modeling, most studies have not systematically addressed the dynamic bottleneck effect caused by truck speed degradation on long steep upgrades.
1.2.3. Truck Bottleneck Effects
Building on microsimulation research, several studies have focused on moving bottlenecks caused by trucks due to reduced maneuverability or low speed and their impacts on efficiency. These can be grouped into four categories:
Formation mechanisms and propagation: Yuan et al. [31] modeled trucks as moving bottlenecks, deriving multi-lane flow fundamental diagrams; Ou et al. [32] incorporated moving bottleneck speed into an extended macroscopic model, analyzing propagation under uniform flow and small perturbations; Zhang et al. [33] used VISSIM to show that speed difference and density jointly determine the impact magnitude; Chen et al. [34] combined empirical trajectory data and three-phase traffic theory to investigate moving bottleneck evolution at continuous merging segments, clarifying the role of lane-changing in congestion dissipation and propagation.
Modeling truck impacts on surrounding vehicle behavior: Zhang et al. [6] proposed an “oppression effect” of large trucks based on UAV trajectory data and potential field theory, developing a car-following model that significantly improved mixed-flow trajectory prediction; Xiu et al. [35] built a two-lane cellular automaton model for urban roads, showing that higher truck proportion intensifies moving bottleneck effects; Fadhloun et al. [36] extended a deterministic traffic flow model to analyze the effect of speed distribution and congestion density on moving bottleneck throughput.
Control strategies to mitigate moving bottleneck impacts: Zhang et al. [37] found that autonomous vehicles can effectively alleviate upgrade congestion; Wang et al. [38] demonstrated that Level-2 autonomous vehicles can attenuate moving bottleneck negative impacts; Čičić et al. [39] treated truck platoons as controllable moving bottlenecks, optimizing platoon operation to reduce delays; Ma et al. [40] proposed a dynamic on-ramp metering strategy for freeway moving bottlenecks.
Capacity estimation under moving bottlenecks: Simoni and Claudel [41] developed a fast numerical method based on the LWR model to solve multi-class moving and fixed bottleneck traffic states; Fadhloun et al. [36] refined the moving bottleneck capacity estimation framework.
In summary, existing research has revealed truck moving bottleneck impacts on efficiency from mechanistic, behavioral, control, and estimation perspectives. However, most studies focus on basic segments, urban roads, or moderate grades; they have not systematically addressed long steep upgrades, where truck speed continuously degrades and randomness intensifies. Moreover, most treat truck bottleneck occurrence as deterministic, with insufficient attention to the probabilistic nature arising from truck speed stochasticity.
1.3. Research Objectives and Contributions
This paper proposes an analytical framework for operational efficiency on long steep upgrades of expressways that integrates truck crest-speed reliability and microscopic simulation. Compared with existing studies, the innovations of this paper are primarily reflected in the following two aspects.
- (1)
- Methodological innovation: incorporating truck bottleneck effects and microscopic driving behavior into the operational efficiency evaluation system. Traditional research methods, represented by the “Highway Capacity Manual” (HCM) and China’s Highway Engineering Technical Standards, employ passenger car equivalent (PCE) factors to convert mixed traffic flow into equivalent passenger car units for capacity and level-of-service evaluation. However, the PCE method is essentially a static conversion approach that averages the speed impact of trucks into a fixed parameter, failing to capture the dynamic car-following and lane-changing interactions between trucks and adjacent vehicles (especially passenger cars) during the continuous speed degradation process on long steep upgrades. By constructing a VISSIM microsimulation model calibrated with empirical data, this study simulates the truck climbing speed degradation process as well as the car-following and lane-changing behaviors of passenger cars in response to slow-moving trucks, thereby incorporating both truck bottleneck effects and microscopic driving behavior into the operational efficiency analysis framework. This addresses the deficiency of the traditional static PCE method in characterizing dynamic interaction behaviors.
- (2)
- Theoretical innovation: introducing reliability theory to characterize the formation mechanism of truck bottleneck effects from a probabilistic perspective. Existing studies on truck moving bottlenecks have largely relied on simulation approaches, seeking deterministic threshold conditions for bottleneck occurrence by setting different traffic volume and truck proportion scenarios—that is, assuming that bottleneck effects inevitably occur when traffic volume or truck proportion exceeds a certain critical value. However, the essence of truck bottleneck effects lies in truck speed falling below the allowable speed, thereby forming moving obstacles. The actual climbing speed of trucks on steep upgrades is influenced by multiple factors, including their own powertrain performance, load conditions, and driving operations, and exhibits significant stochastic characteristics—not all trucks become bottleneck sources; only those whose speed degrades below the allowable speed constitute potential disturbance sources. This paper introduces reliability theory, defining the probability that crest speed exceeds the allowable speed as crest-speed reliability, and uses its complementary event (failure probability) to characterize the probability that a truck becomes a potential disturbance source. This reveals the formation mechanism of truck bottleneck effects from a probabilistic perspective, overcoming the limitation of traditional deterministic threshold methods in characterizing speed stochasticity.
On this basis, this paper integrates the reliability theory results with VISSIM microsimulation to establish a two-stage analytical framework, systematically quantifying the interactive effects of five factors—traffic volume, truck proportion, grade, grade length, and reliability—on the operational efficiency of long upgrades, thereby providing quantitative decision support for longitudinal grade design and freight traffic management on mountainous expressways.
From the perspective of sustainable transportation systems, improving the operational efficiency of mountainous expressways is an important component of economic sustainability, as it directly reduces traffic delays and enhances system productivity. Although improved traffic flow stability may bring secondary environmental benefits (such as reduced fuel consumption and emissions), these are not the primary focus of this study. The framework proposed in this paper provides decision support for geometric design and freight traffic management strategies on mountainous expressways by quantifying truck bottleneck probability and its interactions with traffic flow, with a primary focus on operational efficiency and economic sustainability.
2. Data Collection and Processing
2.1. Vehicle Trajectory Data Acquisition and Processing
Vehicle trajectory data were collected from 26 August to 2 October 2025. A total of five observation days were selected (including three weekdays and two weekends) to capture traffic characteristics across different periods. The observation period was set from 16:00 to 19:00 each day, during which expressway traffic flow was in a free-flow state, with relatively high truck volumes and no extreme congestion. All observations were conducted under clear, rain-free, and good-visibility weather conditions to avoid interference from adverse environmental factors on driving behavior.
The survey sites were selected from basic segments of three expressways: Lianhuo Expressway, Fuyin Expressway, and Xihan Expressway, with design speeds of 120 km/h, 100 km/h, and 80 km/h, respectively. All selected segments were typical long steep upgrades, with grades ranging from 2.9% to 4.0% and grade lengths satisfying the maximum grade length requirements specified in the Highway Engineering Technical Standards for the corresponding design speeds. No interchanges, tunnels, or other complex structures were present within the survey range, thereby excluding the influence of other geometric conditions on vehicle trajectories.
During the observation period, traffic volumes on the surveyed segments ranged from 1075 to 2240 veh/h, with truck proportions between 11% and 43%. All measured traffic flows met the Level of Service (LOS) III requirements for expressways. A DJI Air 2S unmanned aerial vehicle (UAV) was used for aerial videography, with a flight altitude of approximately 120 m (slightly adjusted according to terrain variations during actual measurements). The camera was oriented vertically downward, and each effective flight lasted approximately 20 min (including takeoff and landing). The video resolution was 3840 × 2160 pixels at a frame rate of 30 fps.
All raw aerial videos were processed using Adobe Premiere 2020 software for image stabilization to reduce interference from UAV attitude fluctuations on target tracking. Vehicle trajectories were extracted using the DeepSORT-YOLOv8 object detection and tracking algorithm, which performs well in small-object detection and real-time tracking [42,43,44]. The extracted trajectory data were smoothed using a Kalman filter to eliminate detection noise, and records exceeding the design speed upper limit (120 km/h) were removed as outliers; the remaining data reflected normal driving behavior.
In previous work by our research team [45], the accuracy of this extraction pipeline was validated using publicly available datasets. The results showed that, on an NVIDIA Titan X hardware platform, for vehicle targets traveling at 80–120 km/h, the algorithm achieved an mAP@0.5 of 89.2%, a recall rate of 88.7%, and an inference frame rate of 30–40 FPS, demonstrating outstanding real-time performance. Therefore, the traffic data extracted by this method are of high accuracy and can effectively support subsequent model calibration and validation. A total of 138 valid passenger car discretionary lane-changing events, 188 passenger car car-following events, 120 truck car-following events, and associated headway data were obtained from this collection.
2.2. Car-Following Behavior Extraction
Car-following data were used to calibrate the VISSIM car-following model parameters CC1 (safe distance time) and CC2 (longitudinal oscillation distance). A car-following event was defined by three criteria [6,46]: (1) spacing between 7 m and 120 m; (2) time headway < 5 s; (3) duration > 10 s. Applying these rules yielded 308 valid car-following events.
Two indicators were extracted: time headway (passenger car mean 1.8 s, SD 0.4 s; truck mean 2.4 s, SD 0.9 s) for CC1 calibration and spacing (mean 35.2 m, SD 4.0 m) for CC2 calibration. To ensure strict independence between model calibration and validation, 80% of the collected car-following data (150 passenger car groups and 96 truck groups) were used for model calibration (i.e., the parameter calibration process described in Section 3.3), while the remaining 20% (38 passenger car groups and 24 truck groups) were reserved as an independent validation set for post-calibration evaluation. This data partitioning approach effectively avoids overfitting.
2.3. Lane-Changing Behavior Extraction
Given the low frequency of truck lane-changing on long steep upgrades, this study extracts only passenger car lane-changing events for lane-changing model calibration. This low-frequency phenomenon is not coincidental but rather reflects the rational conservative driving strategy adopted by truck drivers on steep upgrades. Field observations show that the vast majority of heavy trucks crawl uphill in the outer lane at low speeds; in some sections, trucks even form queues in the outermost lane. In contrast, passenger cars generally travel at higher speeds, and most choose to change lanes to overtake rather than follow slow-moving trucks. This is because, on steep upgrades, trucks are constrained by powertrain performance and cannot accelerate significantly. If a lane-changing maneuver were executed, the time required to complete lateral movement at low speed would increase considerably, prolonging the exposure to conflicts with fast-approaching vehicles in the target lane and thereby substantially increasing collision risk. Therefore, to ensure safety, the overwhelming majority of truck drivers adopt a conservative strategy of maintaining their original lane. Accordingly, the lane-changing model calibration in this study focuses on passenger car lane-changing behavior, which is the dominant type of lane-changing operation on long steep upgrades.
Lane-changing data were used to calibrate the VISSIM lane-changing model safety distance reduction factor. Given the low frequency of truck lane-changing on long upgrades, only passenger car lane-changing events were extracted. A lane change was identified when lateral displacement exceeded half a lane width (>1.875 m) and the lane number changed. For each successful lane change, the time headway of the following vehicle in the target lane at the insertion moment was recorded as the “acceptable gap.” A total of 138 valid passenger car lane-changing events were extracted.
To ensure strict independence between model calibration and validation, 80% of the collected passenger car lane-changing data (110 events) were used for model calibration (i.e., the parameter calibration process described in Section 3.3), while the remaining 20% (28 events) were reserved as an independent validation set for post-calibration evaluation. This data partitioning approach effectively avoids overfitting.
2.4. Truck Power-to-Mass Ratio Data
Truck power-to-mass ratio data were collected from the “Truck Home” website: https://www.360che.com/ (accessed on 1 April 2025), covering 25,918 vehicle models across 251 brands, including tractors, cargo trucks, and dumpers. Neyman allocation stratified sampling verified accuracy for heavy, medium, light, and micro trucks, each exceeding 95%, confirming high data reliability.
2.5. Clustering of Power-to-Mass Ratio Data
The power-to-mass ratio data exhibited a clear bimodal distribution (peaks at 9.00 kW/t and 23.00 kW/t). K-means clustering (k = 2) gave the maximum average silhouette coefficient: Cluster 0 (weak power) centroid 9.41 kW/t (n = 14,110); Cluster 1 (strong power) centroid 25.44 kW/t (n = 9296). The 15th–25th percentile of the weak-power cumulative distribution curve corresponded to 6.20–6.90 kW/t, providing the representative truck’s power range. Based on sales data (dominated by Sinotruk and FAW Jiefang) and the overall power-to-mass ratio range (approx. 4.00–70.00 kW/t), the Qingdao Jiefang Tian V heavy truck (430 hp, 6 × 4 tractor, model CA4256P2K15T1E5A80) was selected as the representative truck. Its gross vehicle weight is 48.805 t, and its maximum engine output is 316 kW, yielding a power-to-mass ratio of 6.47 kW/t (20th percentile of the weak-power distribution).
It should be noted that, from a conservative perspective, this study selects a weak-power (6.47 kW/t), fully loaded heavy diesel truck as the representative vehicle for modeling and analysis. This selection approach is a commonly adopted conservative research strategy in road geometric design and traffic bottleneck analysis, and its rationale is based on the following two considerations: ① truck power performance varies across different regional expressways (e.g., strong-power trucks account for a relatively high proportion in some coal transportation corridors); adopting a weak-power representative vehicle ensures broader applicability and a greater safety margin for the analysis conclusions. ② As shown in Figure 1, according to the power performance data survey of China’s truck market, diesel trucks remain the absolute mainstream vehicle type (accounting for 79%), while new-energy trucks (pure electric, hybrid, etc.) constitute a very small proportion. Therefore, selecting diesel trucks as the modeling object can reflect the actual composition characteristics of trucks on current expressways.
Figure 1.
Market share of freight trucks by energy type.
3. Methodology
3.1. Research Framework Overview
To evaluate operational efficiency of long steep upgrades, we propose an analytical method integrating probabilistic characterization of truck bottleneck potential and microsimulation of driving behavior. As shown in Figure 2, the framework comprises three core steps.
Figure 2.
Research framework diagram.
- Step 1: Probabilistic characterization of potential truck bottleneck effects. Given the stochastic nature of truck climbing speed, deterministic methods cannot accurately capture the likelihood that trucks become disturbance sources. We introduce reliability theory. Based on truck dynamics and Monte Carlo simulation, crest-speed reliability (R) is computed as the probability that crest speed exceeds the allowable speed. Its complement, failure probability (1 − R), represents the likelihood that a truck becomes a potential disturbance source; this failure probability is subsequently used in the simulation to characterize the intensity of potential bottleneck disturbances. This reliability value serves as a key input to the simulation model.
- Step 2: Reliability-aware VISSIM simulation modeling. A microsimulation model is constructed for long steep upgrade scenarios, incorporating five influencing factors: traffic volume, traffic composition, grade, grade length, and reliability. Car-following and lane-changing model parameters are calibrated to realistically represent microscopic driver behavior. Notably, “desired speed decision points” are used to accurately simulate the climbing speed degradation of the representative truck.
- Step 3: Operational efficiency model based on response surface methodology. To reduce the number of simulation experiments and reveal multi-factor interactions, a Box–Behnken Design (BBD) is employed for the five factors. Average delay time is taken as the efficiency metric, and a quadratic regression model is fitted, ultimately yielding an operational efficiency analysis model for long steep upgrades that accounts for the failure probability derived from crest-speed reliability (representing potential bottleneck intensity) and driver behavior.
3.2. Probabilistic Characterization of Potential Truck Bottleneck Effects
3.2.1. Rationale for Method Selection
Conventional views hold that truck bottleneck effects emerge when traffic volume or truck proportion reaches a certain threshold. However, the definition of truck bottleneck effects on long steep upgrades of expressways is as follows: “On long steep upgrades of expressways, because the powertrain performance of trucks (especially heavily loaded trucks) is far inferior to that of passenger cars, their climbing speed decreases significantly, forming slow-moving obstacles. When truck flow is high, fast-approaching passenger cars from behind are forced to decelerate, follow, and change lanes, resulting in the actual capacity of the segment being considerably lower than that of a basic segment (level terrain), thereby forming a dynamic, moving ‘bottleneck’.” The essence of this phenomenon lies in truck speed, while traffic volume and truck proportion are merely two influencing factors.
Therefore, this study centers on truck speed and introduces reliability theory to quantify the probabilistic characteristics of truck climbing speed. Specifically, the crest position of the steep upgrade is selected as the analysis location for truck bottleneck effects (where speed is lowest). The probability that crest speed exceeds the allowable speed is defined as the reliability of the representative vehicle, and the corresponding failure probability is used to characterize the potential truck bottleneck effect. In other words, higher reliability indicates a greater probability that truck operating speeds on steep expressway upgrades remain above the allowable speed, implying a lower probability of slow-moving trucks (characterized by failure probability) and, consequently, a lower probability of truck bottleneck effects.
Meanwhile, in this paper, reliability represents the probability of occurrence of a disturbance source (slow-moving trucks), whereas whether the actual bottleneck effect occurs and its severity depend on the coupling between this disturbance source and traffic demand (volume and truck proportion). As shown in Figure 3, a frame from an aerial video captured during our survey illustrates that although trucks were observed traveling in queues, the traffic volume at that moment was low; slow-moving trucks had little impact on passenger cars and did not cause significant adverse effects on operational efficiency. Therefore, traffic volume and truck proportion must also be considered in the assessment of truck bottleneck effects.
Figure 3.
Aerial video screenshot.
Based on the above analysis, this paper adopts a two-stage framework combining reliability (characterizing the probability of slow-moving truck occurrence) with microsimulation (coupling traffic volume and truck proportion factors and incorporating driver behavior) to comprehensively quantify the combined effects of truck bottleneck occurrence probability and driver behavior factors on the operational efficiency of steep expressway upgrades.
It should be noted that the crest-speed reliability proposed in this paper is theoretically computed based on a single-vehicle dynamics model, without directly incorporating traffic volume and truck proportion into the reliability calculation. This treatment is mainly based on the following two considerations: ① Under non-congested expressway conditions, a truck’s climbing speed is primarily determined by its own powertrain performance rather than by interactions with surrounding vehicles. Field observation data indicate that trucks typically travel steadily in the outer lane at low speeds on grade segments and rarely decelerate or change lanes due to passenger cars; instead, passenger cars actively yield to trucks. ② The representative vehicle in this study is conservatively selected as a weak-power truck, already representing the most unfavorable powertrain configuration. Under this conservative premise, the marginal effects of traffic volume and truck proportion on the theoretical climbing speed curve are of secondary importance and are therefore reasonably simplified in the reliability theoretical calculation.
3.2.2. Representative Truck Dynamics Model
Gravity causes truck speed on long upgrades to degrade with increasing grade and length, depending on truck powertrain performance and approach speed at the grade foot. Given the diversity of trucks in operation and the impracticality of field measurement of all powertrain parameters, we surveyed China’s truck market and selected a representative truck from a conservative (weak power) perspective. The classical dynamics equation for Chinese trucks is used:
where P, Q, and W are powertrain parameters; G is the gross vehicle mass (t); U is the engine load factor (100% for the worst-case); γ is the total gear ratio; ηT is the mechanical efficiency; Mmax is the maximum torque (N·m); MN is the torque at maximum power (N·m); K is the air resistance coefficient; A is the frontal area; r is the wheel rolling radius; nN is the rated engine speed (r/min); and nM is the speed at maximum torque (r/min).
3.2.3. Reliability Performance Function
The allowable speed is the minimum truck speed specified in the Highway Engineering Technical Standards: 60 km/h for design speed 120 km/h, 55 km/h for 100 km/h, and 50 km/h for 80 km/h. These values are determined based on safe speed differentials between passenger cars and trucks and the impact of low-speed trucks on expressway efficiency. The legal minimum speed for passenger cars is 60 km/h, consistent with measured data, although some trucks are observed operating below the allowable speed.
When truck crest speed falls below the allowable speed, the truck fails to meet the operational requirements, acts as a disturbance source, and may induce a moving bottleneck. The probability of such speed failure is quantified by reliability theory. Specifically, crest-speed reliability (R) is defined as the probability that crest speed ≥ allowable speed. Correspondingly, the failure probability (1 − R) represents the likelihood that the truck becomes a potential disturbance source. In the subsequent microsimulation, this failure probability is used to determine the proportion of low-speed trucks in the traffic stream, thereby representing the potential bottleneck intensity.
The performance function for crest-speed reliability is:
where P is the performance function (P < 0 indicates that the grade design causes the truck to become a disturbance source at the crest; P > 0 means the truck maintains speed above the allowable throughout); Lt is the theoretical length requirement (m); and Ld is the design length (m).
Reliability analysis proceeds as follows: (1) construct approach speed dataset; (2) fit the distribution of approach speeds; (3) define parameter ranges for the performance function; (4) select an appropriate reliability computation method and sampling size; (5) compute reliability for various operating conditions.
3.2.4. Monte Carlo Simulation for Reliability
Monte Carlo simulation is used to solve for crest-speed reliability. Steps:
- Sampling size: Preliminary analysis (design speed 120 km/h, grade 3%, length 600 m) shows that reliability stabilizes at 10,000 samples (Figure 5). Thus, 10,000 samples are used.
- Reliability computation: For each grade scenario (design speed, grade, length), 10,000 approach speeds are randomly drawn from the distribution, crest speed is computed via dynamics, and the proportion of samples with crest speed below allowable speed is counted, yielding failure probability and reliability.
Figure 4.
Approach speed distribution: (a) design speed 120 km/h, (b) 100 km/h, (c) 80 km/h.
Table 1.
Approach speed distribution.
Figure 5.
Reliability vs. number of Monte Carlo samples.
3.2.5. Linking Reliability to Microsimulation
Reliability analysis quantifies truck speed degradation and the associated failure probability (disturbance source likelihood) but does not capture the dynamic effects of slow trucks on traffic flow. Therefore, in microsimulation we use the “proportion of trucks with speed below allowable” to represent the disturbance source probability. Different low-truck-speed scenarios are constructed based on reliability results to simulate car-following, lane-changing, and disturbance propagation. Crest-speed reliability is not directly embedded as a random process in VISSIM; rather, its complement—the failure probability—is used to build low-speed truck proportion scenarios for analyzing the impact of potential disturbance sources on traffic behavior.
In the two-stage framework of this study, the role of reliability calculation is to quantify, under given grade and grade length conditions, the probability that the representative vehicle becomes a slow-moving disturbance source due to its inherent powertrain limitations. This process is independent of traffic demand conditions. Traffic volume and truck proportion are not incorporated into the reliability theoretical model because, under non-congested conditions, these two factors do not alter the inherent speed degradation pattern of trucks. Rather, they determine how the disturbance source propagates in the traffic stream and the ultimate extent of its impact on operational efficiency.
3.3. VISSIM Simulation Model
3.3.1. Model Framework and Assumptions
VISSIM is used to model traffic flow on long upgrades. Basic settings:
- Alignment: straight segment to eliminate horizontal curve effects.
- Lane configuration: one-way four lanes, width 3.75 m (China’s *Highway Route Design Specification*).
- Vehicle composition: passenger cars and trucks only; all trucks are the representative truck (6.47 kW/t).
- Core assumption: worst-case operation—all trucks fully loaded, weak-power (20th percentile). This conservative bias ensures safety-oriented results.
3.3.2. Simulating Truck Climbing Speed Degradation
Because VISSIM’s built-in truck power model does not accurately reproduce the representative truck’s climbing speed degradation, desired speed decision points are deployed every 50 m along the upgrade (Figure 6). Desired speed distributions at each point are defined based on the 15th, 50th, and 85th percentile speeds computed from the dynamics model. For trucks within the reliability range (crest speed ≥ allowable), the lower bound of desired speed is not less than the allowable speed. For trucks outside the reliability range (crest speed < allowable), the upper bound of desired speed is not higher than the allowable speed. This allows precise representation of speed distributions under different reliability levels.
Figure 6.
VISSIM simulation model layout with desired speed decision points.
3.3.3. Car-Following Model Calibration
The Wiedemann 99 car-following model built into VISSIM is employed to describe longitudinal driving behavior on long steep upgrades. This model contains a total of 10 parameters. Full-range calibration is not only computationally expensive but also prone to overfitting [21]. Therefore, this study adopts a “sensitivity-based hierarchical calibration” strategy. Through single-factor perturbation analysis in pre-experiments, CC1 (desired time headway) was identified as the parameter with the most significant impact on average delay and headway distribution, whereas CC0 (standstill distance), CC3 (threshold for entering following state), and CC4–CC9 all exhibited less than 5% influence on average delay under ±30% perturbation. Accordingly, the latter parameters retain the VISSIM-recommended default values, and only CC1 is subject to refined calibration, thereby reducing dimensionality and focusing on the core error source.
It should be particularly noted that CC0 and CC3 are listed as highly sensitive parameters in some studies. However, tests conducted under free-flow conditions on long upgrades in this study show that their influence is far lower than that of CC1. Therefore, the above treatment is a reasonable simplification based on measured results under specific operating conditions, rather than a downgrade of the calibration hierarchy. The basis for parameter values and the calibration procedure are as follows:
- (1)
- CC0 (standstill distance) and CC3 (threshold for entering following)
Given that both parameters produced less than 5% perturbation on average delay in pre-experiments, and during the observation period the segments were operating under LOS III or above, with few occurrences of stopping queues or frequent state switching, CC0 and CC3 are assigned values based on relevant studies [46,47]: passenger car CC0 = 1.50 m, truck CC0 = 2.40 m, and CC3 = −8.00 s and are not separately calibrated.
- (2)
- CC1 (desired time headway)—core calibration parameter
CC1 directly represents the baseline time headway that drivers expect to maintain in car-following states and is a core parameter affecting capacity. This study adopts a trial-and-error method for calibration. The specific procedure is as follows: ① Based on measured car-following data, the average time headway of passenger cars in car-following states is calculated, yielding a reference target value of 1.8 s. ② Within a reasonable range of 1.0 s to 2.0 s, CC1 values are set one by one with a step size of 0.05 s. ③ For each set of CC1 values, the simulation model is run, and the simulated average time headway is extracted. ④ The optimal CC1 value is determined by minimizing the absolute error between the simulated time headway and the measured target value (1.8 s). Ultimately, when CC1 is set to 1.10 s, the simulated average time headway is 1.79 s, with an error of only 0.6% relative to the measured value of 1.8 s, meeting the calibration accuracy requirement. Thus, passenger car CC1 is determined as 1.10 s. For trucks, due to their lower speeds and larger time headways on grade segments, the measured average truck time headway is approximately 2.4 s. Using the same trial-and-error method as for passenger cars, within the range of 1.5 s to 2.5 s with a step size of 0.05 s, truck CC1 is set to 1.70 s (at this value, the simulated truck time headway is 2.38 s, with an error of less than 1%).
It should be noted that in the Wiedemann 99 model, the macroscopic average time headway under steady-state car following is not directly equivalent to the CC1 value but rather is a statistical output resulting from the coupled interaction of CC1 with CC0, CC2, CC3, and other parameters. Therefore, the calibrated CC1 value in this study is 1.10 s (for passenger cars), while the measured average time headway is 1.80 s. This numerical difference represents a normal mapping relationship between microscopic model parameters and macroscopic statistics and does not indicate a calibration error.
- (3)
- CC2 (following distance oscillation)
CC2 controls the random fluctuation amplitude of longitudinal spacing. This study uses the standard deviation of spacing within measured car-following segments (4.0 m) as the macroscopic reference target. Through tuning, the simulated spacing standard deviation is matched to the measured value. When CC2 is set to 4.00 m, the simulated standard deviation is 3.95 m, which agrees well with the measured value. The calibrated CC2 value is consistent with the VISSIM default, indicating that the default parameters are also applicable in this study scenario, further validating the reasonableness of the model settings, with smooth vehicle acceleration and no abnormal oscillations.
Combined with the above analysis, the calibrated values of each car-following model parameter in the VISSIM simulation model are listed in Table 2.
Table 2.
Calibrated car-following model parameters (Wiedemann 99).
3.3.4. Lane-Changing Model Calibration
VISSIM classifies lane-changing behavior into two categories: mandatory lane-changing and discretionary lane-changing. On long steep upgrades, vehicle lane-changing is primarily driven by speed differences, i.e., discretionary lane-changing, rather than by geometric constraints such as lane reductions or weaving sections. Therefore, this study focuses on the calibration of the discretionary lane-changing model. The core parameter for discretionary lane-changing is the safety distance reduction factor, which represents the reduction ratio of the lane-changing gap and is used to reduce the baseline safety time headway of the car-following model to calculate the critical gap threshold acceptable for lane-changing maneuvers.
Calibration data were derived from 110 passenger car discretionary lane-changing events extracted from UAV aerial footage. For each valid lane-changing event, the time headway of the following vehicle in the target lane at the insertion moment (i.e., the “acceptable gap”) was recorded. The measured data show that the mean acceptable gap is 1.7 s, with a standard deviation of 0.5 s. Considering the representativeness of risk preference in lane-changing behavior, this study selects the average acceptable gap (1.4 s) as the calibration benchmark value.
In VISSIM, the default value of the safety distance reduction factor is 1.0, corresponding to the lane-changing vehicle adopting the same safety distance standard as the car-following model. To reproduce the measured average acceptable gap of 1.4 s, this factor must be reduced. Through simulation tuning, when the reduction factor is set to 0.60, the simulated average acceptable gap is 1.38 s, with a relative error of 1.4% compared to the measured benchmark value of 1.4 s, meeting the calibration accuracy requirement. The safety distance reduction factor is therefore determined to be 0.60.
In addition, because field observations show that trucks rarely perform lane-changing maneuvers on steep upgrades (the vast majority of trucks crawl uphill at low speeds in the outer lane), no valid truck lane-changing event samples could be extracted. Therefore, truck lane-changing parameters retain the VISSIM default values. Other parameters related to discretionary lane-changing, including maximum deceleration, acceptable deceleration, and waiting time before disappearance, also remain at the VISSIM recommended defaults for expressway scenarios, as detailed in Table 3.
Table 3.
Lane-changing model parameters.
3.4. Simulation Experiment Design and Response Surface Methodology
3.4.1. Performance Metric
Average delay time per vehicle is chosen as the efficiency metric, defined as the difference between actual travel time and free-flow travel time. Delay is appropriate because stopping (and thus, the number of stops) is not applicable on expressways.
3.4.2. Rationale for Response Surface Methodology
Five factors (traffic volume, truck proportion, grade, grade length, reliability) are considered. A full factorial design with three levels per factor would require 243 simulation runs, which is computationally heavy and complex to calibrate. Therefore, the Box–Behnken Design (BBD) of response surface methodology is adopted. BBD advantages: (1) requires fewer runs (46 in this study); (2) fits a quadratic regression model, revealing interactions; (3) avoids predictions under extreme factor combinations.
3.4.3. Factor Levels
Factor ranges were determined based on China’s “Highway Engineering Technical Standards” and maximum service flow rates at Level of Service (LOS) C. Table 4 defines the levels for each design speed.
Table 4.
Factor levels for Box–Behnken Design.
4. Experimental Results
4.1. VISSIM Model Validation
To ensure reproducibility of the simulation results, the initial random seed was set to 42 with an increment of 3, and the average of 12 repeated simulation runs was adopted as the final output for each scenario. To verify the statistical robustness of the above observations, this study selected a specific operating condition—design speed 120 km/h, grade 4%, grade length 1000 m, traffic volume 6600 veh/h, and truck proportion 50%—which exhibits larger delay values and more pronounced data characteristics, and conducted an error analysis on the 12 repeated runs. Under this condition, the average delay was 17.54 s, with a standard deviation of 1.23 s across the 12 repeated runs, and the 95% confidence interval was [16.76 s, 18.32 s]. The relatively narrow confidence interval width (1.56 s) indicates that the delay estimate possesses high statistical stability, confirming that the constructed VISSIM simulation model has satisfactory accuracy.
4.1.1. Reliability Representation Accuracy
For a test scenario (grade 3%, length 600 m, traffic volume 3200 veh/h, truck proportion 50%), theoretical reliability values from 10% to 90% were set. The proportion of trucks with actual crest speed above allowable speed was simulated and compared to theoretical values. Table 5 shows that errors are within acceptable limits across 12 simulation repetitions, confirming that the VISSIM model accurately represents truck climbing speed reliability for subsequent analysis.
Table 5.
Reliability representation errors in VISSIM.
4.1.2. Speed Validation
The calibrated model was validated against measured speeds at the grade foot, middle, and crest, as well as average segment speed, using mean absolute percentage error (MAPE). Table 6 shows MAPE values within 11%, confirming that the VISSIM model effectively reproduces car-following and lane-changing behavior.
Table 6.
Speed validation MAPE (%) for different design speeds.
4.1.3. Validation of Car-Following and Lane-Changing Parameter Accuracy
To validate the generalizability of the calibrated car-following and lane-changing model parameters, an independent validation dataset (not involved in the parameter calibration process described in Section 3.3) was used to test the prediction accuracy of the calibrated model. The validation dataset consisted of 62 car-following events (38 passenger car groups and 24 truck groups) and 28 passenger car discretionary lane-changing events. The validation results are presented in Table 7. Specifically, the simulated average time headways for passenger cars and trucks were 1.79 s and 2.38 s, respectively, with relative errors of only 0.56% and 0.83% compared to the measured target values of 1.80 s and 2.40 s. The simulated spacing values were 34.80 m and 33.80 m, with relative errors of 1.14% and 0.88% relative to the measured values of 35.20 m and 34.10 m, respectively. In addition, the simulated mean acceptable gap for passenger car lane-changing was 1.38 s, with a relative error of 1.43% compared to the measured mean of 1.40 s.
Table 7.
Validation results of VISSIM model parameter calibration accuracy.
Based on the above validation results, the calibrated car-following and lane-changing model parameters exhibit satisfactory prediction accuracy and generalizability and can effectively support subsequent simulation analyses of operational efficiency under different operating conditions.
4.2. Reliability Results for Different Grade Conditions
Using the reliability model and Monte Carlo simulation (10,000 samples), crest-speed reliability was computed for the three design speeds across various grade and length combinations (Figure 7). Key observations: (1) For a given design speed, increasing grade and length both reduce reliability, and the negative effect of length accelerates with steeper grade. (2) Under the same grade conditions, reliability decreases as design speed increases. (3) When length exceeds a threshold, reliability can drop to 0%; however, this does not necessarily mean the segment fails design standards, because traffic volume and composition also matter.
Figure 7.
Crest-speed reliability vs. grade length for different grades: (a) design speed 120 km/h, (b) 100 km/h, (c) 80 km/h.
4.3. Operational Efficiency Model for Long Upgrades
Based on the BBD (46 runs), a quadratic regression model was fitted for each design speed with average delay (Y) as the response and traffic volume (A), truck proportion (B), grade (C), grade length (D), and reliability (E) as predictors. The models (for 120, 100, and 80 km/h) are given in Equations (4)–(6).
For the 120 km/h model, the analysis of variance (ANOVA) indicated that the regression model was highly significant (F = 52.75, p < 0.0001), with strong explanatory and predictive capability (R2 = 0.9769, adjusted R2 = 0.9583, predicted R2 = 0.9155). In addition, the lack-of-fit test was not significant (p = 0.3252), confirming that the quadratic response surface model adequately represented the relationship between operational efficiency and the influencing factors.
Among the main effects, traffic volume, truck proportion, grade, grade length, and reliability all had statistically significant impacts on average delay (p < 0.05). Significant interaction effects were mainly observed between traffic volume and truck proportion, traffic volume and grade length, and traffic volume and reliability, indicating that traffic demand plays a dominant role in amplifying the operational impacts of truck bottlenecks on long upgrades. By contrast, several interactions associated with grade variables were not statistically significant, suggesting that their effects are relatively independent within the investigated parameter range.
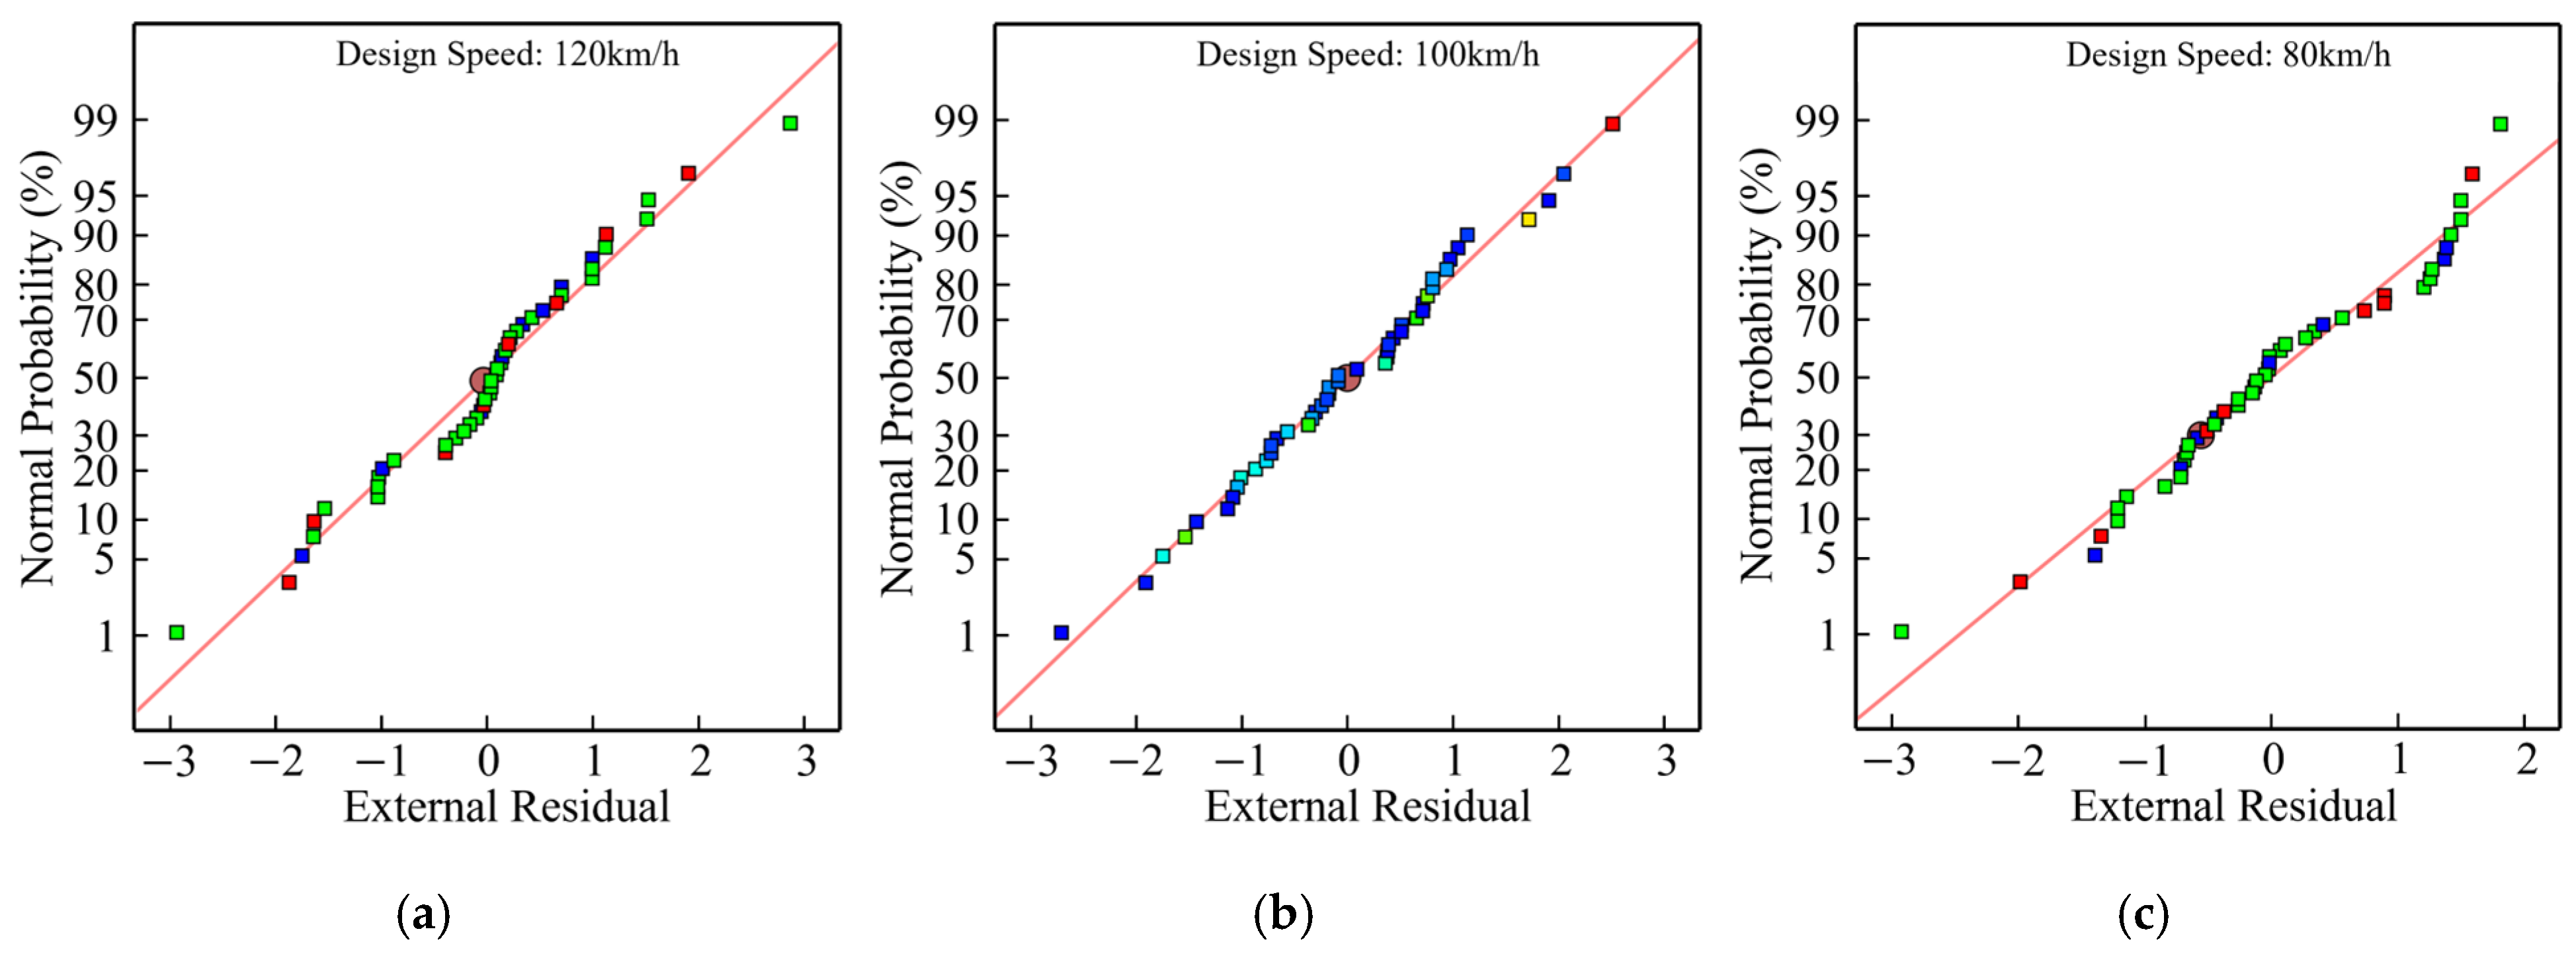
Similar statistical characteristics were observed for the 100 km/h and 80 km/h models, both showing high goodness-of-fit (R2 > 0.95) and non-significant lack-of-fit results. The complete ANOVA results and residual normal probability plots for all regression models are provided in Appendix A and Appendix B, respectively.
4.4. Interaction Between Traffic Volume and Truck Proportion
As shown in Figure 8, average delay increases with both traffic volume and truck proportion. At low traffic volume, increasing truck proportion from 0% to 50% causes almost no delay increase, indicating that the roadway has some capacity to absorb truck bottleneck effects. At high traffic volume, however, the same increase in truck proportion leads to a substantial delay increase, demonstrating a significant coupling amplification effect that doubly suppresses operational efficiency.
Figure 8.
Delay as a function of traffic volume and truck proportion: (a) 120 km/h, (b) 100 km/h, (c) 80 km/h.
Under the condition of a 4% grade, a 1000 m grade length, and a truck crest-speed reliability of 50%, average delay exhibits a continuous upward trend as both traffic volume and truck proportion on the expressway grade segment increase simultaneously, indicating that the increases in both factors have a significant superimposed negative effect on operational efficiency. Further analysis based on the contour distribution characteristics of average delay reveals that the magnitudes of the impacts of truck proportion and traffic volume on operational efficiency are roughly equivalent, suggesting that the two factors have similar sensitivity weights under this condition. Quantitatively, under the combined effect of the above factors, the average delay on the grade segment increases to 17.54 s, directly reflecting the degree of comprehensive deterioration in operational efficiency.
4.5. Interaction Between Grade and Grade Length
Figure 9 shows that for short grade lengths, increasing grade (e.g., from 1% to 4%) has a limited effect on delay. On long upgrades, the same grade increase produces a much larger delay increase. This aligns with the reliability analysis: grade length is a key condition that amplifies the negative effect of grade, together determining the cumulative speed degradation.
Figure 9.
Delay as a function of grade and grade length: (a) 120 km/h, (b) 100 km/h, (c) 80 km/h.
Under the condition of a constant truck proportion (50%), a fixed truck crest-speed reliability (50%), and traffic flow at full capacity, average delay on the expressway grade segment exhibits a significant upward trend as both grade and grade length increase simultaneously, indicating that increases in grade and grade length have a pronounced deteriorating effect on operational efficiency. Specifically, this negative impact is numerically reflected in an average delay increase of 38.72 s. However, from the characteristics of the average delay contour distribution, it can be observed that the marginal effect of increasing grade length on operational efficiency deterioration is greater than that of increasing grade.
4.6. Interaction Between Crest-Speed Reliability and Traffic Volume
Figure 10 shows that increasing crest-speed reliability significantly reduces average delay, especially under high traffic volume. For the 120 km/h case with traffic volume 5940 veh/h, increasing crest-speed reliability from 0% to 90% reduces delay from 6.54 s to 2.57 s. However, even at 90% crest-speed reliability, delay under high volume remains substantially higher than under low volume, indicating that improved climbing reliability partially mitigates but does not fully eliminate the congestion pressure from high traffic demand.
Figure 10.
Delay as a function of reliability and traffic volume: (a) 120 km/h, (b) 100 km/h, (c) 80 km/h.
Under the condition of a 4% grade, a 1000 m grade length, and a truck proportion of 50%, when truck crest-speed reliability remains constant, average delay continuously increases with rising traffic volume, and its marginal increasing effect becomes more pronounced as traffic volume grows. Meanwhile, under constant traffic volume, average delay exhibits a declining trend with increasing crest-speed reliability, indicating that improving truck crest-speed reliability helps enhance operational efficiency on grade segments. Notably, when crest-speed reliability decreases to 0.00% and traffic volume rises to the maximum service flow rate level, the increase in average delay on the grade segment reaches its maximum value of 21.74 s.
5. Discussion
This study proposes an operational efficiency analysis model for long steep upgrades that integrates truck crest-speed reliability and microscopic driving behavior. It quantifies truck bottleneck potential from a probabilistic perspective and reveals interactive effects among traffic volume, truck proportion, and grade conditions. The results demonstrate that conventional static PCE factors cannot capture the dynamic bottleneck caused by truck power degradation, whereas the empirically calibrated microsimulation model effectively reproduces car-following and lane-changing behavior on long upgrades, with validation errors within acceptable bounds (MAPE < 11%).
Compared with prior work, this study makes two novel contributions. First, it introduces crest-speed reliability theory, extending truck bottleneck characterization from deterministic threshold determination to probabilistic quantification, thereby addressing the neglect of truck speed stochasticity. Second, by combining UAV-extracted trajectory data with VISSIM simulation, it achieves fine-grained modeling of truck climbing speed degradation on long upgrades, embedding microscopic driver behavior into the efficiency analysis framework. The results show significant interactions between traffic volume and truck proportion and between traffic volume and crest-speed reliability. Under high traffic demand, a higher truck fraction amplifies average delay, while larger grade and length are key triggers of truck bottleneck formation—findings consistent with existing moving bottleneck mechanism studies.
From the relationship between truck crest-speed reliability and grade–length conditions investigated in this study, it can be observed that the maximum grade lengths currently adopted in China’s Highway Engineering Technical Standards are overly aggressive. For example, under a design speed of 120 km/h and a 4% grade, maintaining a 95% reliability standard would require the grade length to be kept below 232 m. However, the standards generally adopt a length of 700 m. This discrepancy indicates that the current standard for 4% grade conditions would reduce truck crest-speed reliability on expressway grade segments to 13.47%, effectively increasing the potential probability of truck bottleneck occurrence by a factor of six. Moreover, compared with the traditional PCE method, the model proposed in this paper can effectively quantify the average delay on steep expressway upgrades, rather than merely providing a coarse level-of-service classification. This distinction arises from differences in evaluation objectives. The premise of the proposed model is that the expressway grade segment operates at a relatively good level of service without severe congestion, thus serving as a refinement and complement to the traditional PCE method.
The framework proposed in this paper also provides practical references for sustainable transportation system management. On long steep upgrades of mountainous expressways, severe truck deceleration induces frequent passenger-car–truck interactions and speed disturbances, directly reducing operational efficiency and increasing travel time delays. By optimizing grade–length combinations, implementing traffic management measures, or improving truck powertrain performance to enhance crest-speed reliability, traffic disturbances can be mitigated and overall traffic flow stability can be strengthened. The model can be applied to evaluate the real-time operational efficiency of existing expressway grade segments using grade design data, real-time traffic volume, and truck proportion measurements.
Furthermore, for longitudinal grade design during the expressway design phase, the operational efficiency evaluation model developed in this study can be directly applied to determine grade and grade length indices. As shown in Figure 11, by projecting the average delay results calculated from the response surface models under different design speeds onto the reliability curves, the grade length corresponding to the intersection of the specified average delay contour and the reliability value represents the maximum design grade length that satisfies operational efficiency requirements. Once designers adopt a grade length exceeding this value, the operational efficiency of the grade segment will fail to meet the design level of service.
Figure 11.
Diagram of coupling effects of three factors: gradient, slope length and reliability: (a) 120 km/h, (b) 100 km/h, and (c) 80 km/h.
Furthermore, the “sustainability” addressed in this paper primarily refers to economic sustainability, with a focus on optimizing road operational efficiency and reducing economic losses from delays. Environmental benefits such as fuel consumption and exhaust emissions are considered secondary potential benefits and are not quantitatively analyzed in this study. Future work may incorporate energy consumption and emission estimation models to establish a sustainability assessment framework that addresses both economic and environmental dimensions.
Meanwhile, due to the limitations of the Box–Behnken experimental design, all operating conditions in this study were used for model fitting, and no independent validation set was established for external generalizability testing. Although the model exhibits good internal fit (R2 > 0.95) with a non-significant lack-of-fit term, its predictive generalizability beyond the factor ranges still requires further verification.
This study still has certain limitations, which should be considered when interpreting the conclusions and also point toward future research directions. ① This study selects a weak-power, fully loaded conventional diesel truck at the 20th percentile of China’s truck power distribution as the research object, representing a conservative worst-case scenario. It does not cover medium- and high-power diesel trucks, different loading conditions, or new-energy heavy trucks such as pure electric and hydrogen fuel cell vehicles. Therefore, the conclusions are only applicable to mountainous expressways dominated by weak-power diesel trucks and are not generalizable to segments with a high proportion of high-horsepower or new-energy trucks. ② UAV trajectory data were collected only from the Lianhuo, Fuyin, and Xihan Expressways in central and western China. Although these cover the mainstream design speeds, the regional and geometric sample is limited and cannot be directly adapted to differentiated road scenarios such as continuous steep grades in southwest China or plain terrains in northeast China. In addition, traffic data under non-free-flow conditions were not collected for model validation. ③ The simulation was conducted solely under free-flow conditions and did not consider external disturbances such as accident-induced congestion, adverse weather, or road construction. Meanwhile, the influence of individual driver heterogeneity on uphill car-following and lane-changing behavior was not quantified. ④ This study only analyzes segments with relatively straight horizontal alignments and does not investigate traffic flow characteristics under small-radius horizontal curves, tunnels, interchanges, or the coupled effects of horizontal and vertical alignments.
6. Conclusions
This paper addresses the inability of traditional static indices to capture the coupled effects of dynamic truck bottlenecks and microscopic driver behavior on long steep upgrades and proposes an operational efficiency model based on truck crest-speed reliability and microsimulation. The main conclusions are:
- Probabilistic characterization of potential truck bottlenecks: A reliability method based on truck dynamics and Monte Carlo simulation quantifies the potential probability of truck bottleneck formation. Increasing grade and length, as well as higher traffic volume and truck proportion, significantly reduce crest-speed reliability, providing a theoretical basis for probabilistic bottleneck characterization.
- Microsimulation model incorporating driver behavior: A VISSIM model calibrated with UAV-extracted trajectory, speed, and headway data accurately reproduces car-following and lane-changing behaviors. Desired speed decision points enable precise simulation of truck climbing speed degradation. Validation shows crest speed errors < 9% and reliability errors < 10%, confirming the model’s ability to replicate traffic flow characteristics on long upgrades.
- Interaction effects on operational efficiency: The response-surface efficiency model reveals significant interactions between traffic volume and truck proportion and between traffic volume and crest-speed reliability. Under high traffic demand, a higher truck fraction amplifies average delay, whereas improved crest-speed reliability mitigates truck bottleneck effects. These findings provide quantitative support for efficiency optimization on long upgrades.
Engineering implications: For mountainous expressway design and operations, the potential bottleneck probability can be reduced by adjusting truck proportion, optimizing grade–length combinations, or improving truck powertrain performance. The results inform grade design selection and traffic management strategies for long upgrades.
The results inform grade design selection and traffic management strategies for long upgrades while also supporting sustainable mountainous freeway operations through reduced traffic disturbances, improved traffic flow stability, and potentially lower vehicle energy consumption and emissions.
Future research can be further extended in the following directions: (1) incorporating the climbing characteristics of medium-power and high-power diesel trucks as well as different loading conditions (empty, partial load) to conduct sensitivity analyses under multi-type truck scenarios; (2) as the penetration rate of new-energy trucks gradually increases, subsequent studies may conduct dedicated research on the climbing powertrain performance and bottleneck effects of new-energy trucks such as pure electric and hybrid vehicles; (3) further integrating energy consumption and emission estimation models to evaluate the comprehensive impacts of long steep upgrades within a more holistic sustainability framework.
Author Contributions
Conceptualization, Z.L. and B.P.; methodology, B.P.; software, Z.L.; validation, Z.L., B.L. and B.P.; formal analysis, Z.L.; investigation, Z.L. and B.L.; resources, B.P. and B.L.; data curation, Z.L.; writing—original draft preparation, Z.L.; writing—review and editing, B.P.; visualization, Z.L.; supervision, B.P.; project administration, B.P. All authors have read and agreed to the published version of the manuscript.
Funding
This research received no external funding.
Institutional Review Board Statement
Not applicable.
Informed Consent Statement
Not applicable.
Data Availability Statement
The original contributions presented in this study are included in the article. Further inquiries can be directed to the corresponding author.
Acknowledgments
Generative AI tool ChatGPT-4 (OpenAI) was employed to refine the English language of this manuscript, including grammar correction, sentence rephrasing, and clarity improvement, to meet academic writing standards. The use of this tool was limited to language polishing only. All data analysis, interpretations, and conclusions were independently completed by the authors, and the AI tool did not contribute to the generation of any original scientific content or the manipulation of research results.
Conflicts of Interest
Author Bin Li is employed by C.C.C.C. First Highway Consultants Co., Ltd., the remaining authors are affiliated with the University. The authors declare no conflict of interest.
Appendix A
Appendix A presents the ANOVA results of the response surface regression models under different design speeds.
Table A1.
ANOVA results of the regression model (120 km/h).
Table A2.
ANOVA results of the regression model (100 km/h).
Table A3.
ANOVA results of the regression model (80 km/h).
Appendix B
The residual normal probability plots for the regression models under different design speeds are shown in Figure A1.
Figure A1.
Residual normal probability plot: (a) 120 km/h, (b) 100 km/h, (c) 80 km/h.
References
- Ministry of Transport of the People’s Republic of China. 2024 Statistical Bulletin on the Development of the Transportation Industry; Ministry of Transport: Beijing, China, 2025. [Google Scholar]
- Xu, J.L.; Lei, B.; Li, N. Operating speed characteristics of heavy vehicle on expressway uphill section. J. Traffic Transp. Eng. 2013, 13, 14–19. [Google Scholar]
- Lyu, Z.; Hu, X.; Zhang, F.; Liu, T.; Cui, Z. Heterogeneous traffic flow characteristics on the highway with a climbing lane under different truck percentages: The framework of Kerner’s three-phase traffic theory. Phys. A Stat. Mech. Its Appl. 2022, 587, 126471. [Google Scholar]
- Saldarini, A.; Miraftabzadeh, S.M.; Brenna, M.; Longo, M. Strategic approach for electric vehicle charging infrastructure for efficient mobility along highways: A real case study in Spain. Vehicles 2023, 5, 761–779. [Google Scholar] [CrossRef] [Scilit]
- Kong, D.; Sun, L.; Li, J.; Xu, Y. Modeling cars and trucks in the heterogeneous traffic based on car–truck combination effect using cellular automata. Phys. A Stat. Mech. Its Appl. 2021, 562, 125329. [Google Scholar] [CrossRef] [Scilit]
- Zhang, L.; Gong, K.; Yin, X.; Li, Y.; Chen, H. Development of a car-following model incorporating the oppression effects of large trucks. Phys. A Stat. Mech. Its Appl. 2025, 674, 130793. [Google Scholar] [CrossRef] [Scilit]
- Yan, S.; Zhu, Y.; Luo, H.; Pan, J.; Wang, H. Mandatory lane-changing strategy for connected automated trucks in off-ramp area based on evolutionary game theory. Phys. A Stat. Mech. Its Appl. 2025, 675, 130860. [Google Scholar]
- Newell, G.F. A moving bottleneck. Transp. Res. Part B Methodol. 1998, 32, 531–537. [Google Scholar] [CrossRef] [Scilit]
- Alshabibi, N.M. Assessment of passenger car equivalency for increased heavy vehicles percentage on urban multilane roads—A field-based study. Future Transp. 2026, 6, 85. [Google Scholar]
- Purkrábková, Z.; Ruzicka, J. The relevance of heterogeneous floating car data for macroscopic fundamental diagram analysis. IET Intell. Transp. Syst. 2026, 20, e70171. [Google Scholar] [CrossRef] [Scilit]
- Çelík, B.; Tortum, A.; Çíntas, E.; Atalay, K.D. Analysing headway spacing and calculating passenger car equivalent values using computer vision and international dataset. Promet-Traffic Transp. 2025, 37, 888–910. [Google Scholar] [CrossRef] [Scilit]
- Lertworawanich, P.; Elefteriadou, L. Estimation of passenger car equivalents on basic freeway segments from field-observed traffic data. Transp. Res. Rec. 2025, 2679, 108–124. [Google Scholar] [CrossRef] [Scilit]
- Cottam, A.; Li, X.F.; Wu, Y.J. Machine-learning approach for estimating passenger car equivalent factors using crowdsourced data. Transp. A Transp. Sci. 2026, 22, 2377600. [Google Scholar]
- Cheng, P.L.; Zhao, Y.; Song, Z.Y.; Liu, W. PCE algorithm for mixed traffic flow at intersections based on saturated time headway. In CICTP 2023: Innovation-Empowered Technology for Sustainable, Intelligent, Decarbonized, and Connected Transportation; American Society of Civil Engineers: Reston, VA, USA, 2023; pp. 1884–1894. [Google Scholar]
- Yuksel, E.; Bertini, R.L.; Li, X.; Ouyang, Y. Data-driven computation of state-dependent passenger car equivalency for multiple truck lengths. Transp. Res. Rec. 2022, 2676, 194–205. [Google Scholar]
- Ahmed, A.; Noman, S.M.; Baig, M.A.U.; Ali, M. Estimating passenger car equivalent factors for heterogeneous traffic using occupancy-density linear regression model. Transp. Res. Rec. 2022, 2676, 209–220. [Google Scholar] [CrossRef] [Scilit]
- Lu, P.; Zheng, Z.J.; Tolliver, D.; Pan, D. Measuring passenger car equivalents for heavy vehicle on two lane highway segments operating under various traffic conditions. J. Adv. Transp. 2020, 2020, 6972958. [Google Scholar] [CrossRef] [Scilit]
- Wang, Z.; Zhu, H.; Wu, Q.; Wang, Z. Analysis of optimization strategy for trucks in highway traffic with a long tunnel. Phys. A Stat. Mech. Its Appl. 2025, 658, 130290. [Google Scholar]
- Shi, Y.; Wu, T.; Guo, T.; Huang, Z.; Chen, J. Traffic simulation optimization considering driving styles. Commun. Transp. Res. 2025, 5, 100181. [Google Scholar] [CrossRef] [Scilit]
- Chen, Y.; Zhang, F.; Qian, Y.; Zeng, J. A new car-following model considering the driver’s dynamic reaction time and driving visual angle on the slope. Phys. A Stat. Mech. Appl. 2025, 663, 130408. [Google Scholar]
- Afshari, A.; Lee, J.; Besenski, D.; Dimitrijevic, B.; Spasovic, L. Calibrating microscopic traffic simulation model using connected vehicle data and genetic algorithm. Appl. Sci. 2025, 15, 1496. [Google Scholar] [CrossRef] [Scilit]
- Ranpura, P.; Gujar, R.; Singh, S. Development of mixed traffic microsimulation model calibration for signalized intersections. Transp. Res. Procedia 2025, 82, 2898–2910. [Google Scholar] [CrossRef] [Scilit]
- Azam, M.; Hassan, S.A.; Puan, O.C. Calibration methodologies of VISSIM-based microsimulation model for heterogeneous traffic conditions—A survey. Adv. Transp. Stud. Int. J. 2023, 59, 123–146. [Google Scholar]
- Qawasmeh, B. Enhancing work zone safety: Evaluating static merge strategies through microscopic traffic simulation. Open Transp. J. 2024, 18, e18744478330254. [Google Scholar] [CrossRef] [Scilit]
- Hafram, M.; Valery, S.; Hasim, A. Calibrating and validation microscopic traffic simulation models VISSIM for enhanced highway capacity planning. Int. J. Eng. 2023, 36, 1509–1519. [Google Scholar] [CrossRef] [Scilit]
- Monteiro, F.V.; Savla, K.; Ioannou, P. Optimal coordinated platoon lane change in highways with mixed traffic. Veh. Commun. 2025, 54, 100924. [Google Scholar] [CrossRef] [Scilit]
- Liu, X.; Zhang, X. Cooperative lane-changing optimisation of connected and autonomous vehicles in freeway merging area. Phys. A Stat. Mech. Its Appl. 2025, 37, 1474–1488. [Google Scholar] [CrossRef] [Scilit]
- Li, Q.; Li, X.; Huang, Z.; Zhao, J. Simulation of mixed traffic with cooperative lane changes. Comput.-Aided Civ. Infrastruct. Eng. 2022, 37, 1978–1996. [Google Scholar]
- Liu, Y.; Ding, J.Q. Collaborative control of lane changing for autonomous vehicles in high-density heterogeneous traffic flow. IET Intell. Transp. Syst. 2025, 19, e70124. [Google Scholar]
- Farooq, D.; Juhasz, J. Simulation-based analysis of the effect of significant traffic parameters on lane changing for driving logic “Cautious” on a freeway. Sustainability 2019, 11, 5976. [Google Scholar] [CrossRef] [Scilit]
- Yuan, K.; Lo, H.K. Multiclass traffic flow dynamics: An endogenous model. Transp. Sci. 2021, 55, 456–474. [Google Scholar] [CrossRef] [Scilit]
- Ou, H.; Tang, T.Q. Impacts of moving bottlenecks on traffic flow. Phys. A Stat. Mech. Appl. 2018, 500, 131–138. [Google Scholar] [CrossRef] [Scilit]
- Zhang, R.X.; Luo, W.B.; Du, J.J.; Wang, Y. Simulation-based analysis of moving bottleneck characteristics on freeways. In ICITE 2025: Intelligent Transportation Engineering; Springer: Singapore, 2026; pp. 207–221. [Google Scholar]
- Chen, Q.C.; Zhu, S.Y.; Wu, J.G.; Li, Y. Empirical dynamics of traffic moving jams: Insights from Kerner’s three-phase traffic theory. Phys. A Stat. Mech. Appl. 2024, 648, 129953. [Google Scholar]
- Xiu, W.J.; Luo, S.J.; Li, K.L.; Huang, X. Optimization of cellular automata model for moving bottlenecks in urban roads. Appl. Sci. 2025, 15, 3547. [Google Scholar] [CrossRef] [Scilit]
- Fadhloun, K.; Rakha, H.; Loulizi, A. Comprehensive framework for estimating traffic stream flow rates past moving bottlenecks. Transp. Res. Rec. 2014, 2422, 61–70. [Google Scholar] [CrossRef] [Scilit]
- Zhang, F.; Qian, Y.; Zeng, J. Characterizing heterogeneous traffic flow at a slope bottleneck via cellular automaton model. IEEE Trans. Intell. Transp. Syst. 2023, 24, 6507–6516. [Google Scholar]
- Wang, X.; Zeng, J.; Qian, Y.; Zhang, F. Heterogeneous traffic flow of expressway with Level 2 autonomous vehicles considering moving bottlenecks. Phys. A Stat. Mech. Its Appl. 2024, 650, 129991. [Google Scholar] [CrossRef] [Scilit]
- Čičić, M.; Xiong, X.; Jin, L.; Johansson, K.H. Coordinating vehicle platoons for highway bottleneck decongestion and throughput improvement. IEEE Trans. Intell. Transp. Syst. 2022, 23, 8959–8971. [Google Scholar]
- Ma, Y.Y.; Zhang, Y.J.; Qin, X.R.; Liu, H. An on-ramp metering control strategy considering freeway moving bottlenecks in intelligent and connected transportation systems. Int. J. Intell. Transp. Syst. Res. 2025, 23, 1242–1256. [Google Scholar]
- Simoni, M.D.; Claudel, C.G. A fast simulation algorithm for multiple moving bottlenecks and applications in urban freight traffic management. Transp. Res. Part B Methodol. 2017, 104, 238–255. [Google Scholar] [CrossRef] [Scilit]
- Wang, G.; Chen, Y.; An, P.; Hong, H.; Hu, J.; Huang, T. UAV-YOLOv8: A small-object-detection model based on improved YOLOv8 for UAV aerial photography scenarios. Sensors 2023, 23, 7190. [Google Scholar] [PubMed]
- Shin, S.; Shin, J.; Song, B.; Lee, S.; Kim, Y.; Jung, G.; Jeon, S. Wireless power transfer system for high power application and a method of segmentation. In 2013 IEEE Wireless Power Transfer (WPT), Perugia, Italy, 15–16 May 2013; IEEE: New York, NY, USA, 2013; pp. 76–78. [Google Scholar]
- Wang, H.; Wu, Y.; Madawala, U.K.; Li, X.; Dai, X.; Sun, Y.; Hu, J. Integrated coupler design for UAV free-positioning wireless power transfer with inherent cross-coupling utilization and enlarged charging coverage. IEEE Trans. Power Electron. 2025, 40, 14324–14330. [Google Scholar]
- Liu, Y.; Fu, Z.; Ma, Y.; Pan, B. Sustainable transportation design: Examining the application effect of auxiliary lanes on dual-lane exit ramps on Chinese freeways. Sustainability 2025, 17, 1533. [Google Scholar] [CrossRef] [Scilit]
- Zhu, M.; Wang, X.; Tarko, A.; Fang, S. Modeling car-following behavior on urban expressways in Shanghai: A naturalistic driving study. Transp. Res. Part C Emerg. Technol. 2018, 93, 425–445. [Google Scholar] [CrossRef] [Scilit]
- Ran, J.; Zhao, W.; Li, M.; Tang, D.; Zhang, Y.; Abula, R. Speed Limit Strategies for Median Crossover Sections in Freeway Reconstruction and Expansion: A Case Study of a Four-to-Eight-Lane Expansion Project in a Plain Area. Sustainability 2026, 18, 4983. [Google Scholar]
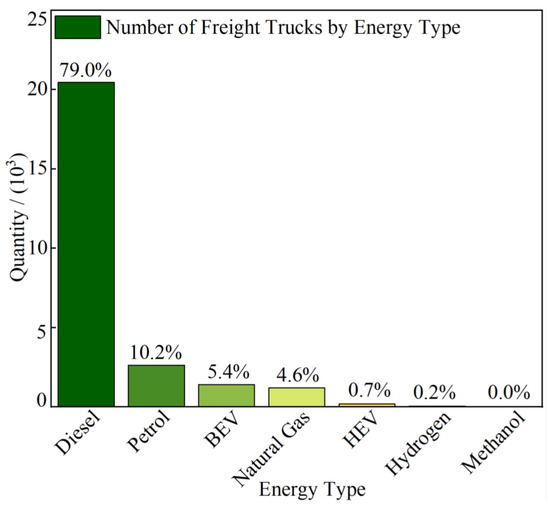
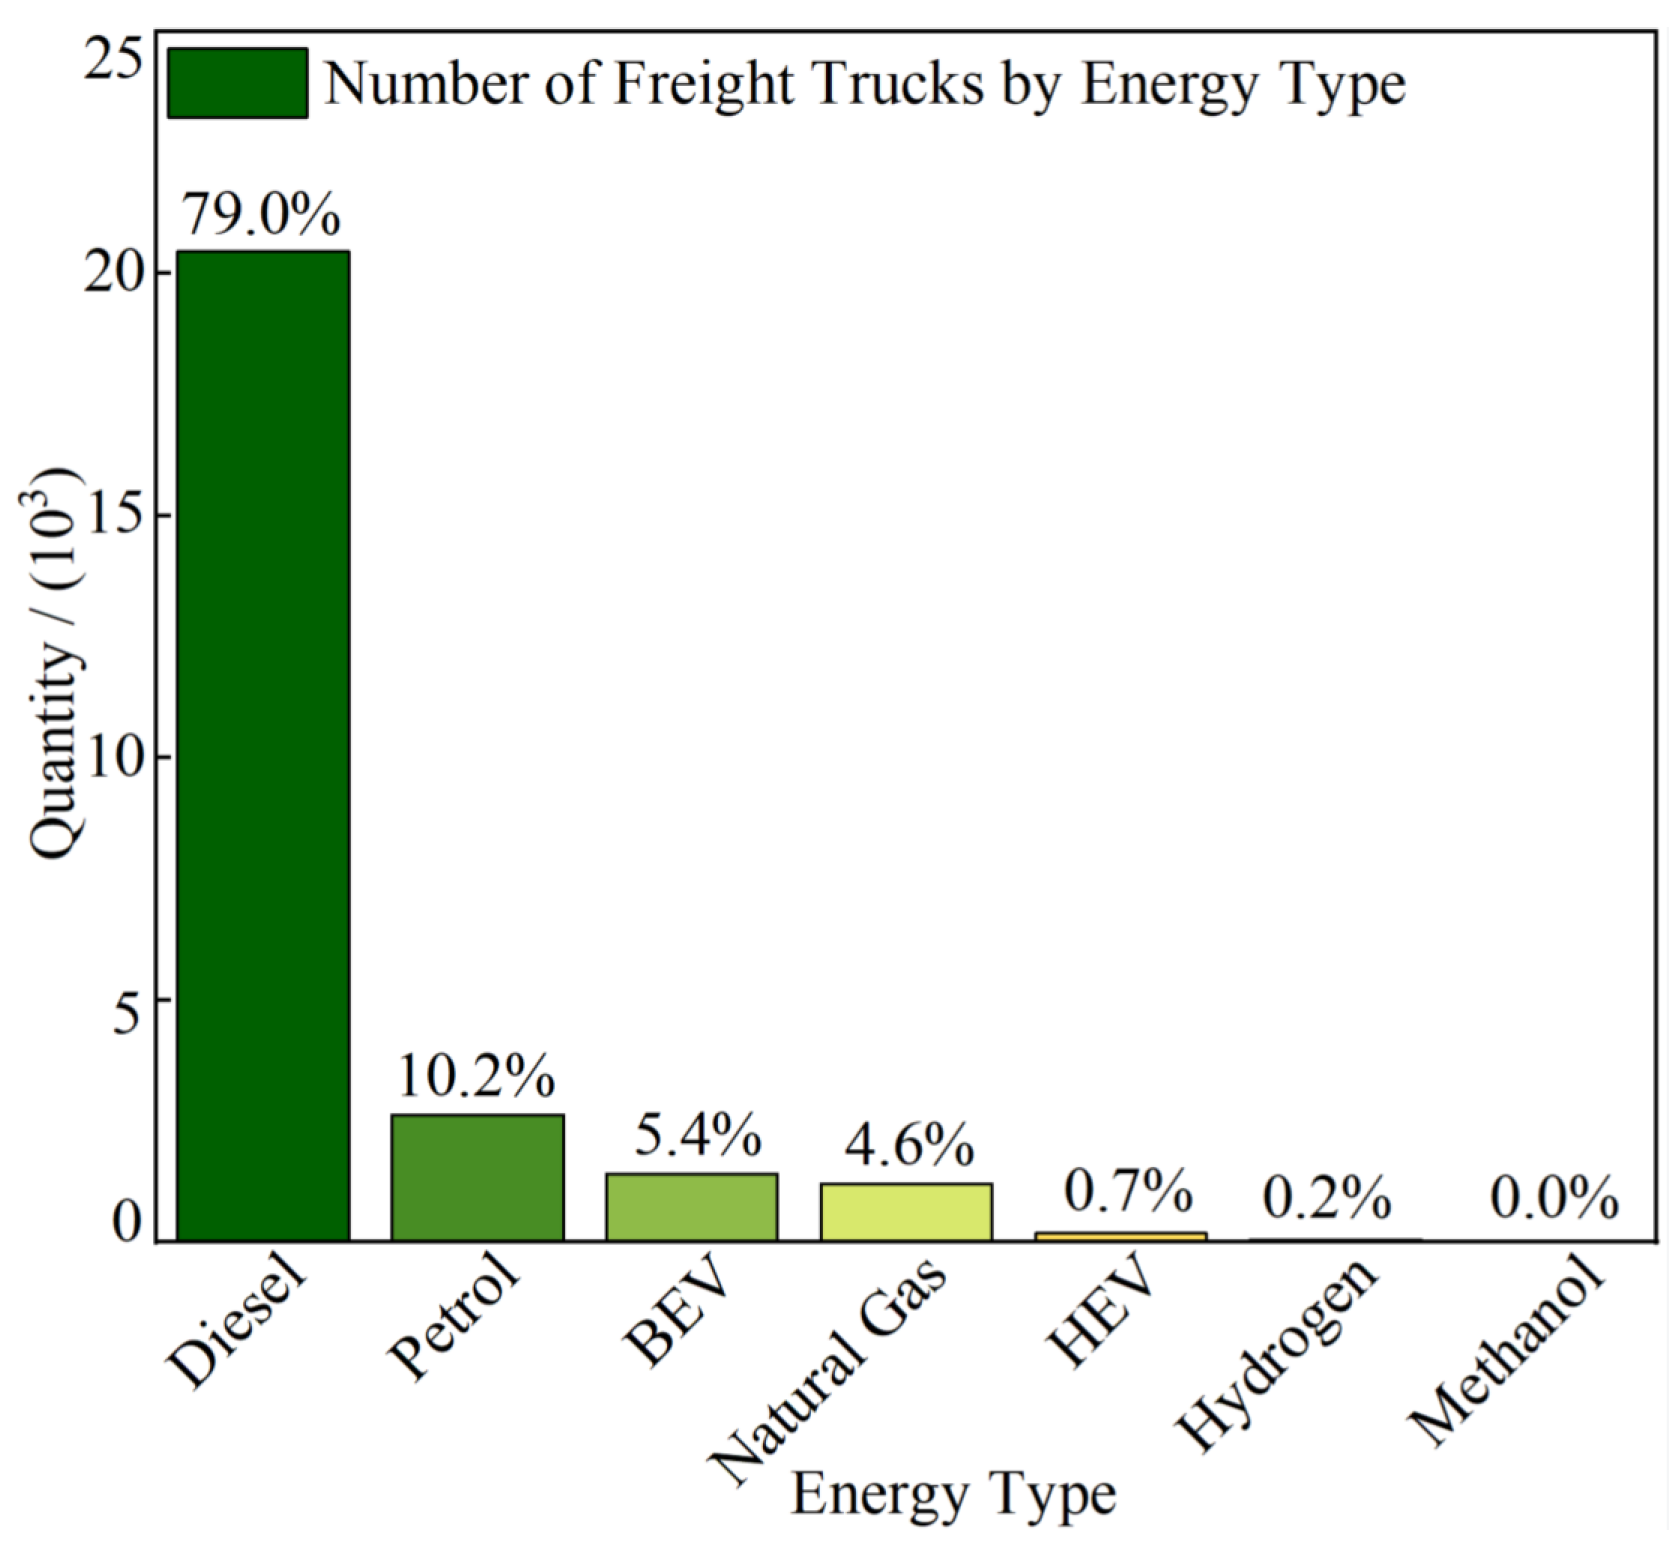
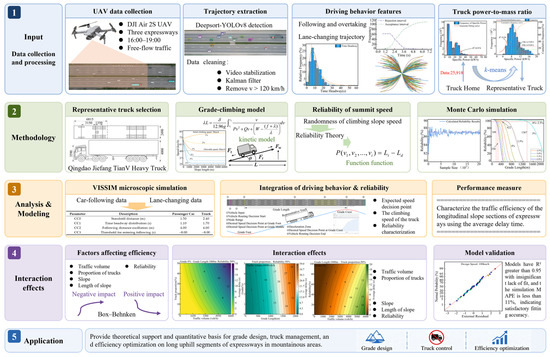
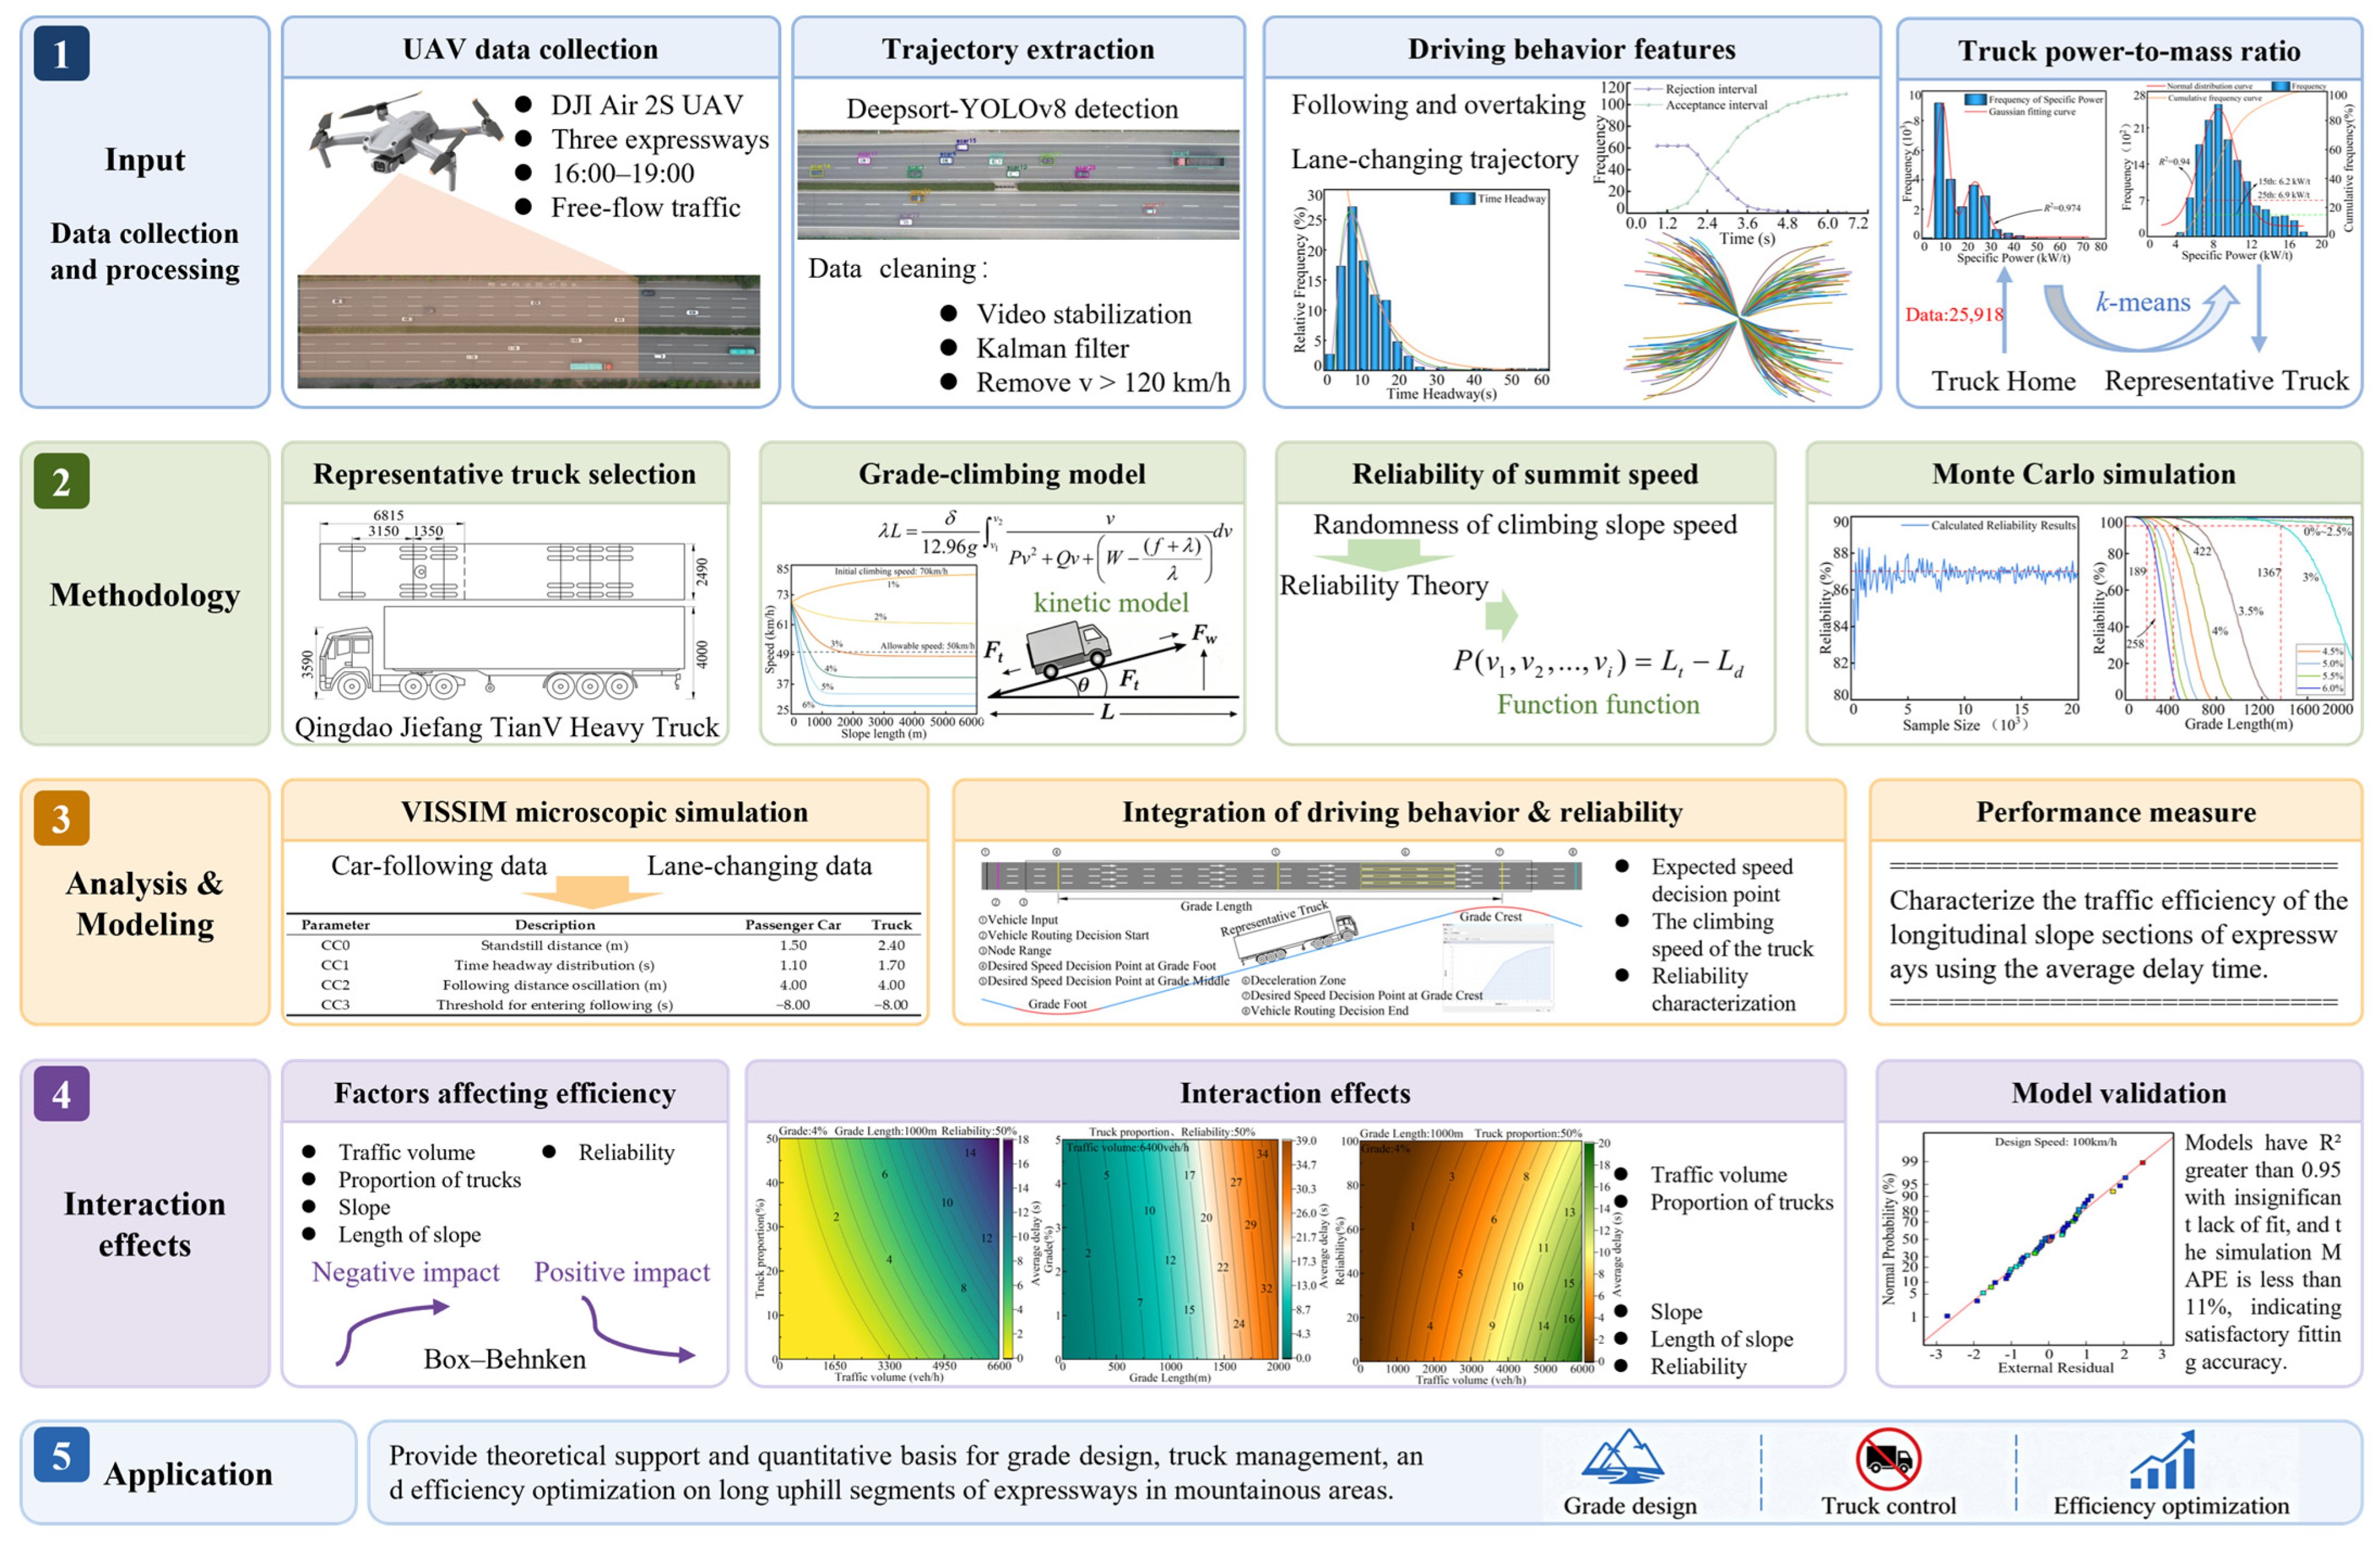


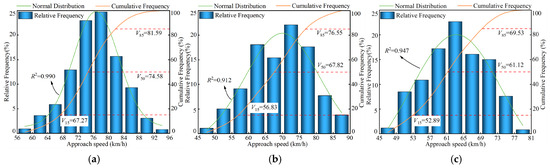
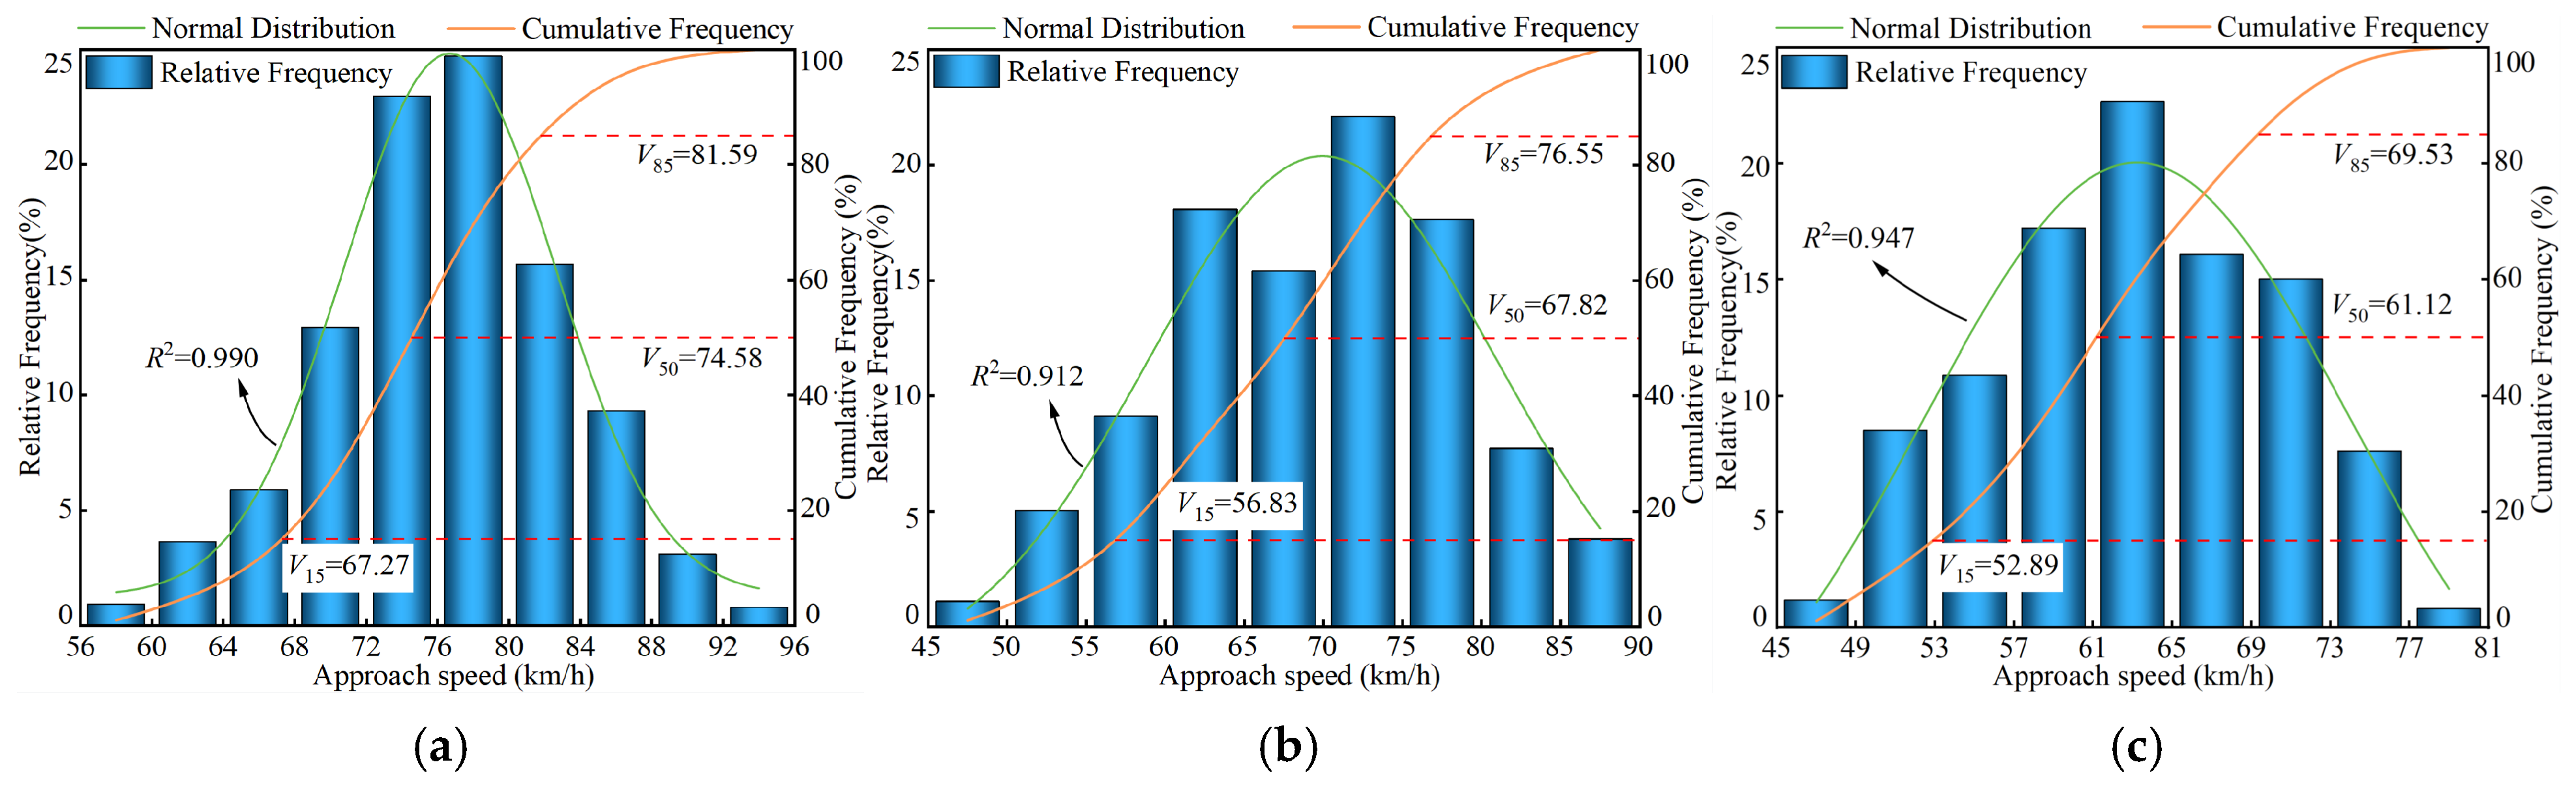
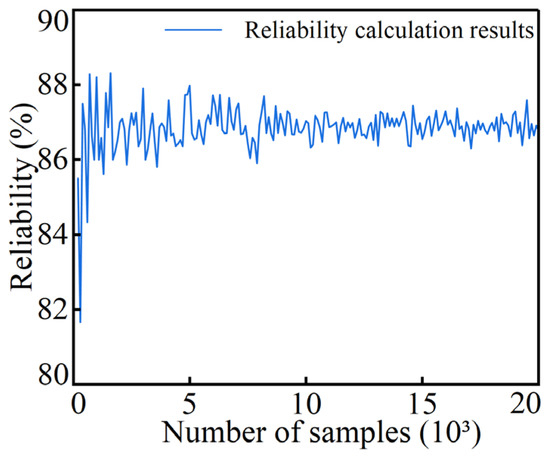
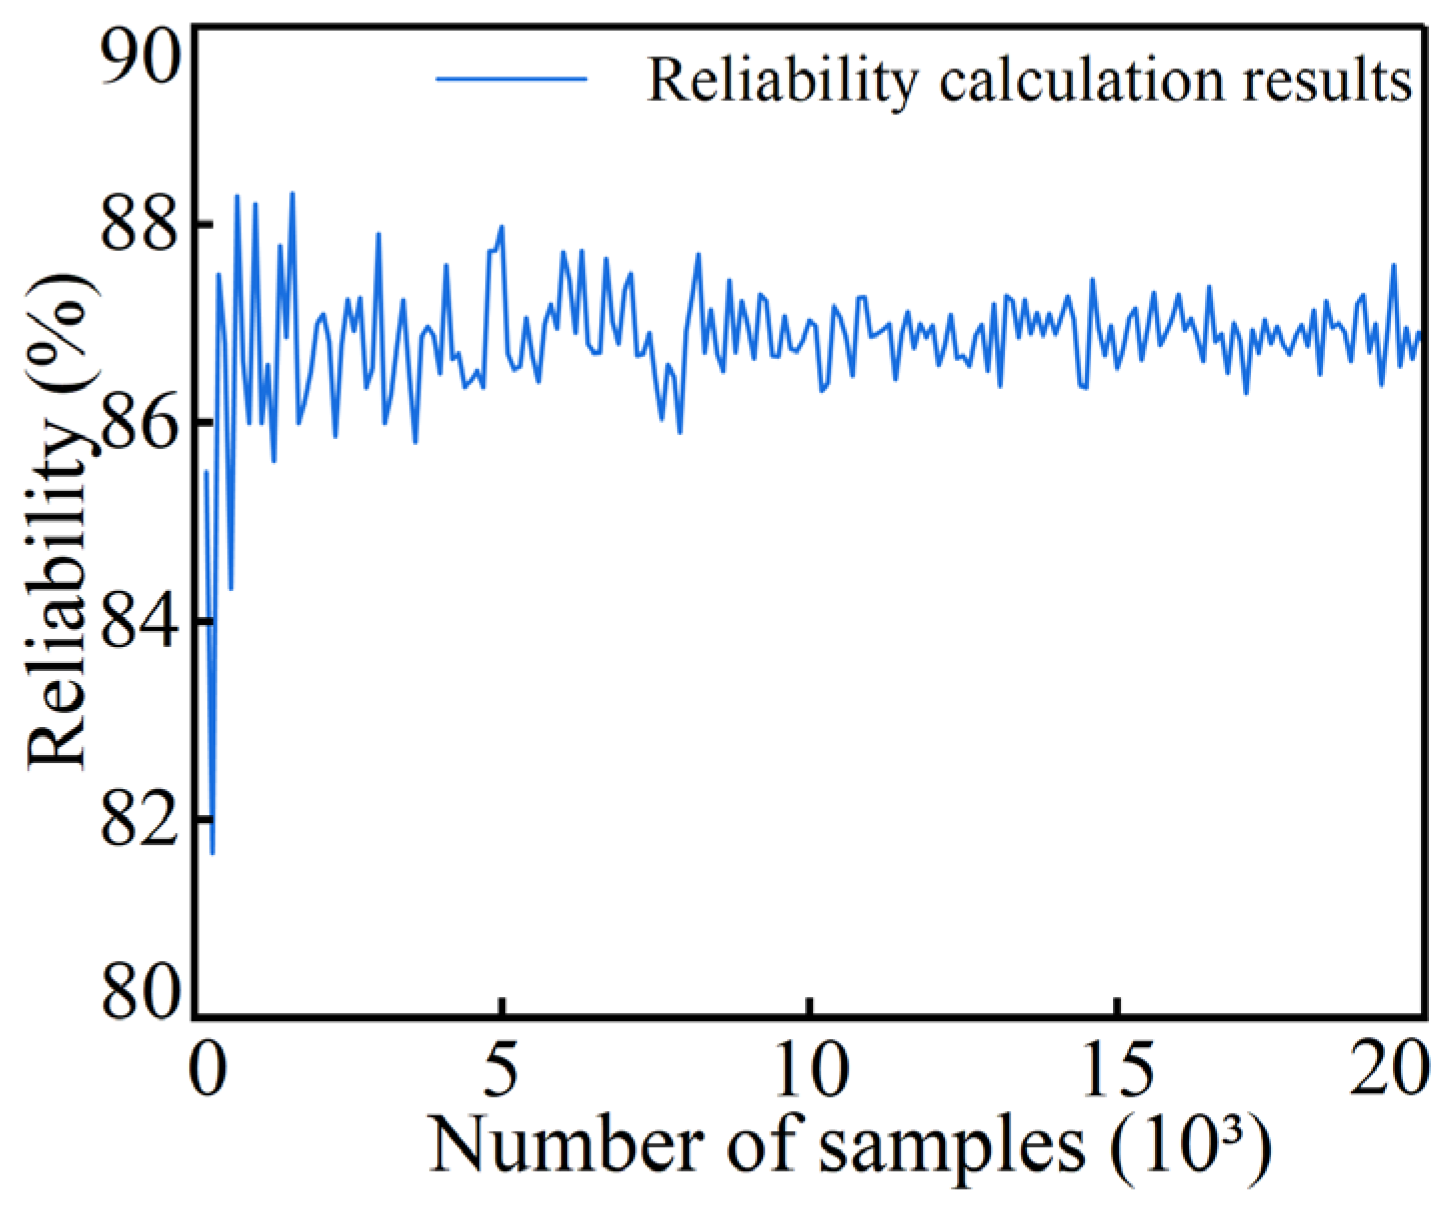
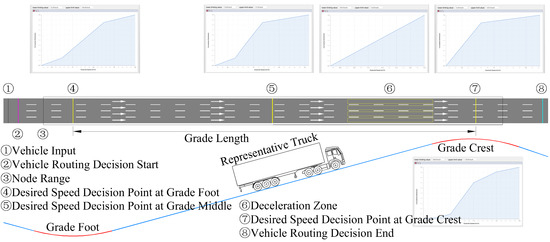
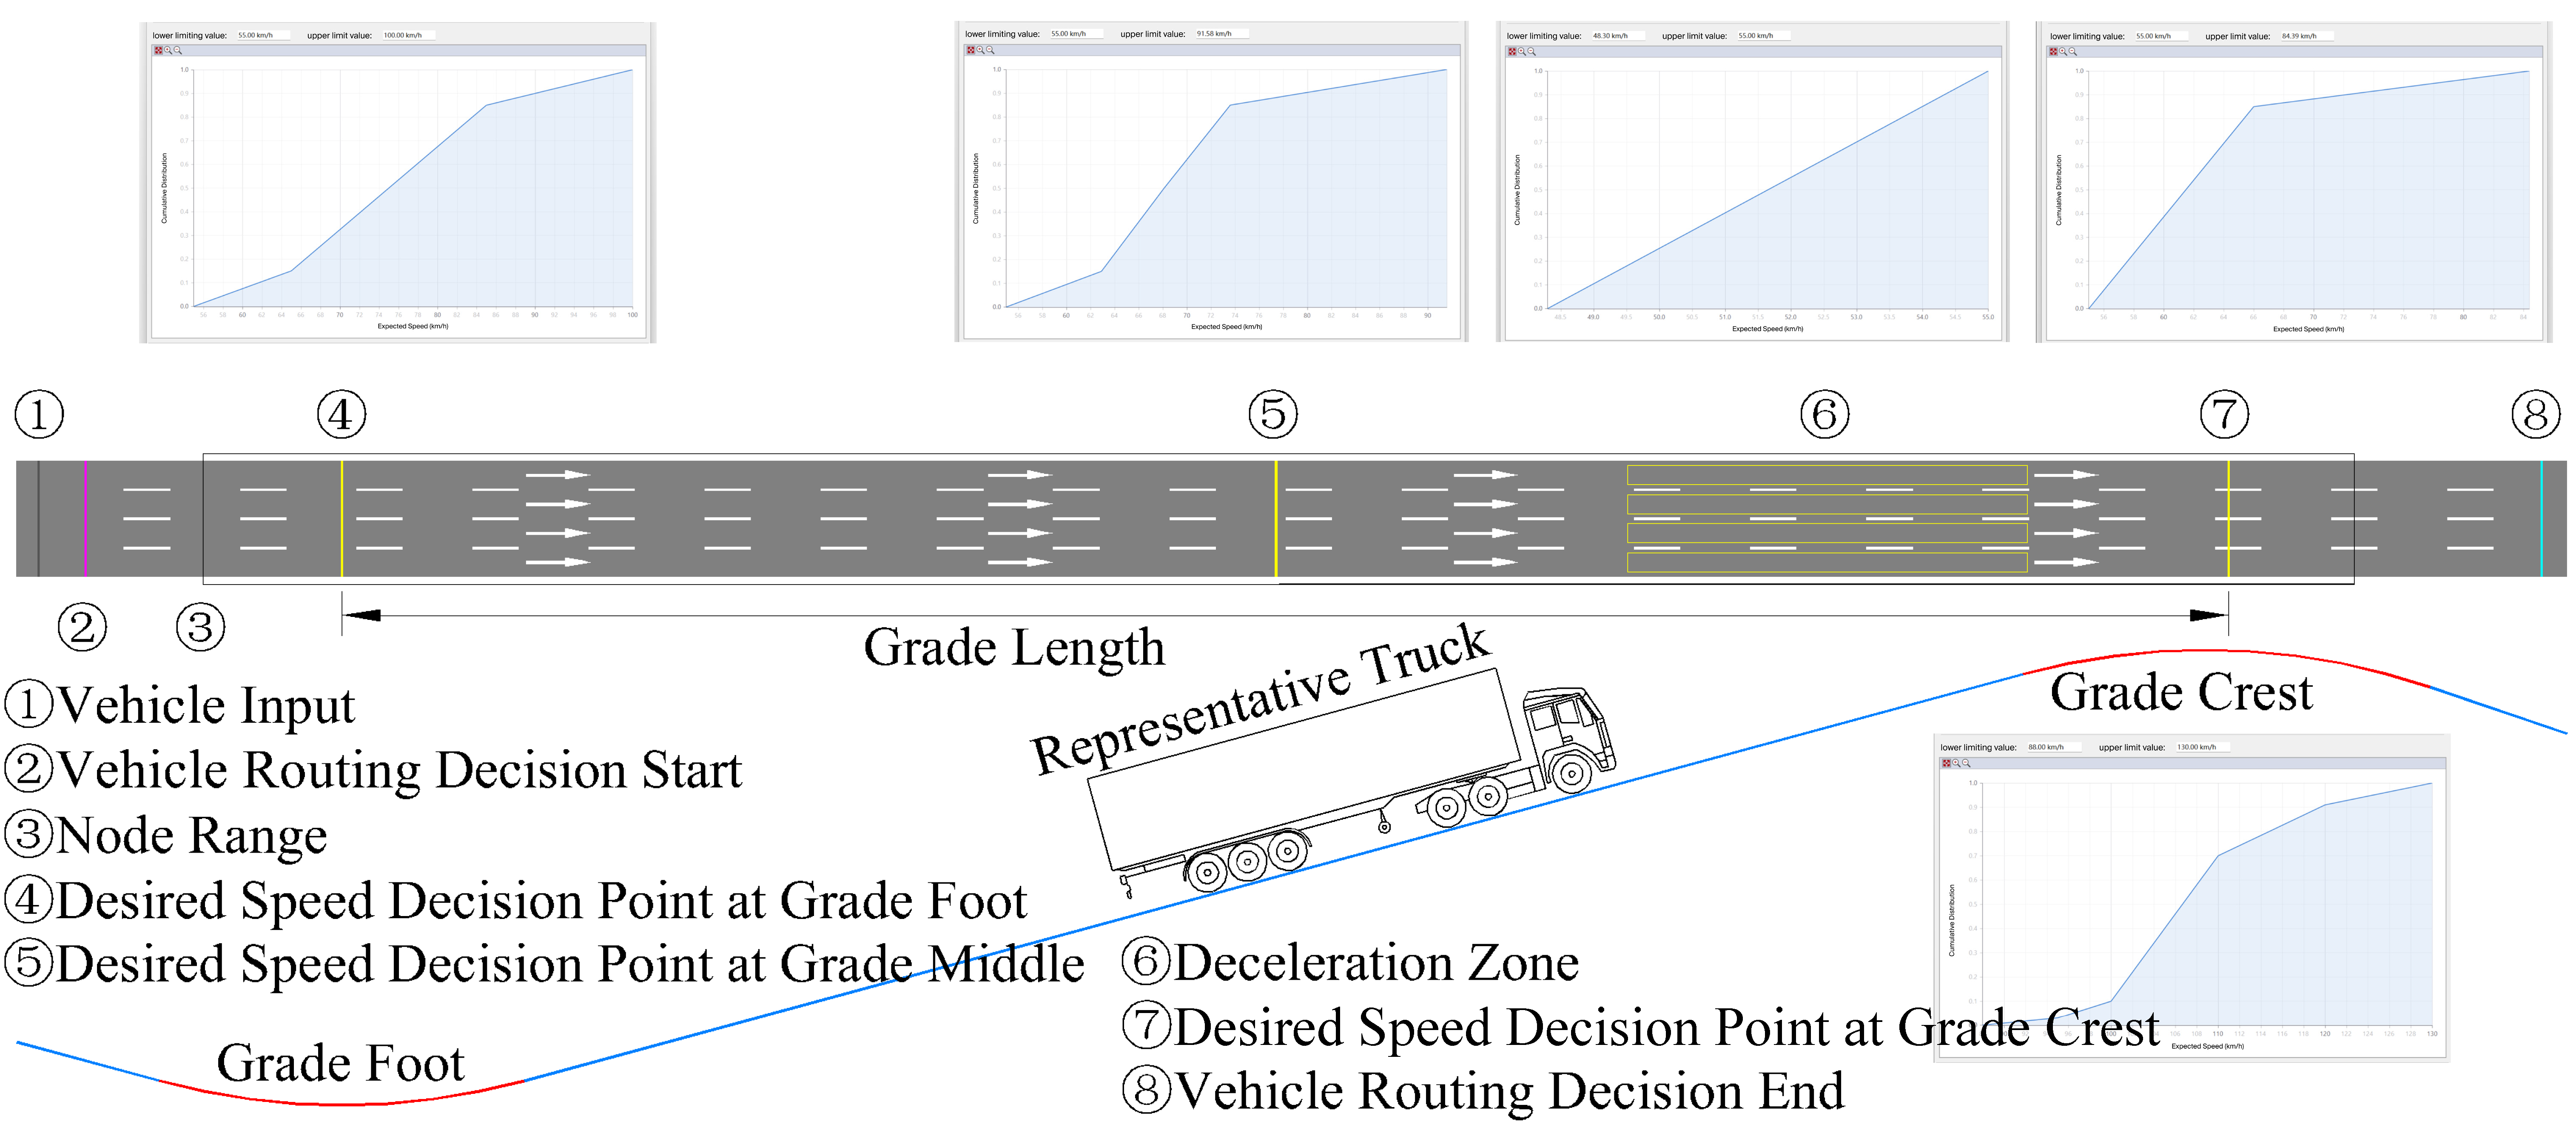
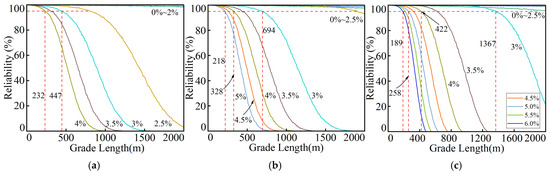
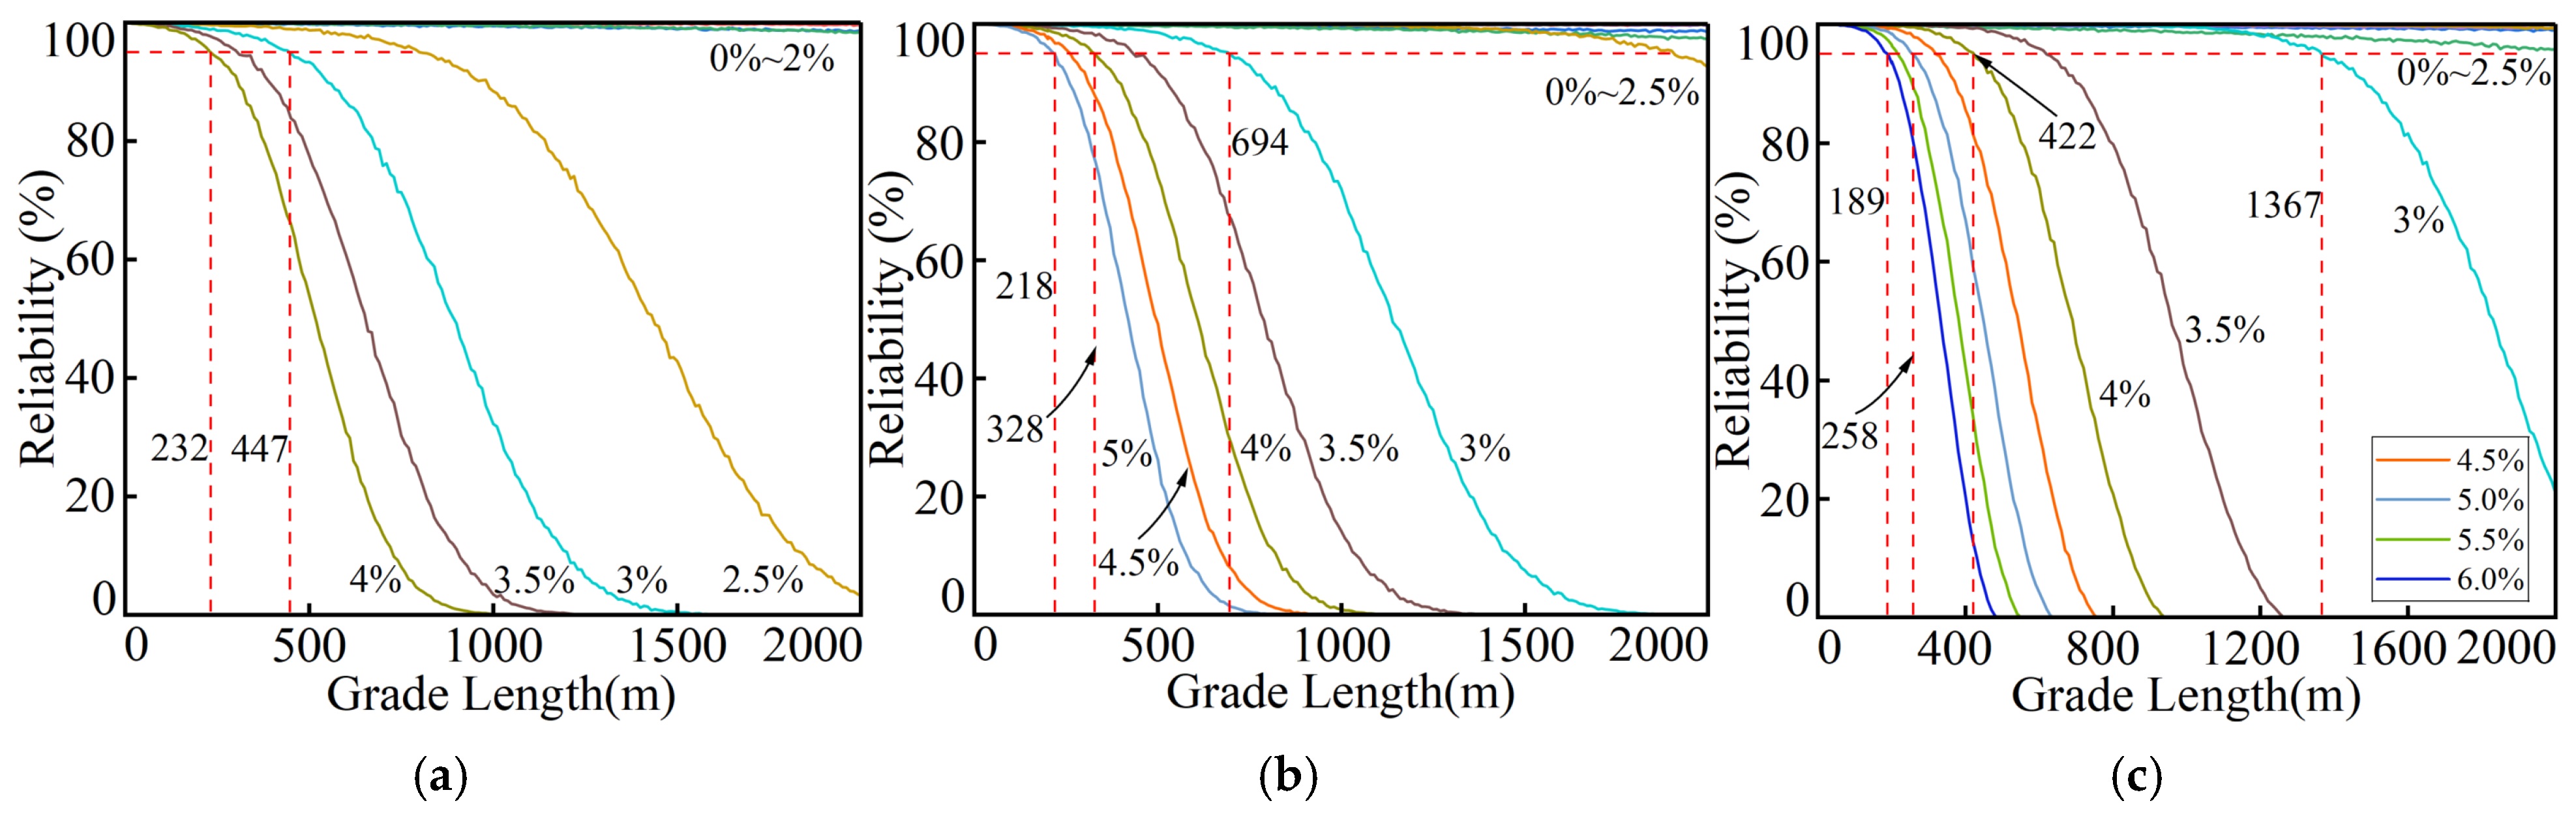
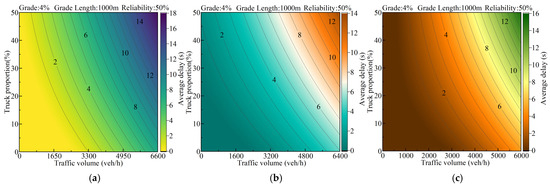
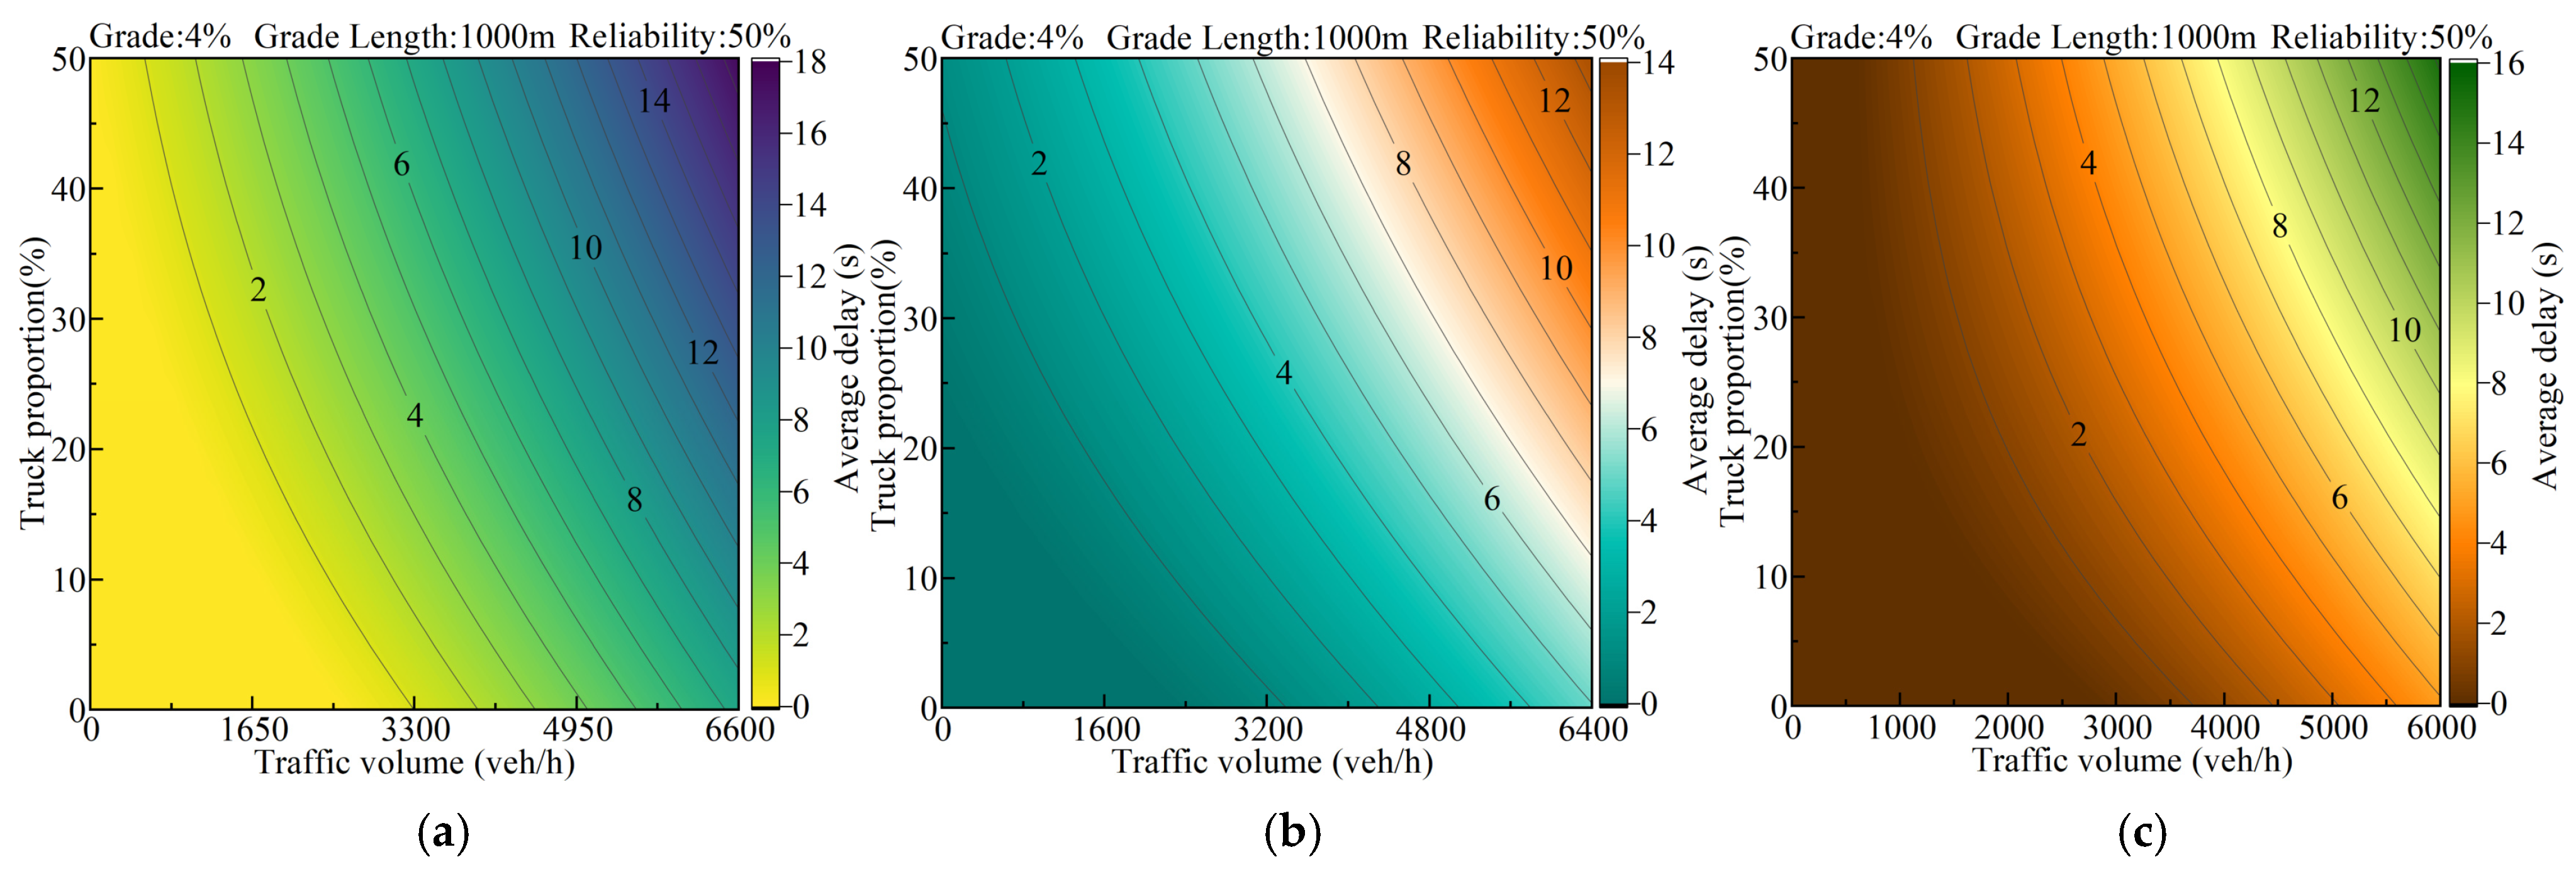
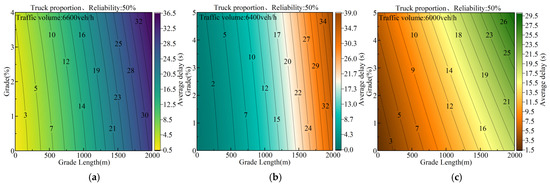
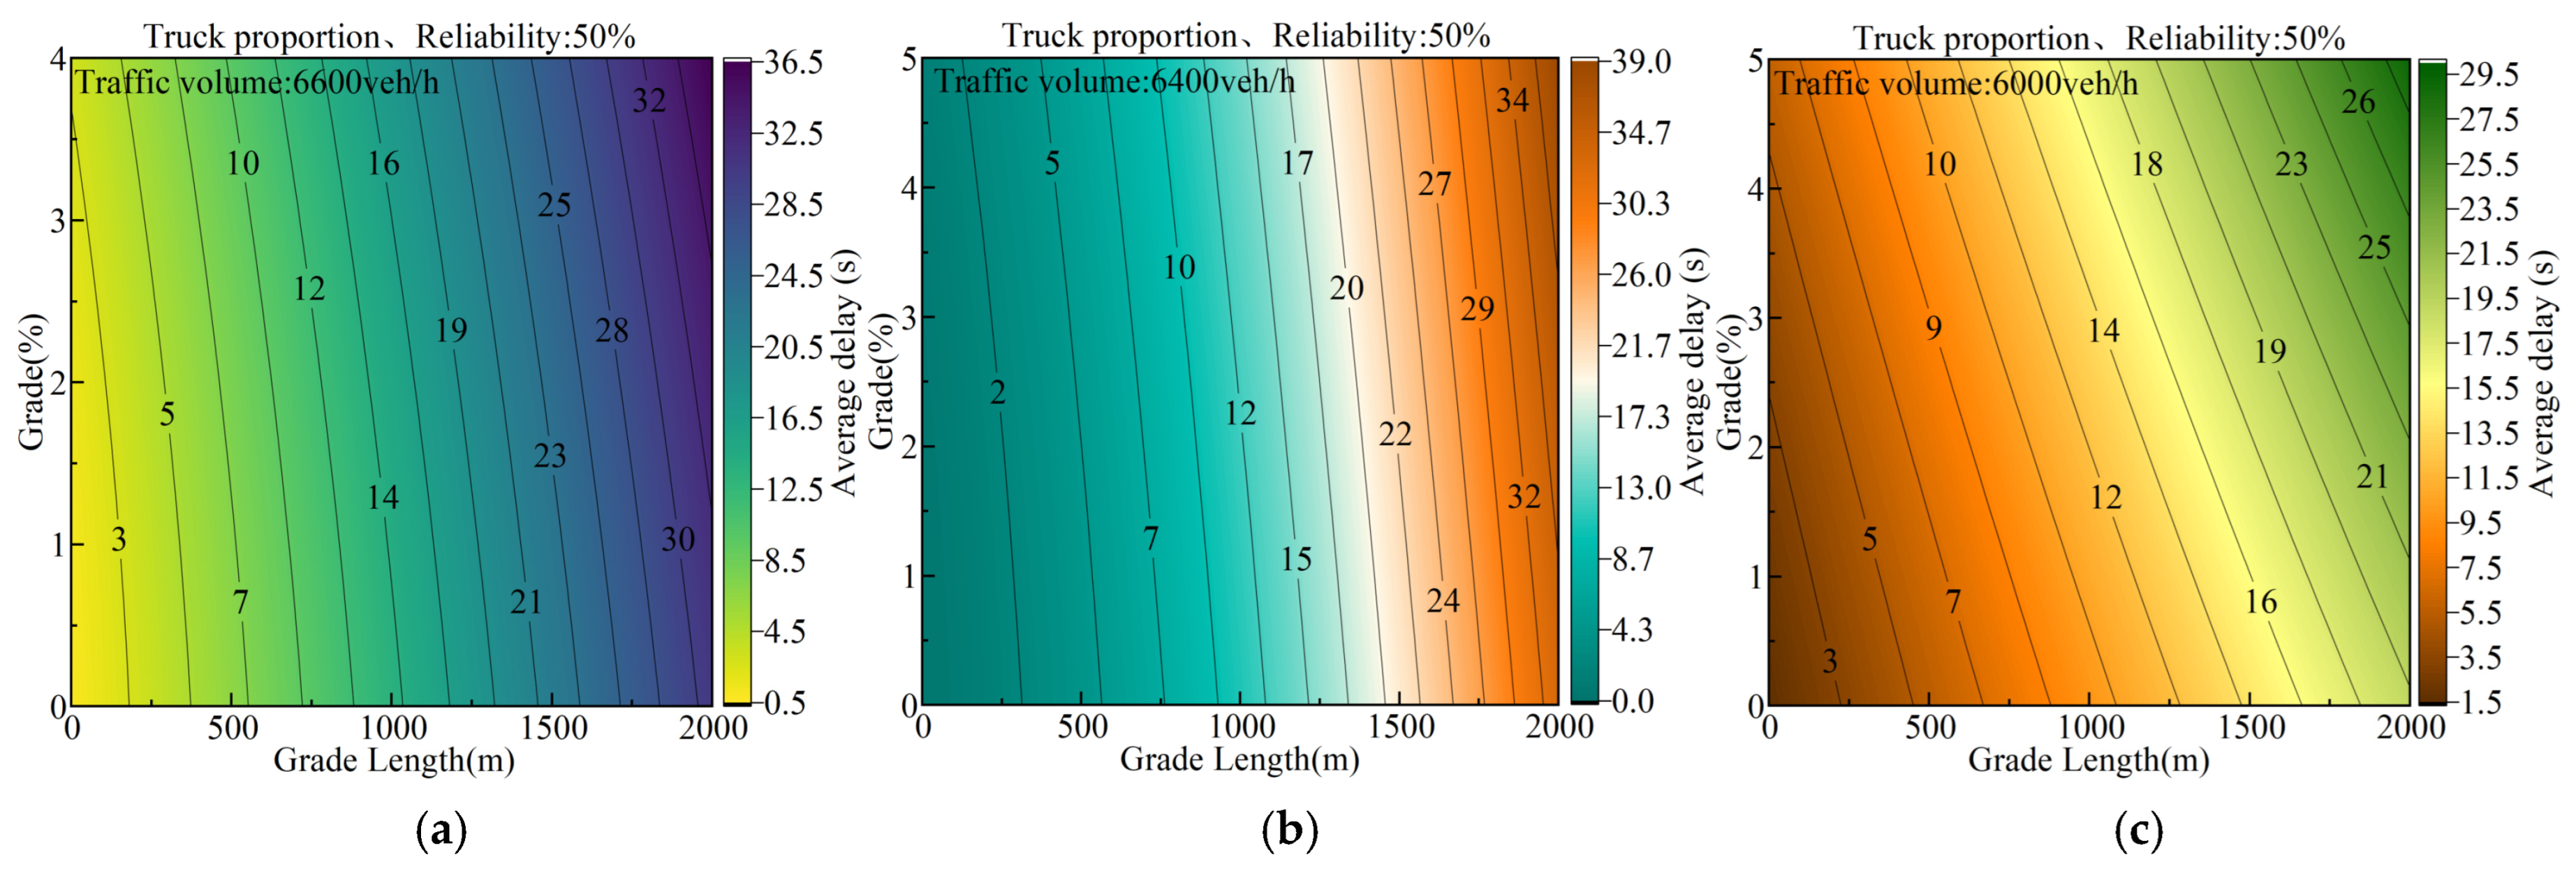
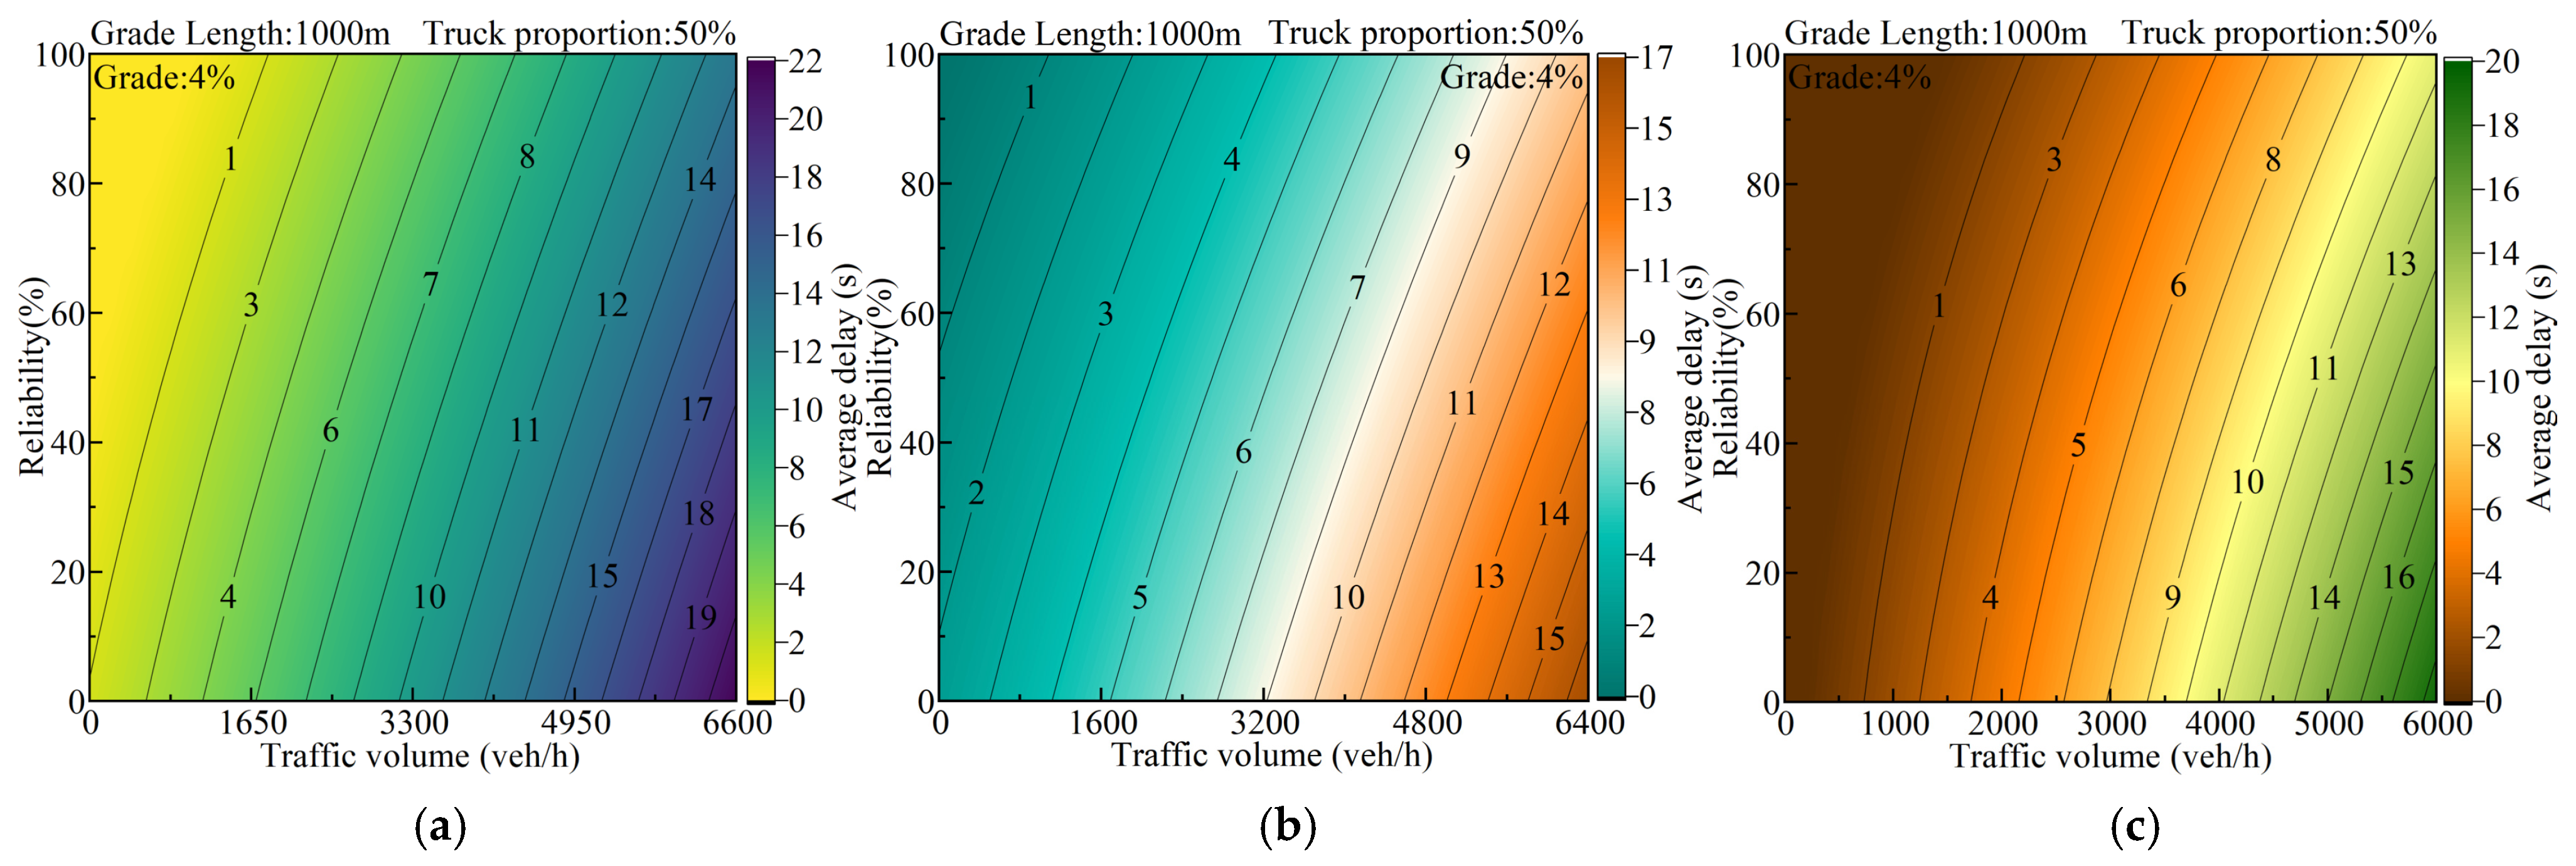
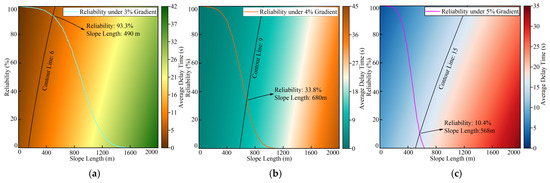
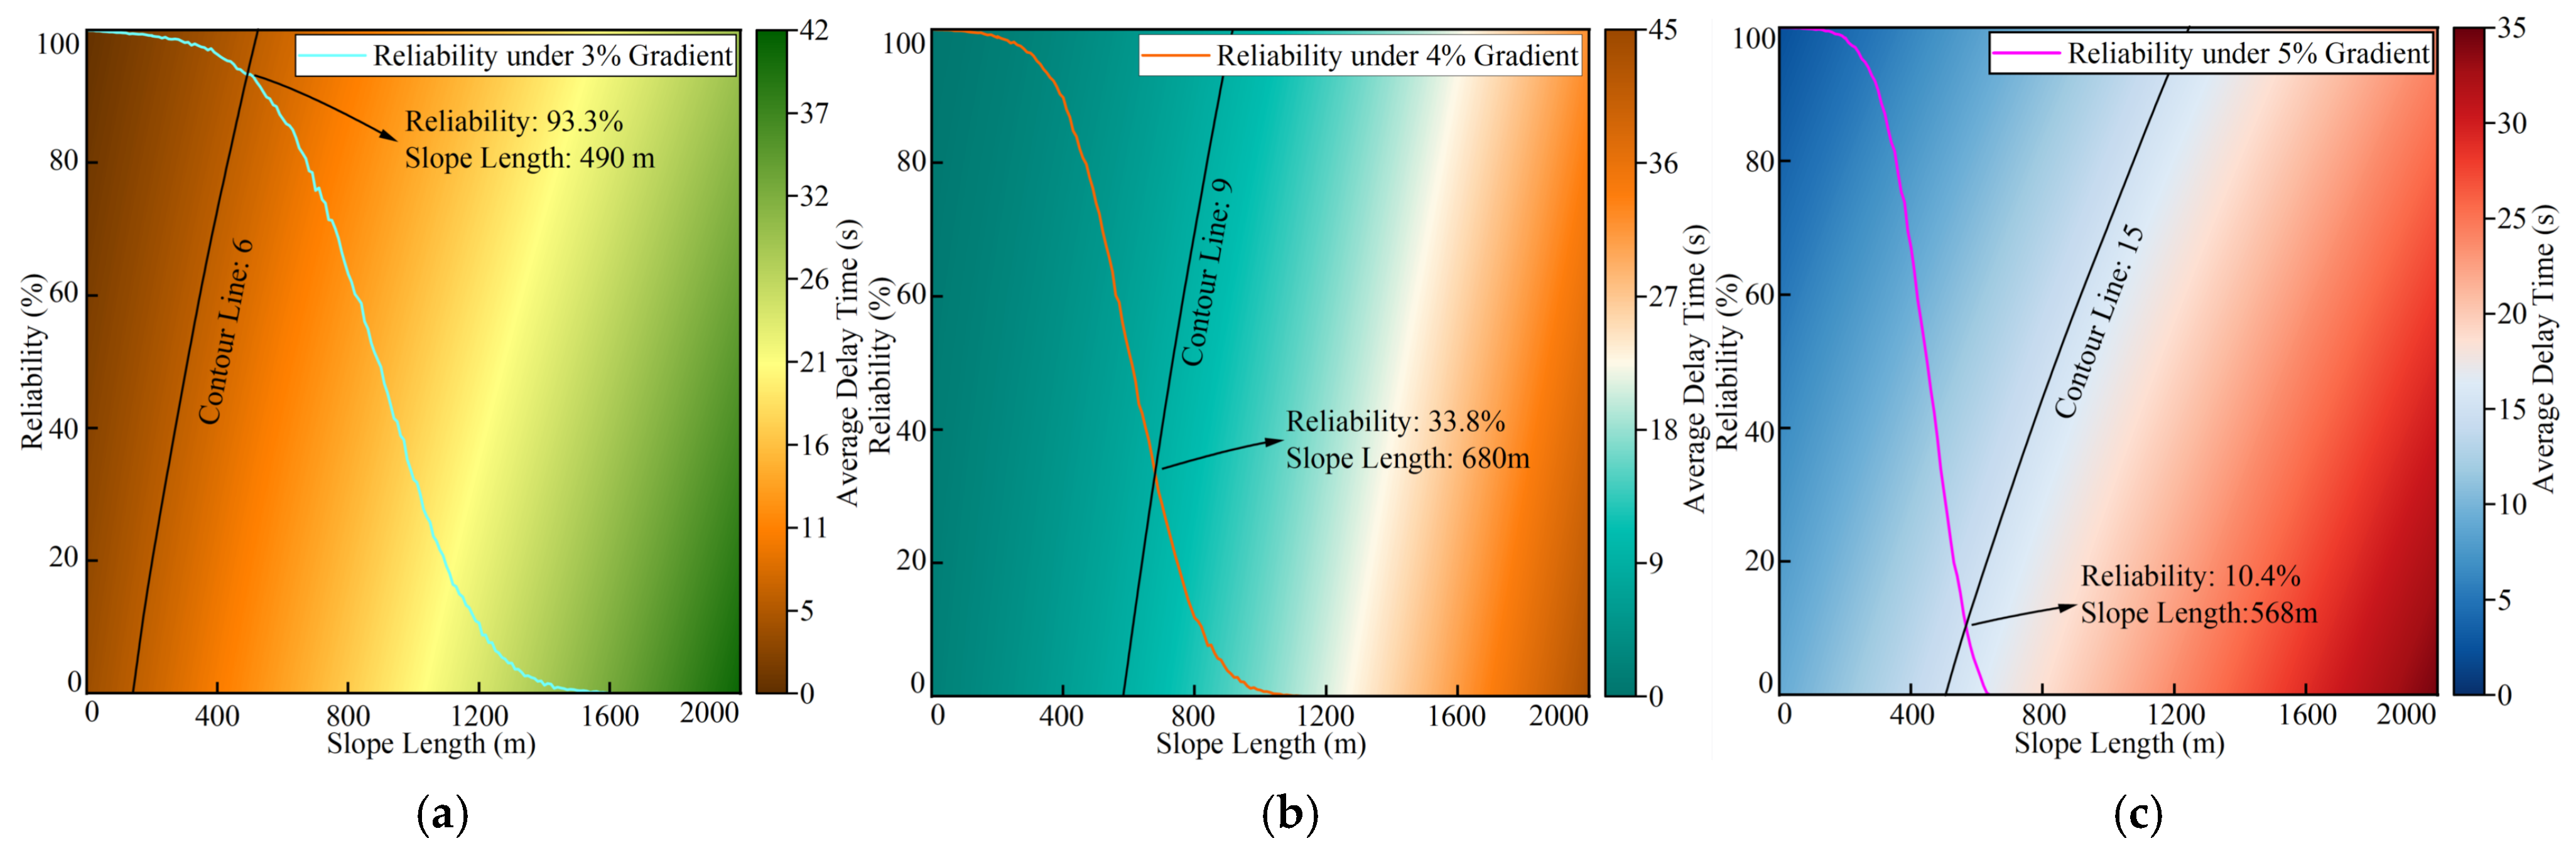

Disclaimer/Publisher’s Note: The statements, opinions and data contained in all publications are solely those of the individual author(s) and contributor(s) and not of MDPI and/or the editor(s). MDPI and/or the editor(s) disclaim responsibility for any injury to people or property resulting from any ideas, methods, instructions or products referred to in the content. |
© 2026 by the authors. Licensee MDPI, Basel, Switzerland. This article is an open access article distributed under the terms and conditions of the Creative Commons Attribution (CC BY) license.