


Abstract
Peri-urban regions around Southeast Asian megacities connect agriculture, markets, food-service facilities, households, and municipal waste systems, yet comparable data for individual waste streams are often unavailable. This study presents a screening framework for selecting the first organic waste streams and node types to measure in Tangerang Raya, Indonesia, before treatment performance data are available. The framework complements, rather than replaces, city scale circularity monitoring, life cycle assessment, and technology selection tools. Public and institutional data were screened by evidence class and temporal and spatial compatibility. The core Peri-Urban Organic Waste Circularity Readiness Index (PU-OCRI) evaluates five intrinsic criteria: feedstock concentration, source separation readiness, treatment pre-screening compatibility, institutional readiness, and the safety/quality gate. Scores represent collective author judgments linked to a criterion level evidence trail; they have not been independently rated by local stakeholders or empirically calibrated. Korea linked support is assessed separately and cannot affect the index. Available evidence included 3248.1 t of large chili production in Kabupaten Tangerang in 2024, 798,406 t yr−1 of reported potential municipal-waste generation in Kota Tangerang in 2024, and a planning-based estimate that 52.89% of non-residential waste in Kota Tangerang Selatan was biogenic organic material. Under equal weights, market-linked organics scored 76/100 and garden and landscape organics 72; production-side residues and household food waste each scored 56, and mixed residual waste scored 32. In 100,000 weight only simulations, market linked organics ranked first in 65.9% of runs and garden and landscape organics in 31.2%. When each score was allowed to vary by one point and sampled together with the weights, the corresponding first-rank frequencies were 50.7% and 40.7%. These results define a provisional paired audit hypothesis, not evidence of superior circular-economy performance. A required 8–12-week comparison of market/food-service and garden/landscape nodes will apply predefined criteria for mass stability, contamination, safety, treatment feasibility, cost, and operator and stakeholder participation before scores are updated or any treatment or scale-up decision is made. Korea-linked cooperation is limited to digital logging, training, QA/QC, and pilot-operation protocols. Data provenance is explicit: the 798,406 t yr−1 value is the issuing agency’s population × per-capita estimate, whereas 52.89% is an author calculated category sum (kitchen + garden + wood) used only as a screening proxy, not as a direct stream level measurement or the plan’s official aggregate organic fraction.
1. Introduction
Organic waste is a persistent urban sustainability challenge because it links food-system inefficiency, greenhouse gas emissions, landfill pressure, public sanitation, and lost nutrient recovery opportunities [1,2,3]. In rapidly urbanizing Southeast Asia, the issue extends beyond farm residues and household food waste. Organic materials move through farms, wholesale and retail markets, restaurants, hotels, public facilities, and municipal collection systems. Their recovery depends on stream cleanliness, concentration, institutional control, and safety verification.
This challenge is particularly visible in Jabodetabek, where peri-urban farmland, dense settlements, and metropolitan food-distribution nodes are closely connected. Public datasets, including Indonesia’s National Waste Management Information System (SIPSN), report waste generation and management at city and regency scales [4]. However, these totals do not show whether individual organic streams are separated, traceable, or safe for recycling. Conversely, crop production statistics confirm that agricultural residues exist but do not describe post-farm waste from markets, restaurants, food service facilities, or municipal collection. Tangerang Raya can therefore be viewed as a peri-urban interface linking organic waste generation and management rather than as a single crop residue case. Kabupaten Tangerang retains agricultural production, including 32,481 quintals (3248.1 t) of large chili (Cabai Besar/TW/Teropong) in 2024 [5]. Kota Tangerang represents a dense municipal waste setting, with 798,406 t yr−1 reported as potential generation in 2024, 224,092 t yr−1 reduced through reduce, reuse, and recycle (3R) activities, and 573,551 t yr−1 formally handled [6]. A Kota Tangerang Selatan planning document reports a large biogenic fraction in non-residential waste, including kitchen, garden, and wood categories [7]. A regional study also documents substantial waste pressure in Kabupaten Tangerang [8], although its 2022 estimate is used only as contextual evidence. Together, these sources shift the immediate question from how much farm residue exists to which peri-urban organic stream should be measured, separated, tested, and piloted first. The 3248.1 t value is a deterministic conversion from 32,481 quintals (1 quintal = 0.1 t); the municipal value is estimated in the cited report from population and a per-capita factor; and the biogenic percentage is an author-calculated category sum rather than a directly measured stream mass. Tangerang Raya’s position between agricultural production and dense urban demand makes it a suitable case for testing whether clean, traceable, and institutionally manageable biowaste streams can support an initial circular-economy intervention. This study differs from crop-residue coefficient inventories and national agricultural by-product assessments. It does not estimate crop specific residue coefficients, apply Bogor or Korean residue factors to Tangerang, or assume that mixed organic waste is safe for agricultural use. Instead, it provides a screening framework for deciding where direct measurement should begin when local stream-level data are limited. The resulting rank is a testable prioritization hypothesis, not a measured performance outcome. Established approaches address later or different decision stages. OECD/JRC guidance covers composite-indicator construction and uncertainty analysis; DPSIR organizes causal relationships; Wasteaware benchmarks operating municipal waste systems; urban circularity frameworks and ISO 59020 monitor measured system performance; and EASETECH and biowaste decision-support tools compare defined material-flow or treatment scenarios once composition, process, and cost data are available [9,10,11,12,13,14,15]. PU-OCRI does not introduce new weighting mathematics or replace these approaches. It addresses the earlier task of selecting a candidate stream and node type for direct measurement while making evidence restrictions, score uncertainty, and a field-based recalibration rule explicit. Korean experience is used only as an external source of implementation support, not as a scored readiness attribute or a source of local mass coefficients. Korean examples can inform logging templates, training, laboratory QA/QC, and pilot-operation procedures, but they cannot increase a Tangerang stream’s PU-OCRI score. This separation reduces policy-preference bias and keeps local evidence as the basis for future ranking. Korea is the focal implementation reference for case specific, not universal, reasons. The author consortium links BRIN and KIST; existing Korea Indonesia smart agriculture and ODA initiatives provide channels for training and digital systems [16,17,18]; and Korean and Indonesian source-separation and fertilizer-control frameworks offer relevant procedures for logging and QA/QC [19,20,21,22]. These links support the feasibility of collaboration, not the transfer of numerical performance values. Accordingly, this study aims to: (i) define Tangerang Raya as a stratified node and route sampling boundary; (ii) establish evidence inclusion and temporal/spatial-use rules; (iii) construct a five criterion PU-OCRI for pre-audit stream prioritization; (iv) test the ranking under random weight, leave one criterion out, and score uncertainty analyses; (v) separate Korea linked implementation support from the numerical rank; and (vi) specify a paired field validation and recalibration protocol before treatment selection, scale-up, or policy adoption. The boundary design used to delimit this waste-and-recycling decision-support assessment is summarized in Table 1.
Table 1.
Boundary design used to position this study as a waste and recycling decision support assessment rather than a crop residue coefficient inventory.
The methodological positioning of the revised PU-OCRI relative to established indicator approaches is summarized in Table 2.
Table 2.
Methodological positioning of the revised PU-OCRI relative to established indicator approaches.
2. Materials and Methods
As this was a desk-based screening and decision-support assessment, no chemicals, reagents, devices, instruments, commercial cell lines, biological samples, or commercial experimental materials were used.
2.1. Study Boundary, Spatial Operationalization and Candidate Organic Waste Streams
Tangerang Raya was represented as a stratified node system within Kabupaten Tangerang, Kota Tangerang, and Kota Tangerang Selatan. The production stratum includes farms and initial aggregation nodes in Kabupaten Tangerang. The market and food-service stratum includes wholesale, retail, catering, and public-facility nodes. The municipal stratum includes collection, landscape management, and treatment interfaces across the regency and two cities. Administrative units therefore serve as nested sampling strata rather than interchangeable observations.
An eligible pilot node must be located within one of the three administrative units, have an identifiable operator, generate or handle one of the five candidate streams, and have a documentable collection or transfer route. This study does not interpolate a continuous waste surface, infer unobserved flows between administrative units, or claim a grid, watershed, or corridor based material flow model. During field validation, selected nodes, service areas, and transfer routes should be geocoded so that the currently conceptual links become observed spatial flow records.
Five streams were evaluated: (1) production side horticultural residues in Kabupaten Tangerang; (2) market linked horticultural organics, including produce trimmings, rejected vegetables, and food service preparation waste; (3) household food waste; (4) garden and landscape organics; and (5) mixed residual waste in conventional collection and disposal routes. Mixed residual waste was retained as a negative control. Because the uncertainty analysis identifies garden and landscape organics as the main competing candidate, the validation design compares this stream directly with market-linked organics rather than auditing only the equal-weight leader. Hereafter, the second stream is termed “market-linked organics.”
2.2. Evidence Hierarchy and Data-Quality Controls
Data sources were not treated as statistically equivalent. Class A requires an official issuer, publication year, administrative boundary, unit, and traceable table or dashboard; it may support a factual input or score only when directly matched to a criterion and stream. Class B requires an adopted plan, regulation, or official technical report with a defined date and boundary; it may support institutional readiness or a stated composition proxy, but not an unreported local mass estimate. Class C requires a peer-reviewed or official technical method that specifies the feedstock, treatment, and analytical procedures; it is limited to variable selection, treatment pre-screening, and QA/QC design. Class D comprises qualitative author interpretation derived from Classes A–C. Sources were excluded if they lacked a verifiable year, boundary, unit, or method, duplicated a secondary summary, or presented non-local coefficients as local values. Class C or D evidence cannot replace local measurements in the numerical score.
Temporal and spatial compatibility were recorded separately. T0 denotes the same reference year as the main 2024 data; T1 denotes a one-year difference; and T2 denotes a difference of two to three years and permits contextual use only. S0 denotes the same administrative stratum and a directly relevant stream; S1 denotes another stratum within Tangerang Raya; and S2 denotes an external or non-local source. No temporal interpolation was applied. The 2022 Kabupaten Tangerang waste-pressure estimate is tagged T2-S1 and excluded from scoring and direct comparison with 2024 totals. Korean sources are tagged S2 and excluded from the core PU-OCRI. Reported masses were converted to t yr−1, but values from different years or spatial supports were not pooled.
These tags control data use; they are not correction factors. The 2022 contextual estimate, 2025 planning proxy, and Korean references are not combined with the 2024 administrative totals to create a common mass balance. Their uses are limited to those specified in Table 3. Three data-use labels were applied in addition to the evidence classes: reported values were transcribed from the cited source; derived values were produced only by a displayed deterministic unit conversion or arithmetic sum; and inferred values were ordinal screening judgments mapped to the published anchors. Derived values do not constitute new empirical observations, and inferred values were never treated as measured mass, composition, contamination, safety, or treatment performance. No missing local value was imputed from another city, year, crop, or Korean case.
Table 3.
Evidence classes, temporal-spatial compatibility tags and permitted analytical uses in the Tangerang Raya assessment.
2.3. Construction of the PU-OCRI Readiness Index
The revised Peri-Urban Organic-Waste Circularity Readiness Index (PU-OCRI) is a transparent screening tool, not a predictive model of recycling success. The core index contains five locally relevant criteria: feedstock concentration (F), source separation readiness (S), treatment pre-screening compatibility (T), institutional readiness (I), and the safety/quality gate (Q). Korea linked transferability was removed because external cooperation is not an intrinsic property of a Tangerang waste stream.
These criteria represent the minimum conditions that can be assessed at stream level before selecting a site or treatment. A candidate stream should be sufficiently concentrated, practically separable, compatible with at least one plausible treatment, linked to an identifiable host institution, and able to enter a defined safety and quality control pathway. The criteria are kept separate to limit double counting: concentration is not separation quality, treatment compatibility is not product safety, and institutional presence is not stakeholder willingness.
Economic feasibility, transport distance, land availability, stakeholder willingness, operating cost, and site specific permitting were excluded from the baseline score because comparable stream level observations were unavailable and several depend on the selected node and treatment. Institutional readiness does not imply willingness, and the safety/quality criterion does not imply regulatory approval. These dimensions are mandatory measurements in the paired audit and may be included in later recalibration.
Each criterion is scored on a 0–5 ordinal scale. The OECD/JRC handbook informed the principles of transparency, normalization, and uncertainty analysis but does not prescribe this scale [9]. A six point range was chosen to distinguish more levels than a binary or three level screen while remaining auditable with limited evidence. A score of 0 indicates no usable criterion matched evidence or no operational readiness, or a contamination or safety constraint that prevents direct circular use. A score of 5 indicates strong criterion matched evidence of regular concentration, practical separability, a compatible pilot treatment, an identifiable host, or a manageable safety/quality pathway. Intermediate values indicate documented partial readiness; they are judgments, not measured quantities. The five criteria and scoring anchors are summarized in Table 4.
Table 4.
Core PU-OCRI criteria and scoring anchors.
For stream j, PU-OCRIj = 20 × sum(wc × sjc), where sjc is the 0–5 score for criterion c, each wc is non-negative, and the weights sum to 1. Equal weights (wc = 0.20) provide the baseline. The 0–100 transformation aids communication but does not indicate probability, interval-scale measurement, or empirical calibration. The bands ≥ 75, 60 ≤ 75, 40 ≤ 60, and <40 are heuristic screening categories rather than validated performance thresholds.
To improve reproducibility, each score is linked to a criterion anchor, a stream-specific evidence statement, and a field observation that can revise it. A numerical score requires criterion matched local Class A or B evidence. Class C may support treatment or safety interpretation only when linked to local Class A/B evidence, and Class D cannot create a score. When evidence fell between two anchors, the lower score was retained. Table 5 provides the full evidence to score trail and a one-point range, [max(0, s − 1), min(5, s + 1)], for each assigned score. These ranges represent pre-field judgment uncertainty, not statistical confidence intervals.
Table 5.
Criterion level PU-OCRI evidence to score audit trail. The pre-field intervals are one anchor step judgment perturbations, not statistical confidence intervals.
Where local evidence established only stream presence or institutional context, the authors treated the assigned score as a conservative structured inference, retained the lower plausible anchor, and specified the field observation required for revision in Table 5.
The score matrix reflects collective author judgment. D.I. compiled the criterion-level evidence map, and D.I., N.A.S., and J.Y.L. reviewed each score against the published anchors. A higher score was accepted only when criterion-matched evidence supported it. Individual preliminary ratings were not archived, inter-rater agreement was not calculated, and no local stakeholder panel independently reviewed the scores. Before policy use, municipal agencies, market and food service operators, waste managers, farmer representatives, and laboratories should repeat the scoring independently, document disagreements, and report inter-rater agreement. AHP consistency ratios would be appropriate only if a future panel undertakes formal pairwise weighting.
PU-OCRI should therefore be interpreted as an expert-supported screening tool with visible and testable assumptions. The anchors do not eliminate subjectivity; the evidence matrix, global weight analysis, leave one criterion out tests, and prospective field comparison make it explicit. No statistical validation or causal prediction is claimed.
2.4. Weight Uncertainty, Calibration Limits and Reproducibility
The matrix contains five candidate streams and five ordinal criteria but no observed recycling success outcome. It is therefore too small for stable PCA or regression calibration. AHP would require a separately designed stakeholder panel, documented pairwise comparisons, and consistency testing. Applying these methods to the present data would create false precision. Equal weighting is used only as a transparent reference case, not as an empirically estimated optimum. The earlier separation logistics, safety first, Korea transfer, and No-K schemes were removed: Korea is no longer part of the index, and policy-labeled fixed weights were replaced by a fully specified analysis across the full range of non-negative weights.
Weight dependence was assessed following composite-indicator uncertainty principles [9]. Using seed 4403916, 100,000 weight vectors were sampled from Dirichlet (1,1,1,1,1); every vector is non-negative and sums to one. In leave one criterion out tests, the omitted criterion received weight 0 and each remaining criterion 0.25. A second 100,000 run analysis used seed 4403917, sampled each criterion score with equal probability from its Table 5 one point range, and combined the sampled scores with new Dirichlet weights. These analyses quantify dependence on author judgments; they do not establish empirical validity. Table 6 reports all weights, score-sampling rules, replication counts, and seeds. All spreadsheet calculations, score aggregation, random-weight sampling, and uncertainty analyses were performed using Microsoft Excel for Microsoft 365 (Microsoft Corporation, Redmond, WA, USA; Version 2505).
Table 6.
Exact weighting and uncertainty analysis specifications used in the revised PU-OCRI.
2.5. Korea-Linked Implementation-Support Mapping External to PU-OCRI
Korea-linked material is not a readiness criterion. It is presented separately so that an international partnership cannot raise the score of a locally weak stream. All Korean sources are tagged S2 and have no direct effect on scores, screening bands, or ranks. The former Korea transfer and No-K scenarios are therefore unnecessary. Korean examples may provide auditable operational products only after Tangerang stakeholders select a stream for field testing.
Implementation will be led locally. Indonesian partners and Tangerang authorities will select nodes, interpret regulations, own the primary data, and make safety and scale-up decisions. Korean partners may co-develop data dictionaries and standard operating procedures, provide train the trainer sessions, and support inter-laboratory QA/QC under a written work plan. Each module should identify a local owner, deliverable, verification record, and maintenance plan; none can change the PU-OCRI rank.
Three guardrails apply. Level 0 prohibits direct transfer of Korean residue coefficients or waste generation rates. Level 1 permits non-local values only as clearly labeled stress test context, never as Tangerang inputs. Level 2 permits protocols, training, laboratory methods, and pilot operation procedures. This distinction resolves the earlier overlap among benchmark, training, and scoring roles: only Level 2 implementation products are transferred operationally, and none changes the core rank. The resulting implementation-support modules are summarized in Table 7.
Table 7.
Korea linked implementation support mapping; all modules are external to the core PU-OCRI score.
2.6. Prospective Paired Validation Protocol
The paired audit is a prerequisite, not an optional extension. PU-OCRI only nominates streams and nodes for measurement; the screening rank alone should not determine treatment choice, procurement, infrastructure commitment, or scale-up.
Because no direct waste-flow or contamination measurements are available, validation is designed as a paired prospective field study. Phase 1 should monitor 2–4 market or food service nodes and at least two garden and landscape collection nodes for 8–12 weeks, matched by service area or collection frequency where feasible. Daily records should include source, fresh mass, missed collections, visible contamination, packaging fraction, moisture proxy, storage time, operator, and routing decision. Phase 2 should apply mandatory safety and quality tests for moisture, pH, EC, total and volatile solids, C/N, NPK, heavy metals, pesticide residues, microbial indicators, and germination index before treatment trials.
The baseline market-linked recommendation will be compared with the garden and landscape stream by domain rather than through another unvalidated composite score. Any stream that fails a mandatory legal or safety requirement is ineligible for scale-up. Streams that pass will be compared for feedstock stability, contamination, treatment and recovery performance, net operating cost, and stakeholder participation. The market-linked recommendation is contradicted if it fails a mandatory safety gate or if the comparator performs at least as well in every non-safety domain and better in at least one. If neither stream clearly outperforms the other, the result is inconclusive and the observed data should be used to revise scores, weights, and sampling before any infrastructure or policy decision. After the audit, each baseline score will be replaced by the observed band in Table 8, and the equal weight, leave-one-out, and uncertainty analyses will be rerun. A stream may enter a controlled treatment pilot only if it passes the mandatory Q gate and receives scores of at least 3 for F, S, T, and I. A total score of 75 or more remains an audit-priority indicator, not authorization for scale-up.
Table 8.
Provisional field to score recalibration rules for the paired audit.
The Table 8 thresholds are provisional operating rules for the planned Tangerang pilot, not universal standards. They should be preregistered with the participating Indonesian authorities and laboratories and replaced wherever binding Indonesian requirements are stricter. A safety failure overrides the aggregate score.
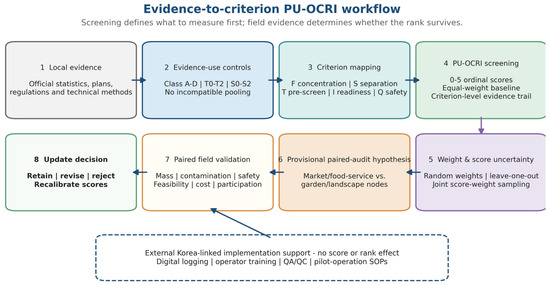
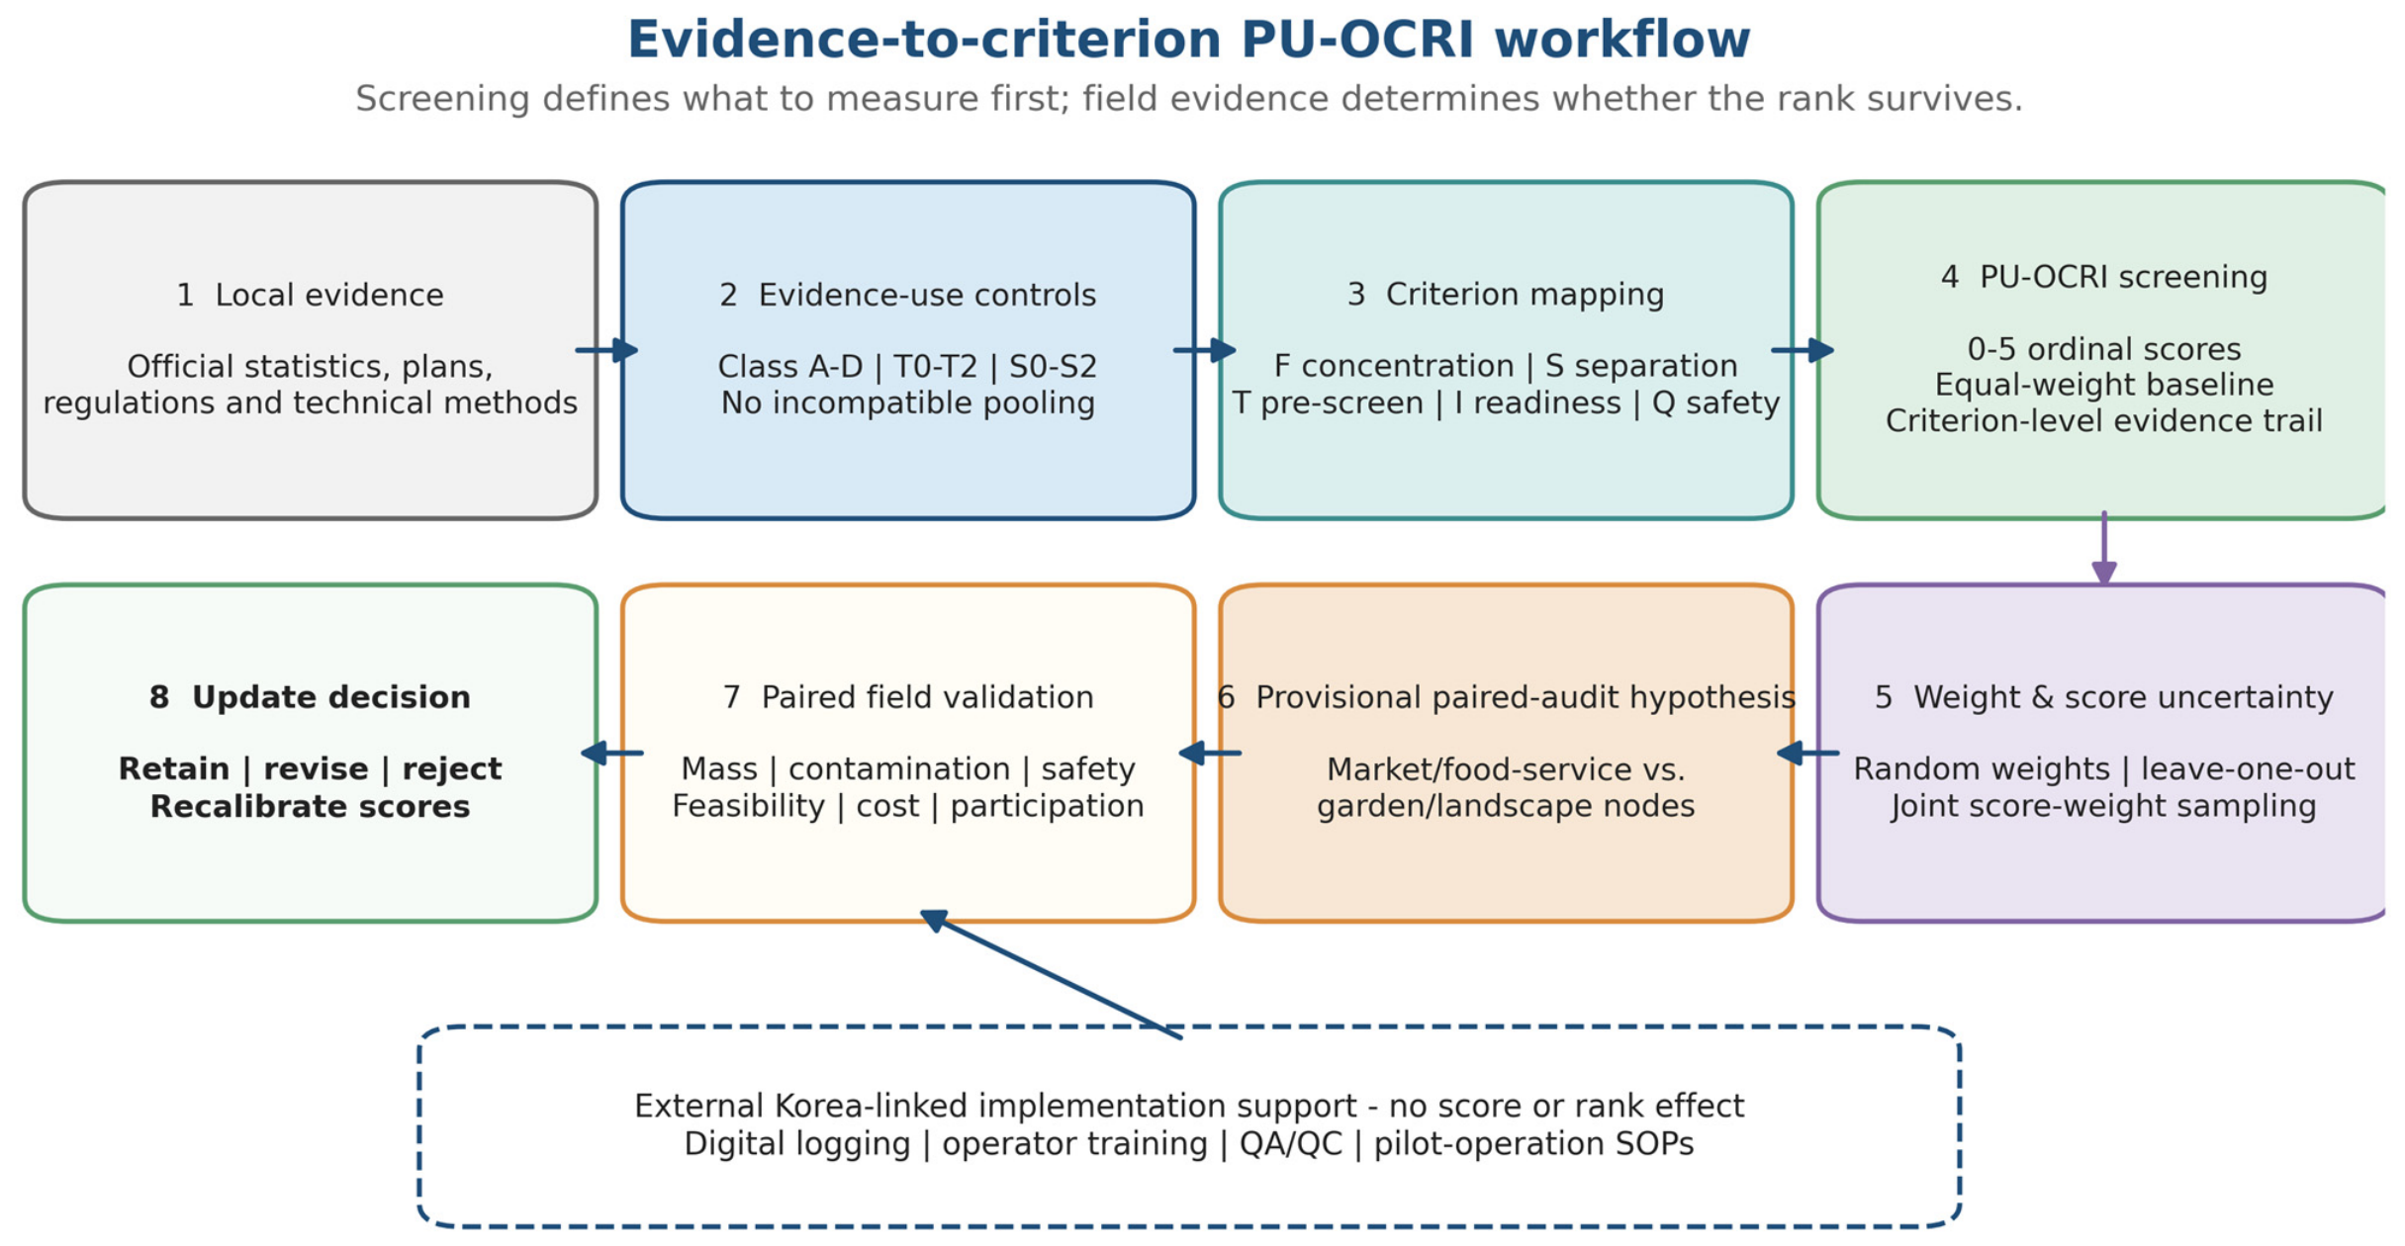
The overall evidence to criterion workflow, including evidence screening, criterion mapping, uncertainty analysis, paired validation, and external Korea-linked support, is shown in Figure 1.
Figure 1.
Evidence to criterion PU-OCRI workflow. Local evidence is screened by class and temporal/spatial support before being mapped to F (feedstock concentration), S (source-separation readiness), T (treatment pre-screening compatibility), I (institutional readiness), and Q (safety/quality gate). Weight and score uncertainty define a provisional audit hypothesis. Paired field measurements then update the scores and may retain, revise, or reject the rank. Korea-linked QA/QC and SOP support remains external to the score.
3. Results
3.1. Tangerang Raya Is a Peri-Urban Organic-Waste Interface Rather than a Crop-Residue Inventory Site
The evidence hierarchy identifies contrasting production, municipal, and non-residential organic waste contexts, but it does not provide a common contemporaneous mass balance. Kabupaten Tangerang produced 3248.1 t of large chili (Cabai Besar/TW/Teropong) in 2024 [5], whereas Kota Tangerang reported 798,406 t yr−1 of total municipal waste, 224,092 t yr−1 reduced through 3R activities, and 573,551 t yr−1 handled in 2024 [6]. The first value confirms a production-side source category, while the municipal totals document waste pressure and institutional activity. Neither measures a market-linked stream, and the values are not divided, summed, or directly compared to generate a score.
Kota Tangerang Selatan planning data report that non-residential waste contains 32.44% kitchen waste, 11.23% garden waste, and 9.22% wood, yielding a 52.89% biogenic-organic screening proxy [7]. This proxy identifies market/service and landscape categories for sampling; it does not establish their local mass, contamination level, or relative performance. The approximately 841.49 thousand t yr−1 estimate for Kabupaten Tangerang in 2022 [8] is contextual T2-S1 evidence and does not affect any score or rank. The stream-level result below is therefore an evidence-supported screening inference that requires field confirmation.
Data-transformation note. The 3248.1 t value equals 32,481 quintals × 0.1 t/quintal [5]. In [6], 798,406 t yr−1 is labeled potential generation and calculated from population × a per-capita factor; 224,092 and 573,551 t yr−1 are separately reported reduction and handling amounts, summing to 797,643 t yr−1, with 763 t yr−1 reported as unmanaged. The 52.89% proxy is the authors’ sum of the kitchen (32.44%), garden (11.23%), and wood (9.22%) rows in Table 9 of [7]. Because the plan’s separate aggregate pie-chart label does not reconcile with those category rows, the sum is used only to nominate sampling categories and not as an official organic share or a mass estimate. The 841.49 thousand t yr−1 value is a rounded transcription of 841,497 t yr−1 in Table 10 of [8], not an extrapolation.
Table 9.
Core PU-OCRI criterion scores and equal-weight totals. Scores are pre-audit author judgments, not measured performance.
Table 10.
Weight only and joint score weight uncertainty results for candidate streams.
3.2. Core PU-OCRI Scores and Weight Uncertainty Results
After removing the Korea linked criterion, the equal-weight core PU-OCRI scores were 76 for market-linked organics, 72 for garden and landscape organics, 56 for production-side horticultural residues, 56 for household food waste, and 32 for mixed residual waste. Table 9 reports the five criterion scores separately. The four-point gap between the leading streams is a screening distinction, not a measured performance margin. Market-linked organics are the baseline first-audit hypothesis, and garden and landscape organics are the required comparator.
Here, “priority” means priority for direct audit and controlled pilot preparation, not immediate technology deployment or infrastructure investment.
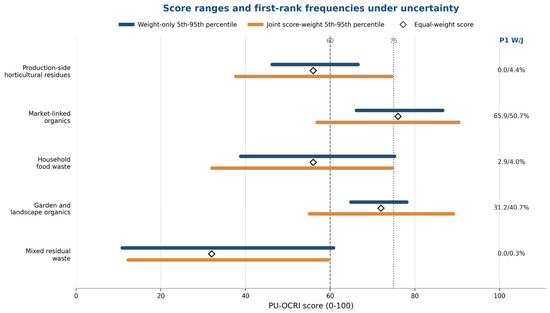
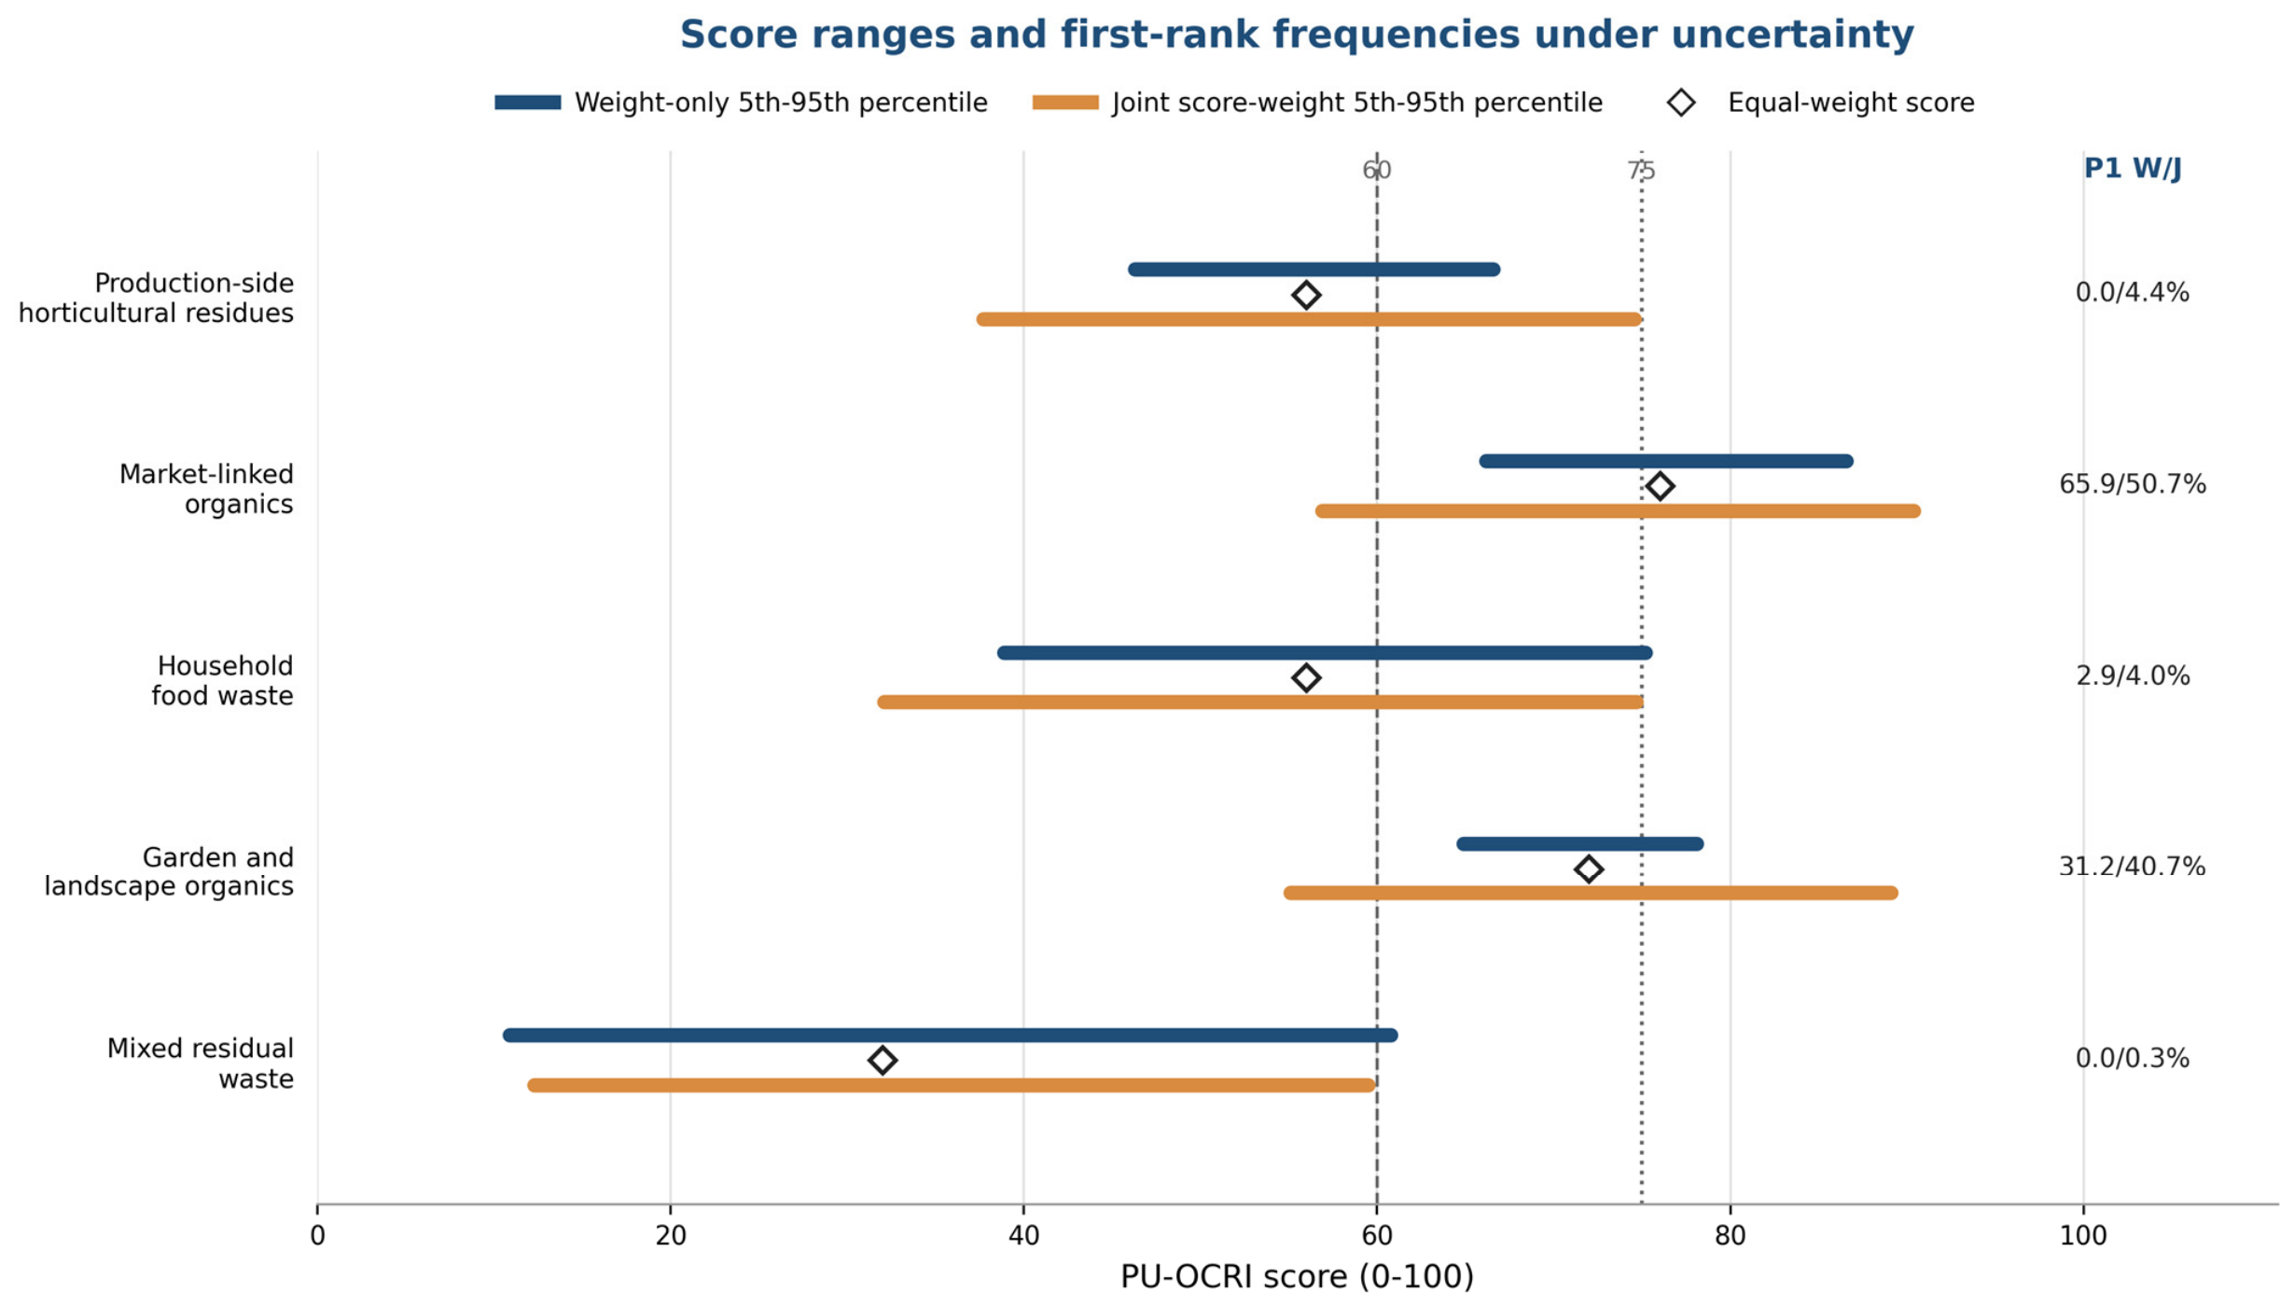
Across 100,000 weight-only simulations, market linked organics ranked first in 65.9% of runs and among the top two in 96.8%; garden and landscape organics ranked first in 31.2% and among the top two in 86.5%. Market-linked organics remained first or tied for first in all five leave one criterion out tests. Under joint score weight uncertainty, however, its first rank frequency fell to 50.7%, while the garden and landscape stream rose to 40.7%; their top two frequencies were 86.0% and 78.0%. Table 10 and Figure 2 report the full ranges. These results justify a paired audit but do not establish that market linked organics are the best circular economy feedstock.
Figure 2.
Equal weight scores and 5th–95th percentile ranges under weight only and joint score-weight uncertainty. The joint analysis samples each criterion score from its one level Table 5 range and each weight vector from Dirichlet (1,1,1,1,1). P1 W/J denotes the first-rank frequency under weight only/joint uncertainty. Vertical reference lines indicate the heuristic scores of 60 and 75.
3.3. Treatment Implications for the Provisional Leading Streams
Treatment compatibility in PU-OCRI is only a screening-level criterion. It indicates whether a stream warrants feedstock characterization and controlled testing; it does not establish process suitability and cannot replace laboratory or pilot scale evaluation. No selected stream has yet been demonstrated to be safe or suitable for composting, black soldier fly larvae (BSFL) bioconversion, anaerobic digestion, biochar-oriented preprocessing, or agricultural reuse. Table 11 is therefore a pre-screening matrix. Market-linked organics may enter composting, BSFL bioconversion, or anaerobic-digestion trials only after packaging, plastic, pesticide residues, moisture, and storage time have been measured. Garden and landscape material may be considered for compost bulking or biochar-oriented preprocessing only after checks for moisture, treated wood, and contamination. Missing data or failure of a mandatory safety gate suspends the pathway; PU-OCRI does not select a technology [25,26].
Table 11.
Preliminary treatment-feedstock decision matrix and minimum controls for prospective pilot testing. No pathway is validated by the present study.
3.4. Korea-Indonesia Pilot Roadmap
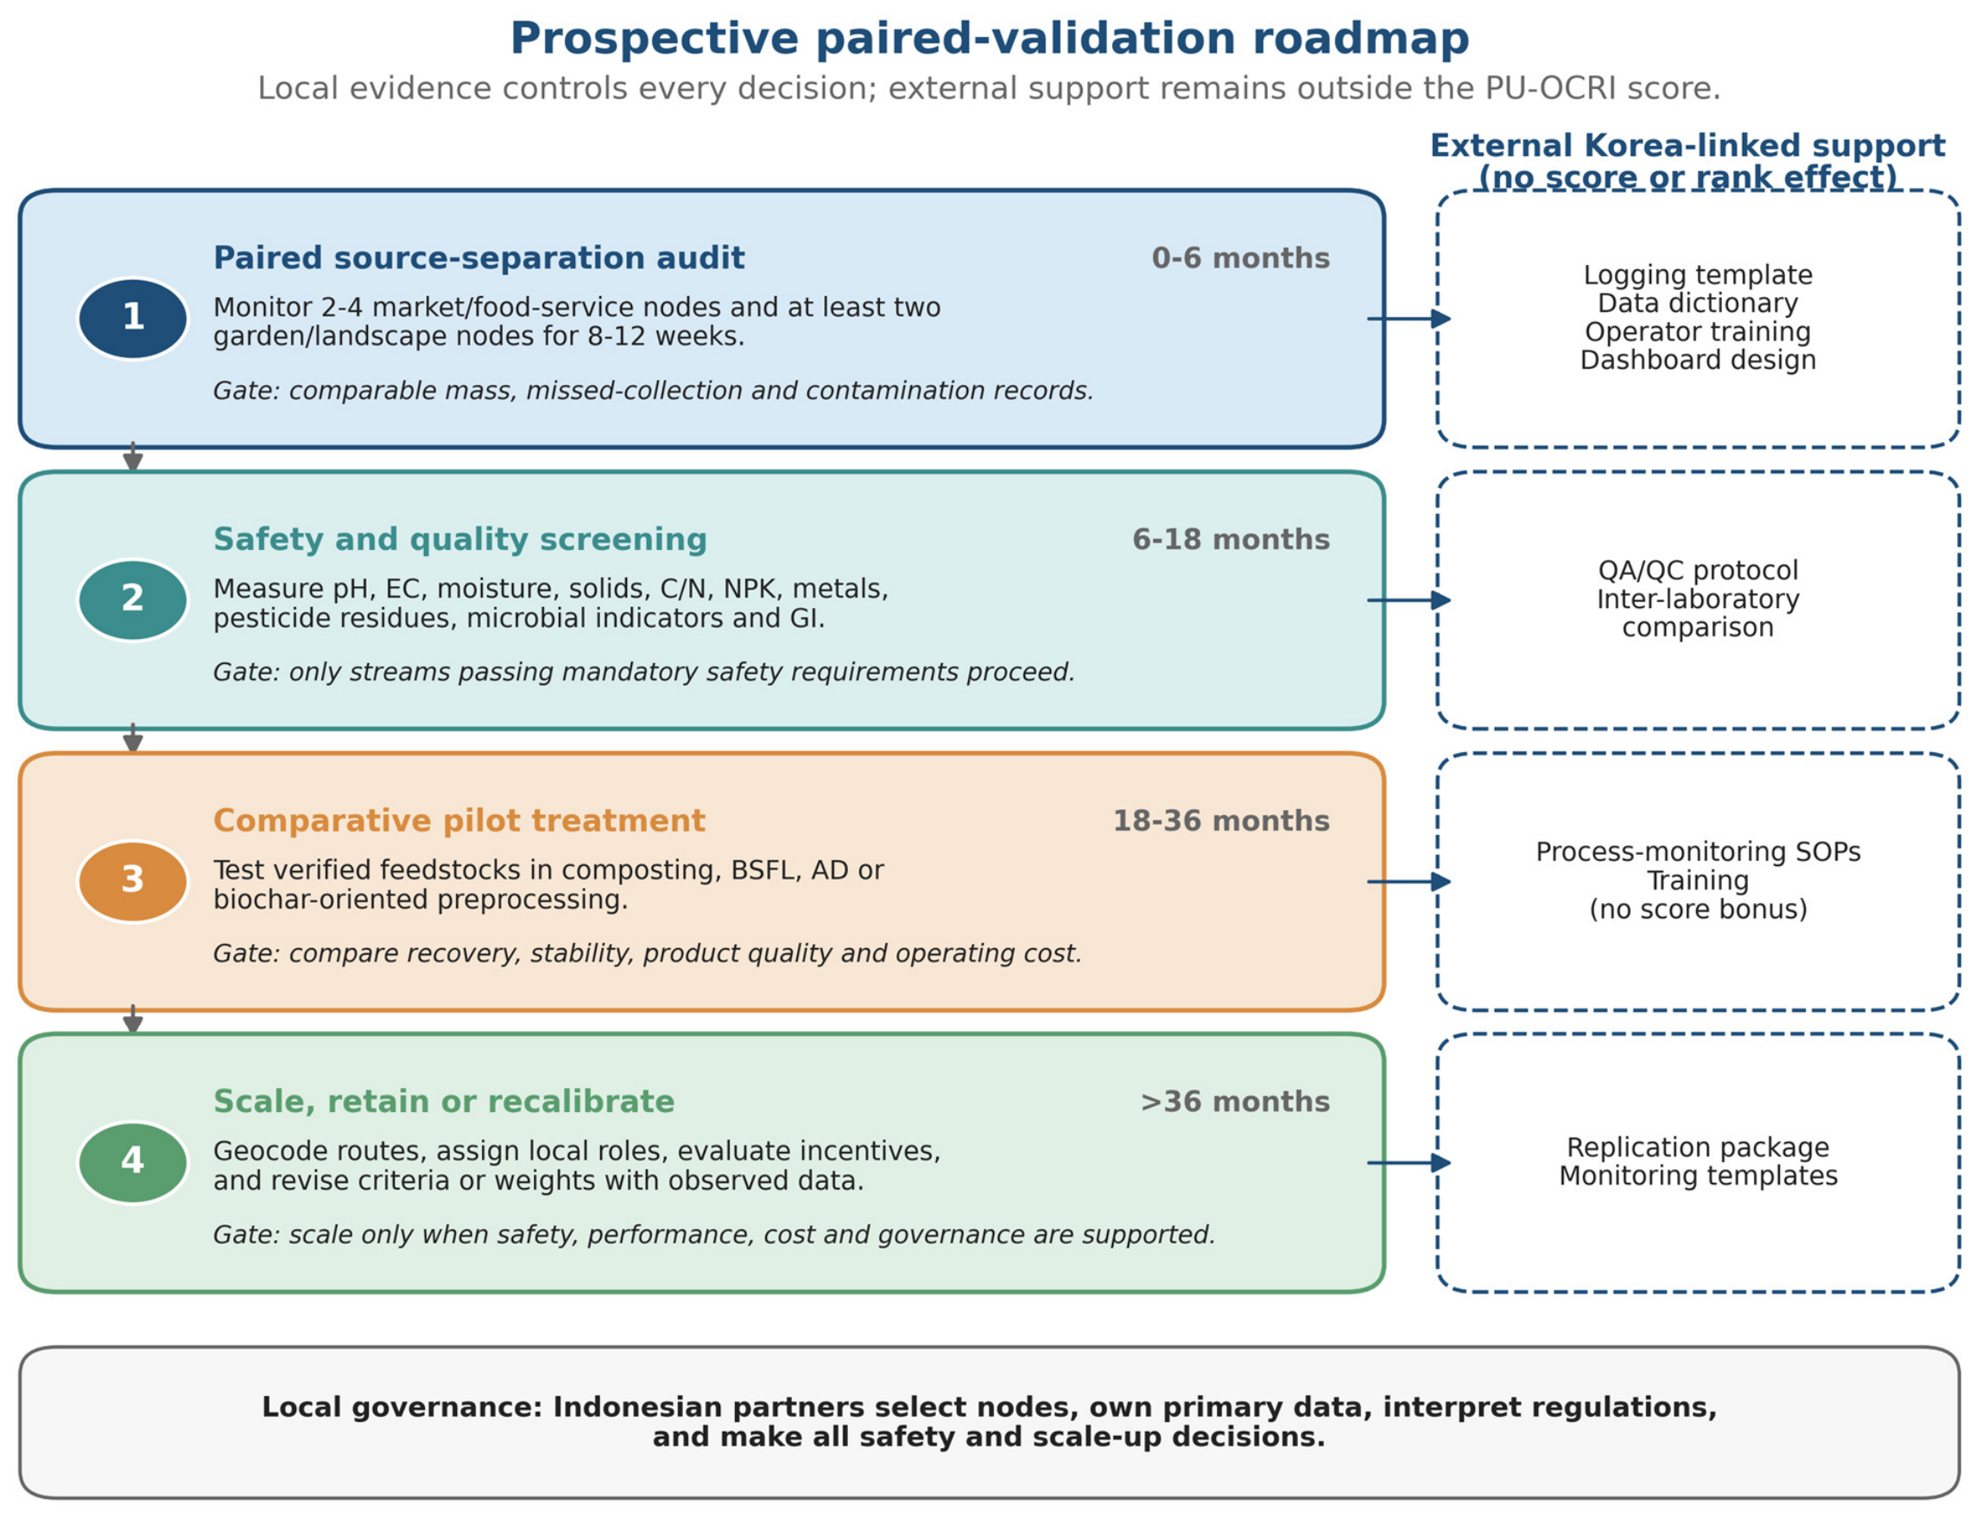
Table 12 summarizes the locally led four phase roadmap. Korea linked support remains external to the rank, and treatment or scale-up decisions depend on measured field evidence.
Table 12.
Locally led prospective validation and external Korea-linked protocol-support roadmap.
The prospective paired validation roadmap and the external Korea-linked protocol support modules are shown in Figure 3.
Figure 3.
Prospective paired-validation roadmap. Korea linked logging, training, QA/QC, and pilot SOPs are shown as external implementation support rather than a readiness score. BSFL, black soldier fly larvae; AD, anaerobic digestion; EC, electrical conductivity; GI, germination index; QA/QC, quality assurance/quality control; SOPs, standard operating procedures.
4. Discussion
4.1. Reframing Tangerang as a Peri-Urban Organic Waste Circularity System
PU-OCRI is not a new indicator algorithm. Wasteaware and urban circularity frameworks assess operating systems, whereas LCA and biowaste tools compare quantified management or treatment scenarios [13,14,15]. PU-OCRI addresses an earlier decision: which stream and node type should be measured before comparable composition, process, cost, and outcome data exist. Its practical features are a node and route sampling frame, explicit evidence use rules, a criterion-level score trail, separation of external support from scoring, joint score weight uncertainty, and a field rule that can reject the initial rank.
The functional boundary is operational only as a reproducible sampling frame. Administrative units define nested strata, but geocoded pilot records are still needed before production to market or market to treatment flows can be modeled quantitatively.
4.2. Implications for Waste and Recycling Practice
The ranking supports a paired source-separation audit, not a technology project. Market-linked organics are the baseline candidate, and garden and landscape organics are the comparator identified by the uncertainty analysis. The paired design may retain, reject, or revise the initial ranking. Accordingly, Table 11 should be read only as a pilot-entry screening matrix; PU-OCRI does not select a treatment pathway.
4.3. Addressing the Main Vulnerabilities of This Study
The main limitation is the absence of direct node-level data on waste flow, contamination, and treatment. Official statistics and planning proxies establish relevant source categories but not a validated rank. Market linked organics are therefore a first audit hypothesis, while the joint uncertainty analysis identifies garden and landscape organics as a close alternative. The paired audit is designed to test both.
A second limitation is score and weight subjectivity. Table 5 documents the evidence for all 25 scores; Table 6 specifies the weighting and randomization rules; and the joint analysis shows how one level score changes affect rank. These steps improve reproducibility but do not calibrate the index. Independent local scoring, inter-rater statistics, and repeated pilot outcomes are still required before policy use.
A third limitation is the heterogeneous temporal and spatial support of the data. The data use matrix prevents arithmetic pooling, excludes the 2022 contextual estimate from scoring, and separates external Korean material from local evidence. The boundary is also limited to a node and route sampling frame. These controls improve internal consistency but do not replace geocoded material flow measurement.
A fourth limitation is treatment uncertainty. Treatment compatibility is a literature-based pre-screen, not measured process performance. Table 11 states what must be measured before a pathway can remain eligible. Comparative pilots must assess recovery, operating stability, product safety, and cost before treatment selection or infrastructure investment.
4.4. Korea Linkage as Protocol Transfer Rather than Coefficient Transfer
Korea was selected for practical rather than normative reasons. BRIN-KIST collaboration and bilateral training and ODA channels make digital logging, operator training, and laboratory QA/QC feasible, while Korean source separation and fertilizer-control experience provides documented procedures [16,17,18,19,20,21,22]. These links do not make Korean coefficients or technologies local defaults.
Governance remains local. Indonesian agencies and operators control node selection, data ownership, regulatory interpretation, and pass/fail decisions. Korean partners may provide time limited templates, training, and inter laboratory support under named work packages. A transferred procedure is retained only when it has a local owner, verification record, and maintenance plan; it cannot compensate for poor separation, safety failure, or weak stakeholder participation.
4.5. Future Validation and Recalibration
Future work should focus on empirical validation and reproducibility rather than further refinement of the pre-field score.
The required next stage is an 8–12 week paired source separation and mass logging audit at market/food service and garden/landscape nodes, followed by feedstock characterization, mandatory safety testing, and laboratory and pilot scale process testing. In addition to mass, contamination, and safety, this study should record transport distance, space or land requirements, labor and operating cost, stakeholder participation, permitting constraints, and treatment specific performance. Independent local raters should rescore the evidence matrix, archive individual ratings, document disagreements, and report inter-rater agreement before policy use. Repeated outcomes across additional streams and locations could later support empirical calibration, stakeholder AHP, or outcome based regression.
Future pilots should use the indicator panel in Table 13, the comparison rule in Section 2.6, and the criterion specific thresholds in Table 8. Observed bands will replace the baseline scores, and the complete uncertainty analysis will be rerun. A market-linked starting point is retained only if it passes all mandatory safety requirements and is not outperformed by the garden and landscape comparator across stability, contamination, treatment, cost, and participation. Discordant or inconclusive results require re-scoring and revised sampling rather than retrospective justification of the original rank.
Table 13.
Pilot-performance indicators and comparison rules for empirical validation and recalibration of PU-OCRI.
The framework’s present value is organizational and testable: it specifies what to measure first, how each score can change, and how the initial recommendation can be rejected. Its empirical value must be demonstrated through the paired audit; until then, the score should not justify procurement, infrastructure, or scale-up.
5. Conclusions
This study developed a stream level screening tool for Tangerang Raya and a separate Korea linked implementation-support module. PU-OCRI addresses the gap between incomplete public evidence and later-stage city benchmarking, circularity monitoring, LCA, or treatment scenario analysis. It is not a validated performance model or a new weighting method. Public data were retained under explicit evidence class and temporal/spatial-use rules. The 2024 horticultural and municipal data, 2025 planning proxy, and 2022 contextual estimate were not pooled as equivalent masses. Korean sources were excluded from the numerical score.
Under equal weights, market linked organics scored 76 and garden and landscape organics 72. Their first rank frequencies were 65.9% and 31.2% under weight only uncertainty and 50.7% and 40.7% under joint score weight uncertainty. Market-linked organics are therefore the baseline audit hypothesis, not an empirically confirmed best stream. Production-side residues and household food waste each scored 56, and mixed residual waste scored 32.
Because the scores are collective author judgments without archived individual ratings or independent stakeholder scoring, the ranking remains provisional. Treatment compatibility is only a screening criterion and requires feedstock characterization and laboratory or pilot scale testing.
Accordingly, an 8–12 week paired audit is required before treatment selection or scale-up. It will compare market/food-service and garden/landscape nodes using geocoded routes, predefined mass and contamination thresholds, mandatory safety gates, treatment feasibility, cost, stakeholder participation, and independent local scoring. Observed evidence will replace the baseline scores, and the uncertainty analysis will be rerun. Korea-linked partners may support logging, training, QA/QC, and pilot SOPs but cannot affect the rank or local decisions.
Author Contributions
Conceptualization, J.-S.Y., Y.H.I. and J.Y.L.; methodology, D.I., N.A.S. and J.Y.L.; data curation, D.I. and N.A.S.; formal analysis, D.I. and J.Y.L.; visualization, C.K.L. and D.I.; writing—original draft preparation, D.I. and J.Y.L.; writing—review and editing, N.A.S., C.K.L. and J.Y.L.; supervision, J.Y.L.; project administration, J.Y.L.; funding acquisition, J.Y.L. All authors have read and agreed to the published version of the manuscript.
Funding
This work was supported by a National Research Foundation of Korea (NRF) grant funded by the Korean government (MSIT) (RS-2024-00340706); the Development of Small-Scale Photovoltaic Power Generation and Storage Technology for Agricultural Applications program (RS-2024-00399318); and the institutional research program of the Korea Institute of Science and Technology (KIST) (26Z0011).
Institutional Review Board Statement
Not applicable.
Informed Consent Statement
Not applicable.
Data Availability Statement
The original contributions presented in this study are included in the article. Further inquiries can be directed to the corresponding author.
Acknowledgments
The authors thank colleagues at BRIN and KIST for institutional collaboration on sustainable industrial systems, smart agriculture, and circular-resource research. The authors also acknowledge the Indonesian public-data providers BPS, local environmental agencies, JDIH, and SIPSN.
Conflicts of Interest
The authors declare no conflicts of interest.
References
- United Nations Environment Programme. Food Waste Index Report 2024: Think Eat Save: Tracking Progress to Halve Global Food Waste; UNEP: Nairobi, Kenya, 2024; Available online: https://www.unep.org/resources/publication/food-waste-index-report-2024 (accessed on 18 June 2026).
- Eriyatno, E.; Larasati, L.; Herianto, A.; Fatmaningrum, D.; Bucatariu, C.; Galvez-Nogales, E. Food Loss Prevention and Reduction Analysis in Indonesia: A Case Study on Chili, Cabbage and Shallot; FAO: Jakarta, Indonesia, 2024. [Google Scholar] [CrossRef] [Scilit]
- Kaza, S.; Yao, L.C.; Bhada-Tata, P.; Van Woerden, F. What a Waste 2.0: A Global Snapshot of Solid Waste Management to 2050; World Bank: Washington, DC, USA, 2018. [Google Scholar] [CrossRef] [Scilit]
- Sistem Informasi Pengelolaan Sampah Nasional. Data Timbulan Sampah. Kementerian Lingkungan Hidup, Republic of Indonesia. Available online: https://sampahnasional.kemenlh.go.id/portal-indikatif/data/timbulan-sampah (accessed on 18 June 2026).
- Badan Pusat Statistik Kabupaten Tangerang. Produksi Tanaman Sayuran dan Buah-Buahan Semusim Menurut Jenis Tanaman di Kabupaten Tangerang, 2024; BPS Kabupaten Tangerang: Tangerang, Indonesia, 2025. Available online: https://tangerangkab.bps.go.id/id/statistics-table/2/MTg1IzI%3D/production-of-seasonal-vegetables-and-fruits-by-kind-of-plant-.html (accessed on 18 June 2026).
- Dinas Lingkungan Hidup Kota Tangerang. Laporan Kinerja Instansi Pemerintah Dinas Lingkungan Hidup Kota Tangerang Tahun 2024; DLH Kota Tangerang: Tangerang, Indonesia, 2025. Available online: https://dislh.tangerangkota.go.id/assets/uploads/informationpublic_20250421_1745204499.pdf (accessed on 18 June 2026).
- Pemerintah Kota Tangerang Selatan. Peraturan Wali Kota Tangerang Selatan Nomor 71 Tahun 2025 Tentang Rencana Induk Pengelolaan Sampah Tahun 2025–2035; JDIH Kota Tangerang Selatan: Tangerang Selatan, Indonesia, 2025. Available online: https://jdih.tangerangselatankota.go.id/produk-hukum/detail/4010-peraturan-wali-kota-tangerang-selatan-nomor-71-tahun-2025-tentang-rencana-induk-pengelolaan-sampah-tahun-2025-2035 (accessed on 18 June 2026).
- Pemerintah Kabupaten Tangerang. Laporan Akhir: Kajian Penanggulangan Sampah Perkotaan Kabupaten Tangerang; Pemerintah Kabupaten Tangerang: Tangerang, Indonesia, 2024.
- OECD; European Commission, Joint Research Centre. Handbook on Constructing Composite Indicators: Methodology and User Guide; OECD Publishing: Paris, France, 2008. [Google Scholar] [CrossRef] [Scilit]
- Smeets, E.; Weterings, R. Environmental Indicators: Typology and Overview; Technical Report No. 25; European Environment Agency: Copenhagen, Denmark, 1999; Available online: https://www.eea.europa.eu/en/analysis/publications/tec25 (accessed on 18 June 2026).
- Urban Agenda for the EU, Partnership on Circular Economy. Indicators for Circular Economy Transition in Cities: Issues and Mapping Paper, Version 4; European Commission: Brussels, Belgium, 2019; Available online: https://www.urbanagenda.urban-initiative.eu/library/issues-and-mapping-paper-indicators-circular-economy-transitions-cities (accessed on 18 June 2026).
- ISO 59020:2024; Circular Economy—Measuring and Assessing Circularity Performance. ISO: Geneva, Switzerland, 2024. Available online: https://www.iso.org/standard/80650.html (accessed on 18 June 2026).
- Wilson, D.C.; Rodic-Wiersma, L.; Cowing, M.J.; Velis, C.A.; Whiteman, A.D.; Scheinberg, A.; Vilches, R.; Masterson, D.; Stretz, J.; Oelz, B. ‘Wasteaware’ Benchmark Indicators for Integrated Sustainable Waste Management in Cities. Waste Manag. 2015, 35, 329–342. [Google Scholar] [CrossRef] [Scilit] [PubMed]
- Clavreul, J.; Baumeister, H.; Christensen, T.H.; Damgaard, A. An Environmental Assessment System for Environmental Technologies. Environ. Model. Softw. 2014, 60, 18–30. [Google Scholar] [CrossRef] [Scilit]
- Delgado, M.; Lopez, A.; Cuartas, M.; Rico, C.; Lobo, A. A Decision Support Tool for Planning Biowaste Management Systems. J. Clean. Prod. 2020, 242, 118460. [Google Scholar] [CrossRef] [Scilit]
- IPB University. Encouraging Future Agriculture, South Korea-Indonesia Realize Smart Greenhouse and Plant Factory at IPB University. IPB News, 21 October 2024. Available online: https://www.ipb.ac.id/news/index/2024/10/encouraging-future-agriculture-south-korea-indonesia-realize-smart-greenhouse-and-plant-factory-at-ipb-university-here-are-the-advantages/ (accessed on 18 June 2026).
- Jung, S. Digitalization and K-Smart Agriculture: Vision of EPIS ODA Project; Korea Agency of Education, Promotion and Information Service in Food, Agriculture, Forestry and Fisheries (EPIS): Sejong, Republic of Korea, 2025; Available online: https://www.wbgkggtf.org/sites/default/files/2025-10/Session%203.1%20Soyoung%20Jung%20%28EPIS%29.pdf (accessed on 18 June 2026).
- Ministry of Agriculture, Food and Rural Affairs. S. Korea’s First Master Plan for Promotion of the Growth of the Smart-Farming Industry for 2025–2029; MAFRA: Sejong, Republic of Korea, 2025. Available online: https://www.mafra.go.kr/bbs/english/25/585835/download.do (accessed on 18 June 2026).
- Korea Legislation Research Institute. Fertilizer Control Act; KLRI: Sejong, Republic of Korea, 2022; Available online: https://elaw.klri.re.kr/eng_mobile/viewer.do?hseq=60247&key=24&type=part (accessed on 18 June 2026).
- Kementerian Pertanian Republik Indonesia. Peraturan Menteri Pertanian Nomor 01 Tahun 2019 Tentang Pendaftaran Pupuk Organik, Pupuk Hayati, dan Pembenah Tanah; Kementerian Pertanian: Jakarta, Indonesia, 2019. Available online: https://peraturan.bpk.go.id/Details/161054/permentan-no-01-tahun-2019 (accessed on 18 June 2026).
- Lee, E.; Shurson, G.; Oh, S.H.; Jang, J.C. The Management of Food Waste Recycling for a Sustainable Future: A Case Study on South Korea. Sustainability 2024, 16, 854. [Google Scholar] [CrossRef] [Scilit]
- Ministry of Environment, Republic of Korea; Korea Environment Institute. Two Decades in Effect: Volume-Based Waste Fee System in South Korea. Korea Environ. Policy Bull. 2016, XIV, 43. [Google Scholar]
- Ju, S.H.; Kim, Y.J.; Go, Y.; Kim, E.J.; Lee, J.G.; Park, J.S.; Kim, D.; Lee, B.S.; Na, H. Assessment of the Chemical Properties and Resource Utilization Potential of Paprika Plant Residues. Hortic. Sci. Technol. 2026, 44, 93–104. [Google Scholar] [CrossRef] [Scilit]
- Shin, K.S.; Kim, C.H.; Lee, S.E.; Yoon, Y.M. Biochemical Methane Potential of Agricultural Byproduct in Greenhouse Vegetable Crops. Korean J. Soil Sci. Fert. 2011, 44, 1252–1257. [Google Scholar] [CrossRef] [Scilit]
- Amrul, N.F.; Kabir Ahmad, I.; Ahmad Basri, N.E.; Suja, F.; Abdul Jalil, N.A.; Azman, N.A. A Review of Organic Waste Treatment Using Black Soldier Fly (Hermetia illucens). Sustainability 2022, 14, 4565. [Google Scholar] [CrossRef] [Scilit]
- Patel, M.R.; Panwar, N.L. Biochar from Agricultural Crop Residues: Environmental, Production, and Life Cycle Assessment Overview. Resour. Conserv. Recycl. Adv. 2023, 19, 200173. [Google Scholar] [CrossRef] [Scilit]

Disclaimer/Publisher’s Note: The statements, opinions and data contained in all publications are solely those of the individual author(s) and contributor(s) and not of MDPI and/or the editor(s). MDPI and/or the editor(s) disclaim responsibility for any injury to people or property resulting from any ideas, methods, instructions or products referred to in the content. |
© 2026 by the authors. Licensee MDPI, Basel, Switzerland. This article is an open access article distributed under the terms and conditions of the Creative Commons Attribution (CC BY) license.