


Abstract
Taxing multinational corporations raises significant government revenue to support progress towards the Sustainable Development Goals (SDGs).This study examines Philips, a multinational corporation that publicly reports country-by-country data on revenue, profits, taxes, employees and tangible assets, using the Government Revenue and Development Estimations (GRADE) econometric model to estimate the development impact of its corporate income tax contributions. Tax payments do not always reflect actual economic activity in host countries due to profit shifting. This study also assesses the degree to which reported profits align with economic activity. Results indicate Philips’ tax payments make a meaningful positive contribution to sustainable development: government revenue equivalent to these payments enables over 1100 additional children to attend school daily and advances SDG progress on basic water (8100 people), sanitation (13,400 people), clean fuels (28,000 people) and electricity (1700 people). However, analysis reveals some misalignment between reported profits and economic activity across countries, suggesting unrealised potential in Philips’ development contribution. Modelling a reallocation of taxing rights to host countries where economic activity occurs using unitary tax with formulary apportionment indicates that annual tax payments may average $78 million higher in constant 2015 USD, potentially enabling 900 more children to attend school and expanding access to basic water (6500 people), sanitation (9600 people), clean fuels (22,600 people) and electricity (7400 people). These findings highlight the value of transparent country-by-country reporting as a foundation for evidence-based tax policy reform and the significant development gains from Philips’ tax payments and greater gains if profits were better aligned with economic activity.
1. Introduction
The 17 Sustainable Development Goals (SDGs) were conceived and developed by all United Nations (UN) member states and published in 2015 as part of the 2030 Agenda for Sustainable Development [1]. The SDGs are a broad, universal framework, or ‘plan of action for people, planet and prosperity’, which covers a wide range of issues, including health, education, inequality, hunger, and poverty; they can only be achieved with adequate finance and ‘in collaborative partnership’ Preamble [2]. Here, we focus on the SDGs that are critical for health and well-being, including access to water and sanitation, education, clean fuels and electricity, and outcomes including child and maternal survival.
Governments are the primary providers of public services necessary for national development and population health and well-being. To deliver these services, governments require revenue, and the private sector, through its tax payments, is a major contributor [3]. Tax is identified as the primary means of implementing the SDGs in SDG 17.1. However, developing countries face a large financing gap that impedes progress on the SDGs. The gap stands at $2.5–4 trillion annually [3]. Critical sources of finance, alongside domestic resource mobilisation, include sustainable debt restructuring, SDG-aligned private finance, investment and trade, and international development cooperation [4].
Taxation contributes 70–85% of total government revenue, and the remainder is made up of non-tax revenue, including fees, fines, profits from state-owned enterprises, resource rents and royalties, grants and aid, interest and investment income, and the sale of assets [5]. Tax revenue is derived from direct and indirect taxes; direct taxes include taxation on the income of both individuals and corporations, and indirect taxes include consumption taxes such as value-added or sales tax [6]. Lower-income country governments typically struggle to raise direct taxes (such as personal income tax) from citizens, many of whom work in the informal sector [7]. Collecting corporate income tax is critical for government revenue, and though it is important for all governments, corporate income tax contributes, relatively, a much larger share in lower-income countries [8]. For example, corporate income tax accounted for almost one-fifth of total tax revenue in African countries, twice the proportion of OECD countries [9,10].
The current system of taxation of multinational corporations, based on the ‘arm’s length principle’, was established over a century ago by the limited number of countries that formed the League of Nations. This system has undergone only modest reforms, largely led by another exclusive membership organisation, the Organisation for Economic Co-operation and Development (OECD). According to the State of Tax Justice 2024, OECD member countries and their dependencies are responsible for two-thirds of global corporate tax abuse risks [11]. Lower-income countries, which are not members of the OECD, have been disproportionately affected by corporate tax abuse, yet have remained on the margins of OECD-led negotiations to reform international taxation.
Therefore, in 2023, the African Group at the UN successfully proposed a resolution to begin negotiations on a UN Framework Convention on International Tax Cooperation. One year later, UN member states agreed on the terms of reference and a schedule for concluding negotiations in 2027 [12]. Member states have an opportunity to support SDG progress by deciding on a fairer allocation of taxing rights, which includes how the rights to tax are determined between resident countries, where multinational corporations are headquartered, and source countries, where economic activity occurs, value is created, sales are made, and customers are based. For multinational corporations to align profits and taxes with economic activity would mean they would book profits and be taxed in the countries where real economic activity occurs, rather than shift profits to exploit loopholes in international tax law and to tax havens and pay less tax. A primary means of ensuring that profits and taxes are aligned with economic activity is through unitary taxation with formulary apportionment. This allocates a multinational corporation’s taxable profits based on the share of this corporation’s economic activity in each jurisdiction [13]. With universal adoption, profits are taxed in one jurisdiction only, eliminating both double non-taxation and double taxation.
The purpose of this case study is to examine the potential impact of an increase in government revenue equivalent to tax contributions and SDG progress if profits were aligned with economic activity for one multinational, to envision the potential for SDG progress of unitary taxation and formulary apportionment at a global level, given that profit misalignment is a characteristic of the international tax system, and not unique to one multinational corporation, as we explain below.
This paper is organised as follows: Section 2 reviews the literature on the relationship between corporate income tax and SDG progress, Section 3 describes the data and methods, Section 4 presents the results, Section 5 discusses the strengths and limitations of the study, and Section 6 and Section 7 provide a discussion and the conclusion, respectively.
2. Corporate Tax and SDG Progress
Several studies examine the relationship between tax and SDG progress and find it to be positive. Halim and Rahman use panel data regression models to study 10 emerging countries (2000 to 2021). They model the impact of tax rates on each country’s annual SDG index (a composite index of all 17 goals). They find that corporate, personal, effective and sales tax rates are positively and significantly associated with the SDG index [14]. In a study covering 23 African and 22 upper-middle- and high-income countries (2010–2020), Ajeigbe et al. estimate a dynamic panel model using the generalised method of moments (GMM) to understand the impact of different tax categories on sustainable development. They use GDP per capita growth, poverty, and unemployment as proxies for sustainable development and find that tax revenue, including corporate tax revenue as a percentage of GDP, is positively associated with the selected proxies for sustainable development [15]. With a focus on the SDG indexes of 38 OECD countries (2000–2021), Rahman models the impact of effective average tax, tax on personal income, tax on corporate profits, and tax on goods and services, drawing on the theory of optimal taxation, where tax systems are designed to maximise social welfare and minimise economic distortions. He finds that a positive change in taxes leads to a positive change in the SDG index, while the impact of tax varies according to the type of tax and the income level [16]. Multinational corporations themselves also benefit from SDG progress in countries where they operate, as they use public infrastructure and rely on a healthy workforce.
Other studies examine the negative relationship between the SDGs and corporate tax base erosion and profit shifting enabled by international tax rules and tax havens [17], tax incentives, holidays and deductions [18], and challenges with enforcement, audit and collection from multinational corporations [19]. O’Hare et al. studied the potential impact on government revenue and for SDG progress if tax abuse were curtailed [20], and Etter-Phoya et al. considered the case of one country, Malawi, if tax abuse were curbed [21]. These studies demonstrate the gap between the potential of corporate taxation and the financing needed to achieve the SDGs.
Profit shifting to low-tax jurisdictions, or tax havens, is a common practice [22], with up to 35% of multinational corporate profits shifted annually [23], which reduces total tax payments. Lower-income countries with the greatest need for SDG progress lose the most tax revenue relative to their total tax revenue [17]. These practices undermine governments’ ability to finance the SDGs and the target to ‘strengthen domestic resource mobilization, including through international support to developing countries, to improve domestic capacity for tax and other revenue collection’ (SDG 17.1). For this reason, tax-motivated illicit financial flows, including tax evasion and aggressive tax avoidance, are among the 231 indicators and 169 targets agreed by UN member countries used to measure progress on the 17 SDG goals [24]. While the law forbids tax evasion, aggressive tax avoidance sits in a grey area, breaching the ‘spirit’ of the law but not always the letter.
Tax practice is not the only means by which multinational corporations support or undermine development progress. The SDG framework recognises the importance of strengthening partnerships among the private sector, governments, and society to support progress on the SDGs (SDG 17). Multinational corporations may both support and undermine SDG progress across all the SDGs. According to a study of 348 multinational corporations’ sustainability reports, 102 of the 169 targets were referenced [25]. Thus, multinational corporations ‘can be engines for knowledge and capital transfer, capital deepening, employment and structural change’, but they may also undermine domestic industry through monopolies [26].
The impact of multinational corporations—typically determined by size, sector, country of origin, and country-specific strategies—stretches across the supply chain, although direct impacts tend to be the focus of most sustainability reporting [25]. A 2023 literature review of research on corporate SDG reporting suggests that reports are ‘largely symbolic and primarily used as an impression management tool’ [27], while meaningful inclusion of corporate tax policies and practices is typically absent in most ratings and standards on Environmental, Social and Governance (ESG) of multinational corporations. Worryingly, ‘An analysis of the tax performance of many U.S. corporations lauded for being the promoters and stewards of ESG goals reveals that they grossly underpay taxes, leading to unprecedented levels of corporate tax avoidance’ [28].
Considered a global benchmark, the Global Reporting Initiative (GRI) standard on tax (GRI 207: Tax 2019) [29], albeit voluntary, is a comprehensive tax reporting standard. It is made up of four components: (1) a description of the corporation’s approach to tax, including how it is linked to sustainable development strategies; (2) a description of the tax governance and control framework, mechanisms to raise concerns about the corporation’s integrity in relation to tax, and assurance process on disclosures; (3) a description of stakeholder engagement and management of concerns related to tax; and (4) country-by-county reporting. Only one quarter (26%) of the 1000 largest public corporations mention the GRI 207 Tax Standard and only 11% align fully with the GRI 207-4 disclosure standard on country-by-country reporting [30], despite the major influence of corporate tax on SDG progress.
In view of concerns about ESG reporting, this research uniquely provides an objective way to assess the private sector’s tax contributions to SDG progress through increased government revenue. Given the role of tax avoidance in undermining development progress, we also provide the first analysis of the potential impact on SDGs of corporate income tax if taxing rights of countries were aligned with their shares of economic activity, through unitary tax with formulary apportionment. By using Philips’ data, we are using the most progressive and comprehensive form of corporate reporting on tax, public country-by-country reports, as disclosed under the voluntary GRI Standard.
Philips and Its Approach to Taxation
Philips, officially Koninklijke Philips N.V., is a Dutch health-technology corporation. The focus of its business model is the design, manufacture and service of health and medical technology products to support patient diagnosis, treatment, and monitoring. Products include diagnostic machines (magnetic resonance imaging and computed tomography), software and data solutions (patient monitoring systems), and personal healthcare products (oral care, mother and child health) [31]. Revenue streams include product and service contract sales. In 2024, Philips generated sales of EUR 18 billion and employed 67,800 people. Its customer base includes hospitals, clinics and consumers in 100 countries [31]. For Philips, like other multinational corporations, assets are both tangible and intangible. Intangible assets include intellectual property, like patents and trademarks, and tangible assets core to its business include, among others, machinery, manufacturing and assembly plants for medical equipment, data centres, and research and development facilities.
Philips’ tax reports state that the corporation exists to ‘improve people’s health and well-being through meaningful innovation’, and it recognises that profits and success are heavily dependent on factors external to the corporation, including local infrastructure, employees, and administration. The report states that it considers wider society and government revenues when paying taxes [32]. From 2020 onwards, Philips committed to publicly disclosing taxes paid on a country-by-country basis [33]. Philips, like Vodafone, is among a growing number of corporations that voluntarily publish details on where they generate revenue, make profits, pay taxes, employ staff, and own or lease assets (property, plant and equipment). These reports are referred to as public country-by-country reports. Both corporations have been highlighted by the Financial Accountability and Corporate Transparency (FACT) Coalition [34] as leaders in their compliance with the Global Reporting Initiative (GRI) tax standards [29]. Therefore, as early adopters, with five years of reporting available, we have decided to focus on Philips in this paper. Philips has been reporting since 2021, for the 2020 financial year onwards, when the GRI 2017: Tax 2019 standard was introduced.
3. Materials and Methods
Here, we apply a methodology previously used to quantify profit misalignment at the country level to the level of one multinational corporation. We use five years of public country-by-country reports from a single multinational corporation to assess the alignment of profits with economic activity. Using the GRADE tool (version 3.20.1), described below, we quantify the impact of changes in government revenue equivalent to corporate tax on the SDGs in countries where the multinational corporation is present, and the potential additional SDG progress if the multinational corporation declared profits and paid corporate tax in alignment with its economic activity.
3.1. Country-by-Country Data
The first case study to assess the impact of government revenue equivalent to a single large multinational corporation’s (Vodafone) total tax contributions on SDG progress included a broad range of tax types, including corporate income tax, customs duties, payroll taxes (from both employer and employee), and value-added tax deductions, some of which were collected on behalf of the government rather than paid by the corporation [35]. In this study, our focus is narrower as we analyse only corporate income tax. Yet our scope is deeper, as we assess whether these payments align with the corporation’s real economic activity and examine the impact of any misaligned profits—those out of proportion to economic activity—on SDG progress. For this case study, we analyse the reports of another early adopter of public country-by-country reporting, Philips.
Philips has published country-by-country reports for the financial year 2020 onwards. The Country Activity and Tax Report, as they are named, include information on tax contributions, tangible assets, employees, and profit and loss. We used all available reports at the time of our analysis: data from each country, reported in millions of euros each year between 2020 and 2024 (five years) [32,33,36,37,38]. The corporate income tax paid is converted into USD using the average Euro-to-USD exchange rate for each year, then converted to 2015 USD for modelling. An increase in government revenue equivalent to the average corporate income tax is modelled using the GRADE tool over the same five years.
3.2. SDG Progress if Taxes Were Aligned with Economic Activity
Given widespread concerns about profit shifting, we provide estimates of potential corporate income tax contributions aligned with the corporation’s real economic activity in each country. There are two accepted methods for quantifying economic activity.
Tørsløv et al.’s research, which is also used by the EU Tax Observatory, now the International Tax Observatory, in its Global Tax Evasion Report 2024, estimates profit shifting by comparing the profit-to-wage ratios between multinational and domestic corporations. Using national accounts data, foreign affiliate statistics, and bilateral balance of payments data, they treat domestic firms as the baseline since they cannot shift profits across borders. They attribute excess profitability of multinationals to profit shifting [39]. Garcia-Bernardo and Janský’s approach compares multinational corporations’ reported profits against theoretical profits—that is, the profits each entity would be expected to earn based on real economic activity indicators such as employment, assets or sales. The gap between reported and theoretical profits is attributed to profit shifting [17]. Both methods attribute the residual to profit shifting, however, Garcia-Bernardo and Janský work at the corporation or country-by-country level, while Tørsløv et al. use aggregate national accounts. The method employed here is based on Garcia-Bernardo and Janský’s approach. This is used by the Tax Justice Network in the State of Tax Justice annual report to assess the global and national scale of profit misalignment by drawing on aggregate anonymised country-by-country reporting data published by the OECD [17,40]. The profit misalignment methodology is based on the ‘notion that profits should accrue where the economic activity takes place’ [41] and attributes economic activity to an equal weighting of employees and wages, which is used to calculate theoretical profits. Theoretical profits are the profits that would be booked in a country if profits were aligned with economic activity.
To estimate the theoretical profits and, through this, the potential revenue gains and losses for countries where profits are misaligned, we use the following steps:
- Share of profits/losses, tangible assets and employees of global totals: For each country, we convert the yearly profits/losses and tangible assets first to USD and then to 2015 USD, and the average over five years is expressed as a percentage of the global total. The average number of employees and average tangible assets over five years are also expressed as a percentage of the global total.
- Aligned (theoretical) profits: We estimate the aligned profits/losses that each country would accrue if the profits and losses were aligned with real economic activity, using the percentage of the total global number of employees and tangible assets, which are weighted equally.
- Misaligned profits and tax losses/gains: We estimate the misaligned share by subtracting the aligned (theoretical) share from the reported share of global profits/losses. We then multiply the misaligned share by the global profits or losses (average for the five years) in 2015 USD. To establish the misaligned corporate income tax, we, like others, multiply the misaligned loss for each country by the statutory corporate tax rate in that country, while the misaligned gains are multiplied by the effective tax rate [41]. We intentionally use the statutory tax rate, even if the actual rate a multinational corporation pays is lower, because these are the rates that countries have decided, often through a democratic process, that should apply to corporations operating in their jurisdiction [41]. At this stage, we also assess different weightings in the formula for employees and tangible assets and confirm the observation that the choice of formula has little influence on estimates of profit misalignment, as discussed below.
- Translating into impacts on SDG progress: Using the GRADE tool (version 3.20.1), we translate the misaligned corporate income tax into the number of additional people who would gain access to SDG indicators if the government had additional revenue equivalent to the misaligned tax.
3.3. Modelling Philips’ Contribution to Government Revenue and the SDGs
The model underpinning the GRADE tool uses the following data sources. General government revenue data, excluding grants, is used as it is the best measure of a government’s capacity to mobilise domestic resources. Data are available in the Government Revenue Database (GRD) [5]. Social contributions are included, despite incomplete data in some countries. We present the GRD data as a percentage of GDP and convert it into GDP per capita using constant 2015 USD from the World Development Indicators (WDI). The GRD is typically updated annually.
Given the effect of revenue on development is affected by public financial management and governance, the model uses the six Worldwide Governance Indicators (WGIs) to model governance. These indicators are: Control of Corruption, Government Effectiveness, Voice and Accountability, Political Stability, Rule of Law, and Regulatory Quality [42]. Multiple surveys underpin these composite indicators. Countries are ranked relative to a global average of zero, with scores ranging from −2.5 +2.5. The WGI data are also updated annually.
To assess SDG progress, the model uses SDG indicators for access to basic and safe water and sanitation, clean cooking fuels, electricity, under-five child survival rates, and maternal survival rates during childbirth. These data are sourced from the World Bank’s World Development Indicators (WDI) database [43]. This is updated biannually. The indicators included in GRADE were selected because they are critical to health and well-being, and there was sufficient data in the WDI database to support modelling. The GRADE model continues to increase the number of SDG indicators included, dependent on data availability. Besides the WDI database, the model employs estimates from a Bayesian hierarchical cohort-based model developed by the UNESCO Institute for Statistics (UIS) and the Global Education Monitoring Report (SDG indicator 4.1.4) [44,45,46] to model the impact of government revenue and governance on school attendance and teacher numbers.
3.4. The GRADE Model
The GRADE model relies on a series of unbalanced panel data models, using data from 217 countries, covering the years 1996 to 2022 [47]. The basic model for each indicator follows a similar nonlinear structure in the following form:
where Yi is the SDG indicator being modelled, GR is government revenue, is a vector of indicators of the quality of governance in each country in each time period and are parameters to be estimated.
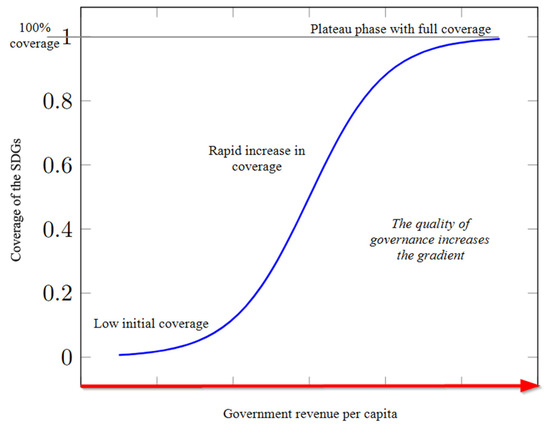
This nonlinear function was chosen to reflect real-world SDG progress, or coverage of SDG indicators. At low levels of development, increases in government revenue have a limited effect on the dependent variable (or SDG indicator). As countries develop, there is a phase of rapid improvement in indicator coverage, followed by diminishing returns as development continues. A country eventually reaches a point at which additional government revenue yields little or no additional progress. This pattern creates an ‘S’-shaped curve characterised by the logistic function (see Figure 1). The four estimated parameters, , determine the specific shape and position of each country’s curve. This allows the governance quality variables to explain variations in outcomes across countries.
Figure 1.
The relationship between government revenue per capita and the coverage of SDGs.
A set of equations for governance indicators is included that shares a similar functional form. This reflects the empirical observation that governance quality tends to improve as countries generate more income. This creates a positive feedback loop. Here, increased government revenue directly improves SDG progress and strengthens governance. Improved governance, in turn, increases the effectiveness of the additional revenue for SDG progress, creating a virtuous cycle over the longer term [48].
Rapid improvements in SDG progress, particularly in lower-income countries, are usually followed by diminishing marginal returns with additional government revenue. This means multinational corporations that pay taxes predominantly in lower-income countries, where modest revenue gains can have a transformative effect, following the S-shaped curve, improve SDG progress for more people. Thus, profit shifting from lower-income countries where SDG indicator coverage remains far from universal has a disproportionately negative effect on development outcomes. In contrast, in high-income countries, where SDG coverage is already near-universal, additional tax contributions to government revenue yield little or no gains for the indicators studied here [49].
Many analyses which quantify the impact of additional government revenue or expenditure on developmental outcomes assume that revenue will be fully allocated to a single expenditure priority, such as a vaccination programme or teachers’ salaries. However, this assumption is unrealistic because all governments manage multiple competing priorities with limited resources and are unlikely to ringfence or allocate additional revenue into a single sector or budget line. The GRADE model takes a more realistic approach. It assumes that any increase in government revenue is distributed across all areas of government spending, in line with historical patterns. This method reflects the broader impact of increased revenue, ensuring improvements across all SDGs, not just the specific indicators modelled.
4. Results
The results are presented in the following four sections, with all currency figures reported in constant 2015 USD. First, we present results on corporate income tax, the estimated misaligned corporate income tax, with the gains and losses by income level, i.e., high-income countries, upper-middle-income countries, and lower-middle-income countries. Second, we present the modelled impact of revenue equivalent to Phillips corporate income tax on SDG progress. Third, we present the modelled impact on SDG progress if profits and corporate income tax were aligned with economic activity. Fourth, we present the combined impact on SDG progress, including existing corporate income tax contributions and those if profits are aligned with economic activity.
4.1. Summary of Corporate Income Tax and Misaligned Corporate Income Tax
Table 1 shows that between 2020 and 2024, Philips paid an average of $370 million (in 2015 USD) in corporate income tax across 75 countries (column A), which are grouped by country-income level.
Table 1.
Corporate income tax (CIT) and estimated misaligned CIT by income level.
Aligning profits with real economic activity would result in some countries gaining additional revenue and other countries receiving less corporate income tax revenue. In Table 1, we compare Philips’ reported average corporate income tax payments with the estimated misaligned corporate income tax, focusing on the scale of potential revenue gains and losses by income group.
If taxing rights were aligned with economic activity, 36 countries would have realised an additional $286 million in revenue (2015 USD, column B). Notably, for lower-middle-income countries, the amount of tax misaligned ($13.0 million in column B) is nearly equal to the average corporate income tax reported ($13.8 million in column A).
In contrast, if taxing rights were aligned with economic activity, 39 countries would experience a $208 million reduction in corporate income tax (2015 USD, column C). Profit shifting is driven by the pursuit of lower effective tax rates, where profits are taxed at minimal rates or not at all. Consequently, the revenue gains ($208 million) for jurisdictions benefitting from profit misalignment, including low-tax jurisdictions, are smaller than the revenue losses ($286 million) incurred by the countries where profits originate and are shifted.
Overall, in aggregate, high-income, upper-middle-income, and lower-middle-income countries would gain additional tax revenue if corporate income tax payments were aligned with the actual distribution of economic activity within their borders (column D). While the absolute gains from aligning profits are largest in high-income countries at $56 million (2015 USD) (column D), the relative share of tax, expressed as a percentage of total corporate income tax, is substantially higher in lower-middle-income countries at 90.6% compared to 17.5% in high-income countries (column E). Globally and in total, if profits were aligned with real economic activity, the result would be an average annual increase of $78 million in corporate income tax (in 2015 USD) (column D), representing just over one-fifth (21.1%) of total corporate income tax.
4.2. Taxes and SDG Progress
Government revenue equivalent to Philips’ corporate income tax in 67 host jurisdictions or territories is available and data on the impact of additional revenue on the SDG indicators are available for 64 countries. The three jurisdictions or territories with insufficient SDG indicator data are Puerto Rico, Taiwan, and Venezuela. We include all relevant variables available in the GRADE tool (version 3.20.1). Table 2 illustrates the modelled impact on SDG progress when governments have additional revenue equivalent to Philips’ corporate income tax by income level.
Table 2.
Additional people and children gaining access to SDG-related services and surviving when governments have revenue equivalent to Philips’ corporate income tax (CIT), by income level.
Our modelling suggests that the additional government revenue equivalent to the corporate income tax paid by Philips, leads to 8 more children surviving beyond their fifth birthday each year. This supports the SDG target 3.2, which aims to end preventable deaths of children under the age of five. In total, 8100 people would gain access to basic water, 13,400 to basic sanitation, 1300 to safe water, and 3700 to safe sanitation daily. Furthermore, 28,000 would use clean fuels, 1700 would gain access to electricity, and 1100 additional children would attend school daily. Corporate income tax paid to governments positively affects progress on the SDGs across all income groups. Lower-middle-income countries receive the least absolute tax revenue; however, given their current SDG coverage, the impacts on people’s lives are greater across all SDGs assessed.
4.3. Additional SDG Progress if Taxes Were Aligned with Economic Activity
Table 3 shows the estimated impact of tax revenue losses and gains on SDG progress if profits and corporate income tax were aligned with economic activity, aggregated by income level.
Table 3.
People and children gaining access to SDG-related services and surviving when governments have changes in revenue equivalent to the tax revenue losses and gains if profits were aligned with economic activity, by income level.
Overall, all income groups would gain revenue and advance SDG progress under an alignment scenario. High-income countries lose the most in terms of absolute revenue due to misalignment, over $56 million in 2015 USD. The high-income countries that benefit the most from profit misalignment are the Netherlands and Germany, but the impact of aligning profits with economic activity on the SDG indicators studied here is minimal because coverage of the modelled indicators in these two countries is already nearly universal. In contrast, the impact of profit misalignment on SDG progress is greatest in lower-middle-income countries. Collectively, upper- and lower-middle-income countries lose $22 million in 2015 USD each year. If governments had this additional revenue, each day an estimated 9600 more people would have access to basic sanitation, and more than 900 children would attend school. The greater proportional increase in access to electricity is explained by Indonesia and India, where even a small percentage change in coverage in these populous countries results in a greater number of additional people gaining access.
4.4. Total Estimated SDG Progress
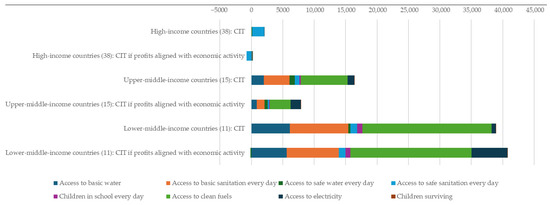
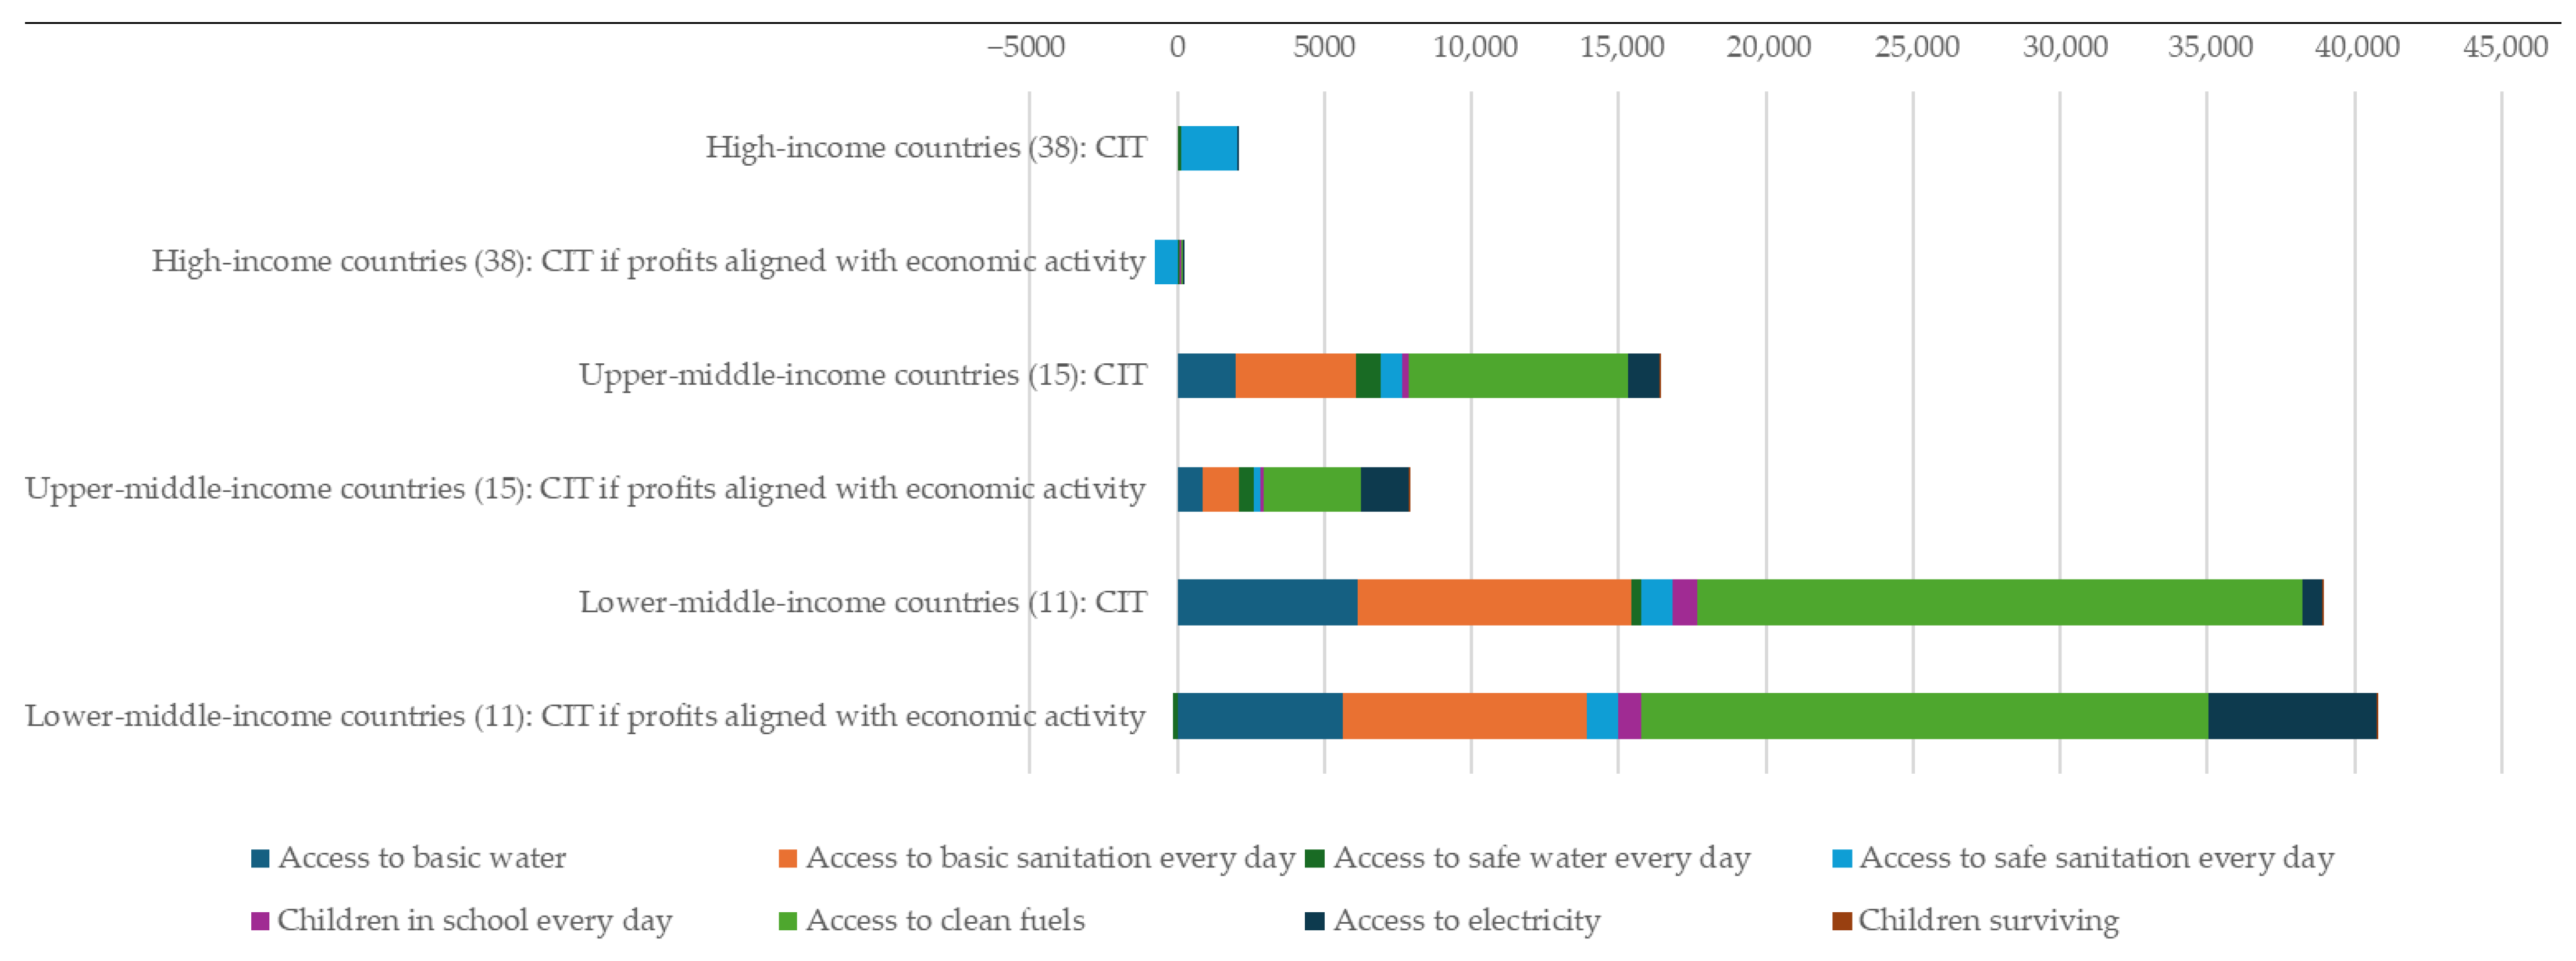
Figure 2 presents the estimated development gains for adults and children, including survival and access to services, aggregated by income groups, when governments have revenue equivalent to the average reported Philips’ corporate income tax payments and the additional gains if profits were aligned with economic activity and were taxed by respective governments.
Figure 2.
Additional people and children gaining access to SDG-related services and surviving when governments have revenue equivalent to Philips’ corporate income tax (CIT), and if profits were aligned with economic activity.
In absolute terms, SDG progress improves, especially for lower-middle-income countries, if profits are aligned with economic activity. This is to be expected given the non-linear relationship between increases in government revenue and SDG coverage, where a small increase in government revenue greatly improves development outcomes in lower-income countries, as discussed earlier. In contrast, in high-income countries, where SDG coverage is already near-universal, additional, or less, revenue results in minimal development gains, or losses.
5. Strengths and Limitations
The novelty of the study is the application of a method previously used to quantify misalignment at the country level to the level of one multinational corporation to examine the potential tax contributions and SDG progress if profits were aligned with economic activity. Corporation-level data helps more accurately understand the extent of profit shifting and potential revenue and development impacts of the fairer allocation of taxing rights, where profits and taxes are aligned with economic activity [17]. The corporate behaviour of misalignment is generalisable based on global studies of profit misalignment [11,17,23,50]; however, further analysis of more multinational corporations that publish country-by-country reports will strengthen corporate-level observations.
The primary limitation of this analysis is that not all misalignment results from profit shifting. With only five years of data, given that public country-by-country data is relatively new, it is not possible to detect trends and misalignment that may result from other causes. For the five years studied, the results may also be influenced by the timing of account reporting and by tax arrangements that allow losses to be carried forward or back. Additional factors include timing differences, as expenses may be deductible in different years under tax law compared to accounting rules, and income may be related to free trade or special economic zones and be tax exempt [32]. While multinational corporations are estimated to shift up to 35% of profits to tax havens, resulting in losses of almost 10% of all corporate tax revenues globally [51], we consider observed profit misalignment for Philips to be characteristic of multinational corporate practice and aligned with expert opinion. US multinational corporations are typically more aggressive in achieving misalignment and have become more so over time, as the State of Tax Justice of 2025 shows using aggregate anonymised country-by-country reporting data [52]. Consequently, we would expect stronger impacts on average than we find for Philips, from ending misalignment. Nevertheless, we do not argue that all misaligned profits are shifted profits; rather, they represent the potential revenue gains (and losses) if profits were aligned with economic activity, as under a model of unitary taxation with formulary apportionment, which is a fairer way to tax multinational corporations.
To estimate the foregone revenues due to misalignment, we used the statutory tax rate, which does not account for corporation- or country-specific tax incentives or tax breaks. We were also only able to use a formula with employees and tangible assets, as there is no sales data by final destination or information on wages, which would be useful for testing different formulae to allocate profits based on economic activity, which the European Union considered during discussions of a common consolidated corporate tax base [53].
Since the reporting period includes global economic shocks associated with the COVID-19 pandemic and the Russian invasion of Ukraine, the findings should be understood in this particular context. We see no reason to expect the volatility of this period to result in higher or lower realised misalignment of profits, however, and analysis of aggregate data suggests that policy measures such as the US Tax Cuts and Jobs Act are more likely to have shaped overall trends during the period [52].
Finally, this study did not capture other important issues across the value chain and a corporation’s net development impact. For example, the benefits to families and communities from additional employment are not included, nor are the human rights and environmental impacts associated with resource use across Philips’ value chain.
6. Discussion
Our model indicates that government revenue, equivalent to Philips’ corporate income tax, enabled 8 children to survive each year and 1100 additional children to attend school daily. Thousands more people have access to crucial services through SDG progress, with many people gaining access to basic water (8100 people), basic sanitation (13,400 people), clean fuels (28,000 people), and electricity (1700 people) (see Table 2).
Philips paid, on average, $13.8 million in constant 2015 USD in corporate income tax to lower-middle-income countries. Our misalignment analysis suggests that if taxes were aligned with real economic activity and taxed at the statutory tax rate, governments would receive an additional $13.0 million in constant 2015 USD. This would make a significant difference. Under such an alignment scenario, 4 additional children would survive, 930 more children would attend school daily, and many thousands would benefit from SDG progress, including access to basic water (6500 people), basic sanitation (9600 people), clean fuels (22,600 people) and electricity (7400 people); see Table 3. Lower-middle-income countries, the countries with the most urgent development needs, would benefit the most, while the cost, in terms of SDG progress, to high-income countries would be minimal. This underscores the profound impact of tax disparities on global inequalities between countries.
In their robustness checks for economic activity, the Tax Justice Network, employing Garcia-Bernardo and Janský’s method, compared other indicators for economic activity, including sales, tangible assets, employees, and wages. They find that ‘the choice of indicators or formula used has a relatively small influence on the estimation of profit shifting at the country level for domestic operations of MNCs [multinational corporations], foreign MNCs shifting profits in, and foreign MNCs shifting profits out’ (pg. 10) [40].
Previous analyses have indicated that using wages as a factor may be less redistributive towards lower-income jurisdictions than using employee count [54], so this could result in smaller SDG impacts than the results presented. On the other hand, the eventual availability of data on sales by final destination is expected to eliminate much of the distortion arising from firms booking sales through low-tax jurisdictions that are not the location of ultimate consumers. This would favour jurisdictions where additional revenues translate most directly into SDG gains.
Given the data available in Philips’ public country-by-country reports, we use the number of employees and tangible assets as proxies for economic activity to calculate theoretical profits. At the aggregate level, these findings are relatively insensitive to the choice of economic activity measure. For example, the Netherlands is the headquarters country, and here the bulk of Philips’ global profits are reported. It accounts for 13.6% of Philips’ global employment, but 21.1% of the corporation’s tangible assets. If we use a formula that only considers employment, the Netherlands is found to have a misaligned profit of $993 million. Under a formula that only considers tangible assets, the misalignment would be $929 million. In our preferred formula, the misalignment is $961 million. This means the Netherlands currently books $961 million profits above its economic activity.
When we look at individual countries in the global supply chain, however, the differences between proxies can be much greater. A particularly large discrepancy is observed regarding India, which accounts for 11.7% of Philips’ global employment and 3.6% of tangible assets. For many countries, however, the discrepancies are small. Egypt, for example, would stand to gain from aligning profits with economic activity—around $1.4 million from either formula—and the UK would gain around $19 million regardless of formula. For only seven countries does the discrepancy between the two extreme formulae exceed $5 million. We include the full findings for a range of formulae using different weights for employment and tangible assets in the spreadsheet accompanying this paper.
An additional question relates to the actual effective tax rates paid in each jurisdiction—in particular, whether there is any evidence that the potential to achieve a lower tax rate may be encouraging the pattern of misalignment identified, or if the distribution of misalignment is essentially arbitrary and therefore unlikely to be tax-motivated. The Tax Justice Network’s approach is to focus on profit shifting only where the effective tax rate is below 15%. For Philips, the unweighted average effective tax rate for the period across all jurisdictions where positive average profits are declared is 35%. One jurisdiction alone—the Netherlands—accounts for a profit misalignment which is larger than Philips’ entire group net profit (The Philips group reports very large losses in the US because of fines imposed for corporate malfeasance [55]. It also reports significant average losses in some other jurisdictions, such as the UK. These reduce the net profit of the group to the point that the Netherlands alone accounts for more profit than the group declares in net total.). The Netherlands has an effective tax rate of 13%, which is consistent with a tax motivation for the identified misalignment, but it is perhaps also evidence that Philips is less aggressive than some multinationals in its pursuit of low taxation. For example, many US multinationals in the tech sector have achieved effective tax rates below 10% in recent years [52].
This research underscores the need to continue exploring different forms of taxation of multinational groups, especially unitary taxation with formulary apportionment. Under this system, corporations report profits and losses at the group level, and profits are then allocated to countries based on economic activity, allowing national governments to levy tax on realistic corporate income that has not been eroded by profit shifting [13,56,57]. This system requires determining how to allocate profit fairly and taxing rights between countries on the basis of the location of corporations’ real economic activity, which is under negotiation at the UN in the draft convention text as Article 4 [58]. This is not a new way of taxing; many states in the United States use a form of unitary tax to prevent state-to-state profit shifting and primarily allocate profits based on sales, while the EU considered, but withdrew, the common consolidated corporate tax base (CCCTB) including a proposal that calculated a member state’s share of profits based on an equally weighted formular of final sales destination, fixed tangible assets, and labour (comprising payroll and number of employees) [59].
More recently, the OECD, in its reforms to tax the digital economy, has adopted unitary taxation, allocating profits based on sales volume, albeit only for 100 of the largest and most profitable multinational corporations under Amount A Pillar One, and only a share of their profits. However, under US pressure, the OECD secretariat redrafted the multilateral convention needed to implement Pillar One such that no country could implement it if the US did not ratify the convention (to which the US administration and Congress are explicitly opposed); while the proposal had in any case been so curtailed in ambition that unilateral digital services taxes were likely to generate more for lower-income nations [60,61]. In part, as explained earlier, this motivated African countries to shift international tax reform negotiations to the UN, where the structure, forum, and rules allow member countries to negotiate democratically, transparently, and with greater inclusivity than at the OECD [62]. With the US withdrawal from negotiations, the door is open for countries to consider unitary taxation, but this remains politically complicated by the aggressive opposition of the US administration to any taxation of US multinationals on their overseas activities [52].
Our analysis aligns with previous research demonstrating that corporate income tax contributes to SDG progress [14,16] and underscores the importance of public country-by-country reporting, as set out in GRI 207: 2019 Tax. The results add support to calls for global unitary taxation and formulary apportionment. In the meantime, corporations could calculate and publish a unitary-style view of where they should pay tax to highlight their transparency. Still, such disclosures would be voluntary and would not replace the legally enforceable amounts they must pay under each national tax regime in which they operate. Absent this, the Fair Tax Mark is a voluntary standard of responsible tax conduct, in which corporations commit to following both the spirit and the letter of the law, to shunning tax avoidance, including the artificial use of tax havens and to being transparent about profits and taxes. Presently, over 270 businesses from 100 parent entities have been accredited by the Fair Tax Foundation [63].
7. Conclusions
Multinational corporations, such as Philips, which disclose revenue, profits before tax, employee numbers, tangible assets, and taxes paid on a country-by-country basis, provide many of the essential inputs for implementing unitary taxation. Public country-by-country reports enable the transparent assessment of corporate contributions to government revenue and sustainable development. However, transparency alone is not enough. An international tax system that aligns taxes with real economic activity, through unitary taxation with formulary apportionment, would significantly strengthen domestic resource mobilisation and accelerate progress toward the SDGs. This approach would curb profit shifting, enhance fairness in global tax allocation, and deliver transformative benefits for countries with the greatest development needs, as our paper shows.
Industry-wide comparative analysis of profit misalignment will be possible in future once there is a critical mass of public country-by-country data available in the European Union and Australia. Although this will be more limited than reports published under the Global Reporting Initiative, such as by Philips, it presents an opportunity for future research to better understand the extent of profit misalignment and the corporations and countries most responsible for undermining government revenue collection and, therefore, development worldwide.
Author Contributions
Conceptualisation, B.O. and R.E.-P.; methodology, A.C., S.H., B.O., R.E.-P. and B.H.; validation, B.O. and R.E.-P.; formal analysis, B.O., R.E.-P. and B.H.; investigation, S.H., B.O., R.E.-P. and B.H.; resources, B.O.; data curation, B.H., B.O. and R.E.-P.; writing—original draft preparation, B.H. and B.O.; writing—review and editing, R.E.-P., A.C., S.H. and E.H.; supervision, S.H. and B.O.; project administration, B.O.; funding acquisition, B.O. All authors have read and agreed to the published version of the manuscript.
Funding
The Scottish Funding Council and the MRC Impact Acceleration Award at the University of St Andrews, Scotland (MR/X502716/1 Harmonised IAA) and the Professor Sonia Buist Global Child Health Research Fund funded this research.
Institutional Review Board Statement
Not applicable.
Informed Consent Statement
Not applicable.
Data Availability Statement
The research data underpinning this publication can be accessed at https://doi.org/10.17630/402ccb3e-00d5-4c4d-aa1b-c8fe4523c1e6 [64].
Acknowledgments
Stuart Murray (SM) for creating the online tool (visualisations) based on the underpinning GRADE models, and Alison Schultz for her meticulous review.
Conflicts of Interest
The authors declare no conflict of interest. The funders had no role in the study design; collection, analyses, or interpretation of data; writing of the manuscript; or decision to publish the results.
References
- United Nations THE 17 GOALS | Sustainable Development Goals. Available online: https://sdgs.un.org/goals (accessed on 29 June 2021).
- United Nations General Assembly. Transforming Our World: The 2030 Agenda for Sustainable Development; Resolution Adopted by the General Assembly on 25 September 2015 (A/RES/70/1); United Nations General Assembly: New York, NY, USA, 2015. [Google Scholar]
- United Nations, Inter-Agency Task Force on Financing for Development. Financing for Sustainable Development Report 2024: Financing for Development at a Crossroads; United Nations: New York, NY, USA, 2024. [Google Scholar]
- Griffiths, J. Financing the Sustainable Development Goals (SDGs). Development 2018, 61, 62–67. [Google Scholar] [CrossRef] [Scilit]
- UNU-WIDER. Government Revenue Dataset, Version 2023; United Nations University: Helsinki, Finland, 2023. [Google Scholar] [CrossRef] [Scilit]
- Prichard, W.; Cobham, A.; Goodall, A. The ICTD Government Revenue Dataset; ICTD Working Paper; International Centre for Tax and Development: Brighton, UK, 2014; pp. 1–7. [Google Scholar] [CrossRef] [Scilit]
- Moore, M.; Prichard, W.; Fjeldstad, O.-H.; Honwana, A.; Institute, I.A.; Society, R.A.; Foundation, W.P.; de Waal, A.; Dowden, R.; Kitchen, S. Taxing Africa: Coercion, Reform and Development; Zed Books: London, UK, 2018; ISBN 978-1-78360-454-8. [Google Scholar]
- Cobham, A.; Janský, P. Global Distribution of Revenue Loss from Corporate Tax Avoidance: Re-Estimation and Country Results. J. Int. Dev. 2018, 232, 206–232. [Google Scholar] [CrossRef] [Scilit]
- African Union; ATAF; OECD. Development Centre Revenue Statistics in Africa. 2023. Available online: https://www.oecd.org/en/publications/revenue-statistics-in-africa-2023_15bc5bc6-en-fr.html (accessed on 25 October 2024).
- OECD. Corporate Tax Statistics 2024; Organisation for Economic Co-Operation and Development: Paris, France, 2024. [Google Scholar]
- Tax Justice Network State of Tax Justice. 2024. Available online: https://taxjustice.net/wp-content/uploads/2024/11/State-of-Tax-Justice-2024-English-Tax-Justice-Network.pdf (accessed on 19 November 2024).
- Cobham, A.; Etter-Phoya, R.; Harari, M.; Lorenzo, F.; Mager, F. Tax Policies for Development. In The Palgrave Handbook of Development Finance; Palgrave Macmillan: Cham, Switzerland, 2025; pp. 103–121. ISBN 978-3-031-77422-5. [Google Scholar]
- Picciotto, S.; Kadet, J.M. The Transition to Unitary Taxation. Tax Notes Int. 2022, 108, 453. [Google Scholar]
- Halim, M.A.; Rahman, M.M. The Effect of Taxation on Sustainable Development Goals: Evidence from Emerging Countries. Heliyon 2022, 8, e10512. [Google Scholar] [CrossRef] [Scilit] [PubMed]
- Ajeigbe, K.B.; Ganda, F.; Enowkenwa, R.O. Impact of Sustainable Tax Revenue and Expenditure on the Achievement of Sustainable Development Goals in Some Selected African Countries. Environ. Dev. Sustain. 2024, 26, 26287–26311. [Google Scholar] [CrossRef] [Scilit]
- Rahman, M.M. Impact of Taxes on the 2030 Agenda for Sustainable Development: Evidence from Organization for Economic Co-Operation and Development (OECD) Countries. Reg. Sustain. 2023, 4, 235–248. [Google Scholar] [CrossRef] [Scilit]
- Garcia-Bernardo, J.; Janský, P. Profit Shifting of Multinational Corporations Worldwide. World Dev. 2024, 177, 106527. [Google Scholar] [CrossRef] [Scilit]
- Masiya, M.; Hall, S.; Murray, S.; Etter-Phoya, R.; Hannah, E.; O’Hare, B. Tax Expenditures and Progress to the Sustainable Development Goals. Sustain. Dev. 2024, 32, 6144–6162. [Google Scholar] [CrossRef] [Scilit]
- De Simone, L.; Stomberg, B.; Williams, B. Does Tax Enforcement Disparately Affect Domestic versus Multinational Corporations around the World? Contemp. Account. Res. 2023, 40, 2816–2845. [Google Scholar] [CrossRef] [Scilit]
- O’Hare, B.A.M.; Lopez, M.J.; Mazimbe, B.; Murray, S.; Spencer, N.; Torrie, C.; Hall, S. Tax Abuse—The Potential for the Sustainable Development Goals. PLoS Glob. Public Health 2022, 2, e0000119. [Google Scholar] [CrossRef] [Scilit] [PubMed]
- Etter-Phoya, R.; Manthalu, C.; Kalizinje, F.; Chigaru, F.; Mazimbe, B.; Phiri, A.; Chimowa, T.; Ligomeka, W.; Hall, S.; O’Hare, B. Financing Child Rights in Malawi. BMC Public Health 2023, 23, 2255. [Google Scholar] [CrossRef] [Scilit] [PubMed]
- Crivelli, E.; De Mooij, R.; Keen, M. Base Erosion, Profit Shifting and Developing Countries. Finanz./Public Financ. Anal. 2016, 72, 268–301. [Google Scholar] [CrossRef] [Scilit]
- Alstadsæter, A.; Godar, S.; Nicolaides, P.; Zucman, G. Global Tax Evasion Report 2024; EU Tax Observatory: Paris, France, 2023. [Google Scholar]
- UN Stats SDG Indicator Metadata. Available online: https://unstats.un.org/sdgs/metadata/files/Metadata-16-04-01.pdf (accessed on 10 June 2024).
- Eang, M.; Clarke, A.; Ordonez-Ponce, E. The Roles of Multinational Enterprises in Implementing the United Nations Sustainable Development Goals at the Local Level. BRQ Bus. Res. Q. 2023, 26, 79–97. [Google Scholar] [CrossRef] [Scilit]
- Narula, R.; Pineli, A. Improving the Developmental Impact of Multinational Enterprises: Policy and Research Challenges. J. Ind. Bus. Econ. 2019, 46, 1–24. [Google Scholar] [CrossRef] [Scilit]
- Awuah, B.; Yazdifar, H.; Elbardan, H. Corporate Reporting on the Sustainable Development Goals: A Structured Literature Review and Research Agenda. J. Account. Organ. Change 2023, 20, 617–646. [Google Scholar] [CrossRef] [Scilit]
- Chaim, D.A.; Parchomovsky, G. The Missing “T” in ESG. Vanderbilt Law Rev. 2024, 77, 789–843. Available online: https://scholarship.law.vanderbilt.edu/vlr/vol77/iss3/3 (accessed on 20 April 2025).
- GRI-Topic Standard for Tax. Available online: https://www.globalreporting.org/standards/standards-development/topic-standard-for-tax/ (accessed on 25 October 2024).
- Stichting Global Reporting Initiative. Global Adoption Trends for the GRI Tax Standard: An Analysis of the Use of GRI 207: Tax 2019 by the 1000 Largest Public Companies Worldwide; Stichting Global Reporting Initiative: Amsterdam, The Netherlands, 2024. [Google Scholar]
- Philips Annual Report 2024: Impact with Care. Available online: https://www.results.philips.com/app/uploads/2026/04/PhilipsFullAnnualReport2024-English.pdf (accessed on 10 November 2025).
- Philips 2024 Country Activity and Tax Report. Available online: https://www.results.philips.com/app/uploads/2026/04/PhilipsCountryActivityAndTaxReport2024.pdf (accessed on 22 April 2025).
- Philips 2020 Country Activity and Tax Report. Available online: https://www.results.philips.com/app/uploads/2026/04/PhilipsCountryActivityAndTaxReport2020.pdf (accessed on 22 April 2025).
- A Material Concern: The Investor Case for Public Country-by-Country Tax Reporting. Available online: https://thefactcoalition.org/report/a-material-concern-the-investor-case-for-public-country-by-country-tax-reporting/ (accessed on 25 October 2024).
- Hannah, E.; O’Hare, B.; Lopez, M.; Murray, S.; Etter-Phoya, R.; Hall, S.; Masiya, M. How Can Corporate Taxes Contribute to Sub-Saharan Africa’s Sustainable Development Goals (SDGs)? A Case Study of Vodafone. Glob. Health 2023, 19, 17. [Google Scholar] [CrossRef] [Scilit]
- Philips 2023 Country Activity and Tax Report. Available online: https://www.results.philips.com/app/uploads/2026/04/PhilipsCountryActivityAndTaxReport2023.pdf (accessed on 22 April 2025).
- Philips 2022 Country Activity and Tax Report. Available online: https://www.results.philips.com/app/uploads/2026/04/PhilipsCountryActivityAndTaxReport2022.pdf (accessed on 22 April 2025).
- Philips 2021 Country Activity and Tax Report. Available online: https://www.results.philips.com/app/uploads/2026/04/PhilipsCountryActivityAndTaxReport2021.pdf (accessed on 22 April 2025).
- Tørsløv, T.; Wier, L.; Zucman, G. The Missing Profits of Nations. Rev. Econ. Stud. 2023, 90, 1499–1534. [Google Scholar] [CrossRef] [Scilit]
- Tax Justice Network Methodological Note: State of Tax Justice 2023. Available online: https://taxjustice.net/wp-content/uploads/2023/08/State-of-Tax-Justice-2023-methodology-Tax-Justice-Network.pdf (accessed on 17 March 2026).
- Cobham, A.; Garcıa, M.C.; Palansky, M.; Schultz, A. State of Tax Justice 2024: Methodological Note on Estimating the Scale of Corporate Tax Abuse. Available online: https://taxjustice.net/wp-content/uploads/2024/11/sotj2024_methodology_corporateTaxAbuse.pdf (accessed on 23 July 2025).
- Kaufmann, D.; Kraay, A.C. The Worldwide Governance Indicators: Methodology and 2024 Update; Policy Research Working Paper Series; The World Bank: Washington, DC, USA, 2024. [Google Scholar]
- World Bank. World Development Indicators [Database]. The World Bank Group. Available online: https://databank.worldbank.org/source/world-development-indicators (accessed on 13 June 2024).
- Dharamshi, A.; Barakat, B.; Alkema, L.; Antoninis, M. A Bayesian Model for Estimating Sustainable Development Goal Indicator 4.1.2: School Completion Rates. J. R. Stat. Soc. Ser. C Appl. Stat. 2022, 71, 1822–1864. [Google Scholar] [CrossRef] [Scilit]
- Hall, S.G.; O’Hare, B.; Hall, S.G.; O’Hare, B. A Model of the Impact of Government Revenue and Quality of Governance on the Pupil/Teacher Ratio for Every Country in the World. Econometrics 2025, 13, 46. [Google Scholar] [CrossRef] [Scilit]
- Hall, S.G.; O’Hare, B. A Model of the Impact of Government Revenue and Quality of Governance on Schooling. Int. J. Educ. Dev. 2024, 108, 103055. [Google Scholar] [CrossRef] [Scilit]
- O’Hare, B.; Hall, S.; Murray, S. Government Revenue and Development Estimations (GRADE) User Guide; Version 3.22.1; Updated January 2026; University of St Andrews: St Andrews, UK, 2026. [Google Scholar]
- O’Hare, B.; Hall, S.G. The Impact of Government Revenue on the Achievement of the Sustainable Development Goals and the Amplification Potential of Good Governance. Cent. Eur. J. Econ. Model. Econom. 2022, 14, 109–129. [Google Scholar]
- Hall, S.; O’Hare, B. A Model to Explain the Impact of Government Revenue on the Quality of Governance and the SDGs. Economies 2023, 11, 108. [Google Scholar] [CrossRef] [Scilit]
- Etter-Phoya, R.; Murray, S.; Hall, S.; Masiya, M.; O’Hare, B. Profit Shifting from Nigeria to Europe: The Impact on Human Rights. PLoS Glob. Public Health 2025, 5, e0004218. [Google Scholar] [CrossRef] [Scilit] [PubMed]
- Wier, L.S.; Zucman, G. Global Profit Shifting, 1975–2019; National Bureau of Economic Research: Cambridge, MA, USA, 2022. [Google Scholar] [CrossRef] [Scilit]
- Tax Justice Network State of Tax Justice 2025. Available online: https://taxjustice.net/wp-content/uploads/2025/11/State-of-Tax-Justice-2025-report-Tax-Justice-Network.pdf (accessed on 20 January 2026).
- Celebi, H. The CCCTB as a Proposed Solution to the Corporate Income Taxation Dilemma within the EU. EC Tax Rev. 2013, 22, 289–298. [Google Scholar] [CrossRef] [Scilit]
- Cobham, A.; Loretz, S. International Distribution of the Corporate Tax Base: Implications of Different Apportionment Factors Under Unitary Taxation; ICTD Working Paper; International Centre for Tax and Development: Brighton, UK, 2014. [Google Scholar] [CrossRef] [Scilit]
- U.S. Securities and Exchange Commission. Dutch Medical Supplier Philips to Pay More than $62 Million to Settle FCPA Charges. 2023. Available online: https://www.sec.gov/newsroom/press-releases/2023-92 (accessed on 8 May 2026).
- Avi-Yonah, R.S. A Proposal for Unitary Taxation and Formulary Apportionment (UT+FA) to Tax Multinational Enterprises. In Global Tax Governance: What Is Wrong with It and How to Fix It; ECPR Press: Colchester, UK, 2016; pp. 289–306. [Google Scholar]
- Clausing, K.A. Lessons for International Tax Reform from the US State Experience under Formulary Apportionment. In Taxing Multinational Enterprises as Unitary Firms; International Centre for Tax and Development: Brighton, UK, 2017. [Google Scholar]
- Intergovernmental Negotiating Committee on the United Nations. Framework Convention on International Tax Cooperation A_AC.298_CRP.21_WSI Co-Lead’s Draft Framework Convention Template 24 Oct 2025. 2025. Available online: https://financing.desa.un.org/sites/default/files/2025-11/A_AC.298_CRP.21_WSI%20Co-Lead%E2%80%99s%20Draft%20Framework%20Convention%20Template%2024Oct%202025.pdf (accessed on 10 November 2025).
- European Parliament Common Consolidated Corporate Tax Base (CCCTB) | Legislative Train Schedule. Available online: https://www.europarl.europa.eu/legislative-train/package-action-plan-on-corporate-taxation/file-common-consolidated-corporate-tax-base-(ccctb) (accessed on 19 December 2025).
- Picciotto, S. Reflections on Theory and Practice. Financ. Dev. 2024, 1, 61–72. [Google Scholar]
- Barake, M.; Le Pouhaër, E. Tax Revenue from Pillar One Amount A: Country-by-Country Estimates. Int. Tax Public Financ. 2025, 32, 680–740. [Google Scholar] [CrossRef] [Scilit]
- Christensen, R.; Hearson, M.; Randriamanalina, T. At the Table, Off the Menu? Assessing the Participation of Lower-Income Countries in Global Tax Negotiations; International Centre for Tax and Development: Brighton, UK, 2020. [Google Scholar]
- Fair Tax Foundation. Global Multinational Business Standard: Guidance Notes; Fair Tax Foundation: Manchester, UK, 2021. [Google Scholar]
- Etter-Phoya, R.; O’Hare, B.; Harsanyi, B.; Hall, S.; Hannah, E.; Cobham, A. How Corporate Tax Supports Human Development and the Cost of Profit Misalignment; University of St Andrews: St Andrews, UK, 2026. [Google Scholar]

Disclaimer/Publisher’s Note: The statements, opinions and data contained in all publications are solely those of the individual author(s) and contributor(s) and not of MDPI and/or the editor(s). MDPI and/or the editor(s) disclaim responsibility for any injury to people or property resulting from any ideas, methods, instructions or products referred to in the content. |
© 2026 by the authors. Licensee MDPI, Basel, Switzerland. This article is an open access article distributed under the terms and conditions of the Creative Commons Attribution (CC BY) license.