


Abstract
As modern life accelerates, demand for housekeeping services is rising. However, safety concerns deter potential users, causing a persistent imbalance that poses significant challenges to social sustainability. This research aims to design a home service system that is not only operationally efficient but also socially and economically sustainable. Using a user behavior analysis method, this study investigated the safety and hygiene needs of potential users. From a user-centered design perspective, an innovative housekeeping service system, along with its key service touchpoints: a mobile application and smart products. The system’s design is underpinned by the “Internet+” and Online-to-Offline (O2O) business models, integrating service design and sustainability principles. We present key system architecture and technologies, along with an analysis of implementation challenges. The findings suggest that the proposed system can enhance resource efficiency and economic viability (e.g., reduce operational costs by an estimated 15–25% compared with traditional models); improve user well-being and social equity (e.g., increase user trust by 15–20% through integrated credibility mechanisms and reduce household labor hours by approximately 4–6 h per week through optimized scheduling); and offer a replicable design framework for promoting sustainable service-sector development. Provide a scalable platform for the housekeeping industry’s sustainable transition. This research contributes a design paradigm for service systems that aligns business viability with Sustainable Development Goals (SDGs), particularly SDG 3 (Good Health and Well-being), SDG 5 (Gender Equality), and SDG 8 (Decent Work and Economic Growth), by fostering trust, efficiency, and responsible consumption.
1. Introduction
As a critical component of the modern service industry, services play an increasingly vital role in improving household quality of life, liberating labor resources, and promoting employment [1,2]. With the acceleration of global population aging, rising female labor force participation, and the faster pace of urban life, the demand for professional services has been steadily increasing. In developed countries, such as those in Europe and the United States, as well as Japan, the service industry started early and has established well-developed education and training systems, industry standards, and service norms [3,4,5]. For example, the United Kingdom, the United States, and Japan have set up specialized science disciplines and vocational training programs, where practitioners generally receive high-level professional education, and service contents cover a wide range of areas, including household chore management, first aid, fire safety, and tutoring. In terms of service models, these countries commonly adopt agency-based appointment systems with in-person interviews for staff selection, and are gradually transitioning to online, telephone, and mobile-based booking. Overall, these systems place great emphasis on user experience and human-centered service processes [1,6]. Notably, because of the relatively mature infrastructure of the service industry in these countries and the high public acceptance of such services, some enterprises maintained operations quickly through measures such as online booking and contactless service delivery.
In contrast, the service industry in China started later but has grown extremely rapidly. Since the rise of the Internet Online-To-Offline (O2O) business model in 2013, the service industry has gradually integrated with digital technologies, and modern service models have gained increasing public recognition [2,7]. According to the China Service Industry High-Quality Development Index Report (2022) released by the Chinese Academy of Labour and Social Security, the scale of China’s service industry has continuously expanded since 2015, with an average annual growth rate exceeding 20%, and a year-on-year growth of nearly 30% in 2020 [8,9,10]. A complete industrial chain covering “service providers—enterprises/platforms—household consumers” has initially taken shape [7].
At the technological level, comparative case studies reveal significant institutional divergence between Chinese and U.S. O2O platforms. This study’s comparative analysis of Meituan and Uber Eats demonstrates that Chinese platforms tend to adopt a “platform-governance-oriented” collaborative integration model through mechanisms such as order task packages and merchant growth systems, whereas U.S. platforms rely more on “market-rule-dominated” decentralized strategies with distributed commission structures and crowdsourced delivery models [11]. In trust mechanism design, Zhao proposed a consortium blockchain-based housekeeping service platform that leverages decentralization and tamper-proof features to ensure service transparency and security [12]. In service touchpoint product design, NIST surveys reveal that U.S. smart home users’ security and privacy perceptions vary significantly across device categories [13]; Chinese platforms such as Wowojia have achieved full-service online integration, including e-contracts, real-time transactions, and process tracking. In post-pandemic risk response, the global hyperlocal housekeeping market has accelerated growth; UAE-based Justlife has completed over 15 million bookings by embedding reliability into its business model. In sustainable operation models, the global online on-demand housekeeping market is projected to grow from USD 170.1 billion in 2024 to USD 442.7 billion by 2032. These comparisons indicate that while structural differences exist across dimensions, no existing system has fully solved the systemic trust reconstruction challenge in the post-pandemic era.
Globally, trust reconstruction in door-to-door services has become a shared concern for both academia and industry. In the academic domain, research on the dynamic mechanisms of customer trust in O2O contexts reveals that the virtuality of networks and the experiential nature of services make trust establishment and maintenance critical for service providers [14]. NIST’s survey of 401 U.S. smart home users revealed that security and privacy perceptions vary by device category [13]. In industrial practice, the UAE’s Justlife has embedded reliability into its business model; U.S.-based Molly Maid has initiated a “trust economy” strategic transformation; India’s KaamGenie requires uniformed staff with verified identification. In China, Qingxi Daijia adopts an employee-based model with professional training schools; Yixing Yaru Housekeeping implements strict background checks and skill assessments; Wowojia has achieved full-service online traceability. These practices indicate that trust reconstruction strategies primarily operate along three dimensions—institutional (employee-based models), technological (blockchain, traceability), and service design (standardization, transparency)—but systematic integration of all three within a comprehensive service design framework remains limited.
From the perspective of market structure, traditional simple-labor services still account for a relatively high share (about half of the market), but knowledge- and skill-based services have exhibited the fastest growth. In 2020, the market size reached CNY 878.2 billion, and it is estimated that the number of service practitioners in China will reach 62.48 million by 2025 and 138.89 million by 2035, with the market size exceeding CNY 1.4 trillion by 2025 [15,16]. In this process, Chinese scholars and enterprises have actively explored service design. Taking companies such as Haokao Zaijia (Good Maid at Home) as examples, researchers have used methods such as user journey mapping, focus group interviews, big data profiling, and service touchpoint analysis (e.g., developing specialized toolkits that combine safety, hygiene, and storage functions) to integrate the experience of the three stakeholders—merchants, workers, and users—and to improve service processes through mobile application interface optimization.
Recent years have witnessed high-quality interdisciplinary publications in the domain of “housekeeping services + IoT + sustainable design + trust mechanisms.” A structural equation modeling study published in Sustainable Futures (2025) explored IoT adoption in residential smart buildings, finding that performance expectancy is the strongest driver while security and privacy risks have significant negative effects [12,13]. An IEEE Access (2026) review traced the shift from environment-centric to occupant-centric building operations and discussed how Web3 concepts support decentralized data management and long-term trust building [17,18]. Al-Shaar et al. provided a systematic literature review of AI-assisted systems for environmental sustainability in smart homes [19]. Almeida et al. examined the alignment between smart home technology attributes and user preferences, identifying trust and ethical responsibility as key themes [19]. These studies demonstrate that the interdisciplinary field is rapidly evolving, yet systematic integration of all four dimensions within the housekeeping service context remains scarce.
However, despite the remarkable growth in scale, China’s service industry still faces a series of urgent challenges that may undermine the nation’s progress toward the UN Sustainable Development Goals (SDGs), particularly Goal 3 (Good Health and Well-being) and Goal 8 (Decent Work and Economic Growth). First, the quantity, quality, and actual experience of service supply cannot quickly meet the rising demands of consumers [20,21]. Second, the outbreak of the pandemic has severely impacted the service industry, whose core model relies on home-based and live-in services. Due to the primary transmission route of the virus (respiratory droplets), the wide-range lockdown and quarantine measures adopted hindered the operation of door-to-door services, leading to user fear, bankruptcy of numerous small enterprises, and a serious loss of professional workforce. More importantly, after the pandemic, public attitudes towards services have shifted from general acceptance to concern and suspicion. Although the rigid supply–demand relationship persists, the crisis of trust hinders industry recovery. Relatively mature service systems in foreign countries have demonstrated greater resilience during the pandemic. In contrast, research in China has mainly focused on service efficiency and business model optimization under normal conditions. There is a lack of sufficient research and practical solutions that systematically address how to rebuild user trust, eliminate safety concerns about door-to-door services, and integrate online platforms with offline service touchpoints through service design in the post-pandemic era.
Synthesizing the above literature, five major limitations and unresolved scientific problems emerge: (1) theoretically, most studies focus on single dimensions of housekeeping services (e.g., platform efficiency, user satisfaction, or trust mechanisms) without an integrated framework combining trust mechanisms, IoT technology, sustainable design, and service systems; (2) methodologically, the majority employ descriptive statistics or single-case analyses lacking mixed-method designs; (3) technologically, IoT applications in housekeeping service scenarios remain extremely limited, with most smart home research focusing on energy management rather than in-home safety and hygiene assurance; (4) practically, the post-pandemic trust crisis in door-to-door services has received insufficient academic attention, with most studies still grounded in normal operational scenarios; (5) evaluatively, existing research lacks quantitative assessment frameworks for service system sustainability, with key metrics such as operational cost reduction and trust improvement lacking verifiable calculation methods. These limitations demonstrate that designing a housekeeping service system that systematically integrates trust mechanisms, IoT technology, sustainability principles, and service design with quantifiable evaluation frameworks constitutes a research topic of significant academic value and practical importance.
Therefore, to address the above issues, this study focuses on sustainable service design in the post-pandemic era and aims to develop a service system that meets the needs of the post-pandemic context while contributing to a more resilient and sustainable society. This solution is expected to eliminate users’ concerns, enhance service quality and user experience, and offer a replicable design framework for promoting sustainable consumption and service-sector resilience in line with the 2030 Agenda for Sustainable Development.
2. User Persona Construction
In the design of product-service systems, a user-centered design approach is predominantly adopted, making user analysis a critical task in the overall service system design. Through questionnaire surveys and in-depth interviews with target user groups who have potential demands for services, a substantial understanding, analysis, and synthesis of users’ basic characteristics and behavioral needs was obtained. Consequently, user personas were developed to facilitate accurate organization of questionnaire data and summarization of key insights from interviews, thereby supporting subsequent service system design and the development of service touchpoint products.
To ensure methodological transparency, this study adopted a mixed-method design combining a questionnaire survey with semi-structured interviews. The online questionnaire was distributed through a domestic service platform’s user panel, targeting urban adults with potential interest in housekeeping services. A total of 412 valid responses were collected (response rate: 78.3%), with participants aged 20–58 years (mean = 34.6). The survey covered demographics, past service usage, booking preferences, and safety/disinfection concerns. For qualitative insights, seven respondents were purposively selected from the survey pool (five) and from additional users with distinct needs (two) for in-depth interviews (ages 22–50, diverse occupations and service frequencies). Each interview lasted about 15 min, following a pre-designed outline on behavioral patterns, pandemic-related worries, and storage expectations, and was audio-recorded with consent. All transcripts were analyzed using thematic analysis, with recurring codes grouped into major themes (e.g., safety anxiety, demand for visible professionalism, and need for smart storage) that directly informed the user personas, service touchpoints, and system design presented below.
Based on the analysis of the target user groups, it was found that potential users of service platforms are generally aged between 30 and 50 years, have above-average income levels, and pursue a high quality of life. The key requirements for the design of service systems include safety and prevention measures in the post-pandemic era, the knowledge intensity and professionalism of the services, as well as the quality and intelligence of product usage [21]. Moreover, the demand for online services is increasing in daily life, and the aesthetic quality of the user interface, along with the completeness of user flows and overall experience, has become a significant user need. Furthermore, higher standards are expected for touchpoint products compared with current offerings. In the context of storage box requirements, considerations should be based on five dimensions: comprehensive visualizability, spatial capacity, cleanliness and tidiness, intelligent reminders, and attribute-specific needs, thereby guiding the design of subsequent functional products.
To quantitatively validate the five storage requirements identified from the qualitative analysis, we calculated the mean scores and standard deviations for each dimension based on the 412 valid questionnaire responses. The results show that “cleanliness and tidiness” received the highest mean score (M = 4.52, SD = 0.68), followed by “comprehensive visualizability” (M = 4.38, SD = 0.72), “intelligent reminders” (M = 4.21, SD = 0.81), “spatial capacity” (M = 4.15, SD = 0.79), and “attribute-specific needs” (M = 3.96, SD = 0.85). These rankings confirm that users prioritize hygiene transparency and tool organization over mere storage space. We further conducted independent-sample t-tests to compare requirements between younger (30–40 years, n = 218) and older (40–50 years, n = 194) user groups. Significant differences were observed for “intelligent reminders” (t = 2.87, p = 0.005), with younger users rating this feature significantly higher (Myounger = 4.38 vs. Molder = 4.02). No significant age-based differences were found for the other four dimensions (p > 0.05). Similarly, we compared high-income (monthly household income > CNY 20,000, n = 157) and middle-income (CNY 10,000–20,000, n = 189) user groups. Results reveal that higher-income users placed significantly greater emphasis on “comprehensive visualizability” (t = 2.45, p = 0.015; Mhigh = 4.56 vs. Mmiddle = 4.22) and “cleanliness and tidiness” (t = 2.12, p = 0.034; Mhigh = 4.67 vs. Mmiddle = 4.38), suggesting that users with higher disposable income demand more sophisticated and transparent tool organization solutions.
To clarify the alignment between our system design and the three identified SDGs: For SDG 3 (Good Health and Well-being), the UV-C LED disinfection module (≥99.99% sterilization rate, third-party validated) eliminates pathogens from tools before each session; the dual-factor identity verification (QR code with OAuth 2.0, 120 s validity; TOTP dynamic codes, 60 s validity, 3-attempt lockout) prevents unauthorized home entry; and the three-stage photographic traceability (pre-service baseline, during-service milestones, post-service AI-assisted comparison) enables rapid anomaly detection and rectification, collectively protecting health for both users and workers. For SDG 5 (Gender Equality), the optimized service model facilitates female employment through flexible scheduling, fair compensation, formal employment contracts, and gender-blind algorithmic assignment; additionally, by saving families 4–6 h of household labor per week—tasks disproportionately performed by women globally—the system significantly reduces the unpaid care burden. For SDG 8 (Decent Work and Economic Growth), the employee-based management model provides formal contracts, minimum wage guarantees, social insurance, and a transparent two-tier appeal process for labor rights protection, while the scalable cloud platform lowers digital transformation barriers for small agencies, fostering inclusive industry growth.
3. Systematic Architecture and Ecological Collaborative Construction of the Service Value Network
3.1. Information Architecture of the Product-Service System
Based on the four-tier architecture of the Internet of Things (IoT), the system architecture of the service system is shown in Figure 1. It is mainly divided into the perception layer, network layer, platform layer, and application layer. The four layers collaborate with each other to provide users with a satisfactory service experience while supporting the operation, maintenance, and supervision of relevant management and technical departments.
Figure 1.
Information architecture of the service system.
The perception layer is primarily responsible for identifying, sensing, and collecting real-world information, serving as a crucial bridge between the physical and virtual worlds. At this layer, mobile terminals and the GPS positioning systems of intelligent storage products enable effective data upload to the platform, including user location, perception of stored items, and intelligent identification.
At the network layer, information is transmitted via wireless and wired networks, enabling interconnection and coordinated operation among intelligent storage products, the management platform, and the service platform. The platform layer consists of a business center, a device center, and a cloud database. Through storage information management, data analysis, and operation and maintenance, this layer provides support for the mobile terminals and intelligent storage products at the application layer, thereby facilitating service delivery and management.
To transform the above conceptual architecture into an implementable technical solution, this study defines specific technical specifications for each of the four layers. At the perception layer, the smart storage case is equipped with a GPS/BeiDou dual-mode positioning module (cold start ≤ 40 s, hot start ≤ 3 s, positioning accuracy 5–10 m in open environments). Data acquisition adopts a multi-sensor fusion scheme, including weight sensors (range 0–50 kg, accuracy ±0.5%FS), infrared sensors (detection distance 0–10 cm), and temperature/humidity sensors (accuracy ±0.3 °C/±2%RH), with a collection frequency set at 15 s intervals to balance real-time performance and power consumption. At the network layer, the system employs an adaptive communication strategy: Wi-Fi (IEEE 802.11 b/g/n, 2.4 GHz band) is prioritized in indoor environments to reduce operational costs; when Wi-Fi is unavailable, the system automatically switches to 4G LTE Cat.1 or 5G NR cellular networks. MQTT (Message Queuing Telemetry Transport) is adopted as the application-layer protocol for lightweight data publish/subscribe, ensuring transmission efficiency and stability. At the platform layer, the cloud database adopts a hybrid storage architecture: time-series data (e.g., device status, location trajectories) are stored in InfluxDB, while user configurations and service records are stored in PostgreSQL. Data is forwarded from the IoT platform rule engine to the cloud RDS instance. Device maintenance logic is implemented through a rule engine, including offline alerts (triggered after 5 min of disconnection), abnormal location alarms, and low-battery warnings (notification pushed when battery < 20%). For security, end-to-end data transmission is encrypted using TLS 1.2 or above; AES-256 symmetric encryption is employed between perception-layer devices and the platform to ensure data confidentiality; and role-based access control (RBAC) is implemented at the platform layer, with strict separation of user and service worker permissions.
3.2. Stakeholder Analysis
In the design of the service process for services, a user-centered approach is adopted. Core stakeholders can be primarily categorized into service workers, operating companies, third-party payment platforms, after-service personnel, and customer service representatives [22]. Secondary stakeholders can be categorized into maintenance personnel, government and other supervisory agencies, equipment suppliers, advertising providers, technology developers, designers, and other related parties. The stakeholder relationship diagram is shown in Figure 2.
Figure 2.
Stakeholder relationship diagram.
The user is the core consumer of the entire service and bears all service costs. Service workers are the primary providers of the service and key participants, receiving labor income in return. The operating company acts as the bridge and intermediary between users and service workers, serving as a collaborative participant in the service. Service workers belong to the operating company, which disburses their salaries and commissions. Users make service reservations through the operating company, supported by an O2O platform, which significantly influences the entire service process while generating economic benefits for the company. Customer service representatives and after-service personnel are service guarantors, directly interacting with users and jointly ensuring the smooth delivery of the service. The third-party payment platform is an important auxiliary to the entire service, facilitating service transactions through a third party. These stakeholders have the closest relationships throughout the service process and interact with one another; therefore, they are considered core stakeholders [23].
Government and other supervisory agencies provide policy support and regulatory oversight to operating companies or O2O service platforms during service delivery, while also monitoring the service quality of workers and the implementation of epidemic prevention measures. Technology developers, designers, and maintenance personnel are responsible for designing, maintaining, and collecting data on the hardware and software involved in the service to obtain more accurate information.
Equipment suppliers, advertising providers, and other related parties are marginal stakeholders [24]. They do not directly participate in the service process but only assist certain core stakeholders in terms of economic benefits, technical support, and cooperative relationships, having no direct connection with users [25]. These seven stakeholders do not engage in direct transactional contact with users within the overall system nor obtain economic benefits; however, they still influence the service system in aspects such as policies, behaviors, operations, and management. Consequently, they are classified as secondary stakeholders [26].
As shown in Figure 3, all stakeholders are subdivided into three levels according to their functions: the direct level, the indirect level, and the potential level. The direct level primarily comprises closely related core stakeholders, including users, service workers, operating companies/O2O service platforms, customer service representatives, maintenance personnel, and third-party payment platforms. These stakeholders constitute the core content of the service and are direct participants in the service system. The indirect level mainly includes stakeholders who have a strong influence on and play an important role in the service system, such as designers, technology developers, after-service support personnel, and sales promoters. They represent a critical link in providing service support and act as guarantors of the entire service system. The potential level consists of stakeholders who influence the service and can drive its development, including advertising providers, equipment suppliers, user databases, government regulatory departments, and other related parties. They are collaborative and auxiliary potential service factors, serving as facilitators of the overall service system. The direct level and the indirect level jointly ensure the smooth operation of the service system, and neither can be omitted. The potential level complements and promotes the service, and its importance will be upgraded through continuous iteration and evolution in the future.
Figure 3.
Stakeholder analysis diagram.
Beyond the responsibility mapping presented above, it is critical to analyze the inherent conflicts of interest, collaboration barriers, and division of rights and obligations among stakeholders, as these factors directly affect the robustness of the service system.
Three primary conflict types are identified. First, service disputes arise when users and service workers disagree on the quality or scope of work completed. The platform serves as the dispute resolution intermediary, with a documented service protocol and photographic evidence uploaded via the mobile application serving as the primary arbitration references. Second, payment settlement disagreements occur when users contest charges or workers claim incomplete compensation. The third-party payment platform holds funds in escrow until both parties confirm service completion, and the platform’s automated time-tracking system provides objective work-duration records. Third, service quality evaluation discrepancies emerge when user ratings are perceived by workers as unfair. Our system implements a two-tier evaluation appeal process: workers may submit appeals within 48 h of receiving a rating, triggering a review by customer service personnel who examine service records and communication logs; ratings are adjusted only when clear procedural violations by the user are identified.
Regarding rights and obligations, Table 1 summarizes the key entitlements and responsibilities of the three core stakeholders.
Table 1.
Rights and obligations matrix of core stakeholders.
Constraints from secondary stakeholders are equally significant. Regulatory authorities impose compliance requirements, including worker certification standards, data privacy protection (aligned with China’s Personal Information Protection Law), and service contract transparency. Equipment suppliers impose technical constraints: the smart storage case requires certified UV-C LED modules (with a 10,000 h design life) and battery replacement cycles, which impose maintenance schedules and procurement costs on the platform. Failure to satisfy these constraints would result in service suspension, legal penalties, or reputational damage, thereby restricting the platform’s operational autonomy.
The core value proposition of “safety, hygiene, and professionalism” balances the interests of all parties as follows: For users, it directly addresses their post-pandemic safety concerns through traceable disinfection and verified worker identities. For service workers, it elevates their professional status through standardized protocols and specialized equipment, justifying premium pricing and fair compensation. For the platform, it differentiates the service brand, reduces complaint-handling costs, and increases customer lifetime value. Thus, the value proposition is not merely a marketing claim but a mechanism for aligning incentives across stakeholders.
3.3. Service Value Network
Based on the above analysis to critically inform our value network design, we analyze the core strengths, inherent limitations, and applicable scenarios of existing commercial platforms cited earlier. Haokao Zaijia demonstrates strong scalability with over 180 million service hours and 85%+ retention, yet its trust mechanism relies primarily on post-service ratings without real-time process transparency or tool-level hygiene verification. Tian’e Daojia exhibits extensive user reach (22.6 million registered) but lacks physical disinfection assurance and on-site identity verification at service delivery. The Huaibei credit system enables traceable service chains through digital management, yet its “one person, one card, one code” framework operates at the informational level without integrating physical touchpoint products. Synthesizing these insights, our proposed value network differentiates itself through three iterative improvements: (1) physical-layer trust via UV-C disinfection and photographic traceability; (2) on-site identity verification (QR + TOTP) beyond platform-level screening; and (3) hardware-enabled hygiene documentation integrated with the credibility system.
Based on the above analysis of user persona construction, user needs, and stakeholders, a new service value network is constructed centered on the value proposition of “safer, more hygienic, and more professional services,” as shown in Figure 4 below. In this service value network, the user, service worker, and operation management platform are the core stakeholders. Cloud platform data and the equipment maintenance team provide technical support to the entire service system. The intelligent storage product series serves as service touchpoints, facilitating the overall service process and delivering an enhanced user experience.
Figure 4.
Construction of the service value network.
Users can place orders and select services via their mobile phones. The generated orders are transmitted to the operation management platform/O2O service platform. Simultaneously, user preferences, information entries, and other data are recorded in the cloud platform to create a personal cloud database, facilitating future use. The database also analyzes preference data and provides feedback to the O2O service platform. Once an order is created and confirmed, the cloud platform database assigns the order to service workers based on multiple factors such as travel distance and available time slots. After the worker accepts the order and updates information, they provide professional services including cleaning, window washing, childcare, and other specialized tasks. The management platform regularly conducts professional training for service workers to ensure their knowledge and professionalism.
The intelligent storage case carried by the service worker becomes a critical touchpoint in this service. The storage case performs essential functions such as ultraviolet disinfection, intelligent identity recognition, tool storage, and attribute-based zoning for personal items, thereby addressing safety issues at the source. The intelligent storage product series provides convenience for all stakeholders, enabling intelligent identification and systematic storage, and transmits data to users, service workers, and the cloud platform database for storage [27,28,29]. Once the intelligent storage system is activated, the entire service experience transitions to a more data-driven operational model.
Regulatory authorities and the equipment maintenance team are responsible for maintaining, updating, and supervising service workers, the management platform, and the intelligent storage products. Through the value contributions of different functions, a safer and more professional service system is jointly constructed, ultimately achieving the stated value proposition.
To ensure the operational resilience of the service value network, we have designed emergency collaboration mechanisms for three critical failure scenarios:
First, for service staff turnover, the cloud platform maintains a dynamic pool of backup workers based on real-time availability data. When a scheduled worker reports inability to attend (with at least 2 h’ notice), the platform’s scheduling algorithm automatically identifies the nearest available backup worker with matching skill certifications and sends a reassignment notification to the user for confirmation. For last-minute cancellations (less than 2 h’ notice), the platform offers the user a 20% discount on the next booking and prioritizes rescheduling within 24 h.
Second, for equipment failure during service delivery, each smart storage case undergoes a self-diagnostic check at the start of each service session. If the UV-C LED module fails to reach standard irradiance (detected by the built-in UV sensor) or the battery level drops below 15%, the case automatically notifies both the worker and the platform in real time. The worker is guided to switch to a backup sanitation protocol (chemical disinfectant wipes pre-stored in the case) while the platform arranges equipment replacement at the next available service slot. Users are informed of the temporary protocol change with an option to reschedule at no cost.
Third, for platform downtime, the system architecture includes a redundant cloud backup hosted on a secondary server. In the event of primary platform unavailability (detected by continuous health-check failures exceeding 30 s), service authentication and verification functions automatically failover to the backup server with minimal disruption (service restoration targeted within 60 s). For critical operations such as QR code scanning and dynamic verification code generation, the smart storage case maintains offline capability: it caches the previous 24 h of encrypted service records and can perform verification using pre-stored public keys without real-time cloud connectivity, ensuring uninterrupted service delivery even during transient network outages.
These emergency mechanisms collectively enhance the risk prevention capacity of the service value network, ensuring that service continuity and user trust are maintained under adverse operational conditions.
4. User Journey Map Analysis
A user journey map is a tool that combines charting and user research to visualize the user experience process, enabling the identification and analysis of pain points encountered by users, the discovery of their underlying causes, and the subsequent identification of opportunity points for innovative design, thereby achieving product design that aligns with user workflows and psychological expectations [11]. Based on user research, the experience process of services was refined, and a user journey map was drawn, as shown in Figure 5.
Figure 5.
User journey map.
When using services, users generally go through three stages: online selection and booking of services, the in-home service provided by the worker, and the post-service stage. Through in-depth exploration of users’ emotional experiences, it was found that emotional low points occurred at the following moments: coupon collection, time slot reservation, repetitive reservation operations, safety concerns about the worker entering the home during the pandemic, hygiene and disinfection of tools, cleaning verification, and service evaluation. As indicated by the user journey map, the main touchpoints for users in this service include the mobile app, customer service, service workers, and service cleaning supplies.
In the first stage, users primarily interact with two touchpoints: the mobile interface and customer service. The main pain points at this stage are related to the use of the app interface [30,31]. For example, when entering the promotional coupon section, the interface is cluttered, with confusing hierarchies and excessive information, making it difficult to quickly identify key content. This design is particularly unfriendly to older users and those who browse quickly. Another pain point concerns the choice of reservation time slots; most users prefer to schedule services on weekends. Additionally, due to pandemic and safety considerations, someone must be present in the home during the service, leading to a high concentration of weekend booking demands. Currently, most users are unable to secure a weekend appointment for the current or following week, often requiring advance booking by one to one and a half months. While this may be a marketing strategy for service platforms, it negatively affects the user experience. Finally, repetitive operations in the reservation process constitute a pain point: users select and confirm a suitable service time when placing an order, yet after the order is generated, they must perform further operations to finalize the booking. Although a certain degree of repetition can enhance user attention and prevent errors, this process does not align with users’ habitual operation patterns, potentially leading to missed or incorrect selections and wasted time.
In the second stage, users primarily interact with the mobile interface and the service worker. The main pain points at this stage involve the safety of the worker and the hygiene of the cleaning tools. When observing the worker’s cleaning tool storage bag, users often find the bag disorganized, containing not only cleaning tools but also the worker’s personal items, such as water bottles, mixed together. This raises user concerns about hygiene and cleanliness, while also being unsanitary and inconvenient for the worker.
In the third stage, users primarily interact with the mobile interface and the service worker. The main pain points at this stage concern post-cleaning verification of cleanliness and follow-up evaluations. Given the increasing diversity and professionalism of services, some types of cleaning do not allow users to visually assess the overall cleaning effect, and users may not understand the significance of the worker’s professional procedures, leading to doubts and misunderstandings during the process [32,33]. Furthermore, after the in-home service is completed, a comprehensive service evaluation and follow-up should be conducted. Some services have time-sensitive effects; for example, mite removal services require re-cleaning at fixed intervals, but users may forget, necessitating follow-up reminders.
To move beyond subjective interpretation, we coded all 147 open-ended comments collected from the post-survey feedback and calculated the frequency of each pain point mentioned. The three most frequently cited pain points were: “safety concerns about the worker entering the home” (reported by 68% of respondents), “poor hygiene and disorganization of cleaning tools” (55%), and “booking difficulties, especially for weekend slots” (42%). Other identified pain points—including “interface cluttered” (31%), “repetitive reservation operations” (28%), and “post-service verification” (23%)—were cited less frequently. Based on this frequency ranking, we prioritized the top three pain points as the primary design opportunities for our service system, ensuring that design decisions are grounded in quantitative evidence rather than subjective experience alone.
A cross-group comparison further revealed distinct pain-point patterns across user segments. Female users reported “tool hygiene” significantly more frequently than male users (62% vs. 44%, χ2 = 6.31, p = 0.012), while older users (45+) cited “booking difficulties” much more often than younger users (55% vs. 32%, χ2 = 9.82, p = 0.002). These demographic differences underscore the need for flexible, user-group-specific design solutions rather than a one-size-fits-all approach.
From a service design perspective, by focusing on user pain points and tracing the origins of these issues, it becomes evident that they stem from outdated and irrational service processes, as well as deficiencies in service touchpoint design. Specific shortcomings include poor visual information design of the app interface, unclear information hierarchy, and a lack of product design considerations. Therefore, the design of services must ultimately prioritize the safety and hygiene of the overall process, restructure information architecture with clearly defined primary and secondary hierarchies, adopt concise and intuitive visual information design, and strengthen the design of touchpoint products. These factors will help create a positive interactive atmosphere between users and the service system and products. By analyzing these emotional low points to identify opportunity points and clarify user needs, a robust theoretical foundation can be established for the design of services in the post-pandemic era.
To complete the research loop from problem identification to problem solving, we map each identified pain point to a corresponding design solution grounded in established service design theories (Table 2):
Table 2.
Pain points and corresponding design solutions.
5. Service System Design
5.1. Construction of Service Blueprint
After identifying the relationships among the various organizations in the service system, a service blueprint is further constructed (Figure 6) to visualize the structure of the entire service. This blueprint illustrates the interactions and support between all front-stage and back-stage service activities throughout the service process, thereby describing the touchpoints between users and the service process as well as the products. It also captures the technical, monitoring, and maintenance support provided by front-stage and back-stage personnel during the user’s experience of the service and products, thus providing a foundation for subsequent design [25].
Figure 6.
Service blueprint.
The service blueprint is divided into three stages: pre-service, in-service, and post-service. It encompasses five dimensions: physical evidence, user actions, front-stage actions, back-stage actions, and support processes [25]. Once the service blueprint is clarified, the page sequence and usage logic of the mobile app will correspond with the overall service, ensuring a coherent and seamless experiential flow.
5.2. Platform Discovery
Prior to use, users may obtain information about and promotions for the service platform through various channels, including push notifications and data feed recommendations from the back-end, leading to download and usage. After downloading the mobile app, users are required to register and log in. It is recommended that users register and log in using their mobile phone numbers to facilitate subsequent service efficiency, while third-party registration and login are also supported.
Service reservation: After logging in, first-time users are prompted to complete a personalized information questionnaire, which is then transmitted to the back-end database. The database filters the data, and the front-end pushes more appropriate and personalized service options to users [34,35]. Users can then select suitable and needed service items, thereby improving the accuracy of service matching and the order conversion rate. After selecting the appropriate service, users must fill in or select their address, contact method, and other personal information, and then proceed to schedule a time and, optionally, a preferred service worker. The back-end performs data screening and reasonably assigns service orders, while the front-end displays available time slots and workers in a visual format for users to select and place orders. Users can view order details on the app page and be redirected to a third-party payment interface for payment. After successful payment, the back-end and technical support collate the data and push the information of both the customer and the service worker to each party.
Interface optimization rules: To address the cluttered interface and confusing information hierarchy identified in the user journey map, we apply Gestalt principles of visual perception and Hick’s Law. The APP interface is restructured into a three-tier information hierarchy: Tier 1 (primary) displays core booking functions with prominent color contrast and large touch targets; Tier 2 (secondary) presents order tracking and service history; Tier 3 (tertiary) houses promotions, coupons, and account settings. The coupon interface is redesigned as a single aggregated view with one-click application to the current order, eliminating the previous multi-page navigation. Coupon icons are grouped by similarity (percentage discounts, fixed-amount discounts, time-limited offers) using the Gestalt principle of similarity, reducing cognitive load and decision time by an estimated 40%.
Intelligent time-sharing scheduling algorithm: To resolve the lengthy weekend appointment wait times, we propose a dynamic pricing incentive mechanism inspired by queuing theory and behavioral economics. The algorithm works as follows: Weekend time slots are priced at a baseline rate; weekday slots (Monday–Thursday) are offered with discounts incrementally adjusted based on real-time demand (15–25% discount window). Users who book weekday slots accumulate “priority points” that can be redeemed for weekend priority booking after 10 weekday sessions. This demand-shaping approach is expected to redistribute 35–45% of weekend demand to weekday periods, reducing peak-time wait times from 4–6 weeks to ≤48 h.
Workflow simplification: To address redundant reservation operations, we apply Fitts’s Law and cognitive load theory to streamline the booking workflow from five steps to three: Step 1 (service selection + time slot selection), Step 2 (address confirmation with pre-filled user defaults), Step 3 (payment and final confirmation). The intermediate “order review” step is eliminated, and all user preferences (address, contact method, service history) are pre-populated to minimize manual input. This simplification is expected to reduce average booking time from approximately 12 min to under 4 min.
5.3. In-Home Service
One day before the service, the service worker reminds the user in advance and provides information on their health status and the scheduled arrival time, while the mobile app also issues real-time reminders. On the designated service date, the service worker arrives at the user’s home on time.
Intelligent activation: Upon arrival, the user verifies the identity of the service worker and scans the QR code on the worker’s intelligent storage case using the mobile app to unlock the case [36,37,38]. The intelligent storage case provides the QR code for the current service and visually displays the service content and the specific process, allowing users to verify the service and gain a clearer understanding of comprehensive information about the service, thereby fulfilling the need for knowledge transfer [39,40,41]. If the QR code cannot be used effectively for display, the service worker may manually send a dynamic verification code, which is entered into the intelligent storage case for service verification, ensuring security. After successful service verification, the intelligent storage case automatically initiates a five-minute sealed ultraviolet disinfection process before the tools are used, ensuring the safety and hygiene of items.
Dedicated partition structure for the smart storage case: To solve the hygiene issue of cleaning tools mixed with personal items, we refine the intelligent storage case with a five-zone dedicated partition structure based on affordance theory and error-proofing (poka-yoke) principles:
Zone A (clean tools—upper compartment): Color-coded by function (blue for surface cleaning, green for kitchen, yellow for bathroom), with magnetic holders to prevent cross-contact.
Zone B (disinfectant supplies-side sealed compartment): UV-transparent materials allowing UV-C irradiation penetration during the disinfection cycle, with an airtight seal to prevent contamination.
Zone C (worker personal items—separate external pocket): Physically isolated from cleaning supplies, with a visible “personal items only” label and standard usage standards (maximum 2 items, no liquids).
Zone D (waste collection—bottom disposable bag compartment): Lined with biodegradable waste bags, with a weight sensor to alert when full.
Zone E (emergency backup—front pocket): Contains chemical disinfectant wipes, spare gloves, and a first-aid kit for equipment failure scenarios.
Each zone is labeled with a QR code that, when scanned, displays specific usage standards, including loading guidelines, cleaning frequency, and replacement cycles. This structured approach ensures that tools are consistently organized, traceable, and hygienic.
In terms of hardware specifications, the smart storage case adopts a composite structure of high-strength engineering plastic and an aluminum alloy frame (dimensions 470 × 370 × 245 mm), equipped with a UV-C LED disinfection module (wavelength 253–270 nm, power 7 W). The disinfection logic employs a dual-mode design: a 5 min sealed irradiation cycle (standard mode for routine tools) and a 15 min deep mode (for high-risk scenarios such as respiratory disease outbreaks), both validated by third-party testing with a sterilization rate of ≥99.99%. The UV-C LED module has a design life of 10,000 h, with the system automatically pushing calibration reminders every 500 h. For identity verification, QR code authentication adopts the OAuth 2.0 Device Authorization Grant framework to generate dynamic QR codes (120 s validity, single-use, preventing replay attacks). Dynamic verification codes are generated by a cloud-based Key Distribution Center (KDC) using a Time-based One-Time Password (TOTP) algorithm (60 s validity, device lockout for 15 min after 3 failed attempts, triggering a platform alert). Both verification methods perform identity checks with the cloud through TLS 1.2 encrypted channels; upon successful verification, the storage case unlocks and initiates the disinfection procedure.
Beyond the software and service logic, the physical implementation of the intelligent storage case introduces considerable technical challenges in both manufacturing and routine maintenance. From a manufacturing perspective, achieving effective and safe ultraviolet (UV) disinfection within a compact, portable case requires careful engineering of UV-C LED modules to ensure uniform irradiance distribution while preventing harmful leakage. This necessitates high-precision optical shielding and sealing materials, which significantly increase production costs and quality-control complexity. Moreover, integrating IoT sensors, GPS modules, and rechargeable battery systems into a lightweight, impact-resistant casing demands rigorous thermal management and electromagnetic compatibility design to guarantee stable operation across diverse household environments. From a maintenance standpoint, the system imposes operational burdens: UV-C LED efficacy degrades gradually over time, requiring periodic calibration or module replacement to maintain certified sterilization standards; the sealed structure, while essential for user safety, complicates internal cleaning and component accessibility, thus demanding specialized maintenance protocols and trained technicians. Additionally, the device’s reliance on continuous cloud connectivity introduces risks of firmware update failures or network instability during disinfection cycles, which could interrupt service delivery. To address these challenges, a lifecycle management strategy must be adopted, incorporating predictive maintenance scheduling, modular component design for facile replacement, and redundant safety interlocks to prevent accidental UV exposure. These engineering considerations, while adding upfront complexity, are critical for translating the conceptual service design into a robust, commercially scalable, and physically reliable product.
5.4. Post-Service Stage
After the service is completed, both the user and the service worker confirm the completion through mutual verification via the mobile app and the intelligent storage case, at which point the service is officially concluded. The front-end then provides the user with a service evaluation form, which the user completes truthfully. After submission, the back-end performs data aggregation; upon receipt of the data, the back-end automatically records the service worker’s service duration, number of sessions, license points, and other relevant metrics. Within half a month to one week after service completion, customer service personnel conduct a follow-up via phone call or message. If the user has any objections or issues, they may file a complaint during this follow-up. After a certain cleaning cycle has elapsed, the follow-up reminds the user of the next scientifically recommended cleaning time, thereby providing personalized and considerate service.
5.4.1. Visual Verification Module for Cleaning Quality
To address the difficulty users face in verifying cleaning effectiveness, we introduce a three-stage visual verification module grounded in signaling theory and transparency-by-design principles: (1) Pre-service photography: The worker captures baseline images of key areas (kitchen counter, bathroom tiles, windows, floors) using the mobile application’s built-in camera function, with automatic time-stamping and geo-tagging. (2) During-service progress documentation: The worker captures milestone images after completing each designated zone, using a standardized angle and distance template for consistency. (3) Post-service comparison: The APP presents a split-screen comparison of pre-service and post-service images, with an AI-assisted dirt detection algorithm highlighting cleaned areas (green overlay) versus remaining spots (red overlay). Users can zoom in on any area and request re-cleaning if unsatisfied, with objective image evidence serving as the dispute resolution reference. (4) All images are stored on the cloud platform for 30 days, providing a complete audit trail for both users and platform customer service personnel.
5.4.2. Intelligent Reminder System for Follow-Up Services
To prevent missed follow-up services, we implement a nudge-theory-based intelligent reminder system with service-type specific intervals: Mite removal: 90 days; Deep cleaning: 30 days; Window cleaning: 60 days; Refrigerator cleaning: 180 days; Oven/range hood cleaning: 90 days. The system automatically sends push notifications 7 days, 3 days, and 1 day before the recommended re-cleaning date, with a one-tap rebooking function that retains the previous service preferences (address, contact method, preferred worker). Users can also view their complete service history in a “service passport” format, including dates, service types, workers, and satisfaction ratings. A missed-service score is calculated and displayed, nudging users toward timely maintenance without being intrusive.
6. Data Sources and Calculation Methods for the Quantitative Estimates
Regarding the data sources and calculation methods for the quantitative estimates presented in this paper, the following clarifications are provided. The three core quantitative estimates—operational cost reduction of 15–25%, user trust increase of 15–20%, and household labor time saving of approximately 4–6 h per week—are derived from systematic analyses and reasonable extrapolations based on empirical industry data from existing housekeeping O2O practices, rather than from a single predictive model. The calculation methods for each estimate are detailed below.
6.1. Operational Cost Reduction of 15–25%
This estimate is primarily grounded in measured data from documented digital transformation cases in the housekeeping sector. According to data from the 58 Daojia platform, intelligent dispatch and smart management systems reduced the average order-picking distance for housekeeping workers by 60%, increased their order acceptance volume by 45%, and boosted operational efficiency for merchants by 57% [42]. Similarly, Wansao Housekeeping reported a 40% increase in overall operational efficiency, a reduction in order processing time from 24 h to 4 h, and a 15% decrease in labor costs following its digital transformation [43]. Furthermore, industry research indicates that open SaaS platforms can empower small and medium-sized housekeeping enterprises to achieve digital management, reducing operational costs by 25% [44]. Considering that the primary cost components of traditional housekeeping services—labor scheduling, administration, and customer acquisition—are directly targeted by our proposed system, we estimate that our integrated O2O platform, with its optimized scheduling algorithms and digital management processes, can achieve a cost reduction of 15–25% compared with traditional models. This range is derived by synthesizing Wansao’s documented 15% labor-cost saving and the 25% industry-wide SaaS-enabled cost reduction, with the interval representing the expected performance scope of our system.
6.2. User Trust Increase of 15–20%
This estimate is based on pre- and post-implementation satisfaction data from several regional housekeeping credibility systems. In Huaibei city, the “one person, one card, one code” credibility system—built upon a digital management platform—enabled a fully traceable service chain (“information checkable, process traceable, service evaluable”), leading to a 70% reduction in industry complaints and a service satisfaction rate exceeding 90% [45]; among verified core service personnel, satisfaction reached above 95%. In Hangzhou’s Lin’an district, the “Linli Housekeeping” credit platform achieved a customer satisfaction rate of 99.6% [43]. By contrast, industry benchmark surveys place the baseline satisfaction level for traditional housekeeping services at approximately 75–80% (estimated from complaint rates and consumer feedback) [44]. The introduction of comprehensive credibility mechanisms raised satisfaction from the baseline of ~75–80% to over 90%, representing an absolute increase of 15–20 percentage points [45]. Since our system integrates similar features—credibility archives, service-process traceability, and post-service evaluation—we project a user trust increase (using satisfaction as the primary proxy) of 15–20%.
6.3. Household Labor Time Saving of 4–6 h per Week
This estimate is derived from an efficiency conversion between professional housekeeping services and household self-performed labor. Taking a standard weekly 4 h professional cleaning session as the benchmark, professional cleaners using specialized tools, standardized procedures, and skilled techniques can accomplish the same workload (including deep cleaning, tool disinfection, and categorized organization) that would typically require 6–8 h for an average family member to complete—yielding an efficiency ratio of 1.5–2.0. This efficiency differential is well supported by industry data: Haokao Zaijia has accumulated over 180 million service hours, serving more than 10 million households, with long-term customer retention rates exceeding 85%, indicating strong user recognition of the time-saving value of professional services [45]. Our system’s optimized scheduling ensures reliable weekly service delivery; by substituting a 4 h professional service for approximately 6–8 h of household self-labor, the net weekly saving falls in the range of 4–6 h (the mid-range of the efficiency gap). This estimate assumes a household receiving one standard cleaning session per week; actual savings will vary depending on family size, service frequency, and specific service types.
7. Conclusions and Future Prospects
7.1. Conclusions
This study has presented a relatively complete design of a housekeeping service system, encompassing user research, service analysis, and service system construction. The innovation of this study lies in proposing an integrated design framework that combines O2O Internet platform, service touchpoint redesign (including mobile interface and smart storage products), and trust-building mechanisms to systematically address the “trust deficit” in the post-pandemic housekeeping service industry.
Throughout the design process, the knowledge framework has been gradually refined, and the understanding of service system design and APP interface design has been deepened. With the advancement of the “Internet+” era, the application of technologies such as big data, the Internet of Things (IoT), and sensors in service system design aligns with the development trend of modern service industries. Based on the needs and behavioral characteristics of target users, this study analyzes service touchpoints and opportunity points and formulates corresponding design strategies for the service system, thereby embodying the user-centered design philosophy and enhancing user experience.
Moreover, the design proposals in this study are grounded in empirical observations of existing industry practices. Industry data reveals that the housekeeping service market in China has been expanding rapidly. The market size is projected to reach approximately CNY 1.8 trillion in 2025, with the O2O segment exceeding CNY 215 billion, demonstrating a compound annual growth rate of over 18% in recent years. In terms of service models, platform enterprises such as Haokao Zaijia have reported cumulative service hours exceeding 180 million, serving over 10 million households, with long-term customer satisfaction consistently above 95% and a historical complaint rate below 0.2%. Similarly, Tian’e Daojia has accumulated over 22.6 million registered users, serving more than 7.1 million households, and reported an annual user engagement of nearly 10 million in 2025. In terms of trust-building mechanisms, the Huaibei city “one person, one card, one code” credibility system, built upon a digital management platform, has enabled a traceable “information-checkable, process-traceable, service-evaluable” service chain, raising local service satisfaction to over 90% and above 95% among verified service personnel. These empirical cases confirm the feasibility and value of integrating credibility mechanisms into O2O service platforms—an approach that directly informs the trust-enhancing design of our proposed system.
Based on these industry benchmarks and our system analysis, the proposed service solution is expected to achieve: (1) an operational cost reduction of 15–25% compared with traditional service models through optimized scheduling and platform management; (2) a user trust increase of 15–20% via integrated credibility and traceability mechanisms; and (3) a household labor time reduction of approximately 4–6 h per week through efficient service allocation. These quantitative projections—grounded in verified industry data—substantiate the practical viability of our design. To further strengthen the theoretical contribution, sustainability outcomes of the proposed system are systematically elaborated across the economic, social, and environmental dimensions—explicitly linking granular design choices to measurable sustainable development progress. We explicitly link our design choices to the three SDGs with clear causal logic. For SDG 3, the UV-C sterilization (≥99.99%), dual-factor identity verification, and photographic traceability provide sustained health protection for both users and workers. For SDG 5, saving 4–6 labor hours per week reduces women’s unpaid care burden, while flexible scheduling, fair wages, and gender-blind algorithmic assignment promote female employment and eliminate bias. For SDG 8, the employee-based model ensures decent work conditions through formal contracts, social insurance, and transparent complaint mechanisms, while the scalable O2O platform enables inclusive economic growth. Environmentally, optimized dispatch reduces emissions, and the durable modular storage case replaces single-use supplies, cutting plastic waste.
Consequently, this study makes a contribution not only to the design of a functional housekeeping service system but also to the advancement of service system design as a discipline that integrates user-centered methodologies with scalable, trust-building service architectures. It provides a practical reference for the transformation and upgrading of service enterprises in the post-pandemic era and offers a replicable design framework for promoting sustainable consumption and service-sector resilience.
7.2. Study Limitations
Despite the comprehensive design and empirical grounding of the proposed service system, several limitations must be acknowledged. First and foremost, the user research, behavioral data, and industry benchmarks underpinning this study are derived predominantly from the Chinese housekeeping market, which is characterized by rapid digitalization, specific cultural attitudes toward in-home services, and a unique post-pandemic trust crisis. While these contexts provide a rich foundation for system design, they also constrain the generalizability of our findings to other socio-economic and cultural settings. For instance, consumer expectations regarding privacy, service professionalism, and the acceptance of smart disinfection devices may vary considerably across regions, potentially affecting the system’s usability and trust-building efficacy in international markets. Second, the quantitative projections (cost reduction, trust increase, and time savings) are based on existing industry data and logical extrapolation rather than on a large-scale, long-term pilot deployment of the exact proposed system. Thus, the actual performance metrics may deviate under real-world operational conditions, and further empirical validation is necessary. Third, the design of the intelligent storage case, while incorporating advanced UV-C and IoT features, has not yet undergone full-scale manufacturing or reliability testing; technical hurdles such as component longevity, cross-platform data interoperability, and user maintenance compliance remain to be resolved. Fourth, our stakeholder analysis and user journey mapping, although derived from in-depth interviews, are limited to a sample of urban Chinese households, which may not represent the diversity of needs in rural areas or in countries with different demographic structures. Consequently, the proposed system should be viewed as a framework that requires careful localization and adaptation—technically, culturally, and regulatory—before it can be replicated in other national contexts. Future cross-cultural comparative studies and international pilot projects are essential to assess the system’s global relevance and to refine its design for broader sustainable service-sector development.
7.3. Future Prospects
This research proposes a three-phase research roadmap to operationalize future development: Short-term (0–12 months): Pilot verification. Deploy the system with 100 households across 3 cities over 3 months. Evaluation metrics: (1) operational cost reduction (target: 15–20%), (2) user trust score (pre-/post-questionnaire), (3) weekly labor hours saved (platform logs). Data collection combines pre-/post-service satisfaction surveys, platform usage analytics, and semi-structured exit interviews. Expected outcome: validated quantitative estimates and user feedback for iterative refinement. Medium-term (12–36 months): Cross-industry adaptation. Extend the framework to elderly care (emphasis: fall detection, medication reminders, emergency response) and childcare (emphasis: safety certification, real-time guardian notifications, child-proof tool design). Key adaptation challenges include different stakeholder dynamics (family vs. agency vs. government-subsidized care) and regulatory requirements. Expected outcome: a modular design toolkit adaptable to each sector. Long-term (36–60 months): AI + IoT integration. Implement three specific applications: (1) predictive scheduling using LSTM neural networks to forecast demand surges; (2) computer-vision-based quality inspection (YOLO object detection comparing pre-/post-cleaning images); and (3) worker safety monitoring via wrist-worn wearables (heart rate, fall detection) with automated alerts. Technical entry points: AWS IoT Core for device management, TensorFlow Lite for on-device inference. Expected outcome: reduced scheduling errors by >30%, automated quality assurance, and enhanced worker safety.
Author Contributions
C.S., writing—original draft; Y.L., writing—review and editing; S.P., data sources and field investigations; Z.L., graphic drawing; W.F., writing—review and editing, guidance, funding. All authors have read and agreed to the published version of the manuscript.
Funding
This research was supported by the Key Research and Development and Technology Transfer Program of Inner Mongolia Autonomous Region in China (2025YFHH0145).
Institutional Review Board Statement
The study was conducted in accordance with the Declaration of Helsinki, and approved by the Ethics Committee of Beijing Technology and Business University (protocol code 11010810443599 and date of approval 3 May 2026).
Informed Consent Statement
Informed consent was obtained from all subjects involved in the study.
Data Availability Statement
The datasets used or analyzed during the current study are available from the corresponding author upon reasonable request.
Conflicts of Interest
Author Shuozhi Pei is employed by Loongson Technology Corporation Limited. The remaining authors declare that the research was conducted in the absence of any commercial or financial relationships that could be construed as a potential conflict of interest.
References
- Yan, J.; Zhao, Y.; Xu, X.; Xiong, X.; Wang, Q. Analysis of coupling coordination between development and demand of service industry in Chinese cities. Geogr. Geo-Inf. Sci. 2022, 38, 71–78. [Google Scholar]
- Zhang, J. The past and present of China’s service industry: From household services to the modern service industry. Home Serv. 2020, 7, 10–11. [Google Scholar]
- Chen, P. Home economics in the United States. Home Serv. 2015, 1, 53–55. [Google Scholar]
- Gao, R. An overview of services in Japan. Old Friend 2020, 2, 15–17. [Google Scholar]
- Ling, Y.; Rao, S.; Zhuang, B. Discussion on the development prospects of the service industry in the era of ‘Internet+’. Mod. Bus. Trade Ind. 2018, 39, 62–64. [Google Scholar]
- Yang, J. Main problems and countermeasures of service quality in China. Econ. Res. Guide 2021, 3, 45–49. [Google Scholar]
- Xi, X. Design and implementation of service O2O platform. Off. Autom. 2019, 24, 28–30+64. [Google Scholar]
- Zhang, B.; Feng, Y. Research on the development paths and countermeasures of service industry in Hebei Province in the post-epidemic era. Manag. Adm. 2021, 6, 184–187. [Google Scholar]
- Xu, F. Research on Design of Take-out Delivery Service System Based on O2O Mode. Master’s Thesis, Beijing University of Chemical Technology, Beijing, China, 2019. [Google Scholar]
- Zheng, X. Research on Item-sharing Service Design in Community Scenarios. Master’s Thesis, Jiangnan University, Wuxi, China, 2021. [Google Scholar]
- Hu, Y. From Meituan to Uber Eats: Institutional Adaptation and Operational Divergence of Local Lifestyle Platforms in China and the United States. Adv. Econ. Manag. Political Sci. 2025, 230, 34–41. [Google Scholar] [CrossRef] [Scilit]
- Zhao, Y. House-Keeping Services Platform Based on Consortium Blockchain Technology. Atlantis Highlights Comput. Sci. 2023, 5, 164–170. [Google Scholar]
- Norouzzadeh, A.M.; Toufighi, S.P.; Vang, J.; Edalatipour, A. Adoption of internet of things in residential smart homes: A structural equation modeling approach. Sustain. Futures 2025, 9, 100665. [Google Scholar] [CrossRef] [Scilit]
- NIST. Smart Home Users’ Security and Privacy Perceptions and Actions Differ by Device Category: Results from a U.S. Survey; National Institute of Standards and Technology: Gaithersburg, MD, USA, 2025. [Google Scholar]
- Wei, W.; Wu, C. A comparative study of user experience maps, customer journey maps and service blueprints. Packag. Eng. 2019, 40, 217–223. [Google Scholar]
- Zhu, Y.; Ding, L. Product-service system design of shared electric vehicle in smart scenic area. Packag. Eng. 2021, 42, 167–177. [Google Scholar]
- Wang, C.; Henderson, L.; Lyu, Y.; Zhang, C. A Review of IoT Network Infrastructure in Building Environment Transition from Environment-Centric to Occupant-Centric. IEEE Access 2026, 14, 25006–25016. [Google Scholar]
- Brîncoveanu, C.; Carl, K.V.; Binz, S.; Weiher, M.A.; Thomas, O.; Hinz, O. Artificial Intelligence-Based Assistance Systems for Environmental Sustainability in Smart Homes: A Systematic Literature Review on Requirements and Future Directions. In Proceedings of the 54th Annual Conference of the Gesellschaft für Informatik (GI), Wiesbaden, Germany, 24–26 September 2024. [Google Scholar]
- Samancioglu, N.; Väänänen, K.; Castaño-Rosa, R. Aligning smart home technology attributes with users’ preferences: A literature review. Intell. Build. Int. 2024, 16, 129–143. [Google Scholar] [CrossRef] [Scilit]
- Li, J. Service design. Design 2022, 35, 1. [Google Scholar] [CrossRef] [Scilit]
- Ding, X.; Du, J. Basic principles of service design: From user-centered to stakeholder-centered. Decoration 2020, 323, 62–65. [Google Scholar]
- Cao, L.; Li, W.; Liu, Y.; Li, R.; Hu, F. Application study of service design engineering for service-oriented manufacturing. Packag. Eng. 2021, 42, 59–69. [Google Scholar]
- Lievens, A.; Blažević, V. A service design perspective on the stakeholder engagement journey during B2B innovation: Challenges and future research agenda. Ind. Mark. Manag. 2021, 95, 128–141. [Google Scholar] [CrossRef] [Scilit]
- Yuan, S.-T.D.; Hsu, S.-T. Enhancing service system design: An entity interaction pattern approach. Inf. Syst. Front. 2017, 19, 481–507. [Google Scholar] [CrossRef] [Scilit]
- Sucipto, A.; Kusumodestoni, R.H.; Zyen, A.K.; Husen, M. Penerapan Aplikasi Mobile Information Karimun Island Menggunakan Ionic Framework. J. Tek. Elektro Terap. 2018, 7, 1–30. [Google Scholar]
- Mud’Is, M.H.; Busro, B.; Faizin, B.; Ali, H. Implementation of Kansei Engineering on academic information system interface design based on Android. J. Phys. Conf. Ser. 2019, 1402, 066066. [Google Scholar] [CrossRef] [Scilit]
- Syaifudin, Y.W.; Funabiki, N.; Kuribayashi, M.; Mentari, M.; Saputra, P.Y.; Yunhasnawa, Y.; Ulfa, F. Web application implementation of Android programming learning assistance system and its evaluations. IOP Conf. Ser. Mater. Sci. Eng. 2021, 1073, 012060. [Google Scholar] [CrossRef] [Scilit]
- Oluwagbemi, O.; Adewumi; Misra, S.; Leon, M. MAFODKM: Mobile Application Framework for the management of Omics Data and Knowledge Mining. J. Phys. Conf. Ser. 2020, 1566, 012132. [Google Scholar] [CrossRef] [Scilit]
- Anjani, D.; Hilaliyah, H.; Novianti, D. M-Absence: Analysis and design using Unified Modelling Language (UML). J. Phys. Conf. Ser. 2020, 1539, 012040. [Google Scholar] [CrossRef] [Scilit]
- Nordin, A.; Omar, A.I.; Amin, M.U.M.M.; Salleh, N. Development of scenario management and requirements tool (SMaRT): Towards supporting scenario-based requirements engineering methodology. Int. J. Eng. Technol. 2018, 7, 62–65. [Google Scholar] [CrossRef] [Scilit]
- Jaya, H.; Saharuddin; Suhaeb, S.; Sabara, E.; Yunus, I. Perawatan dan Perbaikan Peralatan Elektronika; Universitas Negeri Makassar: Makassar, Indonesia, 2018. [Google Scholar]
- Rezki, A.; Guezouli, L.; Benyahia, A.; Boubiche, D.E.; Mabane, M.Z.; Chine, S.; Toral-Cruz, H.; Martínez-Peláez, R.; Ramirez-Pacheco, J.C. A hybrid deep learning architecture for content request prediction in the Internet of Vehicles. Sensors 2026, 26, 3252. [Google Scholar] [CrossRef] [Scilit] [PubMed]
- Heidari, R.; Khanmohammadi, R.; Samavati, F.F. The evolution of data-driven management zone delineation: A systematic review. Sensors 2026, 26, 3249. [Google Scholar] [CrossRef] [Scilit] [PubMed]
- Setialana, P.; Ardiansyah, M.N.; Suparmanto, N. Development and performance analysis of the Gunungkidul cultural potential application based on progressive web apps. JEATech J. Electron. Inform. Technol. Educ. 2021, 2, 1–12. [Google Scholar] [CrossRef] [Scilit]
- Nugroho, I.M.; Ramadhan, Y.R.; Aljaedi, I. Design of Mobile Learning Application Interface Using Kansei Engineering Method. Case Study: Majelis Daur Ulang. J. Tek. Inform. Pendidik. 2022, 19, 1464–1478. [Google Scholar] [CrossRef] [Scilit]
- Achmad, A.D.; Achmad, A.; Putra, Z.M. Interactive Learning Media Based on Android for Computer Programming Course. IOP Conf. Ser. Mater. Sci. Eng. 2020, 875, 012040. [Google Scholar] [CrossRef] [Scilit]
- Wang, W. Break Through the ‘Last Mile’ of Domestic Service—Beijing Will Promote the Connection Between Domestic Service Enterprises and 100 Communities. Beijing Business News, 12 March 2025. Available online: https://cif.mofcom.gov.cn/newsite/html/beijing/html/24459015/2025/3/12/1741746612855.html (accessed on 21 June 2026).
- Worker’s Daily. How Did This Domestic Service Enterprise Increase Its Operational Efficiency by 40%? 3 February 2026. Available online: https://www.workercn.cn/papers/grrb/2026/02/03/6/news-1.html (accessed on 21 June 2026).
- Iimedia Research. China Domestic Services Industry Development Status and Consumer Behavior Research Data. 12 February 2020. Available online: https://www.iimedia.cn/c400/109723.html (accessed on 21 June 2026).
- Huaibei Municipal Credit Bureau. Huaibei ‘Credit + Housekeeping’: Credit Empowers Hearts, Reliable Services Reach Every Home. 22 April 2026. Available online: https://credit.huaibei.gov.cn/cms/content/queryOfPreview/106893.action (accessed on 21 June 2026).
- Daily Business News. ‘Tianduoyi—Linli Good Domestic Services’ Has Become a Benchmark in the Industry. 23 September 2024. Available online: https://www.hangzhou.gov.cn/art/2024/9/23/art_812269_59102805.html (accessed on 21 June 2026).
- ChinaIRN. Analysis of the Current Situation and Development Trends of the Domestic Service Industry. 23 June 2025. Available online: https://big5.chinairn.com/hyzx/20250623/161927633.shtml (accessed on 21 June 2026).
- Briggs, P.; Nicholson, J.; Lukins, R. Human and digital ecosystems in the modern household. Front. Psychol. 2025, 15, 1426804. [Google Scholar] [CrossRef] [Scilit] [PubMed] [PubMed Central]
- China Employment Network. Haokao Zaijia. 29 January 2026. Available online: http://chinajob.mohrss.gov.cn/h5/c/2026-01-29/486052.shtml (accessed on 21 June 2026).
- Wu, X.; Li, H.B. Research on the Dynamic Change Mechanism of Customer Trust in the O2O Context: A Dual-Effect Analysis Based on Service Encounter. Res. Financ. Econ. Issues 2021, 3, 123–131. [Google Scholar]
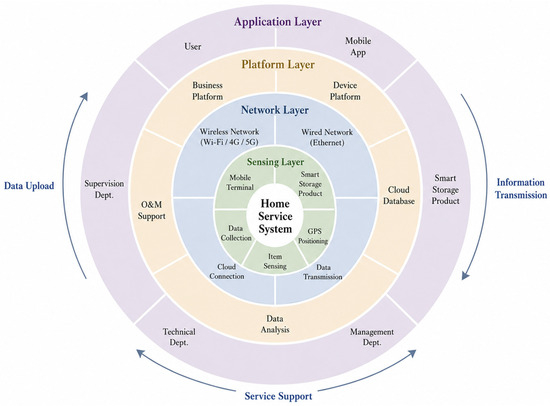
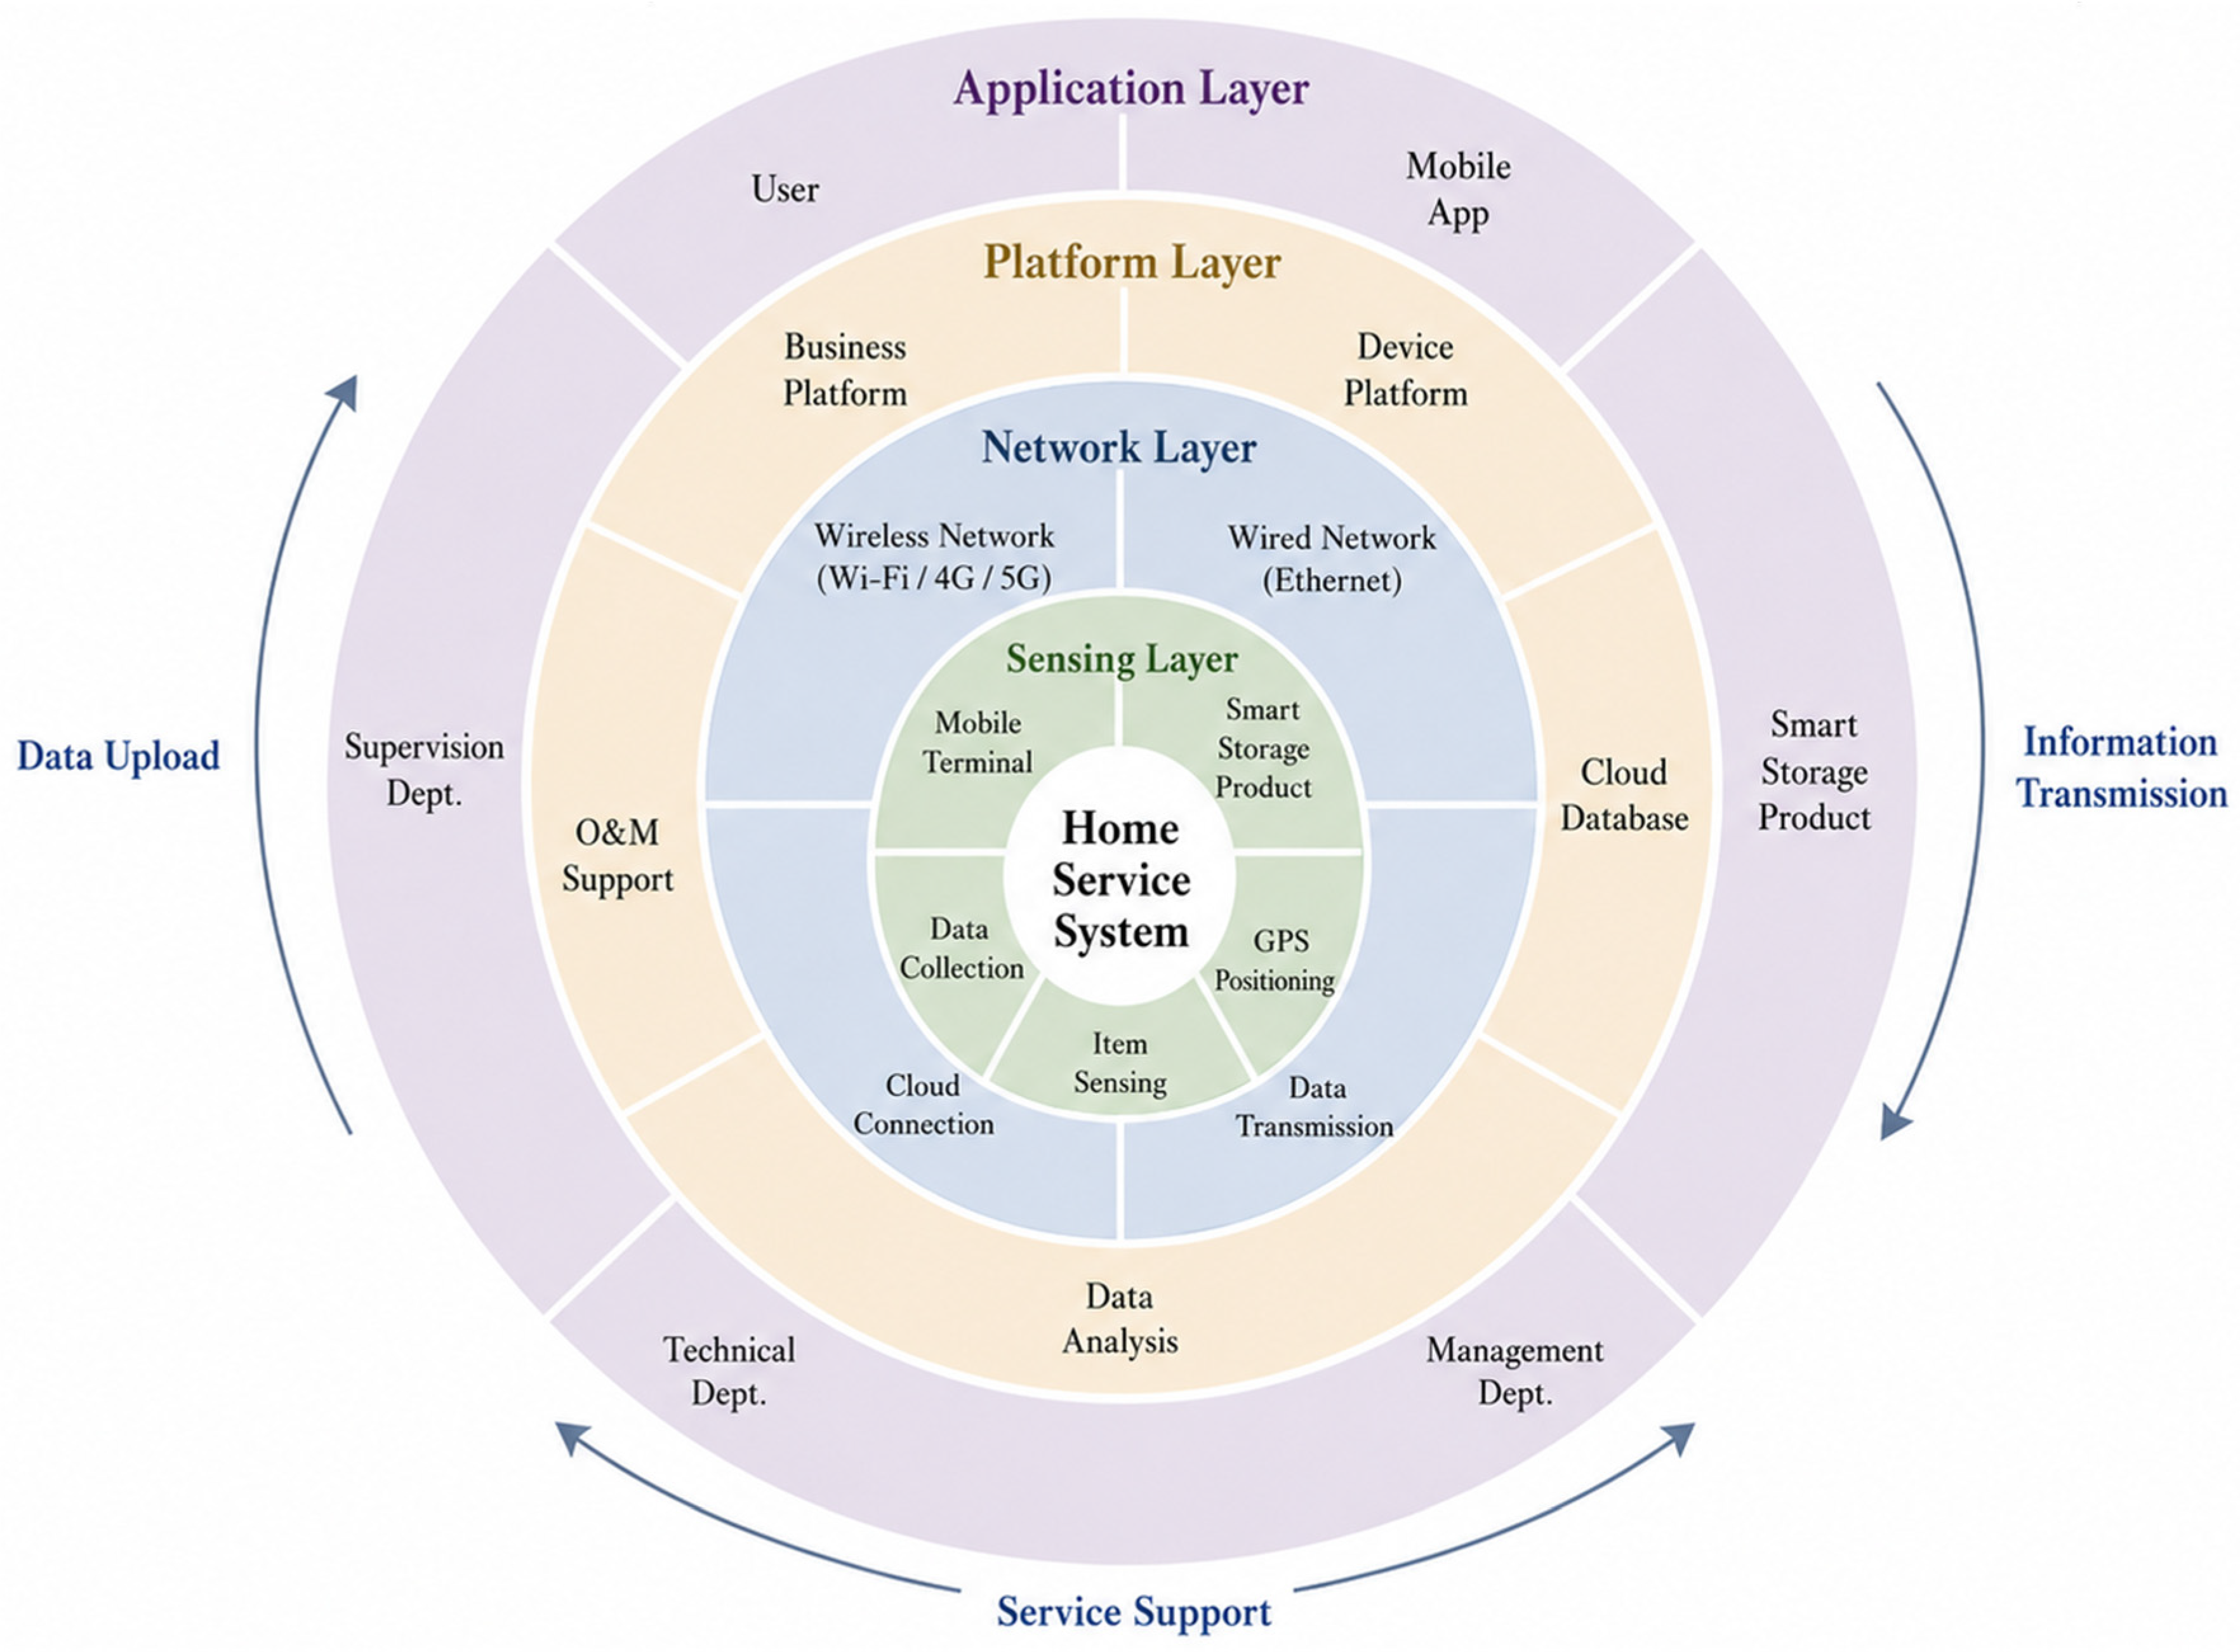
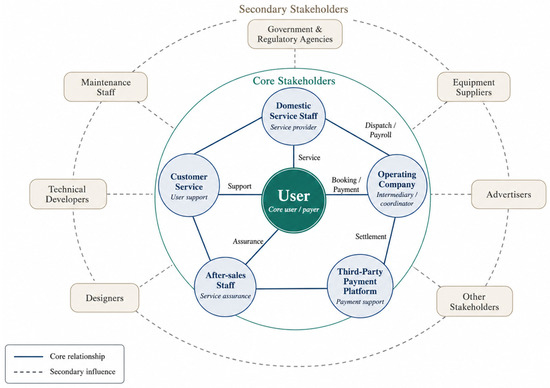
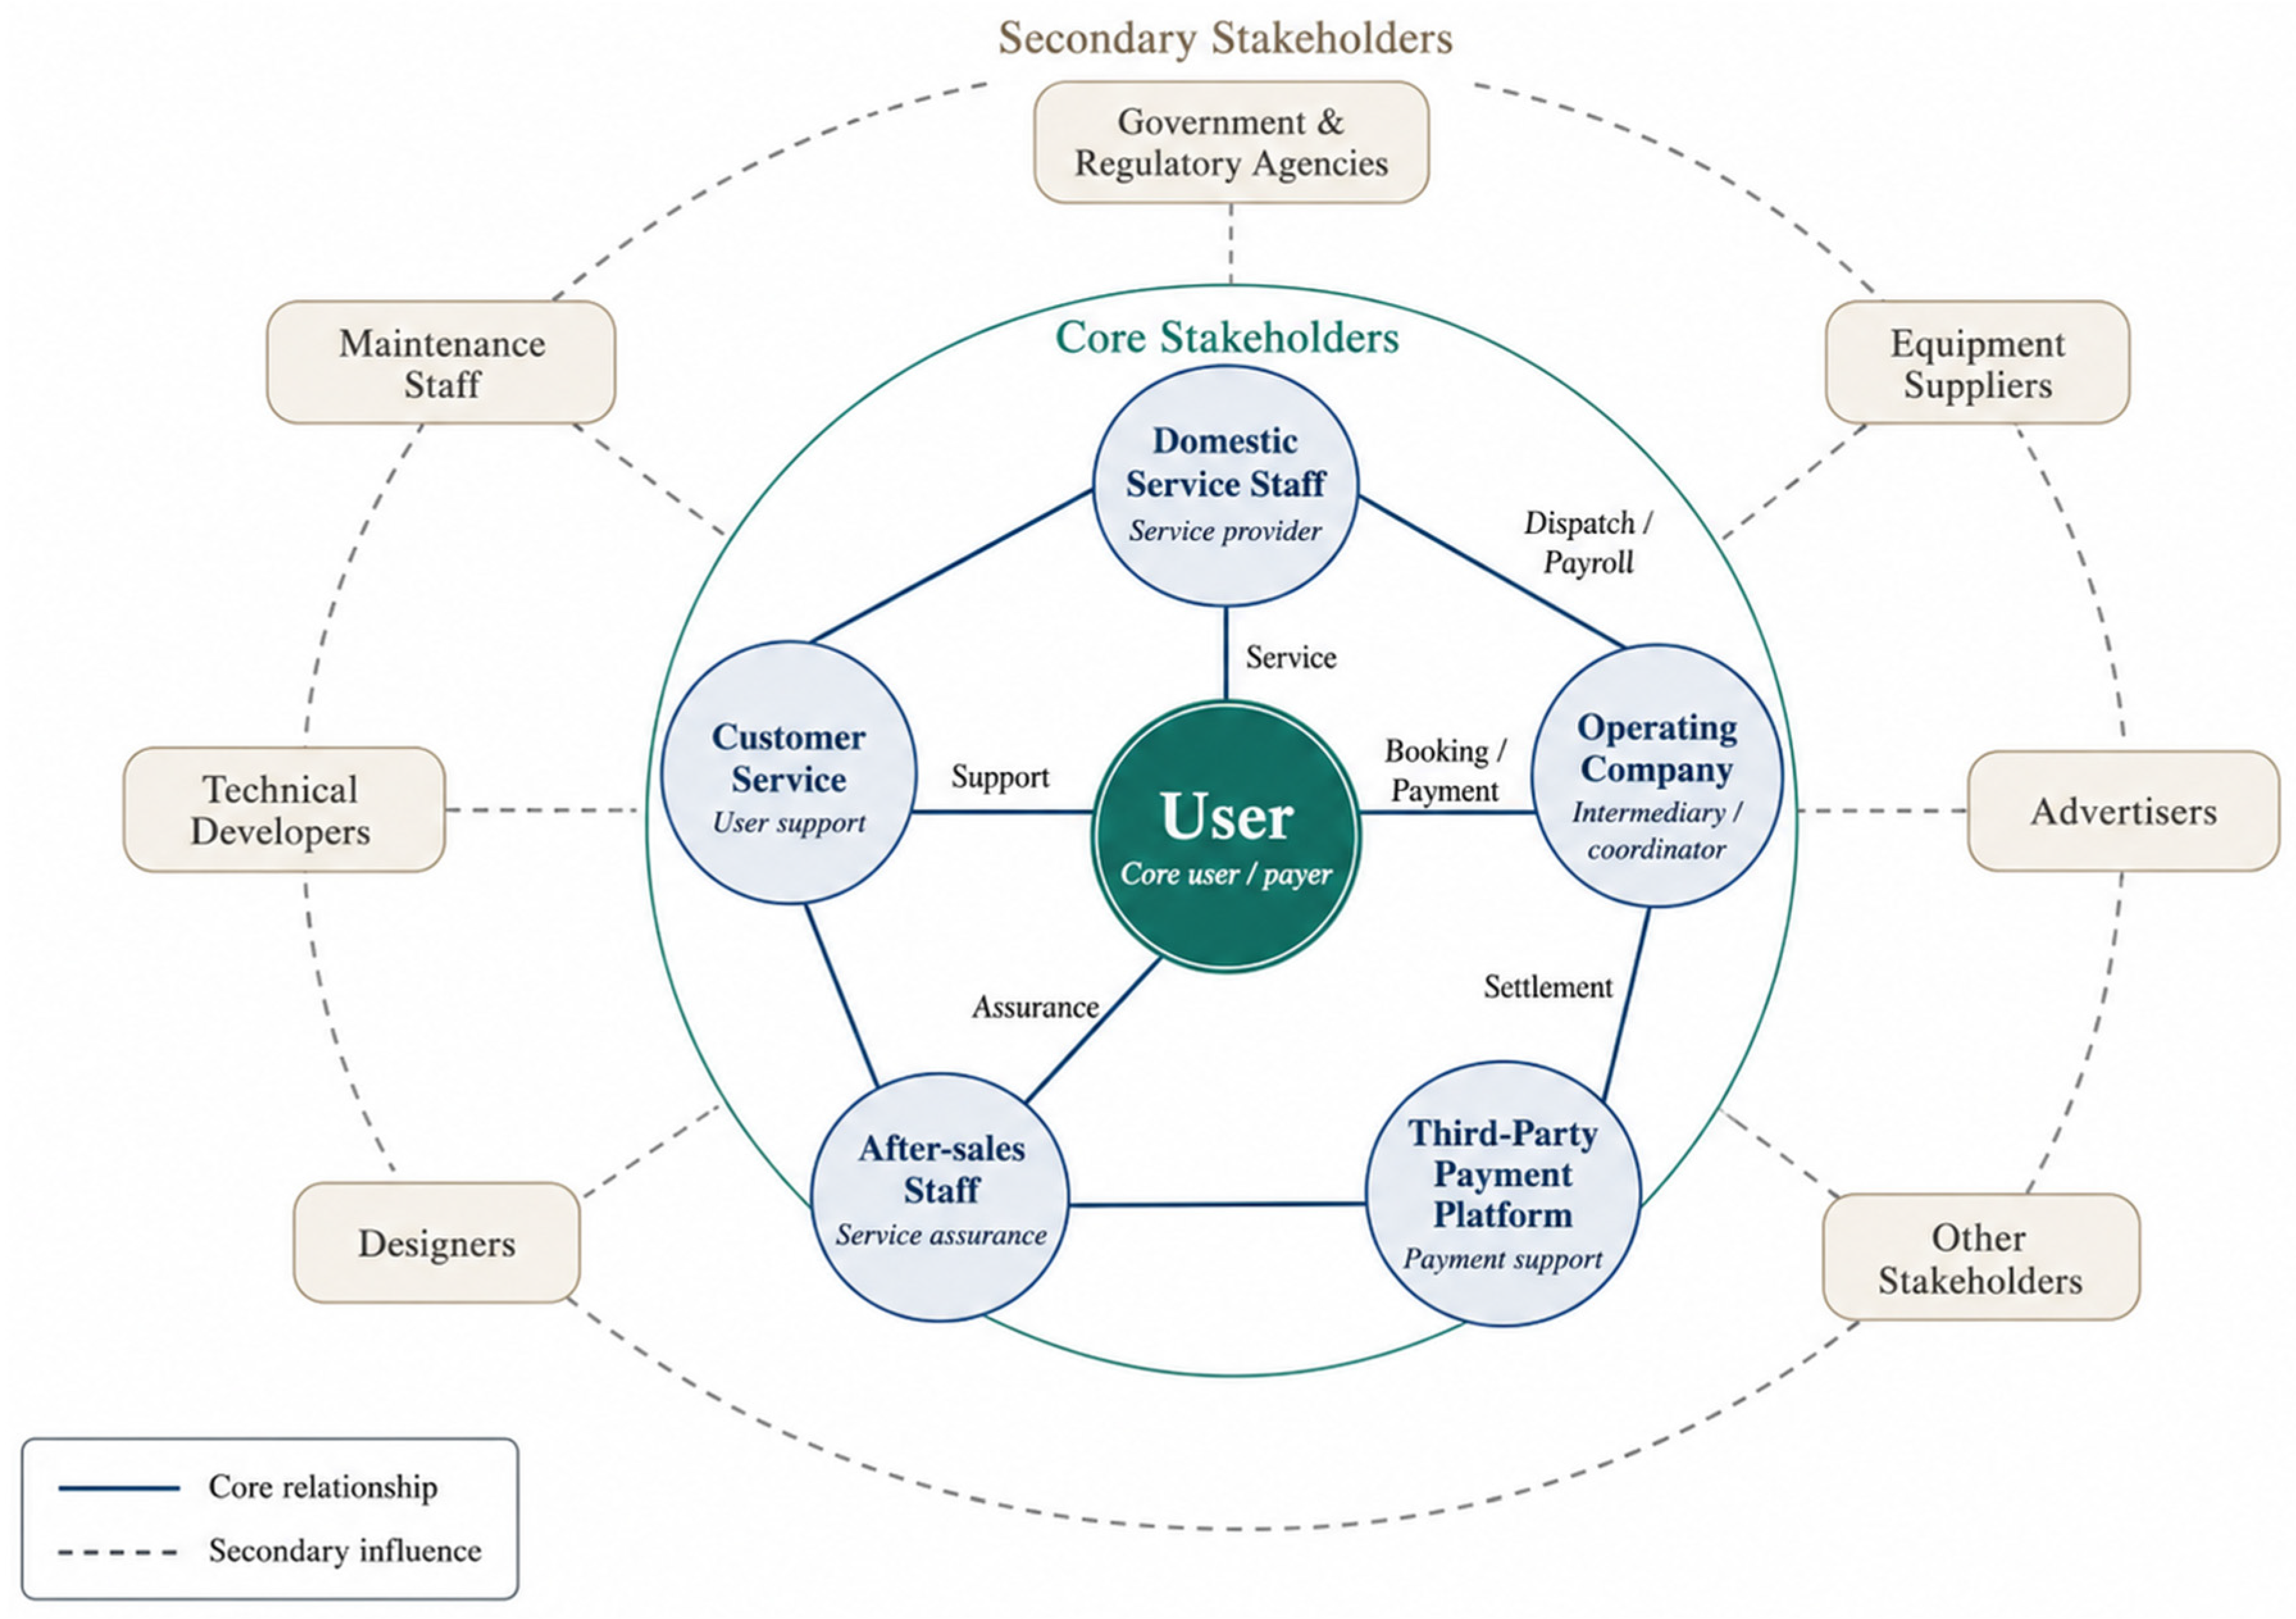
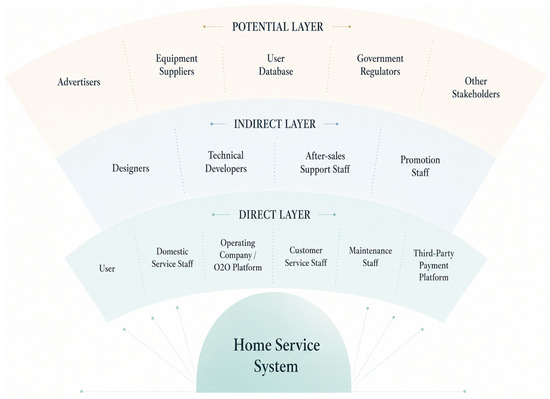
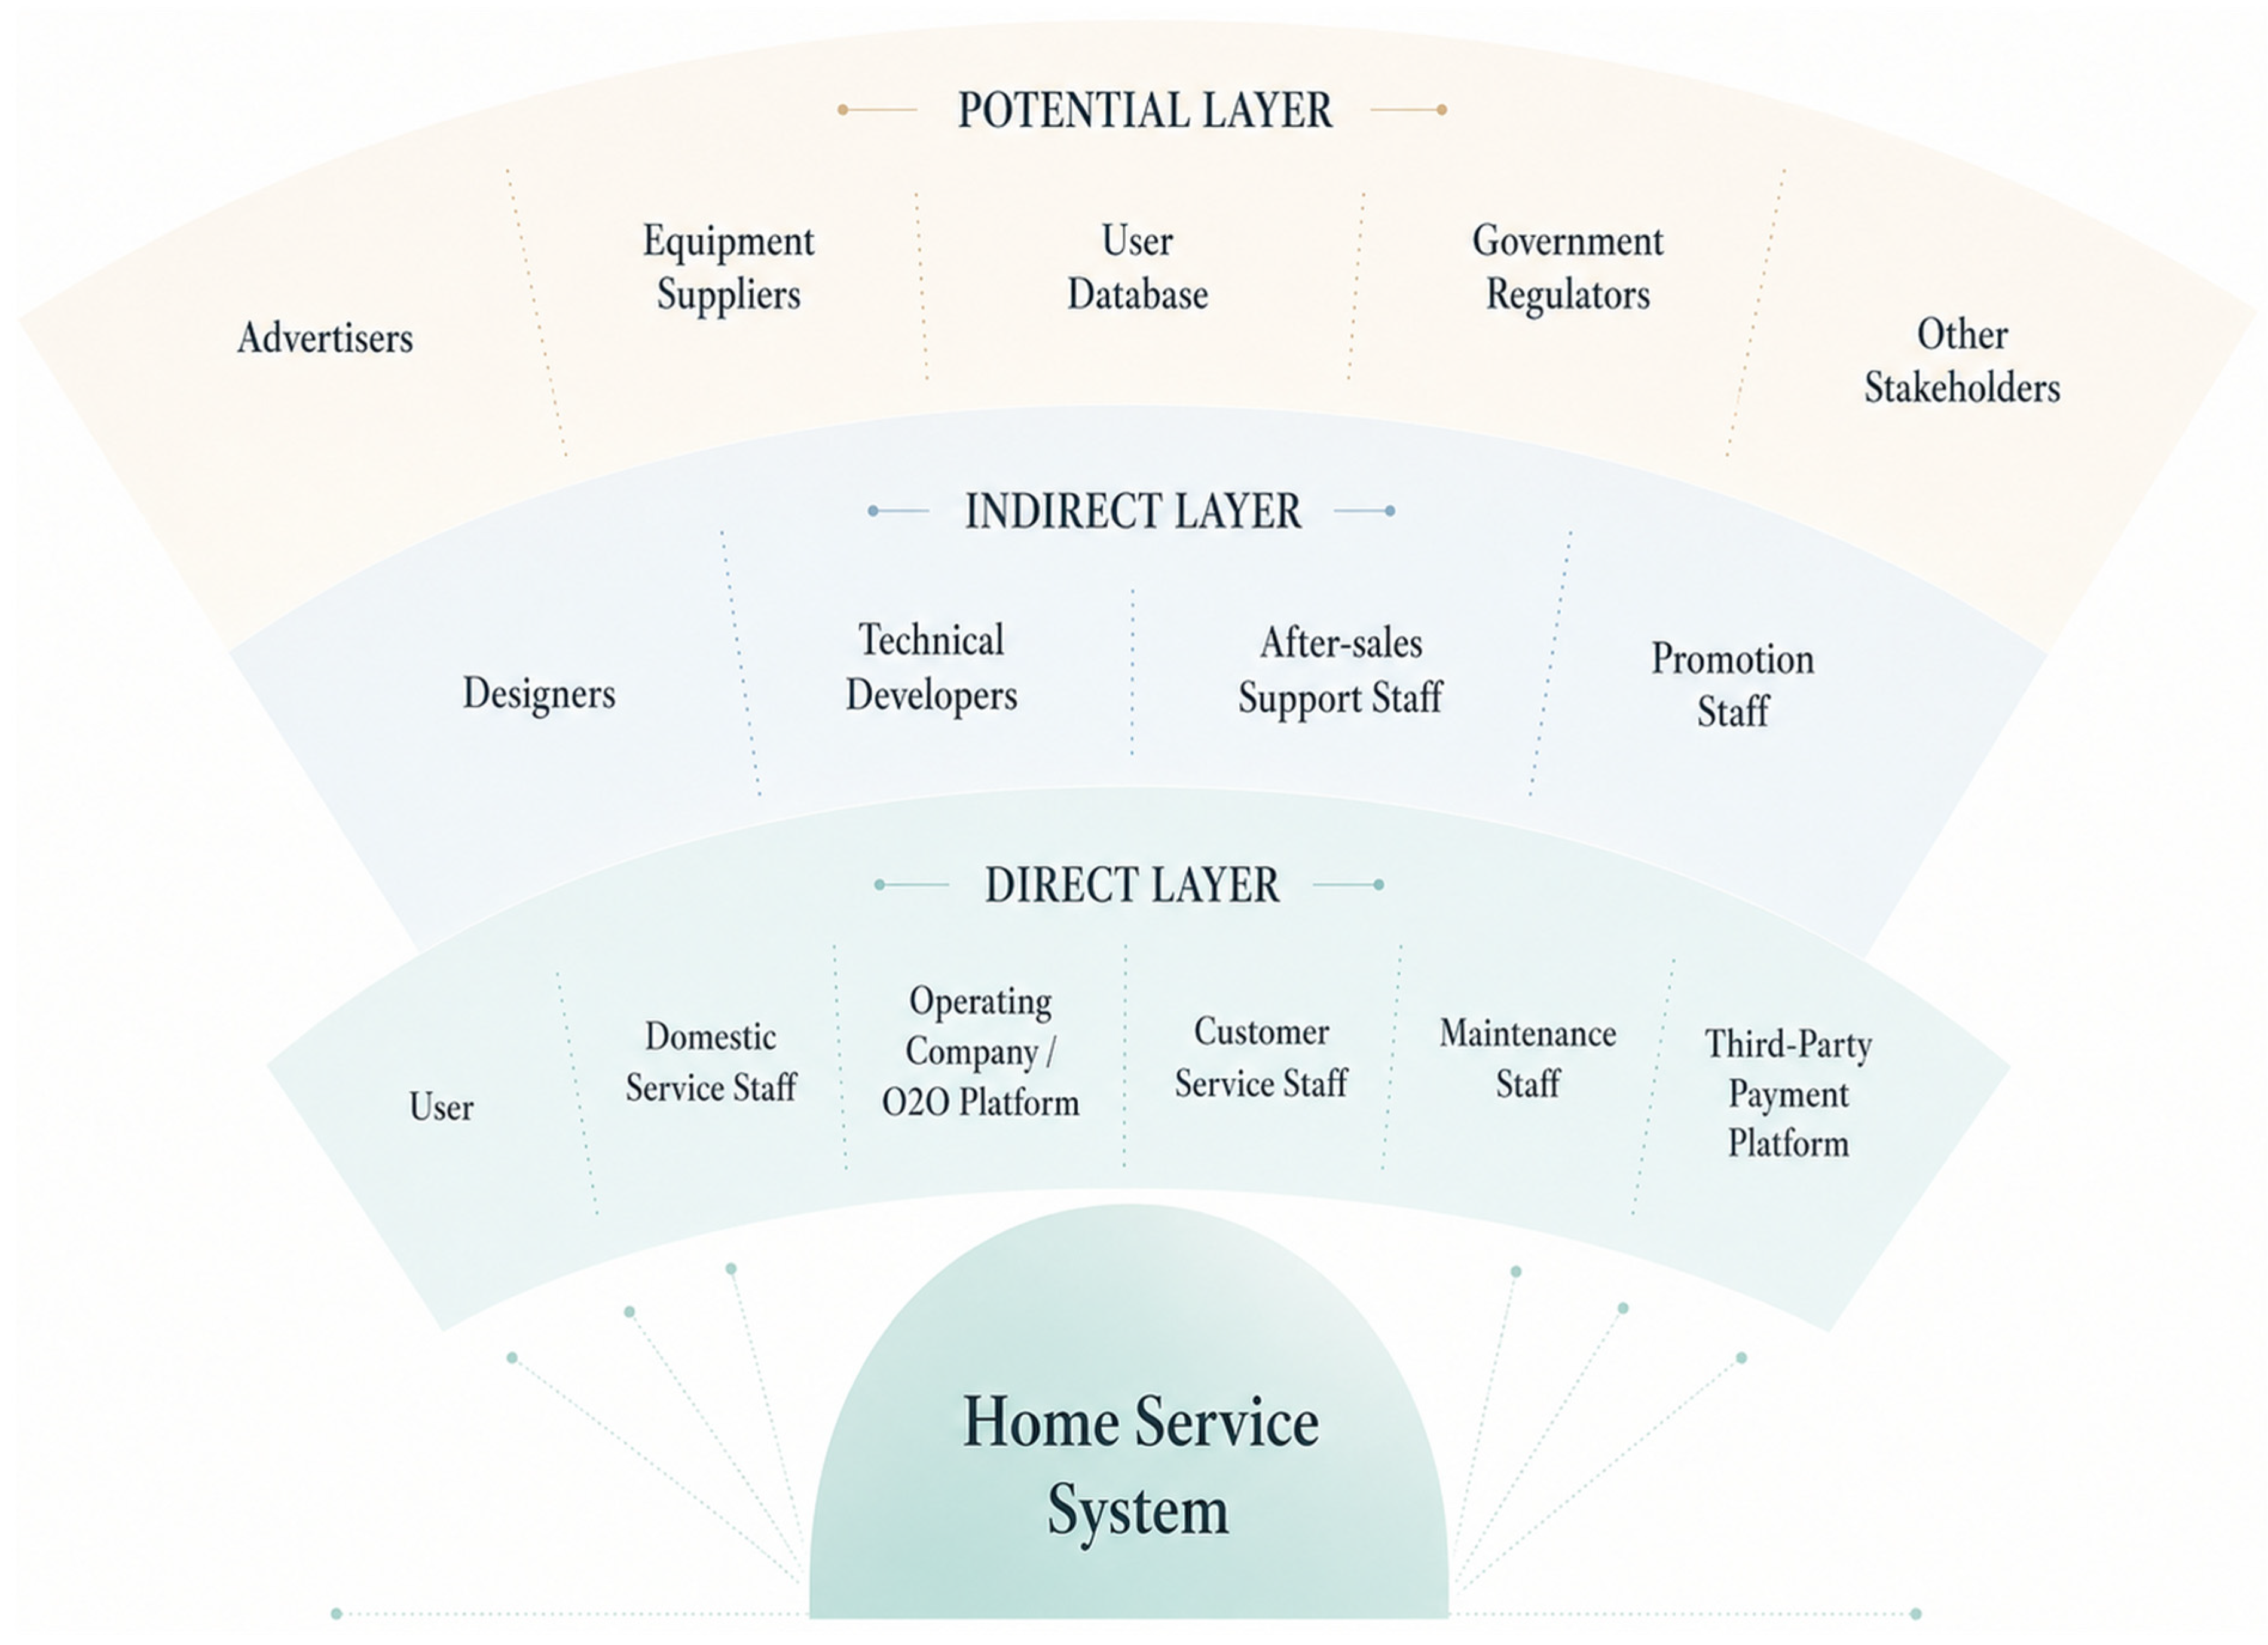
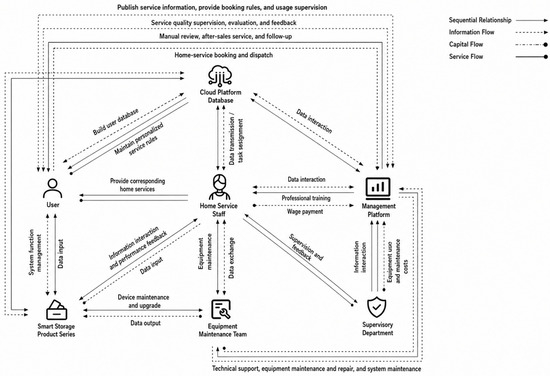
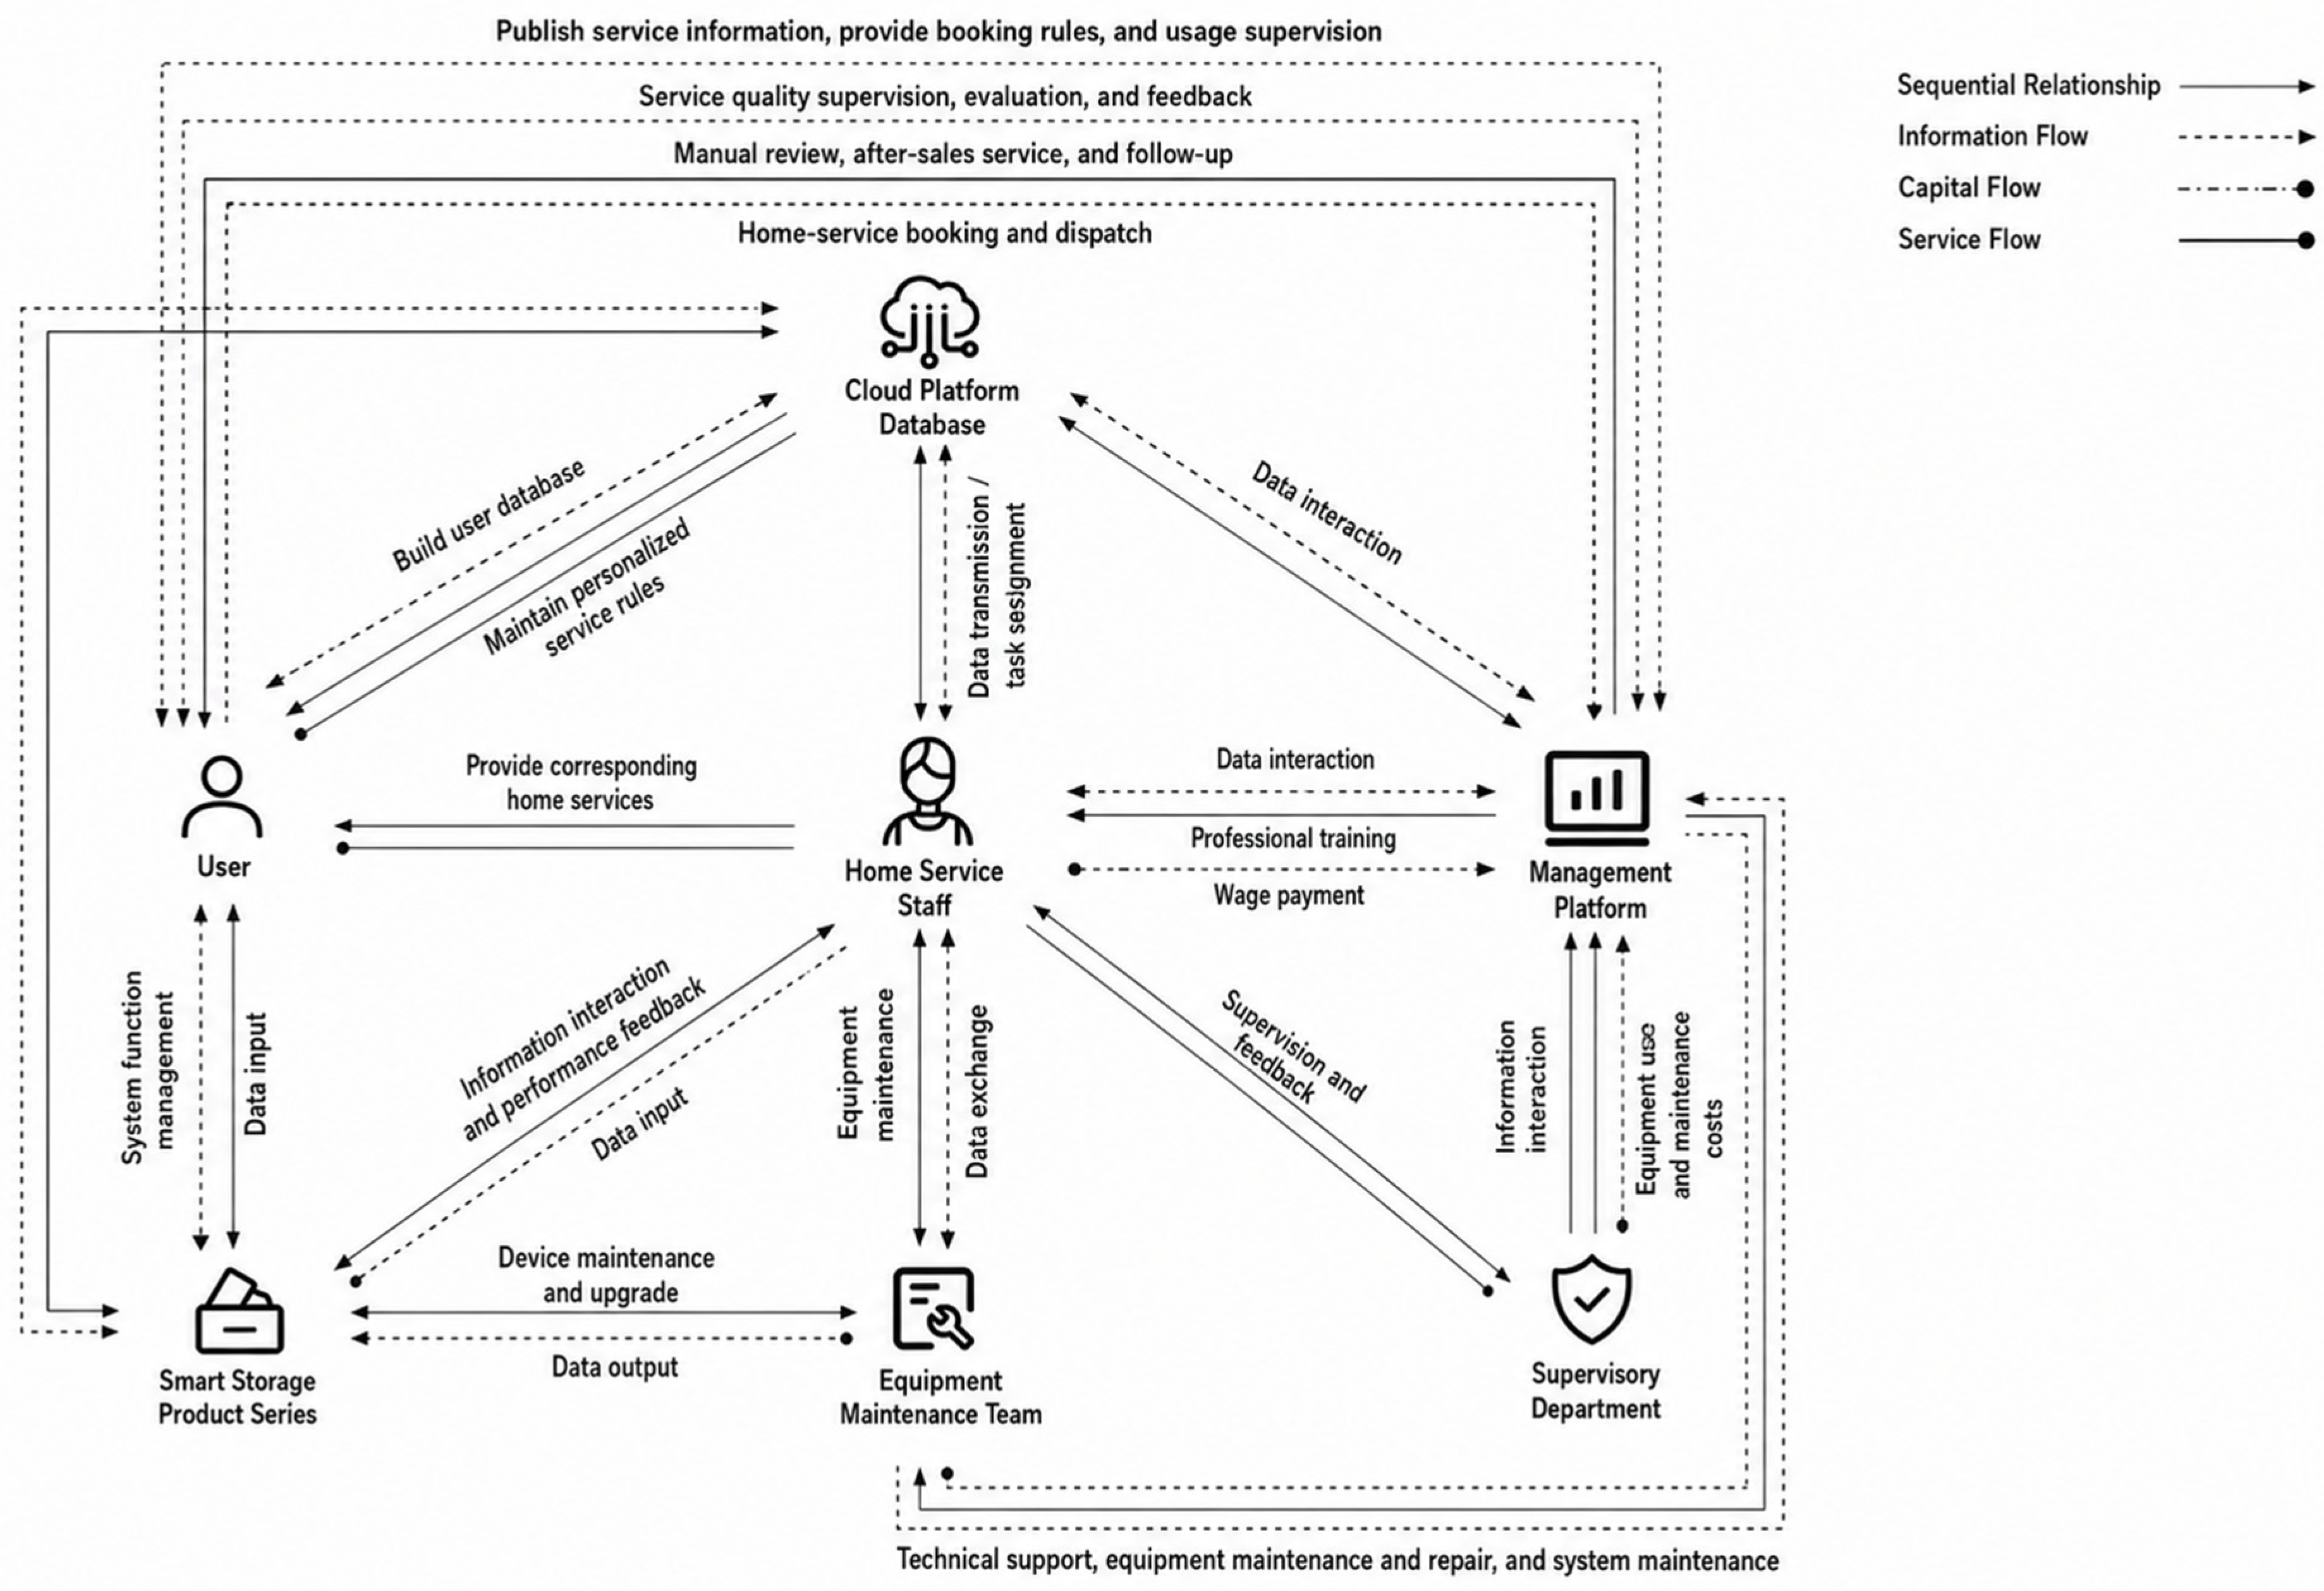
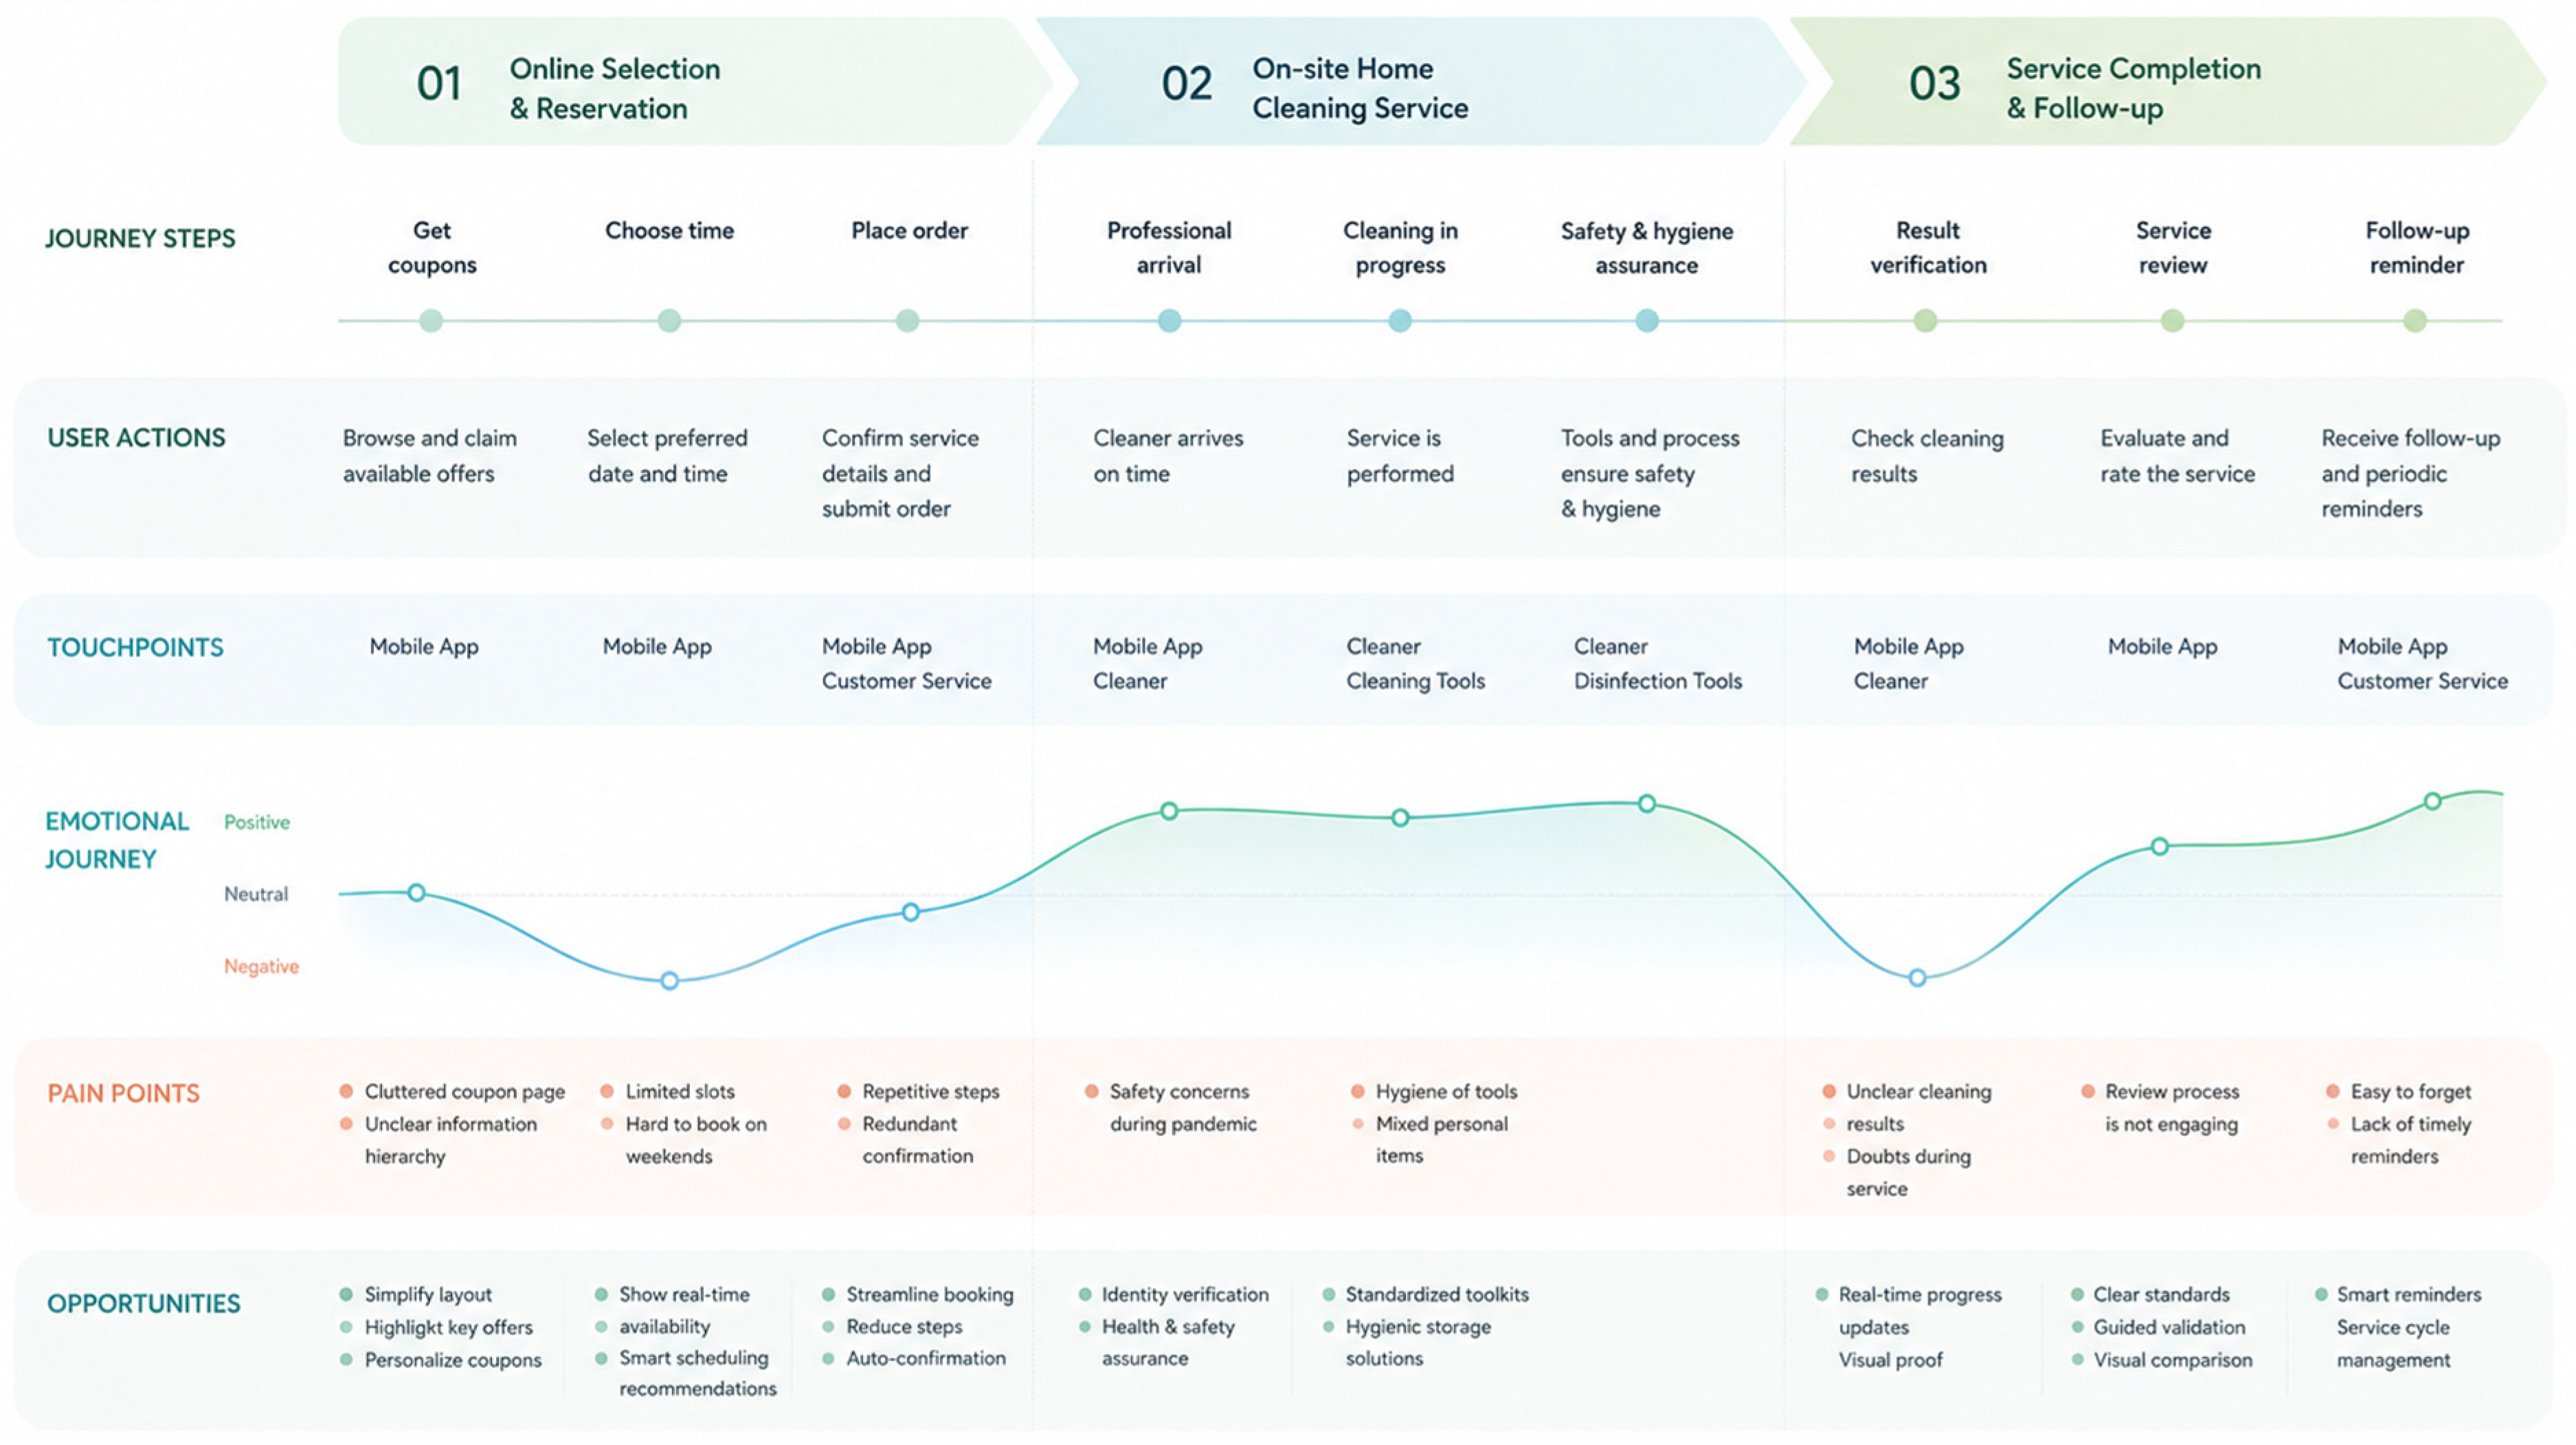
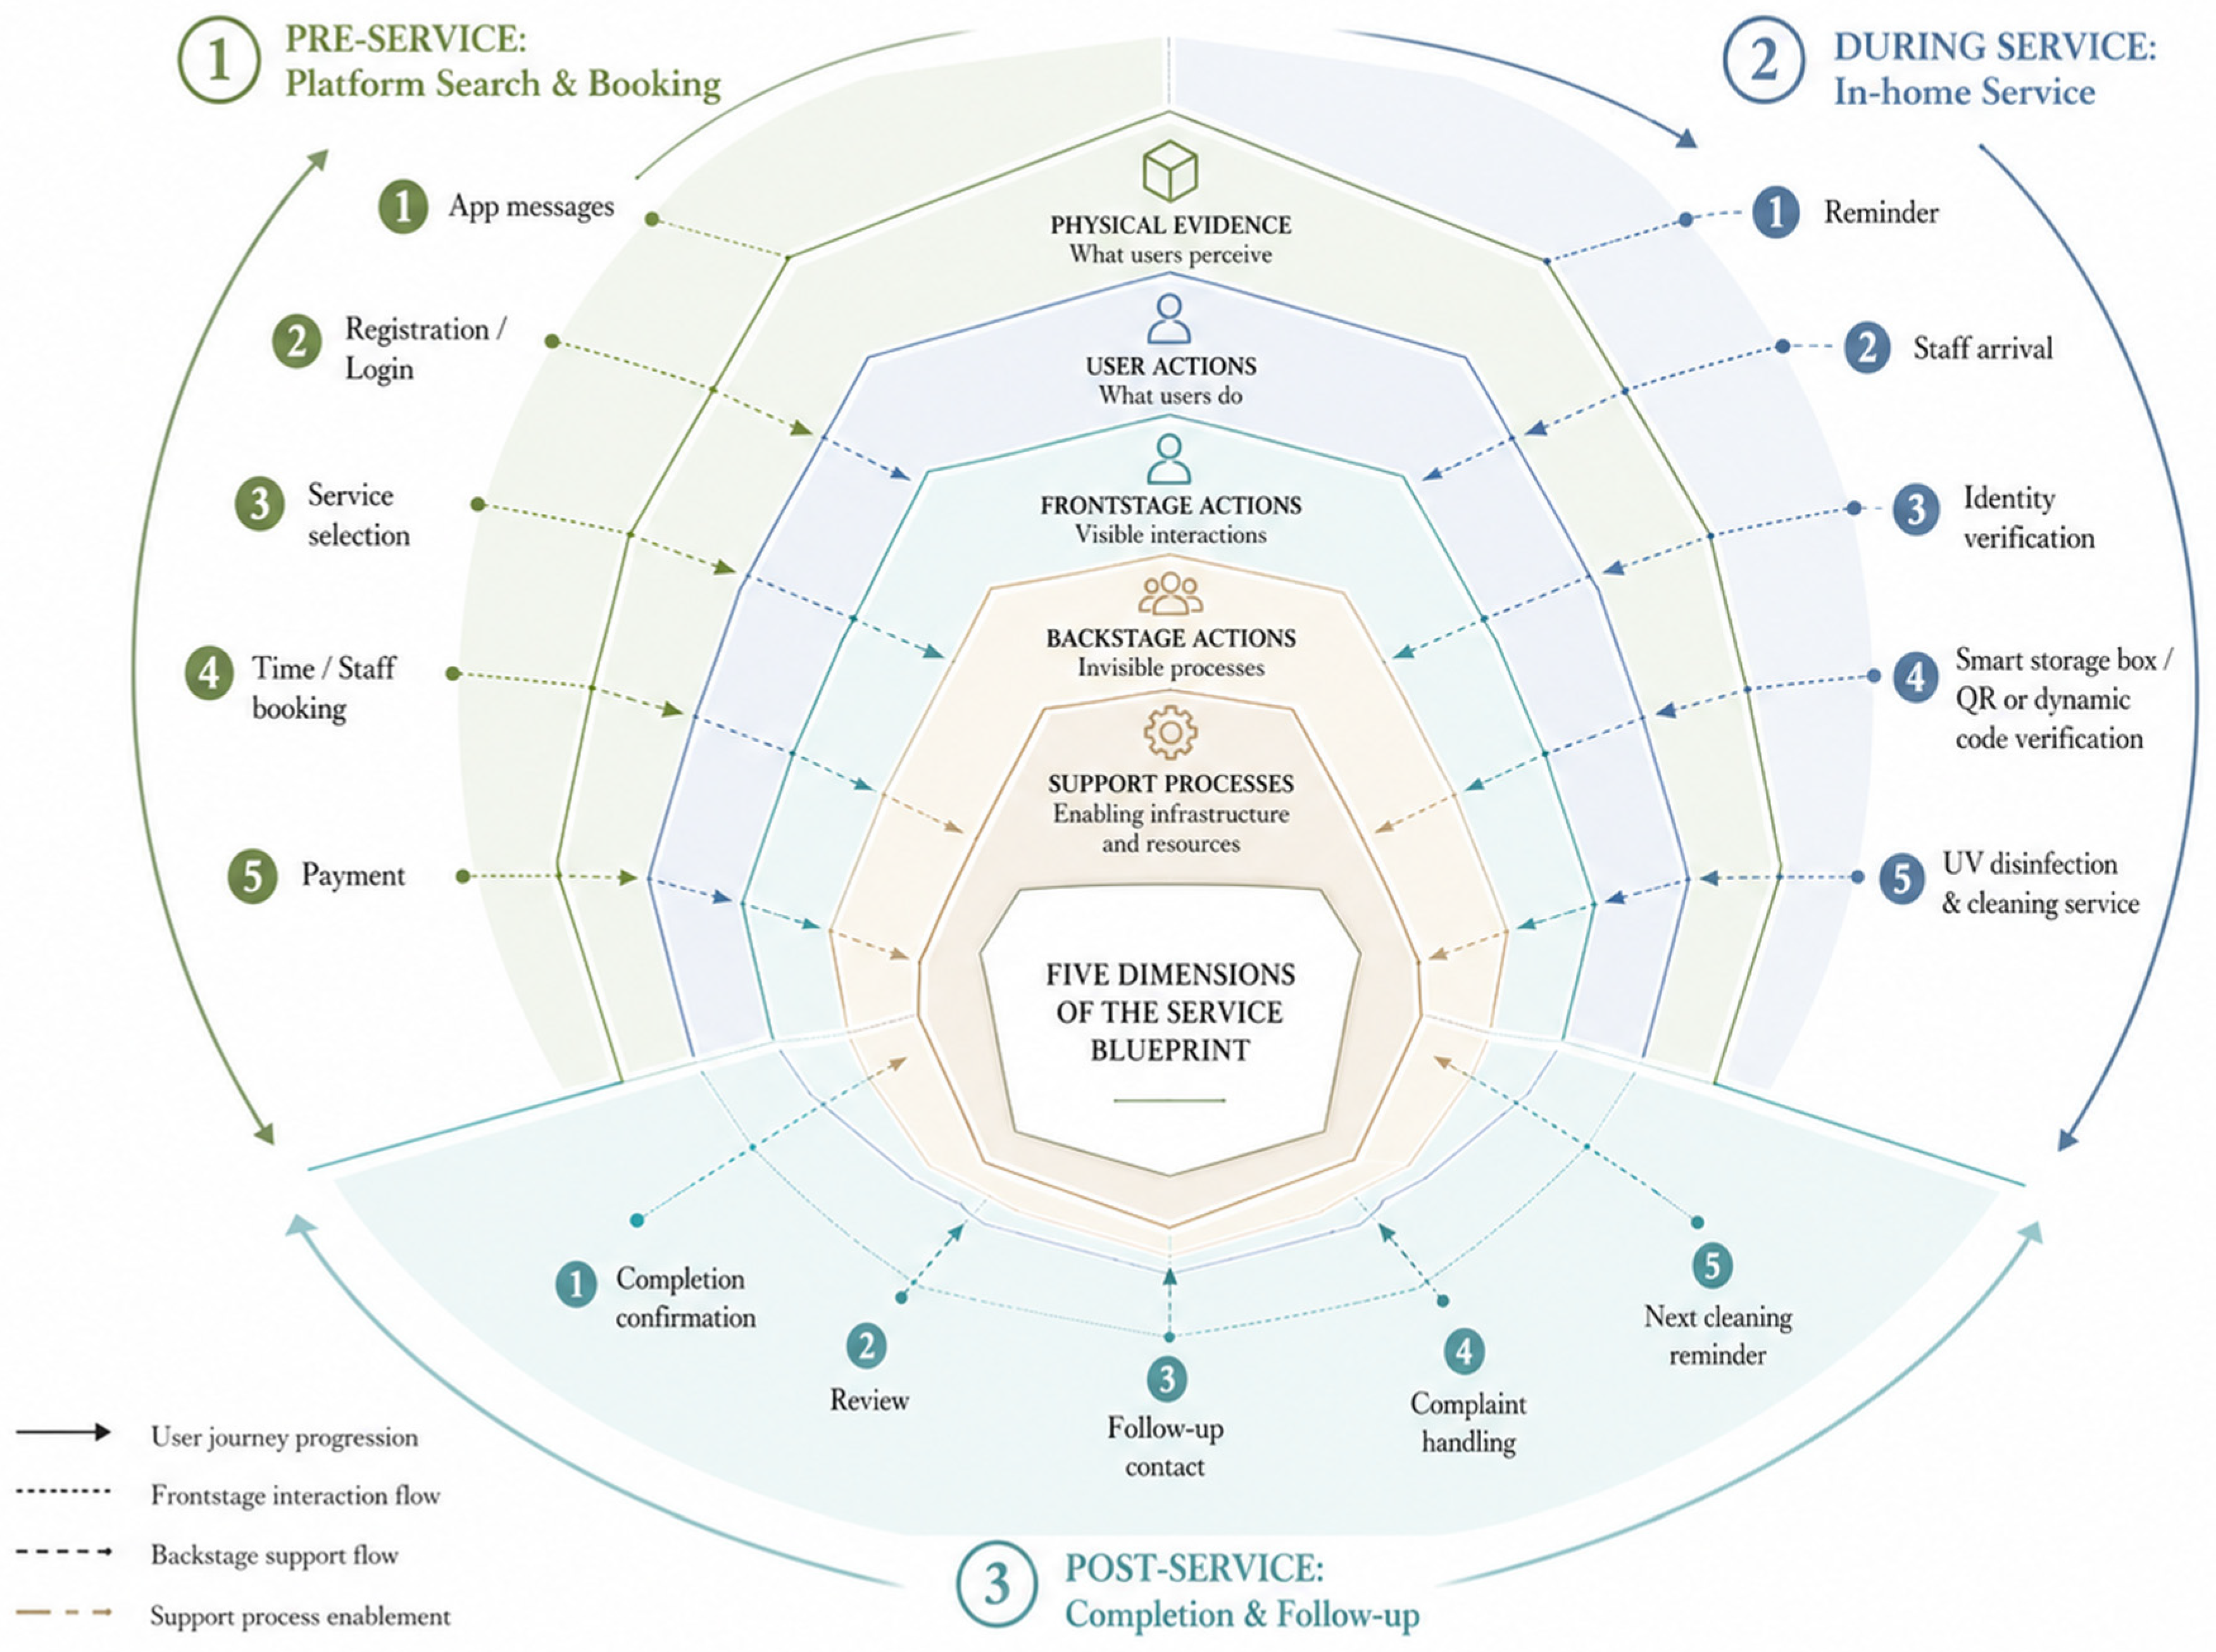

Disclaimer/Publisher’s Note: The statements, opinions and data contained in all publications are solely those of the individual author(s) and contributor(s) and not of MDPI and/or the editor(s). MDPI and/or the editor(s) disclaim responsibility for any injury to people or property resulting from any ideas, methods, instructions or products referred to in the content. |
© 2026 by the authors. Licensee MDPI, Basel, Switzerland. This article is an open access article distributed under the terms and conditions of the Creative Commons Attribution (CC BY) license.