


Abstract
Infrastructure is critical for mitigating flood impacts and supporting post-disaster recovery. However, comprehensive and validated approaches for evaluating urban infrastructure resilience (UIR) remain limited. A novel composite index system is developed based on the resilience dimensions of resistance, recovery capability, and adaptability, with both engineering and social infrastructure incorporated into the evaluation framework. An integrated AHP&EWM&KL-TOPSIS model is proposed to evaluate the UIR levels of nine cities in Fujian Province, China, over the period 2012–2021. The effectiveness and reliability of the integrated evaluation model were validated through cross-validation and comparative sensitivity analysis. Key findings reveal that the Environmental Protection System consistently exhibits the highest resilience with minimal inter-city variation across Fujian Province, whereas other infrastructure systems show significant disparities, suggesting effective province-wide environmental policies. In 2021, Fuzhou had the highest UIR, while Putian and Nanping showed the lowest. The UIR of Fujian exhibited a “higher in the south, lower in the north” spatial pattern, with enhanced regional coordination in Southern Fujian, and widening disparities within Eastern Fujian. This study provides practical guidance for policymakers and urban planners for identifying critical system-level vulnerabilities and spatial disparities, thereby supporting targeted resilience enhancement, balanced regional development, and improved flood preparedness.
1. Introduction
With the acceleration of global climate change and urbanisation, cities are experiencing an increasing frequency of flood disasters, causing significant losses to people’s lives and property [1]. Fujian Province incurred RMB 166.7 billion (USD 23.1 billion) in damages to properties and critical infrastructure systems, including transportation, communication, and drainage, due to flood between 2006 and 2021 [2]. In 2021, the economic losses in the Netherlands caused by flood disasters were estimated to range between €350 million and €600 million (USD 406 million–696 million) [3]. In times of emergency, the functionality of infrastructure system can be a determining factor for timely relief and rescue missions, which can mitigate the impact of flood on people and properties, as well as the post-disaster recovery effort [4]. The traditional concept of flood prevention only focuses on strengthening the physical facilities for flood prevention, such as reinforcing levees and improving drainage systems [5]. These measures require high financial and ecological costs. With the gradually increasing rainfall intensity in recent years, it is timely to reconsider the application of traditional flood prevention measures for a more cost-effective and sustainable measure for managing flood in cities.
The word resilience originated from a Latin word “resilio,” meaning “return to original state,” and was first used in material sciences for the ability of metals to restore their original state after being deformed by external forces [6]. The concept of resilience has gradually extended from the field of engineering to the field of humanities and society, including engineering resilience, ecological resilience, and social–ecological system resilience [5]. Cities have historically acted as centres of innovation and economic expansion, making substantial contributions to regional and national development trajectories [7]. In the context of global environmental changes and rapid urbanisation, various uncertain risks (for example: natural risk, social risk, political risk, economic risk and technological risk) have become important obstacles to urban security and sustainable development. Against this backdrop, the concept of urban resilience emerged as a response to growing urban risks and was first introduced by the International Council for Local Environmental Initiatives (ICLEI) in 2002 [8]. The concept of urban resilience emphasises proactive prevention and control from a dynamic developmental perspective, while also proposing alternative approaches to urban disaster risk management. In 2013, the Rockefeller Foundation initiated the 100 Resilient Cities programme to support cities in strengthening their capacity to cope with emerging challenges, including climate change, economic disruptions, and social instability, thereby improving their ability to adapt to and recover from various disturbances [9].
A city’s resilience to flood disasters demands concerted coordination among various construction works, including flood control facilities and urban transportation, communication, environmental protection, and medical care systems. This integrated approach serves as the foundational component for a resilient urban system. In contrast to traditional flood protection concepts, researchers have begun to focus on urban infrastructure resilience (UIR), emphasising the ability of urban infrastructure itself to adapt and transform crises while safeguarding physical facilities [10,11]. The concept of UIR is still not universally defined. Nonetheless, most studies concurred on three dimensions: resistance, recovery capability, and adaptability [12,13]. Drawing from the literature, UIR refers to the ability of urban infrastructure systems to resist damage, absorb negative impacts, and maintain the operation of critical functions when exposed to external disturbances such as natural events or human-induced disruptions. Through adaptation and learning, these systems can gradually restore their original functionality or even improve beyond their original operational state. The three dimensions of resistance, recovery capability, and adaptability are complementary rather than independent. Strong resistance can reduce the extent of damage and facilitate subsequent recovery, while effective recovery capability enables the rapid restoration of critical functions following disruption. Adaptability, in turn, strengthens both resistance and recovery capability by promoting learning, technological improvement, infrastructure upgrading, and institutional adjustment. Consequently, UIR can be understood as a continuous process of resisting disturbances, recovering functionality, and adapting to future challenges.
While previous UIR evaluations have focused on specific infrastructure components [7,14,15], they often lack an intrinsic perspective that comprehensively integrates both engineering and social infrastructure and fully captures the complex interdependencies and dynamic capabilities (resistance, recovery capability, adaptability) of disaster-resistant systems. Social infrastructure like healthcare and education are vital for human well-being and community recovery, yet often overlooked in purely engineering-focused assessments. For example, Kapucu et al. [14] applied a network governance perspective to study interdependent infrastructure systems such as water supply (wastewater), electricity, transportation, and telecommunications. Wang et al. [15] assessed the resilience levels of urban infrastructure systems in 283 Chinese cities from 2010 to 2019, which focused on energy supply, water supply and drainage, road transport, postal and telecommunications, landscaping and sanitation, and disaster prevention facilities. Alizadeh and Sharifi [7] analysed the resilience of critical water, electricity, and gas infrastructure networks in Ahvaz, Iran. Existing studies predominantly focused on engineering systems and emphasised resistance resilience. Consequently, the synergistic and interdependent relationships between social and engineering infrastructure, as well as comprehensive discussions on recovery capability and adaptability resilience, have received limited attention. This study addresses this gap by incorporating ten diverse infrastructure systems that collectively encompass resistance, recovery capability, and adaptability resilience, thereby offering a more comprehensive reflection of UIR and representing a key innovation of this research.
Considering the complexity of urban development, it is necessary to establish a comprehensive evaluation model to serve as the foundation for the synchronised and coordinated development of cities. A resilience evaluation model that considers the overall infrastructure system as the research object refers to the quantification of resilience through the construction of an index system and the selection of specific evaluation methods, to gauge the resilience level of different cities in different periods based on a standardised criterion. Determining the weighting of individual indicators or dimensions is a challenging process, as it reflects the relative importance of each indicator to the subject. The commonly used index weighting methods are mainly divided into three categories: subjective weighting method, objective weighting method and combined weighting method. The subjective weighting method is mainly applied for evaluating qualitative data such as personal judgement of experts or decision-makers. The common subjective weighting methods include Delphi method [16], Analytic Hierarchy Process (AHP) [17], Ordinal Priority Approach (OPA) [18], and Analytic Network Process (ANP) [19]. The objective weighting method uses mathematical methods to calculate the weight of indicators, focusing on the information provided by the numbers themselves, independent of the subjective perspective of people. Common objective weighting methods mainly include entropy weight method (EWM) [20], Criteria Importance Through Intercriteria Correlation (CRITIC) [21], standard deviation method [22] and so on. It is necessary to integrate objective and subjective weights, as subjective weighting methods ignore the performance ratings of the alternatives with respect to different criteria, while objective weighting methods overlook the decision-maker’s experience [23]. Existing studies employed various combinations to determine weights, such as AHP–EWM [24], ANP–EWM [25], and AHP–CRITIC [26]. The advantage of such combinations lies in their ability to integrate expert judgments with objective data characteristics, thereby producing weight results that more accurately reflect real-world conditions. The combination of AHP and EWM can effectively reduce the deviation in evaluation results, making it one of the most widely used weight integration approaches [27]. Hence, this study integrated AHP and EWM to determine the comprehensive weights of the indicators.
Various resilience evaluation methods are customised for specific applications, making it necessary to validate their applicability when used in a new context [1]. The academic community commonly employed methods such as the Delphi survey approach [12], Integrated Assessment Model (IAM) [21], VlseKriterijumska Optimizacija I Kompromisno Resenje (VIKOR) [28], Technique for Order Preference by Similarity to an Ideal Solution (TOPSIS) [25], fuzzy comprehensive evaluation [29], and BP neural network [30] to evaluate resilience.
This study develops a composite index system and AHP&EWM&KL-TOPSIS integrated multi-criteria evaluation model to measure the UIR of nine cities in Fujian Province, aiming to assist decision-makers to inform targeted optimisation strategies. Although the individual methods employed have been applied in resilience assessment, the methodological contribution of this study lies in their systematic integration within a flood-oriented resilience framework. To ensure the reliability and practical relevance of the proposed evaluation method, this study integrates cross-validation with existing resilience models in Fujian Province and conducts a comparative sensitivity analysis against EWM-CIM and CRITIC-IAM models. This study adopts TOPSIS as the resilience evaluation method, which orders the solutions based on distance from the ideal solution. Specifically, a smaller distance to the positive ideal solution indicates higher resilience, while a smaller distance to the negative ideal solution indicates lower resilience [31]. This method aligns well with the relative nature of resilience and has the advantages of making full use of the original data with minimal information loss, making it a commonly used and effective method in multi-objective decision analysis [32]. However, the TOPSIS method is unable to distinguish the distance of the positive and negative ideal points on the vertical line due to the symmetry of the Euclidean distance formula employed, potentially leading to inaccurate ranking of alternatives that are equidistant from both ideal points. Therefore, this study applies the asymmetric Kullback–Leibler (KL) distance formula instead of the Euclidean distance formula to ensure that the evaluation results are more accurate and reasonable, hence referred to as KL-TOPSIS.
Due to the high complexity of infrastructure systems and limitations in data availability, certain deficiencies remain in the model. Currently, the impacts of dynamic environmental changes (e.g., climate change) and human responses at the individual level are not incorporated into the model. However, a multidimensional resilience index system was established based on the concept of infrastructure resilience, with a focus on both engineering and social infrastructure systems. It should be noted that the AHP&EWM&KL-TOPSIS model adopted in this study is a multi-criteria decision-making evaluation framework rather than a predictive modelling approach. The model is designed to evaluate and compare the relative levels of UIR based on historical data from 2012 to 2021. Based on the evaluation outcomes, targeted resilience enhancement priorities are identified for different cities in Fujian Province, providing practical support for disaster risk reduction and infrastructure planning under increasing flood risks.
2. Methodology
2.1. Framework for the UIR Model
Figure 1 provides the framework for the UIR model. This study uses AHP for subjective weighting, EWM for objective weighting, and combines AHP and EWM for combined weighting. The combined weighting approach ensures that both expert opinion and empirical data are accounted for, enhancing the reliability of the model. To address the issue of distinguishing the distance between the positive and negative ideal points on the vertical line in the traditional TOPSIS method, the KL-TOPSIS method is applied to evaluate the UIR of Fujian Province against flood disasters from 2012 to 2021.
Figure 1.
Process flow of AHP&EWM&KL-TOPSIS evaluation.
2.2. Development of UIR Index System
To more comprehensively reflect the concept of UIR, this study incorporates the scope of infrastructure systems as defined in the “Standard for basic terminology of urban planning.” It proposes that the infrastructure systems considered in this research include the Energy Supply System (ESS), Water Supply System (WSS), Drainage System (DS), Transportation System (TS), Disaster Prevention and Safety System (DPSS), Environmental Protection System (EPS), Post and Telecommunications System (PTS), Medical and Health System (MHS), Cultural and Educational System (CES), and Science and Technology System (STS).
This study established an UIR evaluation index system for responding to flood disasters, based on a review of the existing literature, expert consultations, and adherence to the criterion of scientific, comprehensive, independent, and measurable, as shown in Table 1. Scientific criterion refers to the ability of indicators to directly or indirectly reflect the relevance to the content of the study, and to maintain a pragmatic and objective attitude in the process of indicator selection. Comprehensive criterion is reflected in the need to cover the full range of characteristics of urban resilience. Independent criterion means that the boundaries among evaluation indicators should be clear and unambiguous, avoiding highly correlated indicators with similar meanings and expressions. Measurable criterion refers to the ability of an indicator to be quantified in terms of specific values and to have access to data with a high degree of confidence.
Table 1.
Evaluation index system of UIR in response to flood disaster.
This system organises resilience into three main criteria: resistance, recovery capability, and adaptability. The resistance dimension includes the ESS, WSS, DS, TS, and DPSS. These systems primarily provide essential protective and operational functions before and during flood events, helping cities withstand disturbances, maintain basic services, reduce exposure, and minimise immediate losses. The recovery capability dimension comprises the EPS, PTS, and MHS. These systems play a critical role in post-disaster response and restoration by supporting emergency communication, healthcare services, environmental remediation, and the rapid restoration of normal urban functions. The adaptability dimension includes the CES and STS. These systems primarily enhance long-term learning, innovation, knowledge dissemination, technological advancement, and institutional adaptation, thereby improving the city’s capacity to adjust to future flood risks and evolving environmental conditions. Although each infrastructure system may simultaneously contribute to resistance, recovery capability, and adaptability, resilience studies commonly classify infrastructure components according to their dominant function within the disaster management cycle. Following this principle, the present study assigns each infrastructure system to the resilience dimension in which it makes its primary contribution under flood disaster conditions. This approach facilitates the construction of the index system and the analysis of resilience dimensions while recognising the interdependent nature of the three resilience dimensions. The index layer I includes ten infrastructure systems, each comprising index layer II representative indicators. Although some indicators may also reflect the level of socioeconomic development, they were selected based on their established relevance to the ability of urban infrastructure systems to resist, recover from, or adapt to flood-related disturbances. Therefore, the indicators were classified according to their dominant contribution to resilience rather than their development attributes alone. For example, C2 (Electricity usage per capita) reflects the operational capacity and reliability of the ESS, which supports the continuous functioning of critical infrastructure during flood events and thereby strengthens resistance to disruptions. C26 (Number of college students per 10,000 people) reflects the level of human capital and educational resources, which enhance learning capacity and facilitate adaptation to evolving flood risks. C29 (Number of patents granted per 10,000 people) reflects technological innovation capacity, which supports the development and adoption of adaptive technologies and strategies for addressing future flood challenges. Detailed formulas for calculating these indicators and data sources are presented in Table 1. Existing research has progressed in establishing urban resilience indicators, but has yet to standardise an evaluation system. The evaluation index system developed in this study is used for evaluating the UIR of cities in Fujian Province.
2.3. AHP&EWM&KL-TOPSIS Evaluation Model
2.3.1. Subjective Weighting Using AHP
Subjective weighting assesses the relative importance assigned by experts to the systems and indicators of UIR. The subjective weighting obtained through AHP is helpful for evaluating the significance of various infrastructure systems and analysing differences in UIR based on perception. The basic steps of AHP [43] are as follows (see Figure 1).
First, a judgement matrix compares indicators to show their relative importance. Twenty experts were invited to assign importance scores to the various factors affecting UIR through the “Wenjuanxing” online survey platform. The experts come from fields such as resilient cities, flood disaster management, emergency management, urban governance, engineering management, and urban planning. Based on the experts’ ratings, this study makes two-by-two judgements on the same layer of elements affecting the UIR, and establishes a judgment matrix, as shown in Equation (1). A square judgement matrix for a criterion layer (e.g., Resistance) is constructed based on the number of sub-criteria in index layer I (e.g., five systems for Resistance, requiring a 5 × 5 matrix). Similarly, for each system in index layer I (e.g., ESS), a judgement matrix is constructed based on the number of indicators in index layer II (e.g., three indicators for ESS, requiring a 3 × 3 matrix). The judgement matrix constructed for each expert’s rating must pass the consistency test prior to calculating a comprehensive judgement matrix A using the geometric mean (Files S1–S3).
where n represents the number of evaluation indicators; denotes the relative importance of indicator i compared to j, based on a 1–9 scale (see Table 2).
Table 2.
AHP evaluation scale description [43].
After constructing the judgement matrix, weighting coefficients of the indicators can be determined using the square root method:
Then, the weighting, , of the indicators can be calculated from:
The eigenvectors of the judgement matrix, , can be next computed, where , (j = 1, 2, …, n).
Following this, the maximum eigenvalue of the judgement matrix ( is subsequently used in the consistency test to ensure the logical coherence of the pairwise comparisons.
Subsequently, a consistency test is performed on the judgement matrix.
CI denotes the consistency index calculated using:
CR denotes the consistency ratio obtained from Equation (6), which is used to assess the consistency of the judgement matrix.
When CR < 0.1, the consistency test is satisfied. Otherwise, the judgement matrix needs to be reconstructed.
Once the consistency requirement is satisfied, the weighting relative to the target layer () is calculated.
Based on the structural hierarchies in Table 1, the hierarchical weighting of the criterion layer, index layer I, and index layer II are multiplied to obtain the subjective weighting relative to the target layer, . For example, the weighting of Resistance, ESS, and C1 in the corresponding criterion layer are multiplied to obtain the subjective weighting of C1 relative to the target layer. In this study, SPSSAU software (Version 25.0) is utilised to compute the subjective weighting.
2.3.2. Objective Weighting Using EWM
Objective weighting methods utilise statistical or information-theoretic approaches to determine the relative importance of each indicator based on the evaluation data, by calculating the variability or information contribution of each indicator within the dataset. EWM is applied for determining the objective weighting, computed using Microsoft Excel. And EWM focuses on the uncertainty factors of the evaluation database, which helps to build a stable comprehensive evaluation system. The specific determination steps of EWM [20] are as follows (see Figure 1).
The raw indicator data matrix, X, is first constructed as the basis for subsequent normalisation and entropy calculations.
where m denotes the number of evaluation objects, n represents the number of indicators, and is the raw data of the i-th object on the j-th indicator.
Since the chosen indicators differ in units and scales, they are normalised to transform them into a common measurement basis. The vector normalisation method is applied, using Equation (8) for positive indicators and Equation (9) for negative indicators. For positive indicators, higher values indicate better performance, whereas for negative indicators, lower values indicate better performance.
where is the normalised matrix; i represents the evaluation object; and j is the evaluation indicator.
Subsequently, the proportion of the sample value for the i-th city under indicator j relative to the sum of that indicator across all cities is calculated according to Equation (10).
Based on these proportions, the entropy value of the j-th indicator is determined using Equation (11). The entropy value, , reflects the degree of dispersion of the indicator’s values across all cities, thereby indicating its information content. The smaller the variation in indicator values, the larger the , indicating that the indicator provides less discriminatory information (and thus a smaller weight). The greater the variation, the smaller the , indicating that the indicator provides more discriminatory information (and thus a larger weight).
where k = 1/ln(m) > 0 and m is the total number of cities.
Following this, information entropy redundancy, , represents the degree of useful information provided by the j-th indicator and is calculated as Equation (12). A larger indicates greater discriminatory power of the indicator across the cities.
Finally, the objective weighting, , is obtained by computing the contribution of . A larger implies that the indicator contributes more to the evaluation results.
2.3.3. The Calculation Steps of KL-TOPSIS
The employed specific calculation steps of the KL-TOPSIS method take the following procedure [20]:
Data normalisation is first performed following the procedure described in the EWM method. Then, the combined weighting of the resilience index is calculated by averaging the respective subjective and objective weighting values, as shown in Equation (14). A subjective weighting of the UIR index for flood disasters is obtained by the AHP method, denoted as . The objective weight of the UIR index for flood disasters is obtained using the EWM method, denoted as .
Referring to Figure 1, the subjective, objective, and combined weighting of the UIR evaluation indicators is determined. Subsequently, using the weighted normalisation method, the combined weighting for both the criterion layer and index layer I are obtained, as shown in Table 3. Taking ESS as an example, the corresponding index layer I weighting C1 is obtained by dividing the combined weighting of C1 by the sum of the combined weighting of C1, C2, and C3.
Table 3.
Combined weighting of indicators for UIR.
Next, a weighted normalised decision matrix, , is established as Equation (15).
where is the weighting matrix and is the normalised matrix, which were defined in Equations (8) and (9); i represents the evaluation object, and j represents the evaluation indicator.
Following this, the positive and negative ideal solutions are determined. The positive ideal solution, , consists of the best values for each indicator, while the negative ideal solution, , consists of the worst values. For a positive indicator, takes the maximum value of the indicators and takes the minimum value, as given in Equations (16) and (17).
For a negative indicator, takes the minimum value of the indicators and takes the maximum value, as given in Equations (18) and (19).
The KL distance is then used to measure the separation of each alternative from and .
where is the positive ideal solution, is the ordinary solution, and is the negative ideal solution. is the distance from the positive ideal solution and is the distance from the negative ideal solution.
Finally, the degree of fit to the idealised target is calculated using Equation (22).
The performance evaluation result is expressed by the degree of fit, which ranges from 0 to 1. When the value is closer to 1, it is closer to the positive ideal point, indicating that the resilience level of urban infrastructure is higher; when the value is closer to 0, it is closer to the negative ideal point, indicating that the level of urban infrastructure is lower. These values are applied for classifying the level of UIR using an ArcGIS 10.2 tool, which utilises the natural breaks classification method. The natural breaks classification method is an objective statistical classification technique that sorts and groups data based on the patterns of its statistical distribution, and determines the optimal breakpoints by iteratively comparing the sum of squared deviations within and between groups, thereby achieving homogeneity of attributes within groups and maximising differences between groups [44]. The ArcGIS 10.2 tool classifies UIR into five levels, i.e., higher resilience, high resilience, moderate resilience, low resilience, and lower resilience [15]. It is important to note that UIR levels are relative to each city’s resilience development within the same period. Thus, cities with the same resilience category in different years have different actual resilience values.
2.4. Model Reliability Verification
This study employs cross-validation to evaluate the reliability of the AHP&EWM&KL-TOPSIS model. Cross-validation is a widely used validation technique that involves comparing the outcomes of the target model with those obtained from an alternative model addressing the same matter [31]. Considering that Lin [44] similarly evaluated UIR in Fujian Province using EWM-CIM (Composite Index Method), a cross-validation is conducted by comparing the evaluation results of the AHP&EWM&KL-TOPSIS model with those reported by Lin [44]. The comparison focuses on identical infrastructure systems in both studies, namely ESS, WSS, DS, TS, EPS, and PTS. A Pearson correlation coefficient, , is determined to investigate the potential relationship between the two sets of results:
where and denote the UIR values of the two cities in year i; and represent their respective mean UIR values over the study period; and n is the total number of years included in the comparison.
The interpretation should be contextualised based on the research domain and objectives. Typically, a Pearson correlation coefficient below 0.1 indicates a negligible correlation, between 0.1 and 0.39 indicates a weak correlation, 0.4 to 0.69 a moderate correlation, 0.7 to 0.89 a strong correlation, and 0.9 to 1.0 a very strong correlation [45].
In addition to cross-validation using Pearson correlation analysis by SPSS Statistics 27.0.1, a comparative sensitivity analysis is performed to further evaluate the robustness of the evaluation model. Specifically, the results generated by the AHP&EWM&KL-TOPSIS model are compared with those obtained from the EWM-TOPSIS, EWM-CIM, and CRITIC-IAM models, which employ different weighting schemes and evaluation approaches. This comparison is designed to assess the stability and reliability of the AHP&EWM&KL-TOPSIS model.
2.5. UIR Spatial Distribution Map
A spatial distribution map is then plotted using the ArcGIS 10.2 software to visually represent the UIR levels of various cities by mapping them onto geographic space using colours, symbols, and other visual elements. This visualisation helps reveal spatial disparities and imbalances in UIR across different cities, providing intuitive support and a decision-making basis for formulating city-specific disaster prevention strategies and optimising resource allocation.
3. Results and Discussion
3.1. Reliability of Model
To verify the reliability of the AHP&EWM&KL-TOPSIS evaluation model, this study conducts cross-validation on the empirical results. Based on the same infrastructure system, the UIR results for 2013–2019 from two studies are shown in Table 4. SPSS Statistics 27.0.1 analysis shows the Pearson correlation coefficient between the two results is calculated to be 0.975 (statistically significant at the 0.01 level), implying that the AHP&EWM&KL-TOPSIS evaluation model demonstrates strong concordance with existing UIR assessments for the region.
Table 4.
Comparison of two studies on the level of UIR in Fujian Province.
3.2. Evaluation of Resilience Level
Analysing resilience levels from a systemic perspective helps identify disparities among different infrastructure systems within the same city and the variations and interconnections of the same system across different cities. The resilience level of the system is evaluated based on the combined computation of expert opinion and statistical data (Table 1) with weighting of indicators (Table 3). The UIR values of the ten systems in 2021 (Table 5) are obtained using the AHP&EWM&KL-TOPSIS model, and the natural breaks classification method of the ArcGIS is applied to categorise them into different levels (Figure 2). The UIR value is a relative indicator specific to the dataset of each system; therefore, resilience levels are determined by classifying these UIR values using the natural breaks method in ArcGIS. The resilience levels of different systems within the same city vary (see Table 5). There are two ways of interpreting the values, i.e., by system and city. The data for all indicators of the ten systems are from the year 2021, with detailed sources provided in Table 1.
Table 5.
Resilience values of ten infrastructure systems in 2021.
Figure 2.
Resilience levels of ten infrastructure systems in 2021.
3.2.1. Resilience Level by System
Analysis of resilience level by system can identify the variation in respective systems in different cities, to facilitate well-informed decisions for inclusive development plans for the cities in line with the aspiration of the UN Sustainable Development Goals.
- (1)
- ESS
ESS supports the resistance of a city against flood by sustaining operation through a flood event. The resilience level in ESS ranged from 0.623 (Nanping) to 0.896 (Quanzhou). Both cities recorded an “Urban gas penetration rate” greater than 98.5%; however, the variation in resilience level in this case was mainly attributed to the disparity in hydropower and electricity availability. Power systems are highly vulnerable during extreme events such as flood, and failures can trigger cascading urban dysfunctions [46]. Specifically, Quanzhou’s “Water supply per capita” was approximately 1.6 times that of Nanping, and its “Electricity usage per capita” was about 1.3 times higher. These indicators reflect a more reliable and redundant energy infrastructure in Quanzhou, enabling more effective support for critical systems such as healthcare, drainage, communication, and emergency shelters during flood events. In contrast, Nanping’s lower ESS is reflected by more frequent service disruptions, slower emergency responses, and prolonged recovery times. For example, on 18 June 2022, the operations in Nanping were crippled by a prolonged power outage resulting from the complete collapse of No. 1 transformer and poles on the 10 kV Helong Line. Repairs commenced after water levels receded the following day. In the case of Putian, the ESS resilience value is reflected by other factors such as outdated infrastructure and limited investment, which indicates that improving these factors can enhance the city’s ESS resilience.
- (2)
- WSS
WSS supports the resistance of a city by maintaining stable water provision, thereby ensuring daily household consumption and the operation of critical facilities. The post-disaster functionality of WSS is vital to public health and other essential services, and system failures may trigger cascading impacts [47]. Longyan emerged as the leading city in terms of WSS resilience, whereas Ningde lagged behind and recorded the lowest resilience level. Longyan’s “Urban water supply pipe density” was approximately three times higher than that of Ningde, and the denser network proved more effective in sustaining water supply and public services during flood events. Ningde’s sparse pipeline and low disaster resistance capacity resulted in pump station inundation, water supply interruptions, and critical pressure drops across urban areas during heavy rainfall. Alizadeh & Sharifi [7] conducted a spatial analysis of the resilience of the water supply infrastructure network in Ahvaz, Iran, and found that water supply resilience increases with greater distance from the city centre. This pattern is mainly attributed to the fact that infrastructure facilities in peripheral areas are relatively newer and less affected by ageing. Their case highlights that infrastructure deterioration is a critical factor influencing the resilience of water supply systems. In contrast, the present study further emphasises the importance of pipeline network density and system redundancy in maintaining water supply continuity under flood conditions. Together, these two studies reveal the driving mechanisms of water supply system resilience from different perspectives, providing complementary insights for enhancing the resilience of water supply system in response to flooding.
- (3)
- DS
DS supports the resistance of a city by rapidly discharging stormwater, alleviating waterlogging pressure, ensuring road accessibility, and maintaining the operation of critical facilities. Lei et al. [5] emphasised that DS should be placed at the core of urban flood management planning, given its integral role in mitigating flood risks. Resilience levels of DS varied considerably across cities, with Putian and Zhangzhou outperforming other cities and Sanming showing the weakest resilience performance. Although the “sewage treatment rate” exceeded 98% in Putian, Zhangzhou, and Sanming, differences in “urban drainage pipeline density” emerged as the primary factor explaining the disparity. Specifically, the density was approximately 2.8 times higher in Putian and 2.0 times higher in Zhangzhou than in Sanming. Additional factors influencing DS resilience include the design standard of waterlogging prevention, the rationality of pipeline network layout, the flood resistance of pumping stations and sluice gates, the degree of ageing infrastructure renewal, drainage system management practices, and the application of intelligent technologies. For instance, Putian and Zhangzhou adopt a 30-year drainage design standard, whereas Sanming follows a 20-year standard. The higher design standard enhances flood conveyance capacity and may partly explain the stronger DS resilience observed in Putian and Zhangzhou [48].
- (4)
- TS
TS supports the resistance of a city by maintaining transportation infrastructure operability, enabling evacuation, ensuring emergency access, and facilitating efficient logistics. A clear contrast was observed among the cities, with Xiamen achieving the highest TS resilience level, whereas Zhangzhou exhibited the lowest level of resilience. Although both cities have comparable per capita road area, the enhancement of emergency evacuation and resource allocation during flood events is attributed to Xiamen’s more advanced public transport and logistics systems. In contrast, Zhangzhou’s TS resilience is constrained by the relative underdevelopment in these areas. Additional determinants of TS resilience are considered to include the structure and redundancy of the road network, the disaster resistance of key infrastructure nodes, the development of multimodal transport systems, the presence of emergency traffic management mechanisms, and the effectiveness of maintenance practices. For example, a ring road system composed of the second, third, and outer ring highways was established in Fuzhou, through which multiple alternative routes are provided to enhance traffic continuity and diversion capacity during disasters. Moreover, the integration of diverse transportation modes and the implementation of a cross-sector emergency traffic coordination mechanism are identified as key factors contributing to the higher TS resilience observed in Fuzhou.
- (5)
- DPSS
DPSS supports the resistance of a city by providing flood forecasting, enabling emergency response, and facilitating disaster management. Existing studies strengthened DPSS resilience by optimising reservoir operations [49] and improving flood monitoring capabilities [50], highlighting its role as a critical line of defence during flood events. Among all cities, Zhangzhou demonstrated the strongest DPSS resilience (0.513), while Xiamen exhibited the weakest performance (0.001). Although Zhangzhou has a smaller land area than Xiamen, it demonstrated superior advantages in both hydraulic infrastructure and financial investment. Specifically, Zhangzhou was equipped with 13 hydrological stations and a total reservoir capacity of 848 million m3, substantially surpassing Xiamen’s two stations and 175 million m3. Furthermore, its “investment in water conservancy as a percentage of GDP” was approximately 4.5 times that of Xiamen. Enhanced early warning capacity, increased water storage regulation, and improved construction and maintenance of flood control infrastructure were facilitated by advantages in hydrological monitoring, reservoir regulation, and financial input, thereby strengthening emergency dispatch and flood response efficiency. Xiamen’s limited hydraulic infrastructure and insufficient investment severely constrained its capacity to effectively respond to extreme rainfall, thereby weakening its DPSS resilience. Additionally, disparities in factors such as levee height, monitoring technology, emergency planning, material reserves, and repair capabilities have been identified as key contributors to inter-city differences in DPSS resilience.
- (6)
- EPS
EPS supports the recovery capability of a city by restoring ecological functions, controlling pollution, and ensuring environmental safety. EPS resilience values varied from 0.823 in Ningde to 0.999 in Putian, indicating a high resilience level, likely resulting from the ecological civilisation effort across Fujian Province to increase green coverage in built-up areas and per capita public green space nationwide. It concurs with the finding by Chen et al. [33] on the ecological dimension in Fujian Province using a Bayesian network. Komeh et al. [51] pointed out that unsustainable urbanisation has led to an approximate 2 °C increase in temperature, with the most pronounced rise occurring in areas where forests were cleared for development, whereas regions with vegetation restoration exhibited almost no change. Conley et al. [52] indicated that a 10% increase in urban greening coverage could lead to an approximate 3.8% reduction in stormwater runoff. Damage to the urban environment and infrastructure during flood events is mitigated by the green infrastructure system through runoff reduction. A solid foundation is provided for post-disaster ecological restoration, water purification, and the recovery of living environments, thereby enhancing the city’s recovery capability resilience.
- (7)
- PTS
PTS supports the recovery capability of a city by restoring communication services, ensuring information flow, and supporting emergency coordination. Xiamen recorded the highest PTS resilience level, whereas Zhangzhou exhibited the lowest. Xiamen demonstrated higher levels of “Internet coverage,” “Mobile phone coverage,” and “Number of internet broadband users per 10,000 people” than Zhangzhou, exceeding by 22%, 19.4%, and 888 users per 10,000 people, respectively. These indicators reflect stronger communication assurance and emergency coordination capabilities in Xiamen, which have better supported post-disaster rescue operations, resource allocation, and social order restoration. Zhangzhou’s relatively weaker communication recovery capacity was found to hinder rescue efficiency. Following the impact of Typhoon Doksuri, the communication infrastructure was damaged in parts of Fujian Province. Due to communication disruptions in Zhangzhou, emergency repairs were accelerated under provincial supervision, while Xiamen’s rapid response practices were promoted across the province. In addition, disparities in PTS resilience across cities are attributed to factors such as the resistance of communication infrastructure, redundancy design, level of intelligence, and emergency planning. For example, Fuzhou is equipped with a dedicated flood control network, which enables the rapid activation of satellite communication and multimedia platforms when trunk lines are disrupted, ensuring high PTS resilience [53].
- (8)
- MHS
MHS supports the recovery capability of a city by ensuring medical services, facilitating post-disaster treatment and epidemic prevention. MHS showed significant inter-city differences, with inland cities like Sanming, Longyan, and Nanping scoring 0.959, 0.950, and 0.918, respectively—higher than those of coastal cities. This aligns with the findings of Chen et al. [33], who noted that per capita medical resources are a strength of inland cities. For example, these three cities rank among the top in the province in terms of “Number of medical technical personnel per 10,000 people” and “Number of beds in health institutions per 10,000 people,” which enables them to swiftly carry out medical treatment and epidemic prevention after flood disasters, improve treatment efficiency, relieve pressure on medical facilities, and effectively respond to secondary risks such as infectious diseases. It was acknowledged that population characteristics have a direct impact on MHS resilience [54]. According to the Seventh National Population Census of Fujian Province [55], the ratio of permanent residents in coastal to inland cities was 4.534, up from 4.026 in the Sixth Census [56]. The continued population outflow from inland areas has eased the pressure on the demand for medical resources. Xiamen has the lowest MHS resilience value, due to its attractiveness as a special economic zone, which has drawn a large influx of people, thereby placing a heavier burden on the medical system.
- (9)
- CES
CES supports the adaptability of a city by enhancing public risk awareness, promoting disaster education, and strengthening emergency preparedness. Historical educational strategies are identified as a critical pathway for promoting more sustainable flood risk mitigation approaches [57]. CES resilience levels varied considerably across cities, with Fuzhou and Xiamen outperforming other cities, while Ningde exhibited the weakest resilience performance. The superior performance of Fuzhou and Xiamen can be attributed to their abundant higher education resources, advanced educational informatisation, and substantial fiscal investment, which collectively support disaster education, scientific innovation, and public risk awareness. For instance, “Number of college students per 10,000 people” reached 459 in Fuzhou and 338 in Xiamen, substantially exceeding the figure of 54 recorded in Ningde, reflecting the advantages of Fuzhou and Xiamen in talent cultivation and knowledge dissemination. Ningde has relatively limited cultural and educational resources, with a small number of higher education institutions and lagging development in educational informatisation, which hinders the dissemination of disaster prevention knowledge and the improvement of public emergency awareness, thereby weakening its ability to adapt to environmental changes and adjust after disasters.
- (10)
- STS
STS supports the adaptability of a city by promoting infrastructure optimisation and improvement of emergency response mechanisms. Zhong et al. [58] indicated that technological resilience played a pivotal role in enhancing urban capacity to cope with flood disasters, potentially outweighing improvements in economic and built environment conditions. Bukhari et al. [50] emphasised that the adoption of technologies such as the Internet of Things (IoT), remote sensing, machine learning, and early warning systems could significantly strengthen disaster monitoring and response capabilities, thereby mitigating the impacts of flooding. STS resilience showed considerable inter-city variation, with Nanping recording the lowest value (0.098) and Xiamen achieving the highest (1.000). These differences were primarily attributed to variations in fiscal investment, industrial structure, and the allocation of technological resources. Xiamen’s “Expenditure for science as a percentage of fiscal spending” was six times greater than that of Nanping, and “Number of patents granted per 10,000 people” was approximately four times higher, reflecting its strong innovation capacity and substantial R&D investment. Xiamen leverages its high level of STS resilience to promote intelligent infrastructure upgrades and the optimisation of early warning systems, while transforming post-disaster experiences into institutional and technological innovations, thereby fostering a virtuous cycle of “learning–adjustment–optimisation” and continuously enhancing its post-disaster improvement capability.
Figure 3 compares the 2021 DPSS resilience values calculated using the AHP&EWM&KL-TOPSIS model proposed in this study with those obtained using the EWM-TOPSIS model by Ji and Wang [20]. Ji and Wang [20] determined indicator weights using the EWM and applied the traditional TOPSIS model to evaluate urban flood resilience. Although differences exist in the resilience values obtained from the two models, the consistency in city rankings validates the robustness of the AHP&EWM&KL-TOPSIS model in resilience evaluation. Furthermore, correlation analyses were conducted between the resilience values derived from both models and the original values of key indicators C10, C11, C12, and C13 (see Table 6). The results indicate that the AHP&EWM&KL-TOPSIS model exhibits stronger correlations with these key indicators, suggesting that it outperforms the EWM-TOPSIS model in terms of data fitting and explanatory power. These findings suggest that the AHP&EWM&KL-TOPSIS model has stronger explanatory capability and better consistency with the selected key indicators, supporting its applicability for UIR evaluation.
Figure 3.
Comparison of DPSS resilience value for the two models.
Table 6.
Correlation analysis between DPSS (2021) and original indicators.
3.2.2. Resilience Level by Dimension
Evaluating resilience through the dimensions of resistance, recovery capability, and adaptability facilitates the evaluation of an infrastructure’s defensive capacity before disasters, its recovery capability afterward, and its long-term adaptability and optimisation. Additionally, it enables comparisons of differences among cities within the same dimension, thereby informing more targeted improvement strategies. Figure 4 illustrates the three-dimensional resilience levels of Fujian Province and its nine cities in 2021 in response to flood disasters. Based on Figure 4 and Table 5, an analysis of the three resilience dimensions was conducted.
Figure 4.
Categorical resilience values for nine cities in Fujian Province in 2021.
- (1)
- Resistance
Resistance refers to the ability of a city to defend against flood and to maintain the functioning of urban infrastructure, which is measured by ESS, WSS, DS, TS, and DPSS. In the resistance dimension, Longyan, Zhangzhou, and Fuzhou exhibited resilience levels higher than the provincial level of Fujian, whereas Xiamen, Quanzhou, and Nanping were below the level. Longyan had the highest resilience in resistance, primarily due to the higher resilience of its WSS and DPSS, while its DS and TS maintain moderate resilience, collectively enhancing the city’s resistance. Xiamen recorded the lowest resistance resilience, mainly due to the low resilience of its ESS, WSS, and DPSS. For example, in 2021, the urban water supply pipe density in Longyan was 33.8 km/km2, compared to 13.2 km/km2 in Xiamen. The capacity of large and medium-sized reservoirs per square kilometre in Longyan was 12.628 million m3, while in Xiamen, it was only 431,000 m3. Longyan’s significantly higher urban water supply pipe density and reservoir capacity per square kilometre compared to Xiamen indicate stronger resource availability and infrastructure robustness, which are critical for enhancing resistance resilience.
- (2)
- Recovery Capability
Recovery capability refers to the ability of a city to recover from a damaged state to a normal state, measured by EPS, PTS, and MHS. In the recovery capability, Fuzhou, Sanming, Nanping, and Longyan demonstrated resilience levels above the provincial level of Fujian, whereas Xiamen and Ningde ranked low. Fuzhou ranked highest in recovery capability, benefiting from the high resilience of its EPS, PTS, and MHS, whose synergistic effects significantly strengthened the city’s recovery capability. To address issues such as urban waterlogging and black-odorous inland rivers, Fuzhou has adopted advanced technologies, including artificial neural networks, the Internet of Things, and drone patrols. By integrating foundational data across multiple departments—such as meteorology, water affairs, transportation, urban construction, water resources, and public security—the city developed a scientific water system dispatching platform, significantly enhancing recovery efficiency. Due to the impact of Typhoon Doksuri, Fuzhou experienced 512 instances of urban waterlogging and flooding in 216 residential communities. Temporary suspension notices for public bus and metro services were issued at 7:30 am and 9:00 a.m., respectively, with full service restored by 4:00 p.m. that afternoon. Within just half a day, all bus and metro lines across the city resumed normal operations, and over 90% of waterlogged road sections had been drained, demonstrating the city’s strong emergency response and recovery capabilities. Conversely, Ningde had the lowest resilience recovery capability, primarily due to the lower resilience of its EPS and PTS. These shortcomings have limited Ningde’s efficiency in emergency response and resource allocation following flood disasters, resulting in prolonged recovery periods and delayed restoration of urban functions.
- (3)
- Adaptability
Adaptability refers to the ability of a city to learn from the experience of dealing with flood disasters and to continuously adjust and adapt to achieve higher UIR, measured by CES and STS. In the adaptability dimension, Xiamen, Fuzhou, and Quanzhou surpassed the overall average of Fujian Province, as their CES and STS exhibited high or higher levels. Influenced by geographical conditions, urban development levels, and functional positioning, Xiamen, Fuzhou, and Quanzhou have become the main population inflow cities in Fujian Province [59]. In response to population growth, these cities have demonstrated the ability to dynamically adjust the allocation of educational resources and optimise the structure of technological investment. Cities with high educational resilience can more effectively disseminate disaster prevention and mitigation knowledge, enhancing public awareness and self-protection capabilities in the face of flood and other sudden disasters. Technological systems provide critical support for flood response, such as intelligent hydrological monitoring networks that enable real-time monitoring of rivers, drainage systems, and waterlogged areas. Therefore, education and technology systems are fundamental to enhancing a city’s adaptability resilience, enabling better learning, adjustment, and transformation in the face of uncertainty. In comparison with the overall average of Fujian Province, the adaptability resilience levels of other cities were relatively lower, with Putian exhibiting the weakest performance. Both its CES and Science and STS demonstrated low resilience. This was primarily attributed to the limited support capacity of its educational and technological systems, which undermined the city’s ability to effectively adjust and continuously optimise infrastructure in the face of flood disasters. For instance, the number of college students per 10,000 inhabitants in Putian was only 111.9 in 2021, significantly below the provincial level of Fujian of 244.4, indicating a shortfall in higher education resources. Moreover, expenditure for science as a percentage of fiscal spending was merely 0.7%, compared to the provincial level of Fujian of 3.0%, reflecting a marked deficiency in technological investment. These shortcomings collectively constrained the city’s capacity for technological innovation and social adaptability, thereby weakening its adaptability resilience.
- (4)
- Overall UIR Performance
Fuzhou was the only city where resistance, recovery capability, and adaptability resilience all exceeded the provincial level of Fujian, highlighting its significant comprehensive advantage in UIR against flood disasters. This advantage stems from its role as the provincial capital, benefiting from a strong economic foundation, well-developed flood control infrastructure, robust scientific and educational resources, and an efficient emergency management system. These factors collectively contribute to the balanced development of resistance, recovery capability, and adaptability. Fuzhou city has successfully passed multiple severe tests of the flood seasons since 2018, including Typhoon Maria (196 mm/24 h) in 2018, short-term heavy rainfall on 17 September 2018 (106.7 mm/h), and continuous heavy rainfall from 15 to 19 May 2019 (87.7 mm/h) [60].
Figure 5 presents the three-dimensional UIR levels of Fujian Province in 2020, calculated using the AHP&EWM&KL-TOPSIS model from this study and the EWM-CIM model by Lin [44]. The EWM-CIM model, an existing UIR evaluation model for Fujian, determined indicator weights using the EWM and calculated a composite index through a weighted average method. The AHP&EWM&KL-TOPSIS model combines both subjective and objective weighting and evaluates resilience based on the relative closeness to an ideal solution, resulting in values ranging from 0 to 1. In contrast, the EWM-CIM model relies solely on weighted summation, producing lower and more concentrated values. Therefore, the difference in resilience value ranges between the two models stems from their distinct computational logic and does not affect the comparative validity of their ranking or trend analysis. The resilience results differ between the two models (see Figure 5). The dimensions were ranked as resistance > adaptability > recovery capability, according to the EWM–CIM model. The AHP&EWM&KL-TOPSIS model ranked the three dimensions as adaptability > recovery capability > resistance, aligning with the findings of Zhuang et al. [21], which also concluded that recovery resilience surpasses resistance resilience in Fujian in 2020. Zhuang et al. [21] incorporated key infrastructure systems such as energy supply, water supply, drainage, and transportation into the evaluation of resistance resilience. However, their recovery capability resilience primarily focused on economic investment and the production capacity of construction enterprises, without including critical systems such as environmental protection, healthcare, and communications. In this study, these systems are integrated into the evaluation framework to better reflect the context of flood disasters, highlighting their essential roles in ecological restoration and pollution control, information transmission and emergency coordination, as well as medical treatment and epidemic prevention, thereby enabling a more reliable evaluation of recovery capability resilience. Compared with the EWM–CIM model, the AHP&EWM&KL-TOPSIS model exhibits greater effectiveness in evaluating resilience. It achieves this by integrating a broader range of critical systems, balancing subjective and objective weights, and employing KL-TOPSIS for more nuanced differentiation.
Figure 5.
Comparison of three-dimensional resilience values in 2020 by two models.
3.2.3. Resilience Level by City
Analysis of resilience level by city can identify disparities among different infrastructure systems within a city and, hence, facilitate well-informed decisions for prioritised systems and formulate suitable upgrading strategies. For example, in Fuzhou, TS and CES exhibited higher resilience, while DPSS had low resilience. The reasons for Fuzhou’s higher TS resilience have been explained in the TS of Section 3.2.1. As the provincial capital, Fuzhou led the province in comprehensive educational development, with ample financial investment ensuring educational resources, infrastructure, and faculty strength. Additionally, strong policy support prioritised educational reforms and pilot projects, contributing to the high resilience of CES. Located along the southeastern coast, Fuzhou experiences frequent typhoons and heavy rainfall, placing significant pressure on the flood. However, insufficient investment in water conservancy led to underdeveloped infrastructure, with the proportion of water conservancy investment relative to GDP ranking among the lowest in the province. As flood disasters become more frequent, the city’s reservoir capacity has not grown accordingly in recent years, potentially falling short of handling extreme rainfall events. For example, during Typhoon Haikui in 2023, prolonged heavy rainfall caused water levels in 49 reservoirs across Fuzhou to exceed their flood control limits, and subsequent flood discharge operations further intensified downstream flooding pressure. Thus, the identification of DPSS as a low-resilience system by the model aligns well with the actual situation.
3.3. Spatial Distribution Characteristics of UIR
This study employed the natural breaks classification method of ArcGIS to categorise the UIR levels of nine cities in Fujian Province from 2012 to 2021 and visualised their spatial distribution (see Figure 6). From 2012 to 2021, Nanping consistently remained at a lower resilience level, while Fuzhou, Sanming, Quanzhou, Zhangzhou, Longyan, and Ningde had a one-level difference in resilience. Xiamen and Putian exhibited greater fluctuations, with resilience varying by two or three levels. Specifically, Xiamen’s resilience level showed a gradual decline, whereas Putian experienced an initial increase, followed by a decline. In 2021, Fuzhou (0.5298) exhibited a higher resilience level; Longyan (0.4130) demonstrated a high resilience level; Xiamen (0.3646), Quanzhou (0.3462), and Zhangzhou (0.3376) fell into the moderate resilience category; Sanming (0.2706) and Ningde (0.2561) were categorised as having low resilience; and Putian (0.2349) and Nanping (0.2139) were classified as having lower resilience.
Figure 6.
Spatial distribution of UIR in nine cities in Fujian Province (2012–2021). Note: Brown represents higher resilience, orange represents high resilience, yellow represents moderate resilience, dark blue represents low resilience, and light blue represents lower resilience.
This study divides Fujian Province into four areas, including Eastern Fujian (Fuzhou, Ningde, Putian), Southern Fujian (Xiamen, Zhangzhou, Quanzhou), Western Fujian (Longyan), and Northern Fujian (Nanping, Sanming), similar to that by Lin [41]. The results indicate that from 2012 to 2021, the overall level of UIR in Southern Fujian consistently exceeded that of Northern Fujian, which is consistent with the conclusion drawn by Lin [44]. This disparity can be primarily attributed to the significant advantages of Southern Fujian in infrastructure development, disaster prevention capacity, fiscal investment, and technological support. For example, in 2012, the STS resilience of Xiamen and Quanzhou were 1.000 and 0.804, respectively, while Nanping registered only 0.098 (see Table 5).
In particular, Xiamen, Zhangzhou, and Quanzhou exhibited a trend of convergence in resilience levels. The trend of convergence benefited from the increasingly mature cooperation mechanisms within the Xiamen–Zhangzhou–Quanzhou metropolitan area, especially in infrastructure construction, industrial complementarity, and emergency coordination—thus accelerating the process of regional integration. In contrast, the spatial differentiation of resilience within eastern Fujian became increasingly pronounced, with a widening discrepancy among cities. Specifically, Fuzhou consistently maintained a high or higher resilience level, Ningde remained at a low or lower level, and Putian fluctuated among high and lower resilience levels. This reflects the limited “spillover effect” of the core metropolitan city (Fuzhou) on surrounding smaller cities, resulting in significant disparities in infrastructure development and disaster prevention capacity. For instance, the design return period for urban waterlogging prevention in Fuzhou is 50 years, whereas it is only 30 years in Ningde and Putian. Overall, the spatial distribution of overall UIR in Fujian Province presents a “higher in the south, lower in the north” spatial pattern, with enhanced regional coordination in Southern Fujian but widening internal disparities in Eastern Fujian.
Figure 7 presents the overall UIR levels of Fujian Province in 2021, calculated using the AHP&EWM&KL-TOPSIS model from this study and the CRITIC-IAM model by Zhuang et al. [21]. There are some differences between the resilience results obtained by the two models. The AHP&EWM&KL-TOPSIS model calculates Fuzhou’s UIR as the highest, whereas the CRITIC-IAM model places Longyan at the top. Fuzhou, as the provincial capital, benefits from a stronger economic foundation, more developed infrastructure, and advanced scientific and emergency management systems, making it more resilient in terms of infrastructure. Ding and Dong [61] conducted a comprehensive risk assessment of coastal storm surges in Fujian based on economic, social, ecological, and engineering resilience, which similarly found that Fuzhou has the highest urban disaster resilience. This study develops an index system for UIR encompassing the three dimensions of resistance, recovery capability, and adaptability, grounded in the intrinsic connotation of resilience. The index system emphasises the continuous process of disaster impact reduction, functional restoration, and long-term adaptation, offering important implications for advancing the evaluation of UIR under flood scenarios. Compared with the CRITIC-IAM model, the AHP&EWM&KL-TOPSIS model developed in this study provides a more accurate reflection of the actual conditions of cities, demonstrating higher rationality and applicability in UIR evaluation.
Figure 7.
Comparison of overall UIR values for the two models in 2021 [21].
4. Conclusions
This study developed a composite evaluation model for evaluating UIR against flood disasters, integrating engineering and social infrastructure systems across the dimensions of resistance, recovery capability, and adaptability. Using Fujian Province as a case study, the proposed AHP&EWM&KL-TOPSIS model was applied to evaluate UIR levels and identify spatial disparities and system-level resilience characteristics. The results revealed significant differences in resilience performance among infrastructure systems and cities. The EPS consistently exhibited the highest resilience and the lowest inter-city variation, whereas several other systems showed pronounced spatial disparities. At the city level, UIR generally displayed a “higher in the south, lower in the north” spatial pattern, with increasing regional coordination in Southern Fujian and widening disparities within Eastern Fujian. These findings provide useful evidence for identifying critical vulnerabilities and prioritising resilience enhancement measures.
The modular design of the proposed model and its index system offer significant potential for high adaptability and scalability, allowing for flexible adjustment to local disaster risk profiles and urban development characteristics, including the removal or addition of specific systems (e.g., emergency response, digital governance). This facilitates localised application across diverse contexts and enhances its value for policymaking.
Despite the contributions of this study in developing an evaluation model for UIR against flood disasters and generating practically meaningful findings, several limitations should be acknowledged. First, the evaluation is based on historical observations and does not explicitly account for future climate, socioeconomic, or urban development scenarios. Second, the study primarily focuses on measuring UIR levels and analysing their spatial disparities, without explicitly examining the interaction mechanisms among different infrastructure systems. Third, the proposed framework does not incorporate simulations of flood propagation processes, inundation depths, drainage system performance, or the physical interactions between flood hazards and urban infrastructure systems. Future research could be extended in several directions. First, scenario-based analysis and dynamic modelling approaches could be integrated with climate change projections, socioeconomic development pathways, and urbanisation trends to explore the long-term evolution of UIR. Second, methods such as system dynamics and complex network analysis could be employed to investigate the interaction mechanisms among infrastructure systems and their influence on overall resilience. Third, coupling the resilience evaluation framework with hydrodynamic models would improve the representation of flood processes and infrastructure responses under different hazard conditions. In addition, the framework could be extended to multi-hazard contexts, such as typhoons and earthquakes, to establish a comprehensive resilience assessment and optimisation framework for urban infrastructure under multiple risks, thereby providing more robust support for resilience-oriented urban planning and disaster risk management.
Supplementary Materials
The following supporting information can be downloaded at: https://www.mdpi.com/article/10.3390/su18136581/s1, Original judgment matrices and consistency test results of AHP: File S1: Judgment matrix and consistency test results for criterion layer; File S2: Judgment matrix and consistency test results for index layer I; File S3: Judgment matrix and consistency test results for target layer.
Author Contributions
Conceptualization, Z.H. and L.L.P.L.; Methodology, Z.H. and L.L.P.L.; Software, Z.H.; Validation, Z.H. and L.L.P.L.; Formal analysis, A.B.H.K. and S.N.T.; Data curation, Z.H.; Writing—original draft, Z.H.; Writing—review & editing, L.L.P.L. and A.B.H.K. All authors have read and agreed to the published version of the manuscript.
Funding
The authors thank Universitas Pembangunan Jaya (UPJ) and Universiti Malaysia Sarawak (UNIMAS) for providing research funding through the Matching Grant scheme (INT/F02/UPJ/86238/2023). The authors appreciate the financial support provided by the Ministry of Higher Education, Malaysia under Fundamental Research Grant Scheme (FRGS/1/2024/WAS04/UNIMAS/02/1). The data collection work of this study was supported by the Fujian Provincial Social Science Fund Project (FJ2022B066).
Institutional Review Board Statement
The study was conducted in accordance with the Declaration of Helsinki and approved by Medical Ethics Committee of Fuzhou Institute of Technology (FZLGMEC-2024001 and 10 April 2026).
Informed Consent Statement
Informed consent was obtained from all subjects involved in the study.
Data Availability Statement
The data that support the findings of this study are available from the corresponding author upon reasonable request.
Acknowledgments
The authors acknowledge Universiti Malaysia Sarawak (UNIMAS) for providing the research support. The authors also would like to thank the anonymous reviewers who helped improve this manuscript.
Conflicts of Interest
The authors declare that they do not have any conflicts of interest.
References
- Cao, F.F.; Xu, X.F.; Zhang, C.L.; Kong, W.B. Evaluation of urban flood resilience and its Space-Time Evolution: A case study of Zhejiang Province, China. Ecol. Indic. 2023, 154, 110643. [Google Scholar] [CrossRef] [Scilit]
- Ministry of Water Resources of the People’s Republic of China. China Flood and Drought Disaster Prevention Bulletin. Available online: http://www.mwr.gov.cn/sj/tjgb/zgshzhgb/ (accessed on 25 April 2025).
- Kok, M.; Slager, K.; Moel, H.; Botzen, W.; De Bruijn, K.; Wagenaar, D.; Rikkert, S.; Koks, E.; Ginkel, K. Rapid damage assessment caused by the flooding event 2021 in Limburg, Netherlands. J. Coast. Riverine Flood Risk 2023, 2, 10. [Google Scholar] [CrossRef] [Scilit]
- Balakrishnan, S.; Cassottana, B.; Verma, A. Application of clustering algorithms for dimensionality reduction in infrastructure resilience prediction models. Struct. Infrastruct. Eng. 2024, 1–13. [Google Scholar] [CrossRef] [Scilit]
- Lei, Y.; Zhang, Y.; Gao, S. Analysis of Strategies for Enhancing the Resilience of Urban Waterlogging Prevention and Control Management Systems. Ind. Constr. 2024, 54, 128–132. [Google Scholar] [CrossRef] [Scilit]
- Holling, C.S. Resilience and stability of ecological systems. Annu. Rev. Ecol. Syst. 1973, 4, 1–23. [Google Scholar] [CrossRef] [Scilit]
- Alizadeh, H.; Sharifi, A. Assessing resilience of urban critical infrastructure networks: A case study of Ahvaz, Iran. Sustainability 2020, 12, 3691. [Google Scholar] [CrossRef] [Scilit]
- Liu, S.; Feng, L.; Xie, J.; Ke, Y. Assessing Urban Flood Resilience with Unascertained Measurement Theory: A Case Study of Jiangxi Province, China. Sustainability 2025, 18, 49. [Google Scholar] [CrossRef] [Scilit]
- Spaans, M.; Waterhout, B. Building up resilience in cities worldwide–Rotterdam as participant in the 100 Resilient Cities Programme. Cities 2017, 61, 109–116. [Google Scholar] [CrossRef] [Scilit]
- Rehak, D.; Senovsky, P.; Hromada, M.; Lovecek, T. Complex approach to assessing resilience of critical infrastructure elements. Int. J. Crit. Infrastruct. Prot. 2019, 25, 125–138. [Google Scholar] [CrossRef] [Scilit]
- Alidrus, S.; Wiyono, A. Resilience and Vulnerability of Coastal Communities: A Case Study of Tambak Lorok, Semarang-Indonesia in Facing Flood Risks. J. Syntax Admiration 2024, 5, 3349–3357. [Google Scholar] [CrossRef] [Scilit]
- Rathnayaka, B.; Robert, D.; Adikariwattage, V.; Siriwardana, C.; Meegahapola, L.; Setunge, S.; Amaratunga, D. A Unified Framework for Evaluating the Resilience of Critical Infrastructure: Delphi Survey Approach. Int. J. Disaster Risk Reduct. 2024, 110, 104598. [Google Scholar] [CrossRef] [Scilit]
- Zhang, B.B.; Liu, Y.Z.; Liu, Y.; Lyu, S.N. Spatiotemporal Evolution and Influencing Factors for Urban Resilience in China: A Provincial Analysis. Buildings 2024, 14, 502. [Google Scholar] [CrossRef] [Scilit]
- Kapucu, N.; Hu, Q.; Sadiq, A.A.; Hasan, S. Building urban infrastructure resilience through network governance. Urban Gov. 2023, 3, 5–13. [Google Scholar] [CrossRef] [Scilit]
- Wang, H.; Huang, Z.Y.; Liang, Y.Q.; Zhang, Q.X.; Hu, S.X.; Cui, L.Y.; An, X.Y. Dynamic evolution of urban infrastructure resilience and its spatial spillover effects: An empirical study from China. PLoS ONE 2023, 18, e0282194. [Google Scholar] [CrossRef] [Scilit] [PubMed]
- Kermanshachi, S.; Rouhanizadeh, B.; Dao, B. Application of Delphi method in identifying, ranking, and weighting project complexity indicators for construction projects. J. Leg. Aff. Disput. Resolut. Eng. Constr. 2020, 12, 04519033. [Google Scholar] [CrossRef] [Scilit]
- Ayyildiz, E. Interval valued intuitionistic fuzzy analytic hierarchy process-based green supply chain resilience evaluation methodology in post COVID-19 era. Environ. Sci. Pollut. Res. 2023, 30, 42476–42494. [Google Scholar] [CrossRef] [Scilit] [PubMed]
- Matin, S.; Salehi, E.; Faryadi, S. Comparative Analysis of Planning Theories for Optimizing Disaster Preparedness and Response in Urban Communities. Int. J. Environ. Res. 2025, 19, 138. [Google Scholar] [CrossRef] [Scilit]
- Tavana, M.; Yazdani, M.; Di Caprio, D. An application of an integrated ANP–QFD framework for sustainable supplier selection. Int. J. Logist. Res. Appl. 2017, 20, 254–275. [Google Scholar] [CrossRef] [Scilit]
- Ji, J.; Wang, D. Evaluation analysis and strategy selection in urban flood resilience based on EWM-TOPSIS method and graph model. J. Clean. Prod. 2023, 425, 138955. [Google Scholar] [CrossRef] [Scilit]
- Zhuang, L.; Yu, Z.; Sun, C.; Hou, X. The evaluation and obstacle identification of urban infrastructure resilience in China. Chin. J. Urban Environ. Stud. 2023, 11, 2350015. [Google Scholar] [CrossRef] [Scilit]
- Pala, O. A new objective weighting method based on robustness of ranking with standard deviation and correlation: The ROCOSD method. Inf. Sci. 2023, 636, 118930. [Google Scholar] [CrossRef] [Scilit]
- Paramanik, A.R.; Sarkar, S.; Sarkar, B. OSWMI: An objective-subjective weighted method for minimizing inconsistency in multi-criteria decision making. Comput. Ind. Eng. 2022, 169, 108138. [Google Scholar] [CrossRef] [Scilit]
- Zhan, Y.; Zhang, Y.; Zhang, J.; Xu, J.; Chen, H.; Liu, G.; Wan, Z. Risk assessment of land subsidence in Shanghai municipality based on AHP and EWM. Sci. Rep. 2025, 15, 7339. [Google Scholar] [CrossRef] [Scilit] [PubMed]
- Qiao, S.Y.; Fan, Y.P.; Yin, W. Spatiotemporal dynamic assessment and obstacle analysis of economic resilience in China’s marine fisheries. Sci. Rep. 2024, 14, 27818. [Google Scholar] [CrossRef] [Scilit] [PubMed]
- Yu, S.; Liu, H.; Kang, Q.; Cheng, J.; Gong, Y.; Ke, Y. Research on the Fire Resilience Assessment of Ancient Architectural Complexes Based on the AHP-CRITIC Method. Sustainability 2024, 16, 8022. [Google Scholar] [CrossRef] [Scilit]
- Yu, L.; Li, D.; Mao, L.; Zhou, S.; Feng, H. Towards people-centric smart cities: A comparative evaluation of citizens’ sense of gain in pilot cities in China. J. Clean. Prod. 2024, 434, 140027. [Google Scholar] [CrossRef] [Scilit]
- Arvin, M.; Beiki, P.; Hejazi, S.J.; Sharifi, A.; Atashafrooz, N. Assessment of infrastructure resilience in multi-hazard regions: A case study of Khuzestan Province. Int. J. Disaster Risk Reduct. 2023, 88, 103601. [Google Scholar] [CrossRef] [Scilit]
- Xu, W.P.; Cong, J.T.; Proverbs, D.G. Evaluation of infrastructure resilience. Int. J. Build. Pathol. Adapt. 2023, 41, 378–400. [Google Scholar] [CrossRef] [Scilit]
- Lu, H.; Zhang, C.; Jiao, L.; Wei, Y.; Zhang, Y. Analysis on the spatial-temporal evolution of urban agglomeration resilience: A case study in Chengdu-Chongqing Urban Agglomeration, China. Int. J. Disaster Risk Reduct. 2022, 79, 103167. [Google Scholar] [CrossRef] [Scilit]
- Moghadas, M.; Asadzadeh, A.; Vafeidis, A.; Fekete, A.; Kötter, T. A multi-criteria approach for assessing urban flood resilience in Tehran, Iran. Int. J. Disaster Risk Reduct. 2019, 35, 101069. [Google Scholar] [CrossRef] [Scilit]
- Javari, M.; Saghaei, M.; Fadaei Jazi, F. Analyzing the resilience of urban settlements using multiple-criteria decision-making (MCDM) models (case study: Malayer city). Sustain. Environ. 2021, 7, 1889083. [Google Scholar] [CrossRef] [Scilit]
- Chen, X.L.; Yu, L.X.; Lin, W.D.; Yang, F.Q.; Li, Y.P.; Tao, J.; Cheng, S. Urban resilience assessment from the multidimensional perspective using dynamic Bayesian network: A Case Study of Fujian Province, China. Reliab. Eng. Syst. Saf. 2023, 238, 109469. [Google Scholar] [CrossRef] [Scilit]
- Ancheta, M.A.; Shrestha, S.; Koottatep, T.; Shanmugam, M. Resilience assessment of urban water supply and sanitation systems: A critical review. AQUA—Water Infrastruct. Ecosyst. Soc. 2025, 74, 388–404. [Google Scholar] [CrossRef] [Scilit]
- Xu, W.; Cai, X.; Yu, Q.; Proverbs, D.; Xia, T. Modelling trends in urban flood resilience towards improving the adaptability of cities. Water 2024, 16, 1614. [Google Scholar] [CrossRef] [Scilit]
- Liu, W.Y.; Zhou, J.; Li, X.L.; Zheng, H.; Liu, Y.H. Urban resilience assessment and its spatial correlation from the multidimensional perspective: A case study of four provinces in North-South Seismic Belt, China. Sustain. Cities Soc. 2024, 101, 105109. [Google Scholar] [CrossRef] [Scilit]
- Chen, M.; Jiang, Y.; Wang, E.D.; Wang, Y.; Zhang, J. Measuring urban infrastructure resilience via pressure-state-response framework in four Chinese municipalities. Appl. Sci. 2022, 12, 2819. [Google Scholar] [CrossRef] [Scilit]
- Zhu, S.Y. Evaluation and Improvement Strategy of Urban Flood Resilience—An Example of Cities in Yangtze River Delta. Ph.D. Thesis, Southeast University, Nanjing, China, 2021. [Google Scholar]
- Chen, C.K.; Chen, Y.Q.; Shi, B.; Xu, T. An model for evaluating urban resilience to rainstorm flood disasters. China Saf. Sci. J. 2018, 28, 1–6. [Google Scholar] [CrossRef]
- Lu, H.; Lu, X.; Jiao, L.; Zhang, Y. Evaluating urban agglomeration resilience to disaster in the Yangtze Delta city group in China. Sustain. Cities Soc. 2022, 76, 103464. [Google Scholar] [CrossRef] [Scilit]
- Si, Y.; Liang, L.; Zhou, W. An evaluation of urban resilience using structural equation modeling from practitioners’ perspective: An empirical investigation in Huangshi City, China. Sustainability 2024, 16, 7031. [Google Scholar] [CrossRef] [Scilit]
- Li, H.Y.; Wang, Y.; Zhang, H.W.; Yin, R.M.; Liu, C.; Wang, Z.J.; Fu, F.; Zhao, J.Q. The spatial-temporal evolution and driving mechanism of Urban resilience in the Yellow River Basin cities. J. Clean. Prod. 2024, 447, 141614. [Google Scholar] [CrossRef] [Scilit]
- Wang, K.; Wang, Z.; Deng, J.; Feng, Y.; Li, Q. Study on the evaluation of emergency management capacity of resilient communities by the AHP-TOPSIS method. Int. J. Environ. Res. Public Health 2022, 19, 16201. [Google Scholar] [CrossRef] [Scilit] [PubMed]
- Lin, Q.X. Research on the Measurement and Improvement Measures of Urban Infrastructure Resilience—Take Fujian Province as an Example. Master’s Thesis, Fujian University of Technology, Fuzhou, China, 2022. [Google Scholar]
- Schober, P.; Boer, C.; Schwarte, L.A. Correlation coefficients: Appropriate use and interpretation. Anesth. Analg. 2018, 126, 1763–1768. [Google Scholar] [CrossRef] [Scilit] [PubMed]
- Ye, M.; Ward, P.J.; Bloemendaal, N.; Nirandjan, S.; Koks, E.E. Risk of tropical cyclones and floods to power grids in Southeast and East Asia. Int. J. Disaster Risk Sci. 2024, 15, 494–507. [Google Scholar] [CrossRef] [Scilit]
- Tufail, M.; Nasir, M.J.; Rahman, A.U.; Kakakhel, S.I.; Tariq, A. A geospatial assessment of the resilience of municipal water supply to flooding in Nowshera District, Pakistan. HydroResearch 2025, 8, 89–98. [Google Scholar] [CrossRef] [Scilit]
- Ministry of Housing and Urban-Rural Development of the People’s Republic of China. Notice of the Ministry of Housing and Urban-Rural Development on the List of Persons Responsible for Urban Drainage and Waterlogging Prevention and Control Nationwide in 2025. Available online: https://www.mohurd.gov.cn/gongkai/zc/wjk/art/2025/art_0229dad009d84b2d9822aafb270f3ceb.html (accessed on 29 May 2026).
- Ding, W.; Wei, G.; Zhou, H. Improving flood resilience through optimal reservoir operation. J. Hydrol. 2023, 620, 129494. [Google Scholar] [CrossRef] [Scilit]
- Bukhari, S.A.S.; Shafi, I.; Ahmad, J.; Villar, S.G.; Villena, E.G.; Khurshaid, T.; Ashraf, I. Review of flood monitoring and prevention approaches: A data analytic perspective. Nat. Hazards 2025, 121, 5103–5128. [Google Scholar] [CrossRef] [Scilit]
- Komeh, Z.; Hamzeh, S.; Memarian, H.; Attarchi, S.; Alavipanah, S.K. A Remote Sensing Approach to Spatiotemporal Analysis of Land Surface Temperature in Response to Land Use/Land Cover Change via Cloud Base and Machine Learning Methods, Case Study: Sari Metropolis, Iran. Int. J. Environ. Res. 2025, 19, 98. [Google Scholar] [CrossRef] [Scilit]
- Conley, G.; McDonald, R.I.; Nodine, T.; Chapman, T.; Holland, C.; Hawkins, C.; Beck, N. Assessing the influence of urban greenness and green stormwater infrastructure on hydrology from satellite remote sensing. Sci. Total Environ. 2022, 817, 152723. [Google Scholar] [CrossRef] [Scilit] [PubMed]
- Fuzhou Municipal People’s Government. Notice on Issuing the Emergency Response Plan for Flood and Typhoon Prevention in Fuzhou. Available online: https://www.fuzhou.gov.cn/zfxxgkzl/szfbmjxsqxxgk/szfbmxxgk/fzsrmzf/zfxxgkml/tfggsjdyjyayjxxjydqk/201905/t20190528_2901799.htm (accessed on 29 May 2026).
- Walker, B.; Holling, C.S.; Carpenter, S.R.; Kinzig, A.P. Resilience, Adaptability and Transformability in Social-ecological Systems. Ecol. Soc. 2004, 9, 5. [Google Scholar] [CrossRef] [Scilit]
- Fujian Provincial Bureau of Statistics. The Seventh National Population Census Bulletin in Fujian Province. Available online: https://tjj.fujian.gov.cn/xxgk/tjgb/202105/t20210520_5598804.htm (accessed on 26 May 2026).
- Fujian Provincial Bureau of Statistics. The Sixth National Population Census Bulletin in Fujian Province. Available online: http://tjj.fujian.gov.cn/xxgk/tjgb/201105/t20110525_42888.htm (accessed on 26 May 2026).
- Keenan-Jones, D.C.; Serra-Llobet, A.; He, H.; Kondolf, G.M. Urban development and long-term flood risk and resilience: Experiences over time and across cultures. Cases from Asia, North America, Europe and Australia. Urban Stud. 2025, 62, 469–486. [Google Scholar] [CrossRef] [Scilit]
- Zhong, M.; Lin, K.; Tang, G.; Zhang, Q.; Hong, Y.; Chen, X. A framework to evaluate community resilience to urban floods: A case study in three communities. Sustainability 2020, 12, 1521. [Google Scholar] [CrossRef] [Scilit]
- Yang, J.; Guo, X.; Zhang, S.; Yao, F.; Zhang, X. A Study on the Interaction Between Population Mobility and High-Quality Development of Manufacturing Industry in China—Based on the Data of Fujian Province. J. Adv. Comput. Intell. Intell. Inform. 2024, 28, 714–726. [Google Scholar] [CrossRef] [Scilit]
- Wang, H.; Lei, X.H.; Wang, C.; Liao, W.H.; Kang, A.Q.; Huang, H.C.; Ding, X.C.; Chen, Y.; Zhang, X.L. A coordinated drainage and regulation model of urban water systems in China: A case study in Fuzhou city. River 2023, 2, 5–20. [Google Scholar] [CrossRef] [Scilit]
- Ding, Y.T.; Dong, D.B. Study on comprehensive risk assessment of storm surges for Fujian Province from the perspective of resilience. J. Trop. Oceanogr. 2024, 43, 126–136. [Google Scholar]
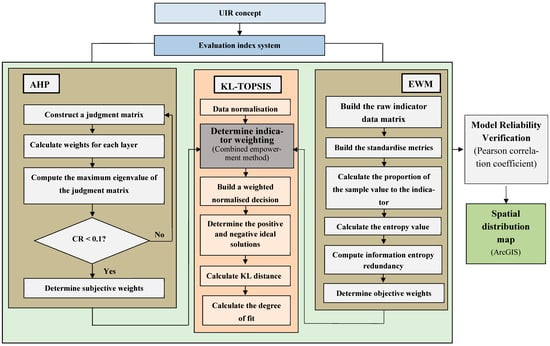
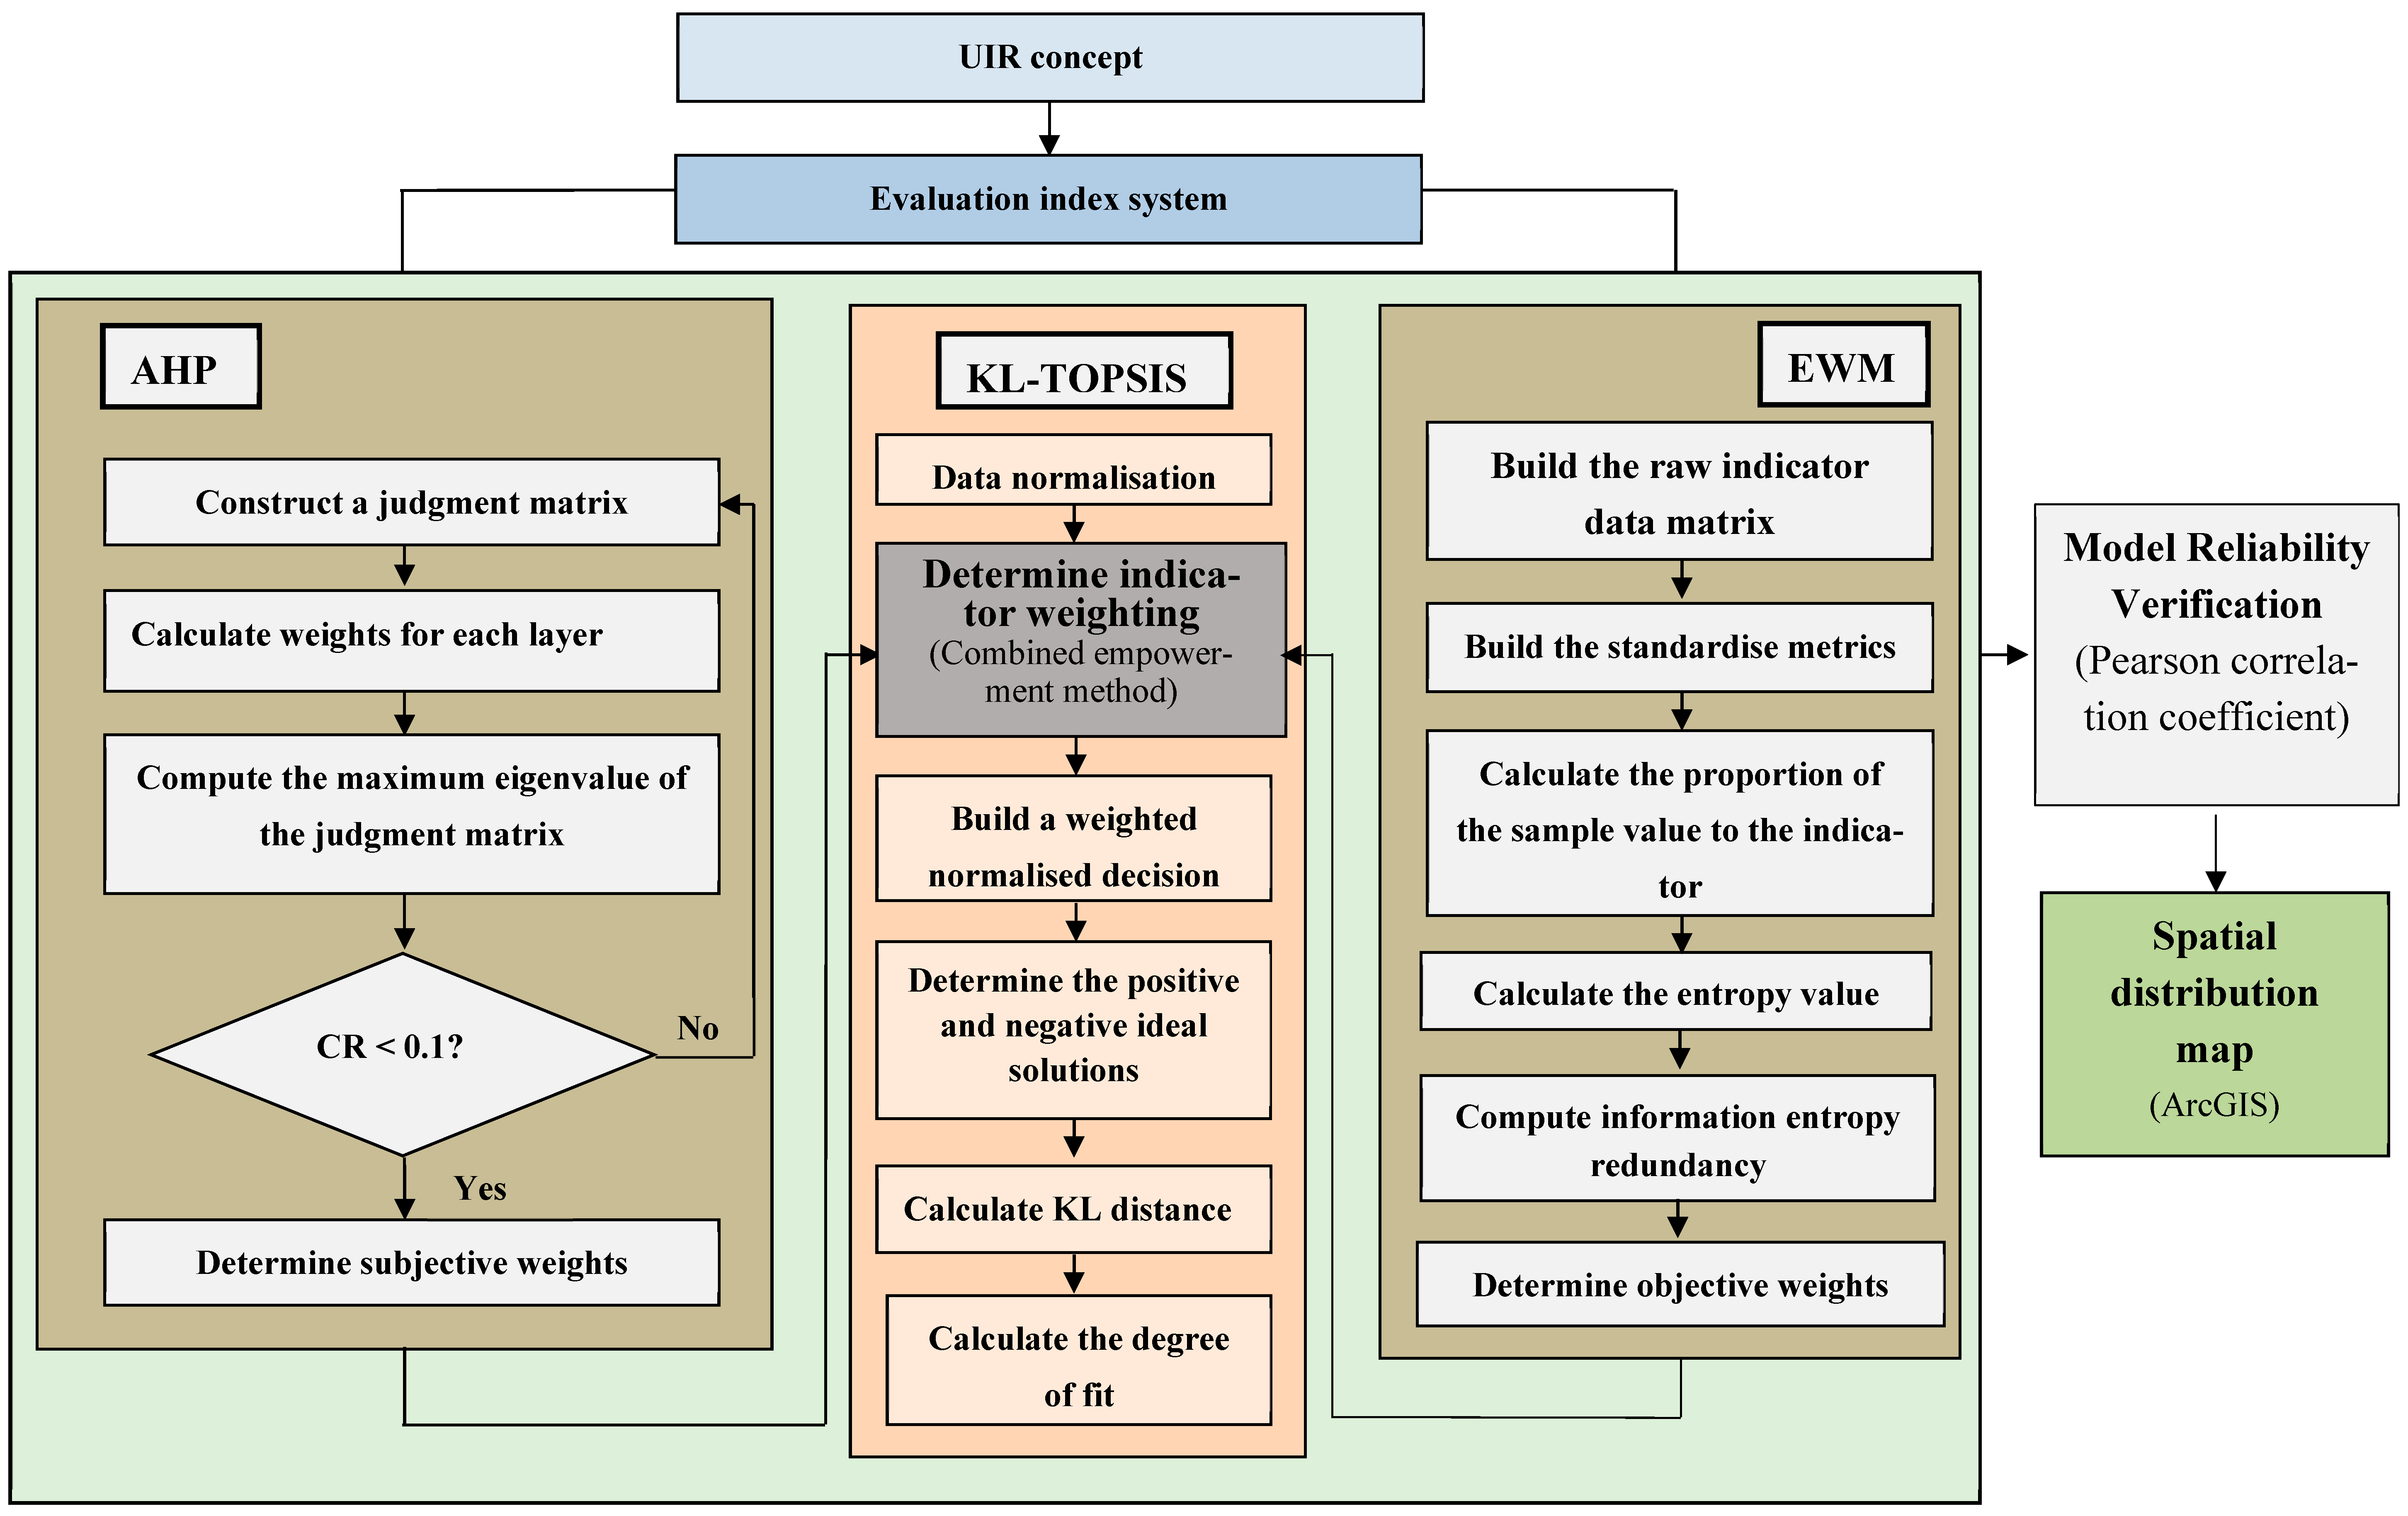
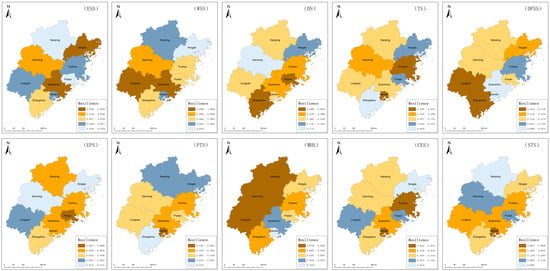
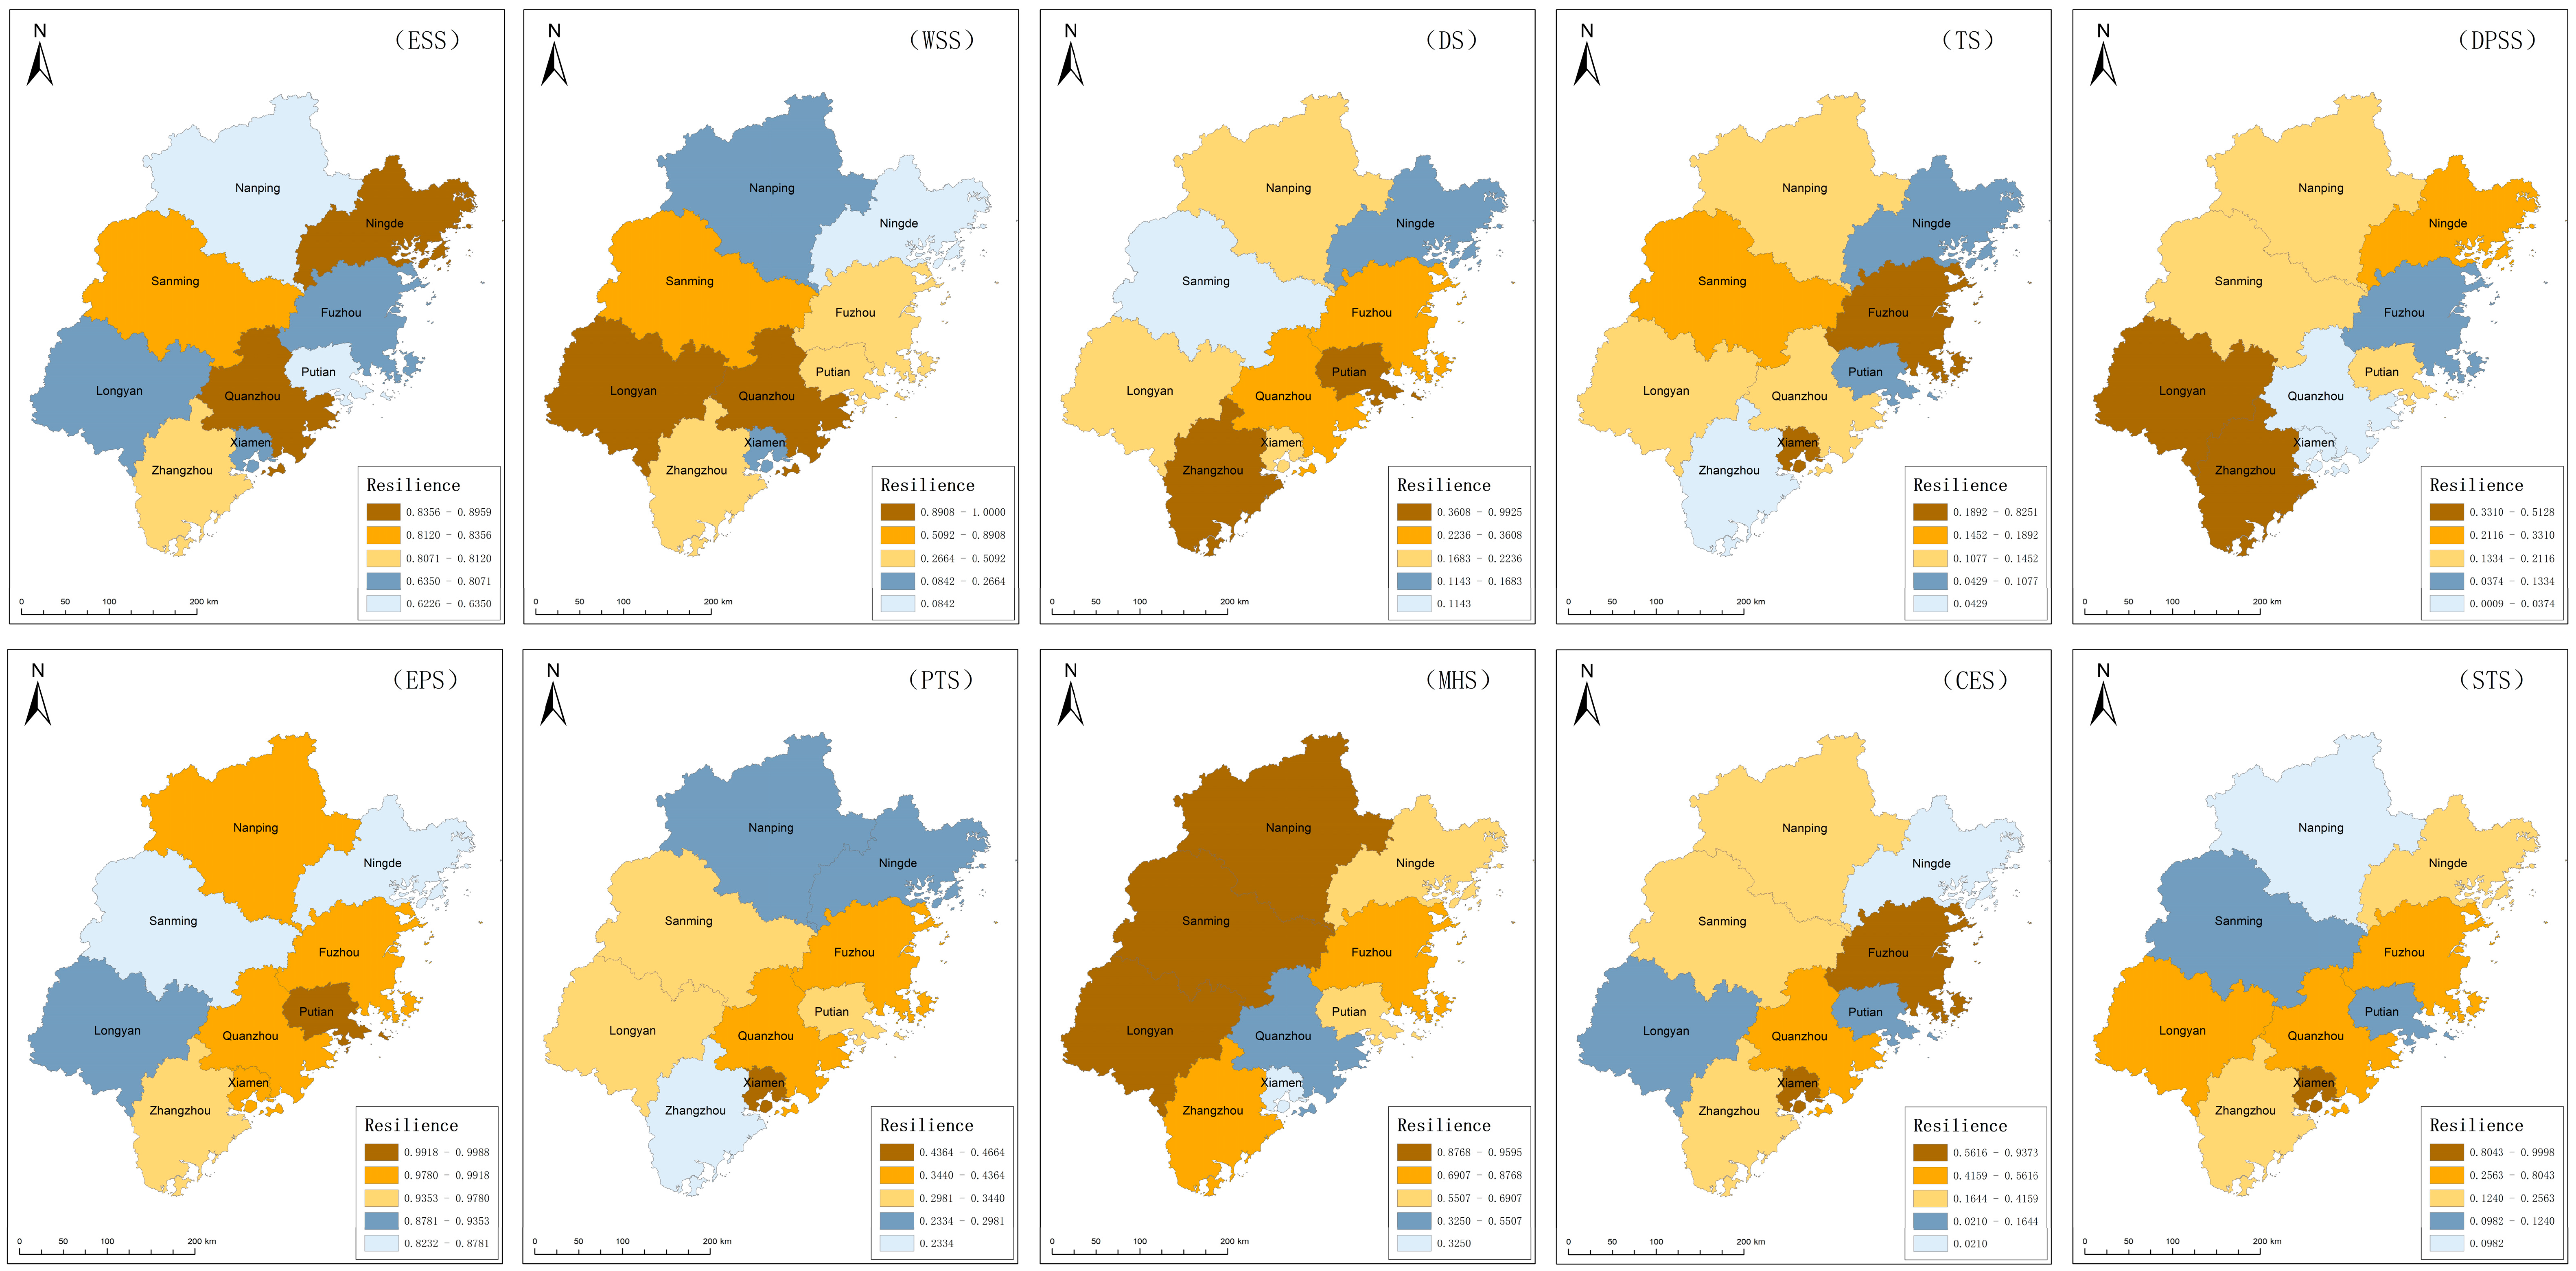
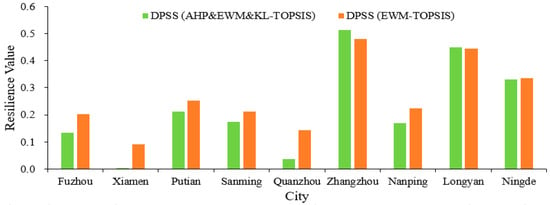
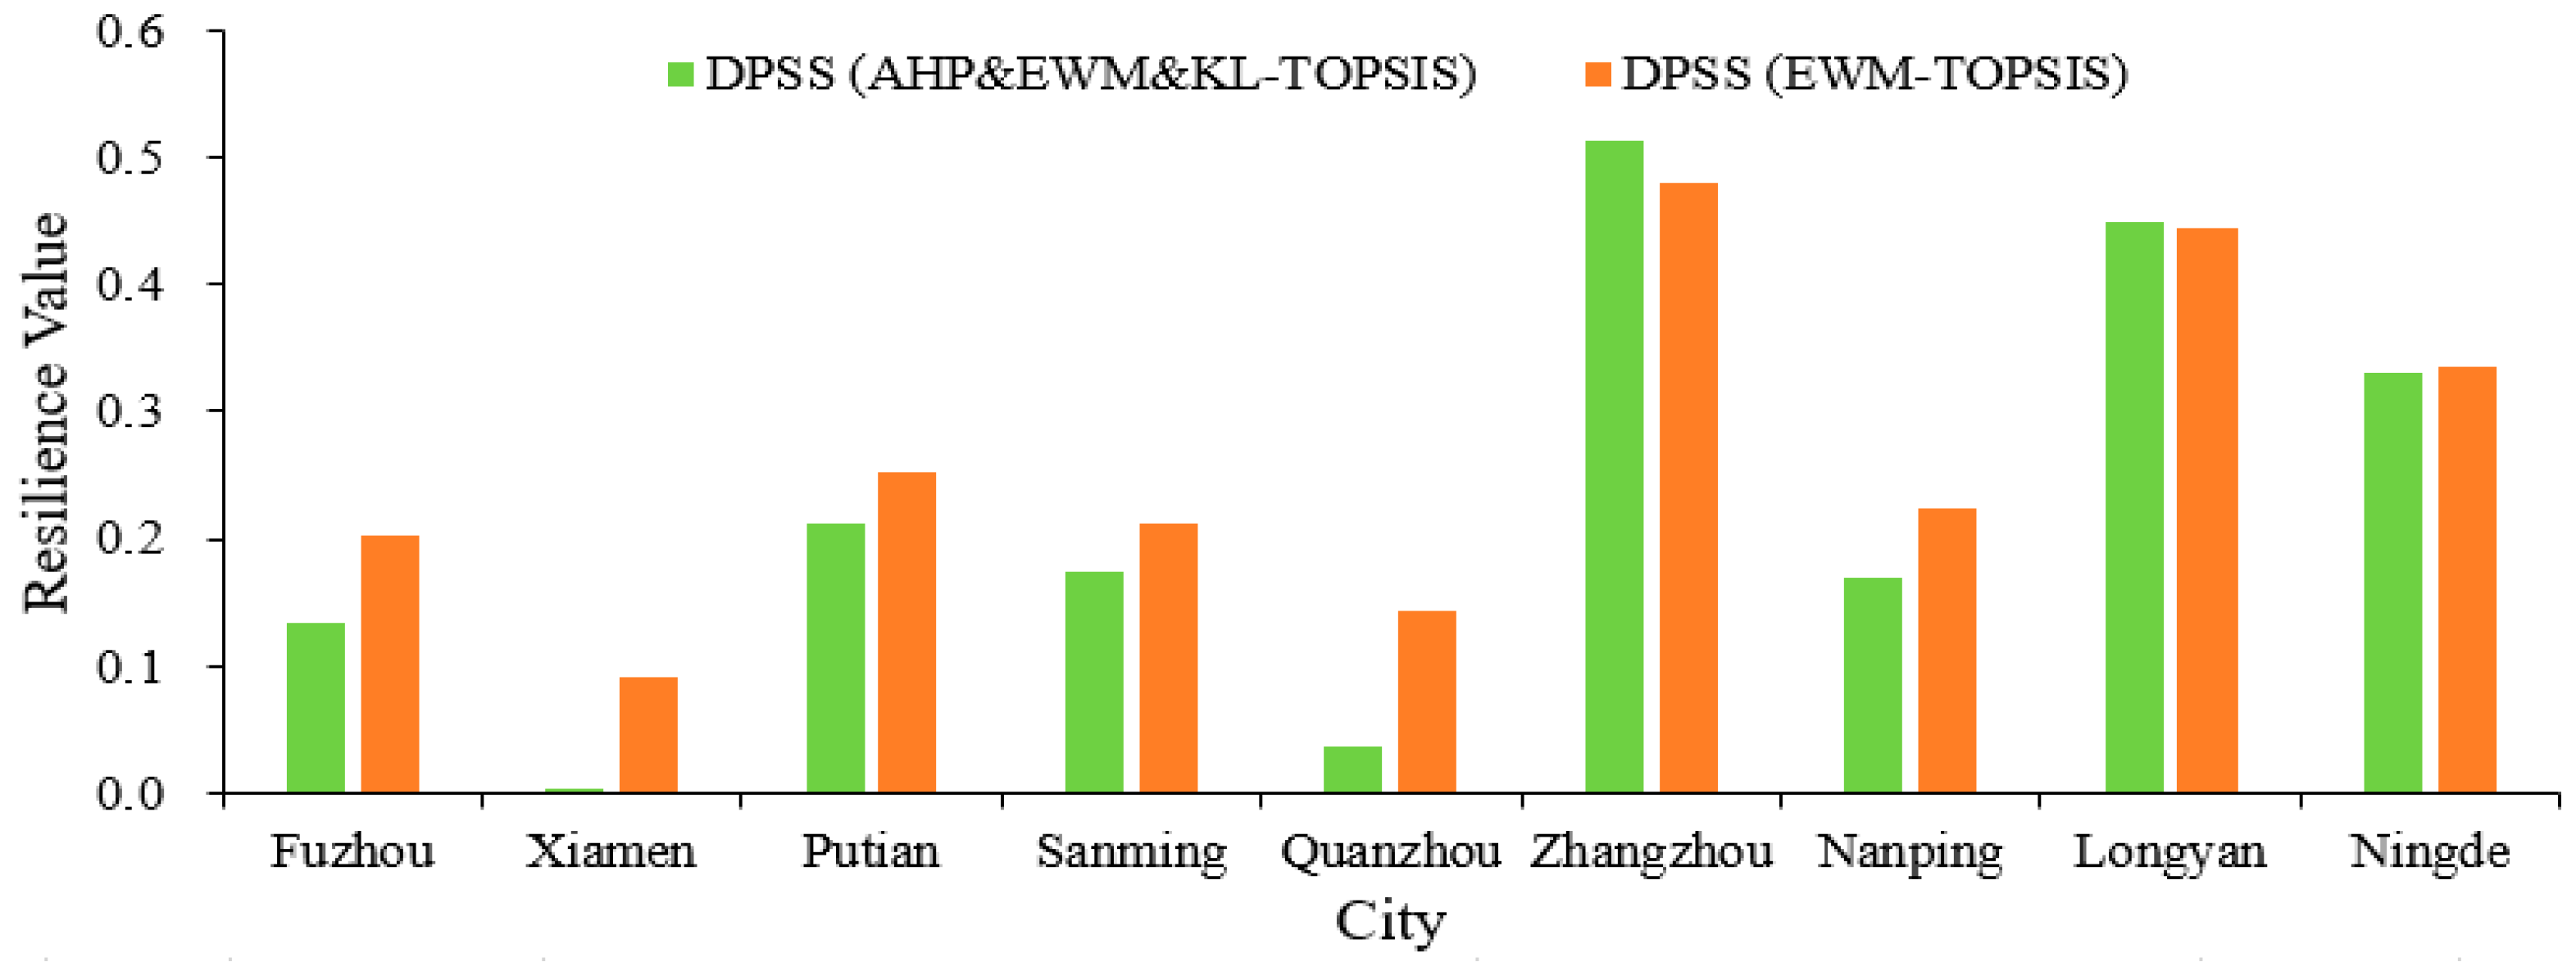
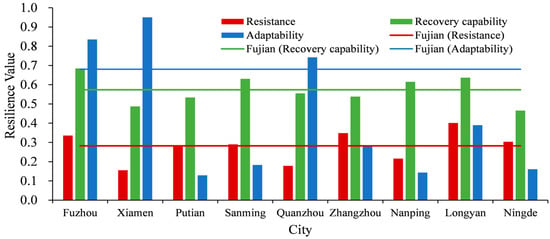
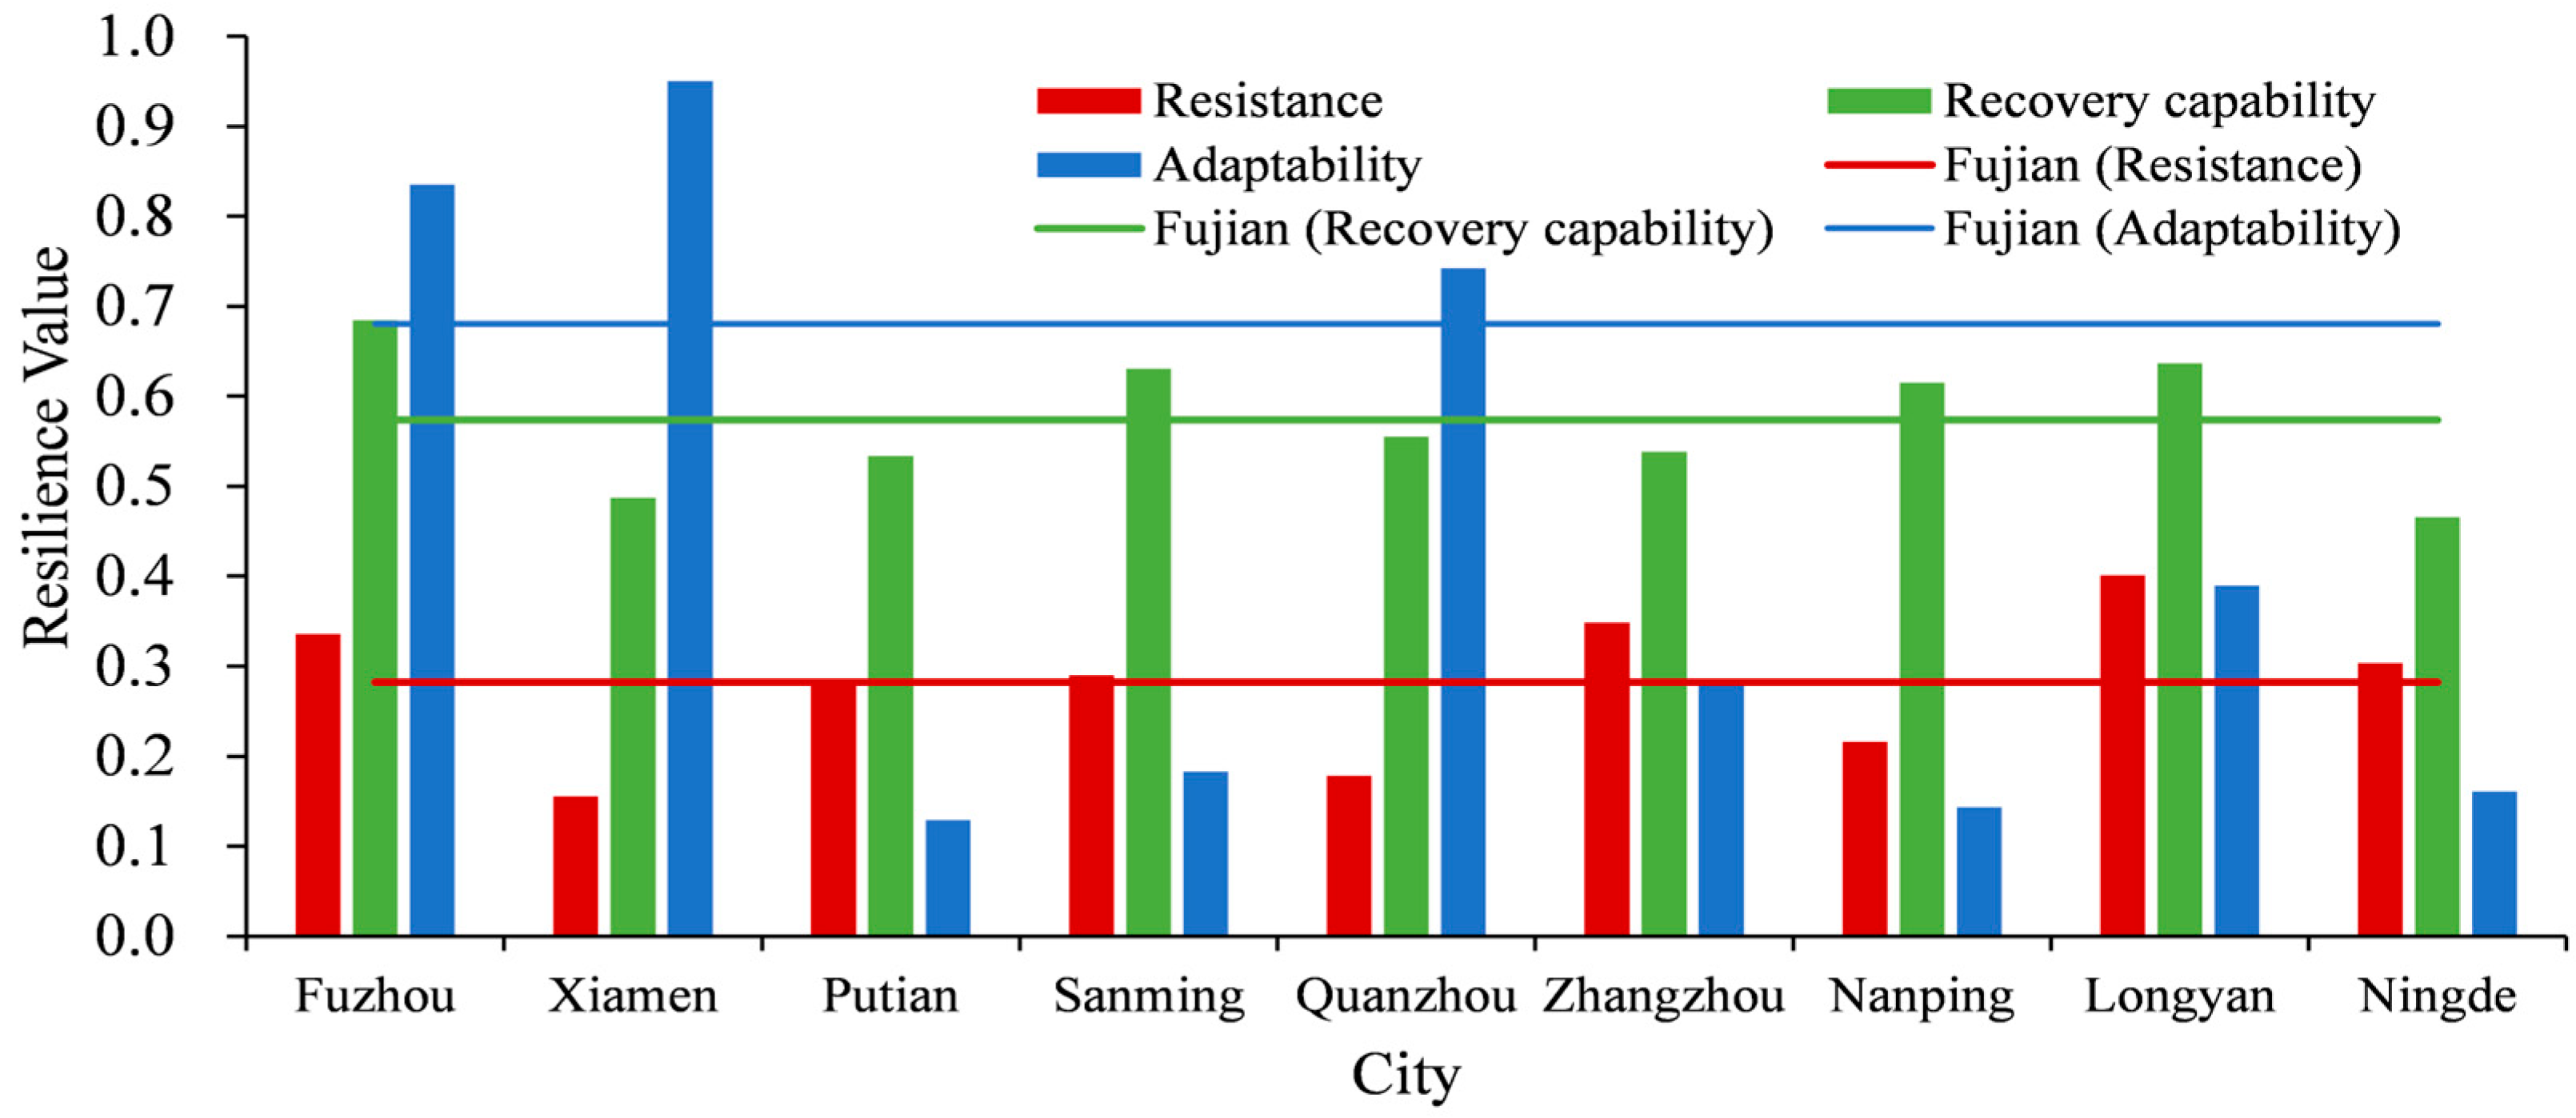
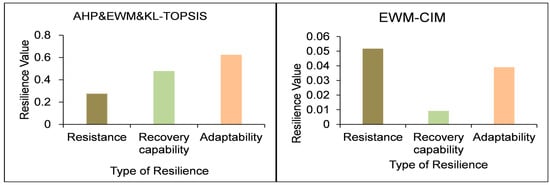
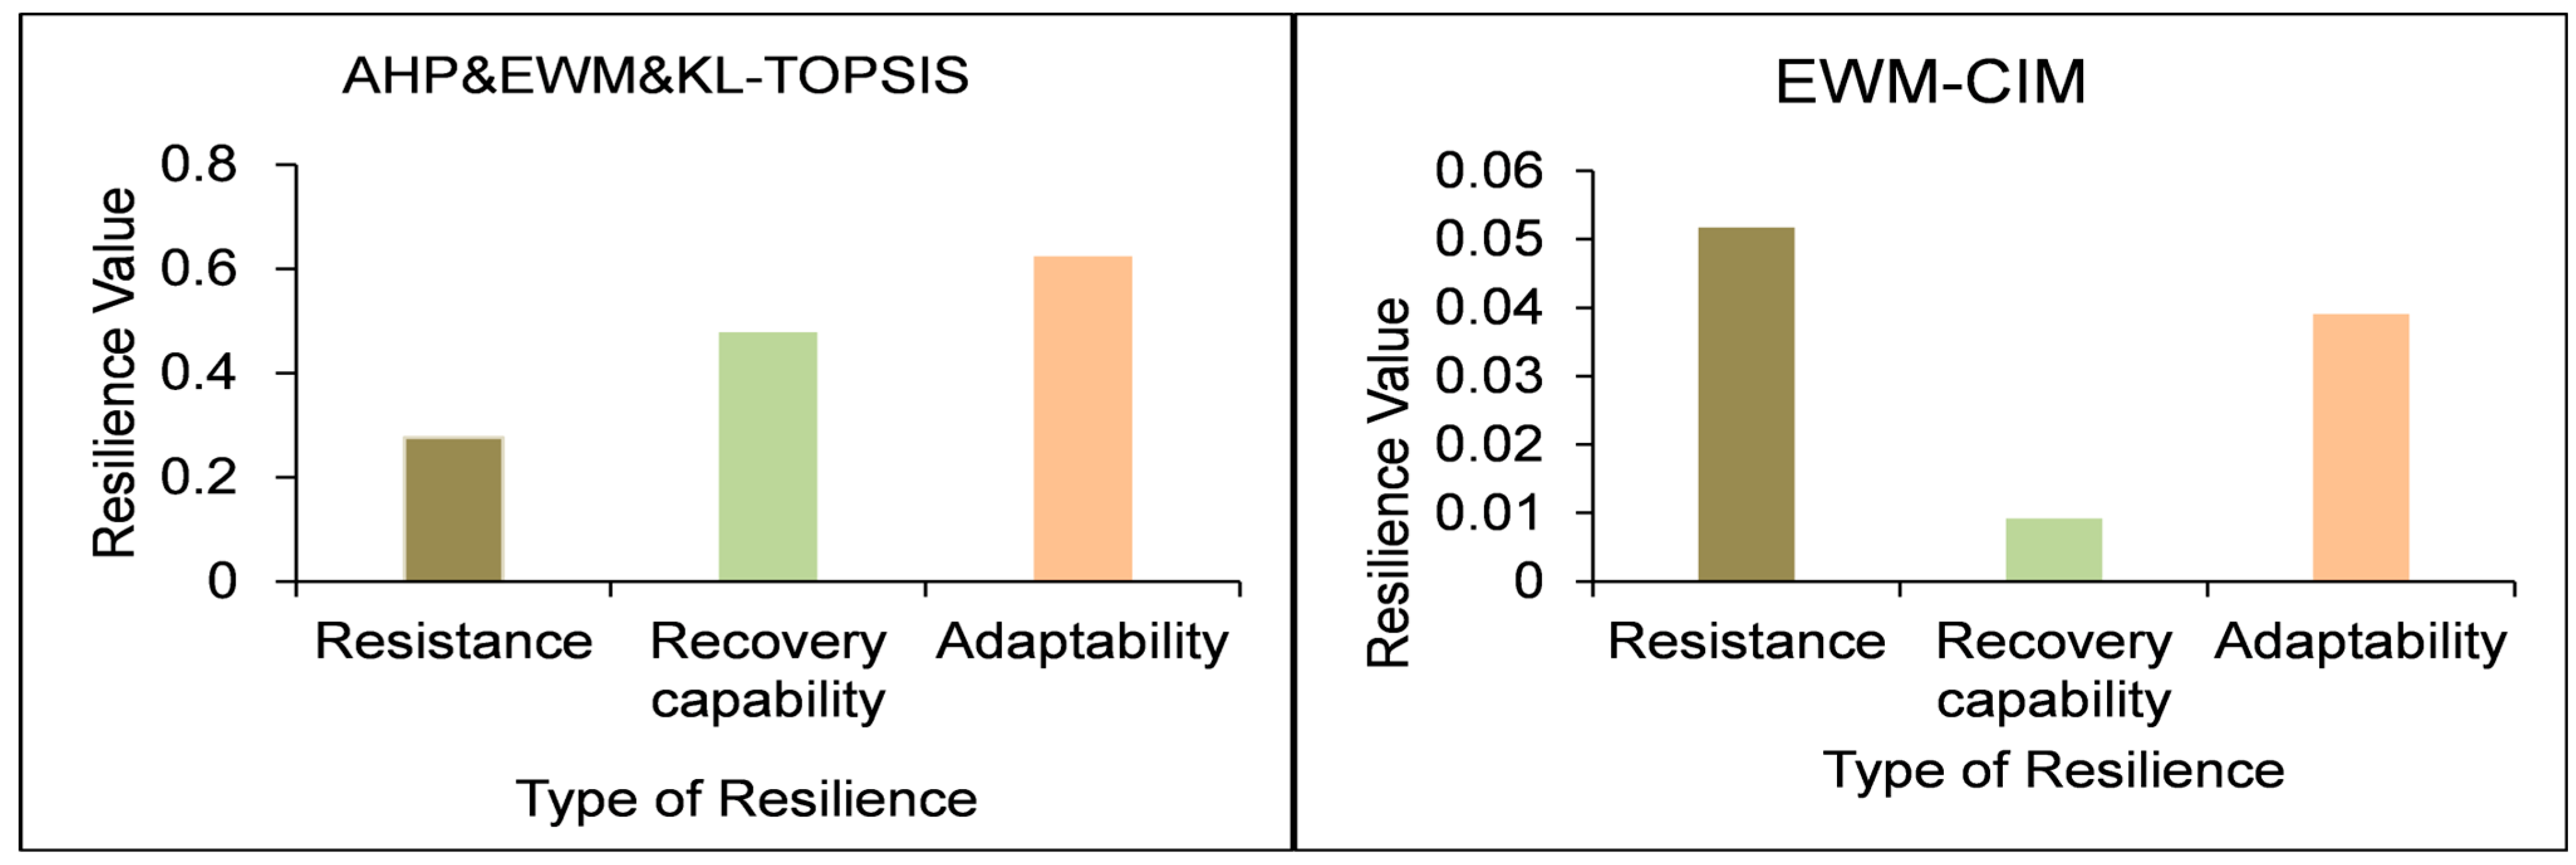
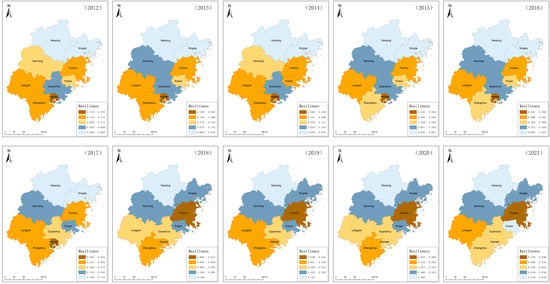
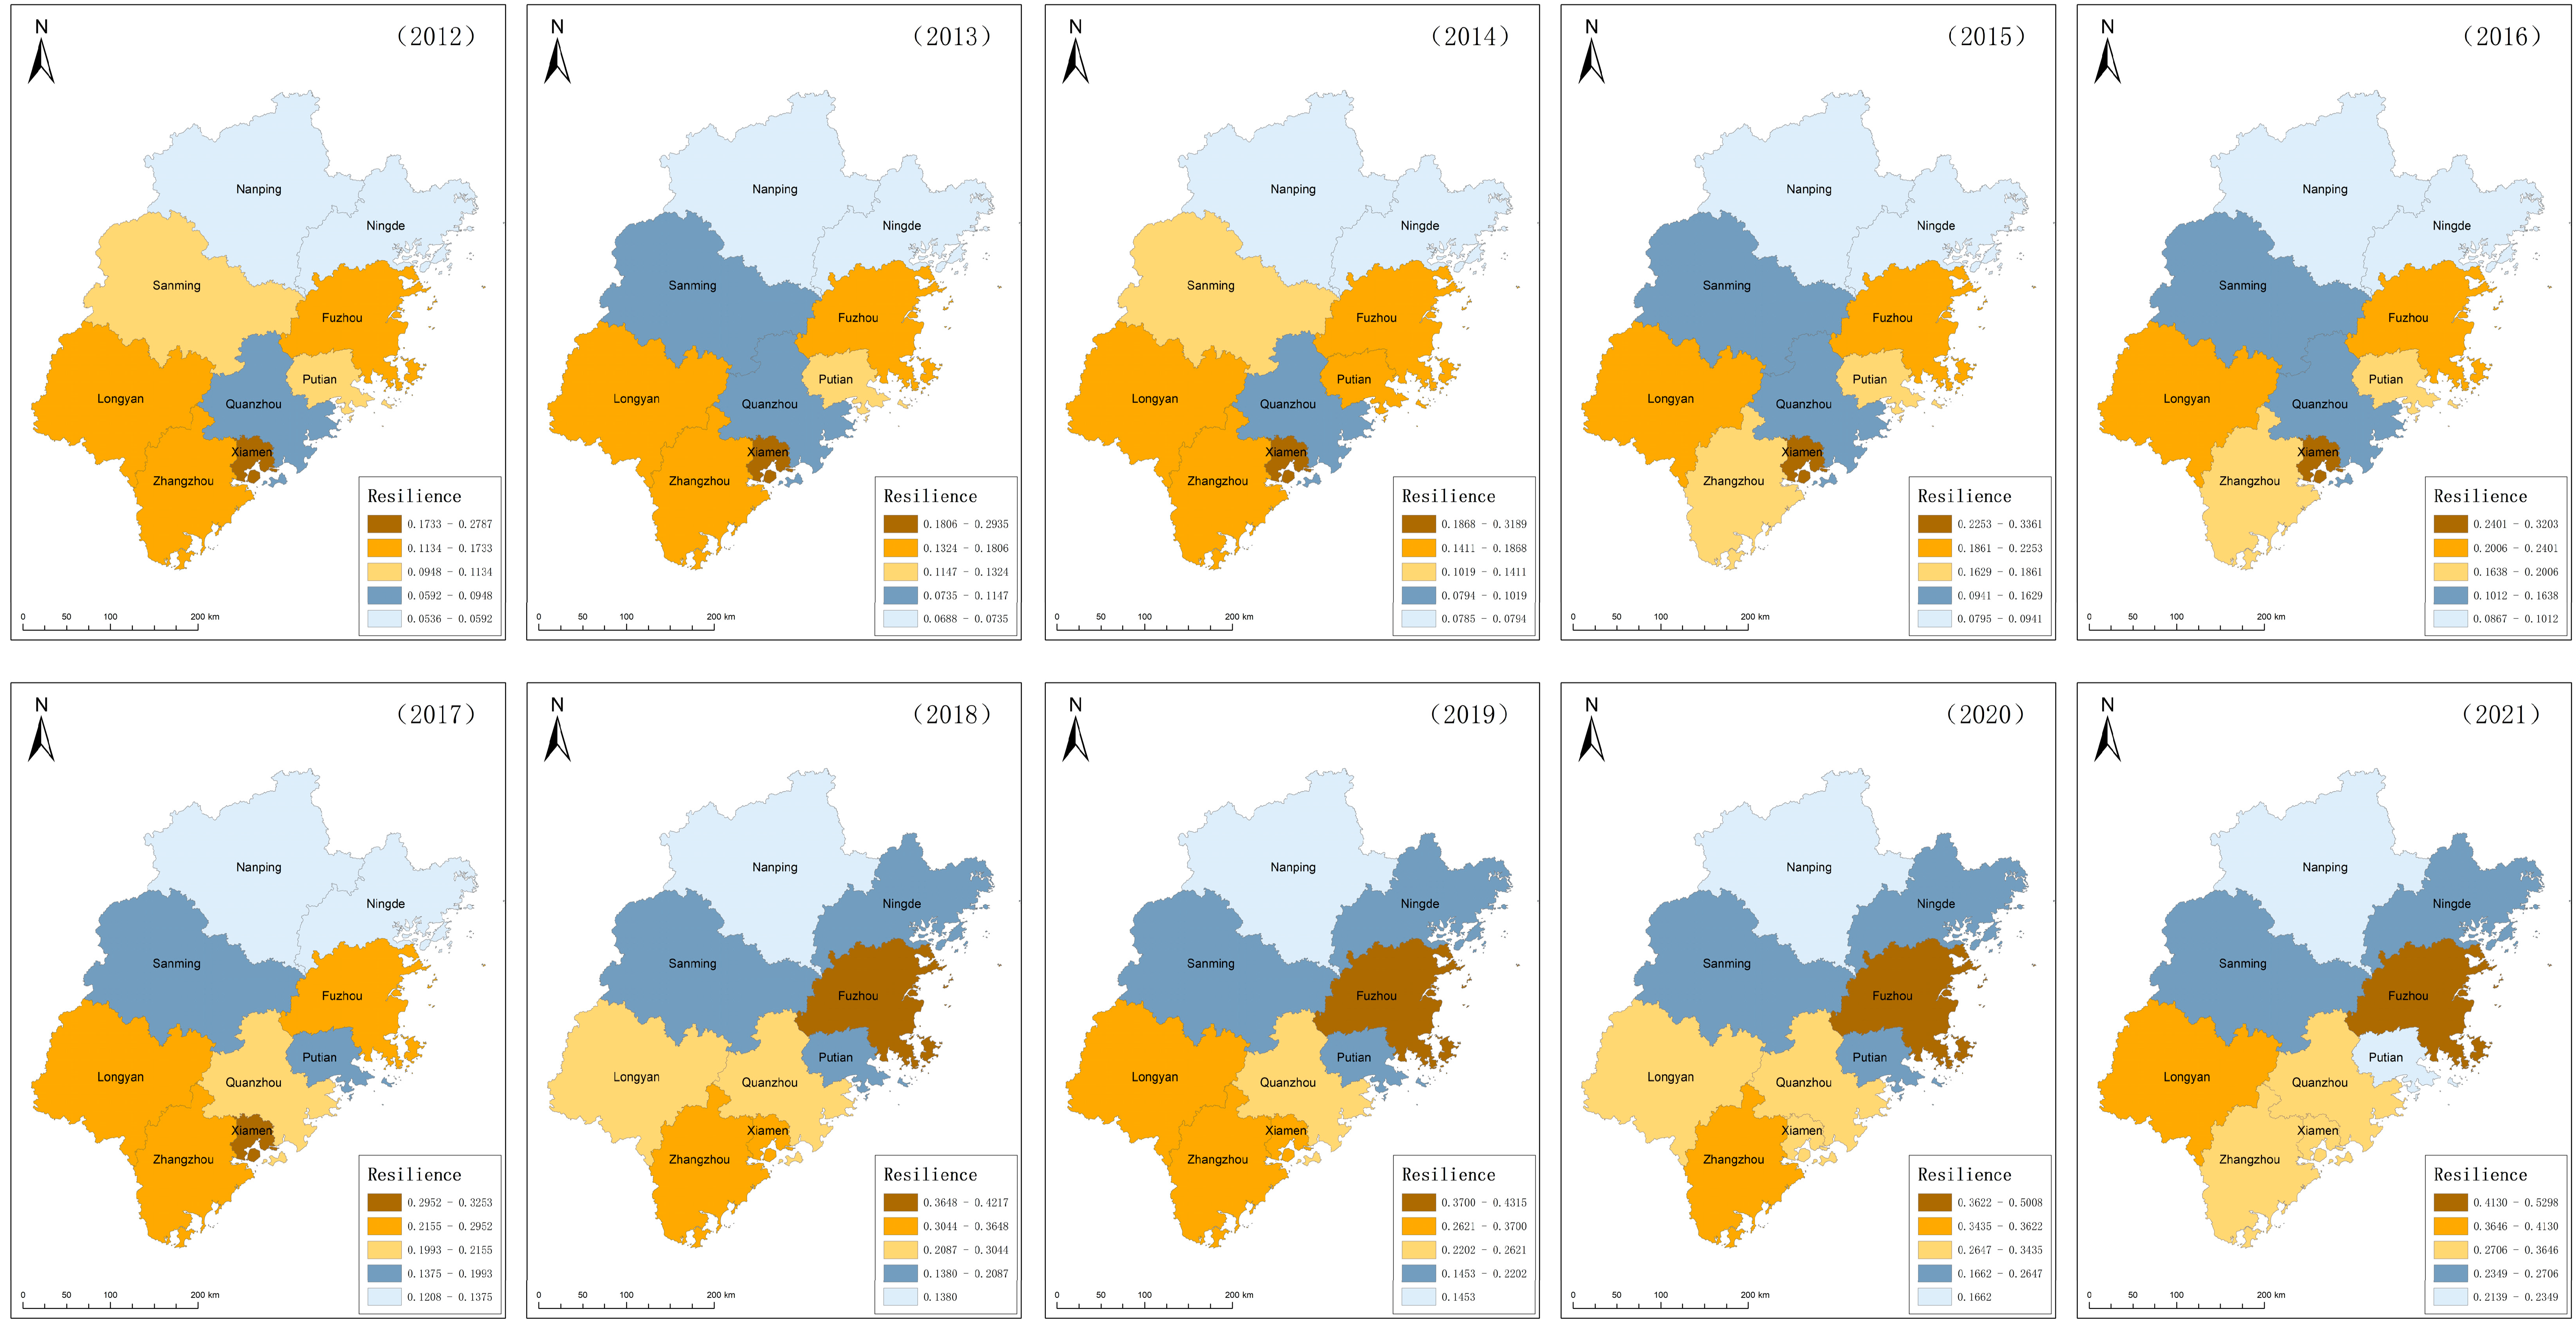
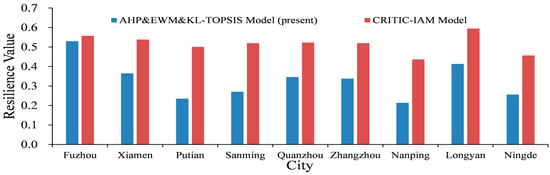
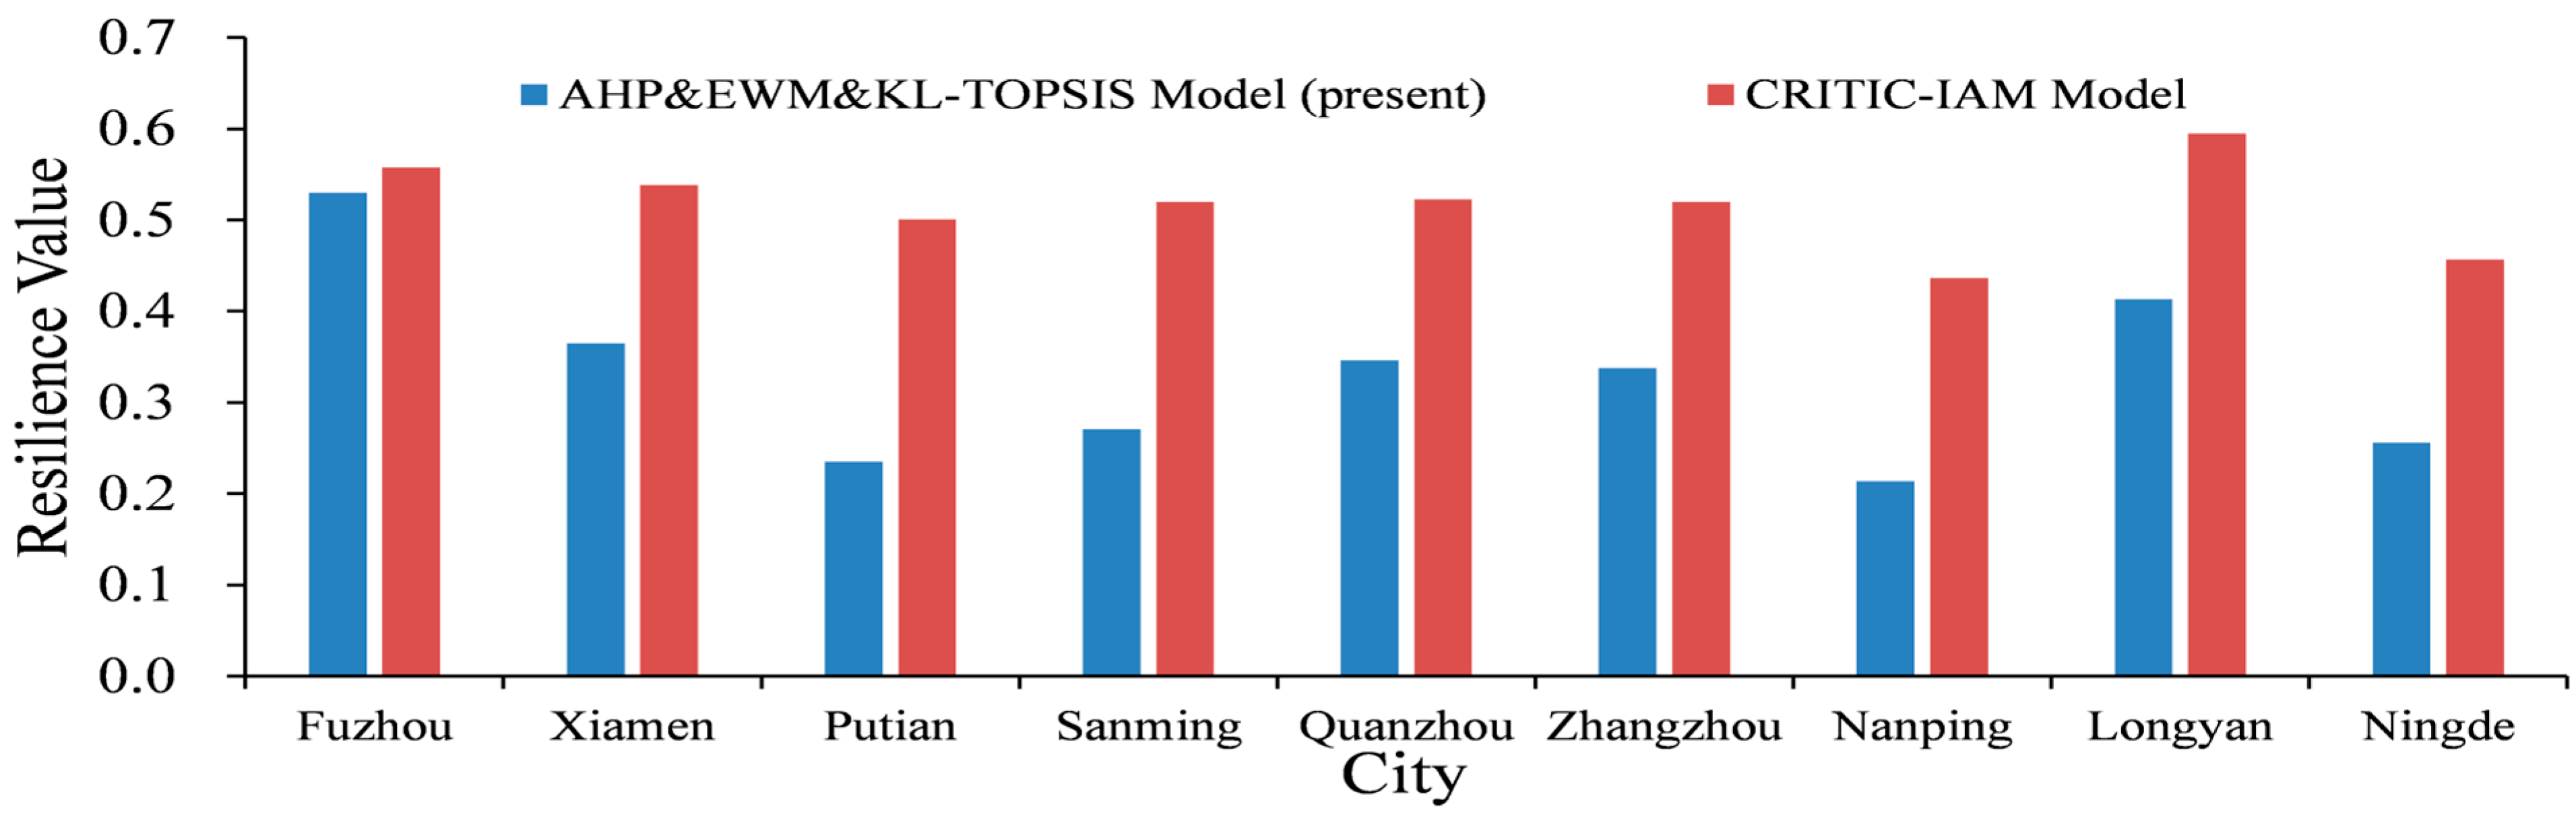

Disclaimer/Publisher’s Note: The statements, opinions and data contained in all publications are solely those of the individual author(s) and contributor(s) and not of MDPI and/or the editor(s). MDPI and/or the editor(s) disclaim responsibility for any injury to people or property resulting from any ideas, methods, instructions or products referred to in the content. |
© 2026 by the authors. Licensee MDPI, Basel, Switzerland. This article is an open access article distributed under the terms and conditions of the Creative Commons Attribution (CC BY) license.