


Abstract
Understanding how economic growth (GDP), livestock production (LPI), agriculture, forestry and fishing (AFF), renewable energy consumption (REN), and urbanization (URB) influence carbon emissions is essential for designing effective climate policies in rapidly developing economies such as India. This study examines the long-run and short-run effects of these factors on CO2 emissions in India during 1990–2024 using the Dual Adjustment Approach (DAA) and the Autoregressive Distributed Lag (ARDL) model. The DAA framework decomposes variables into permanent (trend) and transitory (cyclical) components, allowing a simultaneous assessment of long-run equilibrium and short-run dynamics. Both DAA and ARDL models indicate that GDP and LPI increase CO2 emissions in the long run, while REN reduces them. AFF exerts a weak effect on emissions compared with the other determinants. URB is associated with lower long-run emissions, supporting the urban efficiency hypothesis, but this depends on sustained infrastructure investment and policy support, rather than automatic results of current urbanization levels. The transitory component analysis shows that short-run fluctuations in GDP increase emissions, while the effects of the remaining variables are driven by long-run structural changes. The findings highlight the importance of expanding renewable energy deployment, improving environmental efficiency in agricultural and livestock production systems, and promoting sustainable urban development to reduce carbon emissions in the case of India.
1. Introduction
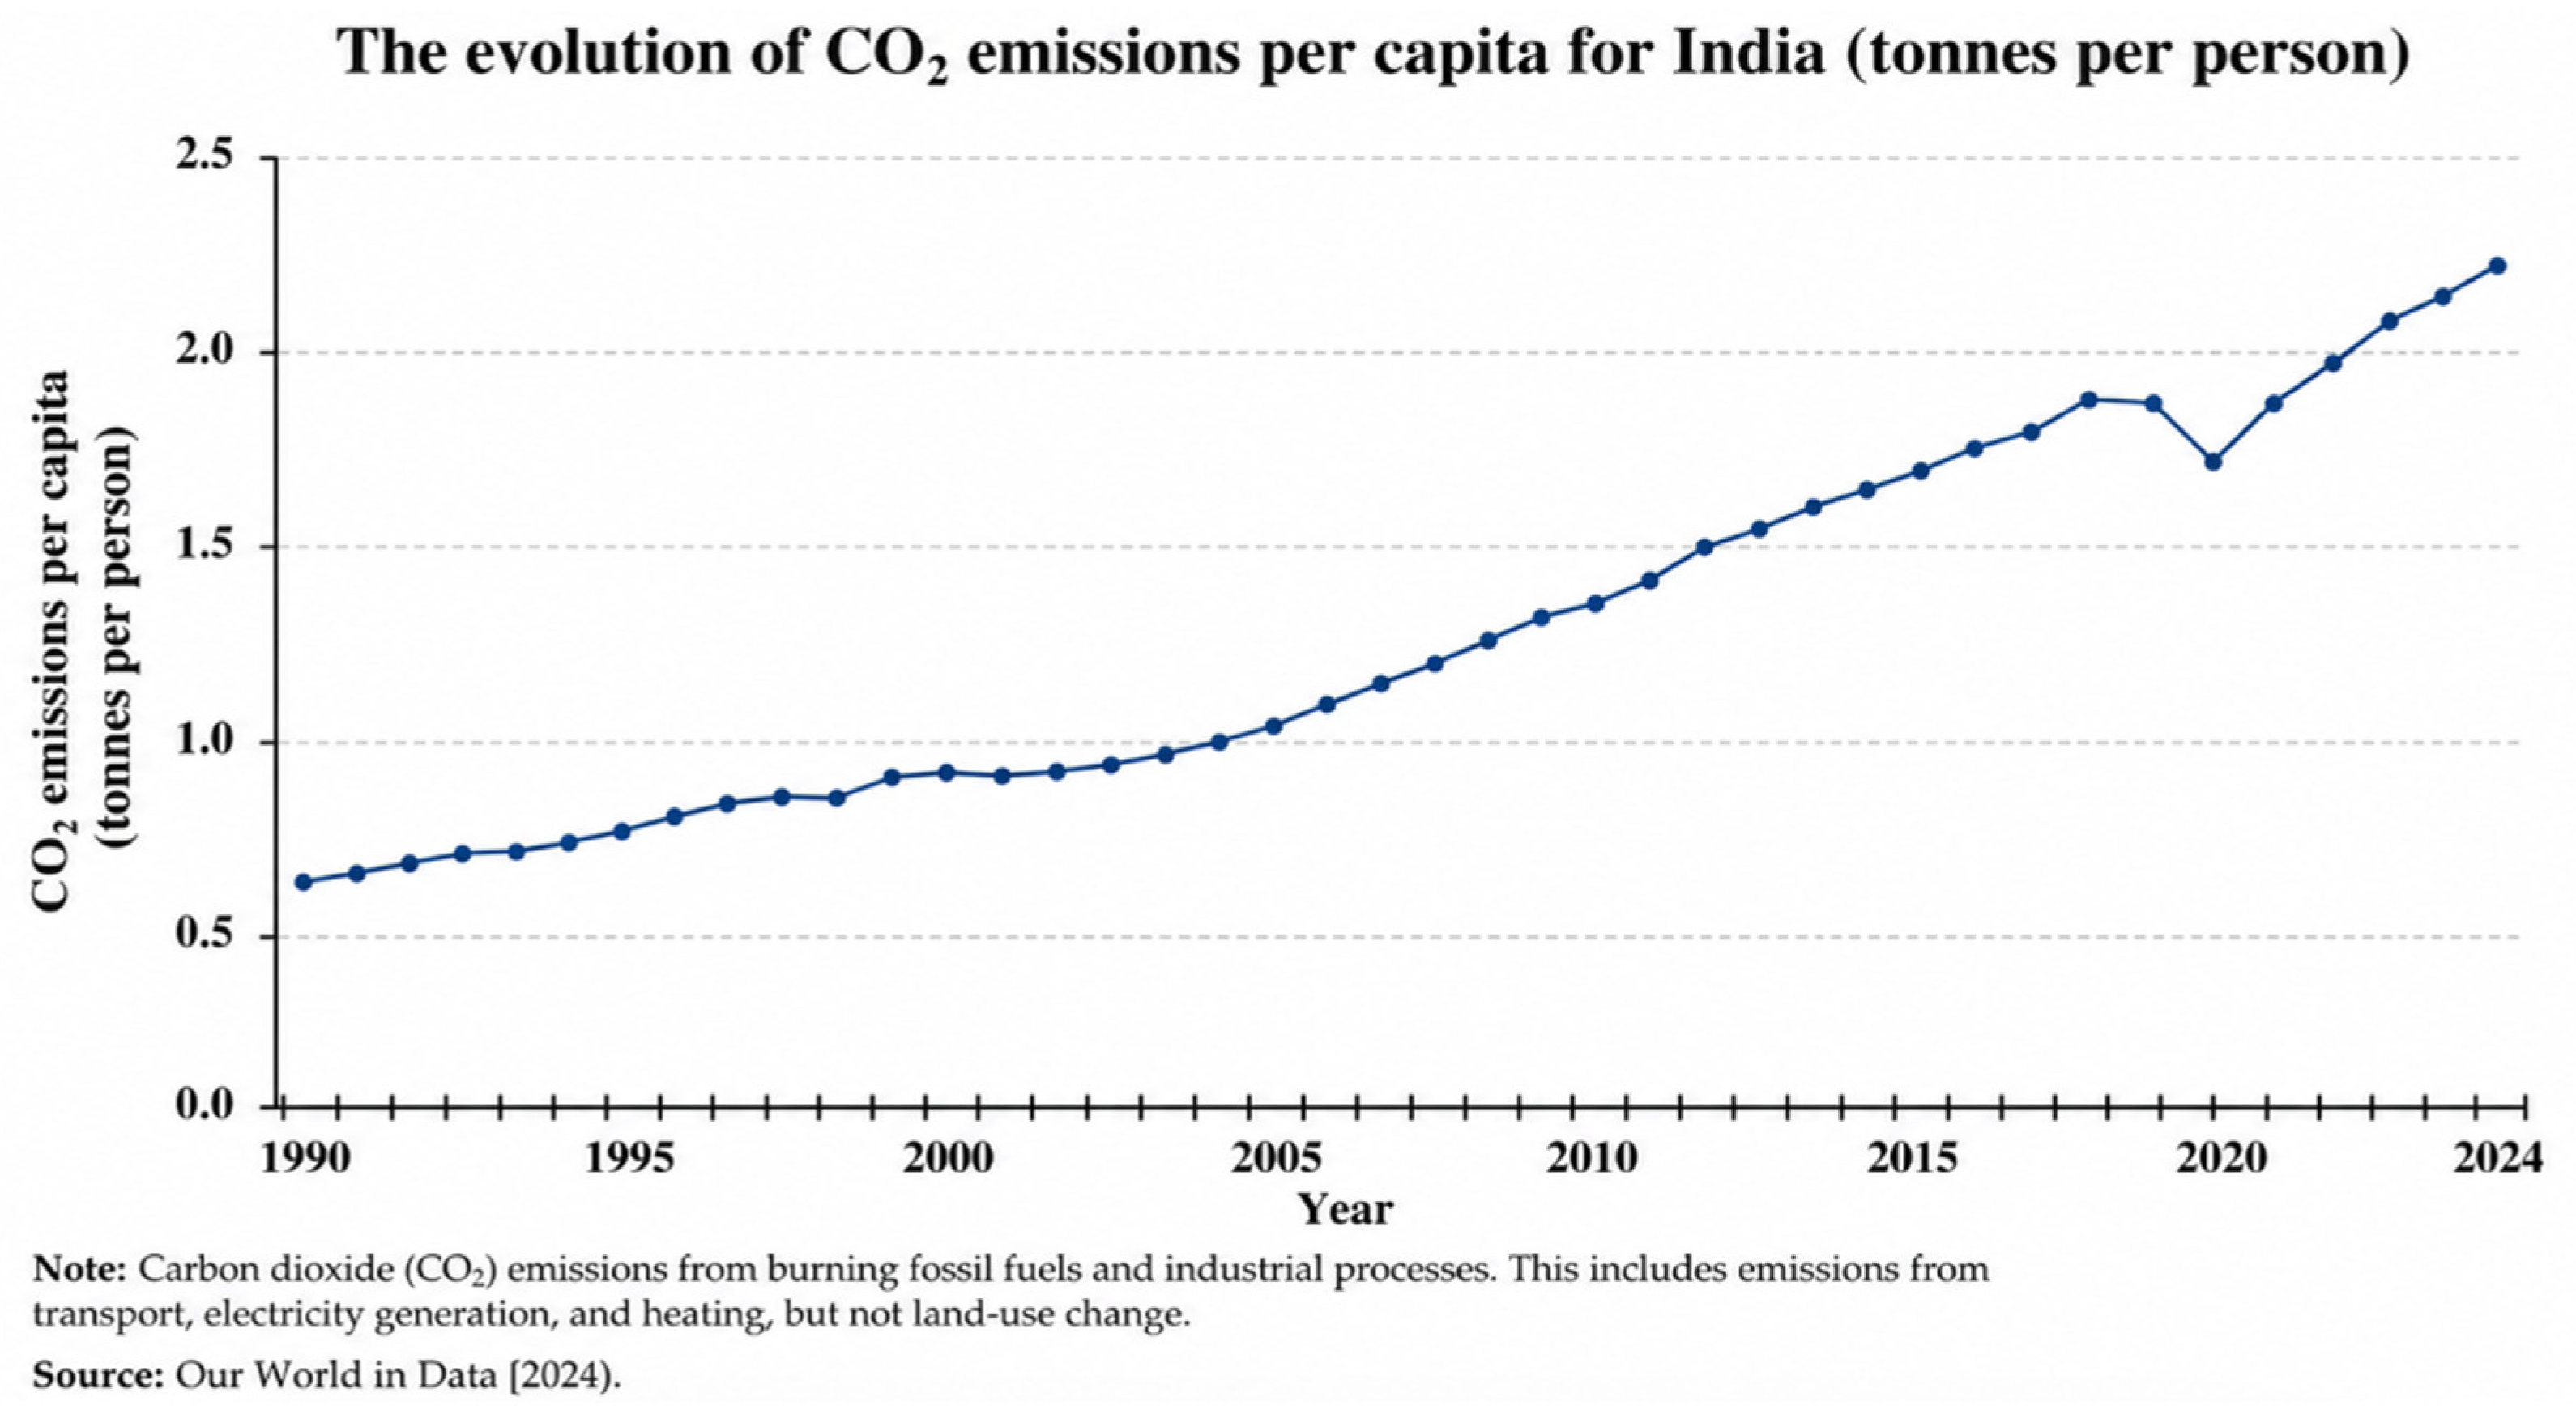
Climate change has emerged as one of the most pressing environmental issues of the 21st century, with CO2 emissions being widely recognized as the main driver of global warming and environmental degradation. Among emerging economies, India occupies a particular position due to its rapid economic growth, expanding population, accelerating urbanization, and increasing energy demand. According to Figure 1, India’s per capita CO2 emissions remain much lower than those of many developed economies, including the United States, Canada, Australia and Russia. However, India’s CO2 emissions per capita during 1990–2024 show an increasing trend (see Figure 2), from less than one tonne per person in the early 1990s to more than two tonnes per person in recent years. This trend reflects the environmental consequences of industrialization, economic expansion and higher energy consumption. According to the Atlas Institute of International Affairs [1], despite substantial investments in renewable energy technologies and India’s commitment to achieving net-zero emissions by 2070, fossil fuels continue to dominate the country’s energy system. Coal remains the main source of electricity generation and supports industrial production and economic growth [2,3]. At the same time, India has expanded renewable energy deployment through initiatives such as the National Solar Mission [4] and other clean-energy programs aimed at reducing carbon intensity and promoting sustainable development. Consequently, India faces the difficult challenge of maintaining economic growth, ensuring energy security and promoting sustainable development. This challenge has attracted attention from policymakers, making the identification of CO2 emissions an important area for policy formulation.
The relationship between economic growth and environmental quality is complex because different socio-economic factors influence emissions through multiple transmission mechanisms. Economic growth stimulates industrial activity, transportation demand and energy consumption, which may increase environmental pressure when production still depends on fossil fuels. Agricultural activity affects emissions through mechanization, irrigation systems, fertilizers, and land-use pressures [5]. Livestock production is another source of environmental impact, since it is associated with methane emissions, manure management and energy-intensive supply chains. Renewable energy is expected to reduce CO2 emissions by decreasing dependence on fossil fuels. Urbanization has an ambiguous relationship with emissions. Rapid and uncontrolled urban growth may increase emissions through higher energy demand, transportation congestion, and industrial concentration [6]. However, urbanization may also improve environmental efficiency through economies of scale, technological diffusion, modern infrastructure, and more efficient public transportation systems [7]. This latter perspective is called “the urban efficiency hypothesis”. Consequently, the effects of the above-mentioned determinants of CO2 emissions are theoretically uncertain and differ with respect to long-run structural transformations and short-run cyclical fluctuations.
A substantial body of literature has examined the determinants of CO2 emissions in India using various conventional econometric approaches [8,9,10,11,12]. These studies regard the relationships among economic growth, energy consumption, renewable energy, urbanization, and environmental degradation. Other contributions emphasize the environmental implications of agricultural and livestock activities, through fertilizer use, mechanization, methane emissions, and land-use pressures [13,14,15,16]. However, several studies treat the adjustment process toward equilibrium as a single mechanism. They focus mainly on long-run and short-run effects. The explicit distinction between permanent structural changes and temporary cyclical fluctuations in the determinants of CO2 emissions is important because these factors may differ. To address this limitation, the present study applies the Dual Adjustment Approach (DAA) proposed by [17], which decomposes variables into permanent (trend) and transitory (cyclical) components. Unlike conventional ARDL studies, which estimate a single adjustment process, the DAA framework enables the separate investigation of long-run equilibrium relationships and short-run cyclical dynamics. So, one can identify whether economic growth, agricultural activity, livestock production, renewable energy consumption, and urbanization affect emissions through structural changes or through temporary fluctuations. Therefore, this study contributes to the literature in two ways. First, it extends the application of the DAA framework to environmental economics and the Indian agricultural and livestock sectors. Second, it provides fresh evidence regarding the permanent and transitory drivers of environmental sustainability in an emerging economy such as India.
The remainder of the paper is organized as follows. Section 2 reviews the relevant literature. Section 3 presents the theoretical analysis underlying the relationships between the explanatory variables and CO2 emissions. Section 4 describes the data and methodology, including the Dual Adjustment Approach and the ARDL framework. Section 5 reports and discusses the empirical results. Section 6 extends the discussion from Section 5. The paper ends with limitations, policy implications, and conclusions, respectively.
Figure 1.
CO2 emissions per capita (tonnes per person) (2024). Note: Carbon dioxide (CO2) emissions from burning fossil fuels and industrial processes. This includes emissions from transport, electricity generation, and heating, but not land-use change. Source: Our World in Data [18].
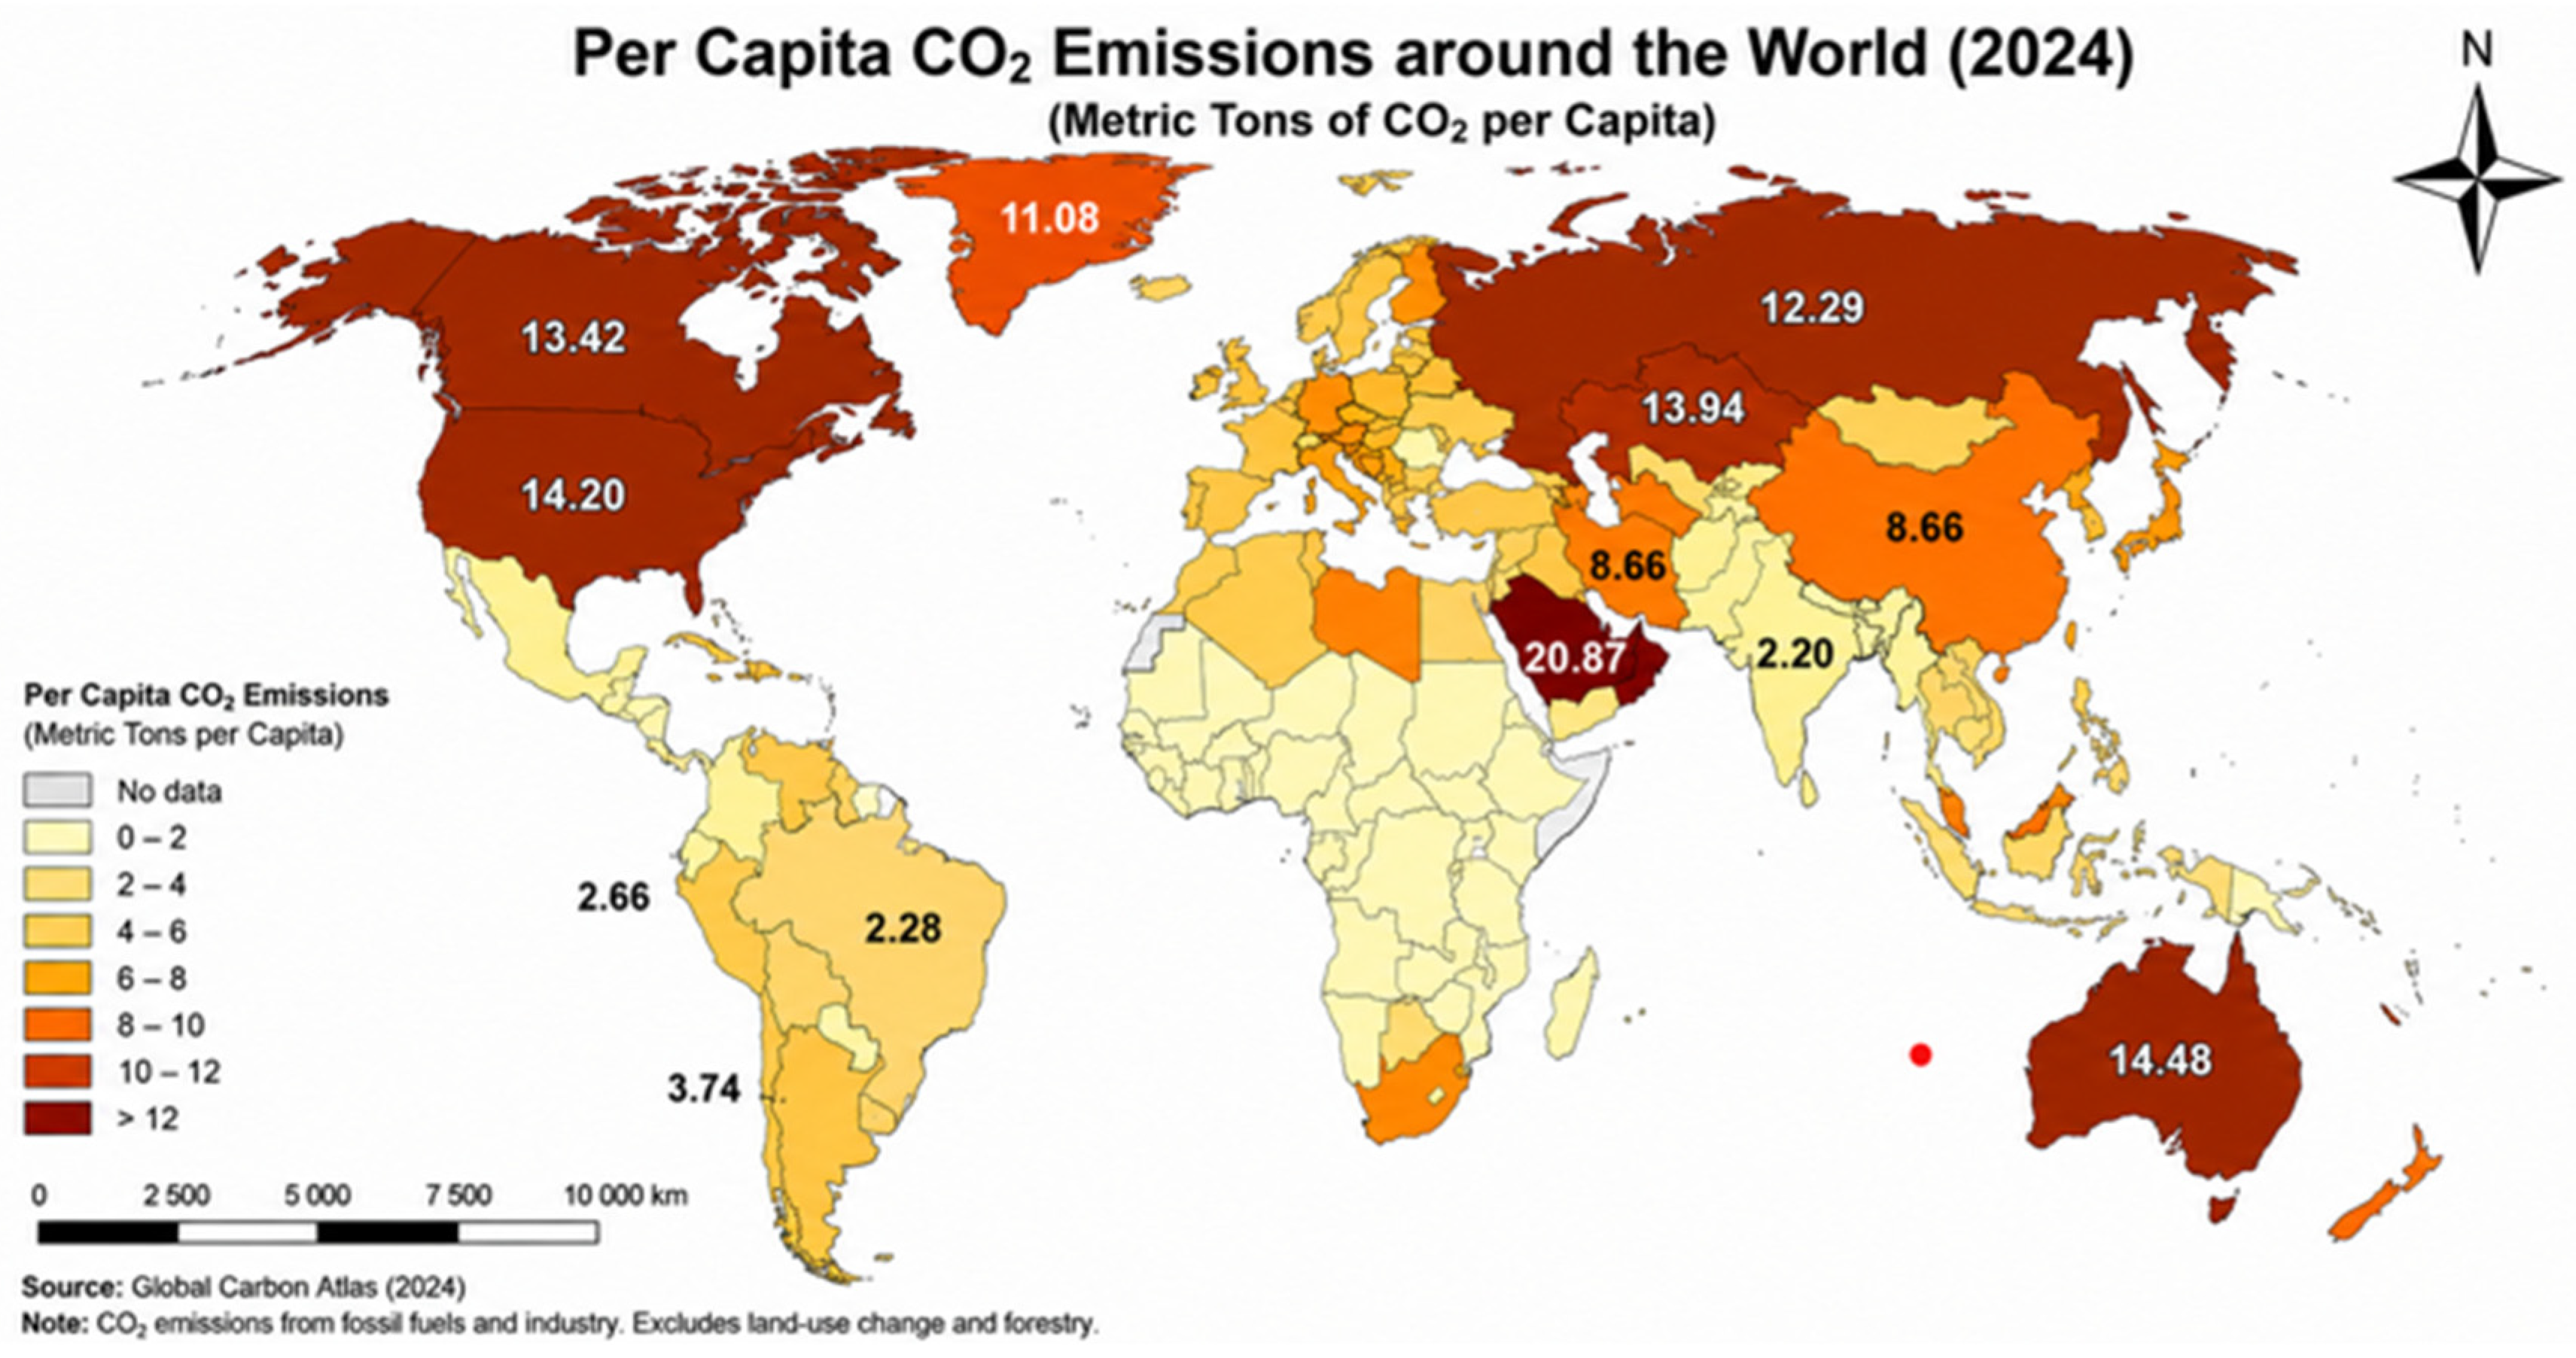
Figure 2.
The evolution of CO2 emissions per capita for India (tonnes per person). Note: Carbon dioxide (CO2) emissions from burning fossil fuels and industrial processes. This includes emissions from transport, electricity generation, and heating, but not land-use change. Source: Our World in Data [18].
2. Literature Review
2.1. CO2 Emissions: Measurements and Determinants
CO2 emissions are among the most widely used indicators of environmental degradation and climate change. They represent the largest share of anthropogenic Greenhouse Gas (GHG) emissions associated with fossil fuel combustion, production, transportation and electricity generation. In studies, CO2 emissions are measured either in total quantities or per capita. Per capita measures are useful when comparing environmental pressure among countries or over time, since they account for demographic change and population growth.
CO2 emissions are shaped by a complex interaction of economic, demographic, sectoral, and energy-related factors. Economic growth exerts environmental pressure in developing economies, particularly when industrial expansion remains dependent on fossil fuels. Ref. [19] confirms that economic expansion and energy demand in India remain important drivers of carbon emissions, highlighting the environmental issues associated with rapid development. Renewable energy adoption appears as a main mechanism for mitigating environmental degradation. Refs. [12,20] show that the expansion of renewable energy capacity contributes to reducing carbon emissions and supporting sustainable development objectives. Tiwari et al. (2013) [8] employ an ARDL framework for India and find a robust long-run relationship between economic growth, coal consumption, and CO2 emissions, confirming that energy use is a key driver of environmental degradation. Ahmad et al. (2016) [9] examine the long- and short-run relationships between carbon emissions, energy consumption, and economic growth in India using ARDL and VECM approaches, confirming the validity of the environmental Kuznets curve and highlighting a bidirectional relationship between economic growth and emissions, with energy consumption exerting a positive impact on environmental degradation. Sharma et al. (2023) [11] investigate the nexus between urbanization, energy consumption, economic growth, and CO2 emissions in India using VECM and Granger causality analysis, finding that energy consumption and economic growth drive emissions, while urbanization does not significantly influence emissions in the short run.
Urbanization remains one of the debated determinants of environmental quality. Rapid urban growth may increase emissions through more intense transportation activities and higher energy demand. Refs. [21,22] support the urban efficiency hypothesis, by which urbanization may improve environmental performance through economies of scale, technological diffusion, or modern infrastructure. In India, the effects of urbanization on environmental change are complex and non-linear. Franco et al. (2017) [23] provide a comprehensive review of the Indian context, highlighting that rapid urbanization significantly increases energy consumption and CO2 emissions, while emphasizing the need for energy efficiency measures and sustainable urban planning to mitigate environmental impacts. Ghosh and Kanjilal (2014) [24] investigate the long-run relationship between urbanization, energy consumption, and economic activity in India, providing evidence of cointegration and unidirectional causality from energy consumption to economic growth and from economic activity to urbanization. Haldar and Sharma (2022) [25] employ the STIRPAT model to examine the impact of urbanization on per capita energy consumption and emissions in India, finding that economic growth, population, and urbanization significantly increase energy demand and CO2 emissions. Martínez-Zarzoso and Maruotti (2011) [26] analyze the relationship between urbanization and CO2 emissions in developing countries, finding an inverted U-shaped pattern that suggests urbanization initially increases emissions but may contribute to environmental improvements beyond a certain threshold.
The “urban efficiency hypothesis” suggests that well-managed urbanization can reduce emissions through better planning, smart infrastructure, and cleaner technologies. Sridhar (2018) [27] compares the relationship between urbanization and carbon emissions in India and China, highlighting that rapid urban growth contributes to increased emissions, while emphasizing the importance of sustainable urban planning to mitigate environmental impacts. Lal and Sethi (2024) [28] demonstrate that improvements in building efficiency and energy use can significantly reduce emissions at the city level. For example, energy-efficient residential systems combined with renewable energy integration can substantially lower per capita CO2 emissions in rapidly urbanizing Indian cities.
Recent advances in heating boiler technology have focused on porous-media-based combustion systems to simultaneously improve thermal efficiency, heat transfer performance, and pollutant reduction. Ref. [29] developed a porous media model for a novel low-NOx heating boiler and demonstrated that optimized burner design, waste heat recovery, and improved flue gas distribution could increase thermal efficiency to over 97% while maintaining extremely low NOx emissions.
2.2. Economic and Environmental Implications of Livestock Production
In addition to energy-related factors, agricultural and livestock activities have also been identified as important determinants of environmental degradation in India. These sectors contribute to CO2 emissions through multiple channels, including land-use changes, mechanized farming, fertilizer production and application, feed cultivation, transportation, processing activities, refrigeration systems, and energy-intensive supply chains. Although livestock production is often associated with methane emissions, its relevance in CO2-based models stems from its close connection with energy use, land-use pressures, and carbon-intensive agricultural value chains [13,30,31]. Therefore, livestock production is relevant because it reflects broader production processes that generate carbon emissions throughout the agricultural value chain. According to [16], livestock-related activities, in particular enteric fermentation and manure management, remain major contributors to GHG emissions in India. Similarly, ref. [13] identifies livestock and rice production as the main sources of environmental pressure within Indian agriculture. Achieving a sustainable food system requires systemic innovation across food production, land use, emissions reduction, dietary improvements, and waste management [30]. Global food production generated approximately 17.3 GtCO2-equivalent emissions annually, with animal-based foods accounting for 57% of total emissions [32]. South and Southeast Asia and South America emerged as the largest production-based GHG emission hotspots due to livestock production, land-use change, and farmland management [32]. Livestock production is both a major contributor to climate change and an essential source of food security and livelihoods, highlighting that targeted investments in low-emission production systems are necessary to reduce methane emissions and achieve climate goals [33].
Agricultural intensification affects environmental sustainability through dependence on synthetic fertilizers, mechanization, and external inputs. Fertilizer use remains a major source of agricultural emissions in India [15]. The rice–wheat cropping system contributes substantially to environmental pressure due to intensive fertilizer use and energy-demanding cultivation practices [34]. The expansion of synthetic fertilizer use has generated nitrogen and phosphorus surpluses, reduced nutrient-use efficiency and increased environmental losses in India [35]. Despite these concerns, technological innovation, precision agriculture, improved feed efficiency, and sustainable livestock management practices can reduce the environmental footprint of agricultural production [30,36]. Global food systems are estimated to account for about one-third of total anthropogenic greenhouse gas emissions, with livestock production representing a major source of emissions through enteric fermentation, feed production, land-use change, and manure management [37]. Emissions from global food systems, particularly those associated with agricultural and livestock production, are sufficiently large to threaten the achievement of international climate targets without significant mitigation efforts [38]. Even the lowest-impact animal products generally produce higher environmental burdens than plant-based substitutes, emphasizing the significant contribution of livestock production to global environmental degradation [39]. Food transportation contributes substantially to global food-system emissions, accounting for approximately 19% of total emissions, with fruit and vegetable supply chains generating particularly high transport-related carbon footprints [40]. Cradle-to-grave emissions from food loss and waste account for nearly 50% of food-system greenhouse gas emissions, emphasizing the critical role of sustainable supply-chain management in reducing environmental impacts [41]. Using CS-ARDL and MM-QR approaches, Liu and Liu (2025) [42] demonstrated that agricultural carbon footprints and sustainable development are closely interconnected in Asia, with the impact of agricultural emissions varying across different levels of sustainability performance. Ref. [43] argued that although agricultural intensification and irrigation have significantly increased food production in South Asia, they have also contributed to environmental degradation through the unsustainable use of land and water resources. Livestock wastewater contains high levels of chemical oxygen demand (COD), biological oxygen demand (BOD), and total dissolved solids (TDS), indicating substantial organic and nutrient pollution associated with inadequate livestock waste management [44]. Ref. [45] showed that international trade reshapes the geographical distribution of agricultural emissions, emphasizing the need to integrate trade-related emissions into climate and sustainability strategies.
Consequently, the relationship between livestock production and CO2 emissions remains an empirical question, particularly in emerging economies such as India, where agricultural modernization, economic growth, and environmental sustainability interact through multiple transmission channels.
2.3. Dual Adjustment Approach: Theoretical and Empirical Background
The Dual Adjustment Approach was introduced in [17] as an alternative framework for analyzing nonstationary economic variables by separating their permanent and transitory components. This approach was motivated by the observation that conventional cointegration techniques, such as Engle–Granger, Johansen, and ARDL models, assume a single adjustment mechanism. These approaches do not distinguish between trend and cyclical dynamics. DAA proposed by [17] recognizes that economic variables may respond differently to permanent structural changes and temporary cyclical fluctuations. Ref. [17] introduced the concept of a common Hodrick–Prescott (HP) trend and proposed a framework that allows permanent and transitory components to be modeled separately.
The theoretical foundations of DAA are related to the Permanent Income Hypothesis (PIH) by Friedman (1957) [46], which distinguishes between permanent and temporary income changes. PIH assumes that economic agents respond differently to permanent and transitory shocks, implying that aggregate relationships may be characterized by multiple adjustment mechanisms. Similar arguments have been developed in the literature of business cycles and trend–cycle decomposition. The separation of long-run structural trends from short-run fluctuations contributes to the understanding of economic dynamics [47,48,49].
Empirical applications of DAA have moved beyond the original consumption-function framework. Ref. [17] applied DAA to the relation between personal consumption expenditure and disposable income in the United States and demonstrated that the variables shared a common HP trend despite the absence of conventional cointegration. Subsequent studies have applied DAA to environmental and sustainability issues. Ref. [50] applied DAA for Turkey to identify whether environmental pressures arise from permanent structural changes or temporary cyclical fluctuations in the explanatory variables. Likewise, DAA was employed to distinguish long-run and short-run dynamics, revealing that trade openness enhances the load capacity factor, while renewable energy consumption, economic growth, and nonrenewable energy consumption affect environmental sustainability in Mexico [51].
DAA has been applied to a broader range of macroeconomic relationships. Using DAA, evidence from China showed that economic growth, urbanization, and CO2 emissions increase healthcare expenditure in the long run [52]. DAA was also used in the study of the effects of current, investment, and transfer government expenditures on unemployment in Turkey, revealing distinct long-run and cyclical dynamics and providing empirical support for both the Abrams curve hypothesis and the Keynesian perspective [53].
DAA also has limitations. The identification of permanent and transitory components depends on filtering procedures such as the Hodrick–Prescott, Baxter–King, or Christiano–Fitzgerald filters, which may be sensitive to the choice of smoothing parameters and sample size. In addition, critics have argued that filtering techniques can potentially distort underlying time-series properties and generate spurious cycles if applied improperly. The interpretation of trend and cyclical components may vary across filtering methods, making robustness analysis essential.
2.4. Research Gaps and Contribution of the Present Study
Although the determinants of CO2 emissions in India have been extensively investigated, several limitations remain in the existing literature. Most studies focus on the relationship between economic growth, energy consumption, renewable energy, and environmental degradation using conventional econometric approaches such as ARDL, VECM, cointegration analysis, and causality tests. All these studies treat the adjustment process as a single mechanism and do not distinguish between structural and cyclical sources of environmental change.
A second limitation concerns the treatment of agricultural and livestock activities. Even if agriculture and livestock production play a central role in the Indian economy and contribute substantially to environmental degradation, these sectors have received less attention than economic growth and energy-related variables. The contribution of livestock production and agriculture, forestry, and fishing activities remains underexplored.
A third limitation is methodological. Conventional cointegration frameworks estimate long-run effects and short-run adjustments but do not identify whether the observed environmental impacts originate from permanent structural transformations or temporary fluctuations. As a result, policymakers obtain limited information regarding whether environmental pressures are driven by long-term development patterns or by short-term cyclical disturbances.
The present study addresses these gaps in several ways. First, it extends the application of DAA to the analysis of environmental sustainability in India, allowing the decomposition of explanatory variables into trend and cyclical components. Second, it provides new evidence on the environmental roles of livestock production and agriculture alongside economic growth, renewable energy consumption, and urbanization. Third, the combination of DAA with the ARDL framework offers a deeper understanding of both long-run equilibrium relationships and short-run adjustment processes. From a practical perspective, the findings can be useful for policymakers by identifying whether environmental pressures arise primarily from structural economic transformations or from temporary fluctuations.
3. Theoretical Analysis
This study is based on the premise that carbon emissions are generated by economic activities that require energy, natural resources, and production inputs. In the case of India, rapid economic growth, agricultural modernization, livestock expansion, urbanization, and energy transformation have altered the relationship between economic development and environmental quality. The determinants of carbon emissions operate through different transmission channels and may exert both permanent and temporary effects on environmental outcomes. Next, we will briefly discuss these transmission channels.
3.1. Economic Growth–Emission Mechanism
Economic growth influences carbon emissions through the scale, composition, and technique effects [54]. The scale effect suggests that economic expansion increases production, transportation activities and energy consumption, generating higher emissions. The composition effect refers to structural changes in the economy when a country develops and the economic activity shifts from agriculture to more energy-intensive activities. The technique effect takes place through technological progress and innovation, improvements in production efficiency, which reduce emissions per unit of output.
Economic growth influences carbon emissions through the scale effect. When income increases, industrial activities intensify and energy demand increases. Since a substantial share of India’s energy system still depends on fossil fuels, higher economic activity generally leads to greater carbon emissions. Economic growth also stimulates household consumption, which increases demand for energy-intensive goods and services. This is in line with the Environmental Kuznets Curve (EKC) hypothesis, which posits that in the early stages of economic development, industrialization and rising energy consumption increase environmental degradation and carbon emissions [54,55].
Economic growth may also generate efficiency gains through technological progress, innovation, and capital accumulation. Advanced technologies can improve energy efficiency, cleaner production processes, and reduce emissions per unit of output [56]. Technological innovation can offset the environmental pressures associated with economic expansion [57]. Therefore, the net environmental impact of economic growth depends on whether the scale effect dominates the efficiency effect. In developing economies such as India, industrialization and energy demand grow higher. Fossil fuels remain a major component of the energy mix; hence, the scale effect remains strong. Therefore, economic growth is expected to exert a positive impact on carbon emissions.
3.2. Livestock Production–Emission Mechanism
Livestock production affects carbon emissions through several interconnected channels. First, livestock systems require large quantities of feed, water, land, and energy inputs. The production and transportation of feed crops increase fossil fuel consumption and agricultural emissions. Second, livestock production generates GHG emissions through enteric fermentation and manure management [16]. Third, the expansion of livestock activities increases pressure on land resources, which may lead to changes in land use and reductions in carbon sequestration capacity [5].
From a production-system perspective, livestock production represents a complex supply chain involving feed production, transportation, processing, refrigeration, and distribution. Consequently, increases in livestock production contribute not only to direct emissions but also to indirect emissions generated throughout the food production system. Therefore, livestock expansion is expected to increase environmental pressure and carbon emissions.
3.3. Agricultural Activity–Emission Mechanism
Agricultural activity influences carbon emissions through input intensification. Modern agriculture relies on mechanization, irrigation systems, synthetic fertilizers, pesticides, and transportation networks. These activities require larger energy inputs and generate emissions during both production and application processes [58].
Agricultural development may increase resource-use efficiency through advanced technologies, better farm management practices, and precision agriculture. Consequently, agriculture contains both emission-generating and emission-reducing mechanisms. The impact depends on whether production expansion occurs faster than efficiency improvements. In rapidly developing agricultural economies like India, production effects often dominate efficiency gains, implying a positive contribution to emissions [40].
3.4. Renewable Energy Consumption–Emission Mechanism
Renewable energy consumption influences carbon emissions through the energy transmission mechanism. According to Energy Transition Theory [59], economies move from carbon-intensive energy systems based on fossil fuels toward cleaner and more sustainable energy sources. This transition reduces the carbon intensity of economic activity and contributes to environmental sustainability. The replacement of fossil fuels with renewable energy sources reduces the carbon intensity of economic activity and contributes to environmental sustainability. First, renewable energy reduces dependence on oil, coal and fossil fuels, which are the main source of carbon emissions in developing countries. Second, the expansion of renewable energy encourages technological innovation. Energy efficiency is improved in the production process. Third, renewable energy investments stimulate the modernization of the energy sector and facilitate the transition to cleaner production systems [12,20]. In the case of India, renewable energy has become a central component of national energy and climate policy. Government initiatives, including the National Solar Mission have accelerated investments in solar and other renewable technologies.
3.5. Urbanization–Emission Mechanism
Urbanization affects carbon emissions through both emission-generating and emission-reducing mechanisms. Rapid urban expansion increases population density, industrial agglomeration, and residential energy consumption. These factors may increase environmental pressure and carbon emissions. On the other hand, the urban efficiency hypothesis suggests that urbanization may improve environmental performance through economies of scale, technological diffusion, and more efficient infrastructure systems. Modern urban development can allow investments in smart cities, energy-efficient buildings, and advanced waste-management systems, lowering emissions.
Therefore, the focus should be on the balance between scale effects and efficiency effects. In developing economies such as India, urbanization has accelerated economic modernization and technological progress.
The theoretical framework in Figure 3 shows that economic growth (GDP) and LPI tend to increase CO2 emissions, while REN and URB help reduce environmental pressures. AFF may have either positive or negative effects depending on production practices and technological development. Environmental sustainability in India depends on the balance between growth-related emissions and mitigation factors.
Figure 3.
Theoretical framework of CO2 determinants in India. Note: Arrows marked with (+) indicate an expected positive effect on CO2 emissions, whereas arrows marked with (−) indicate an expected negative effect. The dashed arrow marked with (±) denotes a context-dependent effect that may be either positive or negative depending on technological progress, production practices, and policy conditions. Solid arrows represent direct relationships between variables. Green dashed arrows indicate indirect pathways through environmental sustainability.
4. Methodology and Input Data
This study employs annual time-series data for India spanning the period 1990–2024. The variables were selected based on their theoretical and empirical relevance in explaining environmental degradation and sustainable development. Specifically, CO2 emissions serve as the environmental indicator, while economic growth (GDP), agriculture, forestry and fishing value added (AFF), livestock production index (LPI), renewable energy consumption (REN), and urbanization (URB) are considered the main explanatory variables. The dataset was extracted from the World Development Indicators (WDI) and Our World in Data, as seen in Table 1. Because AFF is measured as value added relative to GDP, increases in AFF indicate a greater economic contribution of agriculture, forestry, and fishing activities to the national economy rather than an expansion in physical agricultural output alone.
Table 1.
Input data.
A limitation is that the dependent variable captures CO2 emissions from fossil fuel combustion and industrial processes only and does not account for carbon sequestration or carbon storage provided by agricultural, forestry, and land-use systems. Consequently, the analysis evaluates the determinants of emissions rather than the net carbon balance. Future research could incorporate indicators of carbon sequestration, forest carbon stocks, or land-use change to provide a more comprehensive assessment of environmental sustainability.
To reduce heteroscedasticity and facilitate elasticity interpretation, all variables are transformed into natural logarithms prior to estimation [60].
The stationarity properties of the variables were examined using the KPSS unit root test developed by [61], which tests the null hypothesis of stationarity against the alternative of a unit root.
4.1. Dual Adjustment Approach Formulation
This study applies the DAA proposed by [17] to investigate the long-run relationship between CO2 emissions and their determinants for India. Unlike the usual cointegration technique that assumes a single adjustment mechanism towards equilibrium, the dual adjustment approach allows separate adjustments in long-run and short-run fluctuations of the variables. To implement this method, the variables are decomposed into trend and cyclical components using the Hodrick-Prescott (HP) filter [47]. The HP filter separates each variable into a smooth long-run component and a short-run deviation component. The influence of temporary fluctuations is reduced. For annual data, the smoothing parameter is set to λ = 6.25 under the HP filter, following the recommendation of [62]. Ravn and Uhlig [62] demonstrated that the conventional value λ = 1600 used for quarterly data should be adjusted according to the observation frequency. Applying their frequency-adjustment rule yields λ = 6.25 for annual data, whereas the traditional value λ = 100 tends to over-smooth annual series by removing a substantial portion of medium-term fluctuations. Consequently, λ = 6.25 is considered more appropriate for preserving the underlying trend–cycle structure of annual macroeconomic data. Because filtering results may be sensitive to the choice of smoothing parameter and decomposition method, robustness checks were conducted using Baxter–King (BK) [48] and Christiano–Fitzgerald (CF) [49] filters. Following the dual adjustment framework, the long-run relationship between the trend components of the variables can be expressed as:
where , , , and denote the trend components extracted from the HP filter. is the error term which is serially correlated [17]:
In the second step, the stationarity of the residuals obtained from Equation (1) is examined in order to determine the presence of a common trend among the variables. This step can be expressed as:
where .
Under the null hypothesis of no common HP trend, the coefficient . Failure to reject the null hypothesis implies that the residuals are non-stationary and that no common long-run trend exists among the variables. The short-run dynamics can also be analyzed using the cyclical components obtained from the filtering procedure. The short-run equation is:
where , , , , denote the cyclical components (gaps) obtained from the HP filter. These components capture short-term deviations from the long-run equilibrium path.
By combining the trend and cyclical components, the dual adjustment approach enables the simultaneous analysis of long-run equilibrium relationships and short-run adjustments.
4.2. ARDL Formulation
To complement the dual adjustment framework, this study employs the Autoregressive Distributed Lag (ARDL) model developed by [63] to examine both the long-run relationship and short-run dynamics between CO2 emissions and its determinants in India.
The ARDL approach is particularly suitable for this study because it can be applied irrespective of whether the variables are integrated of order I(0) or I(1), provided that none of the variables is integrated of order I(2). The KPSS unit root test results confirm that all variables are I(1), justifying the use of the ARDL bounds testing approach.
The general ARDL() model can be expressed as:
where Δ denotes the first-difference operator, is the white noise error term, represent optimal lag lengths selected based on information criteria.
To test for the existence of a long-run relationship, the ARDL bounds testing approach is applied. The null hypothesis of no cointegration is given by:
against the alternative hypothesis:
If the computed F-statistic exceeds the upper critical bound, the null hypothesis is rejected, confirming the presence of cointegration among the variables.
The short-run dynamics are captured using the Error Correction Model (ECM), specified as:
where
The coefficient ϕ\ represents the speed of adjustment toward long-run equilibrium and is expected to be negative, statistically significant, and in the interval [−1, 0]. To ensure the robustness of the ARDL estimates, several diagnostic tests are conducted: serial correlation (Breusch–Godfrey LM test), heteroskedasticity (Breusch–Pagan–Godfrey test), normality (Jarque–Bera test), functional form (Ramsey RESET test). The stability of the model is evaluated using CUSUM and CUSUMSQ tests.
5. Empirical Results
5.1. Input Data Analysis
Table 2 presents the descriptive statistics for CO2 emissions and its determinants in India. The mean values indicate moderate variation across the variables. The standard deviation shows that GDP (0.464) and CO2 emissions (0.359) exhibit relatively higher variability compared to the other variables, while urbanization (0.100) appears to be the most stable over time.
Table 2.
Descriptive statistics (log variables).
Regarding distributional properties, most variables display low skewness, indicating relatively symmetric distributions, although AFF shows a moderate positive skewness (0.790). The kurtosis values are generally below three, suggesting that the variables have flatter distributions than the normal distribution. Finally, the Jarque–Bera test probabilities exceed 0.05 for all variables, indicating that the null hypothesis of normal distribution cannot be rejected. This supports the suitability of the data for further econometric analysis.
Figure 4 shows the time trends of GDP, AFF, LPI, REN, and URB in India during 1990–2024. GDP, LPI, and URB exhibit a pronounced upward trajectory, reflecting economic growth, expansion in livestock production, and rising urbanization. In contrast, AFF and REN display an overall downward trend, although REN records a short-lived increase around 2020. These patterns indicate that India’s development process has been characterized by structural transformation, with increasing economic activity and urban concentration alongside a relative decline in agriculture-related activity and the REN indicator. The decreasing trend in the renewable energy share in India, reflects structural changes in the country’s energy system rather than a decline in renewable energy production. Rapid economic growth and industrialization have increased total energy demand, making it difficult for renewable energy to keep pace with overall consumption [64]. At the same time, fossil fuels—particularly coal—continue to play a dominant role in India’s energy mix, which limits the relative expansion of renewable energy sources [2]. Although renewable capacity has increased in recent years due to supportive policies and technological progress, the transformation of the energy system remains gradual [65]. These dynamics explain why the renewable share indicator may decrease even when renewable energy deployment is expanding [3,66]. Since REN captures the relative contribution of renewable energy to total final energy consumption, the observed decline indicates a reduction in the renewable energy share within the national energy mix rather than a decline in the absolute amount of renewable energy consumed.
Figure 4.
Time trends of agricultural, economic, and urbanization indicators for India.
The KPSS unit root test was applied to examine the stationarity properties of the variables. The results reported in Table 3 show that CO2, GDP, AFF, LPI, REN, and URB are non-stationary at levels but become stationary after first differencing. Therefore, all variables are integrated of order one, I(1), confirming that none of the series is integrated of order two and supporting the application of the ARDL bounds testing approach.
Table 3.
KPSS unit root test results.
To examine whether the relationship between CO2 emissions and its determinants was affected by major economic and energy-sector transformations, the Bai–Perron multiple structural break test was performed. The results indicate that the specification with two breakpoints (m = 2) provides the best fit according to the Bayesian Information Criterion (BIC = −164.9), compared with the no-break model (BIC = −152.4) and the one-break model (BIC = −155.6). The estimated breakpoints occur at observations 11 and 21, corresponding approximately to the years 2000 and 2010, respectively. The residual sum of squares (RSS) decreases from 0.0091 in the no-break specification to 0.0014 in the two-break model, indicating an improvement in model fit. These break dates coincide with important phases in India’s economic and energy transition, including the acceleration of industrialization and the introduction of major renewable-energy initiatives such as the National Solar Mission. The presence of these structural changes suggests that India’s CO2 emissions trajectory experienced distinct regime shifts during 1993–2024.
5.2. Dual Adjustment Approach
Table 4 reports the results of the Engle–Granger and Co-HP trend tests under different filtering techniques (HP with , BK, and CF). The Engle–Granger test provides preliminary evidence of cointegration, while the Co-HP approach allows for the identification of a common long-run trend after decomposing the variables into permanent components. Following the recommendation of Ravn and Uhlig (2002) [62], the HP filter is applied with a smoothing parameter of which is theoretically appropriate for annual data and avoids the over-smoothing associated with the conventional λ = 100 setting. The reported EG/Co-HP test statistics are negative and statistically significant across all three specifications (HP: t = −6.613, p = 0.0035; BK: t = −6.629, p = 0.006; CF: t = −6.752, p = 0.005), leading to the rejection of the null hypothesis of no cointegration and confirming the existence of a stable long-run relationship among the variables.
Table 4.
EG and Co-HP trend tests (Dual Adjustment Approach).
The results are robust across all filtering methods. GDP and LPI exhibit positive and significant permanent effects on CO2 emissions across all three specifications, while REN and URB show negative and significant impacts. AFF displays a negative and statistically insignificant coefficient under all three filters (HP λ = 6.25: −0.014, t = −1.445; BK: −0.012, t = −0.190; CF: +0.004, t = 0.092), indicating that agriculture, forestry and fishing value added does not exert a robust permanent effect on CO2 emissions in India. This cross-filter consistency strengthens the reliability of the dual adjustment results and confirms the presence of a common stochastic trend among the variables. The absence of a significant AFF effect in the permanent component analysis is consistent with the ARDL long-run estimates reported in Section 5.3, where AFF also shows a negative coefficient. Variations in the relative contribution of agriculture, forestry, and fishing to the Indian economy are not a major driver of long-run CO2 emissions when compared with the stronger effects of the other variables.
Table 5 reports the results of the permanent component (trend) analysis obtained from DAA, estimated using the HP filter with λ = 6.25 as recommended by [62]. The coefficients represent the long-run relationships among the variables after extracting their permanent components using the filtering procedure. The robustness of these estimates across alternative filtering methods (BK and CF) is confirmed in Table 6.
Table 5.
Permanent component estimates (trend analysis).
Table 6.
Robustness of permanent component estimates across filtering methods.
GDP has a positive and highly significant effect on CO2 emissions, with a coefficient of 1.342 (t = 20.30), consistent across all three filter specifications (BK: 1.256, t = 8.78; CF: 0.978, t = 11.82). This indicates that long-term increases in economic activity are strongly associated with higher emissions in India, reflecting the continued dependence on energy-intensive production and fossil fuel consumption.
LPI exhibits a positive and statistically significant coefficient of 0.497 (t = 13.53), confirmed under BK (0.502, t = 2.17) and CF (0.443, t = 2.77), suggesting that the long-run expansion of livestock activities contributes to increased environmental pressure through feed production, energy use, and supply chain emissions.
REN has a negative and highly significant coefficient of −1.018 (t = −43.94), robust across BK (−1.078, t = −20.49) and CF (−0.950, t = −25.24), indicating that greater reliance on renewable energy reduces carbon emissions in India.
URB displays a negative and statistically significant coefficient of −6.646 (t = −22.42), also robust under BK (−6.378, t = −7.46) and CF (−4.585, t = −7.52). URB may contribute to lower emissions through improved resource allocation, economies of scale, and more efficient service provision. However, these benefits are unlikely to arise automatically and depend on continued investments in sustainable infrastructure, public transportation, and energy-efficient urban development.
AFF shows a negative and statistically insignificant coefficient of −0.014 (t = −1.45) under HP λ = 6.25, a result fully confirmed by BK (−0.012, t = −0.19) and CF (+0.004, t = 0.09). Across all three specifications, AFF exerts no significant permanent effect on CO2 emissions in India. The result may reflect the fact that aggregate emissions are driven primarily by energy-intensive sectors such as industry, transportation, and electricity generation rather than by changes in the agricultural sector’s share of economic activity. This result is also directionally consistent with the ARDL long-run estimate reported in Section 5.3, where AFF similarly shows a negative coefficient, reinforcing the conclusion that agriculture does not exert a significant upward pressure on emissions in the permanent component framework.
The permanent component results indicate that economic growth and livestock production are the primary long-run drivers of CO2 emissions in India, while renewable energy consumption and urbanization consistently contribute to emission reductions. The robustness of these findings across HP with λ = 6.25, BK, and CF filters strengthens confidence in the empirical conclusions and highlights the importance of cleaner energy policies and sustainable urban development for improving environmental outcomes in India.
Although the HP, BK and CF filters are based on different trend-cycle decomposition procedures, the empirical results remain consistent for all specifications. GDP and LPI have positive and statistically significant coefficients under all three filters. REN and URB exhibit negative and statistically significant effects on CO2 emissions. AFF remains statistically insignificant regardless of the filtering method. Some variation in coefficient magnitudes is observed across filters. The estimated impact of GDP ranges from 0.978 under the CF filter to 1.342 under the HP filter. The coefficient of URB varies between −6.646 and −4.585. These differences arise because each filter allocates medium-term fluctuations differently between trend and cyclical components. The HP filter extracts a smooth deterministic trend. The BK and CF filters are band-pass filters designed to isolate business-cycle frequencies. The main conclusions are not sensitive to the choice of filtering technique, providing evidence for the robustness of the DAA results.
The model selection criteria in Table 7 indicate a good model fit, with the Akaike Information Criterion (AIC = −4.972), Schwarz Information Criterion (SIC = −4.702), and Hannan–Quinn Criterion (HQ = −4.880) all taking relatively low values, suggesting that the specified model provides an appropriate representation of the data.
Table 7.
Model selection criteria.
Table 8 presents the results of the transitory component (gap) analysis, which captures the short-run deviations of the variables from their long-run equilibrium trends. The coefficients therefore reflect the short-term dynamics between the cyclical components of the variables and CO2 emissions. Short-run fluctuations in economic growth (GDP) have a positive and statistically significant impact on emissions, with a coefficient of 0.645 (t = 4.339, p = 0.000). This suggests that temporary increases in economic activity lead to higher environmental pressure, likely due to higher energy consumption and industrial production in the short term. This is the only variable that exerts a statistically significant effect in the transitory component analysis.
Table 8.
Transitory component estimates (Gap Analysis).
AFF shows a negative and statistically insignificant coefficient of −0.191 (t = −1.422, p = 0.166), indicating that short-term fluctuations in agricultural activity do not exert a measurable immediate effect on CO2 emissions. This result is consistent with the permanent component findings, where AFF also shows no significant long-run effect, reinforcing the conclusion that agriculture does not play a robust role in driving emissions in India.
LPI has a negative and statistically insignificant coefficient of −0.087 (t = −0.567, p = 0.575), indicating that short-run fluctuations in livestock production do not exert a measurable immediate effect on CO2 emissions. The environmental impacts of livestock activities appear to operate mainly through long-run structural channels rather than short-term cyclical fluctuations.
REN exhibits a negative but statistically insignificant coefficient of −0.091 (t = −0.561, p = 0.579), suggesting that short-term changes in renewable energy consumption do not produce an immediate measurable dampening effect on emissions. This contrasts with the strong negative long-run effect identified in the permanent component analysis, implying that the emission-reducing benefits of renewable energy materialize over longer time horizons rather than through short-term cyclical adjustments.
URB appears statistically insignificant in the short run, with a coefficient of −7.724 (t = −1.516, p = 0.140), indicating that short-term changes in urban development do not have a significant impact on emissions. This suggests that the effects of urbanization on environmental quality operate primarily through long-term structural adjustments in infrastructure, technology adoption, and energy efficiency rather than through short-term fluctuations.
5.3. ARDL Model
The VAR lag selection criteria are reported in Table 9. The lag order selection criteria include LR (Likelihood Ratio test), FPE (Final Prediction Error), AIC (Akaike Information Criterion), SC (Schwarz Information Criterion), and HQ (Hannan–Quinn Information Criterion). The optimal lag length is three, as suggested by the AIC, SC, HQ, and FPE criteria. Based on this result, the maximum lag length used in the ARDL estimation was set to three.
Table 9.
VAR Lag Order Selection Criteria.
The ARDL bounds test in Table 10 indicates that the calculated F-statistic (5.85) exceeds the upper critical bound at the 1% significance level, providing strong evidence of a long-run cointegration relationship among CO2 emissions and its determinants in India.
Table 10.
Results of ARDL cointegration bounds test.
The ARDL results in Table 11 reveal both long-run equilibrium relationships and short-run adjustment dynamics between CO2 emissions and their determinants in India. In the long run, a 1% increase in GDP leads to a 0.474% increase in CO2 emissions, indicating that economic expansion continues to be associated with higher energy consumption and environmental pressure. This finding reflects the dependence of India’s economic growth on energy-intensive production and fossil fuel use.
Table 11.
Long-run and short-run ARDL estimates.
AFF exhibits a negative and statistically significant long-run coefficient of −0.198, suggesting that improvements in agricultural productivity or structural changes in the agricultural sector may help reduce emissions over time. This may reflect increasing efficiency in agricultural practices or technological improvements in the sector.
LPI has a positive and significant coefficient of 0.428, indicating that expansion in livestock activities contributes to higher CO2 emissions in the long run. This relationship may reflect the environmental impacts associated with livestock production, including feed production, energy use, and supply chain activities. The observed positive relationship may be explained by several livestock-related emission channels. First, enteric fermentation from ruminant animals generates substantial methane emissions, which contribute indirectly to environmental degradation. Second, manure management systems release methane and nitrous oxide during storage and treatment processes. Third, livestock production requires feed cultivation, which involves fertilizer application, mechanization, irrigation, and transportation activities that increase fossil-fuel consumption. Finally, processing, refrigeration, and distribution throughout the livestock supply chain generate additional carbon emissions. Therefore, the estimated LPI coefficient should be interpreted as reflecting the combined environmental impact of livestock-related production systems rather than a single emission source.
REN has a negative and highly significant effect on emissions, with a coefficient of −0.643. This result suggests that increasing reliance on renewable energy sources plays a crucial role in reducing carbon emissions and improving environmental sustainability in India.
URB displays a negative long-run coefficient of −1.872, implying that urban development may contribute to emission reductions through improved infrastructure, technological innovation, and greater energy efficiency in urban systems. However, this effect depends on sustained infrastructure investment and policy support.
The short-run dynamics reveal several important adjustment mechanisms. The coefficients of the lagged dependent variable are positive and significant, with ΔCO2(−1) = 0.398 and ΔCO2(−2) = 0.333, indicating persistence in emission dynamics. This suggests that short-term changes in emissions tend to carry over into subsequent periods.
Short-run economic growth also exerts a positive effect on emissions. The coefficient of ΔGDP is 0.332, implying that short-term increases in economic activity lead to higher emissions due to increased industrial production and energy demand.
URB also shows a significant short-run effect, with a coefficient of −17.899, suggesting that short-term increases in urban development may reduce emissions, possibly due to efficiency improvements in transportation systems, infrastructure, and energy use.
The error-correction term (CointEq(−1)) is negative and highly significant (−1.173), confirming the existence of a stable long-run equilibrium relationship among the variables. The magnitude of the coefficient implies that approximately 117% of short-run disequilibrium is corrected within one year, indicating a rapid adjustment process toward long-run equilibrium. Although the ECT coefficient of −1.173 slightly exceeds the conventional boundary of −1, it remains within the theoretically admissible interval of [−2, −1] and does not indicate model instability or divergence. Following [68,69], an error correction coefficient lying between −2 and −1 implies that the system converges to long-run equilibrium through dampening oscillations rather than monotonically—that is, the system temporarily overshoots the equilibrium but returns to it in a fluctuating, self-correcting manner. This pattern is consistent with the behavior of emerging economies exposed to multiple structural shocks. During the sample period 1990–2024, the Indian economy experienced several major disruptions, including the 2008 global financial crisis, the 2016 demonetization, and the 2020 COVID-19 pandemic, all of which may have amplified short-run adjustment dynamics.
The diagnostic statistics confirm the adequacy of the estimated model. The R2 value of 0.883 indicates that approximately 88.3% of the variation in CO2 emissions is explained by the model, while the adjusted R2 of 0.859 confirms a strong explanatory power. The Durbin–Watson statistic of 2.19 suggests that the model does not suffer from serious autocorrelation problems.
Table 12 reports the results of the diagnostic tests conducted to assess the adequacy of the estimated ARDL model. The Jarque–Bera test indicates that the residuals are normally distributed, suggesting that the normality assumption is satisfied. The Breusch–Godfrey LM test confirms the absence of serial correlation in the residuals. Similarly, the Breusch–Pagan–Godfrey test shows no evidence of heteroskedasticity, indicating that the variance of the residuals remains constant. The Ramsey RESET test does not detect functional form misspecification, implying that the model is correctly specified. These diagnostic tests confirm that the ARDL model is statistically reliable and appropriate for inference.
Table 12.
Diagnostic tests.
The CUSUM and CUSUMSQ plots in Figure 5 indicate that the estimated model is stable over the sample period, as they remain within the 5% significance bounds.
Figure 5.
ARDL CUSUM and CUSUMSQ plots.
Figure 6 presents the impulse response functions obtained for the VAR model for India. The results indicate that a positive shock to GDP generates a persistent increase in CO2 emissions over the forecast horizon, confirming that economic growth remains an important driver of environmental pressure. Similarly, shocks to LPI lead to higher CO2 emissions through energy-intensive production and supply-chain processes. In contrast, a positive shock to REN reduces CO2 emissions. The response becomes more pronounced in time, indicating that environmental benefits materialize gradually. URB produces a relatively small negative response to CO2 emissions, supporting once more the urban efficiency hypothesis [70], by which urban development can improve energy efficiency and infrastructure performance. The response of CO2 emissions to shocks in AFF is weak and negative, consistent with the insignificant coefficients obtained in DAA and ARDL estimations.
Figure 6.
Impulse-response functions. Notes: Black solid lines represent the estimated impulse response functions (IRFs). Red dashed lines indicate the ±2 standard error confidence bands (approximately 95% confidence intervals), and the horizontal gray dashed line denotes the zero-response level. IRFs are based on Cholesky one-standard-deviation innovations over a 10-year horizon.
6. Discussion
The findings obtained from DAA and ARDL models provide several results about the determinants of CO2 emissions in India. The results indicate that GDP and LPI increase CO2 emissions, while REN and URB decrease them. The positive relation between GDP and CO2 emissions confirm that economic expansion remains closely associated with environmental pressure in India. Ref. [71] found that economic growth contributes positively to CO2 emissions for BRICS countries despite increasing renewable-energy investments. Likewise, r evidence for BRICS economies indicates that a 1% increase in economic growth is associated with a substantial rise in carbon emissions, reflecting the persistence of energy-intensive development patterns [72]. It follows that India continues to face the challenge of decoupling economic growth from environmental degradation.
The positive coefficient associated with LPI is also consistent with international evidence. Livestock production has been identified as a major contributor to GHG emissions through feed production, transportation, manure management and enteric fermentation [16]. Refs. [73,74] emphasize that livestock systems remain an important source of environmental pressure in developing economies undergoing agricultural modernization. Ref. [75] demonstrates that improvements in livestock management can reduce the environmental footprint of animal production in China, emphasizing the importance of technological innovation, resource efficiency, and structural transformation in mitigating carbon emissions associated with livestock supply chains.
The negative impact of REN on CO2 emissions highlights the important role of clean energy in promoting environmental sustainability. Ref. [76] shows that the emission-reducing effect of renewable energy is strong in BRICS economies, where renewable-energy investments generate larger environmental benefits than those observed in some Middle Eastern countries.
URB deserves attention because its negative coefficient differs from the conclusions of several studies. The result is consistent with urban efficiency hypothesis [70]. However, the estimated coefficient should not be interpreted as evidence that India’s current urbanization process has already achieved optimal environmental efficiency. Rather, the result suggests that urbanization may contribute to lower emissions when accompanied by adequate infrastructure investment, technological modernization, and effective urban planning. Cross-country evidence based on 136 countries shows that URB reduces CO2 emissions in non-OECD economies, whereas the effect is statistically insignificant in OECD countries [21]. This finding is consistent with the Indian evidence and suggests that urban concentration may improve resource allocation and energy efficiency in developing economies. However, the urbanization result should be interpreted cautiously. Other studies report the opposite effect. For densely populated Asian economies, urbanization has been found to increase CO2 emissions through transportation infrastructure expansion, industrial concentration, and higher energy demand [22]. Similarly, evidence for South Asian countries indicates that URB reduces CO2 emissions in South Africa when global uncertainty is incorporated into the model [77]. The negative URB coefficient found in this study likely reflects the net outcome of two competing mechanisms: the emission-increasing effects associated with urban expansion and the emission-reducing effects generated by infrastructure modernization and efficiency improvements. The results suggest that, during the study period, the latter effects dominated in India.
The negative long-run effect of URB on CO2 emissions may operate through several complementary mechanisms. First, urbanization facilitates infrastructure modernization, including more efficient transportation networks, energy-efficient buildings, and improved public services, which reduce per capita energy consumption [78,79]. Second, urban agglomeration generates economies of scale and promotes technological diffusion among firms, encouraging the adoption of cleaner production technologies and more efficient resource allocation [80]. Third, densely populated urban areas allow more efficient public transportation systems and lower energy requirements per unit of economic output compared with dispersed rural settlements [81]. These mechanisms are consistent with the urban efficiency hypothesis and may explain why urbanization is associated with lower CO2 emissions in India despite continued economic expansion. Since this study does not include indicators of infrastructure quality, industrial agglomeration, or energy efficiency, these channels should be interpreted as plausible explanatory mechanisms rather than directly estimated causal effects.
7. Limitations and Policy Implications
This study has several limitations. First, even if DAA distinguishes between permanent and transitory effects, it does not comprise the mechanisms through which URB influences CO2 emissions, such as infrastructure quality, industrial agglomeration, or energy efficiency. Second, the analysis relies on national data and does not account for regional heterogeneity in India.
Based on the empirical findings, the following policy recommendations can be proposed:
- The negative long-run effect of RENC indicates that expanding investments in renewable energy sources can contribute to reducing CO2 emissions. Policymakers should continue supporting renewable-energy projects, improving grid integration, and promoting energy-storage technologies.
- Since GDP exerts a positive effect on emissions in both the DAA and ARDL frameworks, economic expansion should be accompanied by stricter energy-efficiency standards, cleaner production technologies, and incentives for green innovation.
- The positive impact of LPI on CO2 emissions highlights the need for improved manure management, sustainable feed systems, and resource-efficient livestock production practices.
- URB is associated with lower long-run emissions. However, this effect depends on sustained investments in public transportation, energy-efficient buildings, smart infrastructure, and effective urban planning rather than being an automatic consequence of increasing urbanization levels.
8. Conclusions
This study examined the determinants of CO2 emissions in India during 1990–2024 by employing DAA combined with the ARDL framework. By distinguishing between permanent and transitory effects, DAA provides more insights into the drivers of environmental degradation. The findings point to the fact that long-run factors are more important than short-run fluctuations in shaping India’s CO2 emissions trajectory. Renewable energy expansion, sustainable livestock management, and efficient urban development are important components of India’s transition toward a lower-carbon economy.
Although urbanization was found to reduce CO2 emissions in the long run, this result should not be interpreted as evidence that India’s current urbanization process has already achieved the infrastructure efficiency assumed by the urban efficiency hypothesis. Existing studies [82] indicate substantial progress through initiatives such as the Smart Cities Mission, but also highlight persistent infrastructure deficits, congestion, and uneven implementation across cities. Therefore, the present study cannot determine whether the estimated environmental benefits of urbanization arise from existing urban policies or from broader structural changes associated with urban development. Future research should incorporate direct measures of infrastructure quality, public transportation efficiency, and smart-city implementation.
Author Contributions
Conceptualization, J.K. and I.G.; Methodology, J.K. and I.G.; Software, J.K. and I.G.; Validation, J.K. and I.G.; Formal analysis, J.K. and I.G.; Investigation, J.K. and I.G.; Resources, J.K. and I.G.; Data curation, J.K. and I.G.; Writing—original draft, J.K. and I.G.; Writing—review and editing, J.K. and I.G.; Visualization, J.K. and I.G.; Supervision, J.K. and I.G.; Project administration, J.K. and I.G.; Funding acquisition, J.K. and I.G. All authors have read and agreed to the published version of the manuscript.
Funding
This research received no external funding.
Institutional Review Board Statement
Not applicable.
Informed Consent Statement
Not applicable.
Data Availability Statement
The raw data supporting the conclusions of this article will be made available by the authors on request.
Conflicts of Interest
The authors declare no conflicts of interest.
References
- Atlas Institute for International Affairs. Available online: https://atlasinstitute.org/decarbonizing-indias-power-sector-basic-need-to-achieve-net-zero-by-2070 (accessed on 11 June 2026).
- Kumar, C.R.J.; Majid, M.A. Renewable energy for sustainable development in India: Current status, future prospects, challenges, employment, and investment opportunities. Energy Sustain. Soc. 2020, 10, 2. [Google Scholar] [CrossRef] [Scilit]
- Gulagi, A.; Ram, M.; Bogdanov, D.; Sarin, S.; Mensah, T.N.O.; Breyer, C. The role of renewables for rapid transitioning of the power sector across states in India. Nat. Commun. 2022, 13, 5499. [Google Scholar] [CrossRef] [Scilit] [PubMed]
- Umar, M.M.; Yadav, P.K. Unleashing India’s Solar Potential: A Review of the National Solar Mission and the Path to Sustainable Energy in India. J. Technol. Innov. Energy 2024, 3, 49–63. [Google Scholar] [CrossRef] [Scilit]
- Nica, I.; Georgescu, I. The ecological impact of agricultural production on CO2 emissions in India: Pathways to sustainable agriculture. J. Environ. Manag. 2025, 384, 125548. [Google Scholar] [CrossRef] [Scilit] [PubMed]
- Goswami, A.; Kapoor, H.S.; Jangir, R.K.; Ngigi, C.N.; Nowrouzi-Kia, B.; Chattu, V.K. Impact of economic growth, trade openness, urbanization and energy consumption on carbon emissions: A study of India. Sustainability 2023, 15, 9025. [Google Scholar] [CrossRef] [Scilit]
- Yang, Z.; Ji, H.; Chen, S.; Duan, J.; Liu, L. Sustainable urbanization and green total factor productivity: Evidence from China’s new-type urbanization plan. Technol. Econ. Dev. Econ. 2024, 30, 1598–1617. [Google Scholar] [CrossRef] [Scilit]
- Tiwari, A.K.; Shahbaz, M.; Hye, Q.M.A. The environmental Kuznets curve and the role of coal consumption in India: Cointegration and causality analysis in an open economy. Renew. Sustain. Energy Rev. 2013, 18, 519–527. [Google Scholar] [CrossRef] [Scilit]
- Ahmad, A.; Zhao, Y.; Shahbaz, M.; Bano, S.; Zhang, Z.; Wang, S.; Liu, Y. Carbon emissions, energy consumption and economic growth: An aggregate and disaggregate analysis of the Indian economy. Energy Policy 2016, 96, 131–143. [Google Scholar] [CrossRef] [Scilit]
- Raihan, A.; Voumik, L.C. Carbon emission dynamics in India due to financial development, renewable energy utilization, technological innovation, economic growth, and urbanization. J. Environ. Sci. Econ. 2022, 1, 36–50. [Google Scholar] [CrossRef] [Scilit]
- Sharma, T.; Sharma, M.; Mehrotra, S.; Grima, S. An econometric analysis of India’s urbanization, energy consumption, economic growth and CO2 emission. Int. J. Environ. Impacts 2023, 6, 57–64. [Google Scholar] [CrossRef] [Scilit]
- Kumari, D.; Shaswat, S.; Verma, P.K.; Giri, A.K. Examining the nexus between carbon dioxide emissions, economic growth, fossil fuel energy use, urbanization and renewable energy towards achieving environmental sustainability in India. Int. J. Energy Sect. Manag. 2025, 19, 731–746. [Google Scholar] [CrossRef] [Scilit]
- Sapkota, T.B.; Jat, M.L.; Rana, D.S.; Khatri-Chhetri, A.; Jat, H.S.; Bijarniya, D.; Sutaliya, J.M.; Kumar, M.; Singh, L.K.; Jat, R.K.; et al. Crop nutrient management using Nutrient Expert improves yield, increases farmers’ income and reduces greenhouse gas emissions. Sci. Rep. 2021, 11, 1564. [Google Scholar] [CrossRef] [Scilit] [PubMed]
- Sah, D.; Devakumar, A.S. The carbon footprint of agricultural crop cultivation in India. Int. J. Sustain. Dev. World Ecol. 2018, 25, 213–225. [Google Scholar] [CrossRef] [Scilit]
- Thirunagari, B.K.; Kancheti, M.; Kumar, R.; Kota, S.H. Managing synthetic N-fertilizer emissions in India: Insights from field surveys across 102 districts. J. Environ. Manag. 2024, 366, 121909. [Google Scholar] [CrossRef] [Scilit] [PubMed]
- Raheja, S.; Das, U. Energy and agriculture sectors lead emissions in India’s latest greenhouse gas inventory. Down to Earth, 14 January 2025. Available online: https://www.downtoearth.org.in/climate-change/energy-and-agriculture-sectors-lead-emissions-in-indias-latest-greenhouse-gas-inventory (accessed on 20 June 2026).
- İsmihan, M.; ve Küçüker, M.C. İkili Uyarlanma Yaklaşımı: Türkiye İçin Yatırım Fonksiyonu Uygulaması. In Belirsizlik Altında Ekonomik Kararlar ve Politikalar; Selçuk, I.Ş., Ed.; Türkiye Ekonomi Kurumu: Ankara, Türkiye, 2019; pp. 37–71. [Google Scholar]
- Our World in Data. Available online: https://ourworldindata.org/co2-emissions-metrics (accessed on 11 June 2026).
- Raihan, A.; Tanchangya, T.; Rahman, J.; Ridwan, M. The influence of agriculture, renewable energy, international trade, and economic growth on India’s environmental sustainability. J. Environ. Energy Econ. 2024, 3, 37–53. [Google Scholar] [CrossRef] [Scilit]
- Dharmapriya, N.; Gunawardena, V.; Methmini, D.; Jayathilaka, R.; Rathnayake, N. Carbon emissions across income groups: Exploring the role of trade, energy use, and economic growth. Discov. Sustain. 2025, 6, 621. [Google Scholar] [CrossRef] [Scilit]
- Ma, B.; Ogata, S. Impact of urbanization on carbon dioxide emissions—Evidence from 136 countries and regions. Sustainability 2024, 16, 7878. [Google Scholar] [CrossRef] [Scilit]
- Qian, L.H. An empirical study on the relationship between urbanization, transportation infrastructure, industrialization and environmental degradation in China, India and Indonesia. Environ. Dev. Sustain. 2024. [Google Scholar] [CrossRef] [Scilit]
- Franco, S.; Mandla, V.R.B.; Rao, K.R.M. Urbanization, energy consumption and emissions in the Indian context: A review. Renew. Sustain. Energy Rev. 2017, 71, 898–907. [Google Scholar] [CrossRef] [Scilit]
- Ghosh, S.; Kanjilal, K. Long-term equilibrium relationship between urbanization, energy consumption and economic activity: Empirical evidence from India. Energy 2014, 66, 324–331. [Google Scholar] [CrossRef] [Scilit]
- Haldar, S.; Sharma, G. Impact of urbanization on per capita energy use and emissions in India. Int. J. Energy Sect. Manag. 2022, 16, 191–207. [Google Scholar] [CrossRef] [Scilit]
- Martínez-Zarzoso, I.; Maruotti, A. The impact of urbanization on CO2 emissions: Evidence from developing countries. Ecol. Econ. 2011, 70, 1344–1353. [Google Scholar] [CrossRef] [Scilit]
- Sridhar, K.S. Urbanization and carbon emissions in India and China. Environ. Urban. Asia 2018, 9, 113–126. [Google Scholar] [CrossRef] [Scilit]
- Lall, A.B.; Sethi, G. Operationalising energy sufficiency for low-carbon built environments in urbanising India. Build. Cities 2024, 5, 645–661. [Google Scholar] [CrossRef] [Scilit]
- Li, Z.-B.; Yu, Y.; Jia, L.; Wu, Y.-W.; Cheng, P.; Zhang, Z.; Li, Z.-K.; Fan, C.-H.; Guo, X.-M. Thermal characteristic analysis and performance optimization of a novel heating boiler based on a porous media model. Appl. Therm. Eng. 2026, 289, 130035. [Google Scholar] [CrossRef] [Scilit]
- Herrero, M.; Thornton, P.K.; Mason-D’Croz, D.; Palmer, J.; Benton, T.G.; Bodirsky, B.L.; Bogard, J.R.; Hall, A.; Lee, B.; Nyborg, K.; et al. Innovation can accelerate the transition towards a sustainable food system. Nat. Food 2020, 1, 266–272. [Google Scholar] [CrossRef] [Scilit]
- Li, L.; Awada, T.; Shi, Y.; Jin, V.L.; Kaiser, M. Global greenhouse gas emissions from agriculture: Pathways to sustainable reductions. Glob. Change Biol. 2025, 31, e70015. [Google Scholar] [CrossRef] [Scilit] [PubMed]
- Xu, X.; Sharma, P.; Shu, S.; Lin, T.-S.; Ciais, P.; Tubiello, F.N.; Smith, P.; Campbell, N.; Jain, A.K. Global greenhouse gas emissions from animal-based foods are twice those of plant-based foods. Nat. Food 2021, 2, 724–732. [Google Scholar] [CrossRef] [Scilit] [PubMed]
- Mottet, A.; Teillard, F.; Özkan, Ş. Investing in low-emission and resilient livestock production: The why and how. Nutr. Cycl. Agroecosyst. 2024, 128, 387–395. [Google Scholar] [CrossRef] [Scilit]
- Kumar, R.; Mondal, B.; Linda, A.; Baruah, K.K.; Bordoloi, N. Enhancing sustainability in Indian rice–wheat agroecosystem: A review and analysis of fertilizer management practices and greenhouse gas (N2O) emission mitigation. Water Air Soil Pollut. 2025, 236, 358. [Google Scholar] [CrossRef] [Scilit]
- Elsayed, H.; Beusen, A.; Prusty, A.K.; Bouwman, L. Long-term variations (1970–2020) and spatial patterns of nitrogen and phosphorus soil budgets and fates in Indian agriculture. Nutr. Cycl. Agroecosyst. 2025, 130, 17–32. [Google Scholar] [CrossRef] [Scilit]
- Gerber, P.J.; Hristov, A.N.; Henderson, B.; Makkar, H.; Oh, J.; Lee, C.; Meinen, R.; Montes, F.; Ott, T.; Firkins, J.; et al. Technical options for the mitigation of direct methane and nitrous oxide emissions from livestock: A review. Animal 2013, 7, 220–234. [Google Scholar] [CrossRef] [Scilit] [PubMed]
- Crippa, M.; Solazzo, E.; Guizzardi, D.; Monforti-Ferrario, F.; Tubiello, F.N.; Leip, A. Food systems are responsible for a third of global anthropogenic GHG emissions. Nat. Food 2021, 2, 198–209. [Google Scholar] [CrossRef] [Scilit] [PubMed]
- Clark, M.A.; Domingo, N.G.G.; Colgan, K.; Thakrar, S.K.; Tilman, D.; Lynch, J.; Azevedo, I.L.; Hill, J.D. Global food system emissions could preclude achieving the 1.5° and 2 °C climate change targets. Science 2020, 370, 705–708. [Google Scholar] [CrossRef] [Scilit] [PubMed]
- Mandouri, J.; Onat, N.C.; Kucukvar, M.; Jabbar, R.; Al-Quradaghi, S.; Al-Thani, S.; Kazançoğlu, Y. Carbon footprint of food production: A systematic review and meta-analysis. Sci. Rep. 2025, 15, 35630. [Google Scholar] [CrossRef] [Scilit] [PubMed]
- Li, M.; Jia, N.; Lenzen, M.; Malik, A.; Wei, L.; Jin, Y.; Raubenheimer, D. Global food-miles account for nearly 20% of total food-systems emissions. Nat. Food 2022, 3, 445–453. [Google Scholar] [CrossRef] [Scilit] [PubMed]
- Zhu, J.; Luo, Z.; Sun, T.; Li, W.; Zhou, W.; Wang, X.; Fei, X.; Tong, H.; Yin, K. Cradle-to-grave emissions from food loss and waste represent half of total greenhouse gas emissions from food systems. Nat. Food 2023, 4, 247–256. [Google Scholar] [CrossRef] [Scilit] [PubMed]
- Liu, H.; Liu, Y. Agricultural carbon footprints, renewable energy and sustainable development in Asia. Sci. Rep. 2025, 15, 34429. [Google Scholar] [CrossRef] [Scilit] [PubMed]
- Alauddin, M.; Quiggin, J. Agricultural intensification, irrigation and the environment in South Asia: Issues and policy options. Ecol. Econ. 2008, 65, 111–124. [Google Scholar] [CrossRef] [Scilit]
- Yasmin, T.; Jabeen, A.; Iram, S.; Arshad, F.; Waheed, M.; Hashem, A.; Avila-Quezada, G.D.; Abd Allah, E.F. Environmental impacts of livestock management strategies in subtropical agroecosystems. Cogent Food Agric. 2025, 11, 2562171. [Google Scholar] [CrossRef] [Scilit]
- Foong, A.; Pradhan, P.; Frör, O.; Kropp, J.P. Adjusting agricultural emissions for trade matters for climate change mitigation. Nat. Commun. 2022, 13, 3024. [Google Scholar] [CrossRef] [Scilit] [PubMed]
- Friedman, M. A Theory of the Consumption Function; Princeton University Press: Princeton, NJ, USA, 1957. [Google Scholar]
- Hodrick, R.J.; Prescott, E.C. Postwar U.S. business cycles: An empirical investigation. J. Money Credit Bank. 1997, 29, 1–16. [Google Scholar] [CrossRef] [Scilit]
- Baxter, M.; King, R.G. Measuring business cycles: Approximate band-pass filters for economic time series. Rev. Econ. Stat. 1999, 81, 575–593. [Google Scholar] [CrossRef] [Scilit]
- Christiano, L.J.; Fitzgerald, T.J. The band pass filter. Int. Econ. Rev. 2003, 44, 435–465. [Google Scholar] [CrossRef] [Scilit]
- Kirikkaleli, D.; Adebayo, T.S.; Khan, Z.; Ali, S. Does globalization matter for ecological footprint in Turkey? Evidence from dual adjustment approach. Environ. Sci. Pollut. Res. 2021, 28, 14009–14017. [Google Scholar] [CrossRef] [Scilit] [PubMed]
- Wu, H.; Akadiri, S.S.; Haouas, I.; Awosusi, A.A.; Odu, A.T. Impact of trade liberalization and renewable energy on load capacity factor: Evidence from novel dual adjustment approach. Energy Environ. 2024, 35, 795–814. [Google Scholar] [CrossRef] [Scilit]
- Liu, J.; Ameer, W.; Abbas, S.; Altuntaş, M. Does carbon emissions, and economic expansion induce health expenditure in China: Evidence for sustainability perspective. Front. Environ. Sci. 2022, 9, 838734. [Google Scholar] [CrossRef] [Scilit]
- Çolakoğlu, N. Reconsidering the impact of government expenditures on unemployment rate: The Turkish experience (1980–2019). Humanit. Soc. Sci. Commun. 2025, 12, 1740. [Google Scholar] [CrossRef] [Scilit]
- Grossman, G.M.; Krueger, A.B. Economic Growth and the Environment. Q. J. Econ. 1995, 110, 353–377. [Google Scholar] [CrossRef] [Scilit]
- Rabbi, M.F.; Abdullah, M. Fossil fuel CO2 emissions and economic growth in the Visegrád region: A study based on the Environmental Kuznets Curve hypothesis. Climate 2024, 12, 115. [Google Scholar] [CrossRef] [Scilit]
- Nica, I.; Georgescu, I.; Kinnunen, J. Economic growth, innovation, and CO2 emissions: Analyzing the Environmental Kuznets Curve and the Innovation Claudia Curve in BRICS countries. Sustainability 2025, 17, 3507. [Google Scholar] [CrossRef] [Scilit]
- Leal, P.H.; Marques, A.C. The evolution of the environmental Kuznets curve hypothesis assessment: A literature review under a critical analysis perspective. Heliyon 2022, 8, e11521. [Google Scholar] [CrossRef] [Scilit] [PubMed]
- Dogan, M.; Georgescu, I.; Çeştepe, H.; Sarıgül, S.S.; Tatar, H.E. Renewable energy consumption and the ecological footprint in Denmark: Assessing the influence of financial development and agricultural contribution. Agriculture 2025, 15, 835. [Google Scholar] [CrossRef] [Scilit]
- Sovacool, B.K. How long will it take? Conceptualizing the temporal dynamics of energy transitions. Energy Res. Soc. Sci. 2016, 13, 202–215. [Google Scholar] [CrossRef] [Scilit]
- Lütkepohl, H. New Introduction to Multiple Time Series Analysis; Springer: Berlin/Heidelberg, Germany, 2005. [Google Scholar] [CrossRef]
- Kwiatkowski, D.; Phillips, P.C.B.; Schmidt, P.; Shin, Y. Testing the null hypothesis of stationarity against the alternative of a unit root: How sure are we that economic time series have a unit root? J. Econom. 1992, 54, 159–178. [Google Scholar] [CrossRef] [Scilit]
- Ravn, M.O.; Uhlig, H. On adjusting the Hodrick-Prescott filter for the frequency of observations. Rev. Econ. Stat. 2002, 84, 371–376. [Google Scholar] [CrossRef] [Scilit]
- Pesaran, M.H.; Shin, Y.; Smith, R.J. Bounds testing approaches to the analysis of level relationships. J. Appl. Econom. 2001, 16, 289–326. [Google Scholar] [CrossRef] [Scilit]
- Prajapati, P.; Guo, R.; Cai, A.; Prashad, R. Navigating the energy transition in India: Challenges and opportunities towards sustainable energy goal. Water-Energy Nexus 2026, 9, 1–18. [Google Scholar] [CrossRef] [Scilit]
- Kumbhar, S.R.; Satpute, S.T.; Patil, Y.S. Harnessing green power: A comprehensive analysis of India’s renewable energy growth and future outlook. Next Energy 2026, 10, 100493. [Google Scholar] [CrossRef] [Scilit]
- Han, S.; Peng, D.; Guo, Y.; Aslam, M.U.; Xu, R. Harnessing technological innovation and renewable energy and their impact on environmental pollution in G-20 countries. Sci. Rep. 2025, 15, 2236. [Google Scholar] [CrossRef] [Scilit] [PubMed]
- Georgescu, I.; Kinnunen, J. Revisiting the Environmental Kuznets Curve in Hungary with Asymmetric Evidence. Discov. Environ. 2025, 3, 229. [Google Scholar] [CrossRef] [Scilit]
- Narayan, P.K.; Smyth, R. What determines migration flows from low-income to high-income countries? An empirical investigation of Fiji–US migration 1972–2001. Contemp. Econ. Policy 2006, 24, 332–342. [Google Scholar] [CrossRef] [Scilit]
- Bertsatos, G.; Sakellaris, P.; Tsionas, M.G. Extensions of the Pesaran, Shin and Smith (2001) bounds testing procedure. Empir. Econ. 2022, 62, 605–634. [Google Scholar] [CrossRef] [Scilit]
- Glaeser, E.L.; Kahn, M.E. The Greenness of Cities: Carbon Dioxide Emissions and Urban Development. J. Urban Econ. 2010, 67, 404–418. [Google Scholar] [CrossRef] [Scilit]
- Erkılıç, E.; Gazeloğlu, C.; Özgören Ünlü, E. Renewable energy solution to carbon emissions: BRICS countries in the grip of globalization and economic growth. Sustainability 2025, 17, 4117. [Google Scholar] [CrossRef] [Scilit]
- Shekhawat, K.K.; Kumar, N.; Kumar, P.; Sharma, V. Impact of renewable energy, financial globalization, and technological innovation on environmental sustainability in BRICS. Discov. Sustain. 2025, 6, 644. [Google Scholar] [CrossRef] [Scilit]
- Salmon, G.; McLeod, M.; Ryan, F.S.; Niedermaier, D.; Orlishausen, I.; Rosenstein, P.; Özkan, Ş.; Wheelhouse, N.; Mottet, A.; Miranda, A.; et al. Bending the Emissions Curve for Livestock Production; Policy Brief; Livestock Data for Decisions (LD4D): Midlothian, UK, 2025. [Google Scholar]
- Nugrahaeningtyas, E.; Lee, J.-S.; Park, K.-H. Greenhouse gas emissions from livestock: Sources, estimation, and mitigation. J. Anim. Sci. Technol. 2024, 66, 1083–1098. [Google Scholar] [CrossRef] [Scilit] [PubMed]
- Chen, Y.; Qi, L.; Hussain, H.A. Greenhouse gas emissions from Chinese livestock sector can be decreased by one third in 2030 by the improvement in management. Carbon Res. 2024, 3, 66. [Google Scholar] [CrossRef] [Scilit]
- Addis, A.K. The impact of renewable energy on CO2 emissions in Middle Eastern and BRICS economies. Humanit. Soc. Sci. Commun. 2026, 13, 194. [Google Scholar] [CrossRef] [Scilit]
- Fasanya, I.O.; Arek-Bawa, O. Connection between urbanization and CO2 emissions in South Africa: Does global uncertainty matter? Int. J. Energy Sect. Manag. 2025, 19, 412–428. [Google Scholar] [CrossRef] [Scilit]
- Li, X.; Zhang, C.; Pan, T.; Dong, X. The impact of urban form on carbon emission efficiency under public transit-oriented development: Spatial heterogeneity and driving forces. Land 2025, 14, 1172. [Google Scholar] [CrossRef] [Scilit]
- Yang, W.; Chen, Y.; Gao, Y.; Hu, Y. The impact of urban transportation development on daily travel carbon emissions in China: Moderating effects based on urban form. Land 2024, 13, 2107. [Google Scholar] [CrossRef] [Scilit]
- Fu, Y.; Wang, Z. The impact of industrial agglomeration on urban carbon emissions: An empirical study based on the panel data of China’s prefecture-level cities. Sustainability 2024, 16, 10270. [Google Scholar] [CrossRef] [Scilit]
- Rahmati, B.; Rabiei-Dastjerdi, H.; Bibri, S.E.; Aghajani, M.A.; Kazemi, M. Reducing urban energy consumption and carbon emissions: A novel GIS-based model for sustainable spatial accessibility to local services and resources. Comput. Urban Sci. 2024, 4, 37. [Google Scholar] [CrossRef] [Scilit]
- Praharaj, S. An appraisal of the 100 Smart Cities’ Mission in India: Lessons for the post-pandemic urban future. J. Urban Technol. 2025, 32, 115–137. [Google Scholar] [CrossRef] [Scilit]
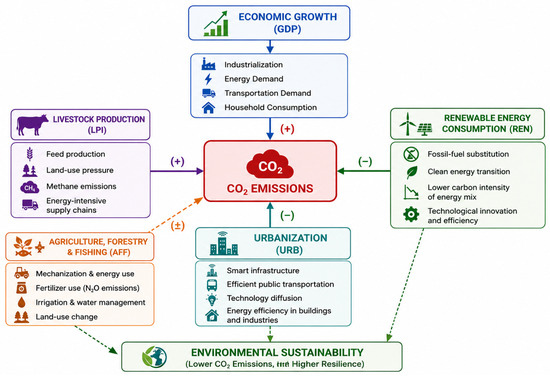
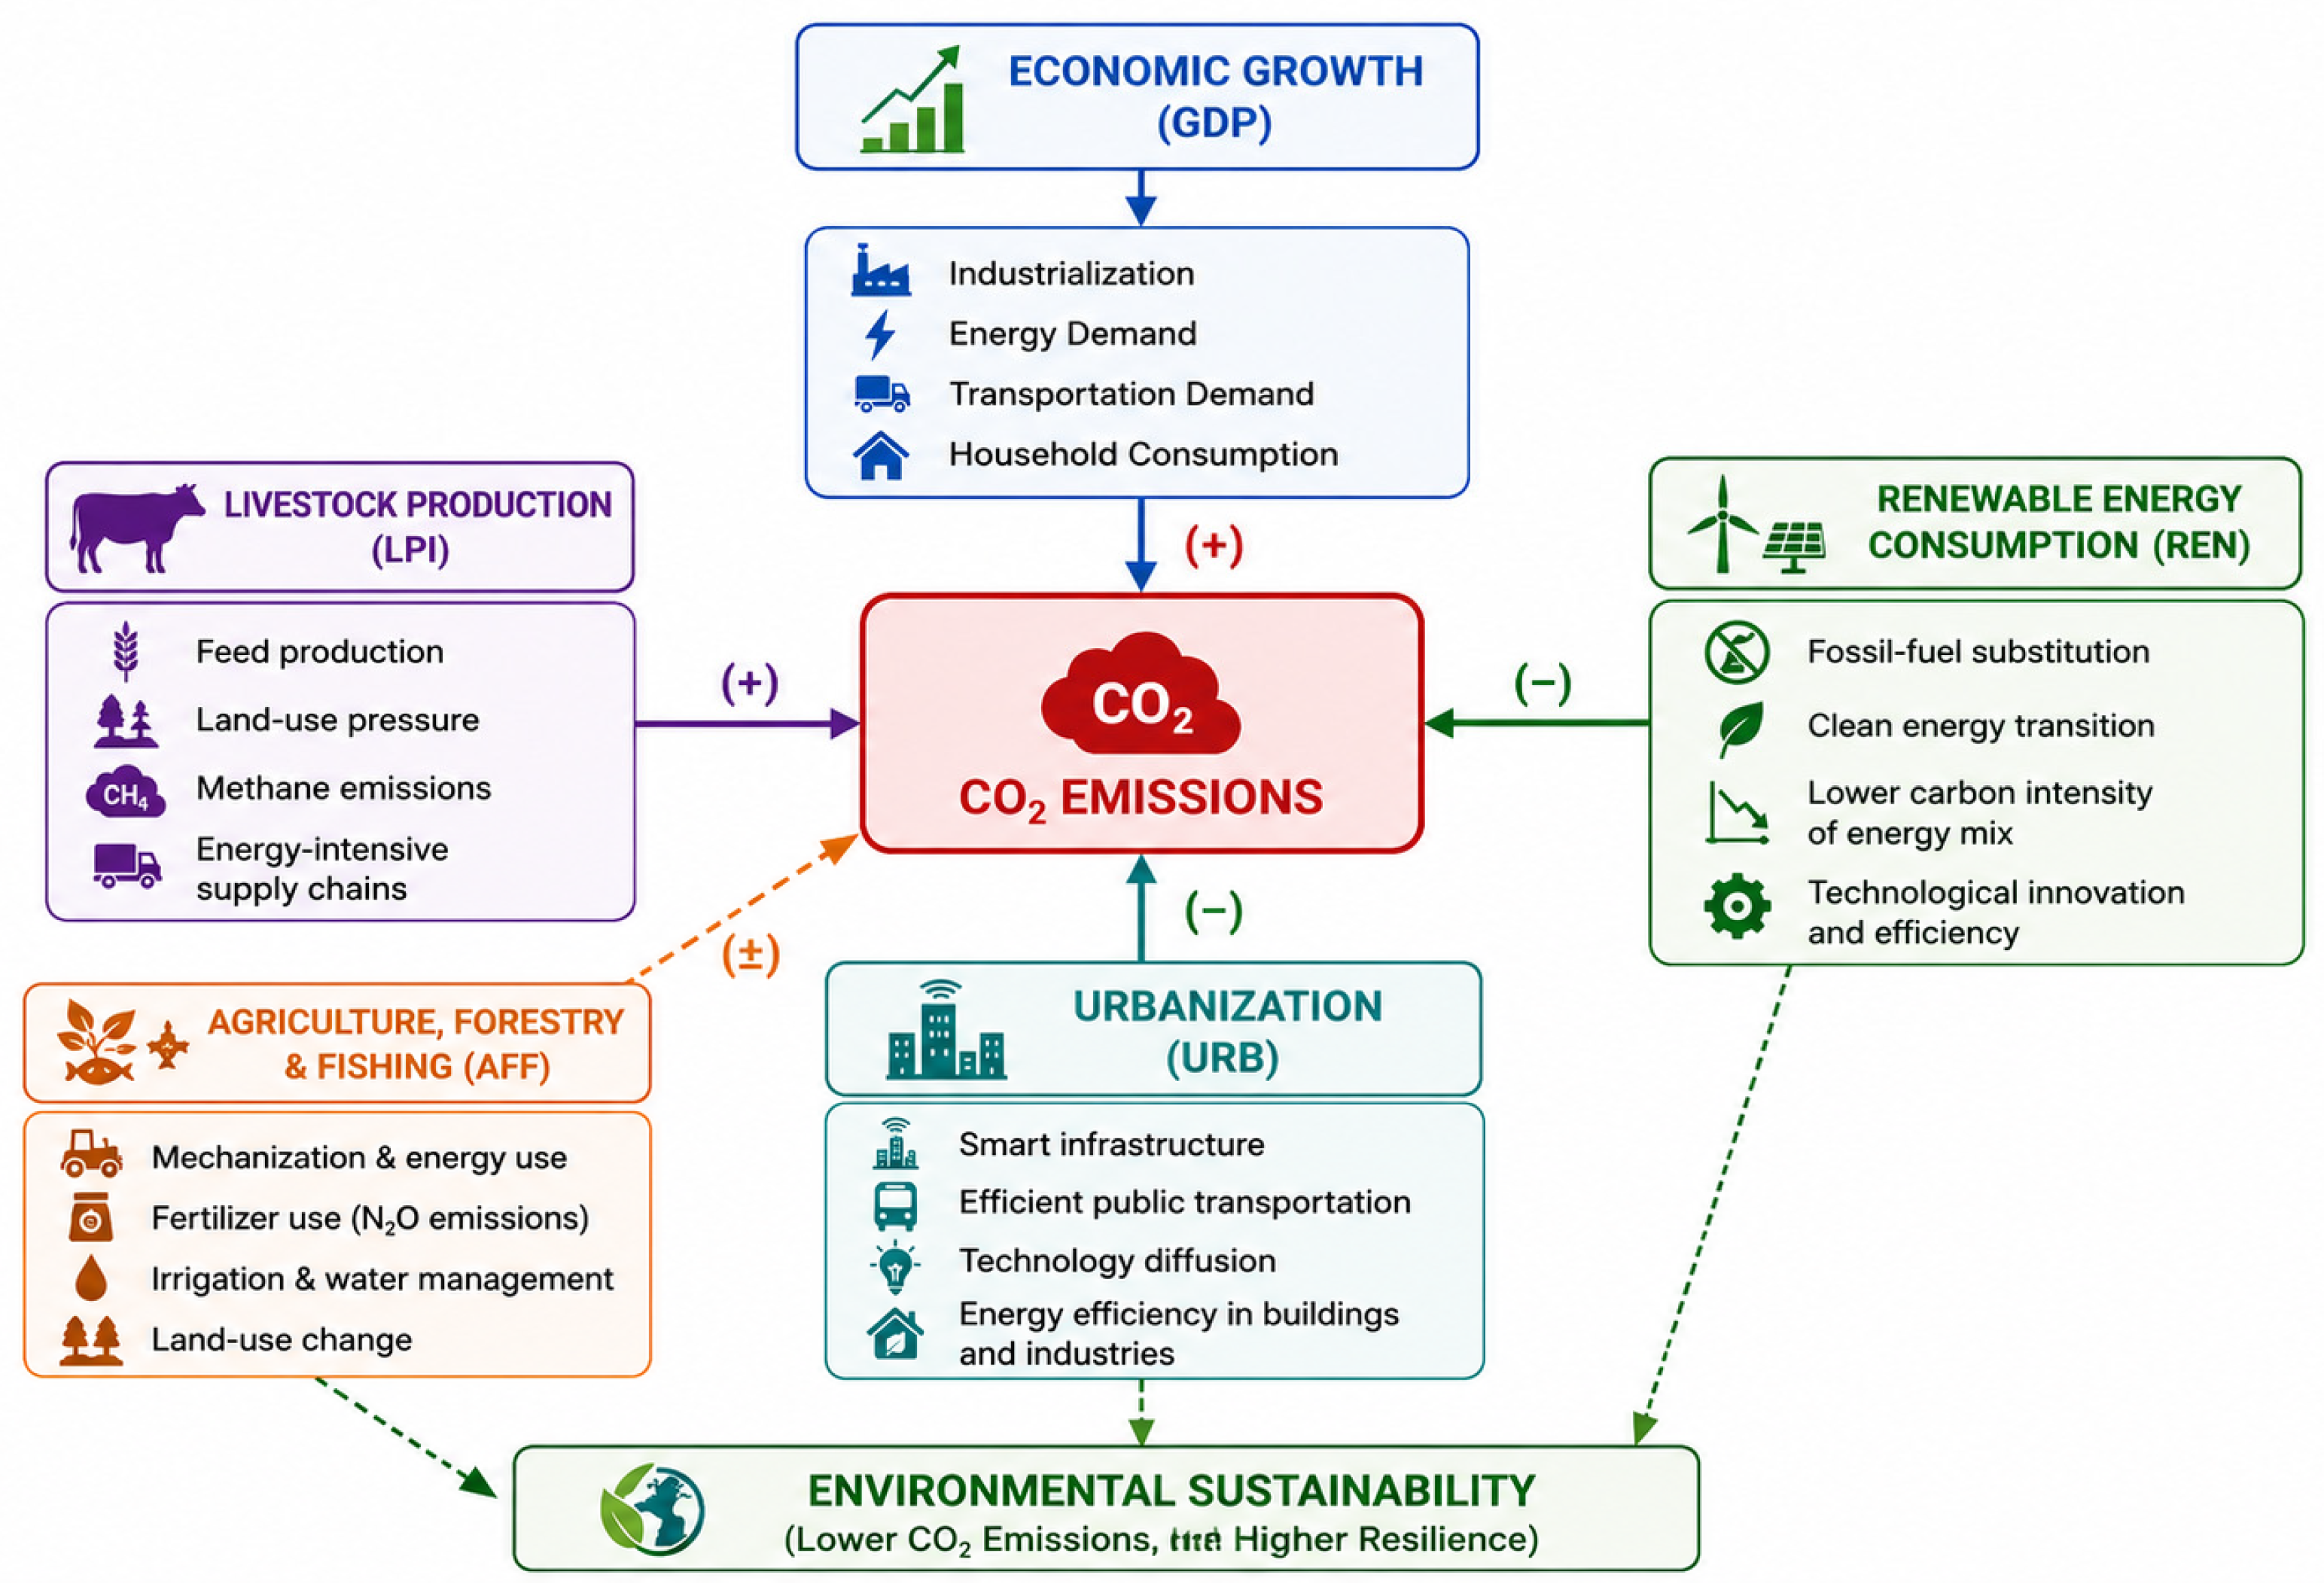
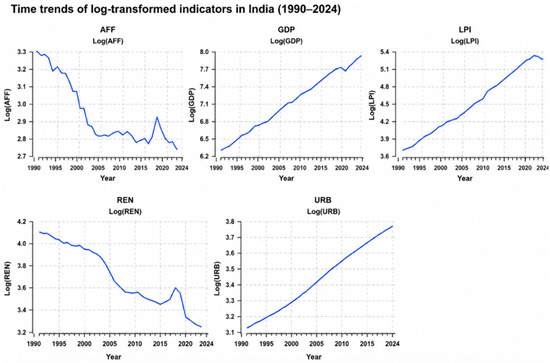
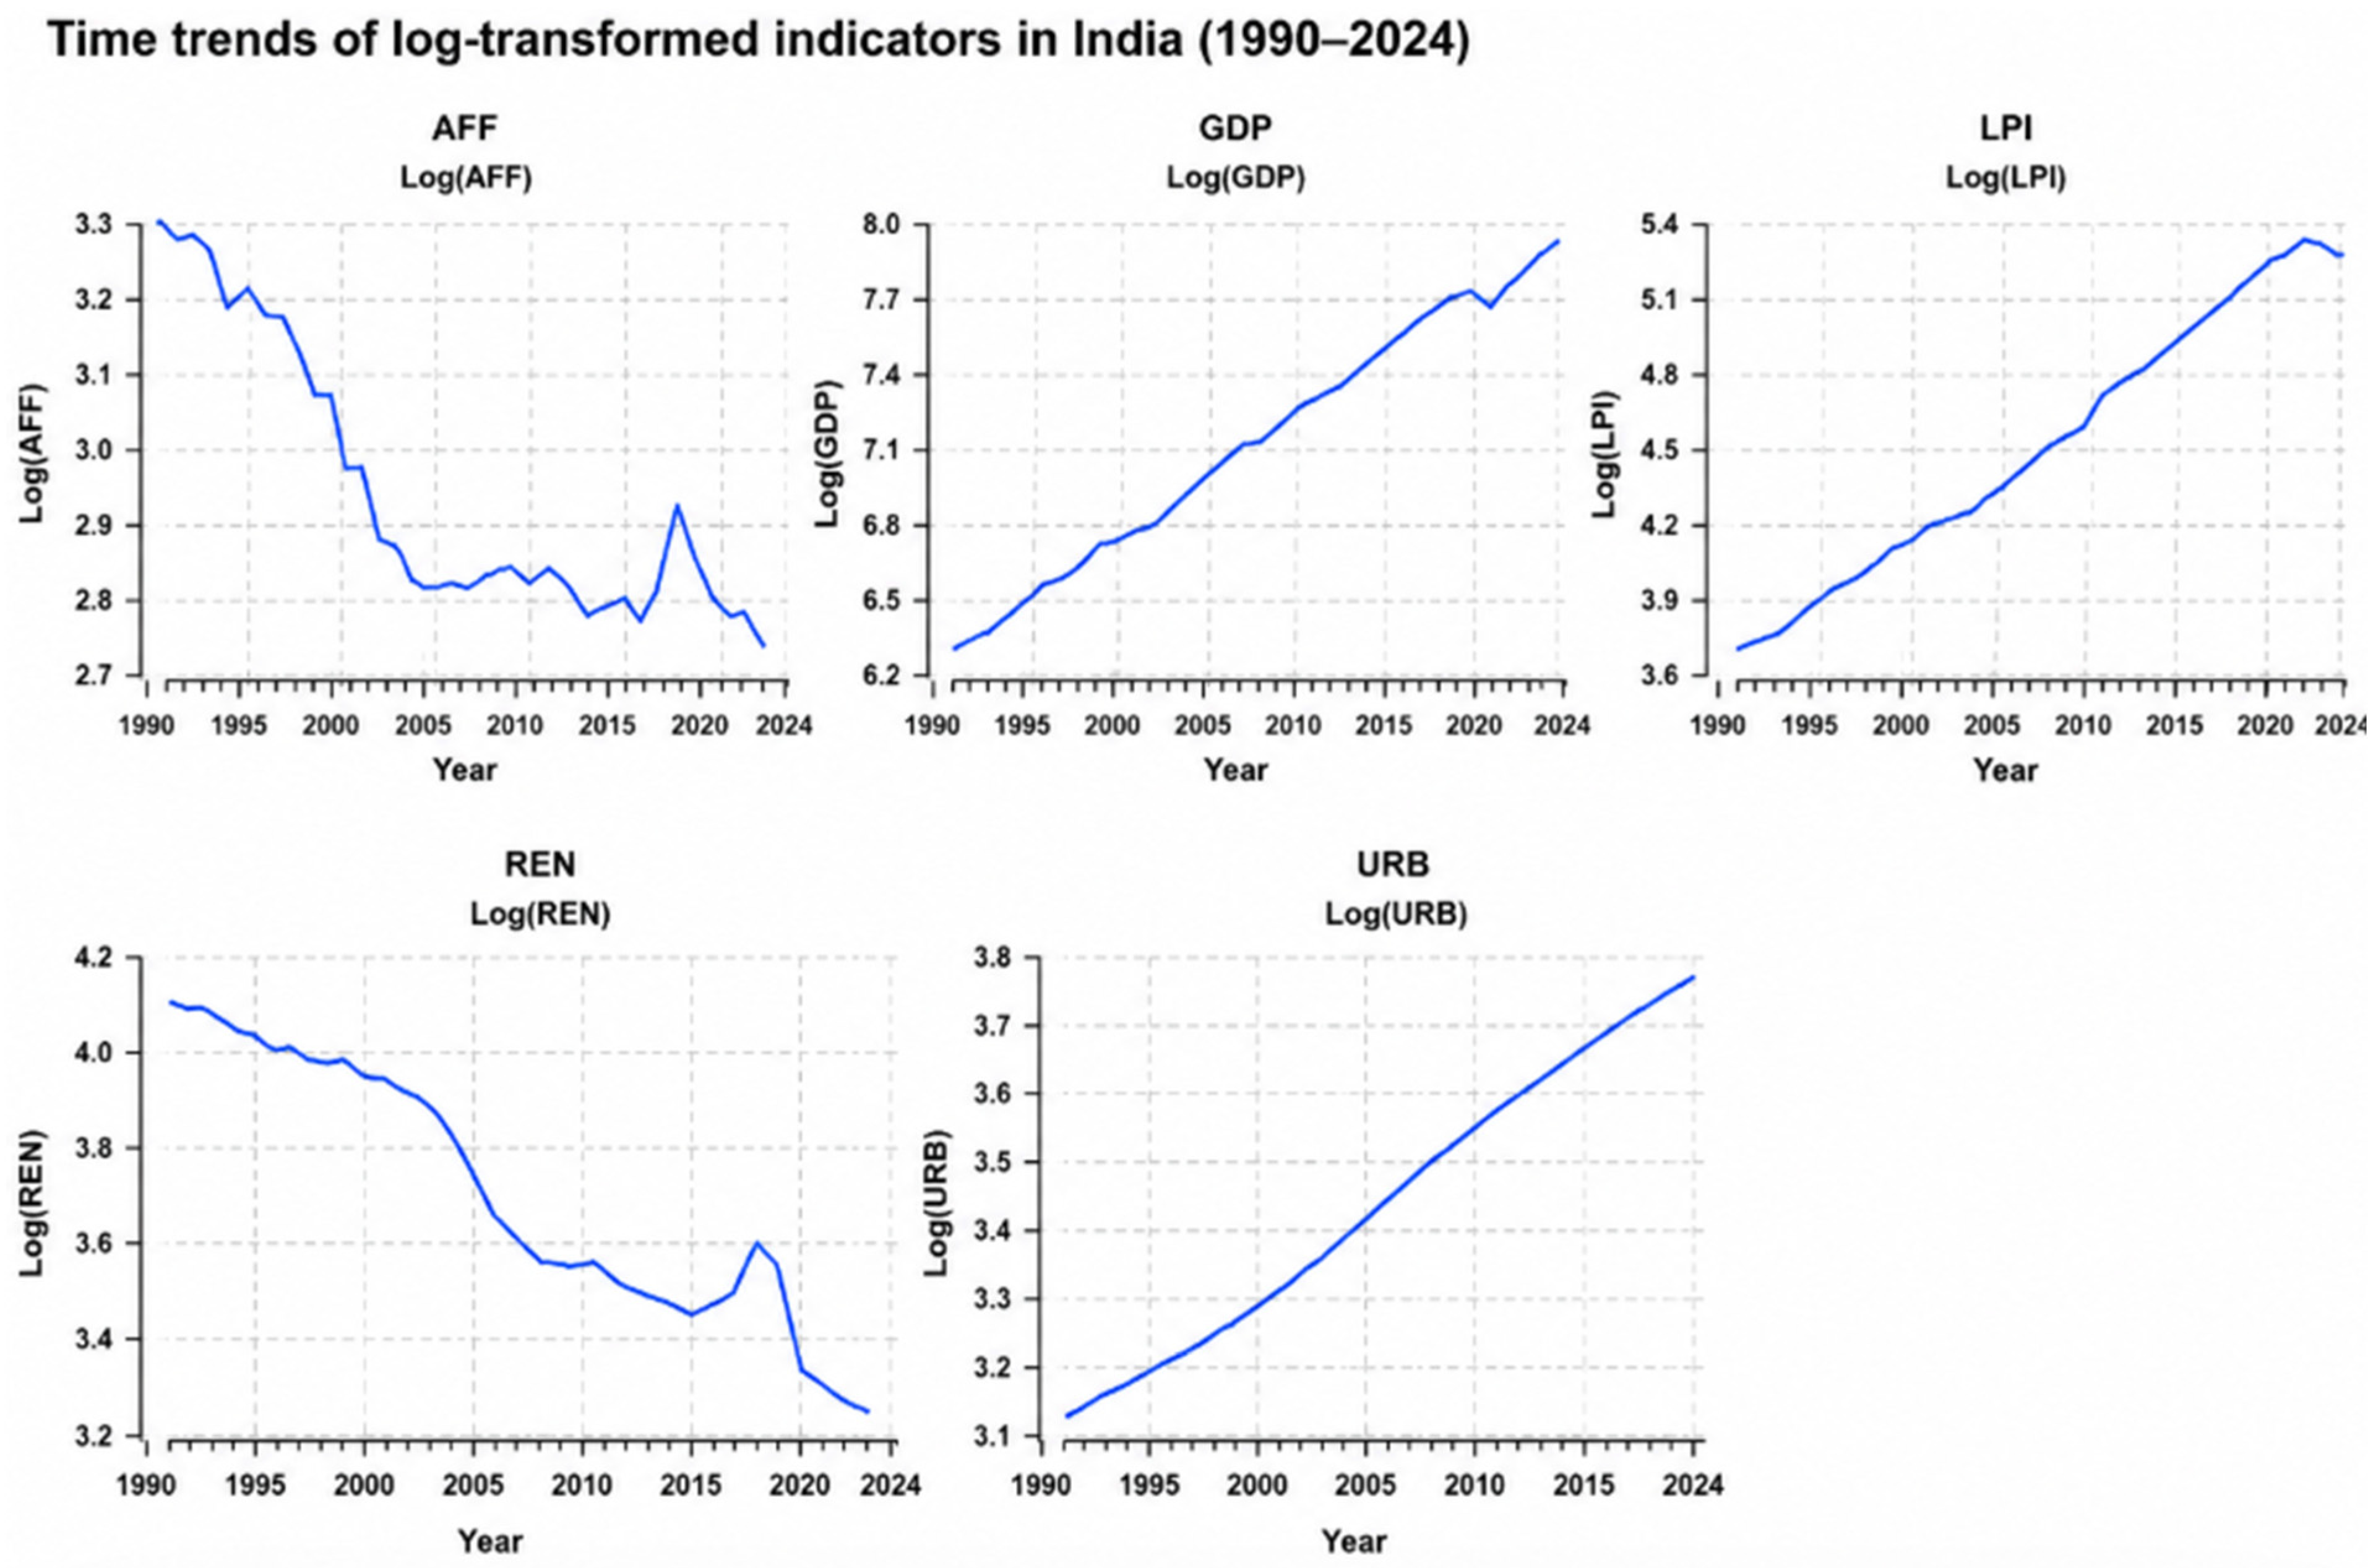
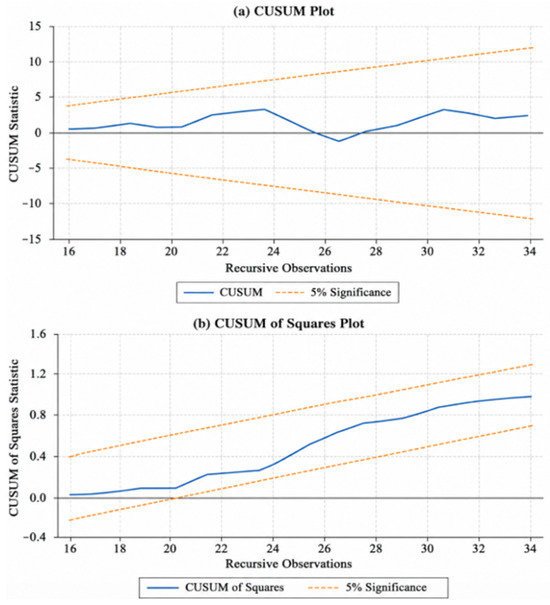
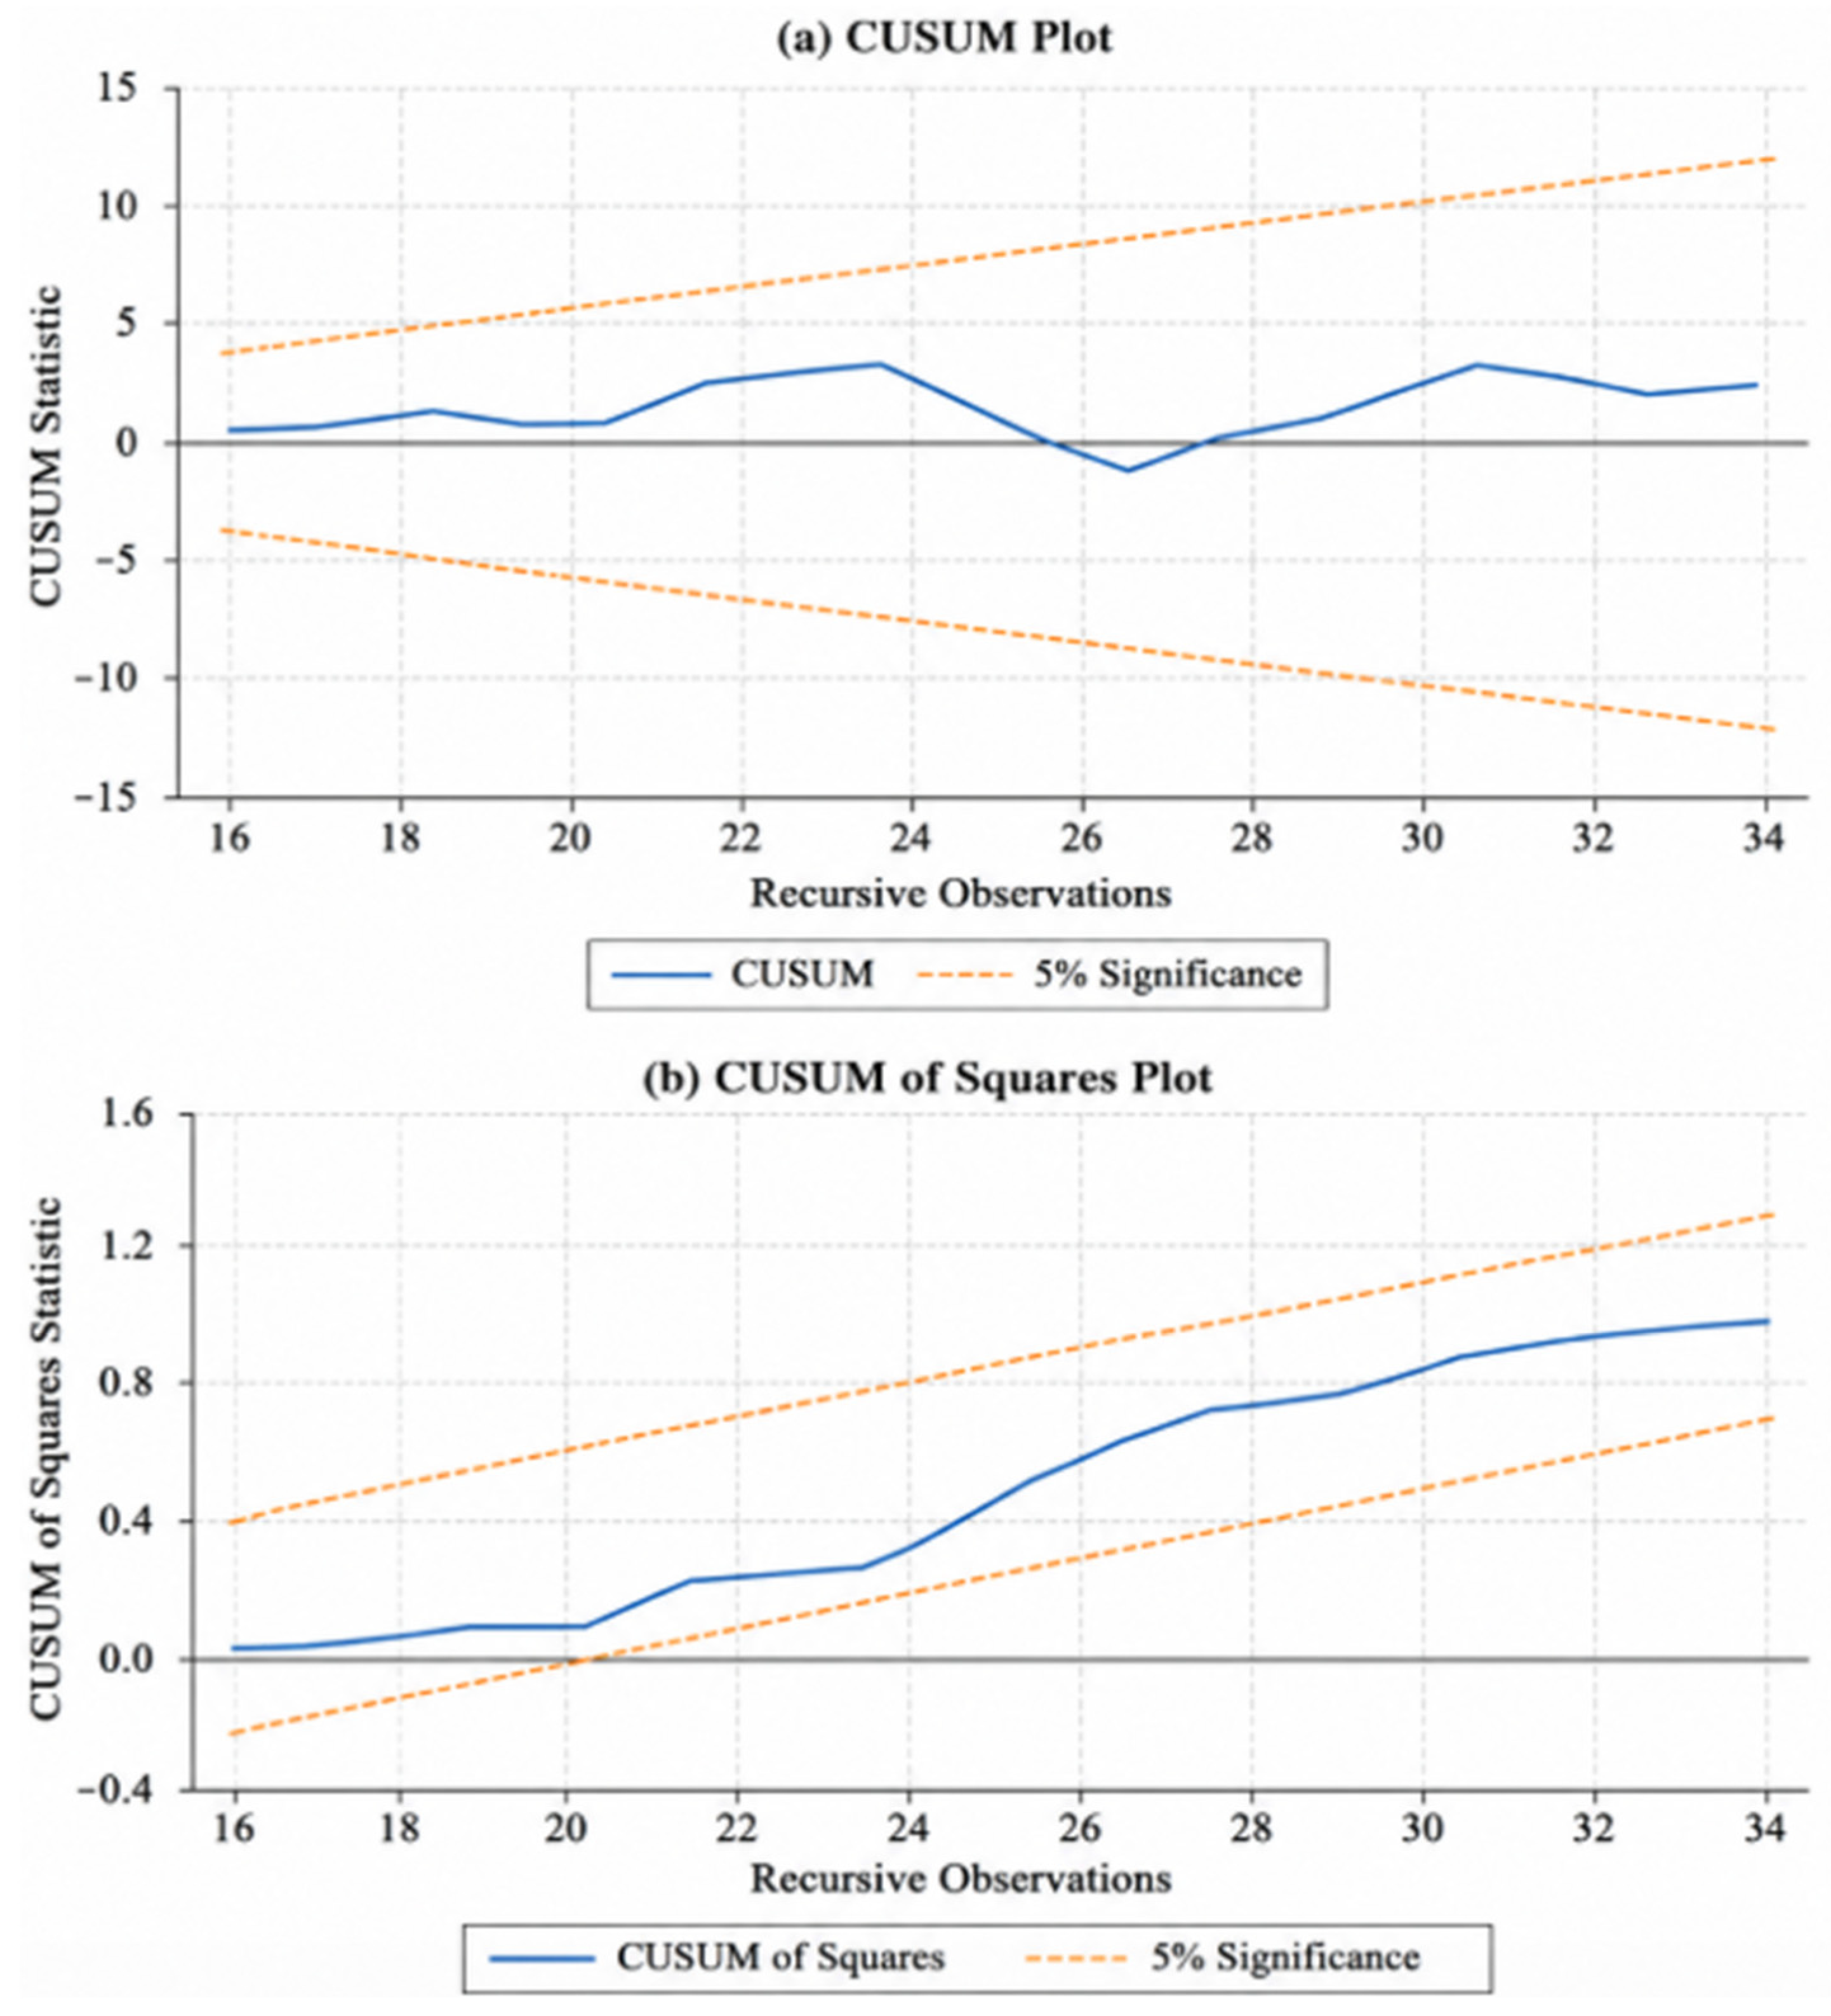
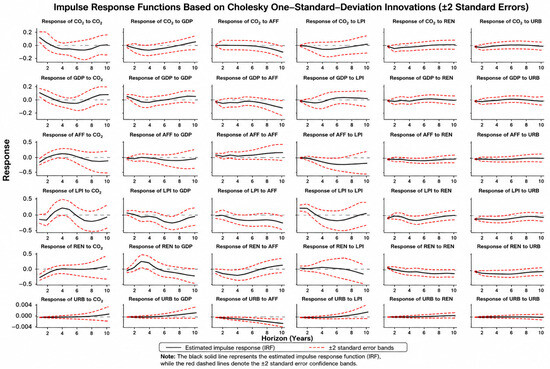
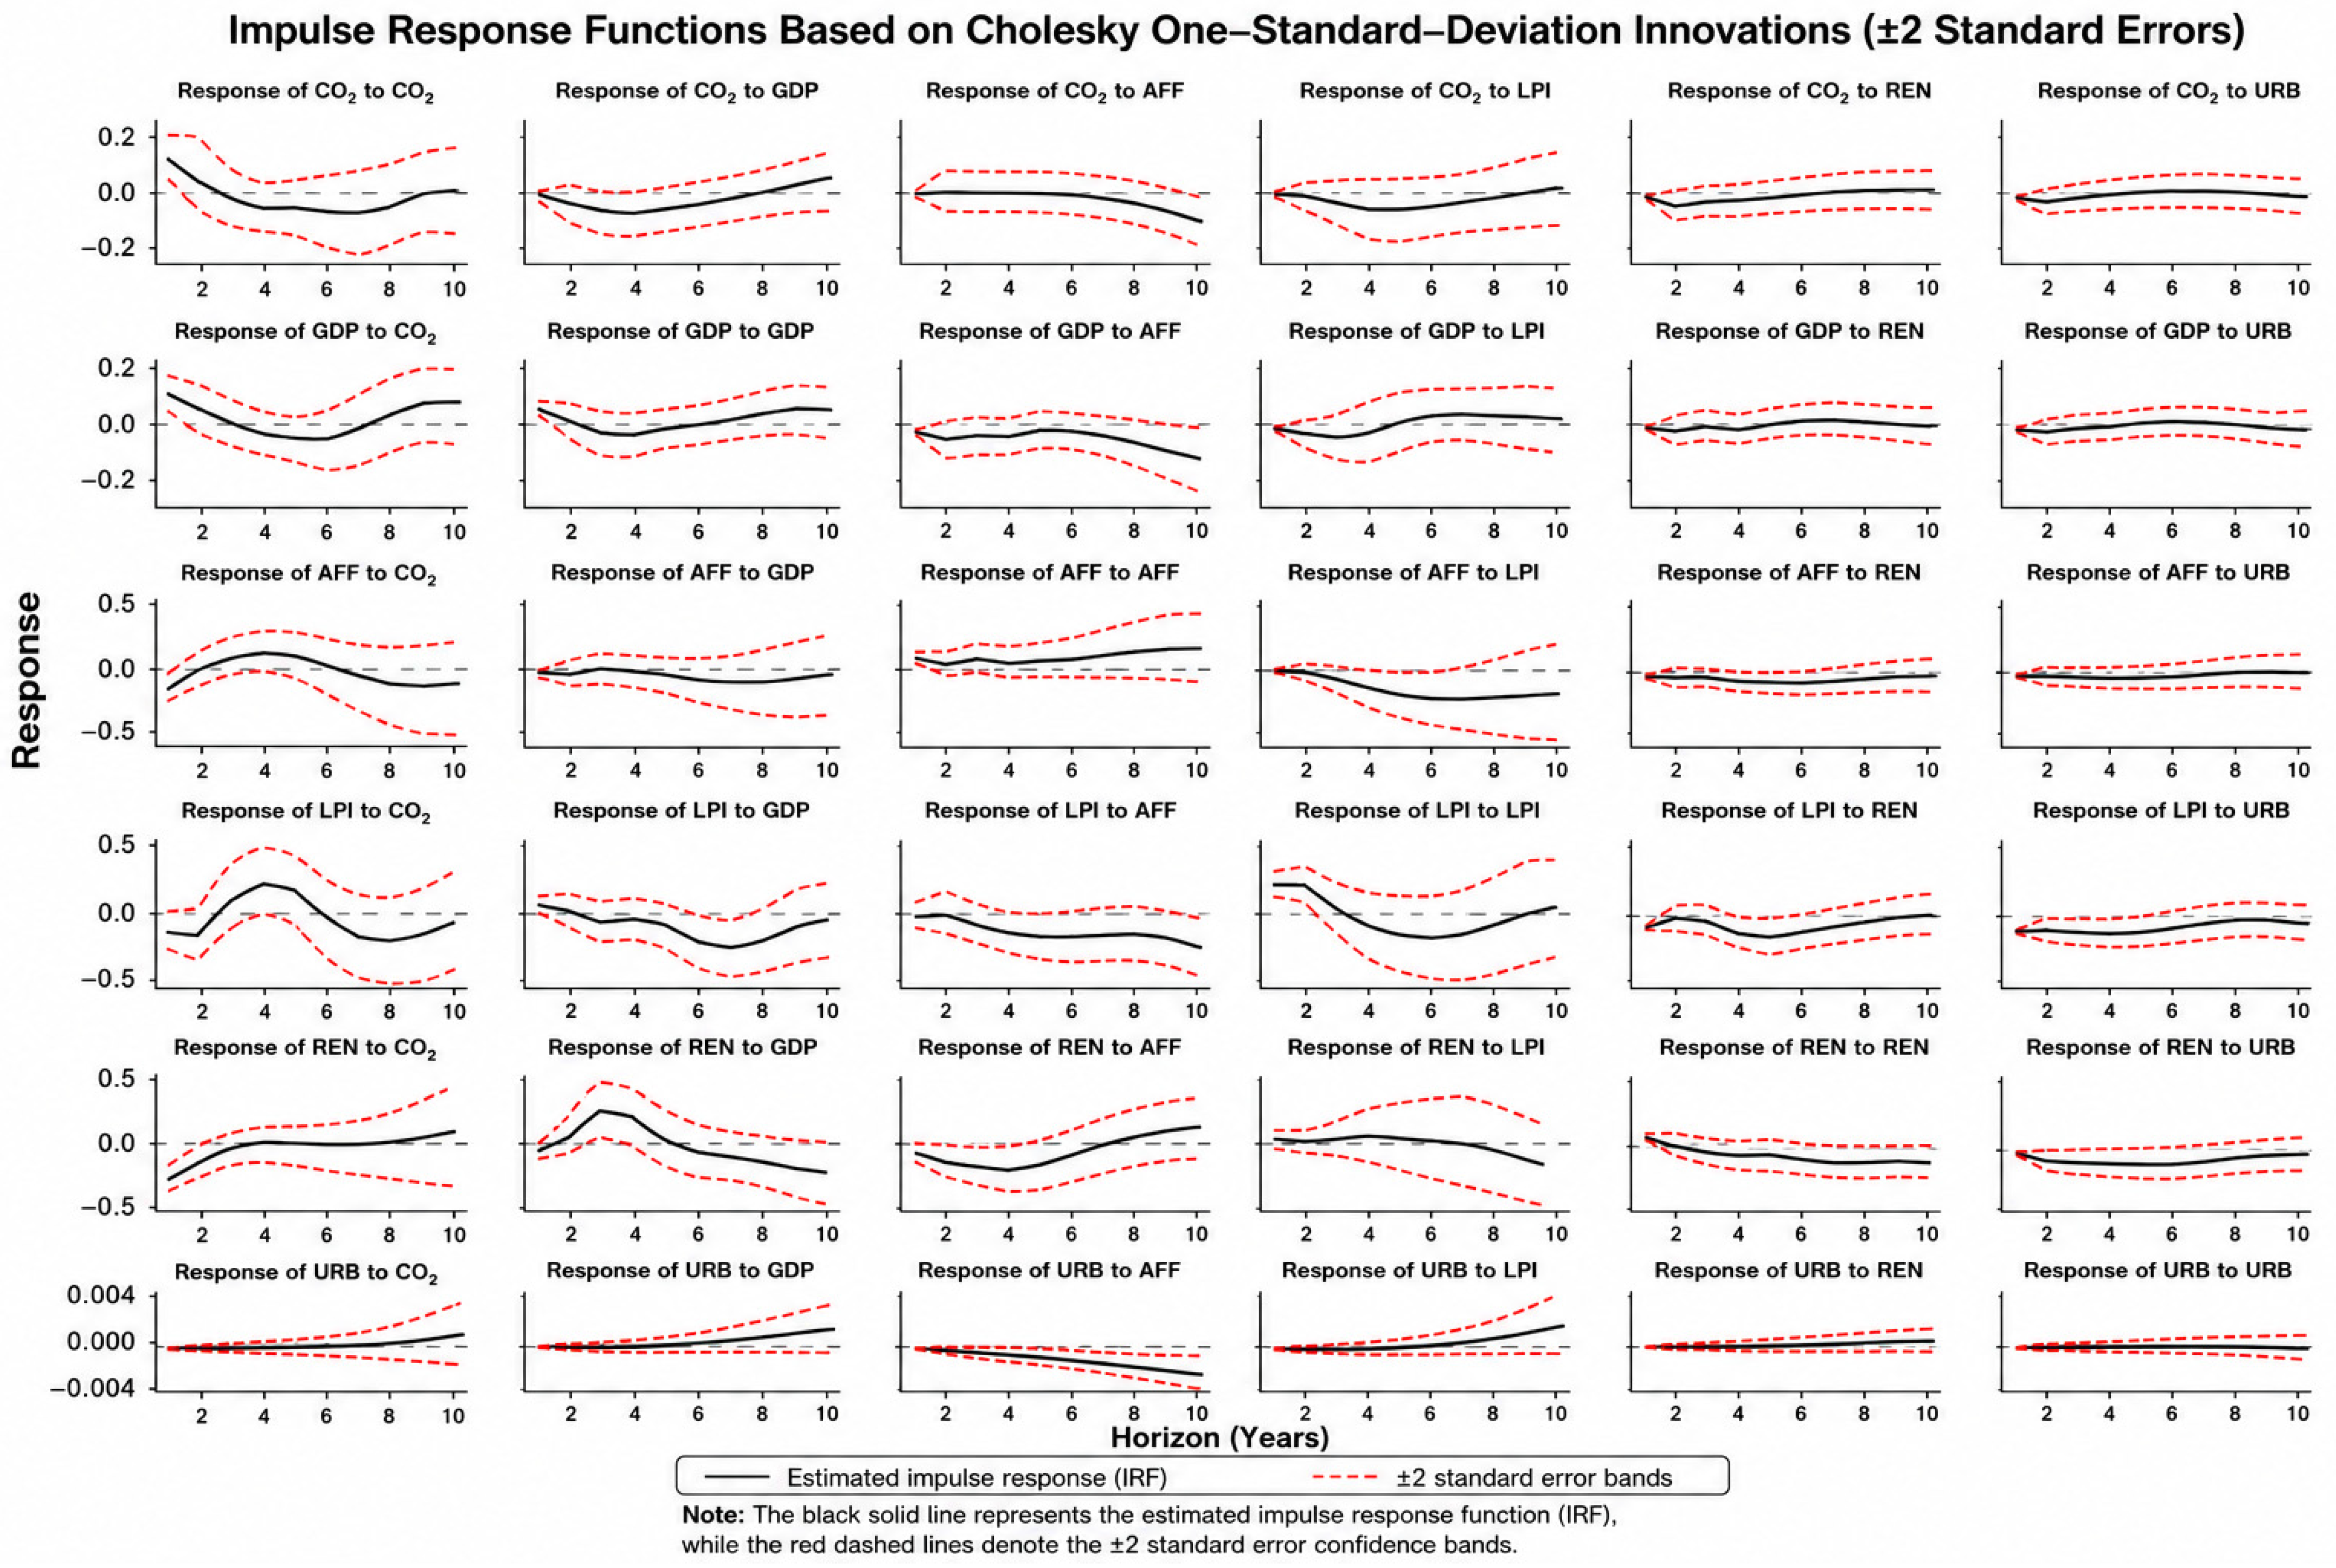

Disclaimer/Publisher’s Note: The statements, opinions and data contained in all publications are solely those of the individual author(s) and contributor(s) and not of MDPI and/or the editor(s). MDPI and/or the editor(s) disclaim responsibility for any injury to people or property resulting from any ideas, methods, instructions or products referred to in the content. |
© 2026 by the authors. Licensee MDPI, Basel, Switzerland. This article is an open access article distributed under the terms and conditions of the Creative Commons Attribution (CC BY) license.