


Abstract
Steel production accounts for approximately 7% of global GHG emissions. Brazil is the largest steel producer in Latin America, and carbon pricing is rapidly moving from a policy debate to an operational reality, making the financial exposure of Brazilian steelmakers to carbon regulation one of the most pressing industrial sustainability questions in an emerging market context. This study evaluates the financial exposure of the Brazilian steel industry to three carbon pricing scenarios: (i) a domestic cap-and-trade mechanism under Brazil’s Greenhouse Gas Emissions Trading System (SBCE); (ii) Carbon Border Adjustment Mechanisms (CBAMs) applied by key trading partners (EU, a hypothetical USA scenario, and a global scenario); and (iii) supply chain (Scope 3) exposure, relevant under net-zero corporate commitments and the expected expansion of EU-CBAM coverage. Using a scenario-based financial impact approach, with both macro-level (industry) and micro-level (company) analyses, results show that domestic carbon pricing could increase production costs by 7–21%, generating USD 1.6–4.9 billion in additional annual costs (equivalent to 4.3–13.3% of annual industry revenue). International CBAM exposure could reduce Brazilian steel export revenues by USD 570 million to USD 1.7 billion in a global scenario (1.5–4.6% of annual industry revenue). Supply chain emissions represent 68% of the industry’s total carbon pricing exposure, equivalent to USD 1.1–3.3 billion in domestic pricing costs and USD 388 million–1.16 billion in CBAM export revenue reduction. A company-level case study confirms the pattern, with lower Scope 3 intensity yielding a comparatively smaller but still material exposure. These findings offer practical decision support for steel companies and policymakers navigating the transition to a low-carbon economy.
1. Introduction
Climate change poses one of the most critical challenges to global economic systems, driven primarily by greenhouse gas (GHG) emissions from human activity. Industries (24%), energy generation (34%), transportation (15%), and agribusiness (22%) are among the largest emission sources globally [1]. The steel industry occupies a particularly prominent position in this landscape: responsible for approximately 7% of global GHG emissions, it is also a pillar of the world economy, contributing roughly USD 2.9 trillion annually (approximately 3.8% of global GDP) and supporting 96 million jobs [2,3].
In response to growing climate urgency, governments worldwide have accelerated the adoption of carbon pricing instruments. By 2024, carbon pricing initiatives covered approximately 24% of global GHG emissions, equivalent to around 13 billion tons of CO2 equivalent [4,5]. Two main instrument types exist: carbon taxes, which set a fixed price per ton of emissions, and Emissions Trading Systems (ETS), which cap total emissions and allow trading of allowances [6]. Both create financial costs for high-emission industries and incentivize investment in cleaner technologies. At the international level, Nationally Determined Contributions (NDCs) under the Paris Agreement have been submitted by approximately 70% of signatory countries, representing a broad political commitment to emissions reduction that increasingly translates into domestic regulatory action [7].
A critical complement to domestic carbon pricing is the Carbon Border Adjustment Mechanism (CBAM), designed to prevent carbon leakage by pricing the carbon content of imported goods. The European Union (EU) launched its CBAM in 2024, with full implementation expected by 2026 and gradual expansion through 2034 [8]. While the United States does not currently have a CBAM in place and near-term adoption remains uncertain, its significance as Brazil’s largest steel export destination justifies its inclusion as a sensitivity scenario. Among the sectors targeted, steel is one of the most exposed, given its energy intensity and emissions profile.
Brazil presents a compelling case for this analysis. The country is the 9th largest steel producer globally and the largest in Latin America, producing 34.1 million tons annually, roughly 2% of world output [9]. At the end of 2024, Brazil enacted Law 15,042, establishing the Brazilian Greenhouse Gas Emissions Trading System (SBCE), creating a domestic cap-and-trade framework that will directly affect energy-intensive industries including steel [10]. Combined with emerging international CBAMs, this regulatory environment introduces substantial new financial risks for Brazilian steel producers.
The existing literature has examined carbon pricing effects on competitiveness [11,12], carbon leakage [13,14], and the macroeconomic consequences of CBAM for developing economies [15,16]. However, fewer studies quantify the financial exposure of specific industries in emerging market countries using both industry-level and company-level empirical data, and fewer still integrate supply chain (Scope 3) exposure into the analysis. This paper addresses these gaps.
The central research question is: what is the magnitude of the financial impact of carbon pricing on the Brazilian steel industry, across domestic, international trade, and supply chain dimensions?
To answer this, a scenario-based quantitative model is developed and applied at both the macro (national industry) and micro (individual company) levels, covering three carbon price points (USD 25, 50, and 75 per ton of CO2 equivalent) aligned with IMF guidance and Brazilian policy scenarios [17,18].
This study makes three principal contributions. First, it provides a quantitative financial exposure framework for carbon pricing in an emerging market industrial context, explicitly measuring the cost of internalizing carbon emissions as an externality across domestic, trade, and supply chain dimensions. Second, it demonstrates the outsized importance of Scope 3 supply chain emissions in determining total carbon pricing liability. Third, it offers a concrete financial business case for decarbonization, providing best-in-class companies with actionable benchmarks as Brazil operationalizes its carbon market. The findings complement prior work on ESG performance evaluation in the steel sector [19], which established a supply chain scoring model for the same industry, by now focusing exclusively on the financial dimension of carbon exposure.
1.1. Carbon Pricing Instruments and Policy Context
Carbon taxes and ETS are the two primary carbon pricing instruments. A carbon tax imposes a fixed cost per unit of emission, while an ETS establishes a cap and allows trading of allowances, enabling emission reductions where they are most cost-effective [6]. Both create economic incentives for decarbonization without prescribing specific technologies. Research confirms that these instruments can reduce emissions while remaining compatible with economic growth, provided they are carefully designed [11,20,21,22,23].
Carbon leakage, the relocation of production to jurisdictions with less stringent regulation, is a central concern motivating CBAMs [13,14]. CBAMs impose a carbon cost on imported goods equivalent to that borne by domestic producers, neutralizing the competitive advantage of lower-regulation countries. The EU-CBAM initially covers aluminum, cement, electricity, fertilizers, and iron and steel. Among major economies, Brazil is among the most exposed, particularly in steel, with aggregated export value to the EU reaching approximately USD 2 billion [15,24]. The downstream effects of carbon policy extend to key steel-consuming sectors as well: recent evidence from the real estate sector demonstrates that decarbonization-driven regulation materially affects sectoral attractiveness and asset valuation [23].
Brazil’s carbon policy trajectory has been evolving since the 2009 National Climate Change Policy (PNMC). After years of incremental development, Law 15,042 of 2024 established the SBCE, introducing a cap-and-trade system with Brazilian Emission Quotas (CBE) and voluntary Verified Emission Reduction Certificates (CRVEs). Entities emitting more than 25,000 tons of CO2 equivalent per year face mandatory reconciliation obligations, with penalties for non-compliance [10,25].
Implementation follows a phased roadmap: Phase I (2025–2026) focuses on regulatory development; Phase II (2027) introduces MRV obligations; Phases III and IV (2028–2030) require mandatory monitoring and the launch of the first National Allocation Plan; and Phase V delivers full system implementation aligned with Brazil’s 2050 carbon-neutrality objective [26]. Notably, the iron and steel sector has been confirmed as part of the first sectoral coverage wave, with MRV obligations beginning in 2027 [27]. This positions Brazil’s steel producers at the immediate frontier of domestic carbon pricing compliance.
1.2. Supply Chain Carbon Exposure in the Steel Sector
The GHG Protocol categorizes corporate emissions into three scopes: Scope 1 (direct emissions), Scope 2 (indirect emissions from purchased energy), and Scope 3 (all other indirect emissions, including upstream and downstream supply chain activity) [28]. In the steel industry, Scope 3 accounts for approximately 68% of total emissions, while Scope 1 represents 20% and Scope 2 12% [29]. This distribution implies that carbon pricing mechanisms that extend to Scope 3, as the EU-CBAM is expected to do from 2027, would dramatically expand financial exposure for steel producers.
Despite this, most corporate carbon risk analyses focus on Scopes 1 and 2. The integration of Scope 3 exposure into carbon pricing impact assessments remains an underexplored area in the literature, particularly for companies in emerging markets. This paper addresses that gap by explicitly modeling supply chain financial exposure at both industry and company levels. The 68% Scope 3 share used in this study is sourced from Schmidt et al. (2022) [29], a sector-level benchmark based on global steel industry data, predominantly reflecting upstream emissions from raw material extraction and processing, the categories most likely to be captured by future CBAM extensions. The inclusion of Scope 3 in the financial exposure scenarios is justified by the EU-CBAM’s planned extension to Scope 3 emissions from 2027, making this exposure financially material for Brazilian steel exporters in the near term.
2. Materials and Methods
This study adopts a scenario-based financial impact assessment approach, estimating hypothetical financial costs under predefined carbon price levels without modeling behavioral responses or probabilistic outcomes. The analysis is structured in two levels: (i) a macro-level assessment of the Brazilian steel industry, and (ii) a micro-level assessment of an individual steel company operating in Brazil. The methodology integrates publicly available industry data with proprietary company-level data and literature-grounded carbon price scenarios.
Data for the macro-level assessment were collected from the World Steel Association (2023), Instituto Aço Brasil (2024), the IMF (2024) [3,9,17], and peer-reviewed literature (Scopus, Web of Science, Google Scholar). The micro-level assessment uses internal company data provided under a confidentiality agreement. The company is a major integrated steel producer in Brazil with significant domestic and export activity. Its production process incorporates low-carbon technologies, resulting in an emission intensity substantially below the Brazilian industry average. Data was sourced from internal documents provided by the company and complemented by publicly available annual reports. The company’s name is withheld under a confidentiality agreement.
Three carbon price levels (USD 25, 50, and 75 per ton of CO2 equivalent) were selected based on IMF (2024) guidance and ranges commonly discussed in Brazilian policy contexts [17,18,30,31,32], representing short (USD 25/t), medium (USD 50/t), and long-term (USD 75/t) regulatory scenarios. For context, Brazil’s existing carbon credit instrument (CBIO), operating under the RenovaBio program in the biofuels sector, traded at approximately BRL 60/credit (USD 11/t CO2eq) as of mid-2025 [33], consistent with the lower bound of the range adopted in Brazil. The EU-ETS average allowance price reached approximately €75.65/tCO2eq over the December 2025–May 2026 period [34], supporting the upper bound. Taken together, these benchmarks ground the selected scenarios in both current market realities and medium-to-long-term policy projections.
2.1. Scenario Framework
Three scenarios are analyzed for both macro and micro levels:
Scenario 1—Domestic Carbon Pricing: A domestic SBCE cap-and-trade mechanism is assumed to be in effect, imposing costs on direct (and potentially indirect) emissions of steel producers operating in Brazil.
Scenario 2—International Trade (CBAM): Carbon border adjustments imposed by trading partners are modeled across three destination configurations: (a) a hypothetical global CBAM, where all countries adopt a uniform standard; (b) a hypothetical USA-CBAM—while there are no concrete plans for the United States to adopt a CBAM in the near term, this configuration is included as a sensitivity exercise given Brazil’s significant export exposure to that market and the strategic value of quantifying potential exposure if such a mechanism were enacted; and (c) the EU-CBAM. The modeling assumes that Brazilian exporters absorb the cost to maintain price competitiveness (price stability assumption). While firms may respond through alternative mechanisms, including partial cost pass-through, contract renegotiation, export destination adjustments, or product portfolio changes, modeling these behavioral responses would require a separate econometric framework beyond the scope of this study. The full absorption assumption therefore represents an upper-bound estimate of financial exposure under each configuration.
Scenario 3—Supply Chain (Scope 3) Impact: The domestic pricing and CBAM scenarios above are extended to include Scope 3 emissions, isolating the share of financial exposure attributable to supply chain activity. This is relevant for companies with net-zero commitments covering all three scopes and is further reinforced by the EU-CBAM’s planned incorporation of Scope 3 emissions from 2027. The 68% Scope 3 share applied at the industry level represents a global sector-level benchmark [29]; company-specific Scope 3 figures may vary depending on production process, raw material sourcing, and vertical integration. For the micro-level assessment, the company’s own Scope 3 data was provided directly, resulting in a substantially lower share of 20%, reflecting its vertically integrated operations.
2.2. Data
Table 1 represents the data inputs for macro-level analysis of the Brazilian steel industry and Table 2 shows the data inputs for the micro-level analysis for the specific indivual company.
Table 1.
Data inputs for macro-level analysis of the Brazilian steel industry.
Table 2.
Data inputs for micro-level analysis (individual specific company).
The specific company case is notable in that it uses biomass and scrap in its production process, resulting in emissions approximately 50% below the Brazilian industry average. Its Scope 3 share (20%) is also substantially lower than the sector average (68%), reflecting vertically integrated operations that include raw material mining.
2.3. Quantitative Model
2.3.1. Scenario 1—Domestic Carbon Pricing
The additional cost per ton of steel due to carbon pricing (CApt) and the total additional annual cost (TAC) are calculated as
where Ept is emissions per ton of steel, CP is the carbon price, and AP is annual production. The new production cost per ton (NPCpt), new profit margin per ton (NMpt), and total margin (TM) are then:
CApt = Ept × CP
TAC = AP × CApt
NPCpt = PCpt + CApt
NMpt = DPpt − NPCpt
TM = AP × NMpt
2.3.2. Scenario 2—CBAM (International Trade)
The additional cost per ton due to CBAM (CAcb) and the new effective export price (NEPpt) are:
where CPcb is the CBAM tariff rate. Export revenue reduction (ER) is
CAcb = Ept × CPcb
NEPpt = EPpt − CAcb
ER = (EV × EPpt) − (EV × NEPpt)
2.3.3. Scenario 3—Supply Chain (Scope 3) Exposure
The financial value attributable to supply chain emissions is isolated by applying the Scope 3 share to the results of Scenarios 1 and 2:
SCC1 = TAC × Scope3%
SCC1 = TAC × 68%
SCC2 = ER × Scope3%
SCC2 = ER × 68%
Equivalent equations apply at the micro level, substituting company-specific emission intensities, production volumes, and export volumes. All equations were developed by the authors specifically to capture the financial structure of carbon pricing exposure in this industrial context.
3. Results
3.1. Macro-Level: Brazilian Steel Industry
3.1.1. Scenario 1 Macro-Level Results—Domestic Carbon Pricing
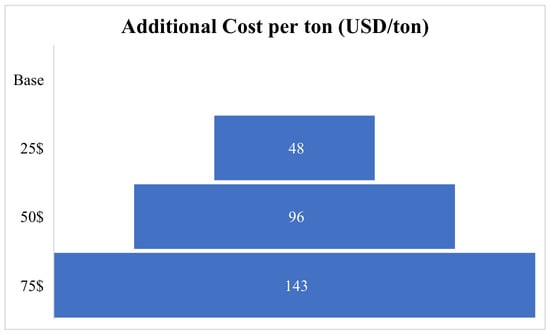
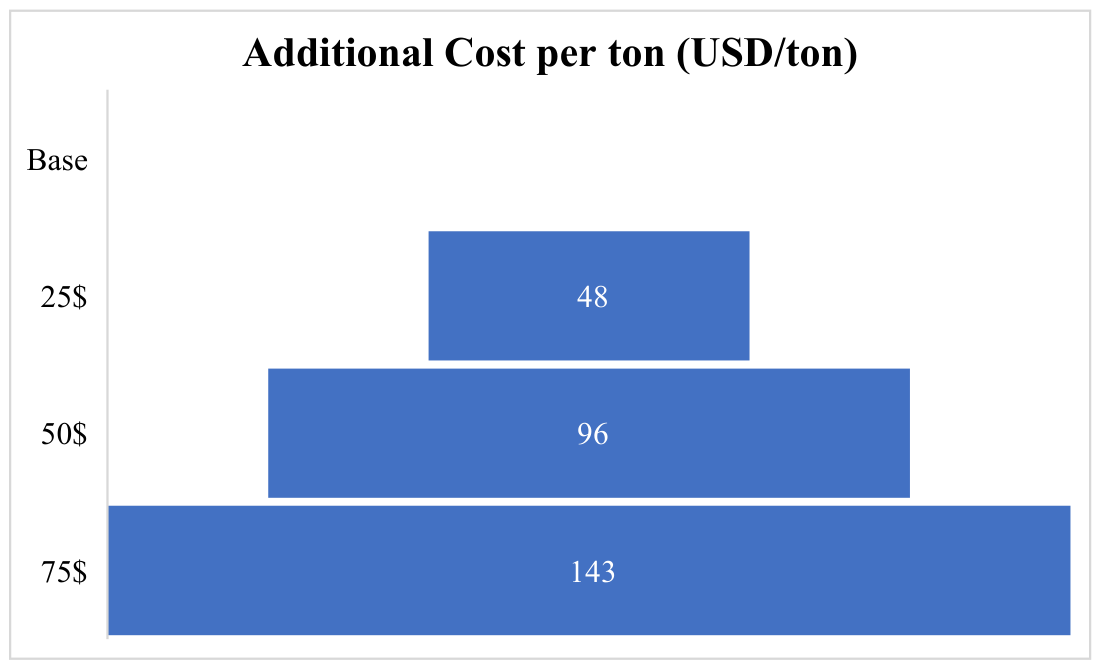
Applying Equations (1)–(5) to the macro-level data, domestic carbon pricing would generate additional costs per ton of steel of USD 47.8, USD 95.5, and USD 143.3, corresponding to carbon prices of USD 25, 50, and 75 per ton of CO2eq, respectively. Multiplied by Brazil’s annual production of 34.1 million tons, total additional annual costs reach approximately USD 1.6 billion, USD 3.3 billion, and USD 4.9 billion for the three price levels, equivalent to 4.3%, 9.0%, and 13.3% of the industry’s annual revenue base of USD 36.79 billion, respectively (Figure 1).
Figure 1.
Total additional annual cost to the Brazilian steel industry under domestic carbon pricing scenarios (USD 25, 50, and 75 per ton of CO2eq).
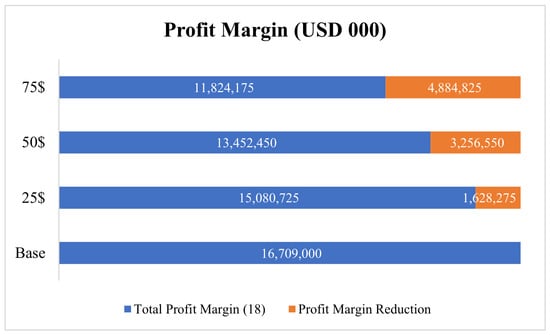
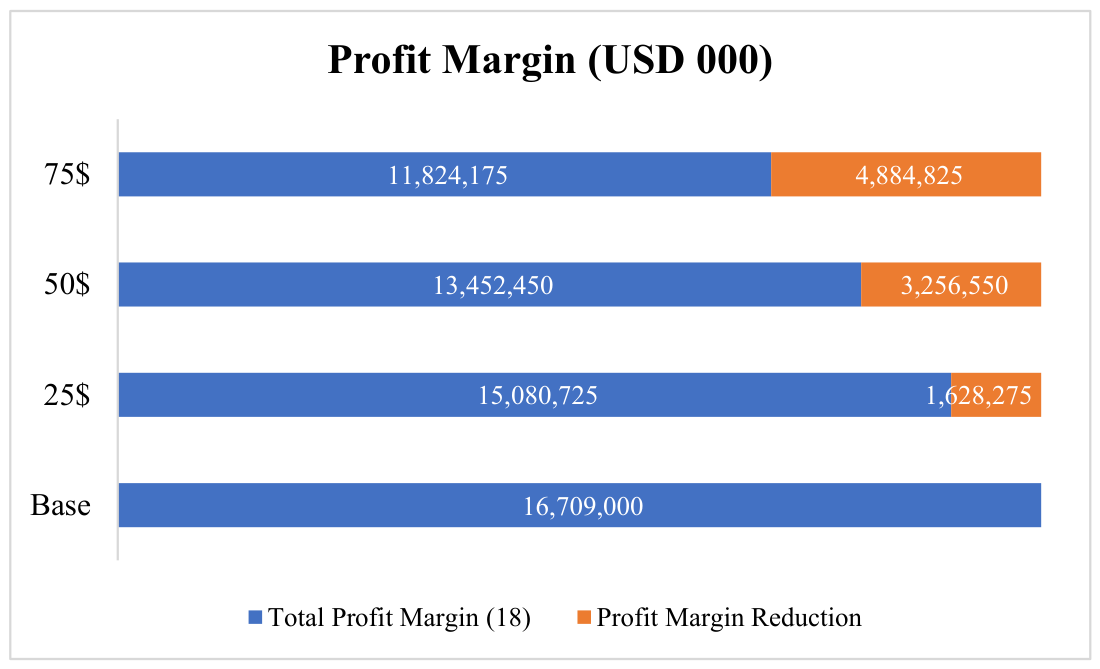
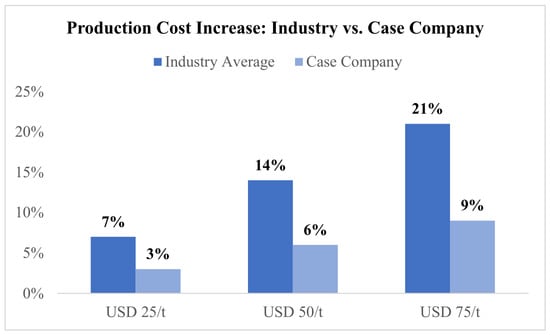
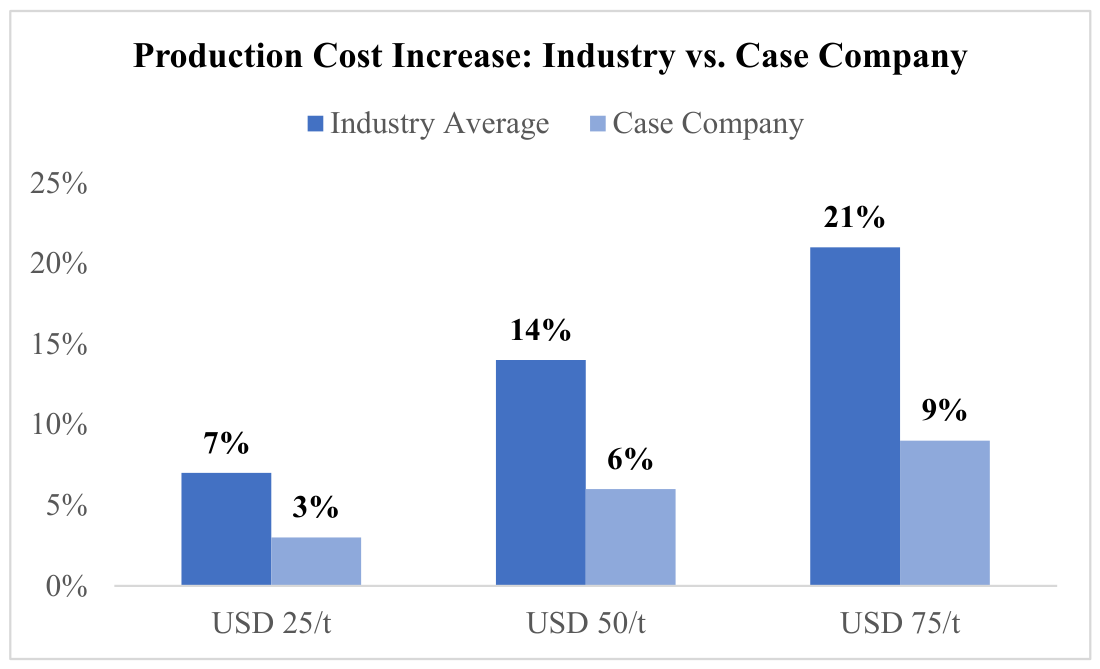
The current average production cost of USD 680 per ton would increase to USD 728 (+7%), USD 776 (+14%), and USD 823 (+21%) under the three scenarios. The resulting profit margin per ton falls from USD 490 to USD 442 (−10%), USD 394 (−19%), and USD 347 (−29%). In aggregate, total annual industry profit margin declines from approximately USD 16.7 billion to USD 15.1, USD 13.4, and USD 11.8 billion, respectively.
3.1.2. Scenario 2 Macro-Level Results—CBAM Exposure
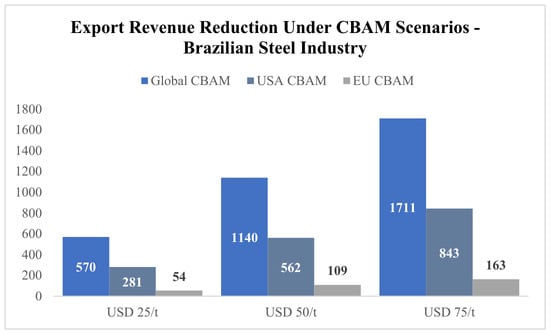
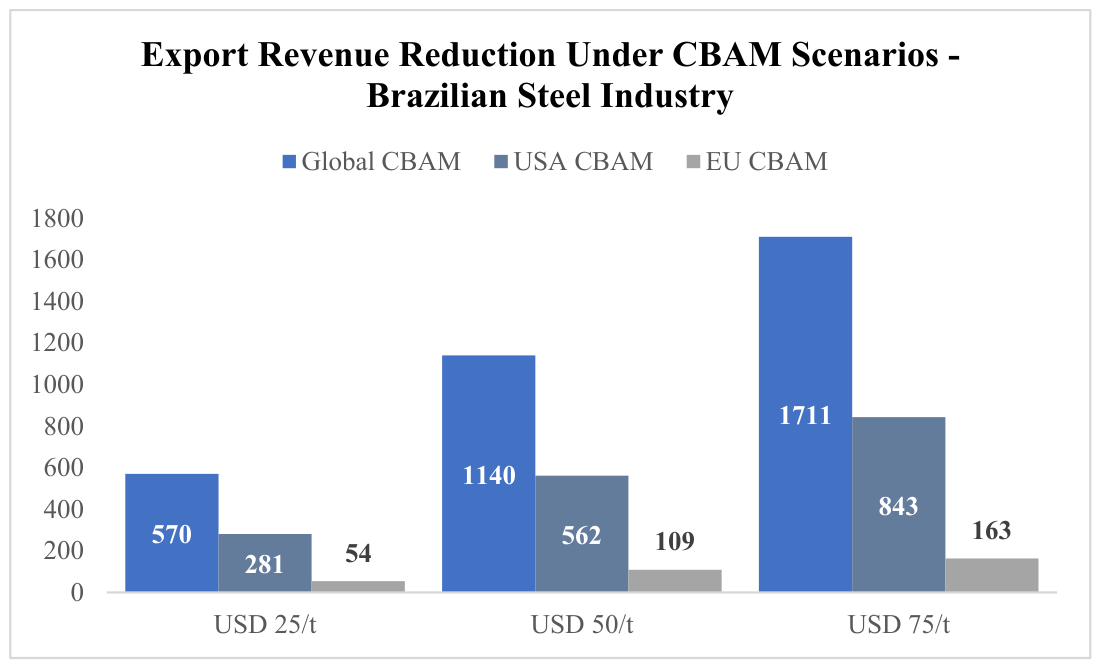
Under the CBAM scenario (Equations (6)–(8)), Brazilian steel exporters absorb the carbon cost to maintain price competitiveness. With Scope 1 + 2 emissions of 1.91 t CO2eq per ton, the effective export price declines by USD 47.8, USD 95.5, and USD 143.3 per ton across the three price levels, representing price reductions of approximately 5–6%, 10–11%, and 15–16% depending on destination. Table 3 shows the export revenue reduction under CBAM scenarios in USD millions.
Table 3.
Export revenue reduction under CBAM scenarios (USD millions). EV: export volume; ER: export revenue reduction.
The USA represents the largest single risk, accounting for approximately half of Brazilian steel exports by volume (USD 5.3 billion in value). A US-CBAM at USD 50/t would reduce revenues from this partner by USD 562 million. The EU-CBAM, already in implementation, represents a near-term risk of USD 54–163 million annually. The global scenario, representing an upper-bound long-term exposure, totals USD 570 million to USD 1.7 billion in export revenue reduction (1.5–4.6% of annual industry revenue).
3.1.3. Scenario 3 Macro-Level Results—Supply Chain Exposure
Applying the industry Scope 3 share of 68% (Equations (9) and (10)), supply chain emissions dominate the total financial exposure. Of the USD 1.6–4.9 billion in domestic carbon pricing costs, USD 1.1–3.3 billion are attributable to Scope 3 activity (3–9% of annual industry revenue). Under the CBAM scenario, supply chain exposure accounts for USD 388 million–1.16 billion (global), USD 191–573 million (USA), and USD 37–111 million (EU) across the three price levels.
These results reinforce the centrality of supply chain decarbonization in any credible strategy to manage carbon-related financial risk. Even without Scope 3 inclusion in current CBAM regulations, the sheer scale of upstream emissions means that companies that address supply chain emissions will have a substantial competitive advantage when regulatory coverage expands.
3.2. Micro-Level: Company Case Study
3.2.1. Scenario 1 Micro-Level Results —Domestic Carbon Pricing
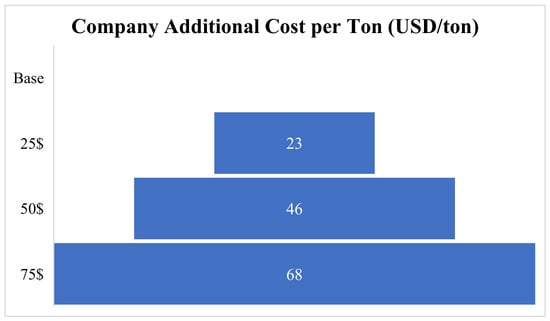
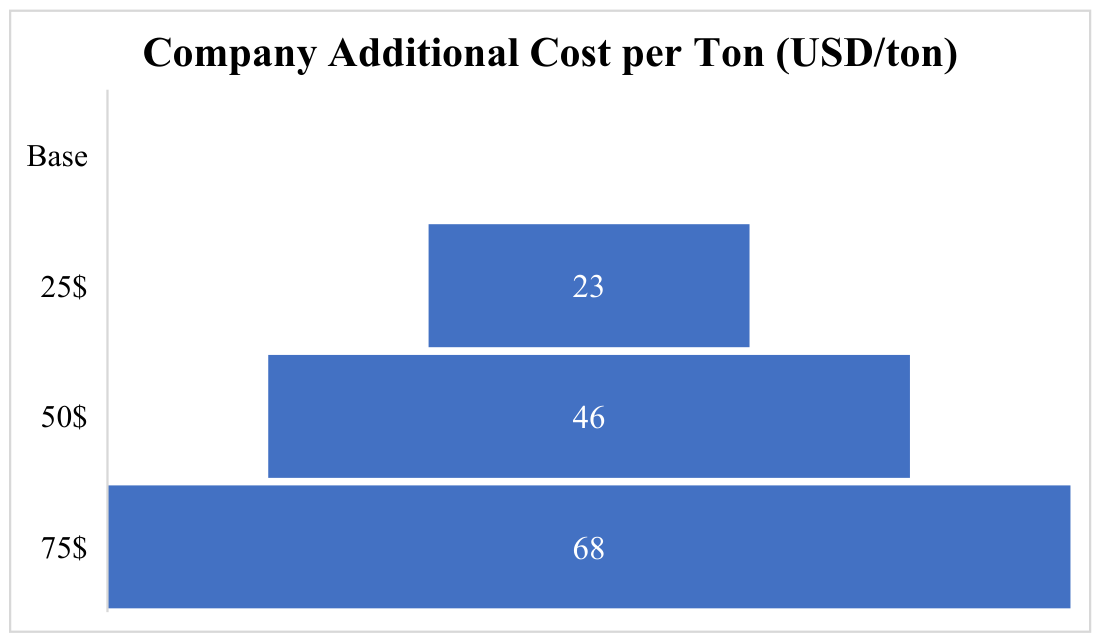
The company’s lower emission intensity (0.91 t CO2eq per ton, vs. 1.91 for the industry average) translates into a substantially smaller per-ton additional cost: USD 22.8, USD 45.5, and USD 68.3 at the three price levels. Total additional annual costs reach approximately USD 208 million, USD 416 million, and USD 624 million, respectively, equivalent to 2.1%, 4.1%, and 6.2% of the company’s annual revenue base of USD 10.12 billion (Figure 2). Figure 3 shows the export revenue reduction under CBAM scenarios by trading partner in USD million.
Figure 2.
Total annual industry profit margin (USD thousand) under domestic carbon pricing scenarios.
Figure 3.
Export revenue reduction under CBAM scenarios by trading partner (USD million). The line indicates the supply chain (Scope 3) share of Global CBAM exposure (68%).
Starting from a production cost of USD 728 per ton, costs increase to USD 751 (+3%), USD 774 (+6%), and USD 797 (+9%). The profit margin per ton (against a domestic selling price of USD 1170) falls from USD 442 to USD 419 (−5%), USD 396 (−10%), and USD 373 (−15%). Total company margin declines from approximately USD 4.0 billion to USD 3.8, USD 3.6, and USD 3.4 billion.
The company’s cleaner production profile confers a notable advantage: at USD 75/t, its production cost increase (+9%) is less than half the industry average (+21%), and its margin compression (−15%) is approximately half the sector-wide impact (−29%). This quantifies the financial value of earlier investments in low-carbon production technologies such as biomass and scrap-based steelmaking. Figure 4 shows the company total additional annual cost under domestic carbon pricing scenarios.
Figure 4.
Company total additional annual cost under domestic carbon pricing scenarios.
3.2.2. Scenario 2 Micro-Level Results —CBAM Exposure
The company exports approximately 2.19 million tons annually (100% modeled under a global CBAM, as destination-level data were not disclosed). Export revenue would decline from USD 1.99 billion to USD 1.94 billion (−USD 50 million), USD 1.89 billion (−USD 100 million), and USD 1.84 billion (−USD 150 million), at carbon prices of USD 25, 50, and 75 per ton, respectively.
3.2.3. Scenario 3 Micro-Level Results —Supply Chain Exposure
With Scope 3 at only 20% of total emissions (Table 4), the company’s supply chain contribution to carbon pricing exposure is substantially lower than the sector average. Of the USD 208–624 million in domestic carbon pricing costs, USD 41–125 million are supply chain-attributable. In the CBAM scenario, supply chain exposure amounts to USD 10–30 million globally. This primarily reflects the company’s vertically integrated operations, which internalize much of the upstream emission activity.
Table 4.
Company Scope emissions inventory.
4. Discussion
The results presented above offer several insights relevant to both corporate strategy and public policy in the context of carbon pricing and industrial decarbonization.
First, the magnitude of financial exposure is substantial and sector-wide. Even at the lowest carbon price modeled (USD 25/t), the Brazilian steel industry would face an additional USD 1.6 billion per year in domestic pricing costs. This is not a marginal adjustment: it represents a structural shift in cost competitiveness that requires proactive strategic responses, including technology investment, supply chain restructuring, and engagement with regulatory processes [36]. In aggregate, under the most adverse scenario modeled (USD 75/t with full CBAM cost absorption), the combined domestic and international carbon pricing exposure would reach approximately 18% of the industry’s annual revenue base.
Second, the supply chain dimension dominates. With 68% of industry emissions in Scope 3, most of the financial exposure to comprehensive carbon pricing mechanisms lies outside the direct operations of steel producers. This finding aligns with Hettler and Graf-Vlachy’s (2024) systematic review highlighting Scope 3 reporting as a critical enabler of supply chain decarbonization [37] and reinforces prior work in the steel sector context showing that ESG performance is significantly determined by supplier conduct [19]. Companies that fail to engage their supply chains in emissions reduction programs will find themselves increasingly exposed as regulatory coverage expands.
Third, the company-level case demonstrates the financial value of early decarbonization. The case company, by virtue of its cleaner production profile (0.91 vs. 1.91 t CO2eq/t), faces less than half the per-ton carbon cost of the industry average. This quantifies, in concrete financial terms, the competitive advantage of sustainability investment. As carbon pricing escalates, this gap is expected to widen, suggesting that firms with lower emission intensities will gain significant market advantages [11,38]. International evidence in carbon-intensive sectors reinforces that producers operating in jurisdictions with mature carbon pricing, such as EU steel companies under the EU-ETS, have increasingly translated lower emission intensity into pricing power and access to green markets, while higher-emission producers face progressive margin compression as allowance prices rise [31].
This dynamic is further illustrated by the emergence of zero-carbon steel producers such as Aço Verde do Brasil (AVB), the first carbon-neutral steel producer in the world, certified by SGS in 2021 [39]. At the disclosure frontier, Vale published in 2025 the first IFRS S2-aligned Sustainability-Related Financial Information Report in Brazil, explicitly quantifying the financial impact of carbon pricing on its revenues and demonstrating the growing integration of climate risk into corporate financial reporting [40]. Figure 5 shows the production cost increase (%) for the industry average (1.91 t CO2eq/t) vs. the case company (0.91 t CO2eq/t) across carbon price scenarios. The gap quantifies the financial value of lower emission intensity.
Figure 5.
Production cost increase (%) for the industry average (1.91 t CO2eq/t) vs. the case company (0.91 t CO2eq/t) across carbon price scenarios. The gap quantifies the financial value of lower emission intensity.
Fourth, the CBAM creates an asymmetric risk profile by destination market. The US CBAM scenario is the largest near-term risk in absolute terms (given Brazil’s high steel export dependency on the USA), while the EU-CBAM is the most imminent legally. Brazilian companies and policymakers need differentiated strategies for each market, rather than a one-size-fits-all approach. Brazil’s exposure is broadly comparable to that of other emerging steel producers such as India and Turkey, both of which have raised concerns at the WTO regarding CBAM’s compatibility with developing-country interests; the adaptation strategies developed in this context will therefore have implications well beyond Brazil [14,15].
From a policy standpoint, the results are consistent with the view that Brazil’s SBCE, while adding short-term costs, positions the sector to better absorb international CBAM pressures. A domestic carbon price of USD 25–50/t would generate revenues that could fund transition support while simultaneously demonstrating emissions governance to trading partners—potentially reducing the CBAM tariff burden for exporters. This is consistent with Van den Bergh et al.’s (2020) advocacy for a dual-track international carbon pricing framework [41].
This study has several limitations. The carbon price scenarios, while grounded in the literature and policy, are illustrative rather than forecasting-based. Demand effects of CBAM (i.e., how price changes affect export volumes) are not modeled, as this would require a separate econometric framework. As a result, the CBAM revenue impact reported here should be interpreted as an upper-bound estimate of price-side exposure, since demand elasticity would likely reduce export volumes sustained at modeled prices. The company case study is limited to one firm, selected based on data availability and its low-carbon production profile. As such, it should be considered a leading performer rather than a representative average, and generalizability of the micro-level findings should be assessed with caution. Additionally, the EU-Omnibus legislative package, launched in early 2025, may modify CBAM rules in ways not yet fully defined; this analysis follows the baseline scenario. Furthermore, the full cost absorption adopted in the CBAM scenarios represents the most adverse case; actual financial impacts may be lower depending on firms’ behavioral responses, including partial cost pass-through, adjustments in export strategy, or investment in decarbonization technologies that reduce the emission base itself rather than redistributing the cost. The CBAM cost is also applied to total embedded emissions rather than to emissions above the EU production benchmark, further reinforcing the upper-bound nature of the CBAM exposure estimates. Sensitivity analyses incorporating alternative cost-absorption rates, demand-side responses, and decarbonization-investment trajectories are identified as directions for future research.
5. Conclusions
This study quantifies the financial exposure of the Brazilian steel industry to carbon pricing under three complementary scenarios: domestic carbon taxation (SBCE), international CBAMs (EU, USA, global), and supply chain Scope 3 exposure. The following conclusions can be drawn.
Domestic carbon pricing in the USD 25–75/t range would increase steel production costs by 7–21%, generating USD 1.6–4.9 billion in additional annual costs for the Brazilian industry, equivalent to 4.3–13.3% of its annual revenue base. Combined with CBAM exposure under the most adverse scenario, total carbon-related financial exposure could approach 18% of industry revenue, representing a material risk to sector competitiveness. International CBAM exposure adds USD 54 million to USD 1.7 billion in export revenue reduction depending on destination and price level. In both cases, supply chain emissions (Scope 3) account for the majority of total exposure (68% at the industry level), underscoring the need for integrated supply chain decarbonization strategies.
The company case study confirms that early investment in low-carbon production yields a measurable competitive buffer: at USD 75/t, the case company faces less than half the production cost increase in the industry average. The supply chain share of its exposure is also substantially lower (20% vs. 68%), reflecting vertical integration and cleaner input sourcing.
For Brazilian steel companies, the policy implications are significant: carbon pricing is no longer a distant scenario but an immediate operational and financial risk. Companies that proactively invest in emissions reduction, especially across their supply chains, are likely to face lower regulatory costs and maintain stronger competitive positioning in key export markets.
Future research should extend this framework to other energy-intensive sectors, model demand effects of CBAM-induced price changes, and assess the investment required in mitigation technologies to offset carbon pricing costs across different reduction pathways. An integration of carbon pricing financial exposure with ESG scoring frameworks also offers a promising avenue for comprehensive sustainability–financial risk assessment.
Author Contributions
Conceptualization, A.S., L.S., S.H.Z.C. and M.S.; Methodology, A.S., L.S., S.H.Z.C. and M.S.; Formal Analysis, A.S.; Investigation, A.S.; Data Curation, A.S.; Writing—Original Draft Preparation, A.S.; Writing—Review and Editing, A.S. and G.T.F.; Visualization, A.S.; Supervision, L.S., S.H.Z.C. and M.S. All authors have read and agreed to the published version of the manuscript.
Funding
The authors would like to acknowledge the support of the Brazilian Research Agencies CNPq (Conselho Nacional de Desenvolvimento Científico e Tecnológico), CAPES (Coordenação de Aperfeiçoamento de Pessoal de Nível Superior), and FAPERJ (Fundação Carlos Chagas Filho de Amparo à Pesquisa do Estado do Rio de Janeiro).
Institutional Review Board Statement
Not applicable.
Informed Consent Statement
Not applicable.
Data Availability Statement
The macro-level data presented in this study are available in the sources cited. Company-level data are available on request from the corresponding author, subject to confidentiality restrictions.
Acknowledgments
The authors thank the participating steel company for providing proprietary data and the Instituto Aço Brasil for public access to industry statistics.
Conflicts of Interest
The authors declare no conflicts of interest.
Abbreviations
The following abbreviations are used in this manuscript:
| CBAM | Carbon Border Adjustment Mechanism |
| ETS | Emissions Trading System |
| GHG | Greenhouse Gas |
| GHG Protocol | Greenhouse Gas Protocol |
| GDP | Gross Domestic Product |
| IMF | International Monetary Fund |
| SBCE | Brazilian Greenhouse Gas Emissions Trading System (Sistema Brasileiro de Comércio de Emissões) |
| SC | Supply Chain |
| SDG | Sustainable Development Goal |
References
- IPCC. Climate Change 2022: Mitigation of Climate Change. In Contribution of Working Group III to the Sixth Assessment Report of the Intergovernmental Panel on Climate Change; Cambridge University Press: Cambridge, UK, 2022. [Google Scholar]
- World Economic Forum. Net-Zero Challenge: The Supply Chain Opportunity; World Economic Forum: Geneva, Switzerland, 2023. [Google Scholar]
- World Steel Association. 2023 World Steel in Figures; Worldsteel Association: Brussels, Belgium, 2023. [Google Scholar]
- World Bank. State and Trends of Carbon Pricing 2024; World Bank Group: Washington, DC, USA, 2024. [Google Scholar]
- Statista. Share of Annual Greenhouse Gas Emissions Covered by Carbon Pricing Instruments 2005–2024; Statista: Hamburg, Germany, 2024. [Google Scholar]
- Pantoja, S.; Valente, P. Carbon taxation: Impacts on the economic indicators of E&P projects. In Proceedings of the Rio Oil & Gas Expo and Conference, Rio de Janeiro, Brazil, 1–3 December 2020. [Google Scholar]
- UNFCCC. NDC Synthesis Report 2024; United Nations Framework Convention on Climate Change: Bonn, Germany, 2024. [Google Scholar]
- Ismagilova, O. Carbon pricing worldwide. St. Petersburg Univ. J. Econ. Stud. 2023, 39, 470–495. [Google Scholar] [CrossRef] [Scilit]
- Instituto Aço Brasil. Brazil Steel Databook, Anuário Estatístico 2023; Instituto Aço Brasil: São Paulo, Brazil, 2024. [Google Scholar]
- Mondino, I.; Oliveira Fernandes, S.; de Paula Souza, J.; Vasconcelos, P.; Costa, K. O desafio da regulamentação das fontes do mercado de carbono no Brasil. Rev. Multidiscip. Pey Këyo Científico 2023, 10, 2024. [Google Scholar]
- Driscoll, D. Do carbon prices limit economic growth? Socius 2020, 6, 1–10. [Google Scholar] [CrossRef] [Scilit]
- Fan, Y.; Yan, X.; Cui, L.; Zhang, L.; Wang, J. Carbon pricing, carbon equity, and the RCEP framework. China Econ. Rev. 2023, 80, 101989. [Google Scholar] [CrossRef] [Scilit]
- Jakob, M. Why carbon leakage matters and what can be done against it. One Earth 2021, 4, 609–614. [Google Scholar] [CrossRef] [Scilit]
- Grubb, M.; Jordan, N.; Hertwich, E.; Neuhoff, K.; Das, K.; Bandyopadhyay, K.; Asselt, H.; Sato, M.; Wang, R.; Pizer, W.; et al. Carbon leakage, consumption, and trade. Annu. Rev. Environ. Resour. 2022, 47, 263–291. [Google Scholar] [CrossRef] [Scilit]
- Perdana, S.; Vielle, M.; Oliveira, T.D. The EU carbon border adjustment mechanism: Implications on Brazilian energy intensive industries. Clim. Policy 2023, 23, 260–273. [Google Scholar] [CrossRef] [Scilit]
- Grand, M.; Schulz-Antipa, P.; Rozenberg, J. Potential exposure and vulnerability to broader climate-related trade regulations: An illustration for LAC countries. Environ. Dev. Sustain. 2024, 26, 6195–6220. [Google Scholar]
- International Monetary Fund (IMF). Fiscal Monitor: Climate and the IMF; IMF: Washington, DC, USA, 2024. [Google Scholar]
- Barata, P.; Mukherjee, M.; Silitonga, A.; Jones, D.; Jaspal, M.; Hanafi, A.; Pearen, H. Navigating Carbon Pricing: The G20 Experience and Global South Prospects; Observer Research Foundation and Environmental Defense Fund: Washington, DC, USA, 2024. [Google Scholar]
- Savi, A.; Santos, L.; Savi, M. Sustainability Evaluation: Assessing Supply Chain Impact on Company Performance. Sustainability 2025, 17, 1158. [Google Scholar] [CrossRef] [Scilit]
- Döbbeling-Hildebrandt, N.; Miersch, K.; Khanna, T.M.; Bachelet, M.; Bruns, S.B.; Callaghan, M.; Edenhofer, O.; Flachsland, C.; Forster, P.M.; Kalkuhl, M.; et al. Systematic review and meta-analysis of ex-post evaluations on the effectiveness of carbon pricing. Nat. Commun. 2024, 15, 4147. [Google Scholar] [CrossRef] [Scilit] [PubMed]
- Chai, S.; Sun, R.; Ke, Z.; Ding, Y.; Wei, W. Is Emissions Trading Scheme (ETS) an effective market-incentivized environmental regulation policy? Evidence from China’s eight ETS pilots. Int. J. Environ. Res. Public Health 2022, 19, 3401. [Google Scholar]
- Deschryver, P.; de Mariz, F. The Role of Transition Finance Instruments in Bridging the Climate Finance Gap. In Global Handbook of Impact Investing; Sarmento, E.M., Herm, R.P., Eds.; Wiley & Sons Ltd.: Hoboken, NJ, USA, 2020. [Google Scholar]
- Ng, V.; To, M.; de Mariz, F. Climate Transition Risk in the Real Estate Sector: Does Decarbonization-Driven Regulation Affect REIT Valuation? Preprints 2026. [Google Scholar] [CrossRef] [Scilit]
- The United Nations. EU Should Consider Trade Impacts of New Climate Change Mechanism; UN Trade and Development: Geneva, Switzerland, 2021. [Google Scholar]
- Albano, F.; Dalla Vecchia, F.; Dos Santos, V.; Zynich, S.; Kich, J.; Cimadon, P.; Rodrigues, R.; Pontin, D. Framework about the carbon market in Brazil. In Proceedings of the 17th Greenhouse Gas Control Technologies Conference (GHGT-17); Elsevier: Amsterdam, The Netherlands, 2024. [Google Scholar]
- Ministério da Fazenda. Roteiro de Implementação do Sistema Brasileiro de Comércio de Emissões de Gases de Efeito Estufa (SBCE); Ministério da Fazenda: Brasília, Brazil, 2024.
- Ministério da Fazenda. Proposta Preliminar de Cobertura Setorial do Mercado Regulado de Carbono; Ministério da Fazenda: Brasília, Brazil, 2026.
- The Greenhouse Gas Protocol. A Corporate Accounting and Reporting Standard; World Business Council for Sustainable Development/World Resources Institute: Geneva, Switzerland; Washington, DC, USA, 2004. [Google Scholar]
- Schmidt, M.; Nill, M.; Scholz, J. Determining the Scope 3 emissions of companies. Chem. Eng. Technol. 2022, 45, 1218–1230. [Google Scholar] [CrossRef] [Scilit]
- Barron, A.; Fawcett, A.; Hafstead, M.; McFarland, J.; Morris, A. Policy insights from the EMF 32 study on U.S. carbon tax scenarios. Clim. Change Econ. 2019, 9, 1850010. [Google Scholar]
- Fremstad, A.; Paul, M. The impact of a carbon tax on inequality. Ecol. Econ. 2019, 163, 88–97. [Google Scholar] [CrossRef] [Scilit]
- Patnaik, S.; Kennedy, K. Why the US Should Establish a Carbon Price Either Through Reconciliation or Other Legislation; Brookings Economic Studies Media: Washington, DC, USA, 2021. [Google Scholar]
- B3—Brasil, Bolsa, Balcão. Crédito de Descarbonização (CBIO)—Negócios Realizados; B3: São Paulo, Brazil, 2024. [Google Scholar]
- European Commission. Auctioning of Allowances—EU Emissions Trading System; European Commission, DG Climate Action: Brussels, Belgium, 2026. [Google Scholar]
- Gray, M.; Hasanbeigi, A.; Ben M’barek, B.; Lu, H.; Tao, J.; Levi, P.; Myllyvirta, L.; Swalec, C.; Zhang, Q.; Xiuping, L. Global Steel Production Costs: A Country and Plant-Level Cost Analysis; Transition Zero and Global Efficiency Intelligence: London, UK, 2022. [Google Scholar]
- Kannan, D.; Solanki, R.; Kaul, A.; Jha, P. Barrier analysis for carbon regulatory environmental policies implementation in manufacturing supply chains to achieve zero carbon. J. Clean. Prod. 2022, 358, 131910. [Google Scholar] [CrossRef] [Scilit]
- Hettler, M.; Graf-Vlachy, L. Corporate Scope 3 carbon emission reporting as an enabler of supply chain decarbonization: A systematic review and comprehensive research agenda. Bus. Strategy Environ. 2024, 33, 263–282. [Google Scholar]
- Casas, M.; Smit, S.; Nilsson, A.; Kuramochi, T. Climate targets by major steel companies: An assessment of collective ambition and planned emission reduction measures. Energy Clim. Change 2024, 5, 100120. [Google Scholar]
- Aço Verde do Brasil (AVB). Brazil’s AVB Receives Carbon-Neutral Steel Certificate; AVB: Açailândia, Brazil, 2021. [Google Scholar]
- Vale S.A. Sustainability-Related Financial Information Report; Vale S.A.: Rio de Janeiro, Brazil, 2025. [Google Scholar]
- Van den Bergh, J.; Angelsen, A.; Baranzini, A.; Botzan, W.; Carattini, S.; Drew, S.; Dunlop, T.; Galbraith, E.; Gsottbauer, E.; Howart, R.; et al. A dual-track transition to global carbon pricing. Clim. Policy 2020, 20, 1057–1069. [Google Scholar] [CrossRef] [Scilit]

Disclaimer/Publisher’s Note: The statements, opinions and data contained in all publications are solely those of the individual author(s) and contributor(s) and not of MDPI and/or the editor(s). MDPI and/or the editor(s) disclaim responsibility for any injury to people or property resulting from any ideas, methods, instructions or products referred to in the content. |
© 2026 by the authors. Licensee MDPI, Basel, Switzerland. This article is an open access article distributed under the terms and conditions of the Creative Commons Attribution (CC BY) license.