


Abstract
Government data governance has become an important institutional mechanism for reducing information frictions, improving data-resource allocation, and supporting firm innovation in the digital economy. However, whether government data governance can promote firms’ technological catch-up remains insufficiently understood. Based on the quasi-natural experiment of the establishment of Big Data Administrations, this study constructs a multi-period difference-in-differences model to examine the impact of government data governance on firms’ technological catch-up. Using panel data from Chinese A-share listed firms from 2011 to 2021, the DID estimates indicate that the establishment of Big Data Administrations significantly improves firms’ technological catch-up. This estimated effect remains robust across placebo tests, specifications controlling for differential trends associated with pre-treatment city characteristics, and double/debiased machine learning estimation. Mechanism analyses provide evidence consistent with three channels: technology stimulation, digital-ecosystem optimization, and competition strengthening. Heterogeneity analyses further show that the effect is evident among non-state-owned enterprises, firms with higher information asymmetry, and larger firms. Additional spatial analyses suggest that neighboring cities’ data governance capacity does not generate stable positive spillovers; instead, it may be associated with negative spatial externalities, potentially reflecting siphoning or competitive crowding-out pressures. These findings highlight government data governance as an institutional driver of firm technological progress and provide policy implications for improving digital governance capacity, optimizing digital ecosystems, and promoting high-quality development.
1. Introduction
In the digital economy, government-led data governance systems have become increasingly important for innovation, industrial upgrading, and sustainable development. By structuring firms’ access to strategically important data resources, such systems can shape data-intensive innovation [1], while stronger public digital governance capacity can further enhance firms’ digital innovation performance [2]. Moreover, integrated governance approaches to digital ecosystems can improve the institutional conditions under which digital markets operate and thereby support innovation [3]. These arguments suggest that public data governance is not merely an administrative arrangement but also an institutional mechanism through which governments can reduce information frictions, improve resource allocation, and support firms’ technological progress.
In China, data resources have been elevated to a strategic factor of production. The Third Plenary Session of the 20th CPC Central Committee called for accelerating the development of institutional arrangements for the digital economy, improving the policy framework for both digital industrialization and industrial digitalization, and fostering an integrated national market for technology and data. These policy initiatives provide important institutional support for firms to accelerate digital transformation, deepen the integration of the digital and real economies, promote technological progress, and contribute to sustainable development.
However, whether government data governance can promote firms’ technological catch-up remains an open empirical question.
This question is particularly important because many firms still face substantial barriers in the process of technological catch-up. On the one hand, firms still face the risks associated with reliance on foreign technology in key core technological domains [4]. On the other hand, many firms remain constrained by data silos and fragmented governance, which hinder the full realization of data value, reinforce technological path dependence, and ultimately impede technological catch-up [5], thereby generating an urgent demand for systematic data governance support. Against this backdrop, the establishment of local Big Data Administrations in China provides a useful institutional setting for examining the economic consequences of government-led data governance.
For example, Henan has integrated government data through its “Internet + Supervision” system, thereby significantly reducing firms’ information acquisition costs and improving the efficiency of technological decision-making. Meanwhile, the Shenzhen Big Data Administration has supported private firms in optimizing asset allocation through the targeted delivery of policy information. Taken together, these cases underscore the practical necessity of data governance agencies in helping firms overcome the challenges of technological catch-up. Nevertheless, systematic empirical evidence on this relationship remains limited.
Existing research on data governance provides an important foundation for understanding firms’ technological catch-up, yet the literature has mainly developed along three lines: firm governance, data factor markets, and public policy. First, at the firm level, studies commonly conceptualize data governance as a critical governance capability for improving information quality, optimizing process management, and strengthening the scientific basis of decision-making. In this view, data governance enhances firm performance by improving the efficiency of resource allocation, strengthening risk control, and increasing strategic execution, and may further stabilize the resource allocation process through mediating mechanisms such as greater investment resilience [6].
Second, at the institutional and market level, a growing body of research has examined data factor marketization and related governance arrangements, showing that institutional infrastructures such as data trading platforms can facilitate data circulation, reduce information asymmetry, promote digital transformation and green innovation, and ultimately improve corporate ESG performance while reducing pollution and carbon emissions [7]. These findings suggest that data governance has evolved from an internal managerial issue into an external institutional condition shaping corporate innovation and sustainable development.
Third, at the public policy level, studies on National Big Data Comprehensive Pilot Zones indicate that data-governance-related policies can strengthen firms’ capacity to absorb technological spillovers and further support low-carbon innovation, green transformation, and regional sustainable development by promoting digital transformation, easing financing constraints, advancing industrial upgrading, and improving energy efficiency and green total factor productivity [8,9]. Related studies further document their effects on low-carbon innovation and regional green transformation [10,11].
Overall, existing studies have revealed important economic, innovative, and environmental consequences of data governance. However, there remains a lack of targeted research on how government data governance affects firms’ technological catch-up through data integration, rule provision, cross-departmental coordination, and resource orchestration. In particular, compared with institutional arrangements such as data trading platforms and comprehensive pilot zones, data governance agencies simultaneously function as organizational carriers, governance instruments, and policy implementation actors, yet their distinctive role in breaking information barriers, alleviating path dependence, and reshaping the conditions for technological catch-up has not been sufficiently examined.
Moreover, the spatial consequences of government data governance remain underexplored. Data governance capacity is not necessarily confined to the administrative boundary of the city in which a policy is implemented. By improving public data coordination, digital infrastructure, and innovation-service provision, a city with stronger data governance capacity may affect neighboring cities through factor mobility, intercity competition, and regional innovation networks. On the one hand, government data governance may generate positive spillovers by facilitating data sharing, technological diffusion, and ecosystem collaboration across cities. On the other hand, it may also intensify competition for digital resources, data-related talent, platform firms, and innovation services, thereby producing siphoning effects or competitive crowding-out effects on surrounding cities. Therefore, examining whether government data governance generates positive spillovers or negative spatial externalities is essential for understanding its broader regional consequences.
A central concern in the fields of technological innovation and strategic management is how firms sustain leadership, surpass incumbent leaders, and narrow the gap with leading firms, particularly in the context of sustainable development [12]. Against this backdrop, the concept of “catch-up” has attracted extensive scholarly attention, referring to the process by which latecomer firms progressively reduce the gap with leading firms in terms of market share and technological capabilities [13]. In recent years, this process has increasingly been linked to firms’ ability to achieve not only economic upgrading but also environmentally and socially sustainable development. The literature on catch-up has long focused on whether, how, and under what conditions latecomers can eventually become leaders [14]. Existing studies suggest that latecomer catch-up is shaped by external factors such as institutional environments [15], industrial conditions [16], and market demand [17], which are also closely related to sustainability transitions. From the perspective of internal factors, the resource-based view emphasizes that technological accumulation and a strong knowledge base constitute the fundamental conditions for catch-up [13]. From a strategic management perspective, strategic architecture and collaborative networks [18] influence the acquisition, transfer, and deployment of production factors, playing a critical role in coordinating internal and external resources for sustainable upgrading. In addition, firms need to develop capabilities such as innovation and absorptive capacity [19,20] to effectively engage in the catch-up process while supporting long-term sustainability.
In this study, technological catch-up is conceptualized in a relative productivity-frontier sense. Specifically, it refers to the extent to which a firm narrows its productivity gap relative to the leading firm within the same industry-year. This definition is narrower than broader notions of catch-up based on innovation capability, digital transformation, product-quality upgrading, or knowledge acquisition. These factors are closely related to technological catch-up because they may help firms improve productivity and move closer to the industry frontier, but they are not treated as equivalent to technological catch-up itself. Accordingly, this study uses relative total factor productivity to measure technological catch-up, while innovation, digital transformation, product-quality improvement, and knowledge-related activities are examined as potential mechanisms.
Meanwhile, the rapid development and widespread diffusion of digital technologies—such as big data, cloud computing, blockchain, and artificial intelligence—have provided the technological architecture for firms’ digital transformation and constitute a fundamental basis for innovation and value creation [21]. Existing research has increasingly focused on the economic consequences of data governance, particularly its role in enhancing firm performance, innovation outcomes, and technological capabilities [22]. At the same time, public data governance has profoundly reshaped market demand and technological paradigms, thereby creating new windows of opportunity for latecomer firms to achieve technological catch-up and offering a novel theoretical perspective for understanding this process. However, research that explicitly examines latecomer catch-up within the context of data governance remains relatively scarce.
In summary, the existing literature provides a solid foundation for this study in terms of theoretical frameworks, empirical approaches, and underlying mechanisms. However, the micro-level relationship between government data governance and firms’ technological catch-up remains underexplored, with several notable gaps. First, few studies have examined the impact of Big Data Administrations on firms’ technological catch-up from a formal theoretical modeling perspective, leaving the direct relationship between the two insufficiently understood. Second, the intermediate transmission mechanisms through which such agencies influence technological catch-up have not been fully theorized. Third, there is a lack of systematic analysis of how firm characteristics—such as ownership type, internal information asymmetry, and firm size—interact with BDA establishment to generate heterogeneous effects on technological catch-up.
More broadly, recent work in sustainability-oriented policy evaluation suggests that aggregate indicators may obscure the structural distribution of policy-relevant outcomes across actors. For example, Zheng et al. [23] show that incorporating non-CO2 greenhouse gases into global photovoltaic trade accounting changes the attribution of climate responsibility across countries and supply-chain stages. This insight is relevant to the present study because evaluating government data governance also requires moving beyond the average policy effect to examine the mechanisms, firm-level conditions, and regional externalities through which its consequences unfold.
To address these gaps, this study develops a new theoretical framework and employs panel data on Chinese A-share listed firms from 2011 to 2021 to examine the effectiveness of Big Data Administrations in facilitating firms’ technological catch-up. Compared with the existing literature, this study makes four main contributions. First, from the perspective of theoretical modeling, this study develops a formal framework to clarify how Big Data Administrations may shape firms’ technological catch-up, thereby extending the strategic perspective on firm development and providing a theoretical basis for future research. Second, this study develops a technology-stimulation, digital-ecosystem optimization, and competition-strengthening framework to explain the channels through which BDAs may facilitate firms’ technological catch-up. Third, this study conducts heterogeneity analyses along three dimensions—firm ownership, internal information asymmetry, and firm size—thereby offering a more nuanced understanding of the conditions under which the association between Big Data Administrations and technological catch-up is more pronounced. Fourth, this study extends the analysis from local policy effects to cross-city spatial externalities. By constructing spatially weighted policy exposure variables and gravity-weighted distance-band exposure variables, we examine whether government data governance generates positive spillovers or negative externalities across cities. This allows us to examine not only the local estimated effect of Big Data Administration establishment, but also its broader spatial consequences for the regional allocation of digital resources and innovation factors.
Overall, the findings shed light on the mechanisms through which Big Data Administrations may support firms’ upgrading and provide empirical support for high-quality and sustainable development.
2. Policy Background and Research Hypotheses
2.1. Policy Background
Since the 18th National Congress of the Communist Party of China, the digital economy has been elevated to a national strategic priority and has gradually become a central arena of global technological competition. By improving the allocation efficiency of production factors, the digital economy generates multiplier effects that stimulate industrial upgrading and enhance the innovative vitality of market entities. As emphasized in the White Paper on China’s Digital Economy Development, data have become a strategic foundational resource in the digital economy era. The intensive development and value extraction of large-scale data assets are continuously giving rise to new economic forms and transforming existing business models.
Meanwhile, the rapid expansion of the digital economy has placed higher demands on governmental digital governance capacity. Public-sector digital transformation requires governments to redesign organizational processes, improve service delivery, and strengthen the coordination of data resources across administrative boundaries [24,25]. In this context, interorganizational information integration becomes a key enabler of digital government [26]. However, when data are collected from heterogeneous sources and processed by separate organizational entities, data quality, interoperability, and contextualization become critical constraints on decision-making quality [27]. Fragmented administrative jurisdictions and insufficient cross-departmental coordination may therefore generate data silos, weakening the data foundation required for intelligent and evidence-based decision-making [28]. In response, local governments in China have gradually established Big Data Administrations and related data management agencies to promote integrated data governance, break down departmental data barriers, overcome fragmented administrative arrangements, and strengthen digital government construction. These agencies are expected to facilitate the joint sharing and coordinated utilization of public data, activate the development of the data economy, and accelerate the construction of an intelligent society.
By 2021, 26 provincial-level administrative regions in China, including Guangdong, Zhejiang, Guizhou, and Chongqing, as well as several prefecture-level cities such as Zhengzhou, Huangshi, and Xiaogan, had established data management agencies. These agencies have played an increasingly important role in enterprise technological empowerment, digital ecosystem optimization, and data-driven intelligent governance. For instance, the Guizhou Big Data Development Administration has promoted enterprise digital transformation through initiatives such as the “Thousand Enterprises Transformation” and “Ten Thousand Enterprises Integration” programs, thereby improving production efficiency and product quality. At the same time, Guizhou has sought to build a big data industrial ecosystem, attract firms to settle locally, and promote industrial agglomeration. In addition, the application of big data in government services and urban governance has been advanced through platforms such as “Cloud Guizhou,” which integrates, shares, and opens government data, thereby improving governmental governance capacity and public service efficiency.
Similarly, the Zhejiang Data Management Center has actively promoted the “No. 1 Project” for the digital economy, supported enterprise digital transformation, and fostered digital industrial clusters and leading digital firms. By building public data platforms, improving the digital ecosystem, breaking information silos, and promoting data sharing and business collaboration, Zhejiang has provided institutional support for the coordinated development of digital governance and enterprise innovation. In addition, the application of big data in smart cities and intelligent transportation, as reflected in Hangzhou’s “City Brain” project, has improved urban operational efficiency and residents’ quality of life.
Taken together, these institutional practices suggest that Big Data Administrations may provide a data-driven channel through which firms move from technological stimulation to ecosystem optimization and competitive adaptation. The establishment of Big Data Administrations therefore provides a quasi-natural experimental setting for examining whether strengthened government data governance promotes firms’ technological catch-up.
2.2. Theoretical Analysis and Hypothesis Development
Following Zhao and Chu [29], this section develops a mechanism-oriented framework to examine how government data governance affects firms’ technological catch-up. The framework organizes the catch-up process around several key frictions faced by firms: product-quality expectations, catch-up returns, cost burden, uncertainty, and market competition. The consumer-side setting links technological catch-up to expected product quality and market demand, while the producer-side setting captures firms’ catch-up returns under cost and uncertainty constraints. Building on these settings, the comparative-static analysis with respect to government data governance provides the basis for the three channels examined below: technology stimulation, digital-ecosystem optimization, and competition strengthening.
2.2.1. Consumer Sector
For simplicity, the total mass of consumers in the market is normalized to unity. The indirect utility associated with product consumption is specified as follows:
Here, α and δ measure consumers’ sensitivity to product quality and price, respectively, with and . denotes utility, denotes the product’s market price, and denotes normalized product quality. The exogenous shock term ε follows a Type I extreme value distribution, a standard specification in discrete-choice settings, and captures unobservable heterogeneity.
To characterize how technological progress reshapes market demand, this study introduces the technology-level parameter . When a firm achieves technological catch-up, product quality improves accordingly, thereby increasing the marginal utility consumers derive from the product. In the initial state, consumers’ perceptions of product quality are modeled as a normal distribution to capture uncertainty in product-quality evaluation, . After technological progress, the mean perceived quality rises to , where and . Here, denotes the baseline perceived quality of the technologically upgraded product, and is an adjustment term that captures consumers’ adaptation to the new technology.
According to Bayes’ rule, consumers’ expected product quality is given by:
As shown in Equation (2), when the firm’s technological capability parameter, , improves discretely, the quality of high-technology products rises accordingly. This induces a rightward shift in the market demand curve and increases the demand for the product. Within a discrete choice framework, the probability that a consumer purchases a high-technology product can be expressed as follows:
Here, the set of products in the market is denoted by , which includes two categories: high-technology products and conventional products. For any product , let denote its price and denote its quality level.
2.2.2. Producer Sector
In the specialized product market, firms differ in technology intensity and are divided into two categories: high-technology firms and traditional production firms. A threshold is assumed to separate these two categories. Once a traditional firm’s technological catch-up surpasses this threshold, it can evolve into a high-technology innovative firm. To maximize profits, the firm must satisfy the following condition:
Here, denotes the firm’s baseline profit, i.e., the level of return when technological catch-up has not been achieved. The profit level after technological catch-up is denoted by , which is assumed to be constant in order to reflect the stability of catch-up gains. denotes the utility allocation coefficient, capturing the weight of the marginal utility gain from technological catch-up in the firm’s overall utility function, where . In the digital context, differences in the digital ecosystem may generate heterogeneity in firms’ technological R&D capabilities, which in turn leads to variation in the returns to technological catch-up. Let denote the firm’s utility function.
Here, denotes the firm’s degree of risk preference. In a more favorable digital ecosystem, data empowerment and higher levels of informatization enable traditional firms to access the advanced knowledge and technologies of high-technology firms more easily, thereby increasing the probability of successful technological catch-up and lowering risk aversion. Under the risk of cost fluctuations, the return stream generated by firms’ technological upgrading is stochastic. To simplify the decision framework, a benchmark case is considered: if the firm maintains the status quo, it receives a certain rate of return equal to ; if it undertakes technological catch-up, the expected return exceeds this benchmark level.
Assume that the firm’s production function is linear, with denoting the amount of factor input required per unit of output. Let represent production efficiency after technological upgrading and initial production efficiency. Technological catch-up is assumed to involve two types of costs: a fixed cost, , and a variable production cost incurred after the catch-up process.
Assume that the firm’s unit factor aggregation price, , follows a normal distribution, , where . As the level of digital development, , increases, conventional firms revise their expectations of . This reflects the improvement of the external digital economy environment, under which knowledge spillovers from technological innovation become more pronounced, inter-firm knowledge flows increase, and advanced technologies diffuse through spillover effects. After acquiring innovative knowledge from high-technology firms, the pricing mechanism in the factor market is restructured, and the price level is updated to , where .
By Bayes’ rule, the posterior mean and variance of the factor price after the firm achieves technological catch-up can be derived as and , respectively:
With the advancement of digitalization and BDA establishment, the flow of inter-firm talent and the formation of knowledge networks are promoted. Under an open innovation paradigm, knowledge spillovers from high-technology firms become significantly stronger, accelerating the diffusion of technological innovation within the industrial ecosystem. This reduces the uncertainty and risk faced by conventional firms in pursuing technological catch-up, increases their willingness to engage in catch-up activities, and gradually reshapes their perceptions of technological catch-up.
Assuming that the firm adopts a technological catch-up strategy, the optimization problem aimed at profit maximization can be specified as follows:
A systematic analysis of Equations (1)–(7) under multiple constraints yields the equilibrium price in the production and sales stage after the firm adopts a technological catch-up strategy, as follows:
By substituting Equation (9) into Equation (8), the firm’s optimal profit after technological catch-up can be obtained as follows:
where .
Firms Undertake Technological Catch-Up
When the threshold condition in Equation (11) holds, the firm undertakes technological catch-up; otherwise, it remains on its current technological path. Here, denotes the firm’s resource endowment.
Substituting the firm’s profit function into Equation (5) gives:
As shown in Equation (12), higher production efficiency, , directly increases the firm’s expected utility after technological upgrading. Meanwhile, a lower posterior expected unit factor cost, , raises the net return from technological upgrading and increases the likelihood that firms will undertake technological catch-up. By contrast, a higher posterior expected cost reduces the net return from technological upgrading, while greater posterior uncertainty, , increases the risk associated with catch-up decisions. Therefore, both and weaken firms’ incentives to undertake technological catch-up. This provides the theoretical basis for the subsequent digital-ecosystem optimization mechanism, through which BDA establishment may promote technological catch-up by reducing firms’ expected cost burden and uncertainty.
Based on the above analysis, this study proposes the following hypothesis:
H1.
BDA establishment promotes firms’ technological catch-up.
2.2.3. The Impact of the External Digital Economy Environment
Building on the above consumer-side and producer-side settings, government data governance, , affects firms’ expected utility from technological catch-up through changes in product quality, cost burden, uncertainty, and competition. To identify these channels, we take the partial derivative of Equation (12) with respect to :
where the first term captures the technology-stimulation effect, the middle terms reflect the digital-ecosystem optimization effect, and the last term represents the competition effect. This decomposition links the theoretical framework to the mechanism discussion: the first term corresponds to the technology-stimulation effect, the two middle terms correspond to the digital-ecosystem optimization effect, and the last term corresponds to the competition-strengthening effect.
Technology-stimulation effect. This effect refers to the role of government data governance in facilitating firms’ access to data factors and digital knowledge, thereby expanding the scope of digital R&D and promoting technological catch-up. Public data resources can provide important inputs for data-intensive innovation and shape firms’ innovation activities in data-dependent technological domains [1]. Digital technologies further enable distributed innovation and support the recombination of digital resources and knowledge within firms’ innovation processes [30], thereby facilitating firms’ technological catch-up.
As can be seen from the decomposition in Equation (13), This indicates that, with BDA establishment and the improvement of the external digital economy environment, , firms’ ability to acquire data assets and transform knowledge is effectively strengthened. This enables firms to strengthen access to data resources and digital knowledge, identify technological opportunities more effectively, and convert such knowledge into technological outputs, thereby increasing the technology-level parameter, τ. In other words, BDA establishment facilitates firms’ technological progress by improving their capacity to access data resources, absorb digital knowledge, and convert such knowledge into technological outputs. Through the intelligent transformation of production processes and the establishment of digital quality management systems, firms not only reduce product defect rates systematically, but also promote overall quality improvement toward higher standards, thereby increasing product quality, . Therefore, government data governance exerts a positive technology-stimulation effect on firms’ technological catch-up. Based on this, we propose the following hypothesis:
H2.
BDA establishment promotes firms’ technological catch-up through the technology-stimulation effect.
Digital-ecosystem optimization effect. Government data governance systematically improves the digital ecosystem through the linked mechanism of “institutional restructuring–ecosystem reconfiguration.” At the level of institutional restructuring, government data governance promotes regulatory innovation, establishes new institutional arrangements for data ownership, circulation, and security, and improves the rules of digital ecosystem governance, thereby forming a collaborative governance pattern characterized by an effective market and a capable government. At the level of ecosystem reconfiguration, government data governance promotes scenario openness, data sharing, and the cultivation of digital ecosystem communities, thereby strengthening the integration of industrial chains, innovation chains, and talent chains. This process improves resource allocation, facilitates knowledge exchange, and enhances ecosystem value.
More importantly, ecosystem optimization may also reduce firms’ cost burden and uncertainty. From a transaction-cost perspective, digital platforms and ecosystems can reshape interfirm interactions and reduce coordination frictions in the process of digital servitization [31]. In the context of public data governance, open government data can improve firms’ external business environment and reduce institutional transaction costs, thereby improving operational efficiency [32]. At the same time, coordination arrangements in ecosystems can affect firm-level uncertainty because ecosystem participants face uncertainties arising from interdependence and coordination challenges [33]. Therefore, government data governance can reduce firms’ effective operating cost burden, and uncertainty, through data sharing, technological spillovers, knowledge exchange, and inter-firm cooperation. The decomposition in Equation (13) can thus be expressed as,
Therefore, government data governance generates a positive digital-ecosystem optimization effect in firms’ pursuit of technological catch-up.
Based on this, we propose the following hypothesis:
H3.
BDA establishment promotes firms’ technological catch-up through the digital-ecosystem optimization effect.
Competition-strengthening effect. As government data governance improves data circulation and market transparency, it lowers firms’ search, transmission, and verification costs, making competitive information more accessible and comparable [34]. Greater data circulation may facilitate technological knowledge diffusion, but it can also sharpen product-market rivalry as firms become better able to observe competitors and respond to market opportunities. Thus, innovation-related interactions may generate not only knowledge spillovers but also stronger competitive pressure [35]. This process may reduce supply-side differentiation. In this setting, can be understood as reflecting the degree of market differentiation or competitive insulation faced by firms, where a lower indicates stronger competitive pressure. With the improvement of government data governance, , data flows and technology diffusion reduce differentiation among competing firms; hence, . From Equation (13), we have , indicating that a higher degree of market differentiation weakens firms’ expected utility from technological catch-up by reducing competitive pressure. Therefore, by the chain rule,
It follows that the competition-strengthening effect induced by government data governance has a positive effect on firms’ technological catch-up. Based on this, we propose the following hypothesis:
H4.
BDA establishment promotes firms’ technological catch-up through the competition-strengthening effect.
Taken together, the above analysis suggests that BDA establishment may promote firms’ technological catch-up, and that the technology-stimulation effect, the digital-ecosystem optimization effect, and the competition-strengthening effect may constitute the main channels through which this relationship operates.
The preceding model formalizes the channels through which BDA establishment may influence firms’ technological catch-up. Rather than imposing a structural estimation of all model primitives, the framework organizes the theoretical logic linking government data governance to technology stimulation, digital-ecosystem optimization, and competition strengthening. Since several constructs in the model are latent in firm-level data, the subsequent empirical analysis examines the framework’s reduced-form implications using observable proxies for technological progress, digital innovation, cost burden, uncertainty, collaborative innovation, and market competition.
The detailed theoretical framework of this study is illustrated in Figure 1.
Figure 1.
Theoretical framework.
3. Research Design
3.1. Model Specification
To examine the impact of BDA establishment on firms’ technological catch-up, this study treats the establishment of such agencies at the city level as a quasi-natural experiment and employs a multi-period difference-in-differences (DID) model specified as follows:
where subscripts and denote firm and year, respectively. is the dependent variable measuring firms’ technological catch-up. indicates whether a Big Data Administration has been established in the city where firm is located in year . is a vector of control variables. In addition, industry fixed effects and year fixed effects are included, and denotes the random disturbance term. The coefficient of interest is , which captures the effect of BDA establishment on firms’ technological catch-up. A significantly positive indicates that BDA establishment promotes firms’ technological catch-up.
At the same time, to test the parallel-trend assumption underlying the multi-period DID model and examine the dynamic response of firms’ technological catch-up, this study follows the conventional event-study DID framework and constructs a dynamic specification by including a series of relative-time indicators around the year of BDA establishment. The coefficients on the pre-treatment indicators are used to assess whether treated and control firms exhibit differential trends before the policy shock, whereas the post-treatment coefficients capture the dynamic response of firms’ technological catch-up after BDA establishment.
where denotes a set of relative-time indicators constructed around the year of BDA establishment. The coefficient captures the difference in firms’ technological catch-up between firms in treated and control cities in each relative period before and after BDA establishment. The year immediately before establishment is omitted as the reference period. If the pre-treatment coefficients are statistically indistinguishable from zero, the parallel-trend assumption is supported. The post-treatment coefficients describe the dynamic evolution of the policy effect. However, because BDA establishment occurred at different times across cities, the conventional event-study DID specification may still be sensitive to heterogeneous treatment effects across treatment cohorts. Therefore, a stacked DID analysis is further conducted in Section 4.6 to provide additional evidence on whether the baseline results are robust to the staggered timing of BDA establishment.
Finally, to examine whether BDA establishment generates cross-city spatial externalities and to avoid relying on a single spatial weight matrix, we follow Delgado and Florax [36] and construct spatially weighted policy exposure variables based on the baseline DID framework. Specifically, let denote the geographic distance between city and city . This study first uses the inverse-distance weight to capture the strength of spatial linkage across cities:
where is the row-normalized spatial weight, measuring the spatial influence of city on city . Following Stakhovych and Bijmolt [37], this study further uses alternative spatial weight matrices to examine whether the estimated spatial exposure effect is sensitive to different assumptions about cross-city connectivity. Based on this weight, the spatially weighted policy exposure variable is constructed as follows:
where indicates whether city has established a Big Data Administration in year . A larger value of implies that city is more strongly exposed to BDA establishment in surrounding cities in year . Accordingly, the spatial policy exposure model is specified as follows:
where denotes the technological catch-up level of firm located in city in year ; is the local BDA establishment variable; is a vector of control variables; and and denote industry fixed effects and year fixed effects, respectively. represents the spatially weighted neighboring policy exposure variable under different spatial weight specifications, where . These specifications correspond to the full inverse-distance matrix, the inverse-distance matrix within 300 km, the inverse-distance matrix within 200 km, and the inverse-distance matrix based on the five nearest cities, respectively. The coefficient captures the spatial externality of neighboring BDA establishment on local firms’ technological catch-up. If is significantly positive, it indicates the presence of positive spatial spillovers. If is significantly negative, it suggests that neighboring BDA establishment may generate siphoning effects or competitive crowding-out effects.
Details on the construction of spatial weight matrices and gravity-weighted distance-band exposure variables are provided in Appendix A.
3.2. Variable Definitions
3.2.1. Dependent Variables
Technological catch-up (). Following Aghion et al. [38], this study constructs an indicator of firms’ technological proximity from the perspective of technological progress, which is expressed as follows: . Here, represents the degree of technological catch-up of firm in year ; denotes the firm’s total factor productivity in that year; and represents the total factor productivity frontier of industry , to which the firm belongs, in year . A larger value of indicates a smaller gap between the firm and the industry technological frontier, and thus a more significant technological catch-up effect. Since TC is normalized by the maximum TFP within each industry-year cell, its upper bound is mechanically equal to 1. Thus, TC = 1 indicates that a firm is located at the sample-based relative frontier within its own industry and year, rather than at an absolute technological frontier. This measure captures technological catch-up in a relative productivity sense rather than directly measuring innovation capability, digital transformation, product quality, or knowledge acquisition. These related factors are treated as possible channels through which firms improve productivity and approach the industry-year frontier. Total factor productivity is measured using the LP method, while the OP method and the GMM method are used in subsequent robustness checks.
3.2.2. Policy Variable
This study treats the establishment of Big Data Administrations as a quasi-natural experiment. The core explanatory variable is constructed as the interaction of two dummy variables () to capture the policy treatment effect. Specifically, is a dummy variable for the treatment group: cities that established Big Data Administrations are assigned a value of 1, and those that did not are assigned a value of 0. is a dummy variable for the post-treatment period: it takes the value of 1 in the year of establishment and thereafter, and 0 otherwise.
3.2.3. Control Variables
The control variables include both firm-level and regional-level variables. Firm-level control variables are divided into general firm characteristics and governance characteristics. The former include firm age (), measured as the logarithm of the number of years since the firm’s establishment plus one; Return on Assets (), measured as net profit divided by total assets; leverage (), measured as total liabilities divided by total assets; firm growth (), measured by the annual growth rate of operating revenue; and liquidity ratio (), measured as the ratio of current assets to current liabilities. Firm governance characteristics include board size (), measured as the logarithm of the number of board members; Board Independence (), measured as the ratio of independent directors to board size; ownership concentration (), measured as the shareholding ratio of the largest shareholder; and CEO duality (), measured by a dummy variable indicating whether the chairperson and the general manager are the same person. Regional-level control variables include GDP per Capita (), measured as the logarithm of GDP per capita, and government expenditure (), measured as the logarithm of local general public budget expenditure. The definitions and measurements of all variables are summarized in Table 1.
Table 1.
Variable definitions and measurements.
3.3. Sample Selection and Data Sources
Subject to data availability, this study uses a sample of Chinese A-share listed firms from 2011 to 2021. Firm-level data are mainly drawn from the CSMAR and WIND databases, and regional-level data are primarily collected from local statistical yearbooks. To improve the precision of parameter estimation, the sample is screened according to the following criteria: ST, PT, and financial firms are excluded; observations with substantial missing data are excluded; and, to mitigate the influence of outliers on the regression results, extreme values of the variables are adjusted or removed through two-sided winsorization at the 1% level. The final sample contains 14,043 observations. Descriptive statistics for the main variables are reported in Table 2.
Table 2.
Descriptive statistics.
4. Empirical Analysis
4.1. Baseline Regression Results
We first regress firms’ technological catch-up () on the establishment of Big Data Administrations (). Column (1) of Table 3 reports the baseline results without control variables and shows that the establishment of Big Data Administrations significantly promotes firms’ technological catch-up at the 1% level. Columns (2) and (3) further add firm-level and regional-level control variables, respectively, and the results remain significantly positive, indicating that government data governance has a positive effect on firms’ technological catch-up.
Table 3.
Baseline estimates of BDA establishment on firms’ technological catch-up.
A possible explanation is twofold. First, by promoting the disclosure of government information and the interconnection and sharing of government data, Big Data Administrations improve the business environment and reduce firms’ difficulty in accessing key government services and technological resources. In addition, by using frontier digital technologies such as big data and artificial intelligence to analyze enterprise data, they help firms better identify market demand and consumer behavior, thereby stimulating technological innovation. Second, BDA establishment contributes to digital ecosystem building. Through platform construction and data-sharing mechanisms, it reduces data barriers in traditional governance, promotes information interconnection among government, firms, and the public, improves government service efficiency, and encourages the innovation and application of digital technologies. It may also facilitate improvements in relevant laws and regulations, thereby creating a fairer, more efficient, and more sustainable digital environment for firms’ technological catch-up. These mechanisms are examined further below.
In terms of economic magnitude, the estimated coefficients range from 0.0066 to 0.0094 across the three baseline specifications. Given the sample mean of TC of 0.7934, these estimates correspond to approximately 0.83% to 1.18% of the sample mean. Given that TC is measured relative to the industry-year productivity frontier, the estimated magnitude represents a modest but meaningful narrowing of the productivity gap. This scale is consistent with the nature of BDA establishment as a governance-oriented institutional intervention rather than a direct subsidy or technology-specific industrial policy. Its practical relevance lies in improving the conditions under which firms obtain public data resources, access policy information, coordinate with digital services, and convert data-related inputs into upgrading outcomes. Viewed in this way, the estimate captures an incremental but systematic contribution of public data governance to firms’ movement toward the productivity frontier over time.
4.2. Parallel-Trend Test
The baseline results suggest that BDA establishment improves firms’ technological catch-up under the DID specification. However, the validity of the DID estimator relies on the parallel-trend assumption, which requires that, absent the policy shock, the treatment and control groups would have followed similar trends in technological catch-up. If this assumption does not hold, the DID estimates may be biased. To test this assumption, this study uses the dynamic DID specification in Equation (15), taking one year prior to the establishment of the Big Data Administration as the reference period. The time indicators −5, −4, −3, −2, and −1 denote five to one years before policy implementation, respectively, while 0, 1, 2, 3, 4, and 5 denote the year of implementation and one to five years thereafter, respectively. As shown in Figure 2, before BDA establishment, most coefficients are statistically insignificant or significantly negative, indicating no systematic pre-trend in firms’ technological catch-up. After policy implementation, the coefficients become significantly positive, suggesting a positive post-treatment response in firms’ technological catch-up. Overall, these results provide support for the parallel-trend assumption and strengthen the credibility of the baseline estimates.
Figure 2.
Parallel trend test.
4.3. Placebo Test
Although the baseline results show that BDA establishment promotes firms’ technological catch-up, the DID estimates may still be affected by other confounding factors. To address this concern, this study conducts a placebo test. Specifically, based on the distributional characteristics of BDA establishment in the baseline model, 1000 random sampling simulations are performed to construct “pseudo-policy dummy variables.” These simulated variables are then introduced into Equation (15), and the distribution of the estimated coefficients and the corresponding -value statistics are examined systematically. As shown in Figure 3, the estimated coefficients on the “pseudo-policy dummy variables” are all close to zero and substantially smaller than the actual estimated coefficient of BDA establishment. In addition, the distribution of the estimated coefficients is approximately normal, and most -values exceed 0.10, indicating that the effect of the “pseudo-policy dummy variables” is statistically insignificant. These findings suggest that the estimated coefficients are not driven by other random factors. Rather, the placebo results provide additional evidence that the baseline estimate is unlikely to be driven by randomly generated pseudo-policy shocks. The placebo test therefore provides further support for the robustness of the baseline results.
Figure 3.
Results of placebo test. The red dots and smooth curve represent the distribution of placebo estimates, and the dashed vertical line indicates the baseline DID estimate.
4.4. Spatial Externalities and Boundary Effects
When geographically assigned policies generate spillovers across administrative boundaries, ignoring neighboring treatment exposure may bias the estimated local treatment effect. To examine whether the policy effect of BDA establishment is affected by neighboring cities’ policy exposure, this study further incorporates spatially weighted policy exposure variables into the baseline model. Specifically, three bounded and localized spatial weight matrices are used: a 300 km distance threshold, a 200 km distance threshold, and the five-nearest-city matrix. Table 4 reports the corresponding results. The coefficient of DID remains positive and statistically significant after including different spatially weighted policy exposure variables. Specifically, after controlling for exposure within 300 km, exposure within 200 km, and exposure from the five nearest cities, the estimated coefficients of DID remain approximately between 0.0075 and 0.0083. This indicates that, even after accounting for the spatial influence of BDA establishment in neighboring cities, local BDA establishment continues to promote firms’ technological catch-up. These results suggest that the positive baseline estimate is unlikely to be explained solely by policy diffusion from neighboring cities and is more consistent with the interpretation that local data governance capacity plays an important role.
Table 4.
Spatially Weighted Exposure to Neighboring BDA Establishment.
Spatial policy exposure may theoretically operate in two different directions. Innovation-related activities often exhibit geographic proximity effects, because knowledge spillovers tend to be spatially localized, as shown by Jaffe et al. [39]. However, when cities compete for mobile digital resources and innovation services, stronger data governance capacity in one city may also crowd out surrounding cities rather than generate pure positive spillovers.
Regarding the spatial policy exposure variables, the coefficients of WDID_300, WDID_200, and WDID_5 are all significantly negative. This suggests that BDA establishment in neighboring cities does not generate stable positive spillovers for local firms’ technological catch-up; instead, it is associated with unfavorable neighboring policy exposure. One possible interpretation is that strengthened data governance may alter the spatial allocation of digital and innovation resources. By improving public data coordination, digital public services, platform support, and firm-oriented innovation services, a city with an established BDA may become more attractive to data-related talent, digital service providers, platform firms, and innovation resources. When these resources are mobile but regionally scarce, improvements in one city’s governance capacity may strengthen its relative position in regional competition and place competitive pressure on surrounding cities. In this sense, the negative neighboring exposure estimates may reflect siphoning or competitive crowding-out pressures, a possibility that is consistent with the view that innovation-related interactions can involve both technology spillovers and product-market rivalry [35].
At the same time, the estimates are also consistent with a broader regional adjustment process rather than a single crowding-out channel. BDA establishment may coincide with connected investments in digital infrastructure, smart-city projects, public data platforms, or digital industrial parks, so neighboring exposure may partly capture a wider package of digital-development policies. In addition, adopting cities may already occupy stronger positions in the regional economic hierarchy, with greater fiscal capacity, industrial foundations, and digital-resource absorption capacity. The negative coefficients may therefore reflect uneven regional development or core–periphery differences in the ability to attract and use digital resources. Regional policy clustering may further reinforce this pattern when neighboring cities implement related digital-governance, industrial-upgrading, or innovation-support policies under a common development agenda. Taken together, the spatial results can be interpreted as unfavorable neighboring policy exposure that may arise from the interaction of competitive resource reallocation, infrastructure co-investment, regional development gradients, and clustered policy implementation.
Further comparison across the bounded spatial weight matrices shows that the signs of the spatially weighted policy exposure variables remain negative under the 300 km threshold, the 200 km threshold, and the five-nearest-city matrix. Taken together, the bounded spatial matrices provide more conservative evidence that neighboring BDA establishment is associated with negative spatial externalities rather than stable positive spillovers. Overall, the effect of BDA establishment mainly reflects the role of local governance capacity in promoting firms’ technological catch-up, rather than stable positive spillovers to neighboring cities. The negative coefficients of neighboring policy exposure further suggest that improvements in digital governance capacity may reshape the regional allocation of data resources and innovation factors, thereby contributing to unfavorable neighboring policy exposure.
Given that the local BDA variable and neighboring exposure variables are constructed from related city-level policy adoption patterns, a further concern is whether the estimated spatial exposure effects are affected by multicollinearity. To address this issue, Appendix B reports VIF diagnostics for the spatial exposure specifications. The results show that the VIF values of the local DID variable and the bounded spatial exposure variables are generally below the conventional threshold of 10, suggesting that the bounded spatial estimates are unlikely to be driven by severe multicollinearity. Appendix B also reports the unrestricted full inverse-distance exposure measure, whose VIF is relatively high. This is consistent with the fact that it aggregates neighboring BDA exposure from all cities and may absorb broader policy diffusion and common time trends. Accordingly, the interpretation of neighboring exposure is based primarily on the bounded and localized spatial matrices.
Distance-Band Boundary of Gravity-Weighted Policy Exposure
To further examine distance-band heterogeneity of neighboring policy exposure, this study constructs distance-band spatial exposure variables using a gravity-based weighting scheme. Following Head and Mayer [40], the gravity weight jointly accounts for neighboring cities’ economic size and geographic distance, thereby assigning greater weight to economically larger and geographically closer cities. Figure 4 plots the estimated coefficients of gravity-weighted neighboring BDA exposure, together with 95% confidence intervals. The corresponding regression estimates are reported in Appendix A, Table A3. Panel A reports the baseline 50 km distance-band estimates, and Panel B reports the alternative 75 km distance-band estimates used for cutoff sensitivity analysis.
Figure 4.
Gravity-weighted distance-band estimates and cutoff sensitivity analysis.
The results show that the coefficients are negative in several distance intervals. In Panel A, based on the baseline 50 km distance bands, the coefficients are negative and statistically significant in the 0–50 km, 50–100 km, 100–150 km, 150–200 km, and 200–250 km bands, while the other distance bands are not statistically distinguishable from zero. In Panel B, which uses alternative 75 km distance bands, the coefficients remain negative and statistically significant in the 0–75 km, 150–225 km, 225–300 km, and 300–375 km bands. These results indicate that neighboring BDA exposure does not generate stable positive spillovers and is instead associated with negative spatial externalities in selected distance ranges.
This pattern suggests that the spatial effects of BDA establishment are unlikely to follow a simple monotonic distance-decay process. Unlike pure knowledge spillovers, the consequences of government data governance may be shaped by administrative coordination, infrastructure linkages, intercity competition, and regional development hierarchy. A city with an established BDA may become more capable of coordinating data resources, providing digital public services, attracting digital talent, and supporting innovation-related services. These advantages may strengthen its relative position in regional competition and place siphoning or competitive crowding-out pressures on surrounding cities.
The non-monotonic distance-band pattern further suggests that geographic proximity alone may not fully characterize these spatial effects. Cities within certain distance ranges may be linked by shared infrastructure projects, regional industrial chains, or common policy agendas, whereas geographically closer cities may not necessarily be connected through the same economic or institutional channels. As a result, the negative coefficients may also reflect connected investments in digital infrastructure, uneven regional economic development, regional policy clustering, or other spatially correlated changes that accompany BDA establishment. Taken together, the distance-band results point to heterogeneous spatial externalities rather than a fixed geographic boundary, suggesting that neighboring BDA exposure may be embedded in a broader regional adjustment process.
4.5. Endogeneity Test
This study examines the impact of BDA establishment at the city level on firms’ technological catch-up. Although no obvious reverse causality is observed, and the policy setting is close to a quasi-natural experiment, concerns may still arise that observable differences between firms in the treatment and control groups lead to sample self-selection and thus bias the estimation results. To address this issue, this study employs propensity score matching (PSM). Specifically, nearest-neighbor matching (1:4) and kernel matching are used to identify control firms most comparable to treated firms, after which the regressions are re-estimated using the matched samples. The results are reported in Columns (1) and (2) of Table 5. In addition, following the principle of distributional matching, entropy balancing is applied to further rebalance the treatment and control groups, achieving higher-order balance in terms of the means, variance-covariance matrix, and skewness of the distributions. The corresponding results are reported in Column (3) of Table 5. Overall, the results show that, after using matching-based approaches to reduce observable differences between treated and control firms, the establishment of Big Data Administrations remains positively and significantly associated with firms’ technological catch-up.
Table 5.
Endogeneity test: Matching-based estimates.
Because BDA establishment is a city-level institutional arrangement rather than a randomly assigned policy shock, adopting cities may have differed from non-adopting cities in their pre-existing industrial structure, administrative modernization, and innovation potential. To account for these differences, we augment the baseline specification by interacting pre-treatment city characteristics with a linear time trend. Drawing on Dustmann et al. (2022) [41] and Feir et al. (2024) [42], this specification allows cities with different initial economic, industrial, and innovation conditions to follow different underlying trends over the sample period, thereby reducing, to some extent, concerns that the estimated BDA effect is driven by differential pre-treatment trends associated with local baseline characteristics.
The pre-treatment characteristics are measured using their 2011–2014 averages, before the earliest BDA establishment in the sample. Specifically, we use GDP per capita to capture initial economic conditions. To address differences in industrial structure, we use industrial upgrading, measured by the ratio of the tertiary-industry share to the secondary-industry share in GDP. To capture innovation potential, we use R&D internal expenditure, which reflects the city’s pre-existing R&D investment base. To capture administrative and innovation-governance capacity, we use the science and technology expenditure level, which reflects local government support for technological development and innovation-related public services.
Table 6 reports the results. The estimated coefficient of BDA remains positive and statistically significant when each pre-treatment trend is introduced separately. More importantly, the coefficient remains positive and significant at the 5% level when the economic, industrial-upgrading, R&D expenditure, and science-and-technology expenditure trends are jointly included. These results show that the estimated effect of BDA remains positive and statistically significant after further accounting for differential trends associated with pre-treatment economic conditions, industrial structure, R&D investment, and innovation-governance capacity. This suggests that the baseline estimates are not solely attributable to differential trends associated with these pre-existing city characteristics.
Table 6.
Pre-treatment City Characteristics and Differential Trends.
4.6. Robustness Checks
4.6.1. Sample Restriction
Groups with fewer than three observations may introduce randomness due to the small sample size and thus bias the estimates. To address this issue, this study excludes such samples (695 firm-year observations in total) and re-estimates the model. As shown in Column (1) of Table 7, the results remain consistent with the baseline regression, suggesting that the positive estimate remains in the restricted sample.
Table 7.
Robustness checks: Alternative samples and variable measurements.
4.6.2. Alternative Measures of the Dependent Variable
In the baseline analysis, firms’ total factor productivity is measured using the LP method. Here, the GMM and OP methods are used instead to measure total factor productivity and recalculate firms’ technological catch-up. As reported in Columns (2) and (3) of Table 7, the estimated coefficients remain positive and statistically significant, suggesting that the positive estimate is not sensitive to alternative TFP estimation methods.
4.6.3. Alternative Sample Period
The COVID-19 outbreak at the end of 2019, as a sudden public event, affected the macroeconomic environment and firms’ managerial expectations, thereby weakening firms’ confidence in technological catch-up. It also affected firms’ investment in technological R&D during business operations. To reduce the uncertainty caused by abnormal years, this study excludes observations from 2020 and 2021 and re-estimates the model. As shown in Column (4) of Table 7, the results remain consistent with the baseline findings.
4.6.4. Excluding First-Tier Cities
First-tier cities possess unique resource agglomeration advantages and may therefore be special in relation to the theme of this study. To address this concern, this study excludes Beijing, Shanghai, Shenzhen, and Guangzhou and re-estimates the model. As reported in Column (5) of Table 7, the results still show a positive and statistically significant estimate for BDA establishment, consistent with the baseline results.
4.6.5. Controlling for Contemporaneous Policy Shocks
When estimating the impact of BDA establishment on firms’ technological catch-up, it is difficult to rule out the potential influence of other contemporaneous policies related to the digital economy and data governance. To address this concern, this study controls for four related policy shocks: the establishment of government data openness platforms, the establishment of data trading platforms, national big data comprehensive pilot zones (BDCPZ), and information-benefit pilot cities. For each policy, we construct a corresponding dummy variable and include it in the regression analysis. As shown in Columns (6)–(9) of Table 8, after controlling for the effects of these important concurrent policies, the results consistently indicate that BDA establishment has a significantly positive effect on firms’ technological catch-up, providing additional support for the robustness of the baseline estimates.
Table 8.
Robustness checks: Additional policy controls.
4.6.6. Stacked DID Estimation
Given the staggered timing of BDA establishment across cities, this study further employs a stacked DID approach to assess whether the baseline results are sensitive to comparisons across treatment cohorts. Drawing on the stacked event-study logic used in Cengiz et al. (2019) [43], we define treatment cohorts according to the first establishment year of Big Data Administrations. For each cohort, we construct a separate stack in which firms located in cities treated in the focal cohort are assigned to the treatment group, while firms located in never-treated and not-yet-treated cities serve as controls. The event window covers three years before and three years after BDA establishment. The 2020 cohort is excluded because it contains very few observations and has only a short post-treatment window. To avoid over-weighting observations that appear in multiple stacks, each observation is weighted by the inverse of the number of stacks in which it appears. The model includes stack-specific industry fixed effects, stack-specific year fixed effects, and the same set of control variables as in the baseline model.
The stacked DID specification is given by:
where indexes the cohort-specific stack. equals one if firm belongs to the treated cohort in stack and is observed in the post-treatment period, and zero otherwise. and denote stack-specific industry fixed effects and stack-specific year fixed effects, respectively.
The results are reported in Table 9. The coefficient of is 0.0059 and statistically significant at the 1% level, which is close to the baseline estimate. This result indicates that the positive effect of BDA establishment on firms’ technological catch-up remains robust after accounting for staggered policy adoption. Overall, the stacked DID estimate provides additional support for the baseline conclusion that government data governance promotes firms’ technological catch-up.
Table 9.
Stacked DID estimates for staggered BDA adoption.
4.6.7. Estimation Based on the Double Machine Learning Model
To further alleviate concerns that the baseline estimates may be sensitive to restrictive linear functional form assumptions, we employ a double/debiased machine learning (DDML) procedure as an additional robustness check. We first partial out industry and year fixed effects from the outcome variable, the DID interaction term, and the full set of controls, and then estimate a partially linear model using five-fold cross-fitting. To flexibly approximate the nuisance functions, we implement three alternative learners, namely random forests, Lasso, and gradient boosting. Table 10 shows that the estimated DID coefficient remains positive and statistically significant across all specifications, with coefficient estimates of approximately 0.0068, 0.0066, and 0.0078, respectively. These findings suggest that the positive estimate is not solely attributable to a particular linear specification of the control variables. The main empirical pattern also persists under a substantially more flexible empirical framework, thereby providing additional support for the robustness of the baseline results.
Table 10.
Robustness Check Using Double/Debiased Machine Learning.
4.7. Mechanism Analysis
The preceding analysis hypothesizes that BDA establishment may promote firms’ technological catch-up through the technology-stimulation effect, the digital-ecosystem optimization effect, and the competition-strengthening effect. Drawing on the approach of Jiang [44], this section examines whether the empirical patterns are consistent with these proposed channels.
Because several theoretical constructs in the framework are latent in firm-level data, the mechanism tests operationalize these constructs using observable empirical measures. Table 11 summarizes how the main model components are linked to the empirical measures used in the subsequent mechanism tests.
Table 11.
Theoretical Constructs and Empirical Measures.
Guided by this operationalization, the following subsections examine the three proposed channels in turn.
4.7.1. Technology-Stimulation Effect
Based on the preceding analysis and the partial-derivative decomposition in Equation (13), BDA establishment strengthens firms’ access to public data resources and digital knowledge, improves information quality, and reduces information frictions. This enables firms to better identify market demand, technological opportunities, and directions for product-quality improvement, while also supporting digital transformation and digital technology upgrading. In this way, BDA establishment may increase the technology-level parameter, τ, strengthen the returns to technological upgrading, and ultimately promote firms’ technological catch-up. Specifically, the deepening of digital government construction and the continuous optimization of the digital economy environment help form an innovation environment characterized by data-driven coordination between government and enterprises. By acquiring government data resources and digital knowledge more efficiently, firms are better able to reduce dependence on traditional R&D paths and explore new opportunities for technological upgrading. At the same time, data openness and sharing can improve the matching between policy supply and firms’ innovation needs, thereby stimulating firm innovation and supporting the integration of industrial and innovation chains.
Given data availability, this study uses total factor productivity measured by the LP method as a proxy for firms’ technological progress and further examines firms’ digital innovation and digital technology upgrading activities. Since the technology-level parameter is not directly observable, this study uses firms’ technological progress, digital technology innovation output, digital transformation, and digital technology upgrading as observable firm-level proxies for the technology-stimulation channel. First, based on the main classification codes of firms’ invention patents, this study matches them with the Statistical Classification of the Digital Economy and Its Core Industries (2021) to identify the number of digital technology innovation patents filed by firms, and then takes the natural logarithm plus one as the proxy for firms’ digital technology. In addition, following Wu et al. [45], this study constructs a text-based measure of firm digital transformation based on the frequency of digital transformation-related keywords disclosed in annual reports. Further following Tao Feng et al. (2023) [46], digital transformation is divided, from a structural perspective, into two subdimensions: digital underlying technology transformation and digital practical application transformation. The regression results are reported in Table 12. The estimated coefficients for BDA establishment are all significantly positive. These results indicate that BDA establishment is positively associated with firms’ technological progress, digital patent output, digital transformation, basic technology upgrading, and application upgrading. This suggests that greater access to data factors may help firms identify relevant digital technologies more quickly and respond more effectively to cluster-development and market-upgrading needs, thereby supporting the development of firms’ digital technologies. Overall, these findings provide evidence consistent with the technology-stimulation channel.
Table 12.
Mechanism Test I.
4.7.2. Digital-Ecosystem Optimization Effect
The digital-ecosystem optimization effect is mainly reflected in the way digital government promotes the integration of government and enterprise data, improves factor allocation, reduces firms’ cost burden and uncertainty, and facilitates collaborative innovation through data openness, sharing, and institutional innovation. In the theoretical model, this mechanism corresponds to the cost-reduction and uncertainty-reduction components:
Higher posterior expected costs reduce the net return from technological upgrading, while greater posterior uncertainty increases the risk associated with catch-up decisions. Therefore, both and weaken firms’ incentives to undertake technological catch-up. BDA establishment may alleviate these constraints by improving data-resource allocation, policy-information matching, cross-departmental coordination, and the circulation of market factors. In this sense, digital-ecosystem optimization implies that BDA establishment should reduce firms’ effective cost burden and operating uncertainty, while also strengthening inter-firm knowledge flows and collaborative innovation networks.
Because and are posterior theoretical constructs and cannot be directly observed in firm-level data, this study uses observable cost-side and uncertainty-side variables as empirical proxies. On the cost side, this study uses the operating cost ratio from the firm-level financial data to capture firms’ effective operating cost burden. We then compare each firm’s operating cost ratio with the industry-year median. If a firm’s cost ratio is higher than the industry-year median, the excess portion is defined as excess cost dispersion, which captures the firm’s relative high-cost disadvantage. If a firm’s cost ratio is lower than the industry-year median, the gap is defined as low-cost advantage, which captures the firm’s relative cost efficiency.
Considering that the industry-year median may be affected by the distribution of firms within each industry-year cell, we further construct two alternative cost-side measures. First, relative excess cost scales excess cost dispersion by the industry-year median, thereby capturing the relative magnitude of a firm’s high-cost disadvantage. Second, excess cost mean uses the industry-year mean rather than the industry-year median to construct the high-cost deviation. These additional measures help examine whether the cost-side results are sensitive to the choice of reference value.
On the uncertainty side, drawing on Koirala et al. (2023) [47], who use rolling standard deviations of ROA to capture firm-level risk-taking and operating volatility, this study constructs ROA uncertainty and growth uncertainty using the rolling volatility of firms’ operating outcomes. Specifically, ROA uncertainty is measured by the standard deviation of ROA over the current year and the previous two years; in line with Chen et al. (2022) [48], who use sales-growth volatility to measure firm-level volatility, growth uncertainty is measured by the standard deviation of sales growth over the current year and the previous two years. These variables capture firms’ profitability uncertainty and growth uncertainty, respectively. Together, these cost-side and uncertainty-side indicators are used to examine whether BDA establishment reduces firms’ operating cost burden and operating uncertainty.
Table 13 reports the cost-side and uncertainty-side results for the digital-ecosystem optimization channel. BDA establishment is associated with lower excess cost dispersion, lower relative excess cost, lower mean-based excess cost, lower ROA uncertainty, and lower growth uncertainty, as well as a higher low-cost advantage. These results suggest that the empirical patterns are consistent with the view that BDA establishment may alleviate firms’ relative cost disadvantages and reduce operating uncertainty in the catch-up process.
Table 13.
Mechanism Test II: Cost Burden and Uncertainty.
Overall, the results in Table 13 suggest that BDA establishment is associated with lower cost burden and reduced operating uncertainty in the catch-up process. These findings are consistent with the theoretical predictions that and , and provide evidence consistent with the digital-ecosystem optimization channel.
Beyond cost reduction and uncertainty mitigation, the digital-ecosystem optimization effect is also reflected in the construction of a collaborative digital ecosystem. Due to the peer effects of digital transformation, firms tend to adopt similar digital technologies, resources, and infrastructures, which creates opportunities for distributed and virtualized collaboration as well as extensive knowledge exchange. This helps firms build stable technology-sharing networks and vibrant knowledge fields, thereby realizing the economies of scale of digital knowledge resources.
First, we use same-city peer digitalization to characterize the local digital environment in which firms operate. Following Wu et al. [45], firm-level digital transformation is measured using the frequency of digital-transformation-related keywords disclosed in annual reports. Following Teng and Shen [49], peer firms are defined as other listed firms located in the same city-year as the focal firm, and same-city peer digitalization is calculated as the average digital transformation level of these peer firms. This measure captures the degree of local digital embeddedness and potential intra-city digital spillovers among firms. As a proxy for the local digital ecosystem environment, it mainly reflects the firm-side digitalization atmosphere within a city, while broader ecosystem conditions—such as digital infrastructure, data governance institutions, platform services, data-market rules, and cross-actor coordination—are examined through the additional collaboration-based indicators discussed below.
Second, patents jointly filed by listed firms and universities or research institutes are defined as industry–university–research collaborative patents, and a dummy variable for industry–university–research collaboration is constructed. If a firm has such collaborative outcomes in a given year, the variable is assigned a value of 1; otherwise, it is assigned a value of 0. This variable is used to measure the role of digital government in promoting collaboration. Third, according to whether a listed firm and other firms jointly apply for digital patents, a dummy variable for firms’ digital R&D alliances is constructed. If a firm has joint digital patent applications, the variable is assigned a value of 1; otherwise, it is assigned a value of 0.
The regression results are reported in Columns (1)–(3) of Table 14. The estimated coefficients for BDA establishment are all significantly positive. These results suggest that BDA establishment is associated with improvements in the local digital ecosystem through data openness, resource coordination, and collaborative innovation. With data openness and sharing as the link, government data governance may support the formation of a more standardized data resource system and improve the institutional conditions for firms to access and use public data. Based on these data resources, firms may be better able to develop innovative applications, optimize resource allocation, and strengthen collaboration with universities, research institutions, and other firms. The results show that BDA establishment is positively associated with same-city peer digitalization, industry–university–research collaboration, and digital innovation cooperation. Together with the cost-side and uncertainty-side evidence in Table 13, these findings provide evidence consistent with the digital-ecosystem optimization channel.
Table 14.
Mechanism Test III.
4.7.3. Competition-Strengthening Effect
The competition-strengthening effect mainly refers to the new competitive landscape generated by data flows under government data governance. First, the opening of government data improves market transparency, fosters new forms of cross-boundary competition, and shortens the decision-making cycle of traditional firms. Second, small and medium-sized firms may benefit from technology diffusion and become better able to overcome development bottlenecks, while leading firms may further strengthen their position through ecosystem platform building, with technological spillovers in turn driving firm upgrading. Third, competition shifts from factor-driven competition to data-driven competition, and from product comparison to competition among solution ecosystems, with standard-setting influence becoming an important strategic focus. This competition-strengthening effect may release digital dividends and accelerate market adjustment, thereby promoting firms’ technological catch-up.
This study uses the Herfindahl index to measure the degree of competition faced by firms. Following McVey [50], digital innovation competition is measured as the industry-level sum of squared shares of firms’ digital invention patent applications. The corresponding regression results are reported in Columns (4) and (5) of Table 14. The estimated coefficients for BDA establishment are all significantly negative. Since a smaller Herfindahl index indicates more intense competition, these results suggest that BDA establishment is associated with stronger competitive pressure among firms. This pattern is consistent with the competition-strengthening channel.
Taken together, the mechanism results provide evidence consistent with the three channels proposed in the theoretical analysis. These findings suggest that technology stimulation, digital-ecosystem optimization, and competition strengthening may help explain the positive association between BDA establishment and firms’ technological catch-up.
5. Heterogeneity Analysis
The preceding theoretical model and empirical tests suggest that BDA establishment is positively associated with firms’ technological catch-up. To further examine this heterogeneity, this section conducts subsample analyses by firm ownership, information asymmetry, and firm size.
5.1. Firm Ownership
Non-state-owned enterprises and state-owned enterprises are two major types of economic entities under China’s institutional context, and they differ in business objectives. State-owned enterprises are owned and controlled by the state and pay greater attention to social responsibility and macro-level regulation, whereas non-state-owned enterprises are mostly privately owned and operated, are more market-oriented, and place greater emphasis on profitability and competitiveness. Therefore, the effects of digital government may differ between state-owned and non-state-owned enterprises. On the one hand, non-state-owned enterprises usually operate in a more competitive market environment and need to continuously invest resources in technological innovation in order to introduce more competitive products and services, whereas state-owned enterprises often hold monopolistic or quasi-monopolistic positions in certain sectors and face relatively weaker competitive pressure. As a result, their incentive for technological catch-up may be weaker than that of non-state-owned enterprises. On the other hand, non-state-owned enterprises are generally more efficient in market response mechanisms and decision-making processes. They are also more responsive to market demand and can adjust business strategies more quickly when external conditions change. This flexibility gives non-state-owned enterprises an advantage in technological catch-up. Therefore, driven by market competition, non-state-owned enterprises are more likely to make use of the informational effects brought by digital government to optimize production processes, improve product quality, and develop new products and services, thereby achieving technological catch-up. Accordingly, this study expects that non-state-owned enterprises may be more responsive to the informational and market-oriented effects of digital government. Columns (1) and (2) of Table 15 report the subsample regression results by firm ownership. The results show that the coefficient of BDA establishment is positive and statistically significant for non-state-owned enterprises, while the coefficient for state-owned enterprises is positive but not statistically significant. These findings suggest that the technological catch-up effect of BDA establishment is more evident in the non-state-owned enterprise subsample.
Table 15.
Heterogeneity analysis by firm ownership, information asymmetry, and firm size.
5.2. Information Asymmetry
For firms with a high degree of information asymmetry, the core constraint on technological catch-up lies in limited information acquisition capacity. By opening data resources and building information-sharing platforms, digital government can significantly improve the efficiency of information acquisition and generate greater marginal benefits. At the same time, because firms with higher information asymmetry often have a weaker original technological base, the empowerment effect of digital government can help them break through information barriers and achieve a rapid improvement in technological capability within a relatively short period, thereby creating a late-mover advantage. By contrast, this nonlinear growth effect is relatively limited for firms with lower information asymmetry. Accordingly, this study expects that digital government will have a more pronounced effect on the technological catch-up of firms with higher information asymmetry.
Following prior studies [51,52,53], this study uses stock illiquidity as a proxy for firm-level information asymmetry, with higher stock illiquidity indicating a greater degree of information asymmetry. The sample is then divided into high- and low-information-asymmetry groups according to the median value of stock illiquidity. The regression results are reported in Columns (3) and (4) of Table 15. The results show that BDA establishment has a significantly positive effect on the technological catch-up of firms with higher information asymmetry. For firms with lower information asymmetry, the effect is weaker and only marginally significant. This finding indicates that the positive effect of BDA establishment is more pronounced among firms facing higher information asymmetry, which is consistent with the above discussion.
5.3. Firm Size
Large firms possess more abundant capital, human resources, and technological accumulation, enabling them to make more effective use of the data resources and policy support provided by digital government and to accelerate the process of technological innovation. Their stronger capacity for resource integration allows the information and policy dividends released by digital government to be translated more rapidly into technological outcomes, thereby forming an advantage in sustained innovation. In addition, large firms can spread R&D costs through economies of scale during the process of technological catch-up, thereby reducing unit costs and improving the efficiency and returns of technological innovation. The industry data and analytical tools provided by digital government also help large firms more accurately identify the direction of technological upgrading, achieve large-scale technological breakthroughs, and further strengthen their leading position in the market. Finally, owing to their scale advantages, large firms have a stronger capacity to bear risk and are therefore more willing to engage in high-risk, high-return technological innovation activities under the support of digital government. This risk preference enables them to explore less familiar technological domains, achieve frontier technological breakthroughs, and lay a solid foundation for future technological development. Taken together, these advantages make large firms better positioned to translate digital-government support into technological breakthroughs and catch-up outcomes.
Firm size is measured by total assets, and the sample is divided into large firms and small firms according to the median value. Columns (5) and (6) of Table 15 report the subsample regression results by firm size. The coefficient of BDA establishment is positive and statistically significant for large firms, while the coefficient for small firms is positive but not statistically significant. These findings suggest that the technological catch-up effect of BDA establishment is more evident in the large-firm subsample.
6. Conclusions and Implications
6.1. Conclusions
This study examines whether and how government data governance affects firms’ technological catch-up. Using the establishment of Big Data Administrations as a city-level institutional shock, this study constructs a multi-period difference-in-differences framework based on panel data of Chinese A-share listed firms from 2011 to 2021. Building on a theoretical framework that links BDA establishment to technology stimulation, digital-ecosystem optimization, and competition strengthening, the analysis yields the following conclusions.
First, BDA establishment has a positive and statistically significant effect on firms’ technological catch-up. This finding remains robust across a range of additional tests, including placebo tests, matching-based estimates, controls for pre-treatment city-level trends, alternative sample and variable specifications, contemporaneous policy controls, stacked DID estimation, and double/debiased machine learning estimation. These results suggest that the establishment of specialized data governance agencies is associated with measurable improvements in firm-level technological catch-up, rather than merely reflecting broader digital-government reforms.
Second, the mechanism analysis provides evidence consistent with the proposed channels of technology stimulation, digital-ecosystem optimization, and competition strengthening. BDA establishment is associated with improvements in firms’ technological progress, digital innovation, digital transformation, cost efficiency, uncertainty reduction, collaborative innovation, and competitive pressure. These findings suggest that the positive association between government data governance and technological catch-up is consistent with multiple, mutually related channels rather than a single source of policy support.
Third, the heterogeneity analysis shows that the effect of BDA establishment is more evident in the non-state-owned enterprise subsample, among firms with higher information asymmetry, and in the large-firm subsample. This pattern suggests that the effectiveness of government data governance depends not only on the existence of data governance institutions but also on firms’ ownership attributes, information environment, and capacity to absorb external digital resources.
Fourth, the spatial analysis reveals that the effect of government data governance is primarily local and is accompanied by complex cross-city externalities. After incorporating spatially weighted policy exposure variables based on alternative spatial weight matrices, the local effect of BDA establishment remains positive and statistically significant. This indicates that the main effect identified in this study is primarily driven by improvements in local data governance capacity rather than by policy diffusion from neighboring cities. However, neighboring cities’ BDA establishment does not generate stable positive spillovers to local firms. Instead, the coefficients of spatially weighted policy exposure are significantly negative, suggesting that neighboring BDA exposure may be associated with negative spatial externalities.
The distance-band analysis further suggests that these spatial externalities are interval-specific rather than linearly decreasing with distance. Negative effects are more evident in several near- and medium-distance ranges, while some other distance bands are statistically insignificant. These findings imply that BDA establishment may reshape the regional allocation of digital and innovation resources. The estimated negative spatial exposure is consistent with siphoning or competitive crowding-out, but it may also reflect connected digital-infrastructure investment, uneven regional economic development, regional policy clustering, and other spatially correlated changes. Future research could further distinguish between these channels using more detailed data on digital infrastructure investment, intercity policy coordination, and regional factor mobility.
Overall, this study provides firm-level evidence that government data governance is positively associated with technological catch-up, and that this association is consistent with improvements in the institutional conditions for data-resource coordination, digital innovation, and competitive adjustment. At the same time, the heterogeneous and spatial results indicate that the benefits of BDA establishment are not evenly distributed across firms or regions. These findings extend the understanding of public data governance as an institutional driver of firm upgrading and provide a basis for more targeted and regionally coordinated digital governance policies.
The scope of these conclusions should be understood in relation to the sample and institutional setting. The evidence speaks most directly to Chinese A-share listed firms, which tend to be larger, more formalized, and more technologically capable than the broader population of firms. These characteristics may place listed firms in a stronger position to absorb public data resources, respond to policy information, and translate improvements in digital governance into technological upgrading outcomes. The mechanisms documented in this study may also be relevant for SMEs, especially insofar as public data governance reduces information friction, improves data access, and strengthens policy matching. However, their effects for SMEs are likely to depend more heavily on complementary conditions, including digital absorptive capacity, affordable data access, external digital-service support, and targeted policy assistance. The findings are also shaped by China’s institutional setting, where local governments play an active role in coordinating public data resources, digital infrastructure, and firm-oriented data services. In institutional environments where such coordination is weaker or organized more through market-based arrangements, the same mechanisms may operate with different intensity.
6.2. Policy Implications
The findings of this study provide several policy implications for the design of public data governance institutions, the alignment between digital governance and firm innovation, and the coordination of data-related policies across regions.
First, governments should strengthen the substantive coordination capacity of Big Data Administrations rather than focusing only on their formal establishment. Since BDA establishment is positively associated with firms’ technological catch-up, although the average estimated effect is modest in magnitude, local governments should view data governance agencies as part of a broader institutional infrastructure for supporting firm upgrading. Accordingly, local governments should improve public-sector data-sharing mechanisms, clarify rules for data ownership, circulation, security, and accountability, and develop classification-based guidelines for public data openness. Digital government data collaboration requires coordination across organizations and governance actors, indicating that data governance should not be confined to isolated administrative departments [54]. In addition, interoperability is essential for enabling data flows across public-sector systems and improving the use of digital public services [55]. Therefore, regional public data platforms should provide standardized data interfaces, compliance guidance, and service-oriented data access mechanisms for enterprises. These arrangements can reduce firms’ data acquisition costs and improve the efficiency with which public data resources are transformed into innovation inputs. This is also consistent with prior evidence that open government data can create business value when firms are able to reuse public data resources for innovation, product development, and business model upgrading [56], while the sustainable value of open government data depends on the joint development of data resources, digital infrastructure, and governance mechanisms [57].
Second, public data governance should be more closely connected with firms’ innovation needs. The mechanism analysis provides evidence consistent with the view that technology stimulation, digital-ecosystem optimization, and competition strengthening are relevant channels through which BDA establishment may be associated with technological catch-up. Accordingly, policy design should move beyond isolated digital infrastructure investment and focus on creating institutional conditions that facilitate data access, digital innovation, collaborative R&D, and market competition. Digital innovation increasingly relies on distributed actors, open knowledge flows, and the recombination of heterogeneous digital resources [30]. Local governments can therefore improve policy-matching tools, open application scenarios, and support collaboration among firms, universities, research institutes, and digital service providers. At the same time, digital platform ecosystems require governance arrangements that coordinate heterogeneous participants and sustain value creation [58]. In this sense, BDA-related policies should not only expand data supply but also improve the conditions under which firms transform data resources into technological progress, digital transformation, and collaborative innovation.
Third, digital empowerment policies should be differentiated according to firm characteristics. The heterogeneity analysis shows that the effect of BDA establishment is more evident among non-state-owned enterprises, firms with higher information asymmetry, and larger firms. For non-state-owned enterprises, governments may expand public data catalogues, improve the accessibility of public data platforms, and provide modular digital analytics tools and platform-based services to alleviate constraints in data access and digital capabilities. For firms with higher information asymmetry, policy instruments should focus on improving the transparency, timeliness, and usability of public information, especially through policy-matching services, data-quality improvement, and firm-oriented digital public services. For larger firms, governments can support data-driven collaborative innovation and industrial-chain digital integration, allowing these firms to better transform data resources and digital public services into technological catch-up outcomes. These differentiated policies should remain closely linked to the heterogeneity patterns identified in this study, rather than being extended to policy instruments that are not directly examined in the empirical analysis.
Fourth, regional coordination in data governance should be strengthened to mitigate negative spatial externalities. The spatial analysis shows that neighboring cities’ BDA establishment does not generate stable positive spillovers and may be associated with unfavorable neighboring policy exposure in certain distance ranges. This finding suggests that the establishment of data governance agencies may reshape the regional allocation of data resources, digital talent, platform firms, and innovation services. At the same time, unfavorable neighboring exposure should be understood in a broader regional-governance context. It may reflect not only siphoning or competitive crowding-out, but also unequal regional development, connected digital-infrastructure investment, and clustered policy implementation. Therefore, regional coordination should focus not only on limiting redundant competition, but also on strengthening cross-city complementarity in digital infrastructure, public data standards, data-platform interoperability, and innovation-service provision.
Author Contributions
Conceptualization, W.X.; methodology, W.X. and P.W.; software, P.W.; validation, P.W., K.L. and D.Z.; formal analysis, P.W.; investigation, P.W. and D.Z.; resources, W.X. and D.Z.; data curation, P.W. and D.Z.; writing—original draft preparation, P.W. and M.L.; writing—review and editing, P.W., K.L., M.L. and D.Z.; visualization, P.W.; supervision, M.L.; project administration, M.L.; funding acquisition, W.X.; W.X. supervised the overall research process, provided guidance on manuscript preparation, reviewed and finalized the manuscript, and took responsibility for the integrity and academic rigor of the study. All authors have read and agreed to the published version of the manuscript.
Funding
This research was funded by the Second Batch of Specially Commissioned Projects of the Philosophy and Social Sciences Innovation Project of Guangdong Province, “Type Identification, Driving Factors and Empowerment Paths of Artificial Intelligence Applications in Guangdong Manufacturing” (Grant No. GD24WTCXGC11).
Institutional Review Board Statement
Not applicable.
Informed Consent Statement
Not applicable.
Data Availability Statement
The firm-level data used in this study were obtained from the CSMAR and WIND databases. Regional-level data were collected from official statistical yearbooks and publicly available government sources. Due to database licensing restrictions, the firm-level data cannot be publicly shared. The processed data and code are available from the corresponding author upon reasonable request, subject to data-use agreements.
Acknowledgments
During the preparation of this manuscript, the authors used GPT-5.5 Thinking version, by OpenAI for language polishing, formatting assistance, and improving the clarity of manuscript presentation. The authors have reviewed and edited the output and take full responsibility for the content of this publication.
Conflicts of Interest
The authors declare no conflicts of interest. The funder had no role in the design of the study; in the collection, analyses, or interpretation of data; in the writing of the manuscript; or in the decision to publish the results.
Appendix A. Construction of Spatial Weight Matrices and Gravity-Weighted Distance-Band Exposure
This appendix provides details on the construction of the spatial weight matrices and distance-band exposure variables used in the spatial externality analysis.
Let denote the geographic distance between city and city . The spatially weighted exposure to neighboring BDA establishment is defined as:
where indicates whether neighboring city has established a Big Data Administration in year , and is the spatial weight under specification .
Table A1.
Definitions of Alternative Spatial Weight Matrices.
Gravity-Weighted Distance-Band Exposure
To further identify the spatial boundary of neighboring policy exposure, this study constructs gravity-weighted distance-band exposure variables. Unlike the inverse-distance matrix, the gravity weight jointly considers neighboring cities’ economic size and geographic distance. For distance band , the exposure variable is defined as:
where denotes the pre-policy economic size of city , measured by GDP or average GDP before policy implementation. The distance bands used in the analysis are listed in Table A2.
Table A2.
Distance Bands Used in the Gravity-Weighted Exposure Analysis.
To complement the graphical evidence reported in Figure 4, Table A3 reports the corresponding gravity-weighted distance-band estimates. Panel A presents the baseline 50 km distance-band specification, while Panel B reports the alternative 75 km distance-band specification used for cutoff sensitivity analysis. Both specifications include firm-level controls, regional controls, industry fixed effects, and year fixed effects.
Table A3.
Gravity-Weighted Distance-Band Estimates.
Appendix B. Variance Inflation Factor Diagnostics for Spatial Exposure Models
This appendix reports variance inflation factor (VIF) diagnostics for the spatial exposure specifications used in Section 4.4. The diagnostics examine whether the local BDA treatment variable and neighboring spatial exposure variables suffer from severe multicollinearity. Because the main concern is the potential overlap between local treatment and neighboring exposure, the discussion focuses on the VIF values of DID and the corresponding spatial exposure variables. For the distance-band specifications, VIF values are reported both with and without industry and year fixed effects.
Table A4.
VIF Diagnostics for Spatially Weighted Exposure Models.
Table A5.
VIF Diagnostics for Gravity-Weighted Distance-Band Exposure Models.
References
- Beraja, M.; Yang, D.Y.; Yuchtman, N. Data-Intensive Innovation and the State: Evidence from AI Firms in China. Rev. Econ. Stud. 2023, 90, 1701–1723. [Google Scholar] [CrossRef] [Scilit]
- Du, Y.; Xu, J.; Yuan, X. How Public Digital Governance System Affects Firms’ Digital Technology Innovation Performance: Base on Open Innovation Perspective. Technol. Soc. 2025, 83, 103001. [Google Scholar] [CrossRef] [Scilit]
- Kira, B.; Sinha, V.; Srinivasan, S. Regulating Digital Ecosystems: Bridging the Gap between Competition Policy and Data Protection. Ind. Corp. Change 2021, 30, 1337–1360. [Google Scholar] [CrossRef] [Scilit]
- Tan, Y.; Dallas, M.; Farrell, H.; Newman, A. Driven to Self-Reliance: Technological Interdependence and the Chinese Innovation Ecosystem. Int. Stud. Q. 2025, 69, sqaf017. [Google Scholar] [CrossRef] [Scilit]
- Marumolwa, L.; Marnewick, C. Unveiling Dark Data in Organisations. Int. J. Serv. Sci. Manag. Eng. Technol. 2025, 16, 32. [Google Scholar] [CrossRef] [Scilit]
- Wang, T.; Peng, Z.; Yan, I.K.M.; Shangguan, X. Data Governance, Investment Resilience, and Corporate Performance Enhancement. Int. Rev. Financ. Anal. 2026, 109, 104771. [Google Scholar] [CrossRef] [Scilit]
- Ge, S.; Tu, Z.; Chen, Y.; Chong, H.-Y. Data Driven-Sustainability: The Impact of Data Trading Platforms on Corporate ESG Performance. Int. Rev. Financ. Anal. 2025, 105, 104371. [Google Scholar] [CrossRef] [Scilit]
- Zhang, Z.; Cao, J.; Ma, R.; Feng, Y. Digital Economy Policies and Corporate Technology Spillovers: A Data-Driven Perspective. Int. Rev. Econ. Financ. 2025, 103, 104516. [Google Scholar] [CrossRef] [Scilit]
- Hunjra, A.I.; Zhao, S.; Goodell, J.W.; Liu, X. Digital Economy Policy and Corporate Low-Carbon Innovation: Evidence from a Quasi-Natural Experiment in China. Financ. Res. Lett. 2024, 60, 104910. [Google Scholar] [CrossRef] [Scilit]
- Wei, X.; Jiang, F.; Yang, L. Does Digital Dividend Matter in China’s Green Low-Carbon Development: Environmental Impact Assessment of the Big Data Comprehensive Pilot Zones Policy. Environ. Impact Assess. Rev. 2023, 101, 107143. [Google Scholar] [CrossRef] [Scilit]
- Zhou, J.; Guo, J.; Xu, W. Construction of Big Data Comprehensive Pilot Zones, New Quality Productive Forces and Transformation of Watershed Resource–Based Cities: Double Machine Learning Approach. Sustain. Cities Soc. 2025, 120, 106144. [Google Scholar] [CrossRef] [Scilit]
- Giachetti, C.; Mensah, D.T. Catching-up during Technological Windows of Opportunity: An Industry Product Categories Perspective. Res. Policy 2023, 52, 104677. [Google Scholar] [CrossRef] [Scilit]
- Lee, K.; Lim, C. Technological Regimes, Catching-Up and Leapfrogging: Findings from the Korean Industries. Res. Policy 2001, 30, 459–483. [Google Scholar] [CrossRef] [Scilit]
- Rosiello, A.; Maleki, A. A Dynamic Multi-Sector Analysis of Technological Catch-up: The Impact of Technology Cycle Times, Knowledge Base Complexity and Variety. Res. Policy 2021, 50, 104194. [Google Scholar] [CrossRef] [Scilit]
- Kim, D. Effects of Catch-up and Incumbent Firms’ SEP Strategic Manoeuvres. Res. Policy 2022, 51, 104495. [Google Scholar] [CrossRef] [Scilit]
- Mao, J.; Tang, S.; Xiao, Z.; Zhi, Q. Industrial Policy Intensity, Technological Change, and Productivity Growth: Evidence from China. Res. Policy 2021, 50, 104287. [Google Scholar] [CrossRef] [Scilit]
- Giachetti, C.; Li Pira, S. Catching up with the Market Leader: Does It Pay to Rapidly Imitate Its Innovations? Res. Policy 2022, 51, 104505. [Google Scholar] [CrossRef] [Scilit]
- Nam, K.-M. Compact Organizational Space and Technological Catch-up: Comparison of China’s Three Leading Automotive Groups. Res. Policy 2015, 44, 258–272. [Google Scholar] [CrossRef] [Scilit]
- Lee, K. Making a Technological Catch-up: Barriers and Opportunities. Asian J. Technol. Innov. 2005, 13, 97–131. [Google Scholar] [CrossRef] [Scilit]
- Li, J.; Kozhikode, R.K. Developing New Innovation Models: Shifts in the Innovation Landscapes in Emerging Economies and Implications for Global R&D Management. J. Int. Manag. 2009, 15, 328–339. [Google Scholar] [CrossRef] [Scilit]
- Vial, G. Understanding Digital Transformation: A Review and a Research Agenda. J. Strateg. Inf. Syst. 2019, 28, 118–144. [Google Scholar] [CrossRef] [Scilit]
- Oduro, S.; De Nisco, A.; Mainolfi, G. Do Digital Technologies Pay off? A Meta-Analytic Review of the Digital Technologies/Firm Performance Nexus. Technovation 2023, 128, 102836. [Google Scholar] [CrossRef] [Scilit]
- Zheng, S.; Ye, Z.; Lu, K.; He, T.; Liu, Y.; Zhang, L.; Hao, Y. Accounting for Non-CO2 Greenhouse Gases in Global PV Trade: Implications for Climate Responsibility and Policy. Sustain. Prod. Consum. 2026, 62, 55–69. [Google Scholar] [CrossRef] [Scilit]
- Mergel, I.; Edelmann, N.; Haug, N. Defining Digital Transformation: Results from Expert Interviews. Gov. Inf. Q. 2019, 36, 101385. [Google Scholar] [CrossRef] [Scilit]
- Gil-Garcia, J.R.; Dawes, S.; Pardo, T. Digital Government and Public Management Research: Finding the Crossroads. Public Manag. Rev. 2017, 20, 633–646. [Google Scholar] [CrossRef] [Scilit]
- Pardo, T.A.; Tayi, G.K. Interorganizational Information Integration: A Key Enabler for Digital Government. Gov. Inf. Q. 2007, 24, 691–715. [Google Scholar] [CrossRef] [Scilit]
- Janssen, M.; van der Voort, H.; Wahyudi, A. Factors Influencing Big Data Decision-Making Quality. J. Bus. Res. 2017, 70, 338–345. [Google Scholar] [CrossRef] [Scilit]
- Heijlen, R.; Crompvoets, J.; Bouckaert, G.; Chantillon, M. Evolving Government Information Processes for Service Delivery: Identifying Types & Impact. Adm. Sci. 2018, 8, 15. [Google Scholar] [CrossRef] [Scilit]
- Zhao, Y.; Chu, X. State Advances, Private Sector Advances”: The Role of State-Owned Enterprises in Outward Foreign Direct Investment. J. World Econ. 2021, 44, 53–78. (In Chinese) [Google Scholar] [CrossRef]
- Nambisan, S.; Lyytinen, K.; Majchrzak, A.; Song, M. Digital Innovation Management: Reinventing Innovation Management Research in a Digital World. MIS Q. 2017, 41, 223–238. [Google Scholar] [CrossRef] [Scilit]
- Kohtamäki, M.; Parida, V.; Oghazi, P.; Gebauer, H.; Baines, T. Digital servitization business models in ecosystems: A theory of the firm. J. Bus. Res. 2019, 104, 380–392. [Google Scholar] [CrossRef] [Scilit]
- Long, Y.; Zhang, X.; Wang, L. How does government data openness affect cross-regional capital flow? Evidence from Chinese-listed firms’ off-site investment. Econ. Model. 2025, 152, 107289. [Google Scholar] [CrossRef] [Scilit]
- Toh, P.K.; Pyun, E. Risky Business: How Standardization as Coordination Tool in Ecosystems Impacts Firm-Level Uncertainty. Strateg. Manag. J. 2024, 45, 649–679. [Google Scholar] [CrossRef] [Scilit]
- Goldfarb, A.; Tucker, C. Digital Economics. J. Econ. Lit. 2019, 57, 3–43. [Google Scholar] [CrossRef] [Scilit]
- Bloom, N.; Schankerman, M.; Van Reenen, J. Identifying Technology Spillovers and Product Market Rivalry. Econometrica 2013, 81, 1347–1393. [Google Scholar] [CrossRef] [Scilit]
- Delgado, M.S.; Florax, R.J.G.M. Difference-in-Differences Techniques for Spatial Data: Local Autocorrelation and Spatial Interaction. Econ. Lett. 2015, 137, 123–126. [Google Scholar] [CrossRef] [Scilit]
- Stakhovych, S.; Bijmolt, T.H.A. Specification of Spatial Models: A Simulation Study on Weights Matrices. Pap. Reg. Sci. 2009, 88, 389–409. [Google Scholar] [CrossRef] [Scilit]
- Aghion, P.; Blundell, R.; Griffith, R.; Howitt, P.; Prantl, S. The Effects of Entry on Incumbent Innovation and Productivity. Rev. Econ. Stat. 2009, 91, 20–32. [Google Scholar] [CrossRef] [Scilit]
- Jaffe, A.B.; Trajtenberg, M.; Henderson, R. Geographic Localization of Knowledge Spillovers as Evidenced by Patent Citations. Q. J. Econ. 1993, 108, 577–598. [Google Scholar] [CrossRef] [Scilit]
- Head, K.; Mayer, T. Chapter 3—Gravity Equations: Workhorse, Toolkit, and Cookbook. In Handbook of International Economics; Gopinath, G., Helpman, E., Rogoff, K., Eds.; Elsevier: Amsterdam, The Netherlands, 2014; Volume 4, pp. 131–195. [Google Scholar]
- Dustmann, C.; Lindner, A.; Schönberg, U.; Umkehrer, M.; vom Berge, P. Reallocation Effects of the Minimum Wage. Q. J. Econ. 2022, 137, 267–328. [Google Scholar] [CrossRef] [Scilit]
- Feir, D.L.; Gillezeau, R.; Jones, M.E.C. The Slaughter of the Bison and Reversal of Fortunes on the Great Plains. Rev. Econ. Stud. 2024, 91, 1634–1670. [Google Scholar] [CrossRef]
- Cengiz, D.; Dube, A.; Lindner, A.; Zipperer, B. The Effect of Minimum Wages on Low-Wage Jobs. Q. J. Econ. 2019, 134, 1405–1454. [Google Scholar] [CrossRef] [Scilit]
- Jiang, T. Mediation Effects and Moderation Effects in Empirical Studies of Causal Inference. China Ind. Econ. 2022, 5, 100–120. (In Chinese) [Google Scholar] [CrossRef]
- Wu, F.; Hu, H.; Lin, H.; Ren, X. Enterprise Digital Transformation and Capital Market Performance: Empirical Evidence from Stock Liquidity. Manag. World 2021, 37, 130–144. (In Chinese) [Google Scholar] [CrossRef]
- Tao, F.; Zhu, P.; Qiu, C.; Wang, X. The Impact of Digital Technology Innovation on Firm Market Value. J. Quant. Tech. Econ. 2023, 40, 68–91. (In Chinese) [Google Scholar] [CrossRef]
- Koirala, S.; Rao, S.; Farag, H.; Marshall, A. The Market for Corporate Control and Risk-Taking: Evidence from Global Merger and Acquisition Laws. Br. J. Manag. 2023, 34, 997–1022. [Google Scholar] [CrossRef] [Scilit]
- Chen, T.; Huang, Y.; Lin, C.; Sheng, Z. Finance and Firm Volatility: Evidence from Small Business Lending in China. Manag. Sci. 2022, 68, 2226–2249. [Google Scholar] [CrossRef] [Scilit]
- Teng, M.; Shen, M. Digital Peer Effects and Corporate Innovation Investment: A Moderated Mediation Model. Sci. Technol. Prog. Progress. Policy 2023, 40, 23–31. (In Chinese) [Google Scholar]
- McVey, J. S The Industrial Diversification of Multi-Establishment Manufacturing Firms: A Developmental Study. Can. Stat. Rev. 1972, 47, 112–117. [Google Scholar]
- Amihud, Y.; Mendelson, H.; Lauterbach, B. Market Microstructure and Securities Values: Evidence from the Tel Aviv Stock Exchange. J. Financ. Econ. 1997, 45, 365–390. [Google Scholar] [CrossRef] [Scilit]
- Amihud, Y. Illiquidity and Stock Returns: Cross-Section and Time-Series Effects. J. Financ. Mark. 2002, 5, 31–56. [Google Scholar] [CrossRef] [Scilit]
- Pastor, L.; Stambaugh, R.F. Liquidity Risk and Expected Stock Returns. J. Political Econ. 2003, 111, 642–685. [Google Scholar] [CrossRef] [Scilit]
- Schmeling, J.; al Dakruni, S.; Mergel, I. Data Collaboration in Digital Government Research: A Literature Review and Research Agenda. Gov. Inf. Q. 2025, 42, 102063. [Google Scholar] [CrossRef] [Scilit]
- Campmas, A.; Iacob, N.; Simonelli, F. How Can Interoperability Stimulate the Use of Digital Public Services? An Analysis of National Interoperability Frameworks and e-Government in the European Union. Data Policy 2022, 4, e19. [Google Scholar] [CrossRef] [Scilit]
- Magalhaes, G.; Roseira, C. Open Government Data and the Private Sector: An Empirical View on Business Models and Value Creation. Gov. Inf. Q. 2020, 37, 101248. [Google Scholar] [CrossRef] [Scilit]
- Jetzek, T.; Avital, M.; Bjorn-Andersen, N. The Sustainable Value of Open Government Data. J. Assoc. Inf. Syst. 2019, 20. [Google Scholar] [CrossRef] [Scilit]
- Costabile, C. Digital Platform Ecosystem Governance of Private Companies: Building Blocks and a Research Agenda Based on a Multidisciplinary, Systematic Literature Review. Data Inf. Manag. 2024, 8, 100053. [Google Scholar] [CrossRef] [Scilit]
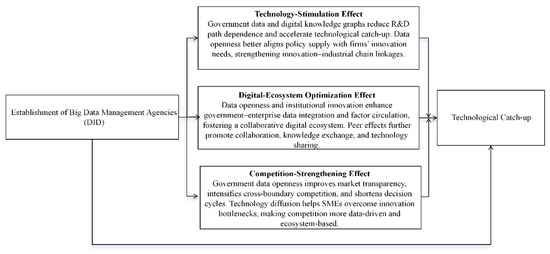
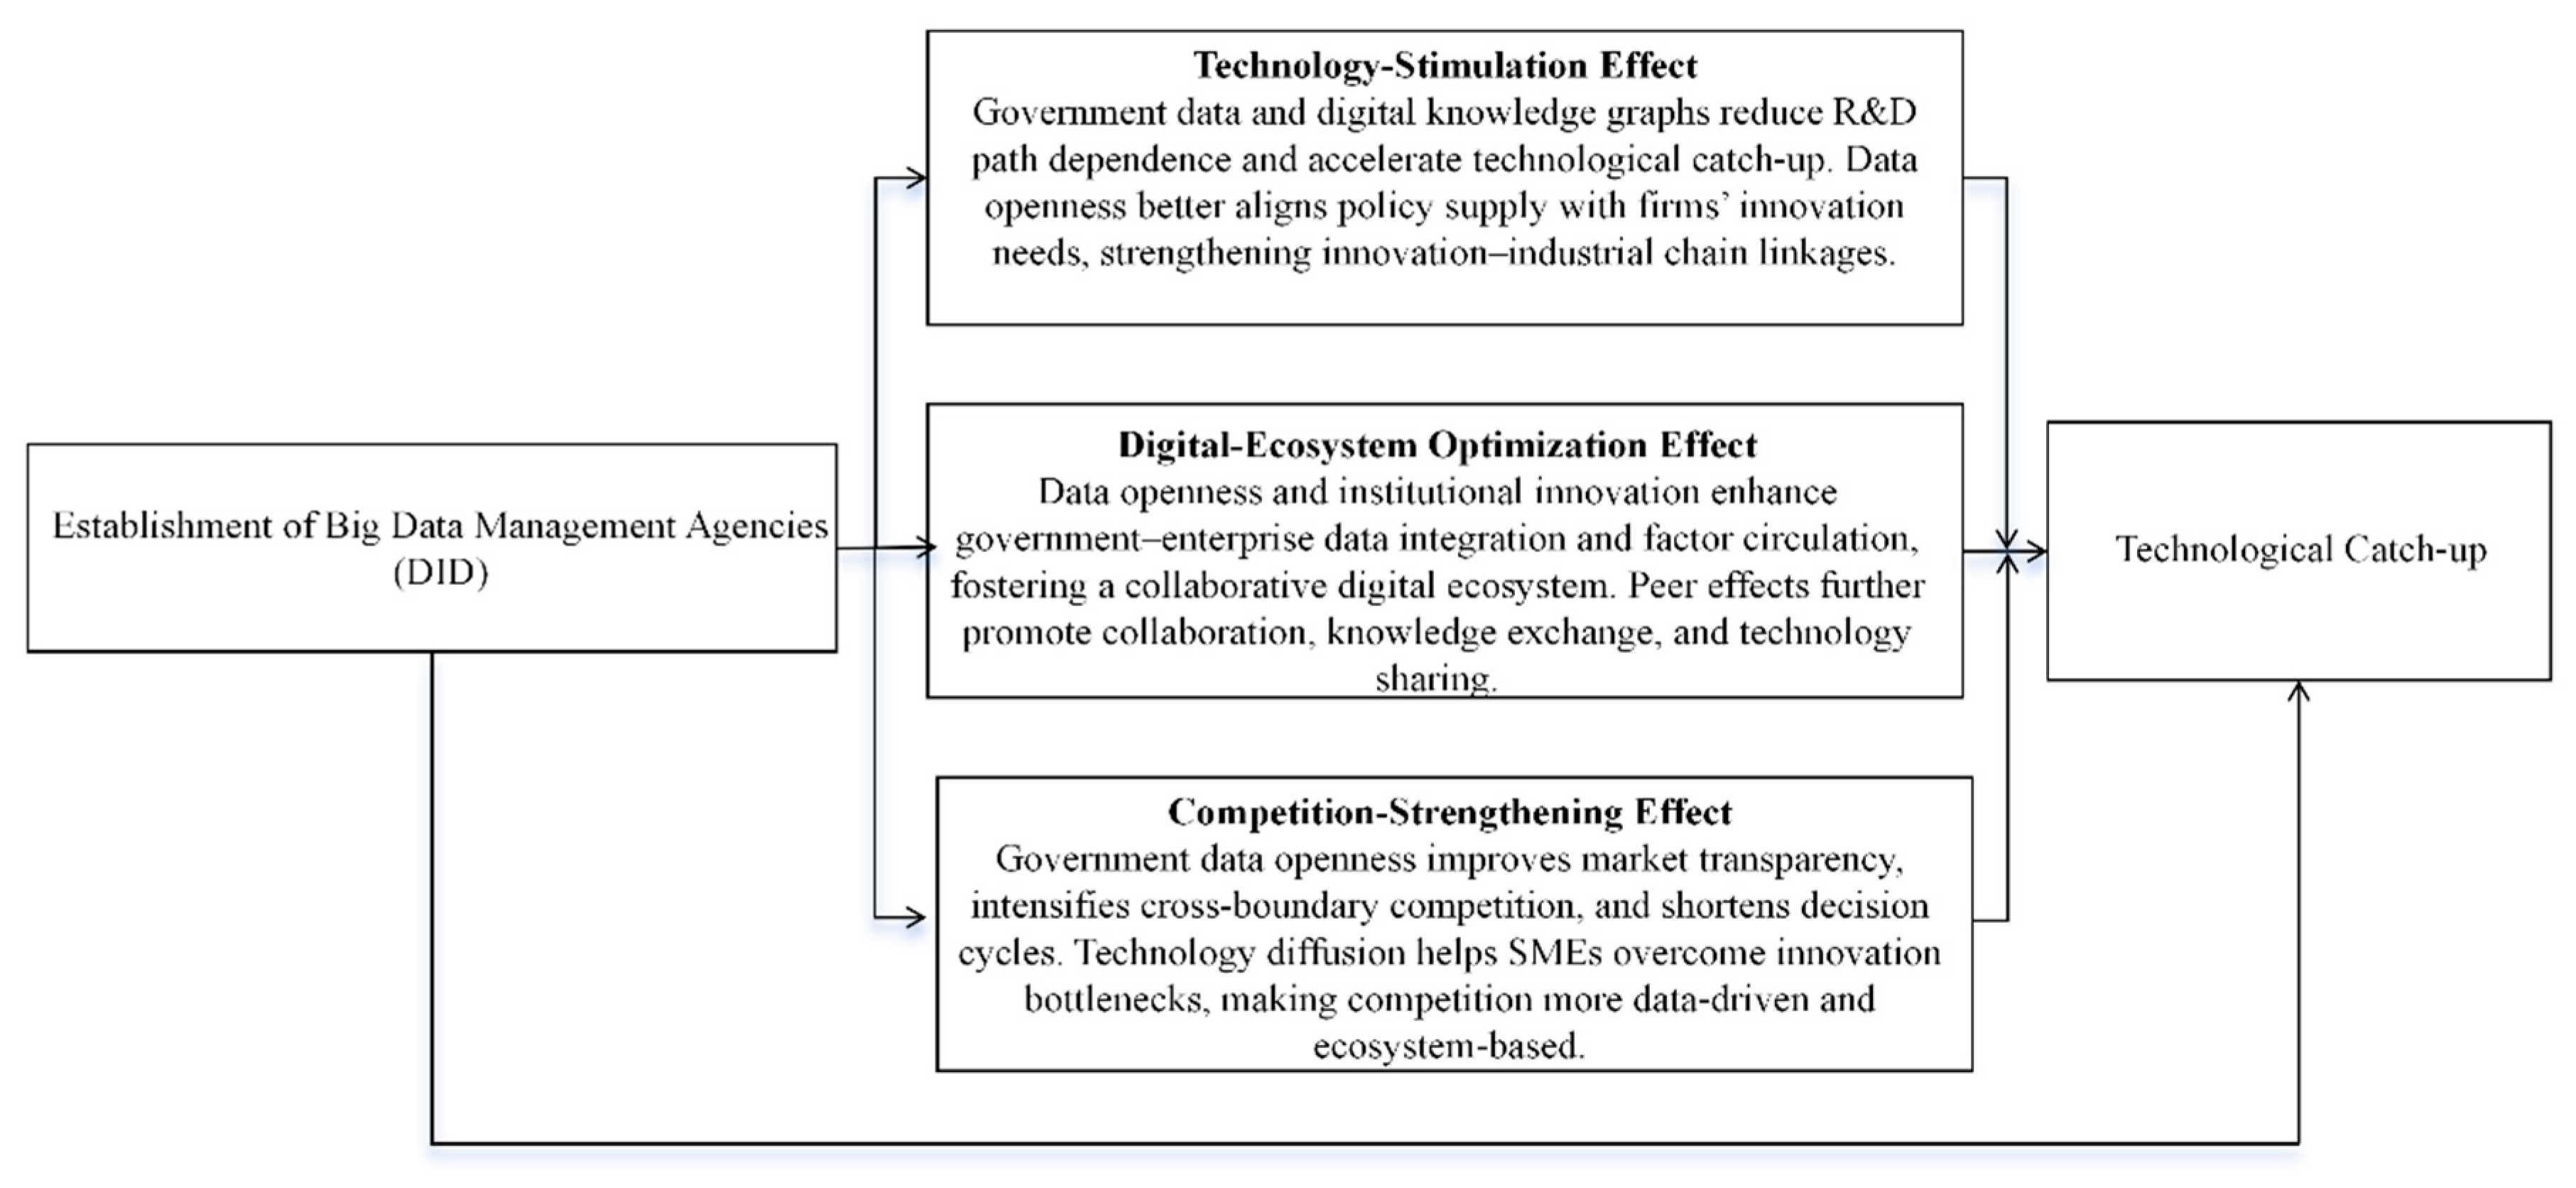
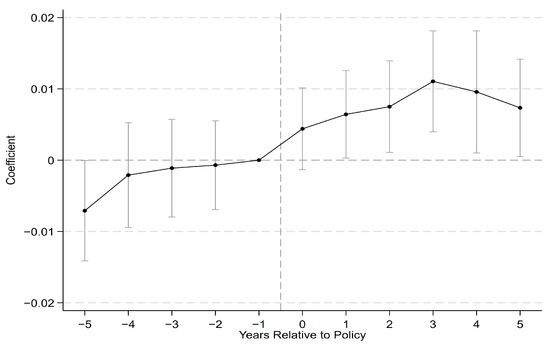
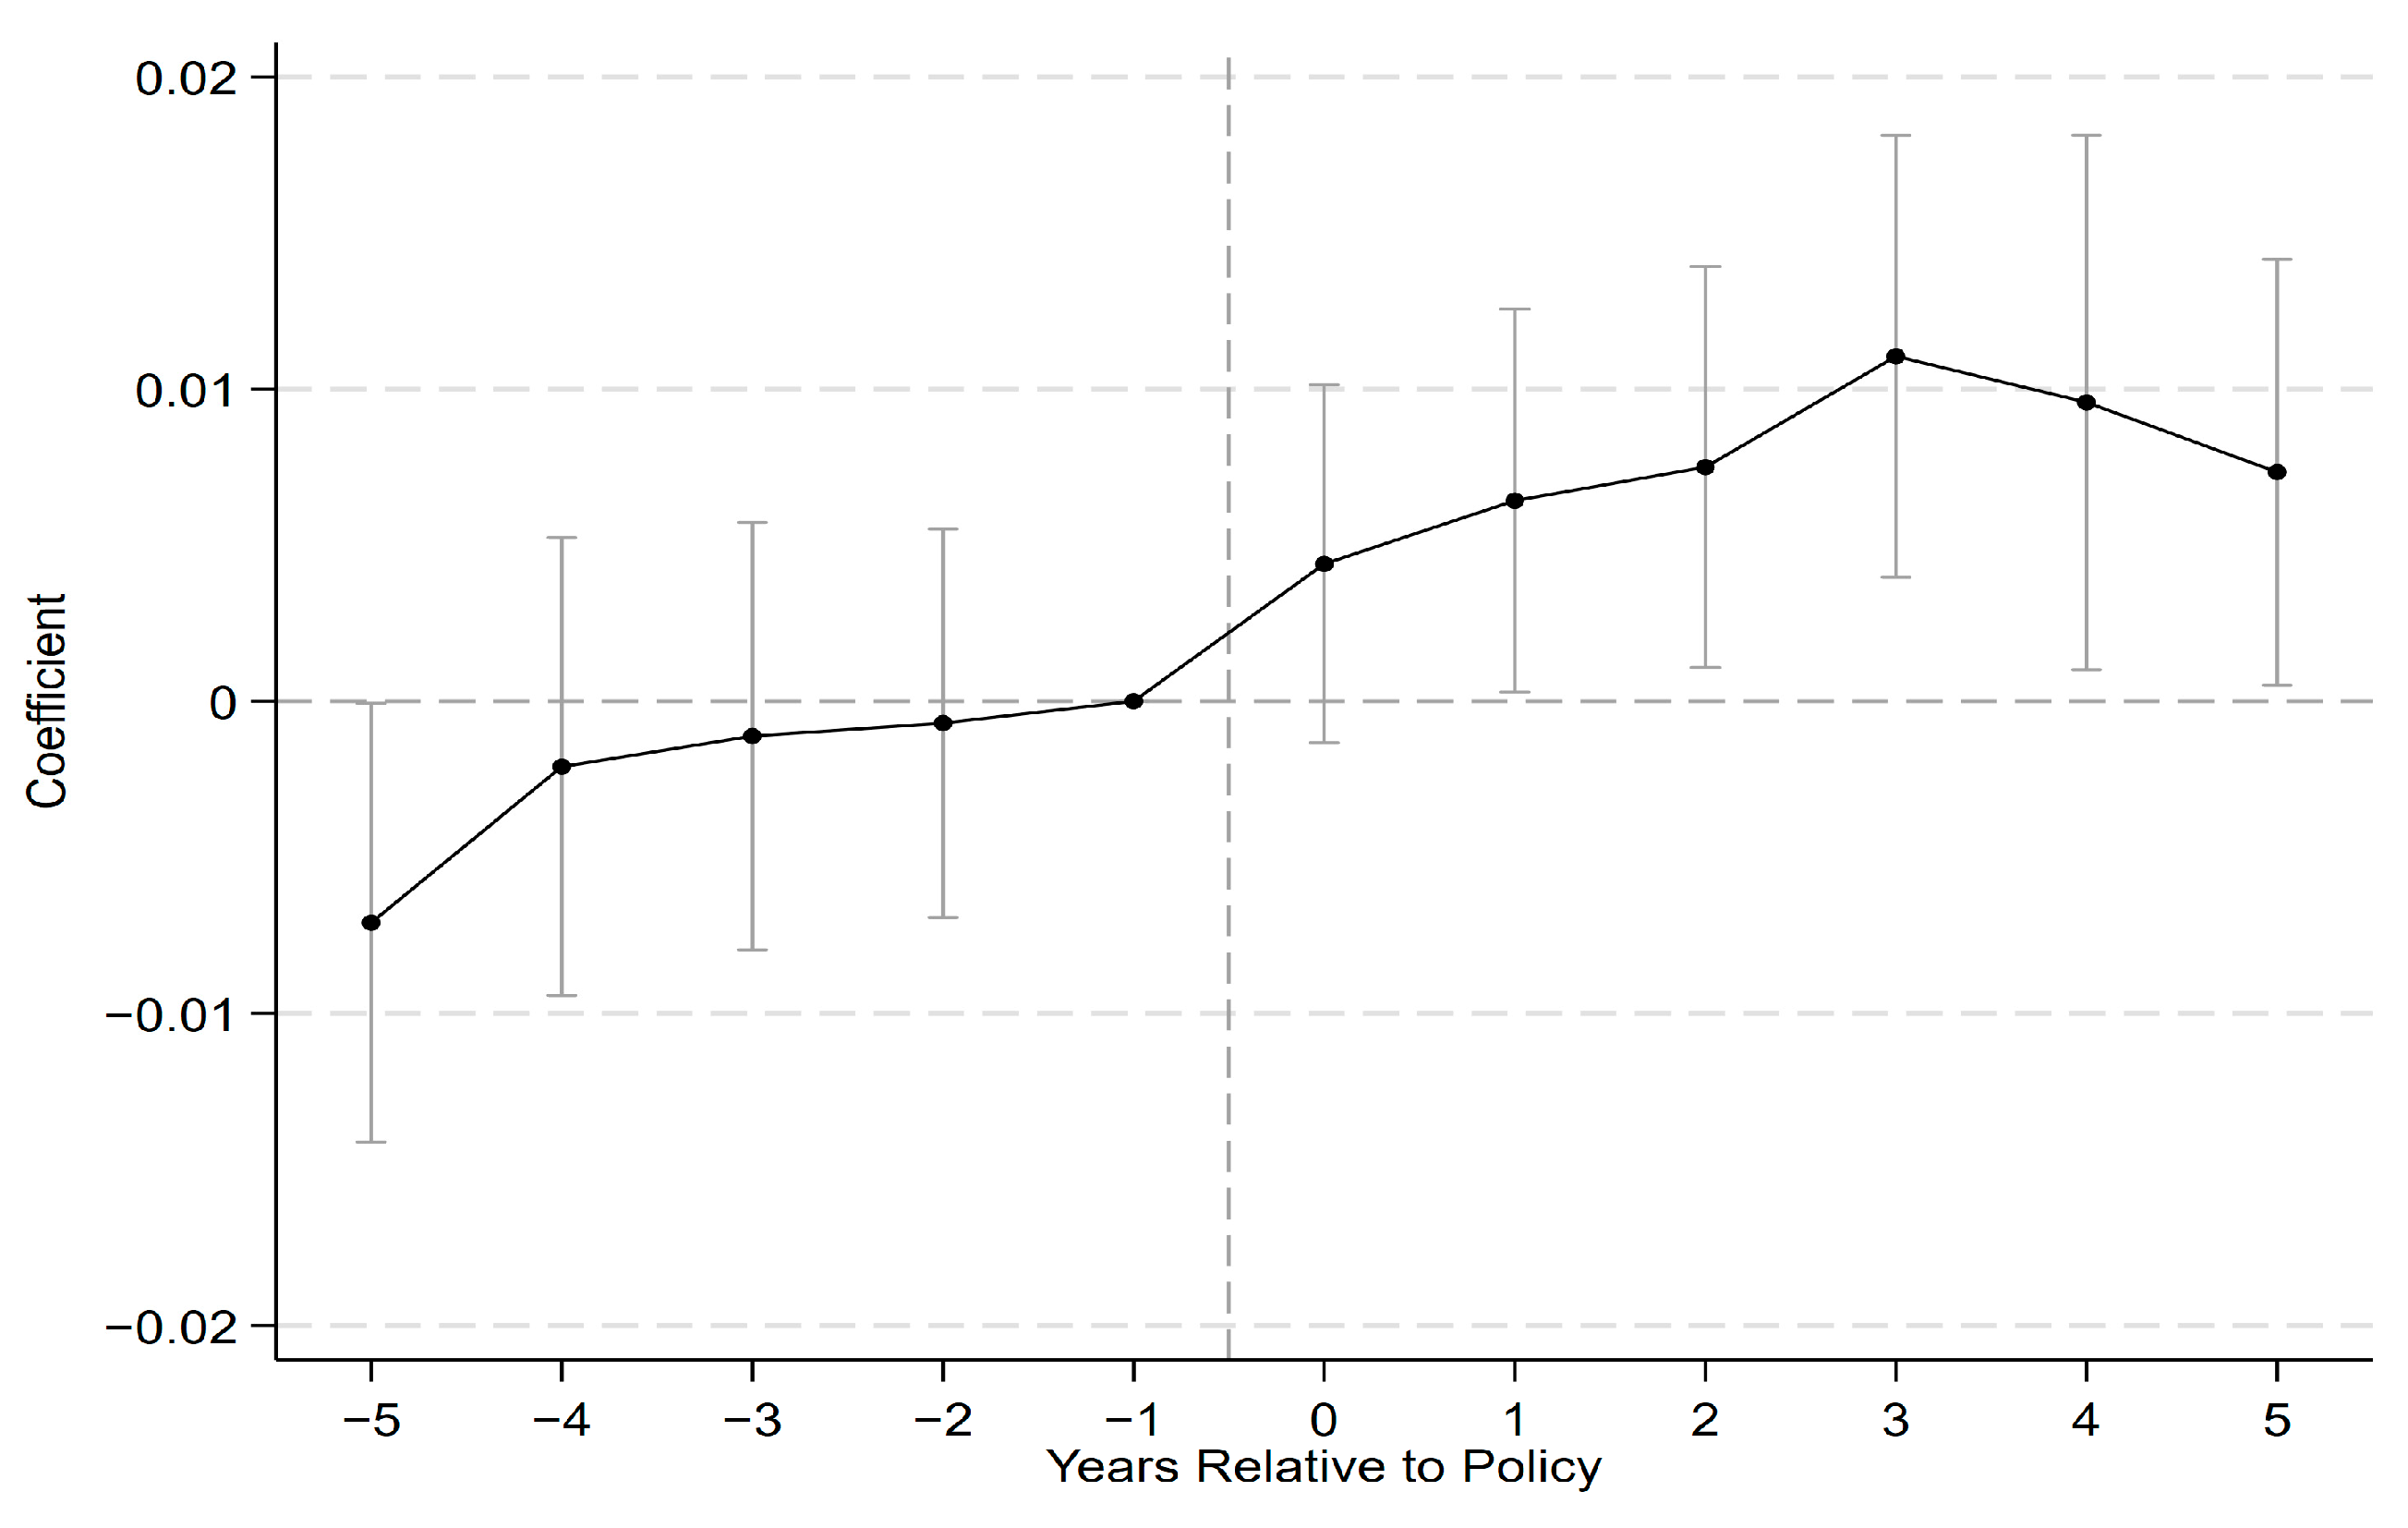
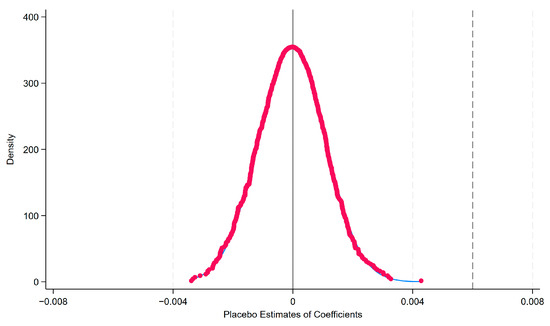
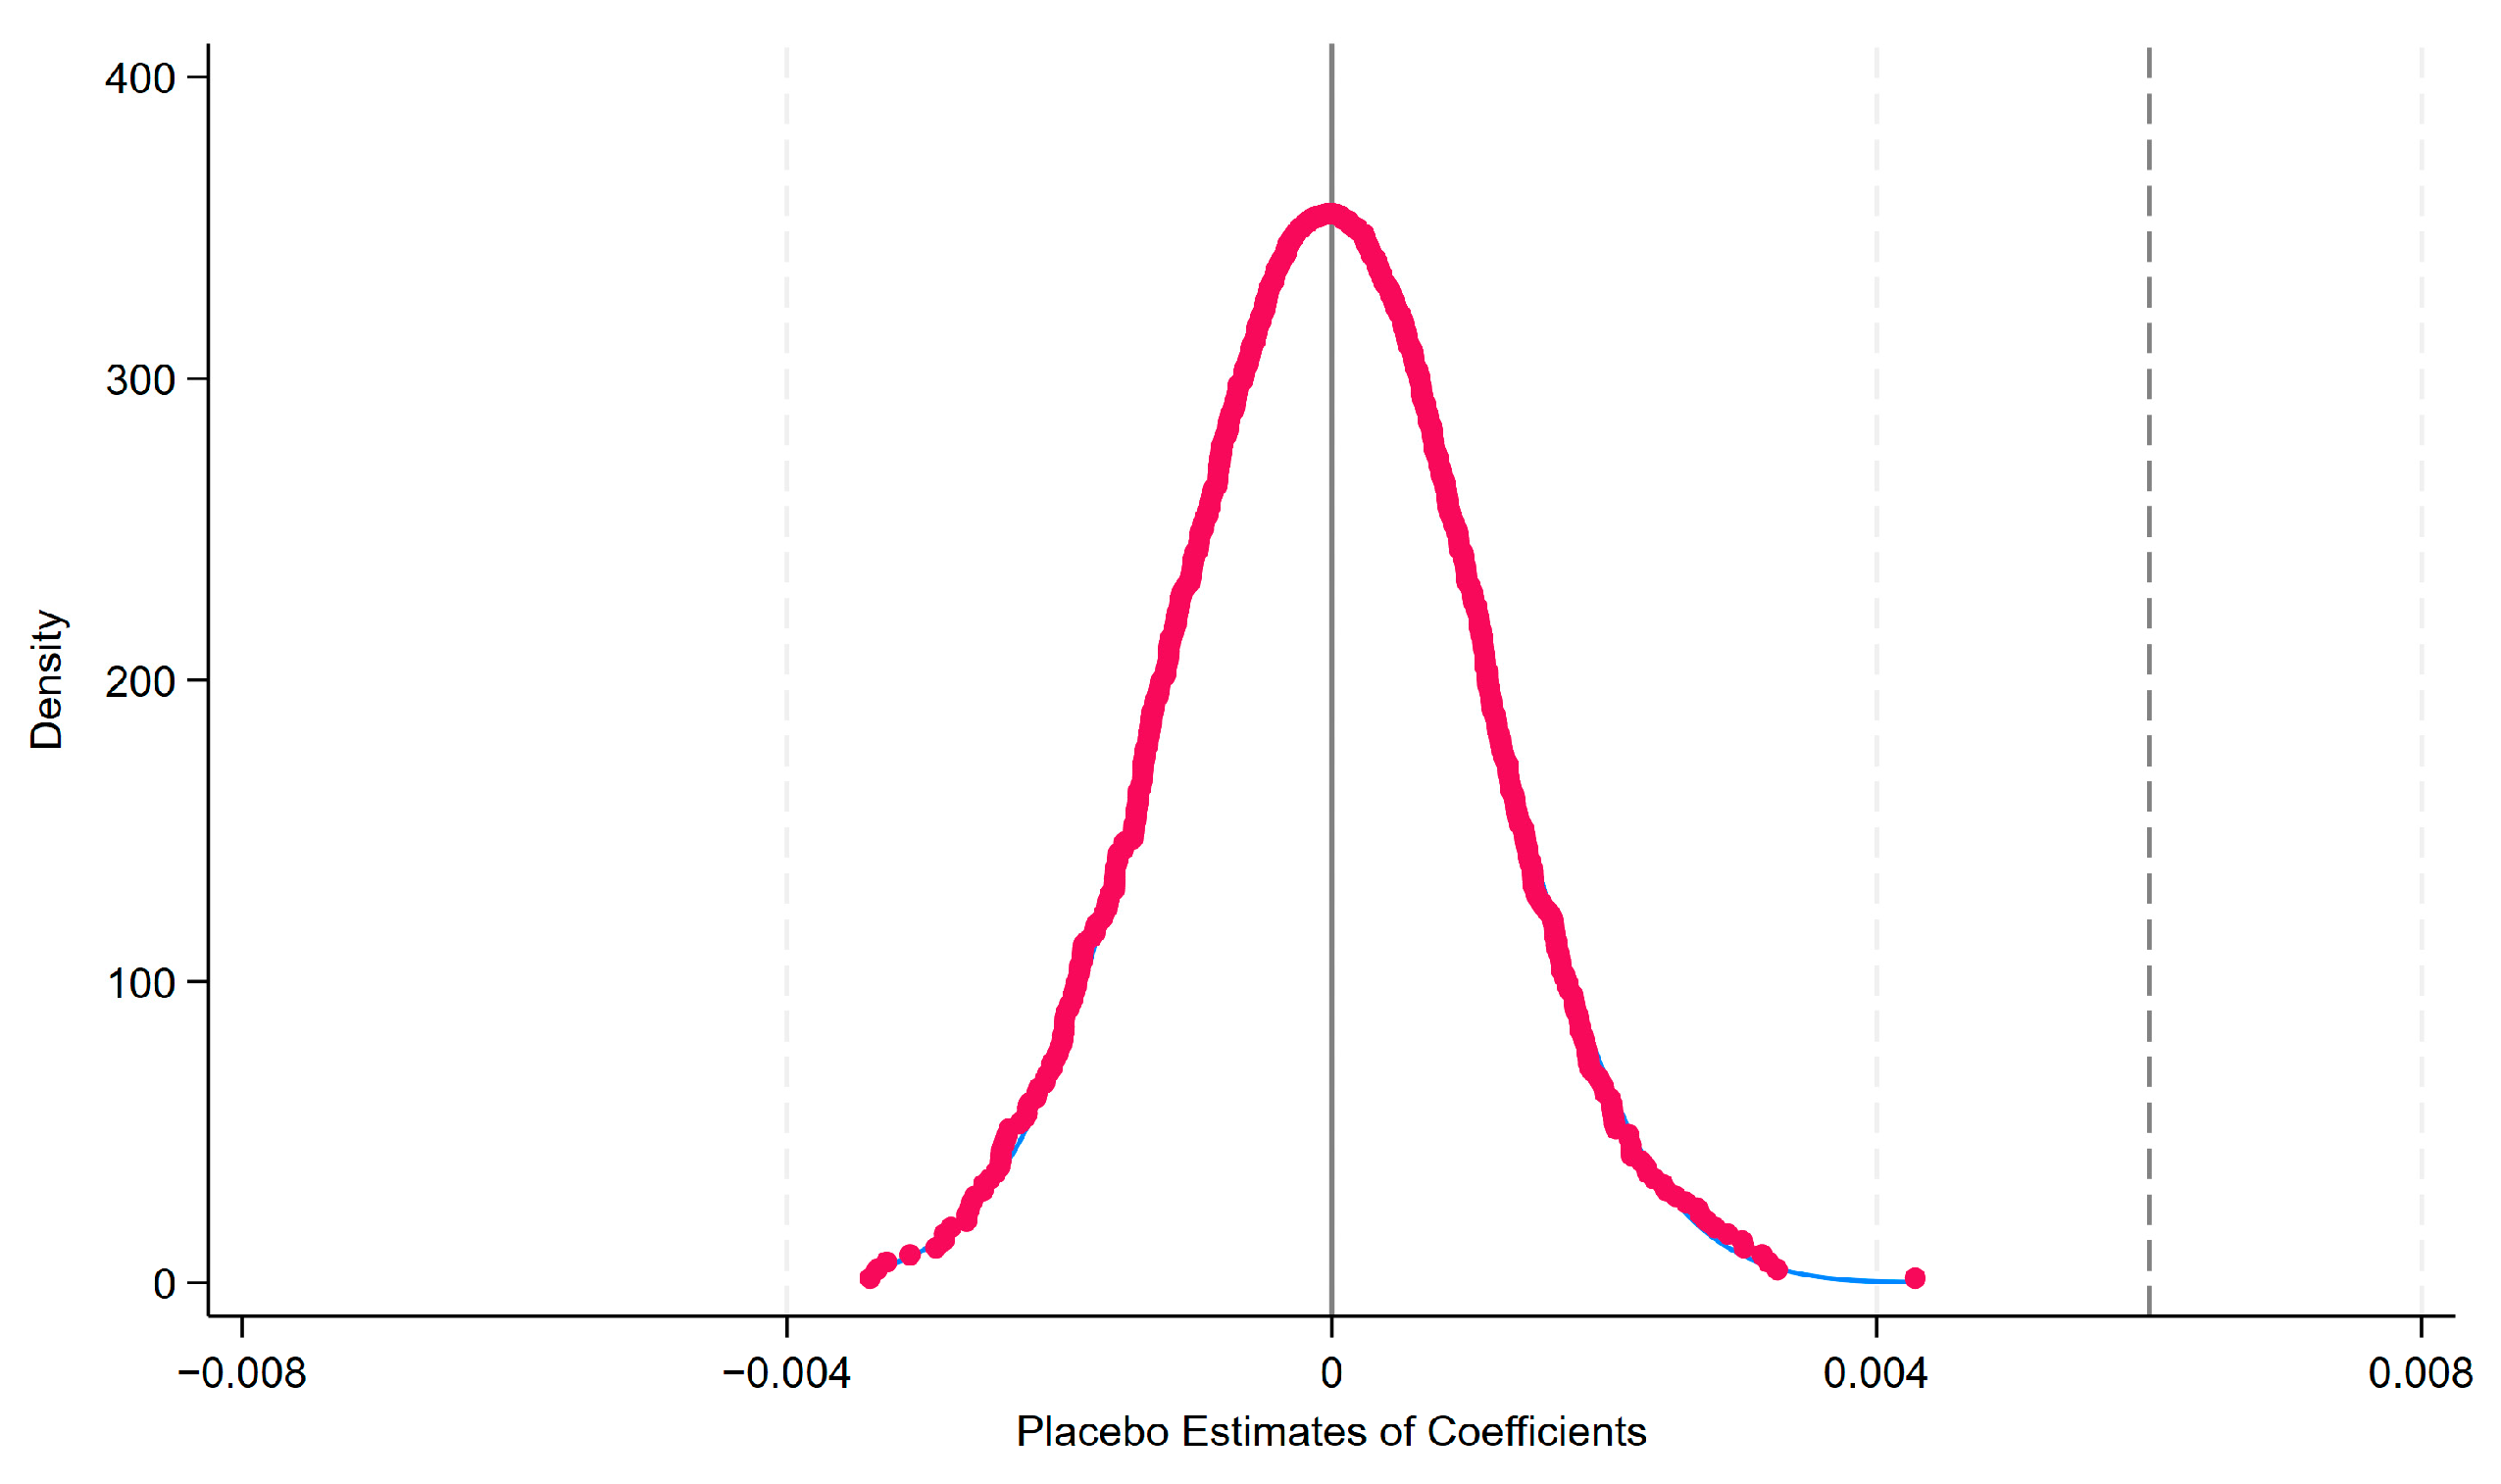
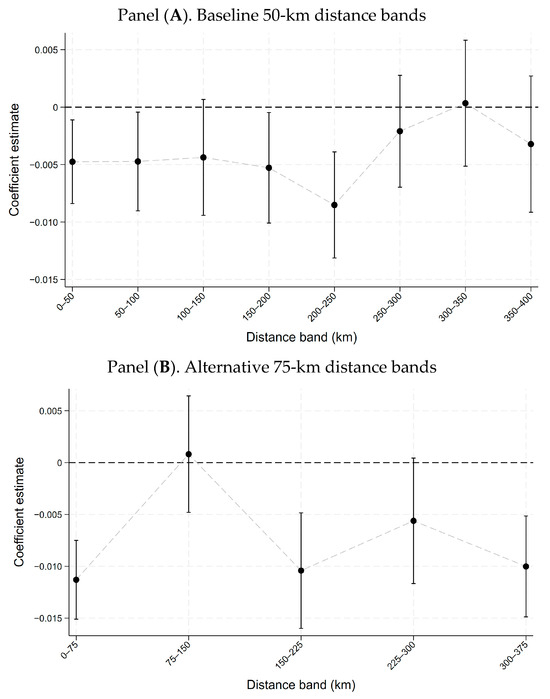
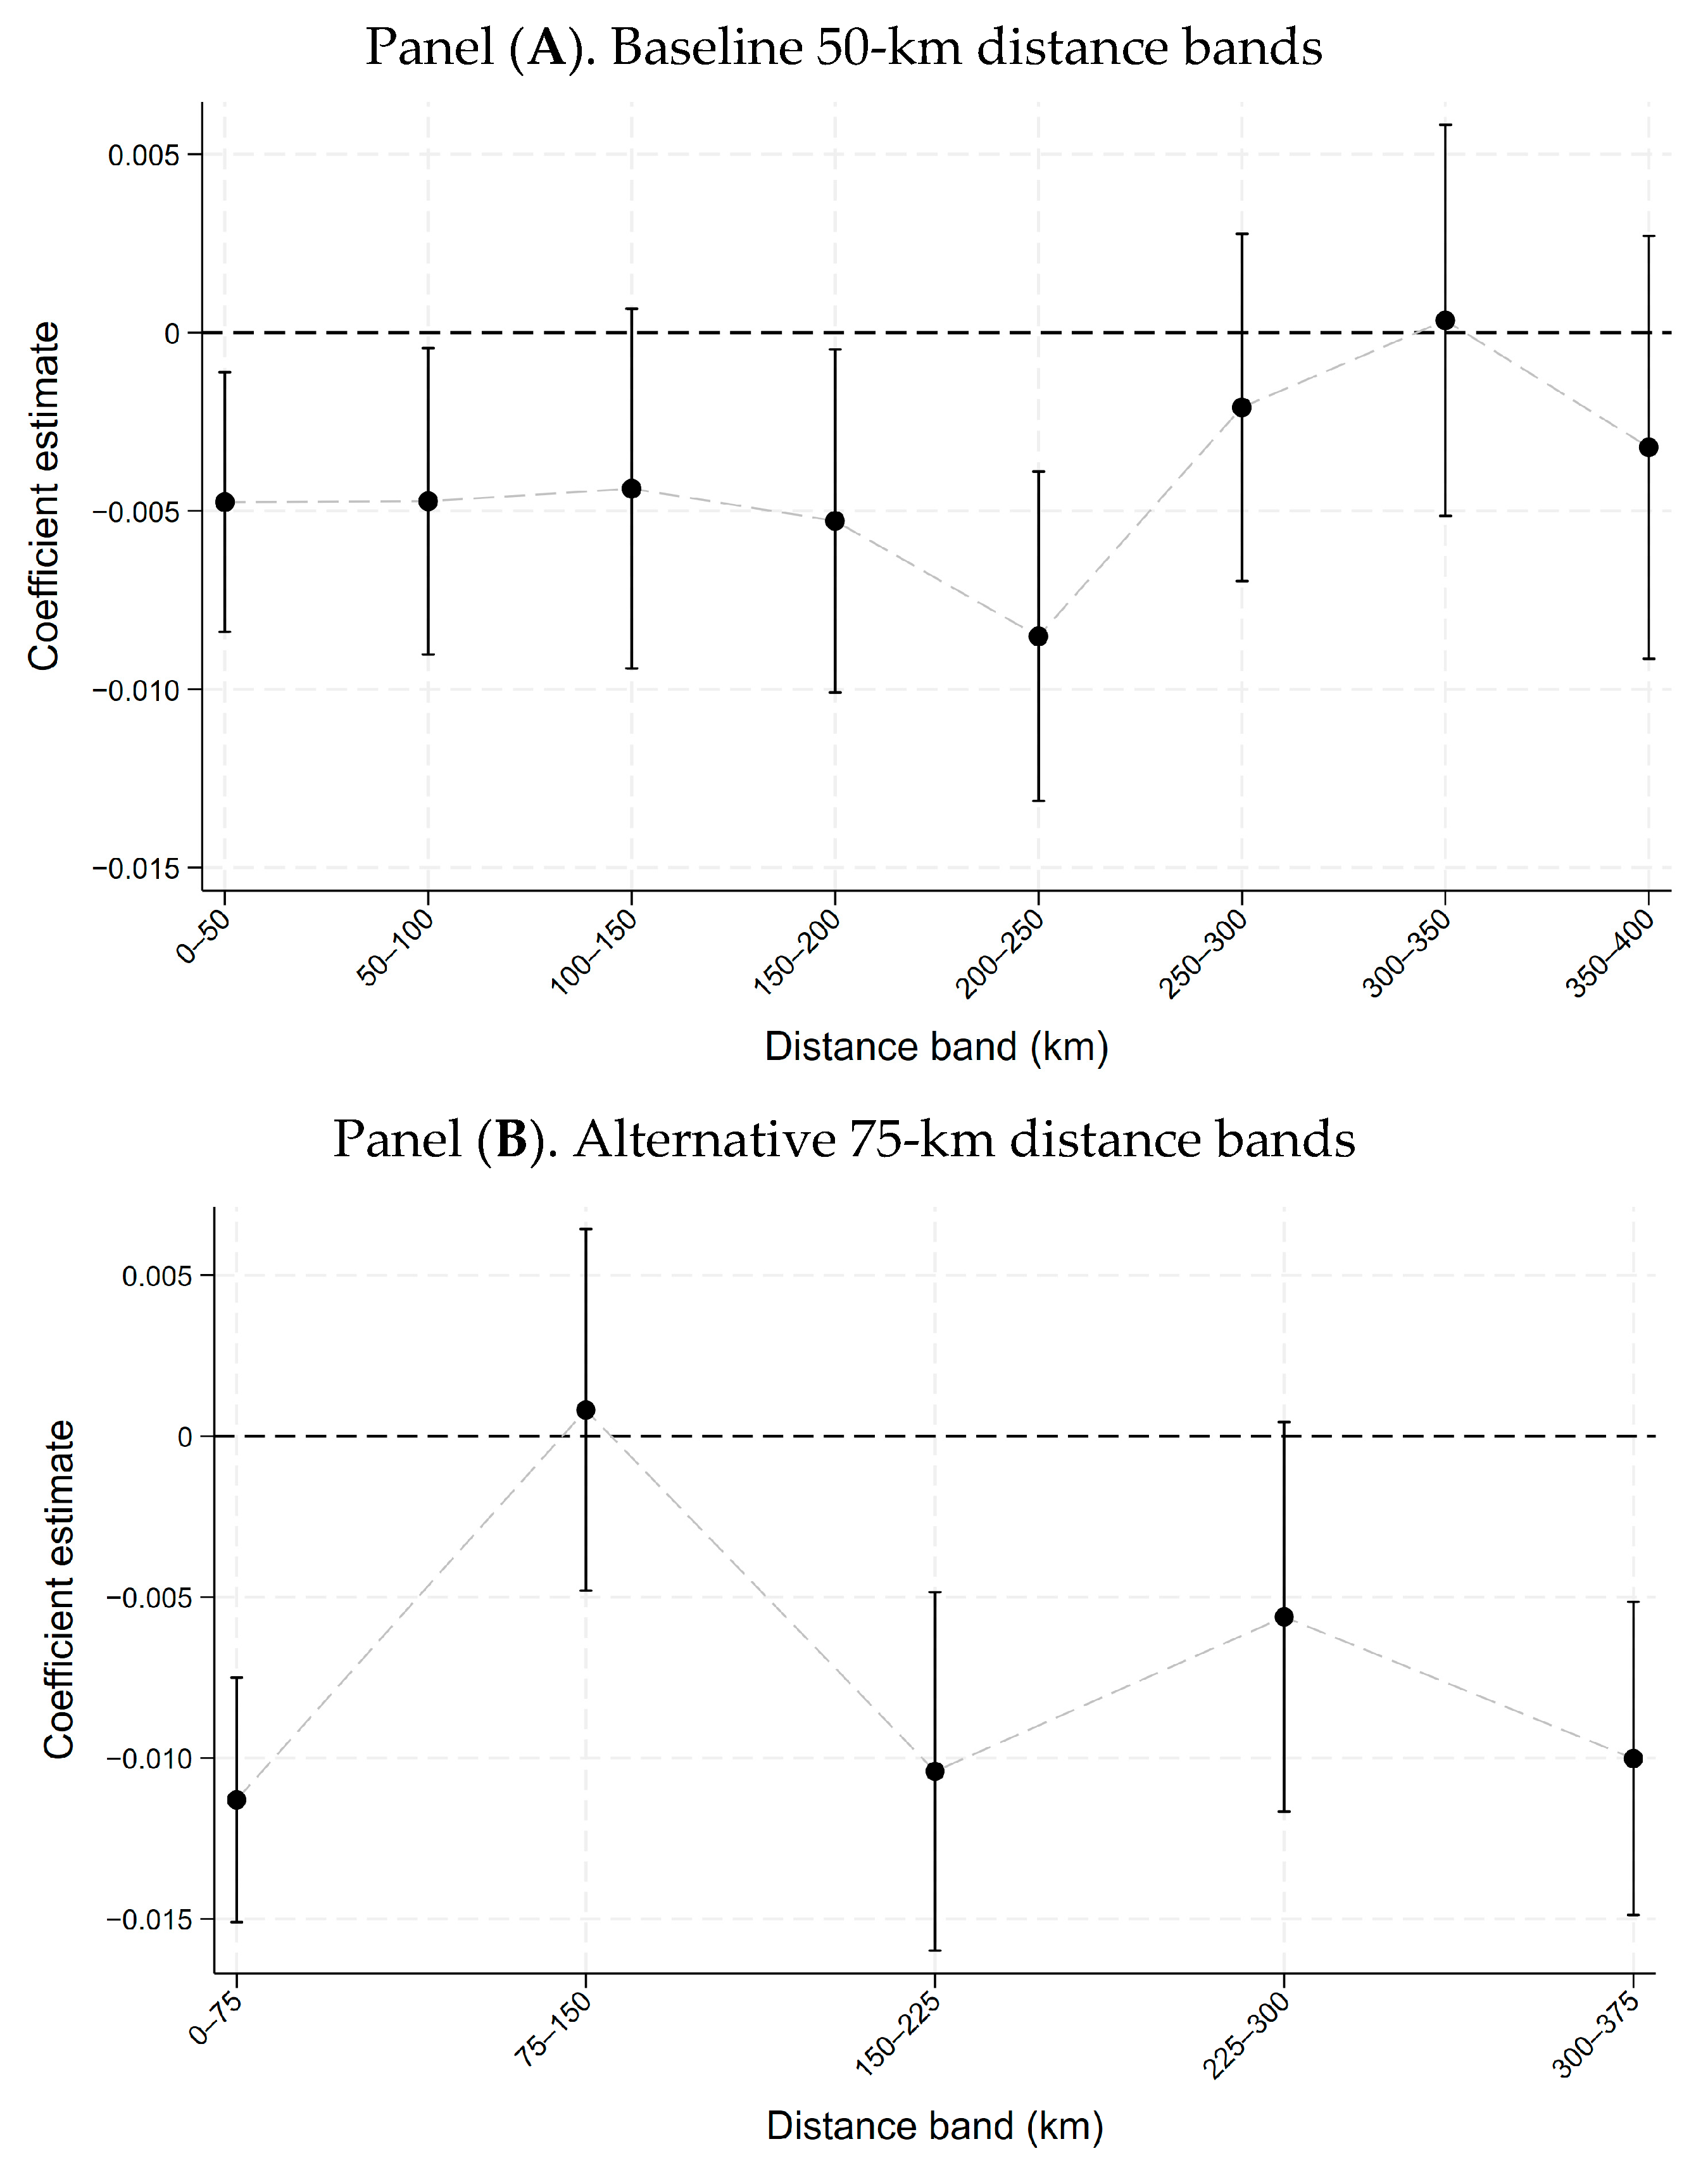

Disclaimer/Publisher’s Note: The statements, opinions and data contained in all publications are solely those of the individual author(s) and contributor(s) and not of MDPI and/or the editor(s). MDPI and/or the editor(s) disclaim responsibility for any injury to people or property resulting from any ideas, methods, instructions or products referred to in the content. |
© 2026 by the authors. Licensee MDPI, Basel, Switzerland. This article is an open access article distributed under the terms and conditions of the Creative Commons Attribution (CC BY) license.