


Abstract
Improving cultivated land use efficiency (CLUE) is a crucial pathway to solve China’s food security challenges. In recent years, the development of digital inclusive finance (DIF) has transformed the economic effects of input and output in the cultivated land utilization process. Employing Yangtze River Delta as the experimental area, which represents one of China’s most densely populated regions with the most acute arable land scarcity per capita, this study utilized a super-efficiency slacks-based measure (SBM) model that incorporated undesirable outputs to measure CLUE using a balanced panel data of 25 prefecture-level cities in the Yangtze River Delta from 2011 to 2023. Additionally, this study employed panel regression analysis combined with a mediation effect model to examine the impact of DIF on CLUE. The findings are as follows. (1) CLUE exhibits an upward trend throughout the study period, with significant improvements noted in the northwest regions, and evolves into a spatial distribution of “high in the northwest and low in the south.” (2) DIF effectively enhances CLUE, supported by extensive robustness tests. (3) Heterogeneity analysis reveals that the effect of DIF on CLUE varies systematically across contexts: it peaks in regions undergoing medium-level urbanization, remains most potent under extremely low credit availability, and is optimized by moderate bank outlet coverage. (4) Mechanism analysis demonstrates that the DIF positively influences CLUE by increasing fixed-asset investment in the primary industry. Based on these results, this study provides targeted policy recommendations for digital inclusive finance to serve the high-quality development of cultivated land utilization.
1. Introduction
Cultivated land serves as the cornerstone of national food security. With the acceleration of urbanization worldwide, cultivated land is confronting compounding stressors such as expropriation, degradation, and contamination in developed and developing countries [1]. Against this backdrop, cultivated land use efficiency (CLUE) has become a key indicator for evaluating whether agricultural production can generate higher economic output with fewer land and related inputs while operating under resource and environmental constraints. The challenge is particularly acute in China, where approximately 20% of the global population lives with only around 9% of global arable land. As urban expansion continues, improving CLUE is crucial for easing the tension between urban land demand and food security. China’s rapid urbanization therefore provides a salient setting to examine how economic development, including changes in access to finance, affects cultivated land use efficiency.
For decades, limited access to finance has constrained efficiency improvements in China’s agricultural sector [2]. Many smallholder farmers lack access to essential financial instruments, including risk mitigation tools and innovation financing, fundamentally restricting the adoption of precision agriculture technologies and optimal land use allocation [3]. Inclusive finance is defined as providing appropriate and effective financial services to all social strata and groups with financial needs at affordable costs, and digital inclusive finance (DIF) refers to the promotion of inclusive finance through digital technologies such as the internet, big data, blockchain, and artificial intelligence. DIF has significantly expanded the service scope, depth, and efficiency of traditional financial sectors, becoming the predominant financial paradigm in the digital era and fundamentally restructuring the dynamics of economic activity and land use interactions [4]. These changes in financial access can reshape production and investment decisions, which in turn affect land use and productivity. In this context, this paper examines whether DIF improves CLUE and through which channels. We focus on two testable mechanisms. First, by alleviating financing constraints and lowering transaction costs, DIF may enhance capital availability for agricultural production. This is hypothesized to facilitate fixed asset investment (FAI) in the primary industry, such as in agricultural machinery and irrigation facilities, thereby directly improving land productivity through capital deepening and technological embodiment. Second, DIF’s inclusive nature may boost farmers’ per capita disposable income (FPI) by broadening financing channels and supporting profitable operations, which could subsequently enable increased and more effective agricultural investment. Building on the framework of economic activity–land use interactions, this study empirically analyzed the impact of DIF on CLUE, with a particular focus on examining the distinct mediating roles of FAI (as a direct capital-input channel) and FPI (as an income-mediated investment channel) in this relationship.
The related literature covers the measurement of CLUE and its economic determinants. The notion of land use efficiency has long been a focal point of scholarly study. The basic evaluation system consists of economic output per land area unit [5]. This methodology, however, oversimplifies the multidimensional nature of land systems, neglecting their inherent spatial and socioecological complexities. To address these limitations, subsequent studies have developed advanced analytical frameworks rooted in land use theory, integrating spatially explicit techniques of data envelopment analysis (DEA) [6]. A key limitation of traditional DEA is its inadequate handing of undesirable outputs, such as pollutant emissions [7]. Building on the foundational work of Tone (2001) [8], who first introduced the slacks-based measure (SBM) model to address radial inefficiencies, Tone (2002) [9] further advanced conventional DEA methodology by integrating the super-efficiency SBM model, explicitly incorporating environmentally detrimental outputs including sulfur dioxide (SO2) and wastewater discharges, thereby extending the analytical framework to encompass land use efficiency assessment [10]. Building on this extension, the super-efficiency SBM model refines traditional SBM methodology by resolving both slack variable biases and radial measurement inaccuracies inherent in conventional DEA approaches. Numerous studies have applied the super-efficiency SBM model as the predominant approach for assessing diverse land use efficiency challenges, including but not limited to urban green land use efficiency [11], carbon emission efficiency of land use [12], and industrial land use efficiency [13]. The most relative studies are Ke et al. (2023)’s [14] and Kuang et al. (2020)’s [15] research demonstrating the efficacy of the super-efficiency SBM model in quantifying cultivated land use efficiency with non-uniformity in study area demarcation.
Regarding the determinants of CLUE, a body of research has specifically assessed its relationship with ecosystem services [16], landscape pattern dynamics [17], road network density [18], and urbanization [19]. However, economic and financial drivers have received relatively limited attention in this literature. While no studies have specifically examined economic factors’ impact on CLUE, existing research incorporating “the ratio of primary sector production to GDP” as an input indicator has demonstrated its statistically significant influence [20]. In parallel, studies examining DIF impacts have shifted focus to agricultural resilience [21], agricultural green economic efficiency [3], urban ecological resilience [22], rural revitalization [23] at the macrolevel, and farmers’ income [24], agroecological efficiency [25], carbon transformation [26], and risk management [27] at the microlevel. By contrast, the role of DIF in land use efficiency, and in particular in CLUE, remains underexplored. This gap motivated our analysis of how DIF affects CLUE.
More importantly, the Yangtze River Delta urban agglomeration in China is currently one of the regions with the highest population density and the lowest per capita cultivated land, which means it faces the most severe pressures on food security and cultivated land ecology. Notably, it also represents China’s most dynamic economic growth area and most intensive urbanization, recorded an average GDP growth rate of 6.2% during Q1 to Q3 2024, significantly exceeding the national urban average of 5.5%. Thus, the impact of DIF on CLUE is expected to be most prominent in this area, rendering it both academically significant and practically relevant and typical reference for developing countries.
Against this backdrop, we summarize our main findings as follows. (1) Employing the super-efficiency SBM model to analyze panel data from the Yangtze River Delta urban agglomeration in China (2011−2023), the measured CLUE exhibits a spatial distribution characterized as “higher in the northwest and lower in the southeast,” with a convergent trend in regional efficiency disparities over time. (2) DIF is positively and statistically significantly associated with CLUE, a conclusion that remains robust in the face of a series of sensitivity checks. (3) Based on the heterogeneity analysis, DIF exerts the most substantial positive impact on CLUE in regions characterized by lower urbanization, tighter financing constraints, and a moderate, yet supportive physical bank branch network. (4) Mechanism analysis indicates that fixed asset investment (FAI) in the primary industry plays a pivotal mediating role in this relationship. As posited, DIF restructures the economic effects of input–output systems. This transformation is channeled through two micro-mechanisms: optimizing factor allocation via FAI and enhancing factor returns via FPI. Consequently, the hypotheses delineate how these pathways drive efficiency gains.
Our study contributes to the literature in three ways. First, this paper helps connect research in land economics with the growing literature on digital finance. While prior research has examined the effects of DIF on macrolevel outcomes [28] such as agricultural green economic efficiency [3] and agricultural resilience [21], as well as microlevel outcomes including farmers’ income [24] and agroecological efficiency. Its specific impact on land use efficiency remains an underexplored area. Furthermore, although some studies have incorporated the “share of primary industry output in GDP” as a factor influencing CLUE [20], the transmission pathway from digital finance to land resource allocation efficiency has received scant attention. By constructing the theoretical chain of “digital finance–capital deepening–cultivated land efficiency,” this study establishes a direct link at the intersection of land economics and digital finance.
Second, we provide evidence on the transmission channels through which DIF affects CLUE. In terms of theoretical elaboration, this study identifies and confirms the central mediating role of fixed asset investment (FAI) in the primary industry in the process through which DIF influences CLUE, highlighting “capital substitution” rather than “income growth” as the dominant mechanism. This finding not only enriches the theoretical understanding of the economic impacts of DIF but also provides a novel theoretical underpinning for understanding agricultural modernization pathways in the digital era, namely leveraging digital finance to promote intensive land use through technology-embedded capital investment.
Third, we document meaningful heterogeneity in the DIF–CLUE relationship. The estimated association between DIF and CLUE is stronger in less urbanized regions. It weakens as urbanization increases, suggesting diminishing marginal gains from DIF in more urban settings. We also find that the DIF–CLUE relationship varies with local financial development. The effect is largest in low-finance areas and smaller in regions with more developed financial systems. Finally, the effect of DIF is strongest when the density of physical bank branches is moderate. It becomes weaker when branch coverage is either sparse or very dense, which is consistent with diminishing marginal returns. Taken together, the heterogeneity patterns offer important policy implications by indicating where improvements in digital finance are most likely to translate into gains in cultivated land use efficiency.
2. Theoretical Analysis and Research Hypotheses
2.1. Theoretical Foundations
The optimization of CLUE is fundamentally governed by the law of diminishing returns, which posits that as variable inputs increase on a fixed plot of land, the marginal increase in output will eventually decline [29]. In the context of modern agriculture, overcoming this constraint requires not just physical inputs but also capital deepening and technological progress.
However, the agricultural sector historically suffers from severe financial exclusion due to information asymmetry and high transaction costs, leading to suboptimal resource allocation [30]. Traditional financial geography suggests that capital flows preferentially to urban and industrial centers, leaving rural areas in a state of “capital starvation” [31]. To break this deadlock, induced innovation theory [32] provides a critical lens: changes in relative factor endowments, such as the scarcity of land versus abundance of capital, inducing the development of new technologies and institutional arrangements. In this framework, DIF emerges as an institutional innovation designed to alter the relative price of capital, making it accessible to smallholders and thereby inducing efficiency gains in land use.
Recent empirical evidence strongly supports this theoretical linkage. For instance, utilizing provincial panel data, Guo et al. (2024) [33] confirmed that digital inclusive finance significantly enhances agricultural green development by optimizing resource allocation. Complementing this, a contemporaneous study by Chang et al. (2026) [34] further unpacked the underlying mechanisms, revealing that DIF drives agricultural sustainability through two synergistic pathways: green technology adoption and agricultural green transformation. Furthermore, Liu and Pu (2025) [35] demonstrated that the spatial spillover effects of the digital economy, closely related to DIF, substantially improve agricultural carbon emission performance, highlighting the macrolevel ecological benefits of digitization.
2.2. The Effects of DIF on CLUE
The essence of CLUE lies in maximizing agricultural output while minimizing factor inputs under finite arable land constraints [36]. Over the long term, capital scarcity in the agricultural sector has critically constrained the growth of agricultural total productivity [37]. This study identified three core channels through which DIF is posited to enhance CLUE: the financing accessibility channel, the financing efficiency channel, and the signal guidance channel.
First, DIF broadens the financing accessibility channel by mitigating the systemic exclusion of smallholder farmers inherent in traditional credit systems. This accessibility mechanism is empirically validated by recent studies. Cao and Wang (2024) [38] found that digital finance significantly boosts agricultural output by lowering the cost of capital and expanding credit scale. Moreover, Su et al. (2025) [39] showed that in the context of agricultural transformation, digital inclusive finance specifically supports the development of new agricultural business entities by alleviating liquidity constraints. By lowering credit thresholds and offering guarantee mechanisms, DIF improves farmers’ access to capital, enabling investment in productive agricultural inputs [40].
Second, DIF enhances the financing efficiency channel through streamlined digital platforms that accelerate loan disbursement and reduce transaction costs, thereby alleviating credit constraints and improving the timeliness of financial support [41]. Third, DIF strengthens the signal guidance channel by facilitating real-time market information flows and directing capital toward innovative agricultural technologies, which accelerates technology adoption and promotes structural upgrading [42]. Moreover, DIF contributes to the reduction in undesirable agricultural outputs [43], a factor inversely related to CLUE, thereby providing an additional pathway for efficiency gains. Collectively, these interconnected channels substantiate the proposition that DIF exerts a positive influence on CLUE, leading to the formulation of the following hypothesis:
H1.
DIF positively impacts CLUE.
2.3. Mediating Mechanism Analysis of the Impact of DIF on CLUE
As noted earlier, while DIF provides objective conditions for improving CLUE through its digital and inclusive features, the specific mediating pathways through which it operates remain underexplored in the literature. Building on the proposed three channels through which DIF affects CLUE—namely financing accessibility, financing efficiency, and signal guidance—this study posits that these channels operate primarily through two mediating variables: fixed asset investment (FAI) in the primary industry and farmers’ per capita disposable income (FPI).
First, through the financing accessibility channel, DIF expands financial inclusion by lowering credit thresholds and offering guarantee services, thereby enabling farmers to access capital for productive agricultural investments. This improved accessibility directly supports fixed asset investments in agricultural machinery, irrigation infrastructure, and soil amelioration, thereby increasing FAI [42]. Simultaneously, enhanced access to credit also facilitates income-generating activities, contributing to higher FPI [43]. The pivotal role of FAI as a mediator is further substantiated by recent findings. Ref. [42] revealed that digital financial inclusion promotes high-quality agricultural development precisely through the mediating path of land circulation and fixed asset investment. Additionally, Xu et al. (2025) [44] emphasized that digital finance enhances agricultural green total factor productivity by facilitating the adoption of green technologies, which requires substantial capital deepening.
Second, through the financing efficiency channel, DIF accelerates fund disbursement and reduces transaction costs via digital lending platforms, making credit timelier and more affordable. This efficiency gain encourages the acquisition of advanced agricultural inputs and technologies, thereby boosting FAI, while also improving farmers’ net returns and thus raising FPI [22]. Third, through the signal guidance channel, DIF facilitates real-time market information flows and directs financial resources toward innovative agricultural technologies. This signaling function helps farmers identify high-return investment opportunities, promoting technology-adopting fixed asset investment (FAI) and improving agricultural productivity and profitability, which in turn elevates FPI [21].
In essence, FAI serves as a proxy for capital input, capturing the capital-deepening effect of DIF through the three channels outlined above, which strengthens the physical and technological foundations of agricultural systems [42]. Conversely, FPI reflects the economic outcome of such improvements, capturing the income effect that enhances farmers’ capacity to invest in land-enhancing technologies and practices [24]. Ultimately, the facilitative effects of DIF on CLUE manifest as both enhanced input intensity per land area (reflected in rising FAI) and improved output yield per unit area (reflected in growing FPI). Therefore, we hypothesize:
H2a.
DIF stimulates fixed asset investment (FAI), which contributes to improving CLUE.
H2b.
DIF improves CLUE through farmers’ per capita disposable income (FPI).
3. Model Specification and Variable Description
3.1. Model Specification
3.1.1. Super-Efficiency SBM Model
The super-efficiency SBM model containing non-desired output was employed to calculate the CLUE in this study, which has been widely adopted by existing studies in the field of land use efficiency measurement [1]. Hong et al. (2024) [45] evaluated all inputs and outputs of cultivated land, in which outputs consist of desired outputs and non-desired outputs:
where denotes the cultivated land use efficiency of a city; represents the decision unit, ; represents the input variable, ; is the desired output variable, ; is the non-desired output variable, ; encompass the input variable, the desired output and the non-desired output; stand for the vector of inputs, desired outputs, and non-desired outputs for the decision unit; are the vector of inputs, desired outputs and the non-desired output matrices; and is the weight vector.
3.1.2. Panel Model
To examine the relationship between DIF and CLUE, this study adopted a two-way fixed-effect (FE) model (Equation (2)) with both city-level individual fixed effects and year-level time fixed effects included to control for unobserved heterogeneity. Given that cultivated land use performance is deeply affected by long-term geographic conditions and policy inertia, this specification effectively absorbs time-invariant regional heterogeneity such as geographic conditions and resource endowments and region-invariant time-varying shocks such as macroeconomic policies and institutional changes, addressing the core sources of omitted-variable bias:
where signifies the CLUE of city in year , represents the digital financial inclusion index of city in year , is the estimated coefficient corresponding to DIF, encompasses a set of control variables, represents the number of control variables, is the coefficient of the control variable, is a constant term, stands for city fixed effect, stands for time fixed effect, and is a random error term.
3.1.3. Mediated-Effect Model
A mediated-effect model was adopted in this study to examine the mediation mechanism of DIF impact on CLUE, which is widely used to explore the mechanism variables of explanatory variables affecting explained variables [24], accounting for both time and individual fixed effects:
where in Equation (3), represents the mechanism variable, the value of coefficient indicates the effect of DIF on the mechanism variable, and is the coefficient of the control variable. In Equation (4), stands for the correction coefficient in the case of considering the mediated effect, stands for the coefficient of the mechanism variable in the case of considering the mediated effect, and is the coefficient of the control variable. In Equations (3) and (4), and are constant terms, and are individual fixed effects, and are time fixed effects, and and are random error terms.
3.2. Variables
3.2.1. Explained Variable
CLUE served as the explained variable in this study. With the existing CLUE evaluation framework and the incorporation of carbon emissions as undesirable outputs, our CLUE evaluation index system is proposed in Table 1, which follows the super-efficiency SBM model (Equation (1)). Since direct carbon emission data at the prefecture-level are unavailable, this paper adopts the input-factor coefficient method (emission factor method) recommended by the IPCC (2006) [46] and applied by Xu et al. (2024) [47] in Nature Food for China’s agricultural emission accounting. Details of each carbon source and its corresponding emission factor are provided in Appendix A Table A1. The calculation formula is:
where denotes total agricultural carbon emissions (tCO2-eq); is the physical input of the i-th carbon source; and represents the corresponding carbon emission coefficient. Five major carbon sources are selected: chemical fertilizers, pesticides, agricultural plastic films, agricultural machinery diesel, and effective irrigated area. The input factors are derived from prefecture-level statistical yearbooks and official agricultural databases. The accounting framework follows the IPCC (2006) [46] Guidelines for National Greenhouse Gas Inventories, while specific coefficients are calibrated to China’s agricultural conditions based on authoritative domestic studies [48,49]. This method is widely used for long-term panel estimation of agricultural carbon emissions at the prefecture level, with good data availability and controllable errors ensuring scientific validity and reliability [47,50].
Table 1.
The multi-tiered structure of the CLUE (comprehensive land use efficiency) indicator system, comprising the criterion layer, factor layer, and indicator layer.
3.2.2. Explanatory Variables
Given the pivotal role of the core explanatory variable, we clearly define the origins, measurement, and dimensions of DIF in this section. The concept of DIF originated from the World Bank’s Financial Inclusion framework in 2010, emphasizing technology-driven solutions to expand financial access. In China, the term was formally operationalized by Peking University’s Digital Finance Research Center in 2016 as “a new financial paradigm leveraging digital technologies to achieve broad coverage, low-cost, and sustainable services” [51]. This study employed the Peking University Digital Inclusive Finance Index as the core explanatory variable, which characterizes the comprehensive level of DIF development in each city throughout the study period (2011−2023). Substitute explanatory variables include the DIF classification index as shown in Table 2. In robustness checks, substitute explanatory variables serve as alternative measures to the DIF Index, verifying the stability of our hypotheses while simultaneously enabling analysis of how distinct DIF categorical characteristics influence CLUE through differentiated pathways. Specifically, the width of digital inclusive finance coverage (COV) reflects the accessibility dimension of DIF services among rural populations, capturing the extent to which users are covered by digital financial tools; the depth of digital inclusive finance use (DEP) measures the intensity of DIF services utilized in agricultural production systems, including payment, credit, and investment activities; the digitization of digital inclusive financial inclusion (DIG) reflects the technological sophistication of DIF services, where higher values indicate greater operational efficiency and user accessibility in digital financial ecosystems. In the panel model, we ran regression analyses by systematically substituting these explanatory variables for the core explanatory variable, thereby providing a three-dimensional examination of the structural characteristics of DIF’s impact on CLUE.
Table 2.
Summary statistics for key variables. CLUE is the comprehensive land use efficiency: DIF is the core explanatory variables; COV, DEP, and DIG are substitute explanatory variables; UGR, CII, MPD are city-level control variables, and FAI and FPI are mechanism variables.
3.2.3. Control Variables
Following Tan et al. (2024) [52] and Jiang (2024) [53], we selected urbanization growth rate (UGR), cropland irrigation index (CII), machinery power density (MPD) as control variables, as shown in Appendix A Table A2. UGR captures the overall development level of a city, the CII represents the level of water resource utilization, and MPD represents the degree of farm machinery inputs utilized by the arable land [54]. In the panel data analysis framework, we adopted a two-way fixed-effect (FE) model. Specifically, within the FE model, city-level individual fixed effects and year-level time fixed effects were included to control for unobserved heterogeneity.
3.2.4. Mechanism Variables
Based on the theoretical analysis and research hypotheses, the facilitative effects of DIF ultimately manifest as enhancing input intensity per land area: directly reflected in increasing “fixed asset investment in primary industry” and improving output yield per unit area directly, reflected by “farmer’s per capita disposable income.” The mediating effects of fixed asset input (FAI) in primary industry and farmers’ per capita disposable income (FPI) were tested separately by the mediated-effect model (Equations (4) and (5)).
3.3. Data Resource
Given the completeness and accessibility of available data, the observation period of this study spanned 2011−2023. The sample covered 25 prefecture-level cities in the Yangtze River Delta, including 13 prefecture-level cities in Jiangsu province and 11 prefecture-level cities in Zhejiang and Shanghai municipality. Data for measuring CLUE in this paper were obtained from the China City Statistical Yearbook and the EPS data platform, wind information terminal, and local statistical yearbooks. Data for measuring the DIF were sourced from the Digital Finance Research Center of Peking University. This index evaluates DIF services along the dimensions of coverage breadth, usage depth, and digital service support, and has been widely adopted in existing studies in the field of digital inclusive finance research [51]. In cases of missing specific indicators, gaps were addressed through city statistical bulletins or linear interpolation. The final balanced panel dataset contained 325 city-year observations (25 cities × 13 years). All variable values in this study were normalized using the min–max method.
This eliminates dimensional differences and scales all variables into the range of [0, 1].
3.3.1. Stationarity Test
To ensure the validity of the regression results and avoid potential spurious regression issues, this study further conducted LLC and Fisher–ADF panel unit root tests on all variables. The results showed that the core explanatory variable DIF and most control variables were stationary at the level form. For a small number of variables found to be non-stationary at the level form, including CLUE, FAI, FPI, and COV, first differencing was applied. After differencing, all variables passed the stationarity test at the 5% significance level, confirming that they were suitable for regression analysis. The detailed results of the stationarity tests are reported in Appendix A Table A3.
3.3.2. Multicollinearity Check
To detect potential multicollinearity, we first examined the Pearson correlation matrix for all regressors, as shown in Appendix A Table A4. The absolute pairwise correlation coefficients were all below 0.70, suggesting the absence of severe bivariate collinearity. Furthermore, we calculated the variance inflation factors (VIFs) for the baseline two-way fixed-effect model. All VIF values were below 12.88, with the mean VIF = 6.26 well beneath the conventional threshold of 5–10. These results confirm that multicollinearity is unlikely to have biased the estimated coefficients.
4. Results
4.1. Spatial–Temporal Evolution Description of CLUE
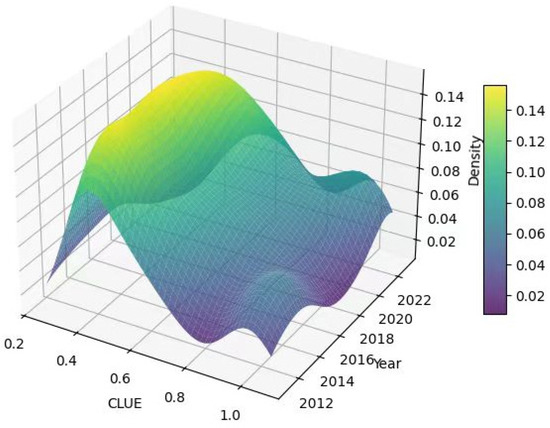
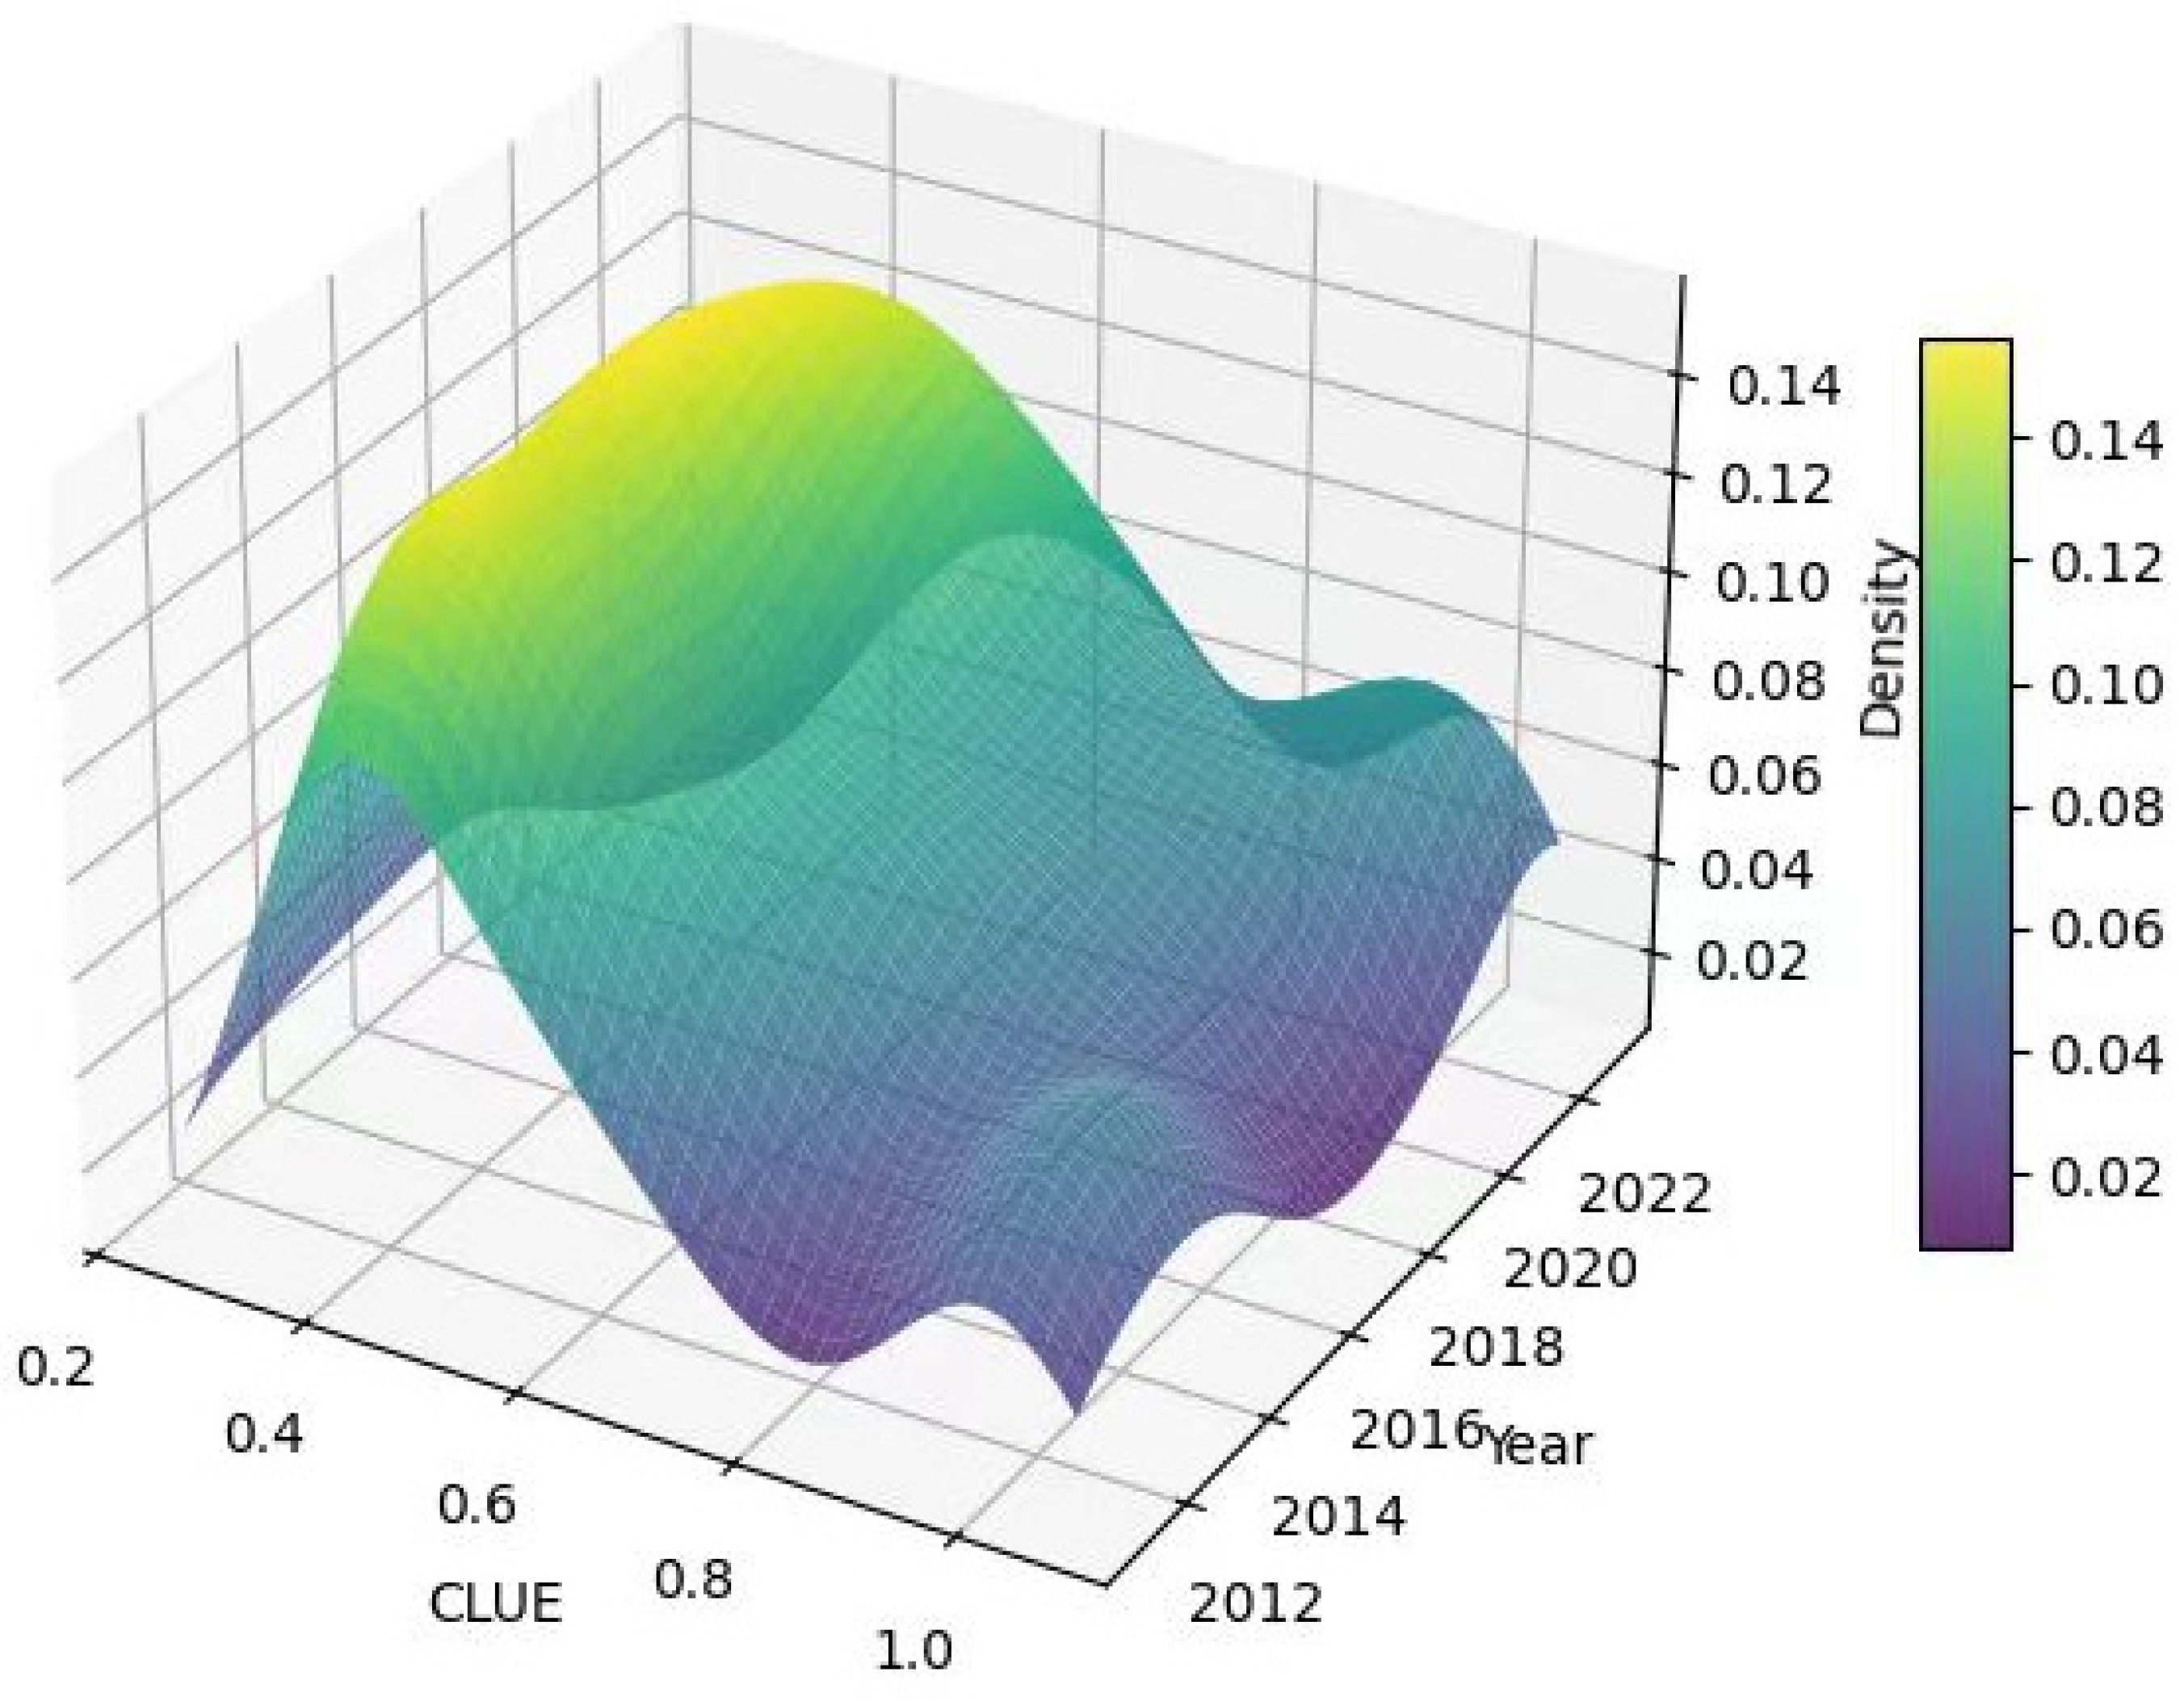
Figure 1 presents a 3D kernel density plot of CLUE for YRD urban agglomeration from 2011 to 2023, reflecting the temporal evolution of CLUE values and revealing three main characteristics. First, kernel density estimation reveals a rightward shift in the distribution’s central tendency toward higher CLUE values from 2011 to 2023. This secular trend signifies sustained improvement in CLUE across the study region, attributable to synergistic effects between agricultural modernization and DIF penetration. Second, the kernel density distribution exhibits dynamic changes in both peak height and width, with the main peak narrowing progressively over time. These patterns indicate an increasing spatial concentration of CLUE values across cities and a gradual reduction in inter-city disparities, suggesting a trend toward more balanced regional development in CLUE. This spatial convergence may be associated with regional coordination policies, the expanding reach of DIF services, and reduced gaps in agricultural investment and technology adoption. Third, regarding polarization characteristics, the kernel density distribution during 2011−2023 primarily exhibits a unimodal structure, with only occasional and non-prominent bimodal tendencies. This pattern suggests the absence of significant multilevel divergence in CLUE across the study region. Rather, it demonstrates synchronized improvements in CLUE, indicating relatively coordinated regional development. This convergence likely stems from the region’s robust economic foundation and advanced digital financial ecosystem, which have facilitated widespread access to technological innovations and policy benefits, thereby enabling parallel enhancements in CLUE across most cities.
Figure 1.
Kernel density distribution of CLUE in sample cities from 2011 to 2023.
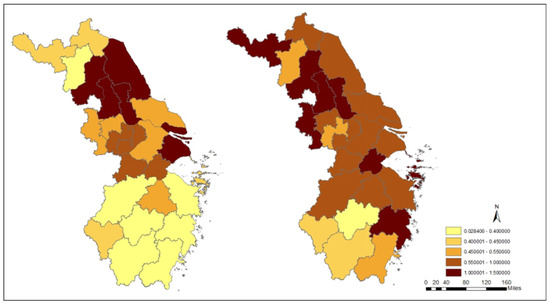
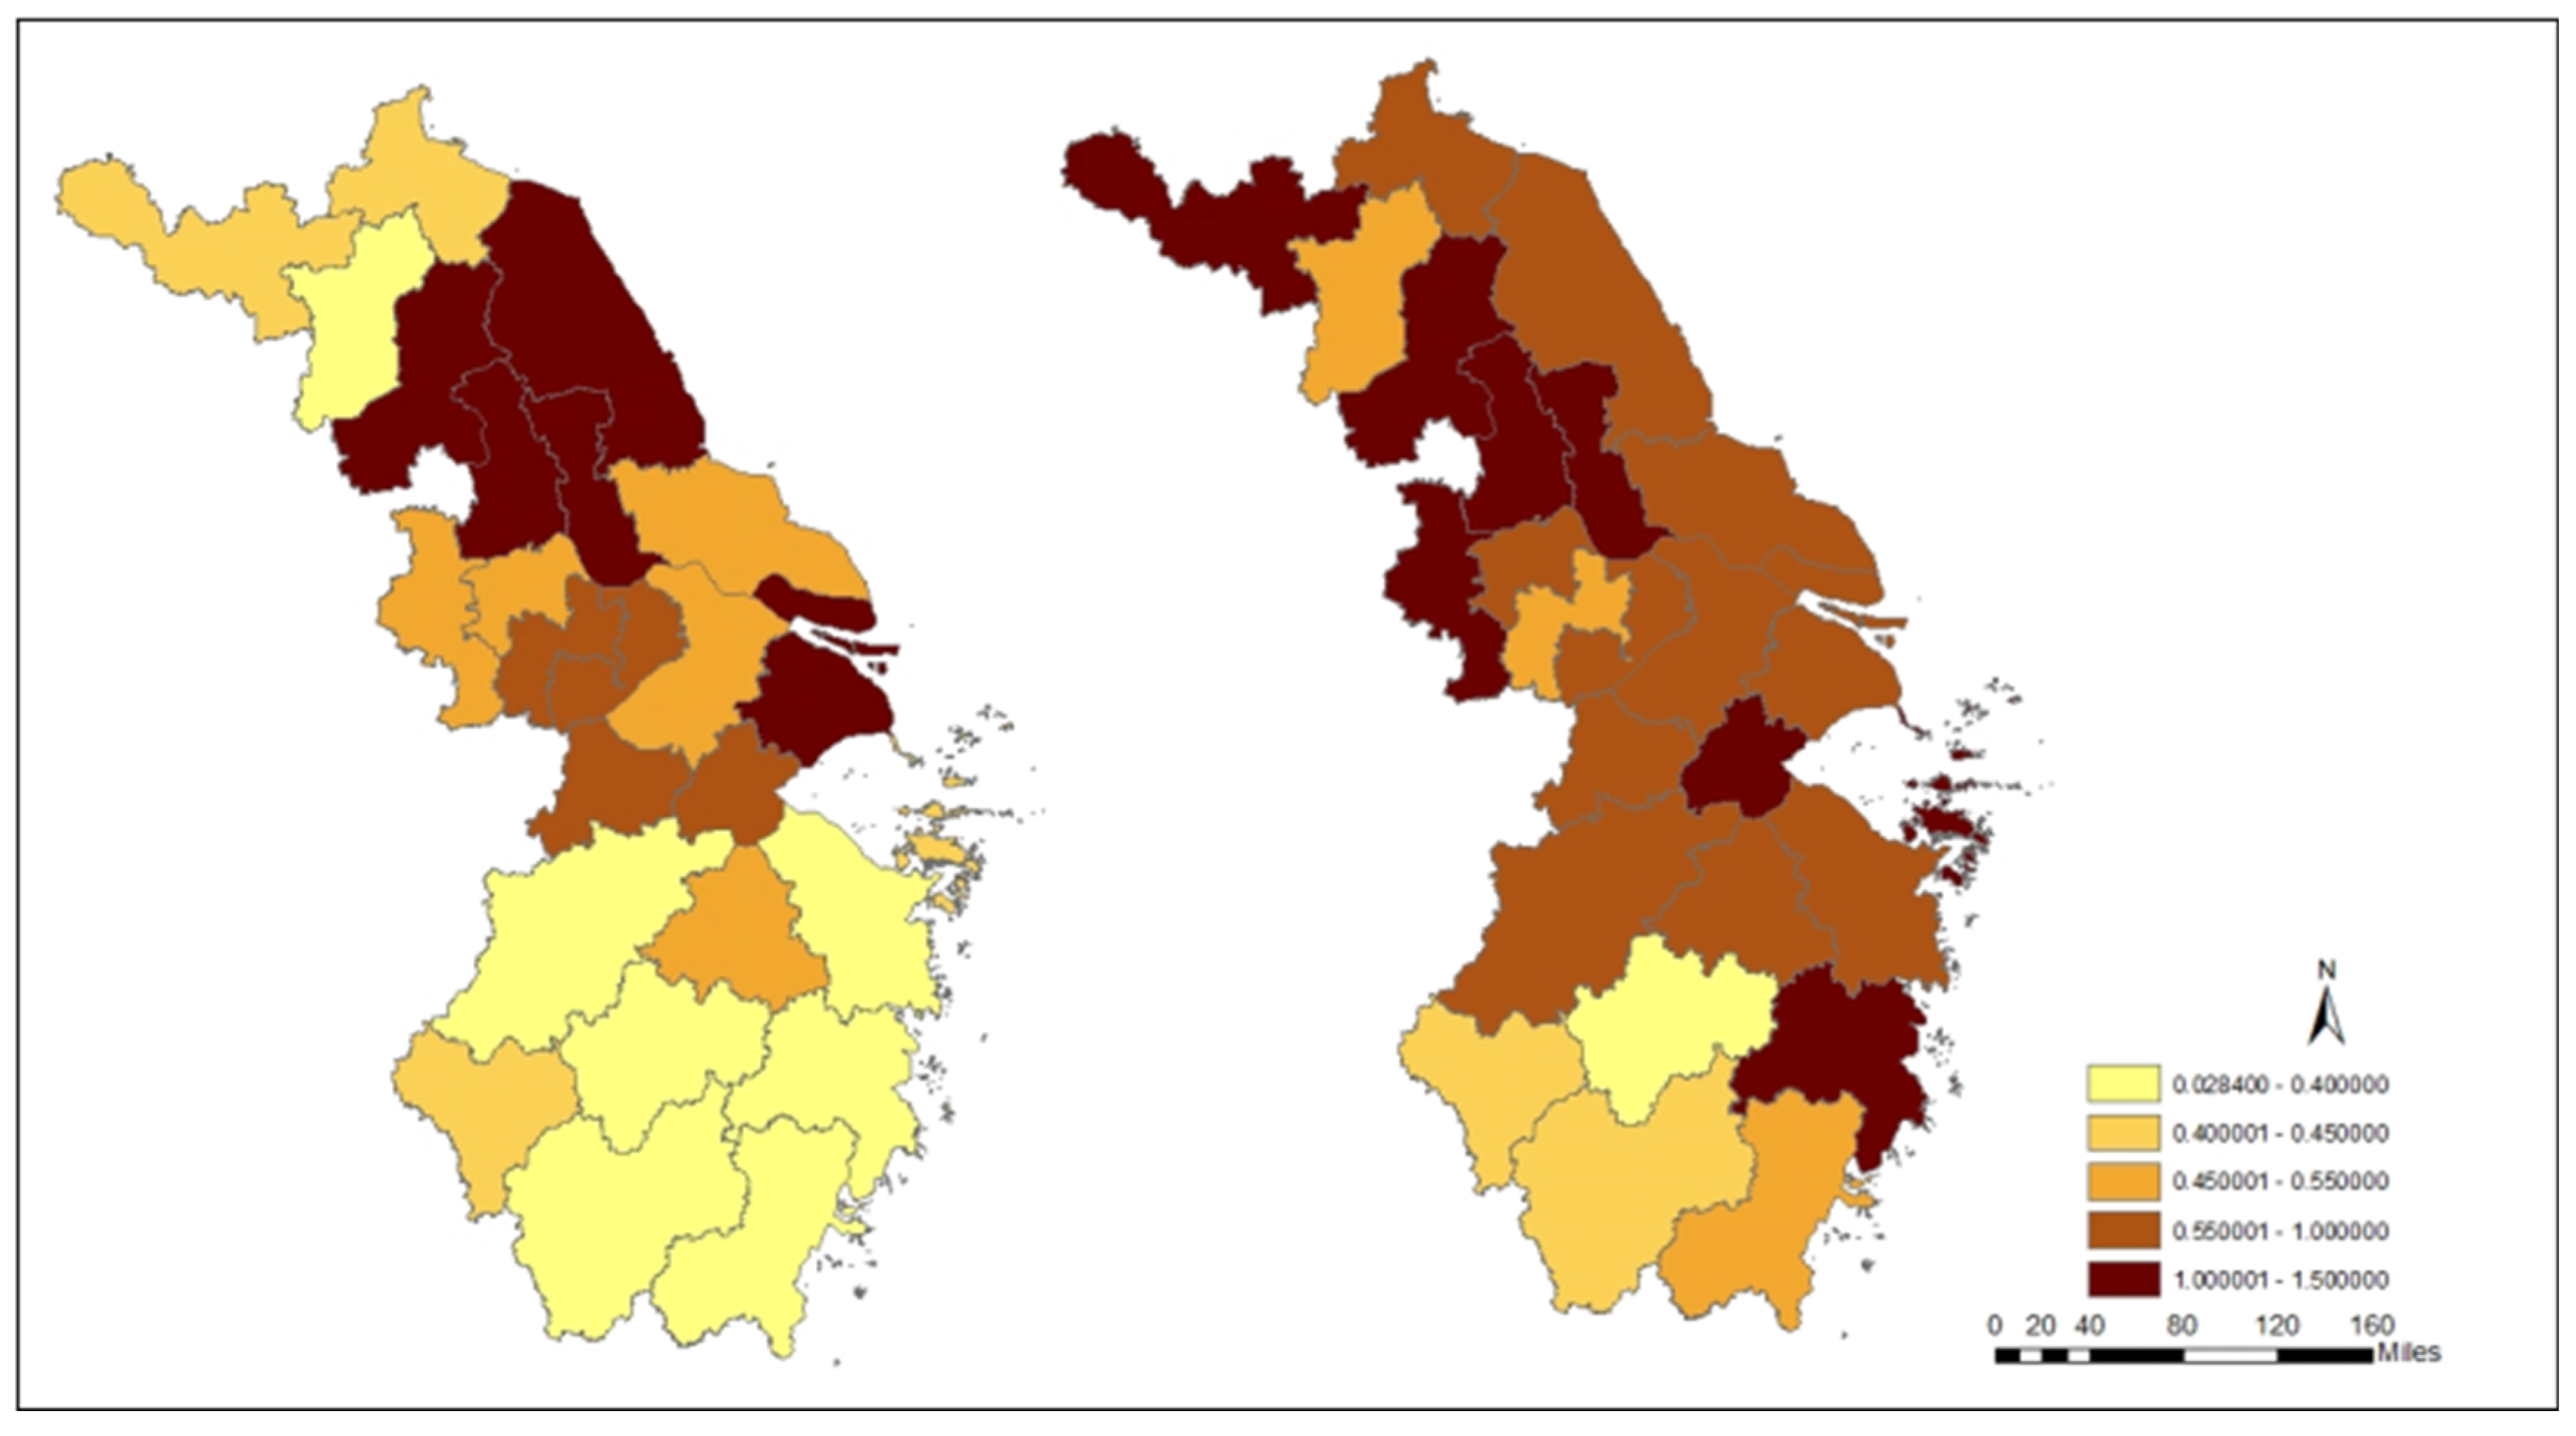
Figure 2 illustrates the spatial distribution pattern of cultivated land use efficiency in China’s Yangtze River Delta (YRD) urban agglomeration in 2011 and 2023, which reflects the spatial distribution and its temporal dynamics. From 2011 to 2023, CLUE exhibited an upward trend, with an overall spatial evolution presenting significant regularity. It displays three main characteristics. First, cities in the northwest and southeast of the study area have witnessed relatively high growth rates in CLUE, while those cities in the northeast and southwest have experienced relatively low growth rates. Second, spatially contiguous declines in cultivated land use efficiency are observed across central municipalities exhibiting a distinct longitudinal clustering pattern, including Shanghai, Changzhou, and Wuxi, with a decline rate of 34.21%, 13.50%, and 11.15% respectively. Third, Taizhou (167.45%), Xuzhou (148.09%), and Zhoushan (146.38%) demonstrate the most substantial gains in CLUE, representing regional maxima that significantly exceed the study area’s mean improvement rate. Overall, YRD’s regional CLUE has exhibited a consistent year-on-year increase from 2011 to 2023, despite exhibiting heterogeneous growth and decline patterns across municipalities. In 2011, CLUE exhibits a spatial distribution characterized by “high in the north and low in the south.” Since 2011, the high-value areas of CLUE have shifted to the northwest, with CLUE underwent rapid growth in Suqian and Xuzhou, while there was a decline in Yancheng. By 2023, the spatial distribution characteristics of CLUE have evolved into “high in the northwest and low in the south.”
Figure 2.
Spatial distribution of CLUE (2011 vs. 2023).
4.2. Results of the Panel Model
4.2.1. Regression Results
The results are shown in Table 3. We adopted a two-way fixed-effect model for panel data analysis. As shown in Column (1) of Table 3, without any control variables, the coefficient of the DIF index is 0.143, with a t-statistic of 2.219 and a p-value of 0.000. This indicates that in the absence of control variables, DIF has a statistically significant positive impact on CLUE at the 1% significance level. After including control variables in Column (2), the coefficient of the DIF index increases to 0.250, accompanied by a t-statistic of 3.428 and a p-value of 0.000, which is significant at the 1% level. This provides preliminary empirical evidence supporting H1.
Table 3.
Regression results. Column (1) reports the baseline regression without control variables; column (2) adds control variables. Both specifications include city and year fixed effects. Robust-statistics are reported in parentheses.
4.2.2. Robustness Test
To implement robustness checks, we substituted the aggregate DIF index with its three sub-dimensional indicators as alternative core explanatory variables. This subdivision enabled us to identify heterogeneous marginal effects across different dimensions of digital inclusive finance on CLUE. As documented in Table 4, the coefficient of COV (inclusive coverage) is 0.307 and statistically significant at the 1% level; the coefficient of DEP (usage depth) is 0.239 with significance at the 1% level; and the coefficient of DIG (digitization degree) stands at 0.204 and also passes the 1% significance test. All three subdivision indicators exert significantly positive impacts on CLUE, which is consistent with the baseline regression conclusion of overall DIF, hence further validating Hypothesis 1.
Table 4.
Robustness tests: Column (1) shows the baseline regression of CLUE on COV; column (2) replaces the core explanatory variable with DEP; and column (3) further replaces it with DIG, while control variables UGR, CII, and MPD are included in all columns.
Among the three dimensions, COV exhibits the largest promoting effect on CLUE, followed by DEP and DIG in descending order. Such empirical evidence suggests digital inclusive finance improves cultivated land utilization efficiency dominantly via its inclusive coverage channel: expanded financial service accessibility effectively relieves smallholder farmers’ financing constraints, unlocks productive investment capacity in agricultural land management, and accordingly lifts CLUE, especially in underbanked rural areas with severe financial exclusion. In contrast, DIG generates the weakest positive marginal contribution toward CLUE, which implies two plausible underlying causes: either the current integration progress between digital technology and intensive farming production remains insufficient or rural agricultural financial products fail to fully exploit fintech’s digital dividend. This result leaves room for future research to explore targeted optimization paths for digital finance to better empower cultivated land productivity improvement.
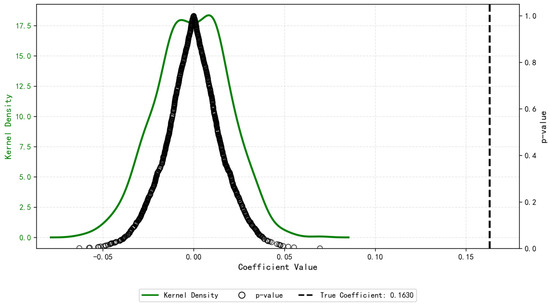
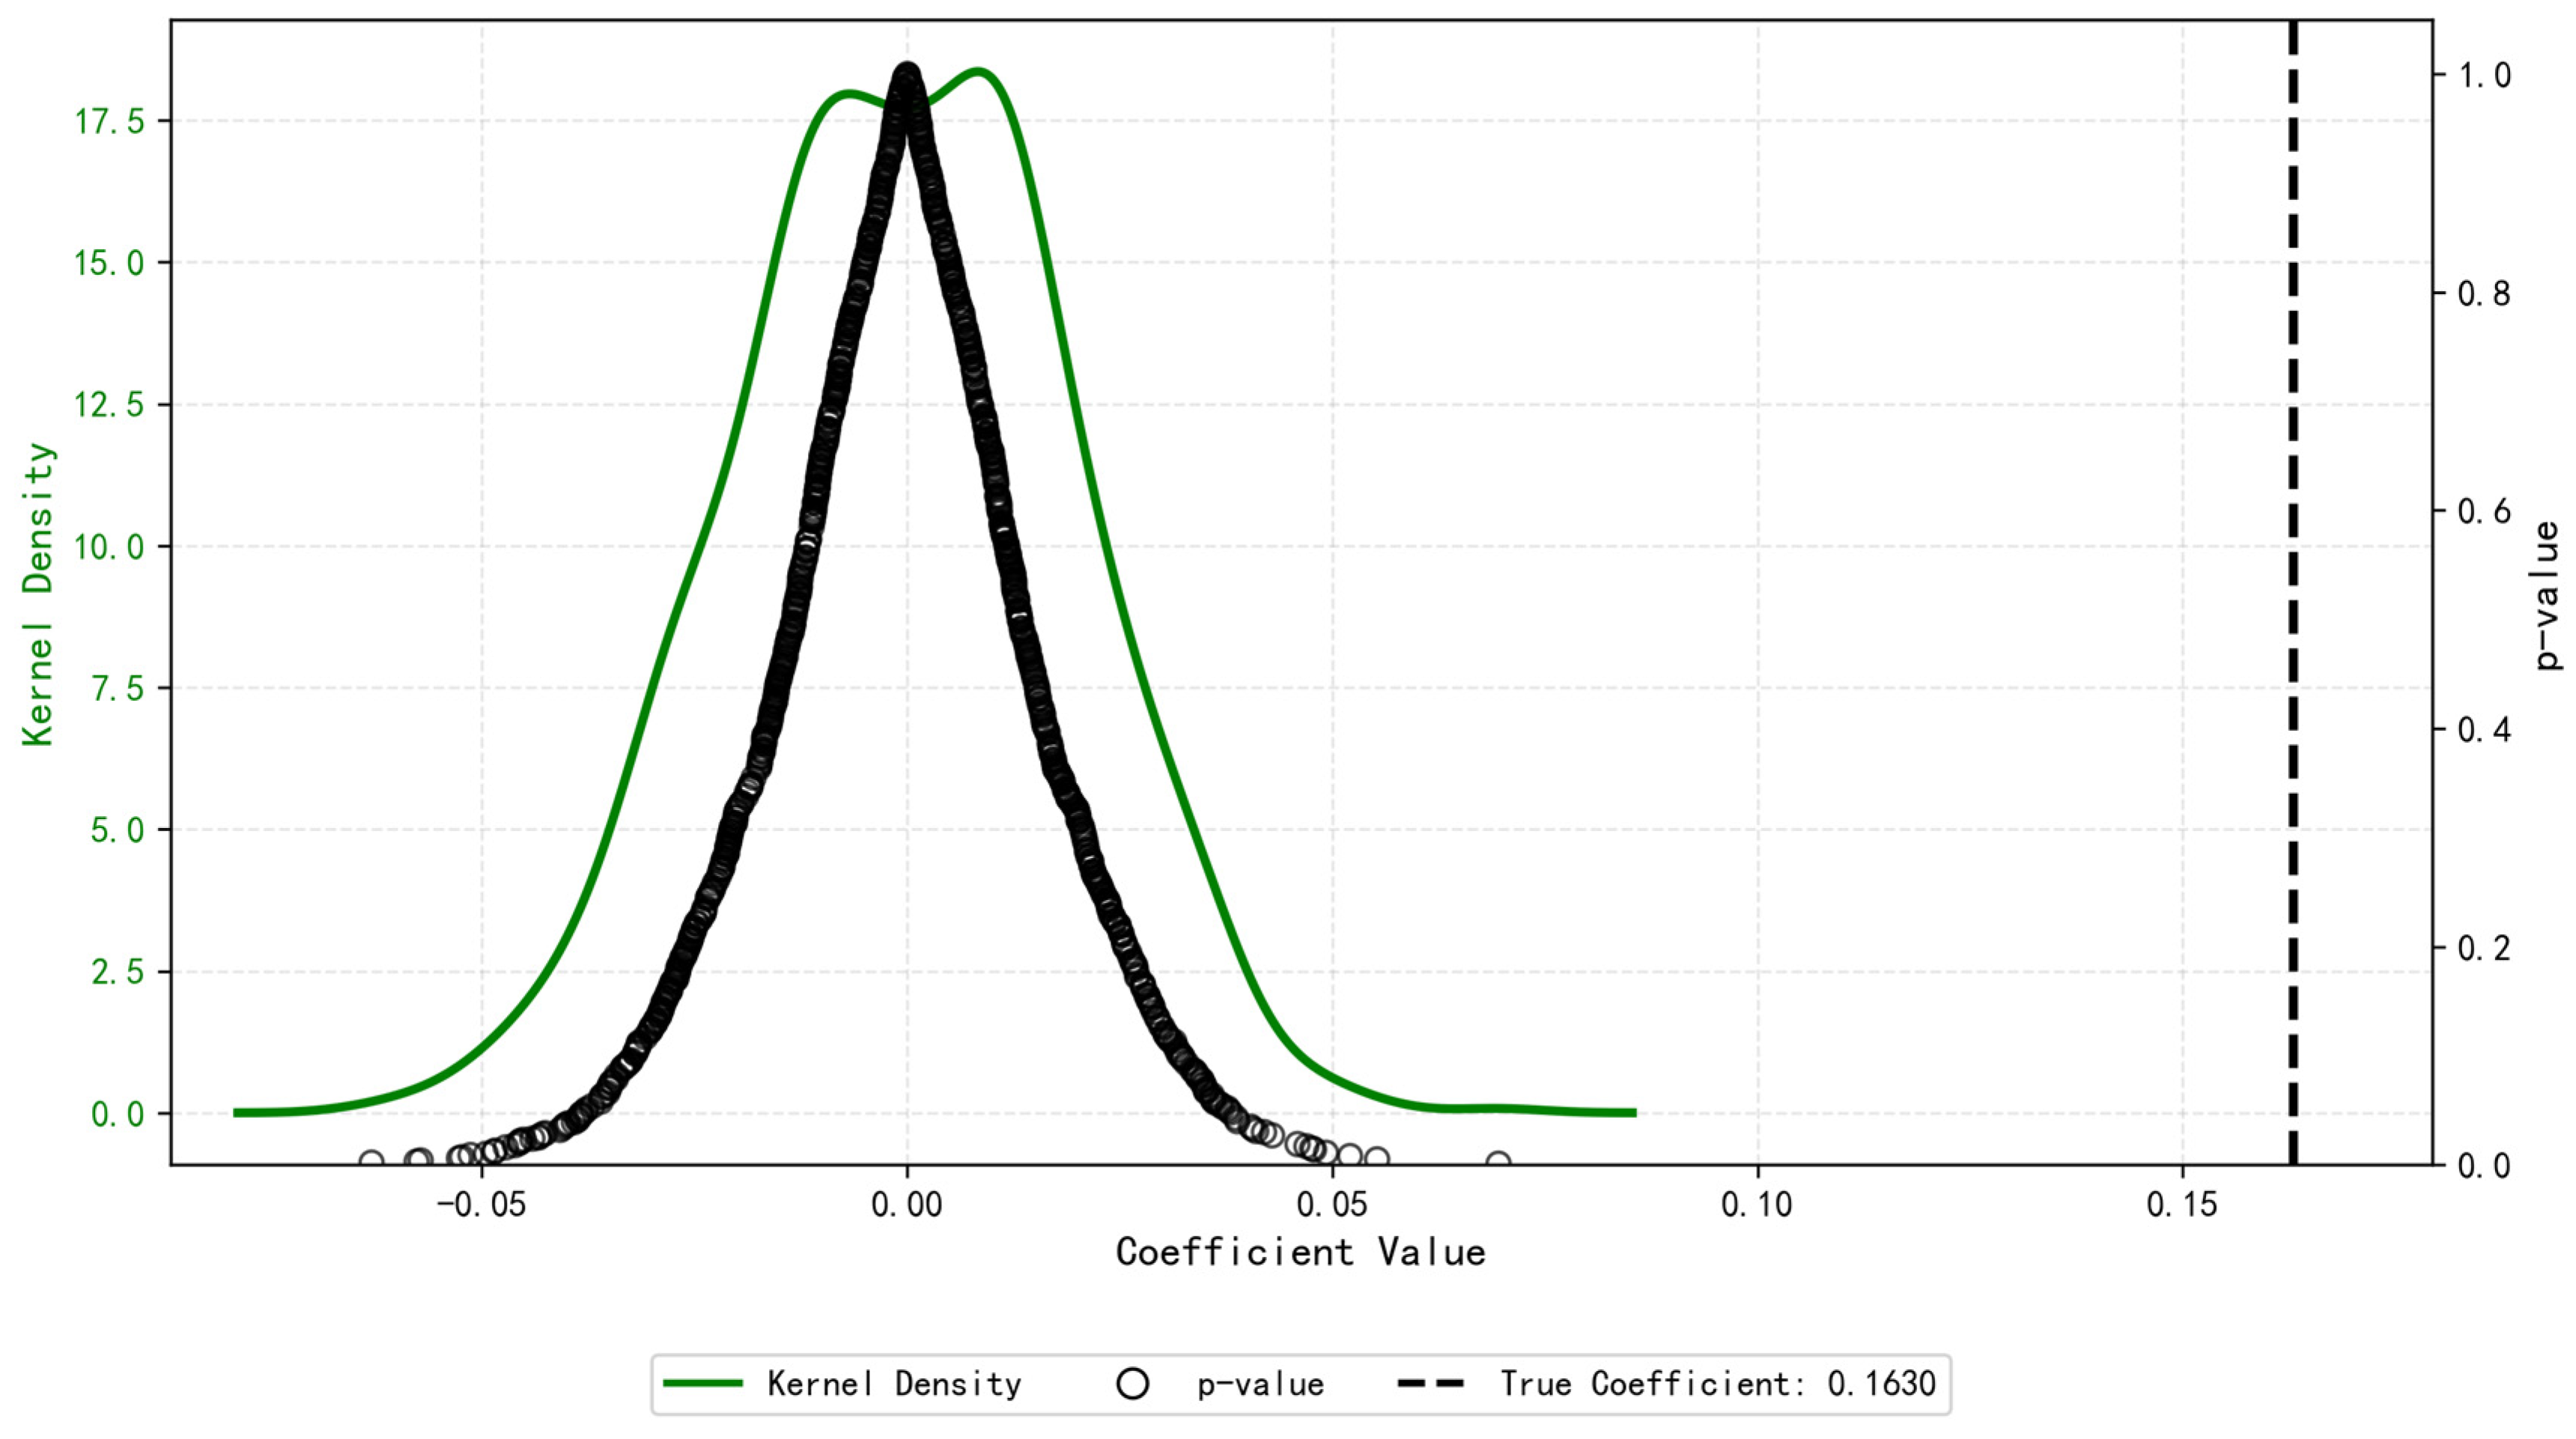
To counter potential bias from unobservable omitted variables in the baseline regression, a placebo test method was utilized [55]. Specifically, cities were generated as placebo treatment groups through random simulation (Figure 3). The simulation logic can be understood as randomly processing data related to the DIF index. Regression analyses are then performed on the dummy variable to derive coefficient estimates, with the entire procedure iterated 1000 times to ensure statistical robustness. As the results show in Figure 3, the estimated coefficients in the placebo test are mainly concentrated around 0, showing a normal distribution, which is significantly different from the true coefficient value of 0.1630. Moreover, most of the simulation results are statistically insignificant. This distribution indicates that the observed DIF index cannot be attributed to unobserved omitted variables or non-random city characteristics, thus enhancing the robustness of the main research conclusions.
Figure 3.
Placebo test results.
4.3. Heterogeneity Analysis
In the theoretical analysis section, we posit that DIF enhances CLUE through three core channels: financing accessibility, financing efficiency, and signal guidance. As elaborated in Section 2.1, the efficacy of these channels is contingent upon the regional context: urbanization alters the structural characteristics of financial demand (financing accessibility), credit availability determines the substitutability of DIF for traditional finance (financing efficiency), and the density of physical bank branches dictates the synergy between online platforms and offline services (signal guidance).
To further examine the role of financing accessibility and verify these theoretical predictions, this study conducted heterogeneity analyses from three perspectives: regional disparities in urbanization development, as measured by urbanization growth rates; credit availability, as proxied by per capita new loan amounts; and bank outlet coverage as a proxy for regional financial infrastructure.
4.3.1. Heterogeneity Analysis by Urbanization Growth
Urbanization development has fundamentally reshaped the structural context of agricultural production, thereby elevating the strategic importance of CLUE for regional sustainability. Drawing upon the financing accessibility channel discussed in Section 2.2, we argue that urbanization moderates DIF’s impact by altering the structural characteristics of financial demand and the severity of information asymmetry. To empirically verify this moderating effect, we stratified the sample into three groups of equal size based on 2023 urbanization rates. Table 5 demonstrates that the medium-urbanization group exhibits the highest DIF coefficient at 0.465 with a t-statistic of 7.564, achieving the strongest significance at the 1% level. This is followed by the high-urbanization group, showing a DIF coefficient of 0.320 and a t-value of 5.999, also significant at the 1% level. In contrast, the low-urbanization group displays a reduced DIF coefficient of 0.193, which remains statistically significant at the 5% level with a t-statistic of 2.189. This pattern reveals urbanization’s heterogeneous effects on DIF’s CLUE-enhancing effects, suggesting that areas undergoing rapid structural transformation derive the greatest benefits from digital finance solutions.
Table 5.
Heterogeneity analysis by urbanization growth—regression results of the impact of DIF on CLUE across subgroups with different urbanization levels: Columns (1) to (3) correspond to low-, medium-, and high-urbanization subgroups, respectively, and control variables include UGR, CII, and MPD, and robust t-statistics are reported in parentheses.
Notably, the heterogeneity in DIF effects aligns with the urbanization gradient across the Yangtze River Delta, rather than simple provincial divisions between southern Jiangsu and northern Zhejiang. Instead, the pattern is driven by the stage of agricultural and economic transformation in each region. This finding corresponds to the stark development disparities within the Yangtze River Delta urban agglomeration. The medium-urbanization group, which exhibits the strongest DIF effect, primarily comprises regions undergoing rapid structural transformation, such as northern Jiangsu. Specifically, it includes Huai’an, Yancheng, and Suqian, with urbanization rates ranging from 63% to 68%. This aligns with the strong coefficient observed in this group. These areas are characterized by a transition from fragmented smallholder farming to scaled operations, where DIF effectively bridges the financing gaps for purchasing machinery and adopting the new technologies in Section 2.1.
In contrast, the low-urbanization group—remote mountainous areas in southwestern Zhejiang—shows a reduced coefficient. Typical examples include Qingyuan County of Lishui City, Wencheng County of Wenzhou, and Kaihua County of Quzhou City, where urbanization rates are generally below 60%. This explains the weakened marginal effect of DIF in these contexts. Although these areas suffer from severe financial exclusion, their extremely fragmented land markets and limited digital literacy hinder the translation of digital credit into productive capital deepening.
Conversely, the high-urbanization group—comprising southern Jiangsu and Shanghai suburbs—represents core metropolitan peripheries. This pattern is consistent with the positive and significant coefficients observed in this group, though its marginal impact is smaller than in the medium-urbanization group. Here, traditional financial systems are saturated, and the agricultural sector is shrinking. Consequently, DIF primarily serves as a supplementary tool for niche scenarios, leaving less room for marginal impact on overall agricultural modernization.
4.3.2. Heterogeneity Analysis by Credit Availability
Based on the capital deepening mechanism proposed in Section 2.2, the effectiveness of DIF is contingent upon the preexisting level of credit availability. This is because DIF-induced capital must be absorbed by productive agricultural investments to translate into efficiency gains. To test this critical effect, we used the “per capita new loan amount (standardized)” as the proxy variable for credit availability, and the sample was divided into three groups (low, medium, high financing) based on the 33rd and 66th percentiles. The empirical results in Table 6 further validate the stage-wise evolutionary pattern of DIF’s impact on CLUE across different credit-availability contexts. Specifically, in the low-credit-availability group (Column 1), the coefficient of DIF is 0.358, with a t-statistic of 4.345, is significant at the 1% level. This indicates that DIF significantly enhances CLUE, primarily by substituting for underdeveloped traditional financial channels and alleviating capital shortages in intensive farmland management. In contrast, in the medium-credit-availability group (Column 2), the coefficient of DIF is 0.195 with a t-statistic of 3.115, significant at the 5% level. The positive effect remains significant, but weaker than that in the low-credit-availability group, as the complementary effect of DIF weakens noticeably when traditional financial services become more accessible. Notably, in the high-credit-availability group (Column 3), the coefficient of DIF is 0.268 with a t-statistic of 2.928, significant at the 5% level. Here, DIF no longer functions merely as a financing substitute, but shifts toward fostering more efficient capital allocation and supporting upgraded agricultural operations, thereby promoting CLUE.
Table 6.
Heterogeneity analysis by credit availability—regression results of heterogeneity analysis based on credit availability: Columns (1) to (3) correspond to the low-, medium-, and high-financing subgroups of credit availability, control variables include UGR, CII, and MPD, and robust t-statistics are reported in parentheses.
This nonlinear, phase-specific heterogeneity suggests that DIF’s role transitions from a substitution mechanism in low-finance settings to a complementary, yet attenuated role in moderate-finance contexts, and ultimately evolves into a synergistic industrial-collaboration driver in high-finance, industrialized regions. The findings highlight the importance of tailoring DIF policies and product designs to local financing conditions and agricultural development stages.
4.3.3. Heterogeneity Analysis by Bank Outlet Coverage
While DIF leverages digital technology, its real-world efficacy relies on the synergy between digital platforms and physical outlets, as argued in the theoretical framework. To uncover deeper boundary conditions and practical implications, this study moved beyond urbanization levels to specifically examine the moderating role of bank outlet coverage. This study used the standardized number of banking institutions to measure the level of bank outlet coverage. Against the background of the literature on heterogeneity grouping in panel data [56,57], this paper moves beyond the traditional fixed-threshold grouping method and instead employs an annual dynamic percentile grouping strategy. Inspired by the data-driven framework of Su et al. (2016) [57], which avoids subjective grouping by identifying unknown group structures, we calculated the 25th, 50th, and 75th percentiles of bank branch coverage for each year and divided the sample into four groups accordingly: extremely low, low, high, and extremely high coverage. This approach allowed the grouping thresholds to evolve over time, better reflecting the actual distribution of offline financial infrastructure in different years and mitigating the bias from static grouping.
The Chow test results in Table 7 confirm significant heterogeneity across groups (Chow statistic = 8.72, p = 0.003 < 0.01). Regression results show that the coefficient of digital inclusive finance (DIF) is the largest in the extremely low-coverage group (0.269, significant at the 1% level), followed by the low-coverage group (0.235, significant at the 1% level). The effect weakens to marginal significance in the high-coverage group (0.115, significant at the 10% level) and remains significant at the 5% level in the extremely high-coverage group (0.165). It is worth noting that the coefficient in the extremely high-coverage group is slightly higher than that in the high-coverage group, which may be due to the deeper integration of digital and traditional finance in areas with dense offline outlets, where online services still play a positive role through scenario collaboration. This pattern reflects the inclusive nature of digital inclusive finance: in regions with underdeveloped offline financial infrastructure, DIF strongly promotes cultivated land use efficiency (CLUE) by compensating for insufficient physical service coverage. In regions with moderate bank coverage, digital and traditional finance complement each other and jointly improve financial service efficiency. In high-coverage regions, the marginal effect of DIF diminishes, as offline outlets dominate large-scale transactions. In extremely high-coverage regions, the redundancy of physical branches weakens the comparative advantage of online services, though the positive effect of DIF remains significant.
Table 7.
Heterogeneity analysis by bank outlet coverage—regression results of heterogeneity analysis based on the annual dynamic percentiles of bank outlet coverage: Columns (1) to (4) correspond to the extremely low, low, high, and extremely high subgroups of bank outlet coverage, respectively, control variables include UGR, CII, and MPD, and all regressions include city and year fixed effects.
5. Mechanism Analysis
To clarify the transmission pathways, we adopted the mediated-effect model to examine the mediating role of fixed asset input (FAI) in primary industry and farmers’ per capita disposable income (FPI) separately. The mediation analysis results reported in Table 8 reveal a statistically significant pathway through which DIF enhances CLUE via FAI while demonstrating no significant mediating effect through FPI, suggesting that capital-intensive agricultural modernization, rather than household income growth, serves as the dominant transmission channel for DIF’s efficiency-enhancing effects in the study region.
Table 8.
Mediation effects of fixed asset investment (FAI) and farmer’s per capita disposable income (FPI) in the relationship between DIF and CLUE: Test denotes the mediation type; a represents the effect of DIF on the mediator; b indicates the effect of the mediator on CLUE; c Total shows the total effect of DIF on CLUE; ab Mediating quantifies the indirect mediation effect; and c’ Direct reflects the direct effect of DIF on CLUE after controlling for the mediator. ** p < 0.05.
As presented in Table 9, the mediation analysis consistently confirms that DIF demonstrates a statistically significant positive effect on both CLUE and the mediator FAI in columns (1) and (2), respectively, both at the 5% significance level. Second, when both DIF and FAI are included in column (3), FAI maintains strong significance at the 5% significance level while DIF’s coefficient diminishes and becomes statistically insignificant, suggesting significant mediation through FAI. This is particularly evident in the Yangtze River Delta, one of China’s most economically advanced urban agglomerations, with structural economic biases favoring the tertiary industry and leading to systematic capital allocation distortions away from agricultural modernization. The statistical significance of this mechanism confirms the theoretical prediction that capital-intensive agricultural modernization dominates financial inclusion effects in advanced urban agglomerations, where structural economic biases toward tertiary industries systematically constrain the role of household income in land productivity improvement. These structural and behavioral factors collectively diminish the mediating role of farmers’ income in this context. These findings demonstrate that in China’s YRD region, FAI serves as the dominant mediating mechanism through which DIF enhances CLUE, providing robust empirical support for Hypothesis 2. Hypothesis 2 should be revised to “DIF indirectly enhances CLUE by fixed asset investment in the primary industry.”
Table 9.
Mechanism analysis of FAI—mediating role of fixed asset investment (FAI) in the relationship between DIF and CLUE: Column (1) shows the total effect of DIF on CLUE, Column (2) shows the effect of DIF on the mediator FAI, Column (3) presents the effect of DIF on CLUE after controlling for FAI, control variables include UGR, CII, and MPD, and all models use robust standard errors with t-values reported in parentheses.
6. Conclusions and Recommendations
6.1. Conclusions
Over the last three decades, China has experienced rapid urbanization, with the Yangtze River Delta urban agglomeration emerging as the nation’s most densely populated and economically dynamic region, yet one that is a cultivated land-scarce region. This unique context has intensified the tension between urban expansion and food security, making CLUE enhancement a critical pathway for resolving this dilemma. The development of DIF has fundamentally reshaped the input–output dynamics of CLUE in the YRD. Leveraging panel data from the YRD urban agglomeration from 2011−2023, this study systematically examined the mechanisms and practical effects through which DIF influences CLUE. The findings provide a valuable reference for developing nations navigating the dual challenges of urbanization and sustainable land management.
Whereas the existing literature often attributes DIF’s agricultural benefits mainly to income effects or general credit relaxation, our findings reveal that capital deepening via fixed asset investment (FAI), rather than disposable income, serves as the dominant transmission mechanism. Furthermore, by identifying the nonlinear moderating roles of urbanization stage, credit availability, and physical branch coverage, this study extends the understanding of contextual boundaries that previous aggregate-level analyses tend to overlook. There were four main findings. (1) During the observation period, the value of CLUE shows an overall upward trend with significant spatial differentiation, exhibiting a new pattern of “high in the northwest and low in the south.” Cities in northern Jiangsu achieved prominent growth, while core cities in the central region experienced a decline in efficiency. (2) As corroborated by a series of robustness tests, DIF exerts a significant positive impact. DIF enhances CLUE predominantly through its inclusive nature, which expands financial service accessibility for smallholder farmers, with relatively limited impact of DIF’s digitization contribution on CLUE. (3) Heterogeneity analysis revealed systematic variations: the promotional effect of DIF peaks in medium-urbanization regions like northern Jiangsu undergoing rapid structural transformation, where it bridges financing gaps for scaling operations. It is most potent under extremely low credit availability, acting as a substitute for underdeveloped traditional finance. Moreover, the synergy between DIF and offline infrastructure is optimized under moderate bank outlet coverage, beyond which marginal returns diminish. (4) Mediation-effect analysis shows that DIF enhances CLUE via FAI, while the mediating role of FPI remains statistically insignificant.
6.2. Policy Recommendations
DIF has become a pivotal institutional mechanism in China’s agricultural modernization, simultaneously addressing the multifaceted challenges of sustainable land governance. Grounded in the empirical findings, particularly the identified regional heterogeneities across the YRD, we propose the following tiered policy recommendations.
First, To advance rural innovation, policymakers should intensify the DIF for Rural Areas 2.0 initiative by prioritizing 5G and agricultural IoT deployment in underserved regions like northern Anhui and southwestern Zhejiang. Simultaneously, tailored financial products is suggested to better align financial services with farming needs, such as cultivated land protection loans linking credit to satellite-monitored land quality and smart agricultural machinery installments with crop cycle-based repayment terms. This dual approach ensures technological access while supporting sustainable land use.
Second, Building on the heterogeneity analysis results, policy design should adopt a multidimensional matching strategy grounded in regional heterogeneity. In medium-urbanization regions like northern Jiangsu (Huai’an, Yancheng, Suqian), priority should be given to credit products that finance the transition from fragmented smallholder farming to scaled operations, such as loans for purchasing machinery. In low-urbanization mountainous areas of southwestern Zhejiang (Qingyuan, Wencheng), efforts must focus on combining DIF with offline agent assistance to overcome digital literacy barriers and collateral assessment difficulties. Second, in regions with extremely low credit availability, DIF should act as a substitute for underdeveloped traditional channels, offering products like “land stewardship credit” that link credit terms to land use efficiency. In contrast, in the highly urbanized peripheries of southern Jiangsu and Shanghai, DIF should evolve from a financing tool to a facilitator of industrial chain integration. Third, regarding physical infrastructure, moderate bank outlet coverage yields the optimal synergy; thus, policy should avoid blindly increasing branch density in extremely high-coverage regions to prevent redundant resource allocation. Instead, focus on functional division: offline outlets handle complex procedures while DIF manages small, high-frequency disbursements.
Third, Given the dominant mediating role of fixed asset investment (FAI), policymakers should prioritize capital-intensive modernization pathways. Establish dedicated DIF-guided investment funds specifically for precision agriculture equipment, with financing terms tied to CLUE performance metrics. Simultaneously, reform rural credit evaluation systems to better capture agricultural modernization potential, mitigating structural biases that currently undervalue primary industry investments in urban agglomerations. This ensures financial inclusion directly translates into productivity-enhancing capital formation.
Author Contributions
Conceptualization, Q.Y. and Z.W.; methodology, Q.Y. and Z.W.; software, Q.Y. and Z.W.; validation, Q.Y. and Z.W.; formal analysis, Q.Y. and Z.W.; investigation, Q.Y.; resources, Q.Y. and Z.W.; writing—original draft, Q.Y.; writing—review and editing, Z.W.; visualization, Y.J.; supervision, Y.J.; project administration, Q.Y. and Y.J.; funding acquisition, Y.J. All authors have read and agreed to the published version of the manuscript.
Funding
This research received no external funding.
Institutional Review Board Statement
Not applicable.
Informed Consent Statement
Not applicable.
Data Availability Statement
Data are contained within the article.
Conflicts of Interest
The authors declare no conflicts of interest.
Appendix A
Table A1.
Carbon sources associated with agricultural activities, along with their respective emission coefficients and the original bibliographic sources.
Table A2.
Variables in the two-way fixed-effect model: composition of variables for the benchmark regression. The explained variable is CLUE, representing the comprehensive cultivated land use efficiency. The core explanatory variable is DIF, measured by the digital inclusive finance index. COV, DEP, and DIG serve as substitute explanatory variables, representing the coverage breadth, usage depth, and digitization level of digital inclusive finance, respectively. UGR, CII, and MPD are city-level control variables, accounting for urbanization development, agricultural infrastructure, and mechanization levels. FAI and FPI are mechanism variables, capturing fixed asset investment in the primary industry and farmers’ per capita disposable income, respectively.
Table A3.
Stationary test: unit root tests for all variables. The null hypothesis of the Fisher–ADF and LLC tests is that the series has a unit root (non-stationary). A low p-value (less than 0.05) indicates rejection of the null hypothesis, suggesting the series is stationary. All variables were found to be stationary at the 5% significance level.
Table A4.
Pearson correlation coefficients among the key variables. The diagonal elements represent the correlation of a variable with itself. Off-diagonal values indicate the pairwise linear correlations between different variables.
References
- Liu, K.; Zhu, W.J.; Luo, M.Z. Land integration and titling policy in China: Institutional barriers and countermeasures. Land Use Policy 2022, 112, 105849. [Google Scholar] [CrossRef] [Scilit]
- Karlan, D.; Osei, R.; Osei-Akoto, I.; Udry, C. Agricultural Decisions after Relaxing Credit and Risk Constraints. Q. J. Econ. 2014, 129, 597–652. [Google Scholar] [CrossRef] [Scilit]
- Aker, J.C.; Boumnijiel, R.; McClelland, A.; Tierney, N. Payment Mechanisms and Antipoverty Programs: Evidence from a Mobile Money Cash Transfer Experiment in Niger. Econ. Dev. Cult. Change 2016, 65, 1–37. [Google Scholar] [CrossRef] [Scilit]
- Huang, Y.P.; Huang, Z. Digital Financial Development in China: Present and Future. China Econ. Q. 2018, 17, 1489–1502. [Google Scholar] [CrossRef]
- Wang, Z.; Chen, J.; Zheng, W.; Deng, X. Dynamics of land use efficiency with ecological intercorrelation in regional development. Landsc. Urban Plan. 2018, 177, 303–316. [Google Scholar] [CrossRef] [Scilit]
- Zhou, Y.X.; Lu, Y. Spatiotemporal evolution and determinants of urban land use efficiency under green development orientation: Insights from 284 cities and eight economic zones in China, 2005–2019. Appl. Geogr. 2023, 161, 103117. [Google Scholar] [CrossRef] [Scilit]
- Shi, J.G.; Xu, T.H. Efficiency evaluation of industrial parks land in Yangtze River Urban Agglomerations based on VRS-DEA Model and Malmquist Productivity Index. Resour. Sci. 2017, 39, 1026–1036. [Google Scholar] [CrossRef]
- Tone, K. A slacks-based measure of efficiency in data envelopment analysis. Eur. J. Oper. Res. 2001, 130, 498–509. [Google Scholar] [CrossRef] [Scilit]
- Tone, K. A slacks-based measure of super-efficiency in data envelopment analysis. Eur. J. Oper. Res. 2002, 143, 32–41. [Google Scholar] [CrossRef] [Scilit]
- Wang, P.; Shao, Z.N.; Wang, J.; Wu, Q. The impact of land finance on urban land use efficiency: A panel threshold model for Chinese provinces. Growth Change 2021, 52, 310–331. [Google Scholar] [CrossRef] [Scilit]
- Zuo, X.F.; Zhang, X.K. How Do Innovation-Driven Policies Affect Urban Green Land Use Efficiency? Evidence from China’s Innovative City Pilot Policy. Land 2025, 14, 1034. [Google Scholar] [CrossRef] [Scilit]
- Zhu, A.A.; Yin, S.K.; Liu, Q.H. Spatial and temporal differentiation and influencing factors of agricultural ecological efficiency in northwest China. Arid Land Geogr. 2024, 47, 1210–1219. [Google Scholar] [CrossRef]
- Jiang, H.L. Spatial–temporal differences of industrial land use efficiency and its influencing factors for China’s central region: Analyzed by SBM model. Environ. Technol. Innov. 2021, 22, 101489. [Google Scholar] [CrossRef] [Scilit]
- Ke, X.; Zhang, Y.; Zhou, T. Spatio-temporal characteristics and typical patterns of eco-efficiency of cultivated land use in the Yangtze River Economic Belt, China. J. Geogr. Sci. 2023, 33, 357–372. [Google Scholar] [CrossRef] [Scilit]
- Kuang, B.; Lu, X.H.; Zhou, M.; Chen, D.L. Provincial cultivated land use efficiency in China: Empirical analysis based on the SBM-DEA model with carbon emissions considered. Technol. Forecast. Soc. Change 2020, 151, 119874. [Google Scholar] [CrossRef] [Scilit]
- Wang, F.H. Does the construction of smart cities make cities green? Evidence from a quasi-natural experiment in China. Cities 2023, 140, 104436. [Google Scholar] [CrossRef] [Scilit]
- Cao, W.; Zhou, W.; Wu, T.; Wang, X.C.; Xu, J.H. Spatial-temporal characteristics of cultivated land use eco-efficiency under carbon constraints and its relationship with landscape pattern dynamics. Ecol. Indic. 2022, 141, 109140. [Google Scholar] [CrossRef] [Scilit]
- Zhou, X.; Wu, D.; Li, J.F.; Liang, J.L.; Zhang, D.; Chen, W.X. Cultivated land use efficiency and its driving factors in the Yellow River Basin, China. Ecol. Indic. 2022, 144, 109411. [Google Scholar] [CrossRef] [Scilit]
- Han, H.B.; Zhang, X.Y. Static and dynamic cultivated land use efficiency in China: A minimum distance to strong efficient frontier approach. J. Clean. Prod. 2020, 246, 119002. [Google Scholar] [CrossRef] [Scilit]
- Pei, B.; Chen, S.L. The spatio-temporal variations of cultivated land compensation efficiency and its influencing factors in mainland China. Ecol. Indic. 2024, 166, 112596. [Google Scholar] [CrossRef] [Scilit]
- Ren, J.; Gao, T.T.; Shi, X.; Chen, X.R.; Mu, K.Y. The impact and heterogeneity analysis of digital financial inclusion on non-farm employment of rural labor. Chin. J. Popul. Resour. Environ. 2023, 21, 103–110. [Google Scholar] [CrossRef] [Scilit]
- Chen, X.; Huang, X.; Yu, T.; Zhang, Y.; Cui, X. From Imbalance to Synergy: The Coupling Coordination of Digital Inclusive Finance and Urban Ecological Resilience in the Yangtze River Economic Belt. Land 2024, 13, 1617. [Google Scholar] [CrossRef] [Scilit]
- Yang, Z.; Liu, T.; Shen, N.; Guan, M.; Zheng, Y.; Jiang, H. Resource and Environment Constraints and Promotion Strategies of Rural Vitality: An Empirical Analysis of Rural Revitalization Model Towns. Front. Environ. Sci. 2022, 10, 956644. [Google Scholar] [CrossRef] [Scilit]
- Li, H.L.; Wei, X.; Chen, W.H. Digital financial inclusion’s impact on farmers’ income and spatial spillover effects: Evidence from inner Mongolia, China. Heliyon 2025, 11, e42155. [Google Scholar] [CrossRef] [Scilit] [PubMed]
- Zhang, Y.D.; Cui, R.Q.; Wei, X.B.; Chen, T.Y. How digital financial inclusion enhances agroecological efficiency: Impact effects and mechanism tests. Int. Rev. Econ. Financ. 2025, 97, 103755. [Google Scholar] [CrossRef] [Scilit]
- Liu, J.X.; Ren, Y.Y. Can digital inclusive finance ensure food security while achieving low-carbon transformation in agricultural development? Evidence from China. J. Clean. Prod. 2023, 418, 138016. [Google Scholar] [CrossRef] [Scilit]
- Banerjee, A.; Duflo, E.; Glennerster, R.; Kinnan, C. The Miracle of Microfinance? Evidence from a Randomized Evaluation. Am. Econ. J. Appl. Econ. 2015, 7, 22–53. [Google Scholar] [CrossRef] [Scilit]
- Zhang, H.; Li, Y.; Zhao, X. The impact of technological progress on green production efficiency of cultivated land: Evidence from the Yellow River Basin, China. Environ. Impact Assess. Rev. 2025, 112, 107838. [Google Scholar] [CrossRef] [Scilit]
- Ricardo, D. On the Principles of Political Economy and Taxation; John Murray: London, UK, 1817; Available online: https://www.econlib.org/library/Ricardo/ricP.html (accessed on 5 February 2018).
- Leyshon, A.; Thrift, N. Geographies of financial exclusion: Financial abandonment in Britain and the United States. Trans. Inst. Br. Geogr. 1995, 20, 312–341. [Google Scholar] [CrossRef] [Scilit]
- Haynes, G.W.; Haynes, D.C. The geography of capital flows and regional growth. Land Econ. 1963, 39, 121–132. [Google Scholar] [CrossRef] [Scilit]
- Hayami, Y.; Ruttan, V.W. Agricultural Development: An International Perspective, Revised ed.; Johns Hopkins University Press: Baltimore, MD, USA, 1985; Available online: https://url1.worldlib.site/s/D49153 (accessed on 17 June 2026).
- Guo, J.; Chen, L.Q.; Kang, X. Digital inclusive finance and agricultural green development in China: A panel analysis (2013–2022). Financ. Res. Lett. 2024, 69, 106173. [Google Scholar] [CrossRef] [Scilit]
- Chang, R.; Gao, Y.; Liu, H. The Role of Digital Financial Inclusion in Agricultural Sustainable Development: A Dual Perspective of Technology Adoption and Green Transformation. Sustainability 2026, 18, 4409. [Google Scholar] [CrossRef] [Scilit]
- Liu, Y.; Pu, X.Y.; Zhang, G.Y. Spatial spillover effect and heterogeneity of digital economy on agricultural carbon emissions. Sci. Rep. 2025, 15, 37693. [Google Scholar] [CrossRef] [Scilit] [PubMed]
- Song, G.; Ren, G.F. Spatial response of cultivated land use efficiency to the maize structural adjustment policy in the “Sickle Bend” region of China: An empirical study from the cold area of Northeast. Land Use Policy 2022, 123, 106421. [Google Scholar] [CrossRef] [Scilit]
- Hu, Y.; Liu, C.; Peng, J.G. Financial inclusion and agricultural total factor productivity growth in China. Econ. Model. 2021, 96, 68–82. [Google Scholar] [CrossRef] [Scilit]
- Cao, L.; Wang, G.S. Impact of digital finance on agricultural output: From the perspective of digital development of agriculture. Financ. Res. Lett. 2024, 66, 105698. [Google Scholar] [CrossRef] [Scilit]
- Su, F.F.; Tao, S.M.; Ying, R.Y. Agricultural transformation in the digital age: Digital inclusive finance and the development of new agricultural business entities. Financ. Res. Lett. 2025, 72, 106614. [Google Scholar] [CrossRef] [Scilit]
- Lagna, A.; Ravishankar, M.N. Making the world a better place with fintech research. Inf. Syst. J. 2022, 32, 61–102. [Google Scholar] [CrossRef] [Scilit]
- Lee, C.C.; Lou, R.C.; Wang, F.H. Digital financial inclusion and poverty alleviation: Evidence from the sustainable development of China. Econ. Anal. Policy 2023, 77, 418–434. [Google Scholar] [CrossRef] [Scilit]
- Xiong, Q.; Guo, X.; Yang, J. Digital Financial Inclusion, Land Circulation and High-Quality Development of Agriculture. Sustainability 2024, 16, 4775. [Google Scholar] [CrossRef] [Scilit]
- Heit, M.; Berner, U.; Rihter, O. Calculation of global carbon dioxide emissions: Review of emission factors and a new approach taking fuel quality into consideration. Glob. Biogeochem. Cycles 2001, 15, 169–181. [Google Scholar] [CrossRef] [Scilit]
- Xu, M.; Shi, L.D.; Zhao, J.H.; Zhang, Y.L.; Lei, T.; Shen, Y. Achieving agricultural sustainability: Analyzing the impact of digital financial inclusion on agricultural green total factor productivity. Front. Sustain. Food Syst. 2025, 8, 1515207. [Google Scholar] [CrossRef] [Scilit]
- Hong, H.; Sun, L.; Zhao, L. Exploring the Impact of Digital Inclusive Finance on Agricultural Carbon Emissions: Evidence from the Mediation Effect of Capital Deepening. Sustainability 2024, 16, 3071. [Google Scholar] [CrossRef] [Scilit]
- Intergovernmental Panel on Climate Change (IPCC). IPCC Guidelines for National Greenhouse Gas Inventories; IPCC: Geneva, Switzerland, 2006; Available online: https://www.ipcc-nggip.iges.or.jp/public/2019rf/index.html (accessed on 17 June 2026).
- Xu, X.; Zhao, Q.; Guo, J. Rising Inequality in Agricultural Greenhouse Gas Emission Intensity Across Rural China, 1993–2020. Nat. Food 2024, 5, 916–928. [Google Scholar] [CrossRef] [Scilit] [PubMed]
- Li, B.; Zhang, J.B.; Li, H.P. Spatiotemporal Characteristics and Influencing Factor Decomposition of Agricultural Carbon Emissions in China. China Popul. Resour. Environ. 2011, 21, 80–86. [Google Scholar] [CrossRef]
- Tian, Y.; Zhang, J.B.; Li, B. Measurement, Spatiotemporal Comparison and Decoupling Effect of Agricultural Carbon Emissions in China. Resour. Sci. 2012, 34, 2097–2105. [Google Scholar]
- Gao, Y.; Li, Z.; Hong, S.; Yu, L.; Li, S.; Jing, W.; Zhang, J.; Zhang, Y.; Zhang, W.; Yuan, W.; et al. Recent Stability of Non-CO2 Greenhouse Gas Emissions from Chinese Agriculture. Natl. Sci. Rev. 2025, 12, nwaf040. [Google Scholar] [CrossRef] [Scilit] [PubMed]
- Guo, F.; Kong, S.T.; Wang, J. General patterns and regional disparity of internet finance development in China: Evidence from the Peking University Internet Finance Development Index. China Econ. J. 2016, 9, 253–271. [Google Scholar] [CrossRef] [Scilit]
- Tan, S.K.; Tong, B.; Zhang, J.W.; Zhang, B. Impact of digital financial inclusion on cultivated land use efficiency: Based on the empirical analysis of Central China from 2011 to 2020. China Land Sci. 2024, 38, 78–89. [Google Scholar] [CrossRef]
- Jiang, Y.X. Public service equalization, digital financial inclusion and the rural revitalization: Evidence from Chinese 283 prefecture-level cities. Int. Rev. Econ. Financ. 2024, 96, 103648. [Google Scholar] [CrossRef] [Scilit]
- Wang, X.; Yamauchi, F.; Huang, J.; Rozelle, S. What constrains mechanization in Chinese agriculture? Role of farm size and fragmentation. China Econ. Rev. 2020, 62, 101221. [Google Scholar] [CrossRef] [Scilit]
- Wang, J.Y.; Su, D.; Wu, Q.; Li, G.Y.; Cao, Y. Study on eco-efficiency of cultivated land utilization based on the improvement of ecosystem services and emergy analysis. Sci. Total Environ. 2023, 882, 163489. [Google Scholar] [CrossRef] [Scilit] [PubMed]
- Bonhomme, S.; Manresa, E. Grouped Patterns of Heterogeneity in Panel Data. Econometrica 2015, 83, 1147–1184. [Google Scholar] [CrossRef] [Scilit]
- Su, L.; Shi, Z.; Phillips, P.C.B. Identifying Latent Structures in Panel Data. Econometrica 2016, 84, 2215–2264. [Google Scholar] [CrossRef] [Scilit]
- Dubey, A.; Lal, R. Carbon Footprint and Sustainability of Agricultural Production Systems in Punjab, India, and Ohio, USA. J. Crop Improv. 2009, 23, 332–350. [Google Scholar] [CrossRef] [Scilit]

Disclaimer/Publisher’s Note: The statements, opinions and data contained in all publications are solely those of the individual author(s) and contributor(s) and not of MDPI and/or the editor(s). MDPI and/or the editor(s) disclaim responsibility for any injury to people or property resulting from any ideas, methods, instructions or products referred to in the content. |
© 2026 by the authors. Licensee MDPI, Basel, Switzerland. This article is an open access article distributed under the terms and conditions of the Creative Commons Attribution (CC BY) license.