


Abstract
This study examines the determinants of electric vehicles adoption focusing on environmental awareness, user preferences, and user experience. Specifically, it investigates whether EV ownership reflects environmental concerns or pragmatic factors such as economic and technological advantages. The analysis is based on survey data obtained from 209 EV users in Türkiye. An Environmental Awareness Index consisting of eleven Likert-scale statements was constructed, and its reliability and validity were verified using Cronbach’s alpha coefficient and factor analysis, demonstrating a unidimensional structure. The empirical strategy relies on a combination of descriptive statistics, non-parametric tests, and multivariate OLS regression models. Robustness analyses were performed using ordered logit and z-standardized OLS estimations. The findings indicate that EV users generally possess a relatively high level of environmental awareness. Descriptive results suggest that economic considerations constitute the most frequently reported motivation for EV adoption, whereas the multivariate analyses provide only limited evidence regarding the independent role of adoption motives in explaining environmental awareness. Econometric results reveal that the frequency of access to environmental information and driving experience are positively correlated with environmental awareness, while household vehicle ownership has a negative effect. These relationships are statistically significant in the baseline models but weaken in the full-specification models, indicating model specification sensitivity. Robustness checks provide partial support for the directional stability of the main associations, although statistical significance varies across alternative specifications. Overall, EV ownership does not necessarily reflect a strong environmentally conscious identity. Instead, adoption is shaped by a combination of cost advantages, technological appeal, and environmental sensitivity. The study highlights the importance of exposure to environmental information on awareness and offers policy implications for both increasing EV adoption and broader environmental awareness.
1. Introduction
Climate change has become one of the most critical global problems of the 21st century, largely due to increasing greenhouse gas emissions resulting from human activities. These emissions have now reached historically high levels, leading to significant disruptions in both natural and human-caused systems. The consequences of climate change, such as global temperature increase, extreme weather events, rising sea levels, and biodiversity loss, pose serious risks not only to environmental sustainability but also to economic stability and public health [1,2,3]. In response to these challenges, strengthening environmental awareness and promoting sustainable behavioral change have become key priorities for governments, institutions, and societies worldwide [4].
The transport sector is responsible for approximately 23% of global carbon dioxide (CO2) emissions, making it a major source of greenhouse gases (GHGs) and global warming; about three-quarters of these emissions originate from road transport [5]. This makes decarbonizing transport systems a critical element in achieving global climate goals, including those set out in the Paris Agreement and the Sustainable Development Goals. Among various mitigation strategies, electric vehicles (EVs) stand out as one of the most promising technological solutions for reducing transport-related emissions and transitioning to low-carbon transport systems [6].
In recent years, the adoption of EVs has accelerated significantly in many countries, including Türkiye; the adoption of EVs has accelerated significantly, with ownership numbers rising rapidly within a compressed timeframe. This growth has been supported by various factors such as low operating costs, technological advancements, government incentives, and increasing environmental concern [6,7]. However, despite this rapid spread, the determinants of EV adoption are still complex and multifaceted; encompassing not only economic factors but also behavioral, psychological, and environmental dimensions [8,9]. From a theoretical perspective, EV adoption can be interpreted both as a pro-environmental behavior and as a technology-adoption decision. The Theory of Planned Behavior suggests that individual behavior is shaped by behavioral intentions, which are influenced by attitudes toward the behavior, subjective norms, and perceived behavioral control [10]. In parallel, the theory of environmentally significant behavior emphasizes that pro-environmental actions are shaped not only by environmental values and awareness but also by contextual and practical constraints [11]. Similarly, the Technology Acceptance Model highlights perceived usefulness and perceived ease of use as key determinants of the acceptance of new technologies [12]. In the context of EVs, these perspectives suggest that adoption decisions may emerge from the interaction between environmental concern, perceived technological benefits, cost-related considerations, and infrastructure-related constraints.
An increasing number of studies highlight that environmental awareness is a significant attitudinal determinant of eco-friendly behaviors, including EV adoption [13]. In general, individuals with higher environmental awareness are more likely to evaluate eco-friendly technologies positively and adopt sustainable consumption behaviors [14,15]. From this perspective, EVs can be considered not only as a technological innovation but also as a symbolic representation of environmental values and sustainable mobility preferences [16]. However, empirical studies also show that the relationship between environmental awareness and EV adoption is not always direct or linear. Environmental concern may increase positive perceptions of EVs, but adoption decisions are often shaped simultaneously by economic incentives, perceived cost savings, technological appeal, charging infrastructure, driving range, and other practical constraints [17,18,19]. Therefore, environmental awareness should not be examined in isolation; rather, it should be understood as one component of a broader decision-making process in which environmental motives interact with pragmatic considerations. This perspective is particularly relevant for actual EV users, whose adoption decisions may reflect both environmental sensitivity and practical evaluations based on ownership and usage experience.
Despite the increasing interest in EV adoption in the literature, understanding of how environmental awareness interacts with user preferences, user experience, and behavioral factors in the context of actual EV users remains limited [9,20]. While most current studies focus on potential users, purchase intentions, or general population samples, studies examining individuals who have already adopted EVs are more limited [21]. Nevertheless, recent studies have begun to examine actual EV users and early adopters in more detail. For example, recent evidence from Türkiye analyzes electric car users through the Technology Acceptance Model and highlights the importance of subjective norms, image, charging infrastructure, and range-related concerns [22]. Similarly, research on early EVs adopters shows that ownership decisions may be associated with income, education, home or garage ownership, maintenance costs, long-term savings, incentives, environmental considerations, and charging infrastructure [23]. However, less is known about existing EV users’ environmental awareness is primarily associated with environmental motivations or with pragmatic adoption factors such as cost savings, technological appeal, and charging-related experience. This creates a specific research gap regarding whether EV ownership reflects an environmentally conscious identity or whether it is mainly shaped by practical and economic considerations.
To address this gap, this study examines the determinants of environmental awareness among EV users and analyzes how user preferences, usage experiences, and socio-demographic characteristics relate to levels of environmental awareness. Specifically, the study aims to assess whether environmental awareness is shaped by behavioral exposures such as acquiring information and daily eco-friendly habits, or whether it is more strongly influenced by the economic and practical motivations underlying EV adoption.
The study offers three key contributions to the literature. First, it contributes to the behavioral and sustainability-oriented EV adoption literature by examining whether EV ownership among actual users reflects environmental awareness or is more strongly associated with pragmatic adoption motives. Second, it develops and validates an Environmental Awareness Index based on Likert-scale statements related to EVs, sustainability, emissions, energy sources, and battery recycling. Third, it examines the determinants of environmental awareness using a comprehensive empirical framework that includes behavioral exposure, usage experience, preference motivations, and socio-demographic characteristics, supported by robustness analyses using ordered logit and z-standardized OLS models.
By focusing on real EV users, this study presents novel empirical findings on the behavioral foundations of environmental awareness in the context of emerging sustainable transportation systems. The results offer important implications for policymakers who aim not only to promote EV adoption but also to foster long-term environmental awareness and sustainable behavioral change.
2. Methods
This study adopts a cross-sectional quantitative survey design to examine the relationship between EV users’ preferences, usage experiences, adoption motivations, and environmental awareness. The unit of analysis is the individual EV user. The main dependent variable is the Environmental Awareness Index, which was constructed from 11 Likert-scale items measuring perceptions of EVs, sustainability, emissions, energy sources, battery recycling, and environmental knowledge.
The survey questionnaire included demographic questions, Likert-scale items, multiple-response questions, and open-ended responses. The empirical analysis is primarily quantitative. Open-ended responses were used only as a complementary source for categorizing participants’ stated motivations, usage-related problems, and environmentally friendly behaviors. The analytical strategy consists of five stages: (i) descriptive analysis of the sample profile, (ii) construction and validation of the Environmental Awareness Index, (iii) non-parametric group comparisons, (iv) multivariate OLS regression models with increasing sets of controls, and (v) robustness checks using ordered logit and z-standardized OLS estimations.
2.1. Data Set and Sample
The data set used in this study consists of responses to survey questions collected from 209 participants. The survey was administered between January and December 2025. Data were collected through an online questionnaire prepared using Google Forms and through face-to-face interviews. Participants were recruited through social media platforms, EV user groups, WhatsApp and Telegram groups, and charging station networks. The inclusion criterion was EV ownership; therefore, only individuals who owned an EV were included in the study. The survey was conducted after obtaining ethics committee approval. Participation was voluntary, and respondents were informed about the purpose of the study before completing the questionnaire. Because the recruitment strategy relied on voluntary participation and access to EV owner networks, the sample was formed using a non-probability sampling approach. Therefore, the findings should not be interpreted as statistically representative of all EVs owners in Türkiye. Rather, they reflect the characteristics, preferences, and environmental awareness levels of the EVs owners who participated in the study. Accordingly, caution should be exercised when generalizing the results to a broader population (e.g., the whole of Türkiye or specific regions such as the Marmara Region). Nevertheless, the data set provides a valuable analytical basis for examining the general behavioral tendencies, preference structures, and environmental attitudes of EV users. The analysis of the data collected in the study was performed using Python 3 in the COLAB environment.
2.2. Data Processing and Coding
The survey data obtained in this study was first subjected to a detailed preprocessing procedure. In this process, variable names were standardized, and columns that did not carry analytical meaning (e.g., timelapse) were removed from the data set. Open-ended responses provided by participants within the demographic variables were grouped under common categories to ensure consistency across variables such as age, household size, driving experience, and the number of vehicles in the household. For questions allowing multiple responses, the data was re-coded in a way that enables tracking each participant individually. Based on these questions, count variables with high analytical value were generated. In this way, participants’ reasons for preferring EVs, the problems they encounter during use, and their environmentally friendly behaviors outside of EV use were made suitable for quantitative analysis. Likert-type items were reviewed to ensure a consistent direction, with higher scores representing higher levels of environmental awareness. Missing observations were examined on a variable-by-variable basis. The full survey included 209 respondents; however, the number of valid observations differs across variables because of item-level non-response. Descriptive statistics and frequency tables report the number of valid responses available for each variable. The Environmental Awareness Index was available for 206 respondents because it was calculated as the respondent-level mean of available reverse-coded Likert items. Reliability and factor analyses were conducted using listwise complete observations across all eleven Likert items, resulting in 195 valid observations. For the regression analyses, a harmonized complete-case approach was adopted to ensure that the OLS models were estimated on the same analytical sample. After excluding observations with missing values in the dependent variable and covariates included in the full specification, the final OLS regression sample consisted of 180 observations. For multiple-response questions, count variables were constructed by counting the number of selected options. Blank responses to these multiple-response items were treated as missing in the regression analyses and were handled through the complete-case procedure.
2.3. Definition of Variables
In this study, three types of variables were used: dependent variables, independent variables, and variables derived from raw data. Detailed information on these variables is provided in this section.
2.3.1. Dependent Variable: Environmental Awareness Index
The dependent variable of the study is the “Environmental Awareness Index.” This index was developed by researchers based on 11 five-point Likert-scale items designed to measure participants’ evaluations of topics such as the environmental impacts of EVs, sustainable transportation, carbon footprint, air pollution, emissions, the effects of energy sources, battery recycling, and general environmental knowledge. The original Likert responses were coded on a five-point scale ranging from 1 = “Strongly agree” to 5 = “Strongly disagree.” Since all eleven statements were positively worded with respect to environmental awareness, the items were reverse-coded using the transformation 6 − original score. Thus, higher values indicate higher levels of environmental awareness. Subsequently, a continuous index was constructed by calculating the respondent-level mean of the eleven reverse-coded items. Before constructing the index, the internal consistency and factor structure of the scale were assessed. The identification of a unidimensional and highly reliable structure supported the use of the environmental awareness scale as the main dependent variable.
2.3.2. Independent and Control Variables
The independent variables used in the empirical models were organized into four categories to improve conceptual clarity.
First, environmental information and pro-environmental behavior variables include the frequency of seeking information about environmental issues (env_info_freq_ord) and the number of environmentally friendly habits reported by participants (eco_habit_count).
Second, EV use experience variables include the number of problems encountered during EV use (problem_count), the number of additional reasons for EVs preference beyond the primary reason (other_reason_count), the duration of EV use (ev_use_duration_ord), and years of active driving experience (driving_years).
Third, EV adoption and usage context variables include the primary reason for choosing an EVs (primary_reason_grouped) and the main charging method (charging_group). The primary reason for EVs preference was grouped into four categories: “Economic,” “Technological,” “Environmental,” and “Other.” Charging method was classified into “Home,” “Public,” “Workplace,” and “Other.”
Fourth, socio-demographic and household control variables include gender, age group, education level, income group, household size, and household vehicle ownership. Education level was recoded into three categories: “High school or below,” “Undergraduate,” and “Graduate”. Income level was categorized as “Low–Middle,” “Middle–High,” and “High”.
2.3.3. Derived Variables
Several derived variables were generated from multiple-response survey items, including the number of environmentally friendly habits, the number of problems encountered during EV use, and the number of additional preference motivations. The variables included in the empirical analyses, together with their coding and measurement levels, are summarized in Table 1.
Table 1.
Variable definitions.
Table 1 summarizes the key variables included in the study. The dependent variable, Environmental Awareness Index, captures participants’ environmental attitudes based on 11 Likert-scale items. Independent variables cover usage experience and environment-related behaviors, while control variables include socio-demographic characteristics and primary factors influencing EVs choice. Measurement levels and coding schemes are also presented to clarify how each variable is quantified for analysis.
2.4. Research Hypotheses
In line with the theoretical framework, previous empirical findings, and the research questions stated above, the hypotheses were organized around three main dimensions: (i) environmental information and pro-environmental behavior, (ii) EV adoption motivations and usage experience, and (iii) socio-demographic characteristics. This structure allows the hypotheses to be directly linked to the study objectives and to the empirical models used in the analysis.
The first group of hypotheses focuses on environmental information exposure and daily pro-environmental behaviors. These variables are expected to be positively associated with the Environmental Awareness Index:
H1.
As the frequency of seeking information about environmental issues increases, the Environmental Awareness Index also increases.
H2.
As the number of environmentally friendly behaviors in daily life increases, the Environmental Awareness Index also increases.
H3.
Individuals who choose EVs for environmental reasons have higher levels of environmental awareness compared to those who choose them for economic reasons.
H4.
As the duration of EV use and driving experience increases, the level of environmental awareness also increases.
H5.
As the number of problems encountered during EV use increases, positive environmental perceptions weaken.
H6.
As education level increases, the Environmental Awareness Index increases.
H7.
The effect of income level on environmental awareness is more limited compared to behavioral variables.
These hypotheses were tested using descriptive statistics, non-parametric group comparisons, and multivariate regression models. The robustness of the main findings was further assessed using ordered logit and z-standardized OLS estimations.
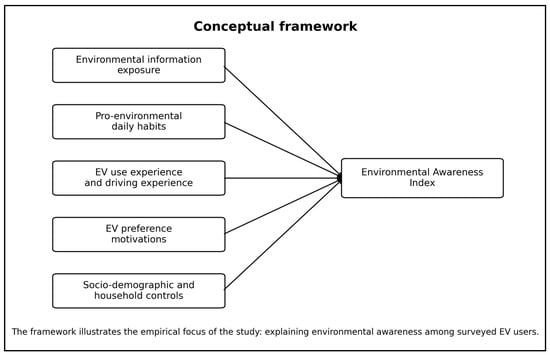
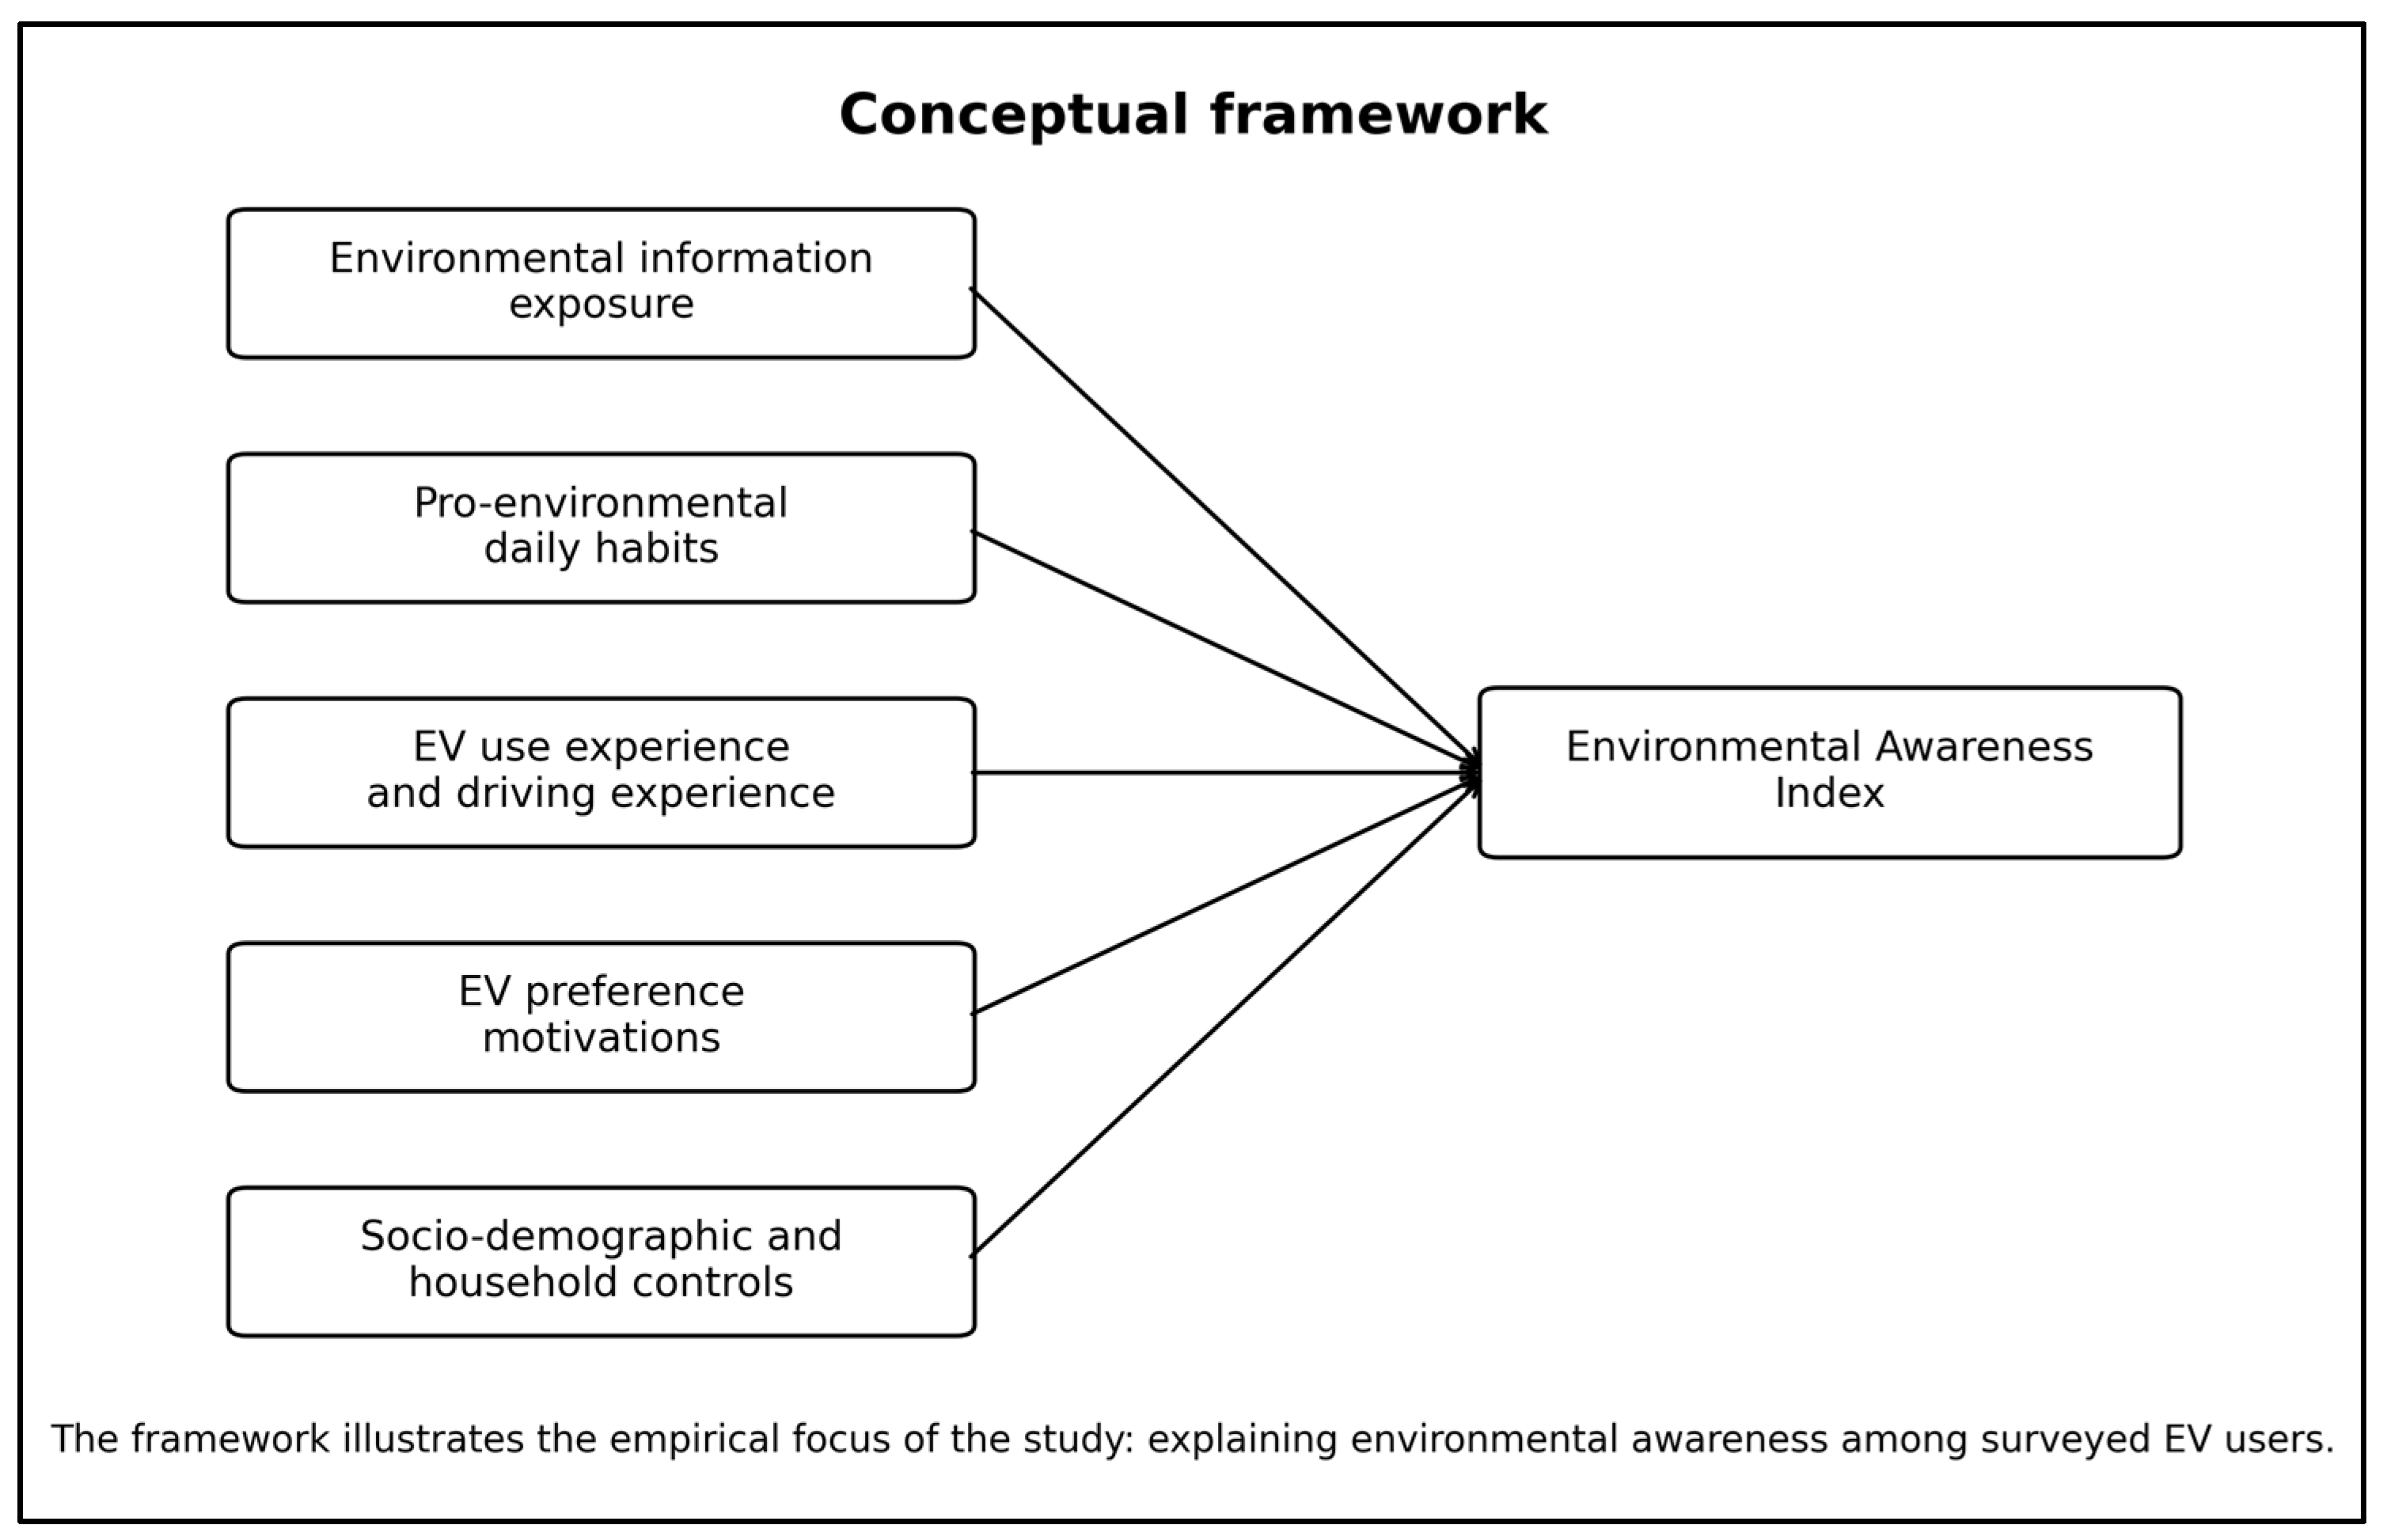
Figure 1 summarizes the conceptual structure of the study by illustrating how environmental information exposure, pro-environmental habits, EV use experience, EV preference motivations, and socio-demographic controls are linked to the Environmental Awareness Index.
Figure 1.
Conceptual framework linking EV preference motivations, EV use experience, environmental information exposure, socio-demographic controls, and environmental awareness.
2.5. Descriptive Statistics
In the first stage of the study, descriptive statistics were used to provide an overview of the general profile of the sample. For this purpose, frequency and percentage distributions were calculated for categorical variables, while mean, standard deviation, median, quartiles, minimum, and maximum values were computed for continuous and ordinal variables. The results are presented in Table 2.
Table 2.
Descriptive statistics.
Table 2 presents the descriptive statistics of the main variables used in the empirical analyses. These statistics provide an overview of the sample characteristics and serve as a basis for the subsequent econometric models.
2.6. Scale Reliability and Validity Analysis
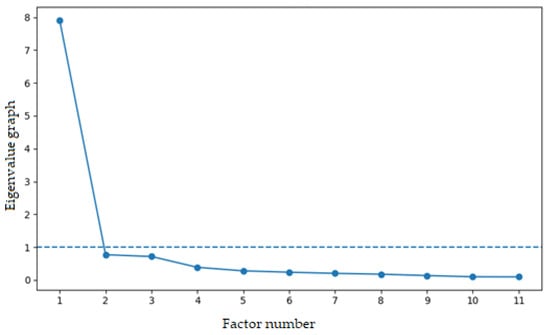
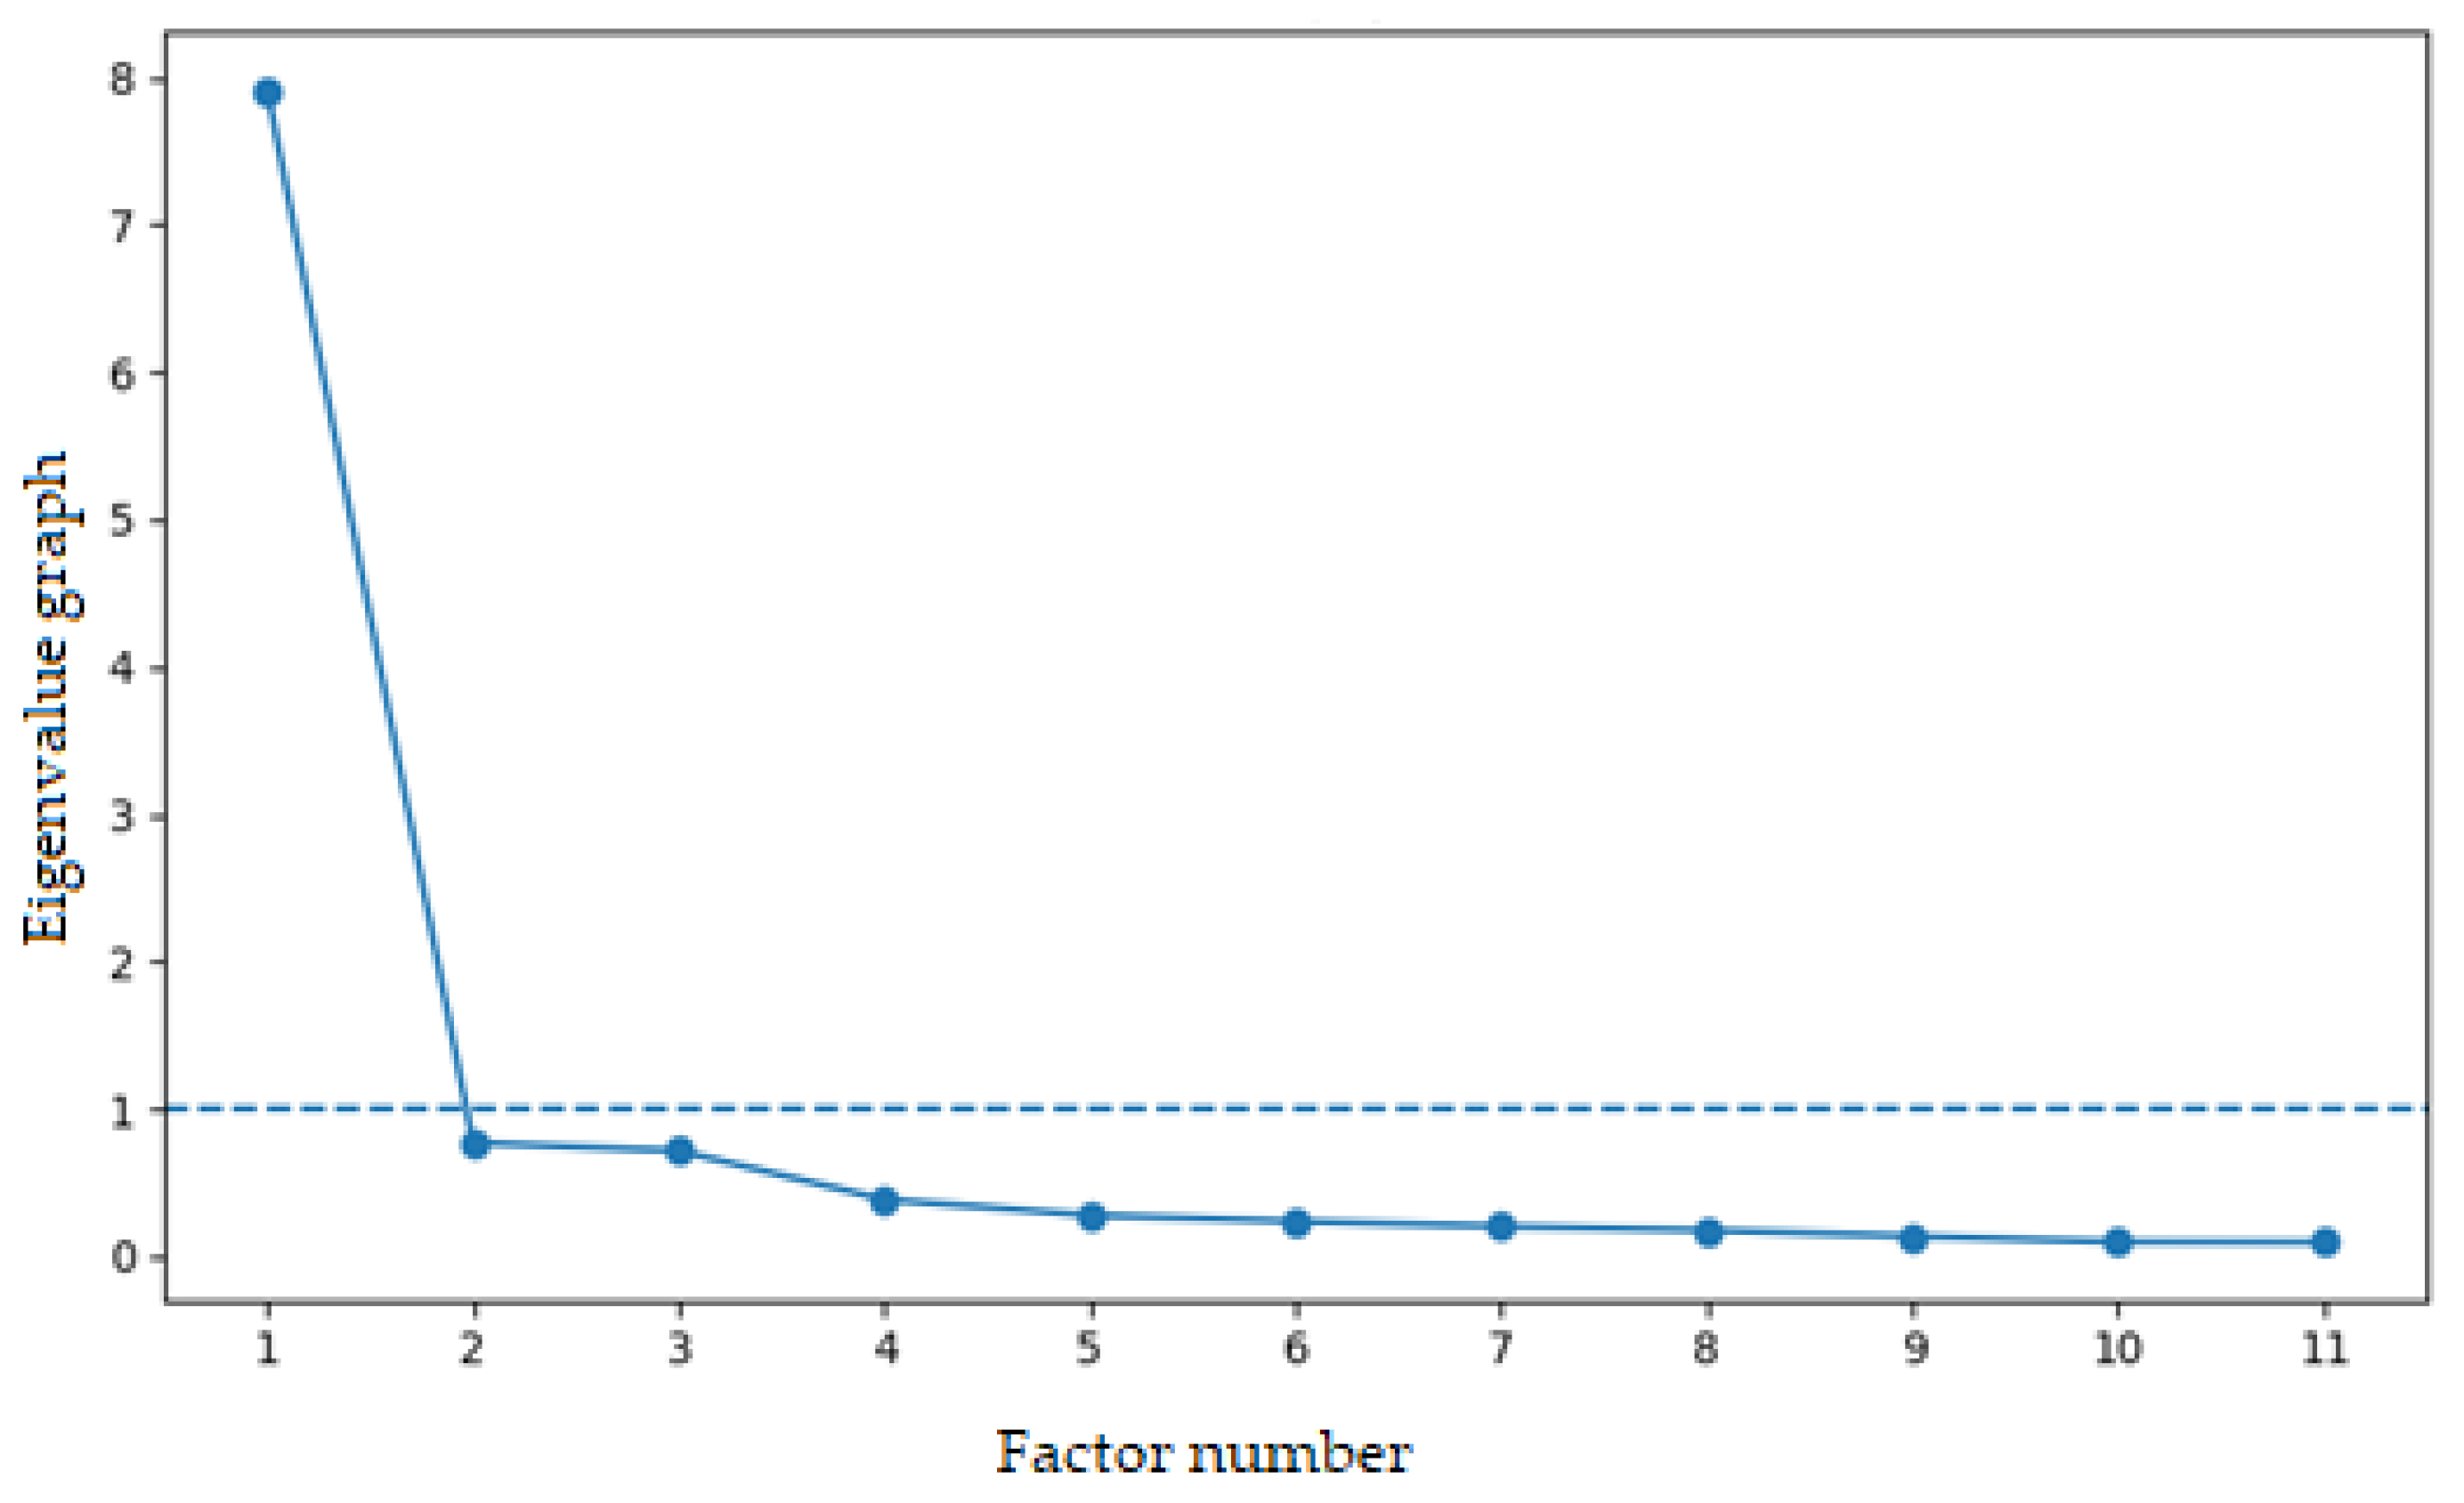
During the Environmental Awareness Indexing, the psychometric properties of the scale items were first examined. To assess internal consistency, Cronbach’s alpha coefficient was calculated, along with corrected item-total correlations and “alpha if item deleted” values for each item. Second, the suitability of the scale for factor analysis was evaluated using the Kaiser-Meyer-Olkin (KMO) measure of sampling adequacy and Bartlett’s test of sphericity. Third, an exploratory factor analysis was conducted to determine eigenvalues, a single-factor solution, factor loadings, communalities, and the total variance explained. The scree plot and eigenvalue graph are presented in Figure 2.
Figure 2.
Scree plot/Eigenvalue graph.
Figure 2 presents the scree plot and eigenvalue plot for the Environmental Awareness Index. The plot shows a distinct breakpoint after the first factor. This supports the idea that the scale has a unidimensional structure. This confirms that a large portion of the variance is explained by a single factor, and all items together measure a single underlying construct: environmental awareness. The high eigenvalue of the first factor (7.9127) supports its dominant role in explaining the variance, while indicating that the contribution of subsequent factors is quite limited. The item analysis results are presented in Table 3.
Table 3.
Environmental Awareness Scale Items and Psychometric Properties.
The conducted tests indicate that the Environmental Awareness scale can be represented as a unidimensional construct with high internal consistency. Accordingly, the Environmental Awareness Index was used as the dependent variable in the econometric models. Figure 2 presents the scree plot and eigenvalue graph, while Table 3 reports Cronbach’s alpha, KMO, Bartlett’s test, and factor loading results.
2.7. Group Comparisons
To determine whether the Environmental Awareness Index differed across demographic and behavioral groups, both pairwise and multiple group comparisons were conducted. Considering the unequal group sizes and the distribution characteristics of the dependent variable, the Mann–Whitney U test was applied for comparisons involving two groups, while the Kruskal–Walli’s test was used for variables with more than two groups. In the Kruskal–Wallis tests, both statistical significance and effect size were considered, with epsilon-squared coefficients calculated. This approach allowed for an assessment of which group variables were associated with differences in environmental awareness and the magnitude of these differences.
2.8. Econometric Modeling
The main econometric framework of the study consists of multivariate linear regression models examining the determinants of environmental awareness. The base model is specified as follows (Equation (1)):
where:
- (env_awareness_index) represents the Environmental Awareness Index score of individual ;
- (env_info_freq_ord) indicates the frequency of obtaining information about environmental issues;
- (eco_habit_count) is the number of pro-environmental behaviors;
- (problem_count) is the number of problems encountered during EV use;
- (other_reason_count) is the number of additional motivations beyond the primary reason for choosing the EVs;
- (ev_use_duration_ord) denotes the duration of EV use;
- (driving_years) is the number of active driving years;
- (household_size) indicates household size;
- (vehicle_count_household_num) is the total number of vehicles in the household;
- represents a vector of demographic and usage-related control variables;
- is the error term.
Since the dependent variable is continuous, the model was initially estimated using Ordinary Least Squares (OLS). To account for potential heteroskedasticity, all models employed HC3 robust standard errors. Variance inflation factors (VIF) were calculated to assess multicollinearity, and the Breusch–Pagan test was used to check the homoscedasticity of errors. The diagnostic tests did not indicate serious multicollinearity or statistically significant heteroskedasticity in the baseline specification. The base model was split into three versions to test the study hypotheses: a behavioral and usage-based model, a sociodemographic model, and a preference motivation model. This stepwise modeling strategy was adopted to align the empirical analysis with the structure of the hypotheses. Model 1 primarily addresses hypotheses related to environmental information, pro-environmental habits, usage experience, and household characteristics. Model 2 adds socio-demographic controls to examine whether these relationships remain stable after accounting for individual characteristics. Model 3 further incorporates EV adoption motivation and charging method variables to assess whether preference-related factors provide additional explanatory value.
Model 1 (Equation (2)) focuses on explaining the Environmental Awareness Index using only behavioral and usage experience variables:
The included variables are the frequency of environmental information acquisition, number of pro-environmental habits, number of problems encountered, number of additional motivation reasons, EV usage duration, driving experience, household size, and household vehicle count. Model 1 serves as the basic equation to identify the core behavioral and experiential determinants of environmental awareness.
Model 2 (Equation (3)) extends Model 1 by incorporating sociodemographic characteristics:
This model controls gender, age group, education level, and income group, testing whether relationships observed in Model 1 remain significant after accounting for individual and socioeconomic characteristics.
Model 3 (Equation (4)) is the most comprehensive specification, adding primary motivation and charging method variables to Model 2:
The inclusion of the primary motivation for EVs choice and charging method allows for examining how environmental awareness varies not only with individual characteristics and behaviors but also with EVs usage practices. Categorical variables were incorporated into the regression models as dummy variables, with reference categories set as male, 18–24 years, postgraduate education, low–middle income, “other” motivation, and “other” charging method. The results of these models are presented in Section 3.4.
2.9. Robustness Analyses
To assess the methodological consistency of the main model findings, two robustness checks were conducted. First, the Environmental Awareness Index was converted into an ordinal dependent variable with three categories using empirical tertile cut-off points. Respondents with index values at or below 3.818 were classified as having low environmental awareness, those above 3.818 and at or below 4.545 were classified as having medium environmental awareness, and those above 4.545 were classified as having high environmental awareness. An ordered logit model was then estimated under the framework of an ordinal dependent variable. The model is specified as follows (Equation (5)):
where represents the latent environmental awareness tendency underlying the observed low, medium, and high awareness categories. Infoi denotes the frequency of obtaining environmental information, denotes the number of environmentally friendly habits, denotes the number of problems encountered during EV use, denotes the number of additional EV preference reasons, denotes EV usage duration, denotes years of active driving experience, denotes household size, and denotes household vehicle ownership. represents the same additional covariates included in the full OLS specification, including socio-demographic controls, primary motivation categories, and charging method controls. In the compact robustness table, the main explanatory variables and selected controls are reported, while age group, income group, and charging method controls are included in the estimation but not displayed. The ordered logit model was applied to test whether the direction of the main associations remains stable when the dependent variable is treated as ordinal.
Second, the Environmental Awareness Index was z-standardized and the OLS model was re-estimated using this standardized dependent variable. Since only the dependent variable was standardized, this model should be interpreted as a scale-sensitivity check rather than as a fully standardized coefficient model. Accordingly, the z-standardized OLS results are used to assess whether the direction of the associations is sensitive to the scaling of the Environmental Awareness Index.
2.10. Methodological Limitations
Due to constraints encountered during the survey data collection process, the sample size was limited to 209 observations, leading the study to adopt a cross-sectional design. This limitation restricts the ability to make causal inferences. Therefore, the findings should not be interpreted as evidence of direct causality, but rather as associations between variables.
In addition, the non-probabilistic nature of the sample limits the external validity of the results. Furthermore, since the ordered logit model relies on the assumption of an ordinal dependent variable, the results obtained from this model should be considered as complementary to the main OLS findings rather than as standalone evidence. Another methodological limitation concerns the scope of the control variables included in the empirical models. Although the present study includes behavioral, experiential, socio-demographic, adoption-motivation, and charging-method variables, the current model specification does not include several potentially relevant contextual, economic, political, infrastructural, and vehicle-specific factors, such as EVs model or type, purchase price, subsidies actually received, commuting distance, previous vehicle type, home ownership, private versus business use, urban or rural location, electricity prices, fuel prices, regional charging infrastructure, household income stability, and political or environmental value orientations. These factors may influence both EV adoption decisions and environmental awareness and should therefore be considered in future research or in extended model specifications where such data are available.
Accordingly, the findings should be interpreted with caution. The results identify associations within the variables included in the present empirical framework, but they do not provide a fully comprehensive model of EV adoption behavior. Future studies using larger, probabilistic, and regionally stratified samples should incorporate broader economic, geographic, infrastructural, political, and vehicle-specific control variables to improve external validity and explanatory power.
3. Results and Discussion
3.1. General Characteristics of the Sample and Descriptive Findings
The overall demographic profile of the survey participants is presented in Table 4.
Table 4.
Descriptive Statistics of the Sample.
An examination of the demographic structure of the 209 survey participants shows that approximately 86% are male and 14% are female. In terms of age distribution, the sample is mainly concentrated in middle-aged groups, with the largest share (approximately 41%) belonging to the 35–44 age group, followed by the 25–34 age group at around 33%.
Regarding education level, the majority of participants have a higher education background. University graduates account for approximately 59% of the sample, while those with a master’s or PhD degree represent about 22%. The income distribution indicates that the sample is concentrated in middle and upper-middle income groups, with approximately 58% of participants reporting a monthly income of 90,001 TRY or above.
This demographic profile is consistent with previous studies such as Plötz et al. [24] and Sovacool et al. [25], which report that EVs owners are predominantly male. From an educational perspective, the predominance of university and postgraduate graduates aligns with the findings of Lee et al. [26] and Hardman et al. [27], who suggest that more educated individuals are more likely to adopt and invest in new technologies.
Furthermore, the fact that participants are from higher income groups and are particularly concentrated in this area indicates that the transition to EVs is currently widespread among individuals with higher purchasing power. This finding is consistent with studies such as Bjerkan et al. [28] and Axsen et al. [29], which suggest that a certain income threshold must be exceeded for environmental awareness to translate into actual behavioral change.
Looking at the profile of EV users, it is seen that a significant portion of the participants are new users. Accordingly, 56.94% of users have been using EVs for less than a year, 29.19% for 1–2 years, and 7.18% for two years or more. This shows that environmental awareness has increasingly transformed into behavior in recent years due to the impact of technological developments, rather than being a long-standing phenomenon [30].
In terms of access to charging infrastructure, the proportions of participants who charge their vehicles at home and those who use public charging stations are similar. The rate of charging at the workplace is more limited at 11.96%. This finding highlights the critical dependence of EV use on both private and public charging facilities. Considering access to charging facilities, it is thought that public policies should not only support the use of EVs but also support charging infrastructure to ensure spatial equality. Furthermore, charging stations in workplaces can be considered a next-generation perk supporting employees’ transition to greener mobility. The presence of such infrastructure in workplaces has been shown to facilitate the integration of environmental awareness into employees’ daily practices [31].
Responses to the question regarding the frequency of obtaining information about environmental issues are mainly concentrated in the “occasionally” and “frequently” categories (approximately 72%). While 15% of respondents reported that they obtain information “very frequently,” around 8% indicated that they do so “rarely.” These findings suggest that the participants in the sample are not completely disconnected from environmental issues and related public discourse.
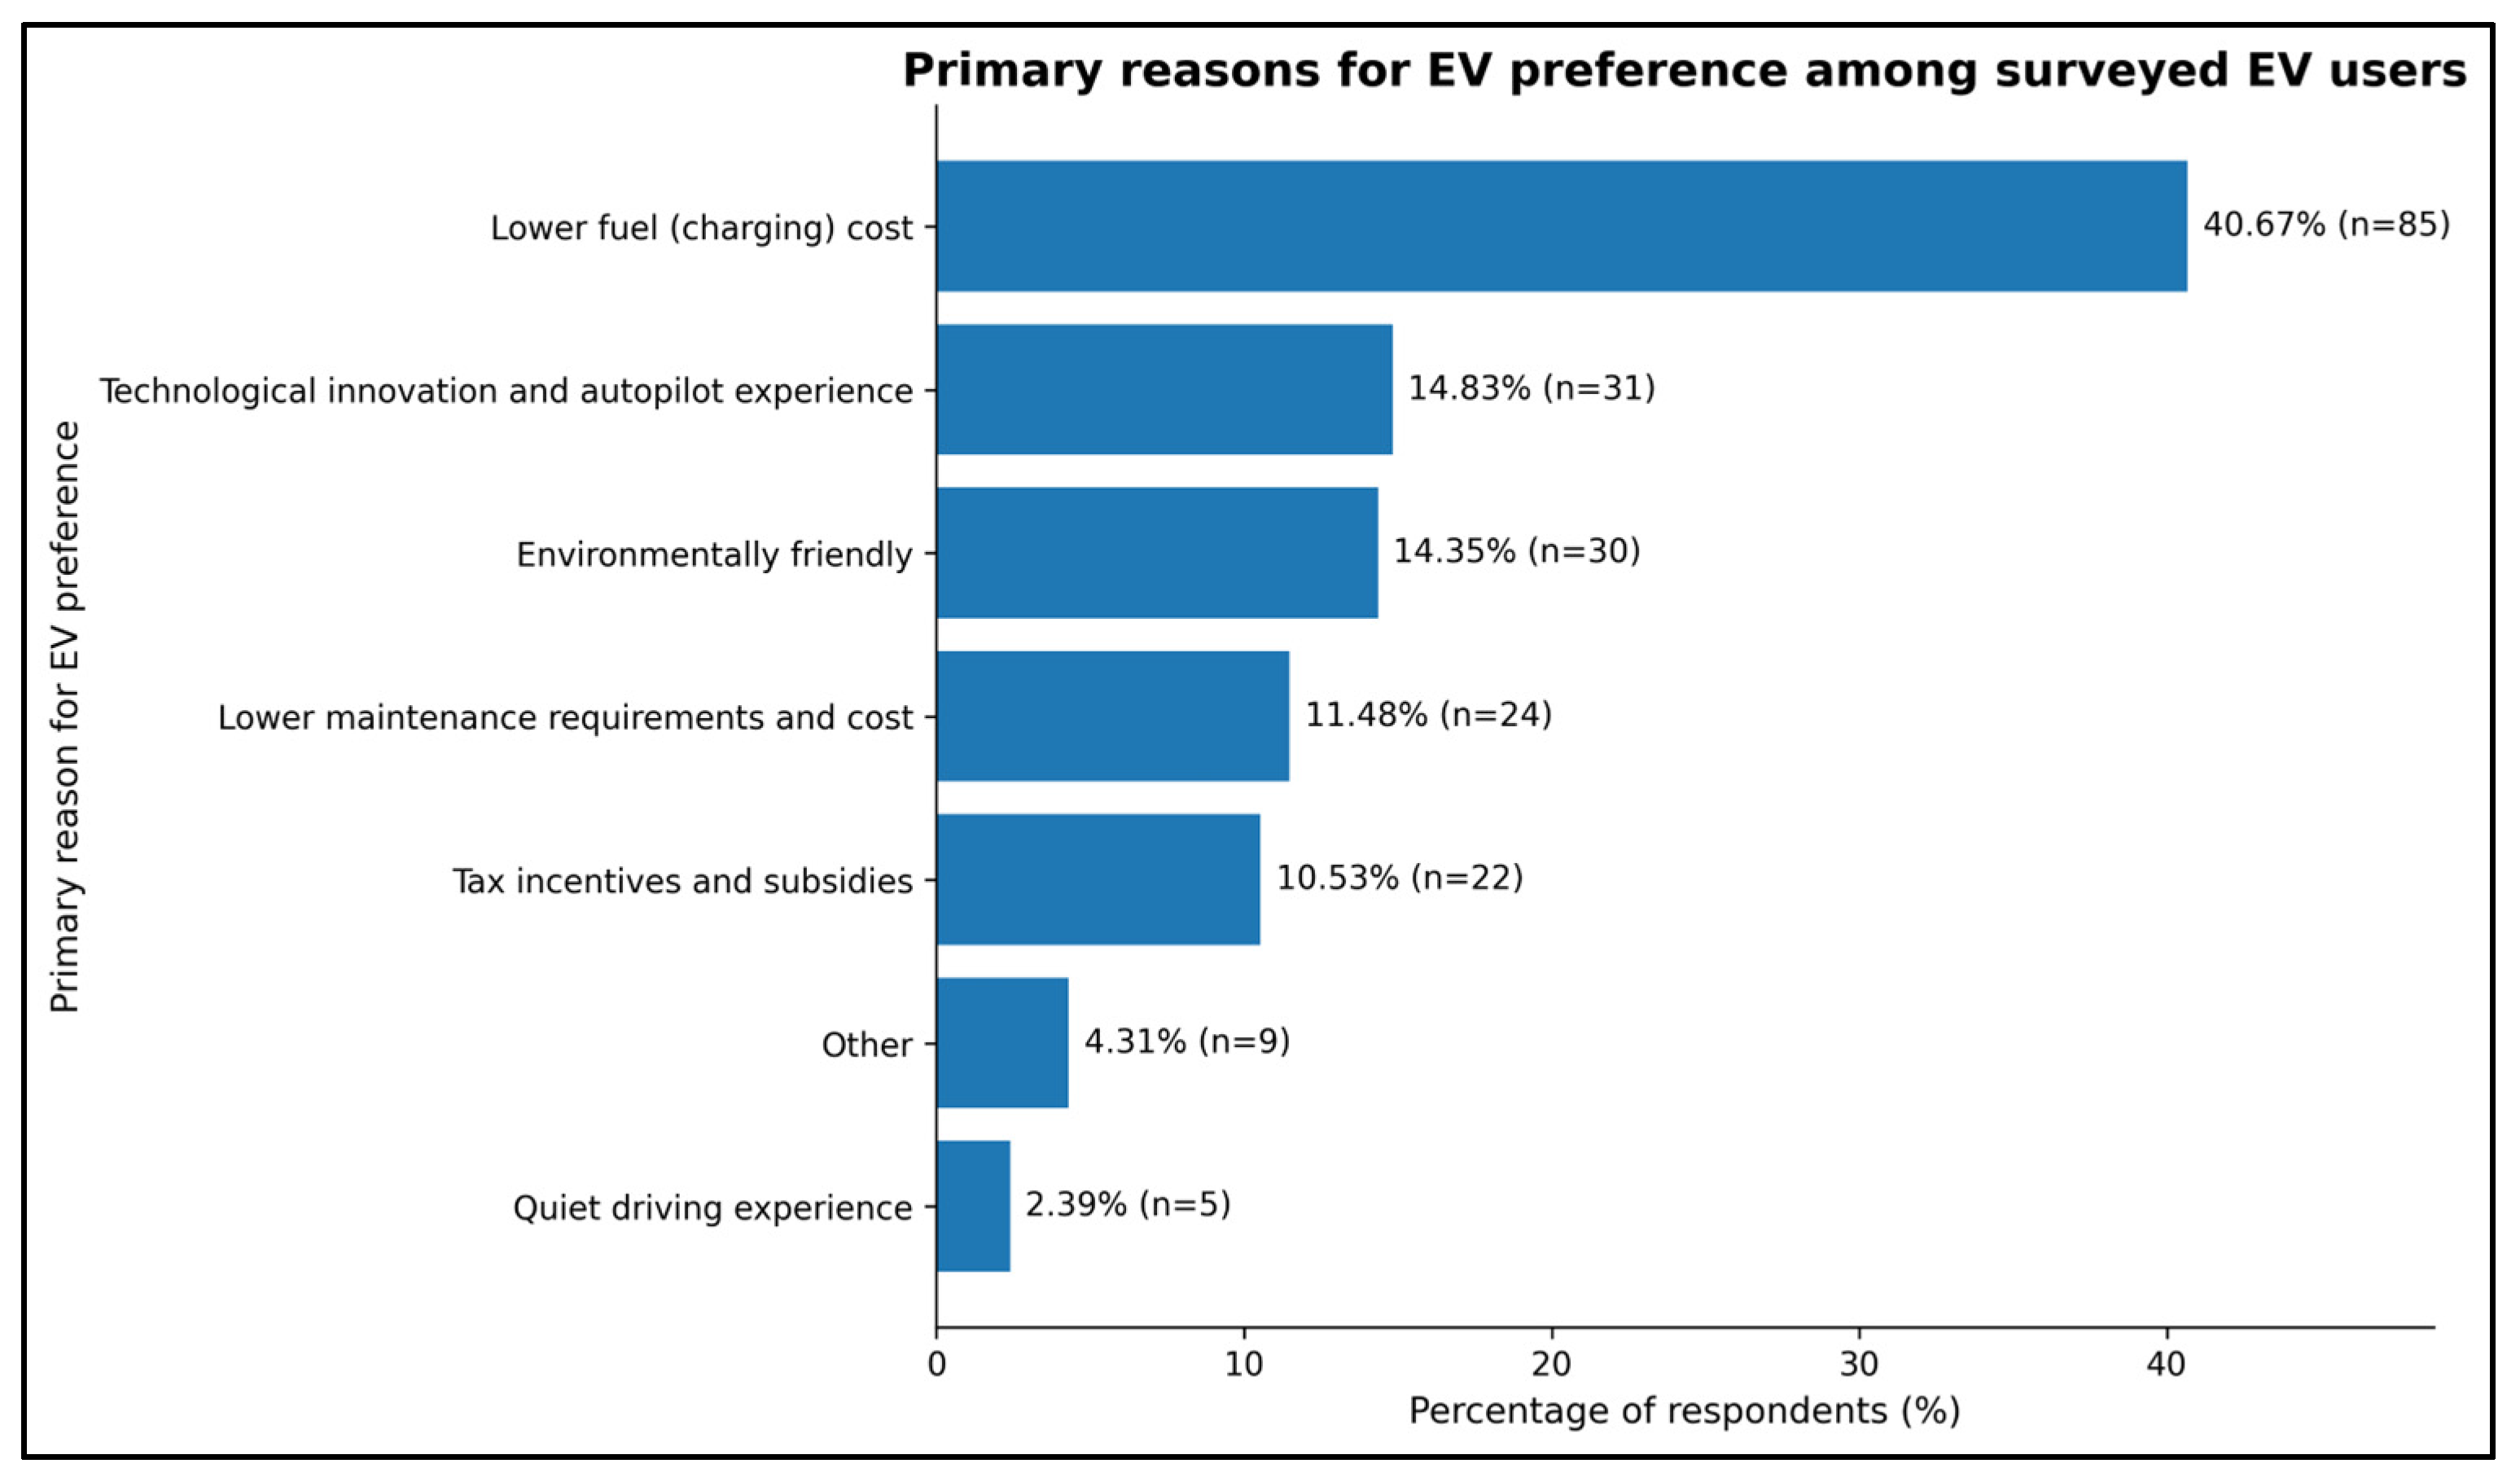
To visually summarize the distribution of stated EV preference motivations, Figure 3 presents the percentage distribution of respondents’ primary reasons for choosing an EV.
Figure 3.
Primary reasons for EV preference among surveyed EV users.
The figure shows that lower fuel or charging cost is the most frequently reported primary motivation, followed by technological innovation and environmental considerations. This visual pattern supports the descriptive interpretation that cost-related and pragmatic considerations are prominent among the surveyed EV users.
Regarding the reasons for choosing EVs, the most frequently reported motivations are lower fuel cost, technological innovation, environmental friendliness, and lower maintenance costs. Overall, economic reasons account for approximately 62.68% of total responses, technological reasons for 17.22%, and environmental reasons for 14.35%. These descriptive results suggest that cost-related considerations are the most frequently reported motivations for EV preference in this sample [32]. In addition, the most frequently reported problem encountered in EV use was limited driving range (62.20%), followed by long charging time (35.41%), high fast-charging costs (35.41%), and insufficient availability of charging stations (30.62%). On the other hand, beyond EVs usage, participants reported several other environmentally friendly practices, including avoiding water wastage (73.68%), using energy-efficient appliances (60.77%), and waste separation according to type (52.63%). These findings suggest that participants’ environmentally friendly behavioral patterns are to some extent reflected in their daily life practices.
3.2. Findings on the Environmental Awareness Scale
The dependent variable used in the study, the Environmental Awareness Index, was constructed by taking the mean of 11 reverse-coded Likert-scale items listed in Table 3. The index has a mean value of 3.887, a standard deviation of 1.037, a median of 4.091, a minimum value of 1, and a maximum value of 5, based on 206 observations. These descriptive statistics indicate a relatively high level of environmental awareness within the sample. The difference between the 206 observations used for the index descriptives and the 195 observations used in the reliability and factor analyses arises from the use of listwise complete observations across all eleven Likert items for the psychometric tests.
At the item level, participants generally evaluate the environmental contributions of EVs positively. In particular, responses are strongly concentrated on statements emphasizing that EVs reduce air pollution, cause less environmental harm compared to fossil fuel vehicles, and are effective in reducing transport-related environmental pollution. This pattern reflects a high level of agreement with environmentally favorable perceptions of EVs across the sample.
However, agreement with the statement “My environmental awareness has increased after using EVs” is comparatively lower than other items. This suggests that respondents perceive the impact of EVs usage on their own environmental awareness as more limited, indicating that the relationship between usage experience and changes in environmental consciousness is not strongly internalized by all participants.
As shown in Table 5, the Cronbach’s alpha coefficient, which indicates the internal consistency of the scale, was found to be 0.959. This value suggests that the scale has a very high level of reliability. The suitability of the scale for factor analysis was assessed using the Kaiser–Meyer–Olkin (KMO) measure of sampling adequacy and Bartlett’s test of sphericity. The obtained KMO value of 0.939 indicates that the sample is at an excellent level for factor analysis.
Table 5.
Scale Reliability and Factor Analysis Results.
The results of the exploratory factor analysis show that the scale predominantly exhibits a unidimensional structure. In the eigenvalue examination, the first factor was found to have an eigenvalue of 7.913, with a high explanatory power of approximately 69%.
3.3. Group Comparisons Results
To examine whether the Environmental Awareness Index differs significantly across groups, non-parametric tests were applied. The Mann–Whitney U test was used for pairwise comparisons, while the Kruskal–Wallis test was employed for multiple group comparisons (Table 6).
Table 6.
Results of Group Comparisons.
Regarding gender differences, the Mann–Whitney U test results indicate that there is no statistically significant difference in environmental awareness between male and female participants (U = 2308, p = 0.5912). Although not statistically significant, the mean environmental awareness score was 3.897 for male participants and 3.873 for female participants. This finding suggests that environmental attitudes do not differ substantially by gender within the sample.
For multiple group comparisons, no statistically significant differences were found across age, education level, income level, EV usage duration, and charging method. Specifically, the results were as follows: age groups (H = 5.1557; p = 0.2717), education level (H = 0.6772; p = 0.8786), income level (H = 1.1116; p = 0.8924), EV usage duration (H = 0.7441; p = 0.6893), and charging method (H = 4.1602; p = 0.2447). These findings suggest that environmental awareness is not primarily driven by basic sociodemographic differences in this sample, but is more closely associated with behavioral and perceptual factors.
In contrast, environmental awareness levels differ significantly according to the frequency of obtaining information about environmental issues (H = 12.6691; p = 0.0130). Although the effect size is limited, it is positive (epsilon-squared = 0.0442). Group means indicate that individuals who “very frequently” obtain environmental information have the highest environmental awareness score (4.202), while those who “rarely” obtain such information show a lower score (3.466). This result suggests that greater exposure to environmental information is associated with higher environmental awareness.
Similarly, the primary reason for choosing the EVs also leads to statistically significant differences in environmental awareness (H = 17.4210; p = 0.0079; epsilon-squared = 0.0577). Group means show that environmental awareness is higher among those who report “technological innovation and autopilot experience” (4.231) and “environmentally friendly” reasons (4.127), while it is relatively lower among those who cite “tax incentives and subsidies” (3.508) and “lower maintenance requirements and costs” (3.742). This finding indicates that the motivation behind EV adoption is associated with the level of environmental awareness.
3.4. Multivariate Regression Findings
To identify the determinants of the Environmental Awareness Index, three econometric models were developed. These models were estimated using a three-stage OLS approach. In all models, heteroskedasticity-robust HC3 standard errors were employed (Table 7).
Table 7.
OLS Models: Results for Model 1, Model 2, and Model 3.
Model 1, as can be observed from the table above, includes individuals’ behavioral and usage-related variables. The model is statistically significant (Model p = 0.0033), although its explanatory power is limited (R2 = 0.0789; adjusted R2 = 0.0358). Among the included variables, only active driving experience has a positive and statistically significant effect (β = 0.0212, p = 0.0033). In other words, greater driving experience is associated with higher levels of environmental awareness. The remaining variables in the model are not statistically significant.
Model 2 is constructed by adding sociodemographic variables to Model 1. With the inclusion of these variables, the explanatory power of the model increases slightly (R2 = 0.1103). In this model, the frequency of obtaining environmental information shows a positive effect and approaches statistical significance (β = 0.1812; p = 0.0735). Similarly, the “low education and below” category in education level shows a positive coefficient and is close to marginal significance compared to the reference category (β = 0.4973; p = 0.0891). In contrast, gender, age groups, income level, number of environmentally friendly habits, number of problems encountered, EV usage duration, and household-related variables are not statistically significant. This pattern suggests that environmental awareness is partly shaped by environmental information exposure; however, this relationship is neither strong nor strictly unidirectional.
Model 3 presents a model that includes all the variables used in the study. In addition to Model 2, primary motivation and charging method variables were added as control variables. The explanatory power of the model increased to R2 = 0.1832. However, none of the coefficients are statistically significant at the 5% level. Nevertheless, the frequency of acquiring environmental information remains positively signed (β = 0.1596; p = 0.1080). Similarly, driving experience continues to show a positive coefficient but is not statistically significant (β = 0.0205; p = 0.1626). Primary motivation categories and charging method variables also do not produce statistically significant differences in environmental awareness in the fully controlled model. Therefore, the multivariate framework shows that although some relationships exist, their magnitudes are limited and sensitive to model specification. In addition, the explanatory power of the models remains modest, suggesting that environmental awareness is likely influenced by additional psychological, social, and contextual factors that were not captured in the present survey. Therefore, the reported findings should be interpreted as associations rather than as a comprehensive explanation of environmental awareness among EV users.
Model diagnostics indicate that the baseline OLS specification is technically acceptable. Variance inflation factors (VIFs) for Model 1 range between 1.04 and 1.16, indicating no serious multicollinearity problems. The Breusch–Pagan test further confirms the absence of heteroskedasticity (LM p = 0.5905; F p = 0.6017).
3.5. Robustness Analyses Results
Two additional robustness tests were conducted to validate the main findings of the study. First, an ordered logit model was estimated to account for the ordinal structure of the dependent variable. Second, an alternative OLS model was estimated using a z-standardized version of the Environmental Awareness Index. The corresponding results are reported in Table 8.
Table 8.
Robustness Analyses for the Environmental Awareness Index: Ordered Logit and Z-Standardized OLS Results.
The ordered logit results provide partial support for the directional stability of the main findings. Specifically, the frequency of obtaining information about environmental issues is positively and statistically significantly associated with higher ordinal categories of environmental awareness (b = 0.4828, p = 0.013; OR = 1.621). Similarly, active driving experience is also positive and significant (b = 0.0568, p = 0.046; OR = 1.058). In contrast, the number of vehicles in the household shows a negative and statistically significant association (b = −0.7276, p = 0.030; OR = 0.483). These results suggest that higher levels of environmental awareness are more likely among respondents with greater exposure to environmental information and longer driving experience, whereas household vehicle intensity is negatively associated with higher awareness categories.
These results suggest that higher levels of environmental awareness are particularly associated with greater exposure to environmental information and driving experience, while household vehicle intensity reduces this likelihood. The ordered logit model was estimated as an alternative specification because environmental awareness can also be interpreted as an ordinal construct when categorized into low, medium, and high levels. The consistency of the coefficient signs across the OLS and ordered logit models, together with the persistence of the key relationships, suggests that the main findings are not dependent on the choice of estimation technique. Taken together, the robustness analyses indicate that the main conclusions remain broadly unchanged across alternative model specifications. In particular, the frequency of obtaining environmental information and driving experience consistently exhibit positive associations with environmental awareness, while household vehicle ownership remains negatively associated. Although statistical significance varies across specifications, the stability of coefficient directions suggests that the substantive interpretation of the findings is robust to alternative estimation approaches and scaling procedures.
In the alternative OLS model estimated using the z-standardized dependent variable, the direction of the coefficients is largely preserved. In particular, the frequency of obtaining environmental information (b = 0.1539, p = 0.108) and active driving experience (b = 0.0198, p = 0.163) remain positively signed, although they lose statistical significance. Since only the dependent variable was standardized, these coefficients should be interpreted as changes in the standardized Environmental Awareness Index associated with one-unit changes in the explanatory variables, rather than as fully standardized beta coefficients. Therefore, the z-standardized OLS model should be understood as a scale-sensitivity check.
Taken together, the robustness checks provide partial support for the directional stability of the main associations, although statistical significance varies across specifications. The results should therefore be interpreted as complementary evidence rather than as definitive confirmation of the main OLS findings.
4. Conclusions and Policy Recommendations
This study empirically examined EV users’ preference motivations, usage experiences, and environmental awareness levels. The findings indicate that environmental awareness among surveyed EV users is generally high. At the same time, descriptive results suggest that economic considerations are the most frequently reported motivations for EV preference in this sample. However, the multivariate analyses provide only limited evidence regarding the independent relationship between adoption motives and environmental awareness. Therefore, EV ownership should not be interpreted as a direct indicator of a strong environmentally conscious identity. Rather, the findings suggest that EV preference among the surveyed users reflects a combination of cost advantages, technological perceptions, and environmental sensitivity.
A key finding of the study is that individuals who are more frequently exposed to environmental information tend to have higher levels of environmental awareness. In line with this finding, it is thought that increased public exposure to environmental information could increase the likelihood of raising societal environmental awareness, which could be a significant gain for policymakers. Furthermore, the positive correlation between driving experience and environmental awareness, and the negative correlation between the number of vehicles in a household and environmental awareness, demonstrates that environmental awareness is shaped not only by individual attitudes but also by user experience and household structure. More targeted policy measures may also enhance both EV adoption and environmental awareness. Considering that EV ownership in the sample is concentrated among relatively higher-income individuals, policymakers may consider introducing targeted financial incentives, such as income-sensitive purchase subsidies or preferential financing schemes, to improve accessibility for middle- and lower-income households. Furthermore, since charging-related concerns remain among the most frequently reported barriers, expanding charging infrastructure in underserved regions may contribute to a more balanced diffusion of EVs across the country. Finally, because exposure to environmental information emerged as one of the most consistent correlates of environmental awareness, public information campaigns focusing on sustainable mobility, battery recycling, and climate-related benefits of EVs could complement economic incentives and support broader behavioral change.
All findings contain important implications for the formulation of policies related to EVs. Firstly, it appears that policies aimed at encouraging the adoption of EVs should not rely solely on tax incentives, subsidies, or infrastructure investments. While economic incentives play a highly decisive role in user decisions in developing countries like Turkey, a sustainable green transition also requires greater emphasis on environmental awareness and its dissemination. Therefore, public policies should address the adoption of EVs not only as a consumption choice but also as an environmental policy tool.
Secondly, the results show that the most common problems users encounter are limited driving range, long charging times, high-speed charging costs, and inadequate charging infrastructure. Accordingly, policymakers must acknowledge that individual purchase incentives alone are insufficient. More effective results require the simultaneous development of infrastructure investments, accessible charging networks, and user-friendly, cost-effective systems. Otherwise, the environmental potential of EVs may not be fully realized due to practical limitations in user experience.
Thirdly, the study highlights a positive relationship between exposure to environmental information and environmental awareness, emphasizing the importance of targeted awareness-raising and information campaigns conducted by central and local governments, universities, and NGOs. Communication strategies that specifically highlight the environmental dimensions of EVs, such as carbon emissions, improved air quality, energy transition, and battery recycling, are likely to strengthen the environmental orientation of user profiles.
In addition to its empirical contributions, this study is also aligned with Sustainable Development Goals (SDGs) 7 (Affordable and Clean Energy), 11 (Sustainable Cities and Communities), and 13 (Climate Action). The findings demonstrate that the proliferation of EVs contributes to the transition to cleaner energy systems and lower urban emissions, but the sustainability impact of this transition depends not only on technological adoption but also on fostering environmental awareness and behavioral change among users. In this context, promoting EV adoption without strengthening environmental awareness may limit the broader societal impact of sustainability policies. Therefore, policy frameworks should integrate technological innovation with behavioral transformation strategies to ensure that the transition to sustainable mobility systems effectively contributes to long-term climate goals and urban sustainability.
Future research should extend this analysis by using larger and more representative samples and by incorporating additional vehicle-specific, economic, geographic, infrastructural, and value-related variables, such as EVs model type, purchase price, subsidies actually received, commuting distance, home ownership, prior vehicle type, private versus business use, electricity and fuel prices, regional charging infrastructure, household income stability, and political or environmental value orientations.
Overall, the most important conclusion of this study is that EVs policies should not be limited to simply increasing the number of vehicles, but should instead aim to build a more informed, sustainable, and environmentally conscious society.
Author Contributions
Conceptualization, A.İ.B., C.E. and M.P.A.; Methodology, A.İ.B., C.E. and M.P.A.; Investigation, A.İ.B., C.E. and M.P.A.; Data curation, A.İ.B.; Writing—original draft, A.İ.B., C.E. and M.P.A.; Writing—review & editing, A.İ.B., C.E. and M.P.A. All authors have read and agreed to the published version of the manuscript.
Funding
This research received no external funding.
Institutional Review Board Statement
The study was conducted in accordance with the Declaration of Helsinki, and the protocol was approved by the Zonguldak Bülent Ecevit University Ethics Committee (Protocol No: 179) on 6 October 2025.
Informed Consent Statement
Informed consent for participation was obtained from all subjects involved in the study.
Data Availability Statement
The data presented in this study are available on request from the corresponding author. The data are not publicly available due to privacy and ethical restrictions, as the study involved survey participants and the dataset may contain information that could potentially compromise participant confidentiality.
Conflicts of Interest
The authors declare no conflict of interest.
References
- IPCC. Intergovernmental Panel on Climate Change 2014, Synthesis Report; Plattner, G.-K., Ed.; IPCC: Geneva, Switzerland, 2014. [Google Scholar]
- Bolan, S.; Padhye, L.P.; Jasemizad, T.; Govarthanan, M.; Karmegam, N.; Wijesekara, H.; Amarasiri, D.; Hou, D.; Zhou, P.; Biswal, B.K.; et al. Impacts of Climate Change on the Fate of Contaminants through Extreme Weather Events. Sci. Total Environ. 2024, 909, 168388. [Google Scholar] [CrossRef] [Scilit] [PubMed]
- Pfenning-Butterworth, A.; Buckley, L.B.; Drake, J.M.; Farner, J.E.; Farrell, M.J.; Gehman, A.-L.M.; Mordecai, E.A.; Stephens, P.R.; Gittleman, J.L.; Davies, J. Interconnecting Global Threats: Climate Change, Biodiversity Loss, and Infectious Diseases. Lancet Planet Health 2024, 8, 270–283. [Google Scholar] [CrossRef] [Scilit]
- Che, W.; Yang, C. Human Awareness and Behavior on the Driving of Sustainable City Environment. Sustain. Cities Soc. 2024, 112, 105604. [Google Scholar] [CrossRef] [Scilit]
- Degirmenci, K.; Breitner, M.H. Consumer Purchase Intentions for Electric Vehicles: Is Green More Important than Price and Range? Transp. Res. Part D Transp. Environ. 2017, 51, 250–260. [Google Scholar] [CrossRef] [Scilit]
- Alatawneh, A.; Ghunaim, D. Towards Vehicle Electrification: A Mathematical Prediction of Battery Electric Vehicle Ownership Growth, the Case of Turkey. Green Energy Intell. Transp. 2024, 3, 100166. [Google Scholar] [CrossRef] [Scilit]
- Şişman, İ.N.; Çarklı Yavuz, B. Determinants of Electric Vehicle Adoption Intentions in Turkey: An Explainable Machine Learning Analysis of Economic, Infrastructure, and Behavioral Factors. Sustainability 2026, 18, 2463. [Google Scholar] [CrossRef] [Scilit]
- Pamidimukkala, A.; Kermanshachi, S.; Rosenberger, J.M.; Hladik, G. Barriers and Motivators to the Adoption of Electric Vehicles: A Global Review. Green Energy Intell. Transp. 2024, 3, 100153. [Google Scholar] [CrossRef] [Scilit]
- Quaglieri, L.; Mercuri, F.; Fraccascia, L. Investigating Consumer Behaviour Towards Electric Vehicles: A Systematic Literature Review. Circ. Econ. Sustain. 2025, 5, 1419–1450. [Google Scholar] [CrossRef] [Scilit]
- Ajzen, I. The Theory of Planned Behavior. Organ. Behav. Hum. Decis. Process. 1991, 50, 179–211. [Google Scholar] [CrossRef] [Scilit]
- Stern, P.C. Toward a Coherent Theory of Environmentally Significant Behavior. J. Soc. Issues 2000, 56, 407–424. [Google Scholar] [CrossRef] [Scilit]
- Davis, F.D. Perceived Usefulness, Perceived Ease of Use, and User Acceptance of Information Technology Available to Purchase. Theory Rev. Artic. 1989, 13, 319–340. [Google Scholar] [CrossRef] [Scilit] [PubMed]
- Dutta, B. Understanding Pro-Environmental Behavior in Sustainable Mobility: An Integrated Framework for Electric Vehicle (EV) Purchase Intentions. Sustainability 2025, 17, 8632. [Google Scholar] [CrossRef] [Scilit]
- Mustafa, S.; Shi, Y.; Adan, D.E.; Luo, W.; Al Humdan, E. Role of Environmental Awareness & Self-Identification Expressiveness in Electric-Vehicle Adoption. Transportation 2024, 53, 861–885. [Google Scholar] [CrossRef] [Scilit]
- Wang, Y.; Witlox, F. Global Trends in Electric Vehicle Adoption and the Impact of Environmental Awareness, User Attributes, and Barriers. Energy Rep. 2025, 13, 1125–1137. [Google Scholar] [CrossRef] [Scilit]
- Prakhar, P.; Jabeen, F.; Jaiswal, R.; Gupta, S.; Piccardi, P.; Jose, S. Mapping the Electric Vehicle Adoption Scholarship for Sustainability: An Integrated Theoretical Framework and Future Research Directions. Manag. Environ. Qual. 2025, 36, 249–276. [Google Scholar] [CrossRef] [Scilit]
- Patil, P. An Empirical Study of the Factors Influencing the Adoption of Electric Vehicles. Contemp. Issues Behav. Soc. Sci. 2022, 4, 1–13. [Google Scholar] [CrossRef] [Scilit]
- Agarwal, R. Key Determinants of Electric Vehicle Adoption: A Comprehensive Review. Int. J. Adv. Electr. Eng. 2024, 5, 142–147. [Google Scholar] [CrossRef] [Scilit]
- Kottala, S.Y.; Chanagala, S.; Balaji, C.; Reddy, V.V.N.; Babu, G.N.P.V. Exploring Electric Vehicle Consumer Behavior: Impact of Digital Innovation, Environmental Concern, Perceived Value, and Social Influence on Purchase Intentions. Front. Sustain. Cities 2025, 7, 1655074. [Google Scholar] [CrossRef] [Scilit]
- Zaino, R.; Ahmed, V.; Alhammadi, A.M.; Alghoush, M. Electric Vehicle Adoption: A Comprehensive Systematic Review of Technological, Environmental, Organizational and Policy Impacts. World Electr. Veh. J. 2024, 15, 375. [Google Scholar] [CrossRef] [Scilit]
- Bryła, P.; Chatterjee, S.; Ciabiada-Bryła, B. Consumer Adoption of Electric Vehicles: A Systematic Literature Review. Energies 2023, 16, 205. [Google Scholar] [CrossRef] [Scilit]
- Bektaş, B.C.; Akyıldız Alçura, G. Understanding Electric Vehicle Adoption in Türkiye: Analyzing User Motivations Through the Technology Acceptance Model. Sustainability 2024, 16, 9439. [Google Scholar] [CrossRef] [Scilit]
- Stajić, D.; Pfeifer, A.; Herc, L.; Logonder, M. Early Adoption of Battery Electric Vehicles and Owners’ Motivation. Clean. Eng. Technol. 2023, 15, 100658. [Google Scholar] [CrossRef] [Scilit]
- Plötz, P.; Schneider, U.; Globisch, J.; Dütschke, E. Who Will Buy Electric Vehicles? Identifying Early Adopters in Germany. Transp. Res. Part A Policy Pract. 2014, 67, 96–109. [Google Scholar] [CrossRef] [Scilit]
- Sovacool, B.K.; Kester, J.; Noel, L.; de Rubens, G.Z. The Demographics of Decarbonizing Transport: The Influence of Gender, Education, Occupation, Age, and Household Size on Electric Mobility Preferences in the Nordic Region. Glob. Environ. Change 2018, 52, 86–100. [Google Scholar] [CrossRef] [Scilit]
- Lee, J.H.; Hardman, S.J.; Tal, G. Who Is Buying Electric Vehicles in California? Characterising Early Adopter Heterogeneity and Forecasting Market Diffusion. Energy Res. Soc. Sci. 2019, 55, 218–226. [Google Scholar] [CrossRef] [Scilit]
- Hardman, S.; Jenn, A.; Tal, G.; Axsen, J.; Beard, G.; Daina, N.; Figenbaum, E.; Jakobsson, N.; Jochem, P.; Kinnear, N.; et al. A Review of Consumer Preferences of and Interactions with Electric Vehicle Charging Infrastructure. Transp. Res. Part D Transp. Environ. 2018, 62, 508–523. [Google Scholar] [CrossRef] [Scilit]
- Bjerkan, K.Y.; Nørbech, T.E.; Nordtømme, M.E. Incentives for Promoting Battery Electric Vehicle (BEV) Adoption in Norway. Transp. Res. Part D Transp. Environ. 2016, 43, 169–180. [Google Scholar] [CrossRef] [Scilit]
- Axsen, J.; Bailey, J.; Castro, M.A. Preference and Lifestyle Heterogeneity among Potential Plug-in Electric Vehicle Buyers. Energy Econ. 2015, 50, 190–201. [Google Scholar] [CrossRef] [Scilit]
- Liao, F.; Molin, E.; van Wee, B. Consumer Preferences for Electric Vehicles: A Literature Review. Transp. Rev. 2017, 37, 252–275. [Google Scholar] [CrossRef] [Scilit]
- Hardman, S. Understanding the Impact of Reoccurring and Non-Financial Incentives on Plug-in Electric Vehicle Adoption—A Review. Transp. Res. Part A Policy Pract. 2019, 119, 1–14. [Google Scholar] [CrossRef] [Scilit]
- Sierzchula, W.; Bakker, S.; Maat, K.; Van Wee, B. The Influence of Financial Incentives and Other Socio-Economic Factors on Electric Vehicle Adoption. Energy Policy 2014, 68, 183–194. [Google Scholar] [CrossRef] [Scilit]

Disclaimer/Publisher’s Note: The statements, opinions and data contained in all publications are solely those of the individual author(s) and contributor(s) and not of MDPI and/or the editor(s). MDPI and/or the editor(s) disclaim responsibility for any injury to people or property resulting from any ideas, methods, instructions or products referred to in the content. |
© 2026 by the authors. Licensee MDPI, Basel, Switzerland. This article is an open access article distributed under the terms and conditions of the Creative Commons Attribution (CC BY) license.