Article

Mine Tailings Facilities in Kazakhstan: Public Databases, Management Practices, and Extreme Weather Events

School of Mining and Geosciences, Nazarbayev University, Astana 010000, Kazakhstan
*
Author to whom correspondence should be addressed.
Sustainability 2026, 18(13), 6479; https://doi.org/10.3390/su18136479
Submission received: 8 May 2026 / Revised: 9 June 2026 / Accepted: 22 June 2026 / Published: 25 June 2026

Abstract

Rapid increase in mining activities, outdated management approaches, and climate change pose risks to the safe operation of mines. We explore public databases on mine tailings storage facilities (TSF) in Kazakhstan, a major mineral producer. We proceed to an in-depth analysis of a representative TSF, located in an area that has been affected by spring flooding. Our geospatial analysis and review of company reports reveal serious challenges related to the TSF design, tailings deposition patterns, and changing weather conditions. Despite modifying the TSF design in response to its failure, the company has struggled with persistent TSF overtopping and seepage in the subsequent years. Our findings from both the country-level review of TSF and the case study highlight the urgency of adopting best practices of TSF management. Specifically, our study demonstrates that risks stemming from spring flooding in Kazakhstan call for proactive TSF management, transparency, and stakeholder engagement. Such changes in TSF governance are essential for achieving a number of Sustainable Development Goals, in particular, SDG 12 Responsible Consumption and Production and SDG6 Clean Water and Sanitation.

1. Introduction

Growing electrification, digitalization, and the adoption of renewable energy systems rely on increasing production of minerals. At the same time, declining ore grades, deeper ore bodies, and their more complex mineralogy result in rapidly increasing volumes of mining wastes. Proactive management of such waste is essential for environmental safety and social acceptance of mining. In addition, the long-term nature of risks stemming from such wastes may undermine the well-being of future generations and compromise sustainable development. However, as investment in waste management does not directly contribute to generating revenues, it is often given low priority by mining companies, with the resulting poor outcomes in mine safety.
Waste from ore processing, stored in the form of slurry within tailings storage facilities (TSF), may cause contamination of soil and water due to seepage, overtopping, or TSF failure [1]. In addition, changing patterns of flooding, droughts, and wildfires create new types of risks for mining. For instance, warmer temperatures and reduced water availability increase air pollution from mining and reduce recovery rates of mineral processing [2]. Heavy and increasingly variable precipitation destroys mining infrastructure and may cause spills of untreated mining waste into ecosystems [3]. Most of such infrastructure was built on the assumption of unchanging climate conditions. If mining industry stakeholders continue to regard climate change as presenting a minor risk, adaptation to future climate impacts on mining operations will remain limited. Such vulnerabilities are especially high in the cases of closed or abandoned mining operations and in developing countries [4]. As a result, international organizations joined mining and metallurgy industry associations to develop the Global Industry Standard on Tailings Management (GISTM) [5]. The goal is to achieve zero failures, promote safety culture, and adopt high standards in designing, operating and closing tailings facilities. The GISTM requires integrated lifecycle management so that tailings management is integrated in planning throughout the mine lifecycle. To improve governance and accountability, clear roles should be assigned to board members, company executives, and technical personnel. Risk-informed management should involve continuous monitoring, data assessment, and actions to ensure that the facility performs as designed. Finally, the GISTM recommends independent reviews and emergency preparedness to protect the environment and local communities.
This study analyzes the environmental impacts of mining in the context of extreme weather events as experienced in Kazakhstan, a leading producer of uranium (#1 globally), chromium (#2), gold (#6), coal (#8), copper (#9), and petroleum (#13) [6]. Kazakhstan’s role in contributing to the global mineral industry is likely to rise due to its recent discoveries of large deposits of critical minerals, including Rare Earth Elements, graphite, and lithium [7]. Kazakhstan’s rich mineral endowment is related to its size, as it is the ninth largest in the world by area. It is the world’s largest landlocked country and, with the exception of southern and western regions, has an extreme continental climate with very cold and snowy winters and hot, dry summers. Although there are different views on the extent of global climate change and its plausible future scenarios [8,9,10,11], a number of studies [12,13,14] focused on Kazakhstan agree that its climate is undergoing changes that vary across regions. Southern regions have hot summers and are expected to experience drier conditions, particularly in critical water basins such as the Amu Darya and Syr Darya [15]. In contrast, other studies [16,17,18] indicate that northern Kazakhstan is likely to experience some of the largest increases in temperature and cold-season precipitation across Central Asia. This enhanced winter warming extends into early spring, when the most pronounced temperature increases have been observed, leading to earlier snowmelt onset [16]. Such seasonal shifts have serious consequences for runoff regimes and water availability in Central Asia [19,20]. Moreover, accelerated spring warming further increases the risk of snowmelt-driven flooding [12,21].
Analysis of long-term trends in Central Asia reveals that heavy March-May floods are becoming increasingly common in mid and high latitudes [22]. The most disruptive recent developments were severe floods that affected northern, eastern, and northwestern regions. The spring 2024 flood was the most devastating event recorded over the past 80 years. It caused substantial economic losses and displaced more than 200,000 people due to widespread residential inundation. Critical infrastructure, including roads and bridges, was severely damaged, with total losses, encompassing housing damage, exceeding $440 million [23]. Researchers [24] relate the 2024 flood to both long-term climate change and interannual variability, including above-normal snowfall and record-high soil moisture during winter, followed by heavy rains in early spring.
The 2024 flood posed serious threats to the country’s petroleum and mining industries [25,26,27]. Impacts of such disruptive weather events are further complicated by the limited consideration given to the sustainability governance of resource extraction in Kazakhstan. Outdated water regulations and the rapid uptake of mining operations resulted in accelerated freshwater withdrawals by mining companies and an increase in water entrained in TSFs [28]. A particularly acute challenge is presented by uranium tailings in Northern Kazakhstan that are associated with heightened concentrations of arsenic, radium, and uranium in adjacent aquifers and ecosystems [29,30,31]. Likewise, in Southern Kazakhstan, tailings from lead smelting resulted in extensive dissemination of heavy metals in the neighboring soils, including lead, cadmium, and zinc [32]. Furthermore, Kazakhstan is exposed to and may itself create transboundary pollution. For instance, seismic activity in neighboring Kyrgyzstan in 1964 instigated a disastrous tailings spill from Ak-Tyuz mine that polluted rivers flowing into Kazakhstan [33]. The ramifications of such contamination are both ecological and socio-economic, impacting public health and agriculture. Buildup of heavy metals in agricultural soils jeopardizes Kazakhstan’s food safety, diminishes agricultural output, and endangers biodiversity [34,35]. Overall, unsafe operation of TSF conflicts with a number of sustainable development goals (SDGs), including SDG6 Clean Water and Sanitation, SDG14 Life below Water, SDG15 Life on Land, SDG3 Good Health and Wellbeing, and SDG12 Responsible Consumption and Production.
Geospatial and remote sensing methods are increasingly used for TSF monitoring, yet their systematic application in Central Asia remains limited. Satellite-based interferometric synthetic aperture radar (InSAR) can detect millimeter-scale surface displacements at TSFs and reconstruct instability preceding dam failures [36,37]. Satellite imagery has been used to map TSF footprints at the global level [38], but no equivalent systematic screening has been conducted across Kazakhstan’s approximately 120 facilities. The interaction between extreme hydrological events and TSF integrity has received limited attention in Central Asia. Previous research demonstrated that even moderate-return-period floods can mobilize contaminants from abandoned TSFs located in flood-prone mining basins [39]. However, comparable assessments of flood exposure and TSF vulnerability remain unavailable for Kazakhstan despite documented increases in snowmelt-driven spring flooding. At the same time, studies of climate adaptation in Central Asia indicate that research activity has declined since 2013 and has rarely considered risks associated with industrial infrastructure [40]. Recent climate assessments have also reported accelerating warming trends and increasing precipitation extremes across Kazakhstan and the broader Central Asian region [15,41]. This study addresses these gaps by applying satellite-based geospatial analysis to Kazakhstan’s national TSF inventory, linking the assessment to the exceptional 2024 flood event, and evaluating how adaptive management measures implemented by a mining company, including increased water recirculation, influenced operational outcomes under extreme hydrological conditions.
These rising threats due to disruptive weather events and evidence of contamination from mining operations motivate our research on the status of TSFs across Kazakhstan. Our study contributes to the growing body of research on TSF remediation and reprocessing of mine tailings in Kazakhstan [42,43,44,45]. Recently, new policies introduced incentives for extracting valuable minerals from mining waste. A key fiscal stimulus adopted by Kazakhstan’s government in 2026 is a 10-fold decrease in the Mineral Extraction Tax on minerals produced by reprocessing of mine tailings [46]. However, the state of TSFs across this country and associated management practices remain underexplored. Using public databases, we find that there are around 120 TSFs in Kazakhstan, a quarter of which are inactive. Half of all TSFs have a moderate level of hazard and were in operation for less than 40 years. The overall condition of TSF in Kazakhstan is comparable to that in Eastern Europe, the Caucasus, and Central Asia. However, to obtain a deeper understanding of the challenges faced by Kazakhstan’s mining companies, we conduct a case study that illustrates risks stemming from both the climatic factors and management practices. Using satellite data and geospatial analysis, we find that the company was able to withstand the challenges of the 2024 flood due to the lessons learned during the previous years when its TSF experienced overtopping, spilling, and stability concerns. In addition, we find that changing weather conditions prompted the company to increase reliance on water recirculation while decreasing the use of freshwater. Thus, our analysis contributes to raising awareness among stakeholders in Kazakhstan’s mining industry of the extent and types of problems associated with the growing volumes of mining waste and the changing climate. As a result, our study increases understanding of challenges that need to be overcome for Kazakhstan’s mining to become safer and more resilient to extreme weather events.
Distribution of the TSFs in Kazakhstan and selection of the case study
There are two public TSF inventories that are relevant for Kazakhstan. The first one is the Global Tailings Portal (GTP) database. Following the Brumadinho dam collapse in 2019 in Brazil, GTP was established to facilitate and disseminate disclosures of mining companies. Currently, GTP contains information on over 1800 TSFs worldwide, with details on their location, size, status, volume, height, raising method, and TSF management practices. The second TSF inventory relevant for Kazakhstan was developed by the United Nations Economic Commission for Europe [47,48], which collected and systematized data on TSF in the Caucasus, the Danube River basin, and Central Asia. The UNECE initiated such studies in response to a number of TSF failures in Eastern Europe in the 2000s. In cooperation with host governments, the UNECE developed digital maps with information on each TSF’s location, age, associated mining or metallurgy company, volume, major contaminants, crest width, embankment material, seismicity, flood hazard, factor of safety, and the Tailings Hazard Index (THI). The THI allows for the consistent assessment of the hazard potential of both active and inactive TSFs, including abandoned ones. It allows for risk ranking of TSFs and prioritizing hazard hotspots, thus enabling allocation of limited public resources. The THI was determined from component indexes as follows [48]:
THI = THIcap + THItox + THIman + THInat + THIdam
where
  • THIcap is the capacity THI: THIcap = log10(material volume(m3));
  • THItox is the toxicity THI, corresponding to the water hazard class according to German national classification: THItox = 0 (no hazard), 1 (low hazard), 2 (medium hazard), 3 (high hazard), 4 (radioactive substances);
  • THIman indicates the management status: THIman = 0 (rehabilitated), 1 (closed), 3 (abandoned, orphaned), 3 (active);
  • THInat is the natural hazard THI, which is a sum of seismic THI and flood hazard THI: THIseism = 0 if peak ground acceleration ≤ 0.1, THIseism = 1 otherwise; THIflood = 1 if a TSF is in the flood prone area, THIflood = 0 otherwise;
  • THIdam is the dam design THI: THIdam = 0 if FoS (factor of safety of the dam design) > 1.5, THIdam = 1 otherwise.
The THI should be interpreted on a logarithmic scale, i.e., a unit increase in its value indicates a 10-fold increase in the hazard level. The THI allows for assessment of TSF accident hazard and it does not measure potential impacts on people or the environment in case of TSF failure. Based on the overall score, TSFs are categorized into the following overall hazard classifications [49]:
  • Low hazard (THI ≤ 9.5): Facilities characterized by limited capacity, non-toxic or less toxic materials, stable conditions, and well-maintained structures with minimal exposure to natural risks.
  • Medium hazard (9.5 < THI ≤ 13.5): Facilities exhibiting moderate capacity or toxicity, or situated in areas with some hazard exposure. These TSFs necessitate regular monitoring but are not deemed critical.
  • High hazard (13.5 < THI): Facilities with substantial volumes, highly toxic contents, inadequate management or abandoned status, and/or significant exposure to environmental risks.
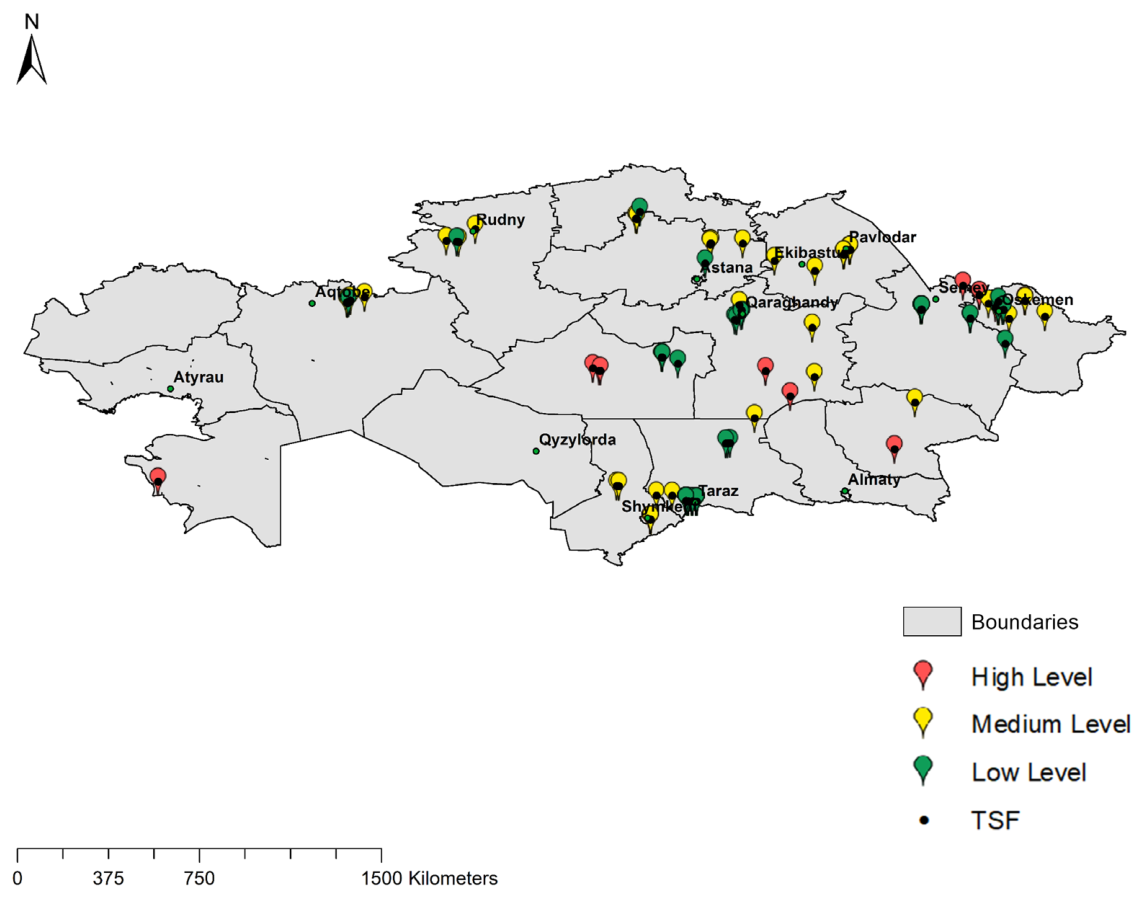
The UNECE conducted mapping of Kazakhstan’s TSFs during 2017–2019 [49]. The project report mentions 121 facilities in Kazakhstan, but the database contains information on 118 facilities. Their THI values range between 5.7 and 15.5. Half of all TSFs in Kazakhstan fall under the category of medium hazard, while 27% are low-hazard. The average age of the TSF is around 40 years and 24% of TSF are closed, abandoned or rehabilitated. TSFs are widely distributed in all parts of the country, except for the western region, where there is only one such facility (Figure 1). The status of TSFs in Kazakhstan is similar to that of other countries where UNECE carried out TSF mapping, but the range of distribution of THI values for Kazakhstan’s TSFs is wider (Table 1 and Table 2). Furthermore, as we compare the UNECE and GTP data, we may conclude that the latter mostly includes Kazakhstan’s larger and newer TSFs. Jointly, TSFs in the GTP database account for 17% of the total number of facilities covered by the UNECE database and 25% of total TSF capacity. This finding is important; the GTP database is better known and more accessible than the UNECE database.
We use the UNECE database to select a case-study facility. Like several other TSFs, the one we focus on has transboundary risks due to its proximity to the international border. It has a THI value of 10 and a capacity of around 30 mln m3, which matches the national average. The main factor in guiding our choice was the location of the mine and its TSF in the part of the country where population and infrastructure were severely affected by the spring 2024 flood, the most devastating one over an 80-year period. Furthermore, the firm that operates the mine publishes regular reports, which enable us to link our findings to the management practices of this company.

2. Materials and Methods

Multiple factors contribute to the safety of a TSF. Downstream design, adequate embankment material, geomembrane lining, drainage, and regular monitoring are necessary, but not sufficient, for safe operation of a TSF. Methods and location of tailings slurry deposition within the TSF are important as well. Deposition of tailings at a safe distance from the dam, along the perimeter of the TSF, allows for the formation of tailings beaches around the walls of the TSF. This reduces the chances of liquefaction of the dam and enhances its structural performance. In such situations, the supernatant water pond would show limited spatial dynamics and deepen gradually over time. Such an approach is considered by [51] as conservative. The authors of [51] conducted a multi-year geospatial analysis of Quebrada Honda TSF and Quebrada Enlozada TSF in Peru, which adhered to conservative TSF management and found no evidence of overtopping, seepage, or failure. Conversely, those facilities that experienced major failures in 2022 and 6–8 km spills of tailings (Williamson TSF in Tanzania and Jagersfontein in South Africa, both centerline design) were found to have had high annual variability of the location of the supernatant water pond, its accumulation at the dam, and the water pond engulfing wet tailings during the years preceding the collapse. As a result, such a pond management approach is considered non-conservative, i.e., risky. An intermediate case is the one where downstream design is used but the pond forms against the dam. Such facilities (Laguna Seca TSF in Chile and Caren TSF in Chile) have not had failures, overtopping or seepage, but they remain at high risk of these events under unfavorable (e.g., seismic) conditions. These spatio-temporal dynamics of TSF surfaces were analyzed by the authors using remote sensing techniques.
In general, remote sensing has become an essential tool in the study of TSFs, largely because satellite products are often the only open access sources of detailed spatial data in hard-to-access regions. It enables consistent, long-term observation of landscape changes and potential environmental risks through broad spatial coverage and frequent revisit cycles. This makes remote sensing a highly suitable method for assessing TSF conditions over time. Several studies underscore the effective utilization of remote sensing for TSF monitoring. Ref. [52] demonstrated the use of historical satellite data for monitoring the long-term development of tailings impoundments and comprehending their environmental impacts. Ref. [53] utilized InSAR techniques to identify minor ground deformations surrounding TSFs, facilitating the early detection of dam collapse. Ref. [54] demonstrated that tailings ponds may be precisely delineated by remote sensing classification techniques, hence improving TSF inventory mapping. Ref. [51] illustrated the application of multispectral photography in differentiating supernatant water ponds from adjacent tailings, offering essential insights on pond stability and spill danger.
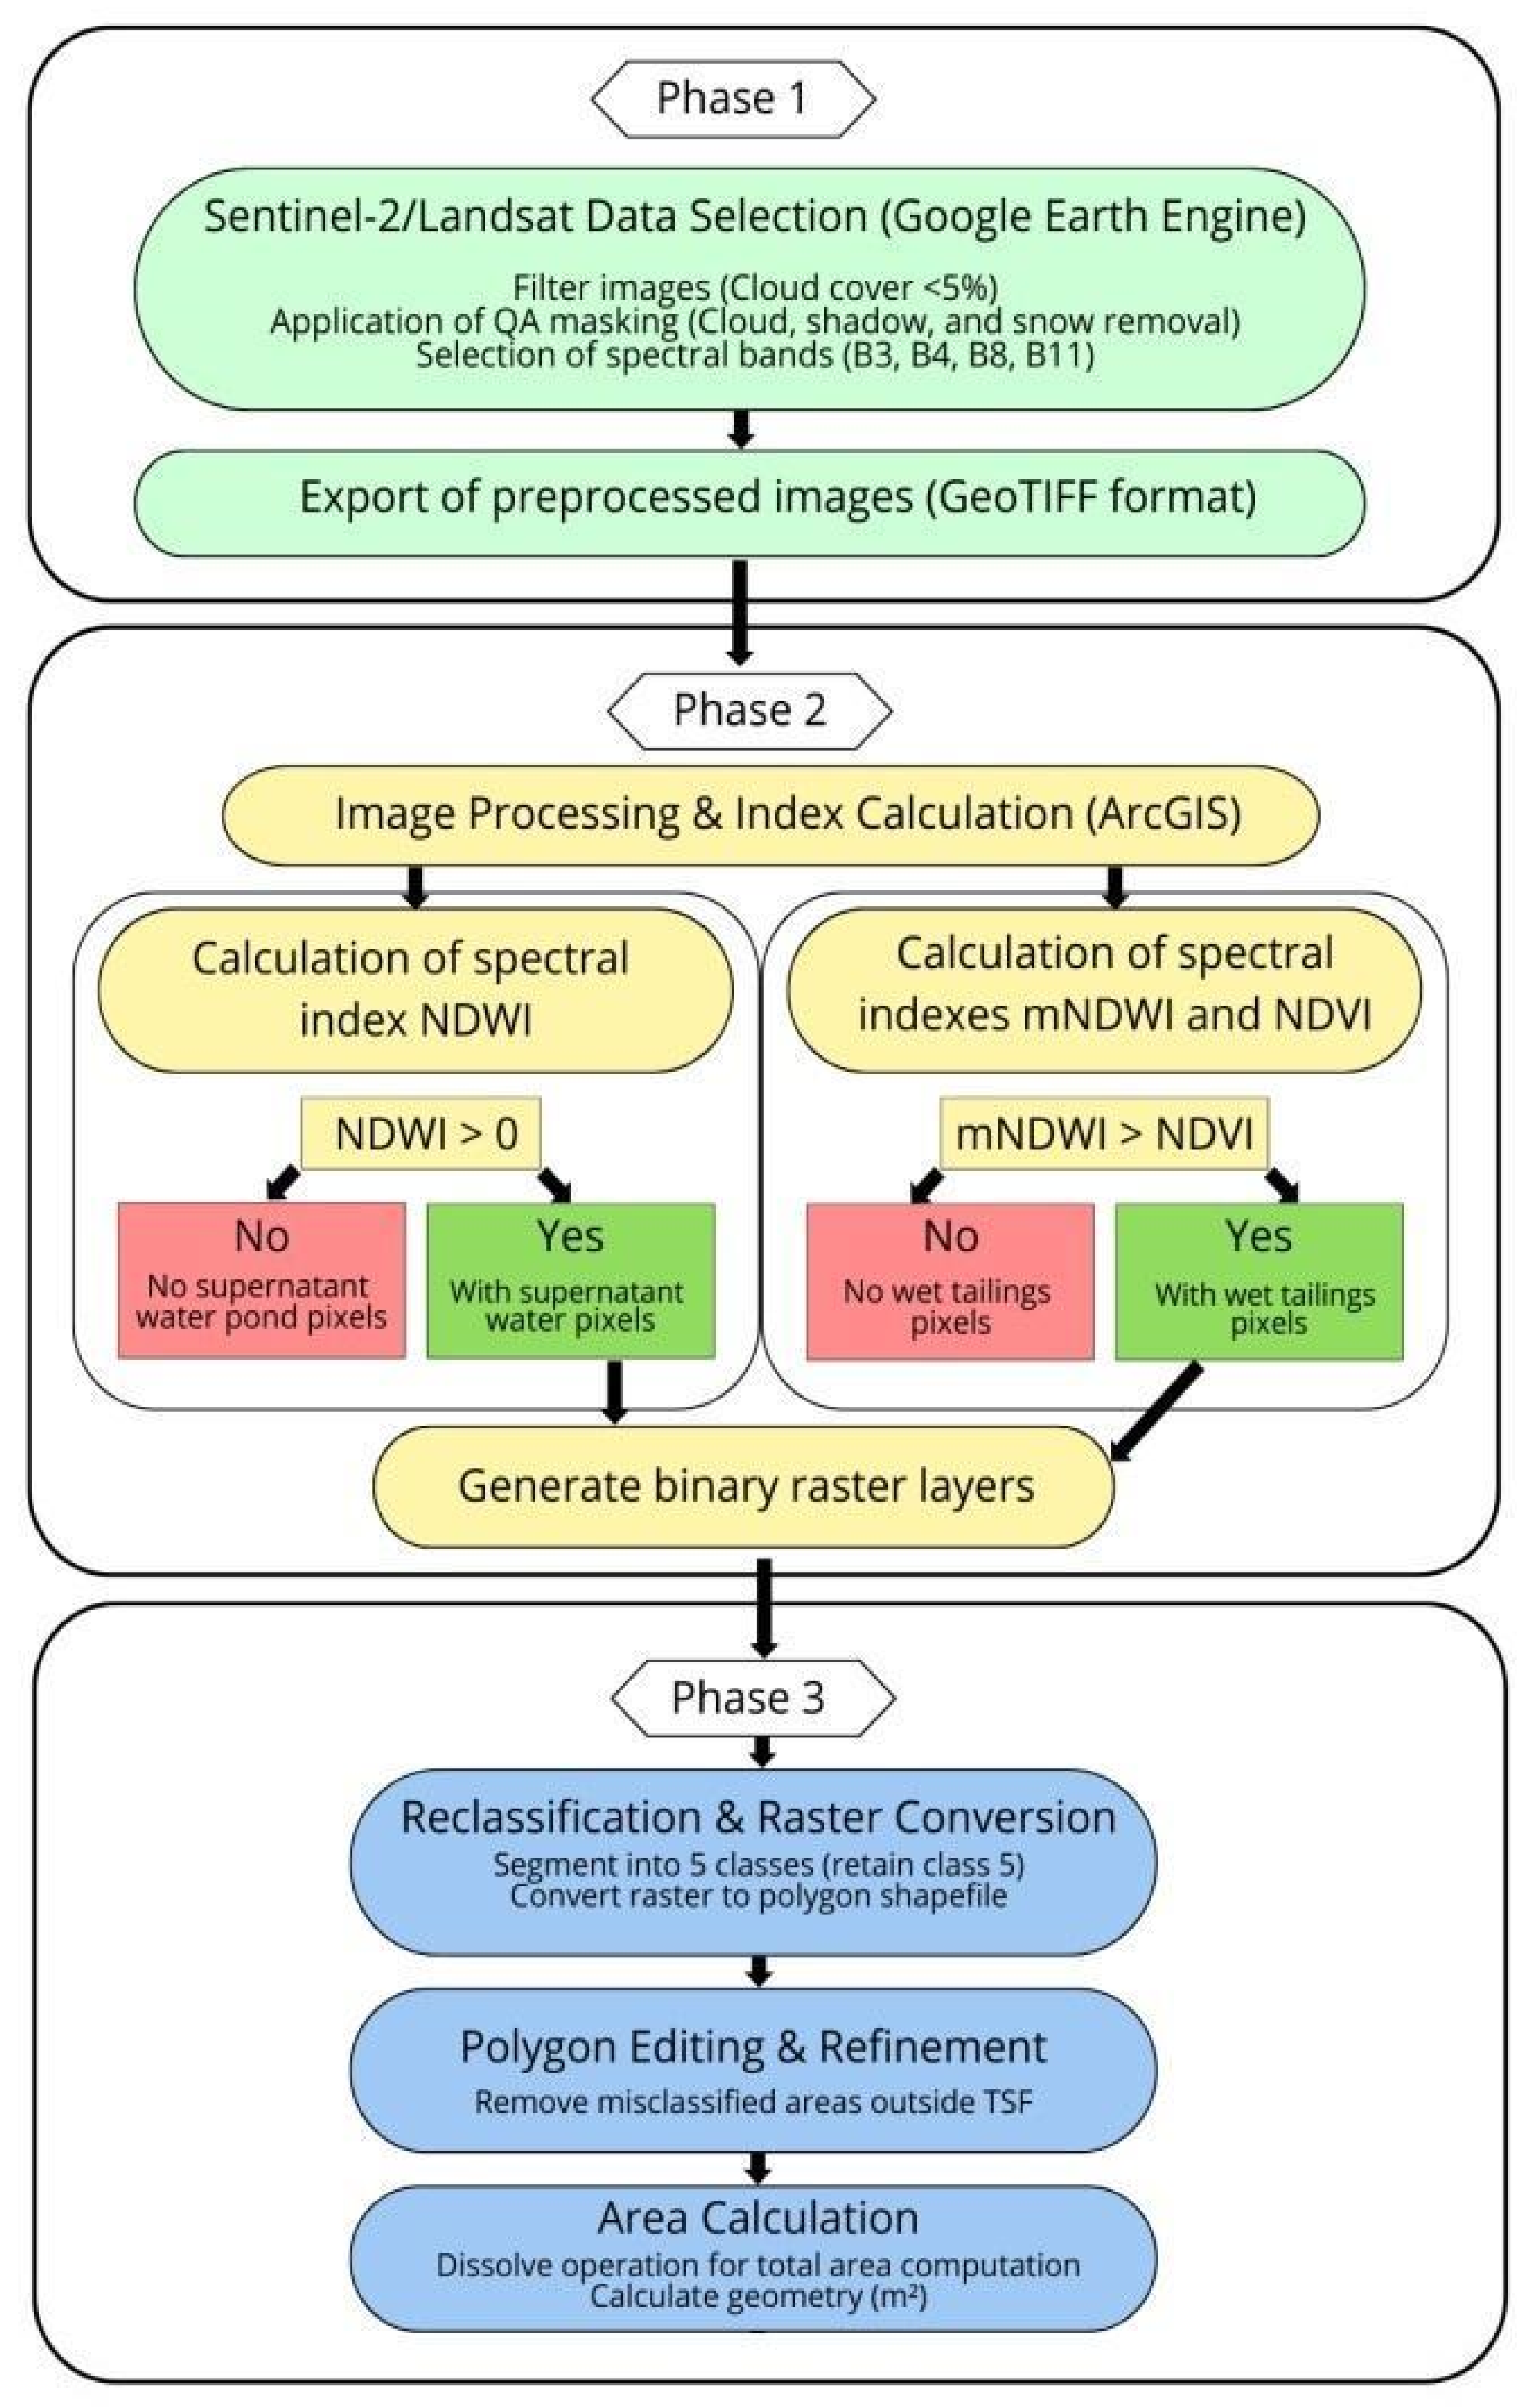
The general flow of the proposed methodology for this study was adapted from [51,55]. These authors identified that supernatant process water ponds and wet tailings are two separate elements within a TSF, each fulfilling unique functions in mining waste management. Ponds of supernatant water form from water that separates from the tailings. This water generally collects on the surface of the tailings and is distinguished by its comparatively low sediment content. Management of these ponds is essential, as improper control may lead to overtopping and contamination of surrounding areas. In turn, wet tailings denote a fine-grained, water-saturated substance that persists following the extraction of precious minerals. Wet tailings possess elevated moisture levels and may contain toxic chemicals, rendering their care crucial for environmental safeguarding. The identification of wet tailings frequently uses spectral indices, which differentiate them from supernatant water and vegetation by examining their distinct spectral fingerprints. Figure 2 summarizes our satellite image processing workflow for assessing areas of supernatant water ponds and wet tailings.
Specifically, to analyze the temporal changes in the TSF surface, Sentinel-2 Level-2A and Landsat 8 imagery were obtained via Google Earth Engine (GEE). Landsat 8 was used for 2016–2018, while Sentinel-2 imagery was used for the years 2019–2024. Although the two sensors have different spatial resolutions (30 m for Landsat 8 and 10–20 m for Sentinel-2), the monitored wet-tailings and supernatant-water features were substantially larger than individual pixels. Therefore, no additional spatial-resolution harmonization was applied, and temporal changes were assessed using the native resolution of each dataset. Our study focused on the spring hydrological period (from 1 March to 31 May). This timeframe aligns with the snowmelt season in northern Kazakhstan [16], when surface water levels rise rapidly and the TSF pond volume typically reaches its annual maximum.
Table 3 presents the preprocessing steps applied in GEE to ensure quality and consistency of Sentinel-2 and Landsat-8 imagery used in this study. These steps include temporal compositing, masking unwanted atmospheric effects, and selection of key spectral bands for further analysis. Cloud, cloud-shadow and snow pixels were removed using the QA_PIXEL band for Landsat 8 and the Scene Classification Layer (SCL) for Sentinel-2. The details of the bands used for index calculation are presented in Table 4. These bands were selected based on their sensitivity to vegetation, water, and soil characteristics, which are essential for effective remote sensing analysis.
Spectral indices were computed in ArcGIS (version 10.7) using the Raster Calculator to classify water bodies and wet tailings within the TSF. The classification criteria were based on previous studies, particularly [54], who combined modified Normalized Difference Water Index (MNDWI), Normalized Difference Vegetation Index (NDVI) and Enhanced Vegetation Index (EVI) to detect water ponds while minimizing interference from vegetation and soil. The criterion MNDWI > NDVI was adopted since water surfaces typically exhibit higher reflectance contrast in the green and shortwave infrared bands than in the red and near-infrared bands, resulting in MNDWI values that exceed NDVI values. This condition enhances the discrimination of water features from vegetation and bare ground. The threshold EVI < 0.1 was applied to exclude vegetated surfaces, as low EVI values generally correspond to non-vegetated or sparsely vegetated areas. This approach was subsequently applied by [51]. for tailings storage facilities, where pixels satisfying MNDWI > NDVI and EVI < 0.1 were interpreted as wet tailings and supernatant water surfaces.
In this study, wet tailings were initially identified using the combined criteria MNDWI > NDVI and EVI < 0.1 (Figure 2). However, due to high variability and noise in the EVI values, applying the EVI < 0.1 threshold consistently across the study period was impractical. Therefore, wet tailings detection was based solely on the MNDWI > NDVI criterion to ensure consistency and reliability. Supernatant water ponds were delineated using the NDWI, as developed by [56]. NDWI was calculated from Sentinel-2 bands B3 (green) and B8 (near-infrared, NIR) according to the following equation:
N D W I = ( G r e e n N I R ) ( G r e e n + N I R )
NDWI values range from −1 to 1, with positive values indicating the presence of surface water. For each year, a median composite for the three-month period (March–May) was generated from all available observations, with the median calculated for each pixel and spectral band to minimize the influence of noise and outliers. This approach ensured a robust representation of water presence during the critical snowmelt and flood period and is consistent with methodologies adopted in previous studies.
The MNDWI, proposed by [57], enhances the detection of water features by minimizing the influence of soil and vegetation. It was calculated using Sentinel-2 bands B3 (green) and SWIR1 (shortwave infrared) according to the following equation:
M N D W I = ( G r e e n S W I R 1 ) ( G r e e n + S W I R 1 )
The NDVI, developed by [58], distinguishes vegetation from other terrestrial surfaces. It was calculated using Sentinel-2 bands B8 (near-infrared, NIR) and B4 (red) according to the following equation:
N D V I = ( N I R R e d ) ( N I R + R e d )
Both the MNDWI and NDVI produce values ranging from −1 to 1. Positive MNDWI values indicate the presence of surface water, with higher values corresponding to denser or more extensive water surfaces. Similarly, positive NDVI values reflect the presence of vegetation, whereas values below zero correspond to non-vegetated surfaces, including bare soil or water.
Wet tailings were delineated using a classification approach based on spectral index thresholds. The raster outputs were reclassified into five classes, of which only the class representing wet conditions (Figure 2) was retained for subsequent analysis. The resulting raster was converted to vector polygon features to enable spatially explicit area calculations. The classified outputs were visually inspected against the original satellite imagery. Polygons located outside the TSF boundaries or corresponding to non-pond features were excluded to ensure that only water pond and wet tailings areas were analyzed. This workflow produced annual estimates of wet tailings and water-covered areas, which were subsequently used to assess spatial and temporal trends over the study period.
Climatic and hydrological data were integrated from KazHydroMet, Kazakhstan’s national hydrometeorological service, to support the geospatial analysis of the case-study TSF. Daily records of precipitation, river water level, and air temperature were obtained from official meteorological and hydrological databases and the KazHydroMet hydrological monitoring platform (www.kazhydromet.kz/ (accessed on 1 February 2025)). Monitoring stations were selected based on their proximity to the study site and their relevance for characterizing local environmental conditions. As the selected stations are located within the same regional climatic zone as the TSF, they were considered representative of the climatic and hydrological conditions influencing the study area. River water level data were obtained from a hydrological post located within 5 km of the TSF, providing representative information on local discharge variability. Precipitation and air temperature data were obtained from the nearest meteorological station, located approximately 40 km from the study site. Water level represents the elevation of the water surface relative to a fixed benchmark and captures seasonal discharge variability, while precipitation reflects total atmospheric water input. Air temperature was measured at a standardized height of 2 m. above ground level. These variables provide key indicators of hydrological inputs, evaporation processes, and potential seepage influencing TSF water balance and stability.
Mean annual air temperature and total monthly precipitation were derived from daily meteorological observations during 2000–2024. Daily river level records for the period 1995–2023 were analyzed to calculate average monthly water levels. These variables were examined to assess interannual variability and to facilitate comparison with remotely sensed dynamics of wet tailings and supernatant water ponds. The Mann–Kendall trend test was applied to annual and monthly mean air temperature series for the period 2000–2024. The Mann–Kendall test is a non-parametric statistical method [59,60,61] widely used to detect the presence and significance of monotonic trends in hydrological and climatic time-series data.
Case study description
The area where the case-study mine is located has level topography (See Figure 3). The region encompasses grasslands, woods, and shrublands. The climate of the region is continental, with temperatures varying from −30 °C in the winter to 30 °C in the summer and annual precipitation ranging from 240 to 350 mm. The mine is within 5 km of the national border, the neighboring village, and the nearby river. The mine is expected to operate until 2040, with a transition from open-pit to underground operations. Tailings at the mine site are the outcome of cyanide-based leaching and flotation of gold-copper ores. The presence of sulfide minerals in the tailings raises the risk of acid production and heavy metal leaching under oxidizing conditions, potentially leading to acid mine drainage. If not controlled effectively, this geochemical process has the potential to mobilize hazardous metals and pose long-term hazards to groundwater quality. Cyanide utilized in processing is managed in accordance with the International Cyanide Management Code, with detoxification lowering WAD cyanide levels to less than 0.5 mg/L before tailings disposal. While no cyanide is discharged into surface water, the risk of groundwater contamination is reduced through an HDPE liner, return water circuits, and regular borehole monitoring. In accordance with Kazakhstan’s subsoil and environmental legislation, the company has committed to equipment detoxification and safe disposal of cyanide-contaminated materials.
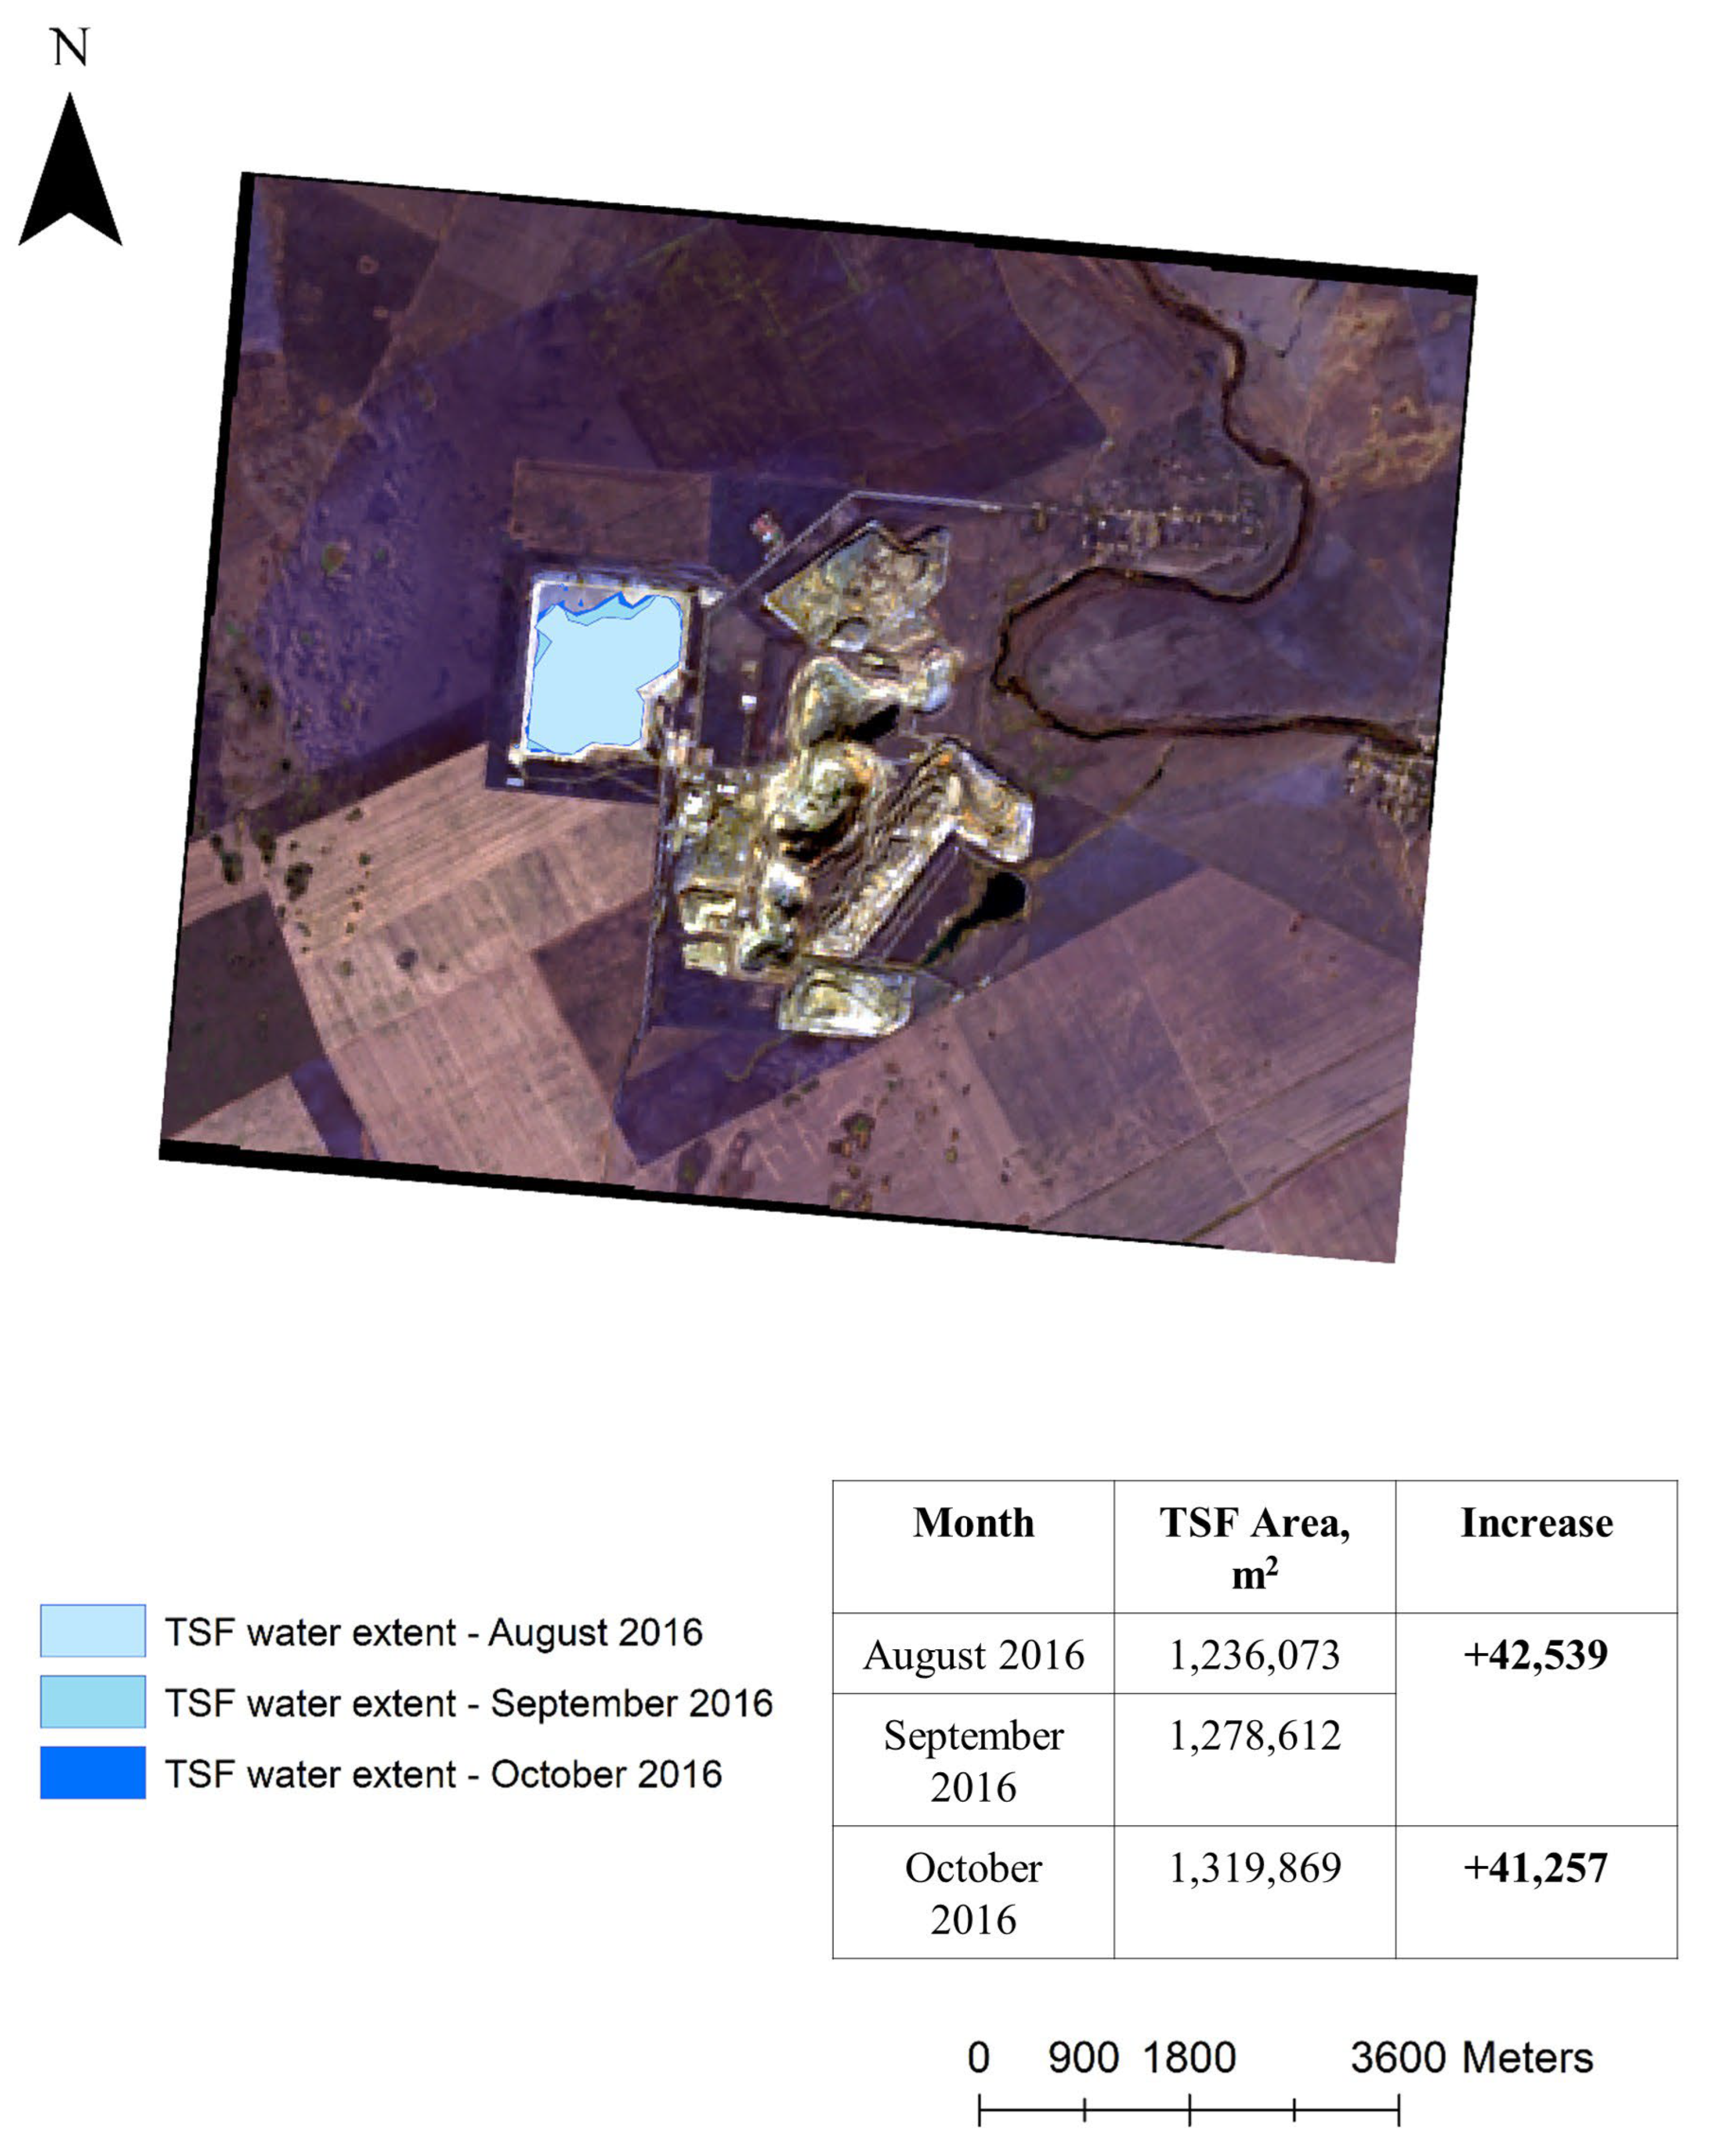
The TSF was constructed in the mid-2000s as a ring-dyke embankment raised in six stages. Initially, the dam was raised using the upstream method, with each phase built partially on previously deposited tailings. According to the company’s reports, in September 2016, the northern embankment of the TSF failed. The failure was promptly handled in accordance with the company’s emergency response plan, and the dam was surcharged with a rock-fill buttress against the original embankment. The company reported that the incident produced no contamination of the surrounding areas. We verify these statements by analyzing satellite images of the facility taken before and after the incident and find no visible signs of contamination (See Figure 3).
In response to the 2016 incident, the design was revised in 2017 to implement a downstream raising approach, which enhanced stability by placing new embankment material on undisturbed foundations. A critical geotechnical factor influencing the facility’s stability was the use of fine-grained local materials—primarily loam and soil—as embankment fill. These materials possess relatively low shear strength and higher susceptibility to erosion and deformation compared with rock-fill, increasing the importance of robust design and monitoring. To address these risks, downstream phases incorporated a geomembrane shield to minimize seepage and a drainage system to control pore water pressure and hydraulic gradients. The dam geometry includes a 12-meter-wide berm, 1:3 upstream slope, and 1:1.5 downstream slope.
In 2017–2018, the UNECE included this facility in a list of TSF hotspots in Kazakhstan [52]. According to their findings, tailings beaches in this TSF had a non-uniform width or were completely missing along certain sections of the embankment. As a result, water levels and pressure measured by piezometers exceeded levels prescribed by the facility’s design documentation. Moreover, design documentation of stage 5 and 6 embankment extensions had no indications of the use of piezometers, which implied a lack of planned monitoring of slope stability.
Later on, an independent review in 2021 identified a lack of sufficient geotechnical data on the foundation soil’s strength and behavior, particularly under seismic loading conditions. In response, further engineering and geological investigations were scheduled to assess the foundation and improve the understanding of its long-term performance. The company reported the Factor of Safety (FoS) for its TSF as 1.205, slightly above the national minimum of 1.20 for high-risk structures. Note that international best practice in TSF management commonly refers to a minimum FoS value of 1.5 [5,49]. Although the company had nominal compliance with the national regulations, the narrow margin underscored the need for continued geotechnical assessment.
Following the 2016 failure, the company transitioned from reactive to adaptive TSF management. Since then, risk mitigation strategies have included structural reinforcements, enhanced monitoring systems, and regular third-party audits. According to a recent independent audit, the company uses a systematic approach to TSF monitoring that combines environmental supervision, technical controls, and routine inspections. Every twelve hours, pipelines, valves, pump stations, and indications of seepage or erosion are subject to operational checks. Standardized checklists and prompt reporting procedures are in use. A drainage system comprising headers and pumps controls pore water pressure, and pipe drains manage seepage. In order to identify cyanide or seepage-related effects, environmental surveillance involves routine sampling from monitoring boreholes and nearby soils. CCTV and real-time alerts are employed to provide additional control in high-risk areas, such as the cyanide mixing zone. The TSF’s operational safety and compliance are further supported by regular emergency response drills and current emergency plans.

3. Results

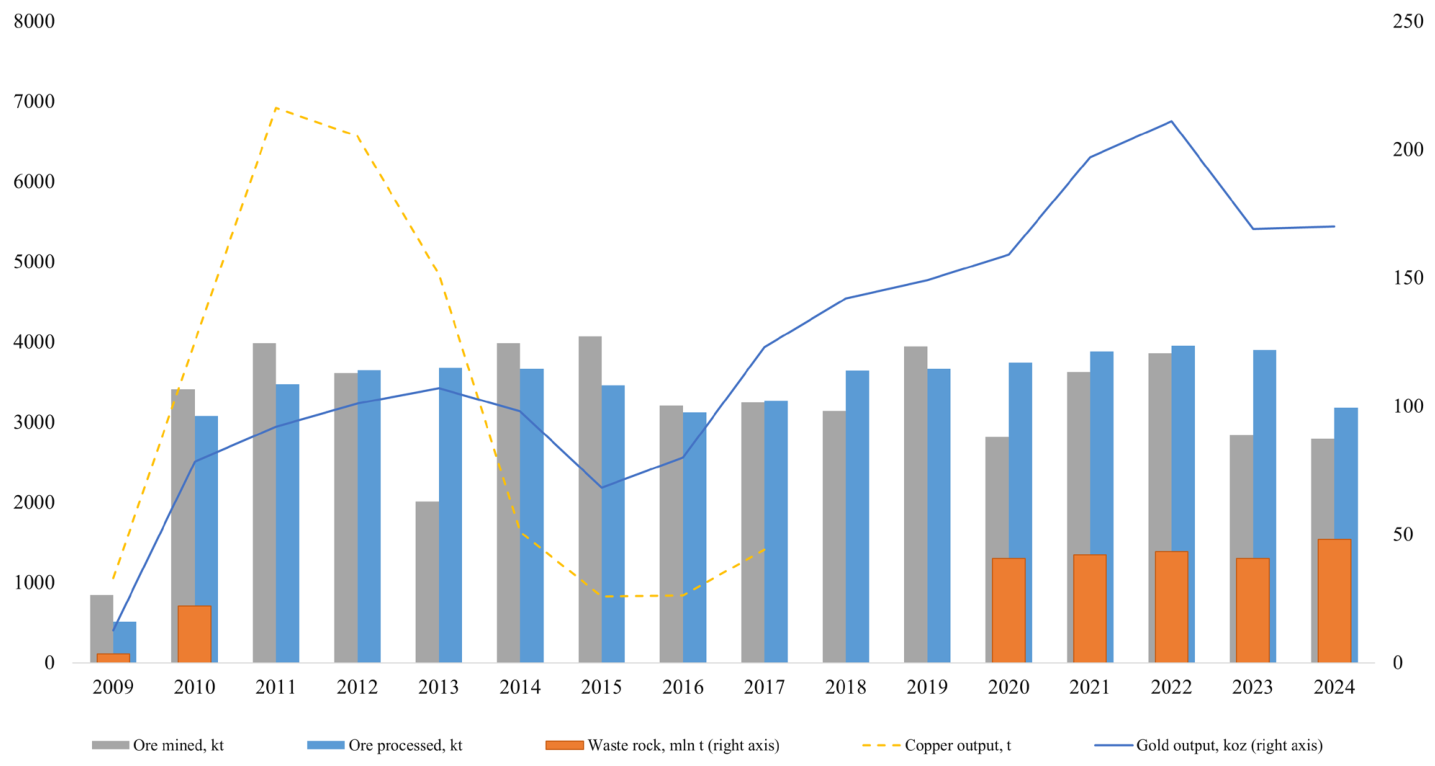
To understand the dynamics of TSF, we first consider mine production levels. Figure 4 provides evidence of variability in levels of output of gold and copper, as well as ore mined. However, the quantity of ore processed stayed stable through the years, growing at 1% per annum on average during 2010–2024. This analysis of production activity allows us to expect that the volumes of materials deposited in the TSF should have grown over time at around the same rate as the volumes of ore processed.
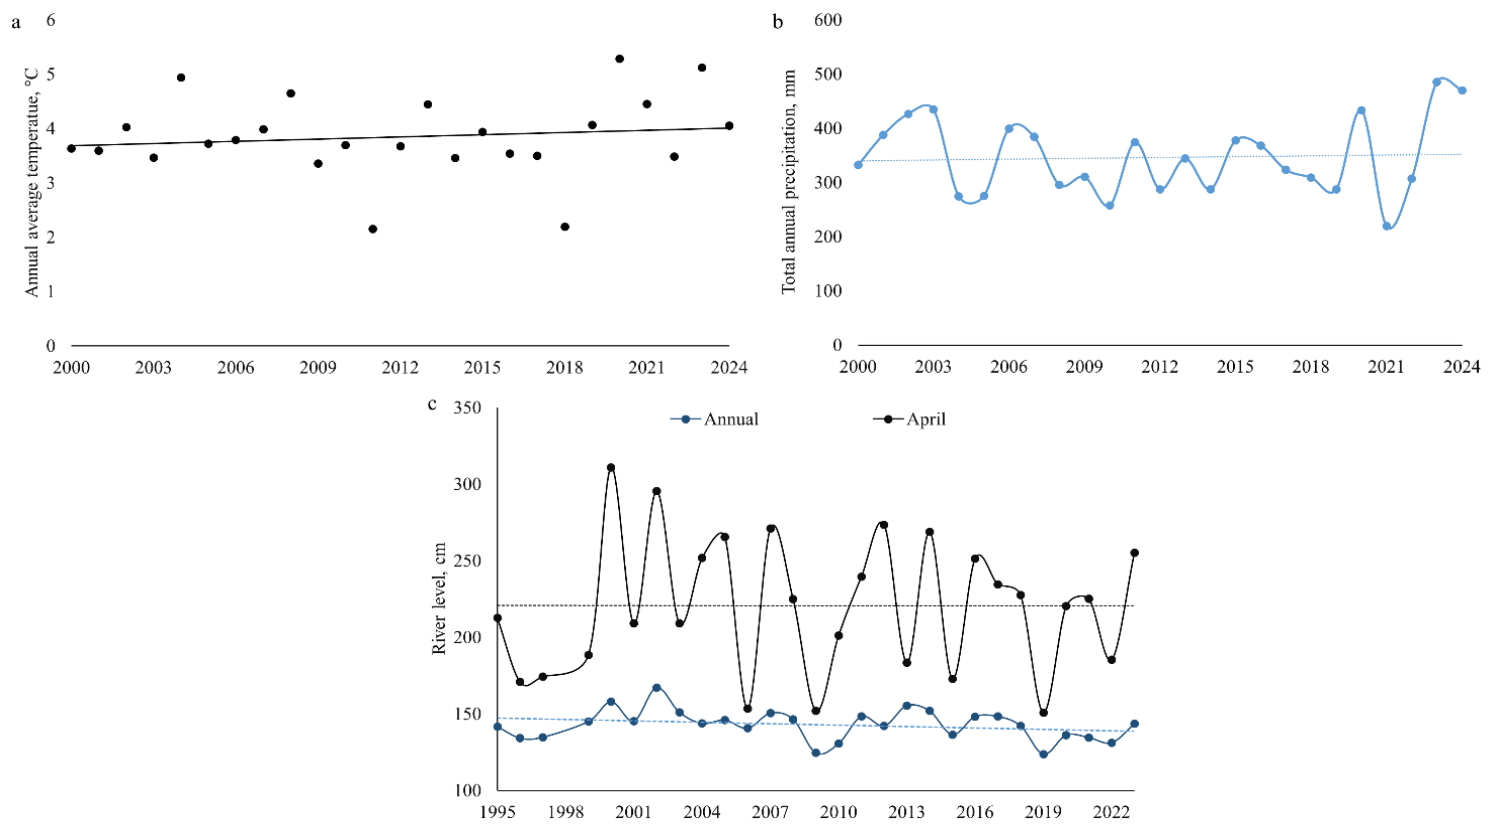
To enhance our understanding of the dynamics of the TSF, we analyze climate records, which indicate considerable interannual variability during 2000–2024 and a mean annual air temperature of 3.8 °C (Figure 5a). Year 2020 was an outlier, characterized by a record-high temperature followed by above-average temperatures in the subsequent years. As for changes in the intra-annual air temperature, it increased most rapidly between March and April, quickly transitioning from negative to positive values and continuing to rise sharply during May (Table 5).
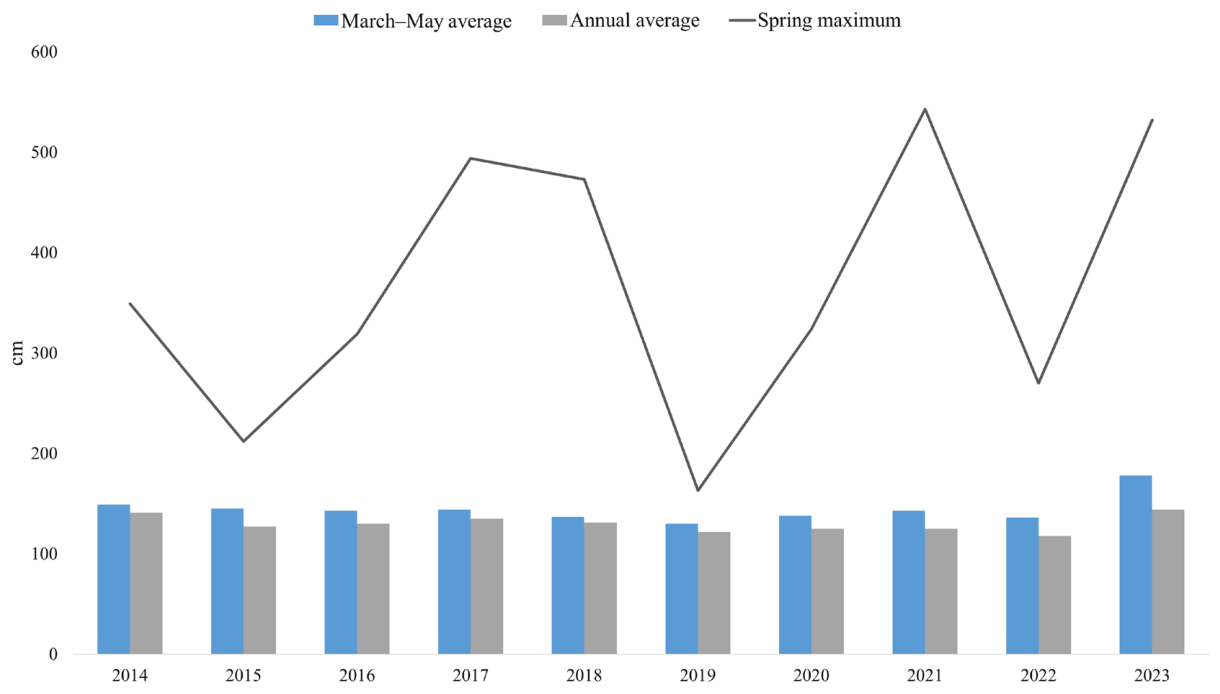
The mean total annual precipitation during 2000–2024 was 346 mm (Figure 5b). We note increased variability since 2020 and very high precipitation in 2023 and 2024. Next, we analyze changes in river water levels during 1995–2023 (Figure 5c). The mean river level was 142.9 cm. The highest river levels consistently occurred in April, indicating a snowmelt-dominated hydrological regime. Additionally, the average monthly river levels showed the greatest variation in March and April, with standard deviations of 18 cm and 44 cm, respectively. These findings confirm that the spring season is the period when structural stability and potential overtopping are most likely to present challenges for the operation of the TSF. This conclusion is further supported by the analysis of daily maximum river water levels (Figure 6), which shows that the highest water levels typically occur during April and May. Notably, in three out of ten years, peak daily river levels exceeded 5 m vs. the long-term average of 1.43 m. These extreme levels coincide with rapid temperature increases in April and the associated acceleration of snowmelt.
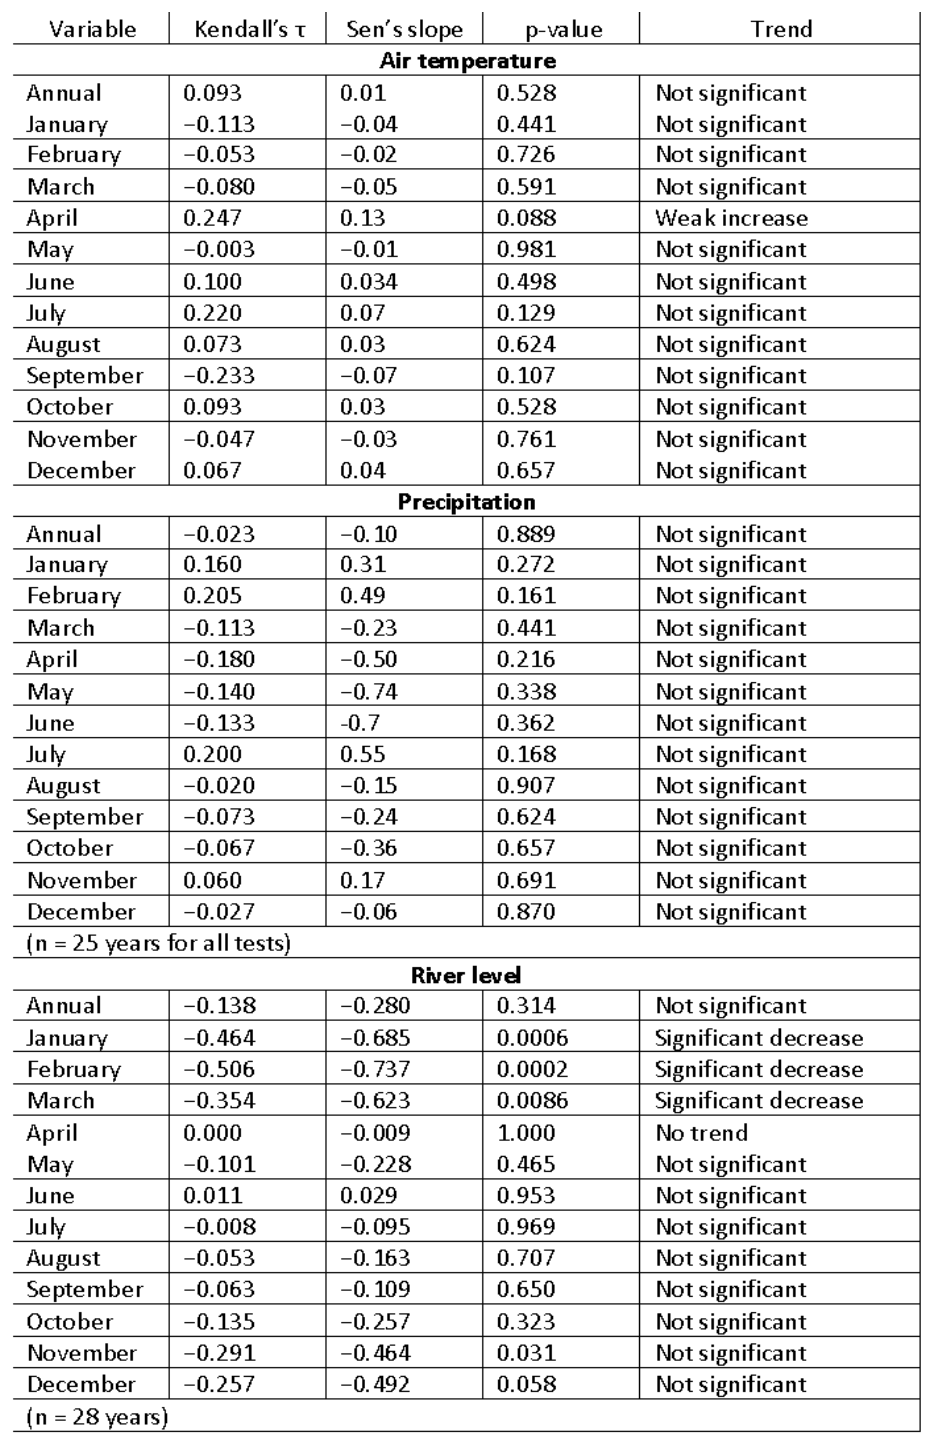
The Mann–Kendall trend test applied to annual and monthly mean air temperature series for the period 2000–2024 (Appendix A) indicated that no statistically significant trends were detected (p > 0.05). However, April exhibited some warming tendency (τ = 0.247; Sen’s slope = 0.134 °C yr−1), suggesting a weak increasing trend during early spring. The Mann–Kendall analysis revealed no statistically significant trends in annual river levels or April peak levels, suggesting that the magnitude of the spring flood peak has remained relatively stable during 1995–2023. Similarly, no statistically significant trends were detected in the annual precipitation series for 2000–2024. This may reflect the relatively short observation period due to data availability, as well as substantial interannual variability. Previous studies have shown that the statistical power of trend detection methods such as the Mann–Kendall test increases with longer time series, and short records may fail to detect emerging climate signals even when underlying trends exist [60]. In addition, river level data for 2024 were not available; however, another peak would be expected given that the second-highest annual precipitation (470 mm) within the study period was recorded in that year (Figure 5b).
Next, we turn to the results of the geospatial analysis. Our findings on climatic and hydrological patterns justify focusing on the spring period for satellite data acquisition to monitor changes in the TSF surface and surrounding areas. Estimated spectral indices are summarized in Table 6. Satellite imagery for the period 2016–2018 was derived from Landsat 8, which has a coarser spatial resolution (30 m) and therefore yielded more generalized spectral responses. In contrast, results for subsequent years are based on Sentinel imagery with higher spatial resolution (10–20 m), enabling finer discrimination of saturated zones and improving the reliability of spatial classification.
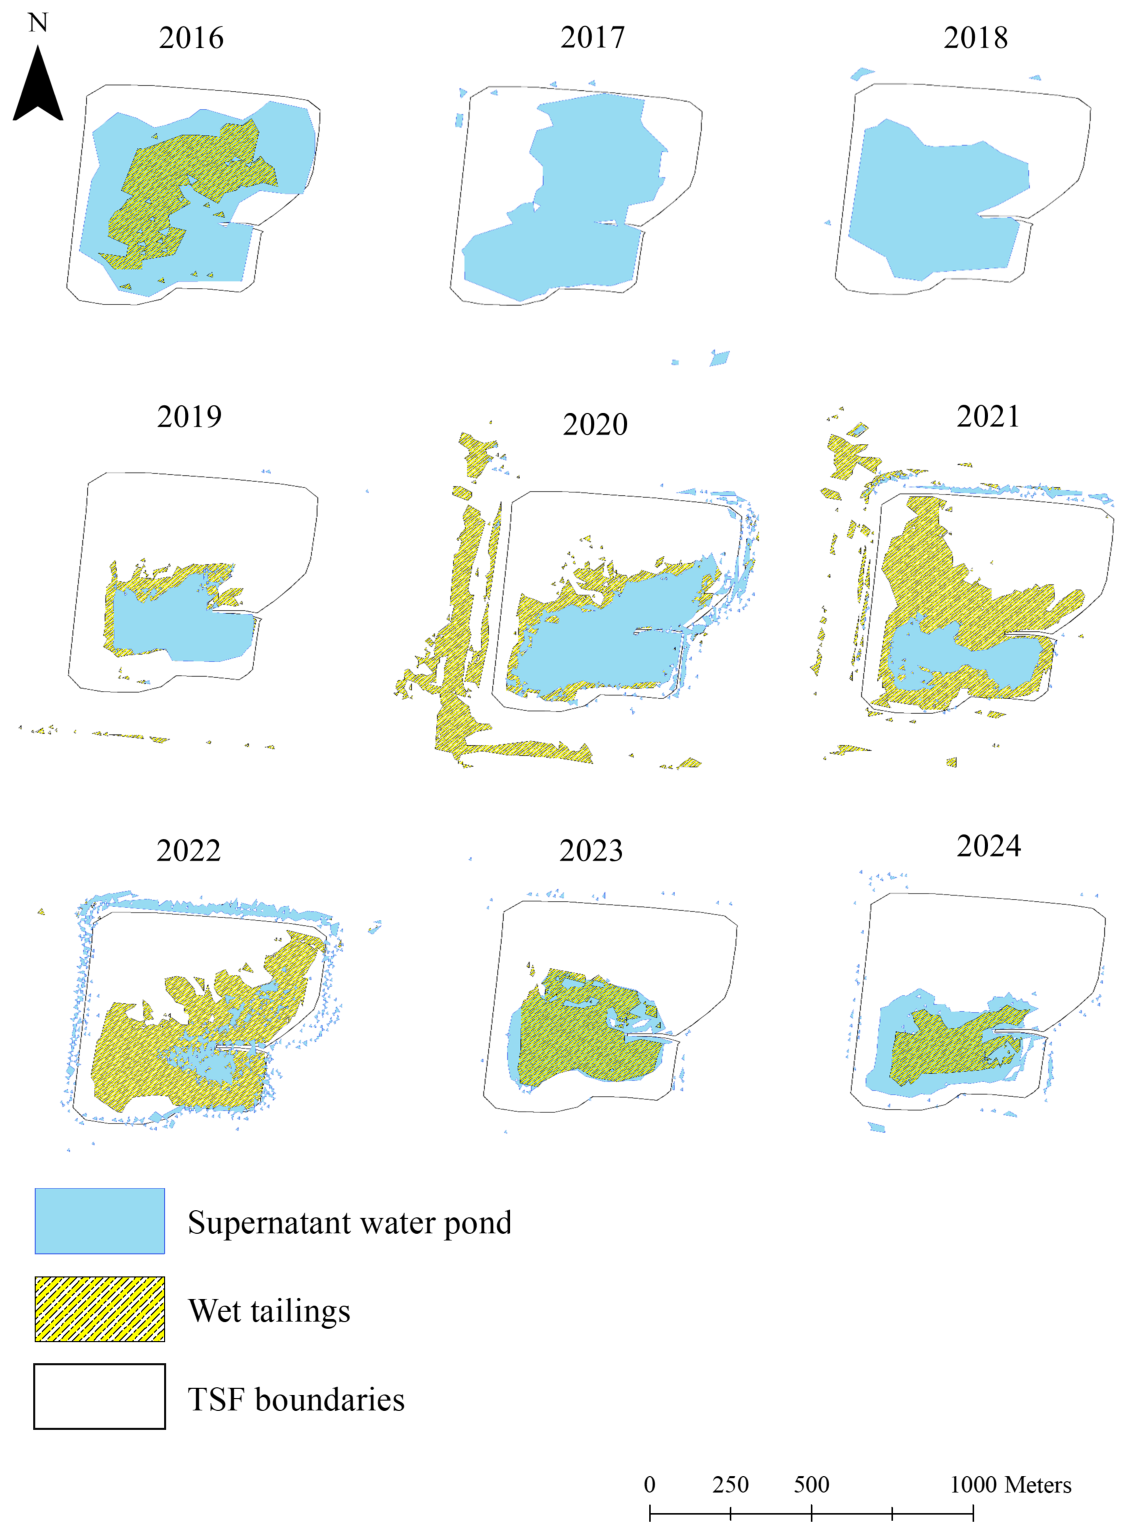
Figure 7 illustrates the annual spatial extent and distribution of wet tailings and supernatant water ponds within the TSF. The wet tailings areas surrounding the supernatant pond represent the primary zones of potential contaminant mobilization and off-pond migration. Changes in the spatial distribution of wet tailings through time provide an indication of the evolving risk of contaminant release from the TSF.
Spatial outputs depict pronounced interannual variability in the size, configuration, and location of both the water pond and wet tailings, as well as their proximity to TSF boundaries. These maps enable visual assessment of temporal hydrological dynamics within the impoundment and allow evaluation of whether the water pond remains at a safe distance from the walls of the TSF, a key factor in its stability and environmental safety.
Next, we estimate areas of wet tailings and the supernatant water pond so as to more precisely assess temporal dynamics of the TSF surface. The results reveal significant fluctuations in estimated areas that may reflect changes in precipitation, deposition patterns, material compaction, or operational practices (Table 7). We note that the year of the reported failure (2016) corresponded to one of the highest combined areas of water and wet tailings during the study period. Although the subsequent two years were characterized by declining total areas, the water pond area in 2017 and 2018 was even higher than in 2016. Then in 2019, the company managed to reduce both the total areas and the water pond area. However, the year 2020 presented extreme challenges as the water pond area doubled and the wet tailings area increased by a factor of 4. In the following two years, the company managed to achieve some reduction in the water pond, but the area of wet tailings continued to grow. In 2023, the company managed to reduce both areas. However, 2024 was again marked by a doubling of the area of the water pond (see Table 7).
The most worrisome finding from our case study is the evidence of significant spilling of wet tailings outside of the TSF in the west and south directions in 2020, as well as water spilling/seepage in the east direction (Figure 7). The situation improved somewhat in 2021; however, there were still areas that were contaminated with wet tailings west of the TSF and with process water north of the TSF. In 2022, process water was present in all directions outside the TSF, in particular along the northern embankment, which had already failed once in 2016. These findings from the geospatial analysis corroborate the company’s own reporting of the FoS value, which was persistently below the international standard of at least 1.5.
Finally, analysis of the positions of the pond and wet tailings with respect to each other is informative as well. We note that in four of the nine years, the pond and wet tailings accumulated in the center of the TSF, away from its edges, which is desirable. But, in most years, we observe a reverse situation. If the water pond surrounds wet tailings, such a pattern may indicate that tailings are deposited at the center of the TSF, which is confirmed by satellite images of the TSF and its maps (Figure 7) that reveal a point/cape that protrudes toward the center of the TSF in its southeastern section. Such a practice of tailings deposition may not be desirable from the point of view of forming dry beaches along the perimeter of the TSF, which enhances its stability. The company’s tailings deposition practice corroborates our findings of high temporal variability of the size, location, and shape of the supernatant water pond. Such a high degree of variability of TSF features was characterized by [51] as a nonconservative, i.e., a risky approach to TSF management.
However, we should acknowledge the company’s efforts in pumping water and its recirculation towards the end of our study period. According to its reports, between 2019 and 2024, use of recycled water increased by 41% and reached 96% of total water consumed. During this period, freshwater withdrawals decreased by 42%. Most of such water was used by the processing plant, enabling a decrease in fresh water intensity from 336 m3/Kt in 2019 to 50 m3/Kt in 2024. The year 2024 was marked by further major changes in water practices when freshwater intensity of processing declined by 72% compared to 2023 and wastewater collection from drainage and mine quarry increased by 20%.

4. Discussion

Dam failures associated with overtopping, static loading, and seismic activity represent the predominant failure mechanisms, collectively accounting for approximately 52% of all TSF incidents [62]. Hydro-meteorological extremes constitute an additional major driver: anomalous rainfall alone was responsible for approximately 25% of documented tailings dam failures worldwide between 1917 and 2006 [63]. Refs. [3,64] further demonstrated that intensifying extreme precipitation exerts a dominant influence on global patterns of tailings dam failures. Collectively, these findings underscore the high sensitivity of TSFs to extreme hydrological events. Our findings are in line with the existing literature and bring to light the current state of TSFs in Kazakhstan, an area that has been underexplored by previous research.
Our study has provided an overview of tailings storage facilities in Kazakhstan, an increasingly important producer of minerals. Our analysis has demonstrated the power of geospatial analysis for monitoring the performance of a TSF by external parties, which is essential for effective stakeholder engagement to support a gradual transition to more sustainable practices in mining. Such a methodology allowed us to overcome challenges due to the low transparency and limited information available on mining in Kazakhstan. Our analysis is important for informing decision-makers of the risks of the current rapid increase in mining activities. In addition, our analysis highlights challenges that require the involvement of the industry, government, and researchers. We find that while the well-known GTP database has information on 20 TSF in Kazakhstan, in fact, their number as of 2019 was around 120. TSF are widely distributed in Kazakhstan (less so in its western regions) and many are close to the international borders. As of 2019, half of these facilities had a medium level of hazard and 27% are low hazard, which compares Kazakhstan somewhat favorably to other countries in Eastern Europe, the Caucasus, and Central Asia. However, aging of facilities, their growing number, outdated approaches to TSF management, and extreme weather events pose risks to the future safe operation of Kazakhstan’s TSFs. We conduct an in-depth analysis of a representative TSF. It is a fairly new facility, classified as having a moderate level of hazard according to the UNECE methodology, located in an area that is being increasingly affected by spring flooding. Our interdisciplinary investigation, which involved analysis of geospatial information, company reports, and climatic data, has revealed serious challenges faced by the firm operating this TSF. We find that a choice of a centerline TSF design, the type of embankment material, the absence of lining during the initial years of operation, and deposition of tailings towards the center of the TSF have resulted in several instances of overtopping and seepage. The company handled these difficulties by changing the design, adding a lining, improving the drainage system, and recirculating TSF water. In addition, our analysis reveals that climate factors exacerbated the company’s challenges due to heavy precipitation, increasing temperatures and heavy spring floods. Eventually, the firm made a decision to construct another TSF. In 2025, the company reported that its original TSF became inactive, with the impoundment volume of 41 mln m3 and a height of 28.5 m. The closure and remediation plan for this TSF had not been released prior to its closure.
Lessons learned from our study emphasize the need for proactive TSF management, including improvements in TSF design, operation (tailings deposition, dewatering, independent reviews), and planning for closure. An important and urgent direction for future work is the adoption of tailings dewatering and dry stacking, which is already in use by some mining companies in Kazakhstan. The case-study company should be acknowledged for the relative transparency in informing stakeholders about challenges presented by its TSF. Its experience demonstrated that meeting national standards (e.g., minimum FoS values) is not sufficient for safe operations and implies that companies should go beyond local regulations and adopt international best practices. Our study finds that reactive measures that the company undertook in the years prior to the 2024 floods allowed it to avoid spills or seepage of tailings during such a hazardous hydrological period. However, these adaptive measures did not allow the company to continue using the original TSF till 2040 as was initially planned. These lessons learned are relevant for managing the new TSF of this company as well as other companies facing similar challenges.

5. Conclusions

Our analysis unveils the persistent difficulties of a Kazakhstani mining company despite its ongoing efforts to prevent contamination from its TSF. Increasing difficulties related to extreme weather events and rising mining production imply that mining companies in Kazakhstan should adhere to the international best practices of TSF management. Principles of SDG12 Responsible Consumption and Production should govern TSF management throughout their lifecycle: from designing a TSF to early planning of its closure and reclamation. In addition, policymakers and stakeholders should join efforts towards the urgent improvement of environmental governance in mining operations in Kazakhstan. Public discussions of the TSF status initiated by the UNECE were active in Kazakhstan during the pre-pandemic period; however, they have subsided since then. Recent policy initiatives that provide tax incentives for the reprocessing of mining waste are an important step forward. In addition, the dissemination of the experience of early adopters of tailings dewatering and dry stacking would help domestic mining companies introduce safe waste management methods. Finally, wider adoption of the Global Industry Standard on Tailings Management would allow Kazakhstan’s mining companies to benefit from the multi-year experience and international expertise in developing best practices in safe management of mine tailings.
This study has several limitations that should be acknowledged. First, wet-tailings identification was based on spectral-index classification and visual inspection of satellite imagery; therefore, some uncertainty remains in the delineation of wet-tailings boundaries and transitional surface conditions. In addition, the use of Landsat 8 imagery during 2016–2018, with its coarser spatial resolution, may have reduced the ability to detect smaller wet-tailings features compared with Sentinel-2 imagery. Second, the analysis was constrained by the availability of climatic and hydrological observations, including the absence of river-level data for 2024. Third, although the results indicate associations between periods of increased precipitation, spring flooding, and changes in TSF conditions, the study does not establish direct causal attribution between individual extreme hydrological events and observed seepage or overtopping occurrences. Furthermore, the relatively short climatic record may limit the detection of statistically significant long-term trends and highlights the need for continued monitoring.
Future research should incorporate higher-resolution remote sensing products, field observations, and geotechnical monitoring data to improve classification accuracy and enable quantitative validation of wet-tailings detection. Additional investigations could integrate hydrological and hydraulic modeling to assess the influence of extreme weather events on TSF performance and evaluate future risks under changing climatic conditions. Expanding the proposed methodology to multiple TSFs across Kazakhstan would also support regional-scale assessment of tailings-management practices and associated environmental risks.

Author Contributions

Conceptualization: Z.A.; Data curation: A.K. and M.B.; Formal Analysis: M.B. and A.K.; Investigation: A.K., M.B. and Z.A.; Methodology: Z.A., M.B. and A.K.; Project administration: Z.A.; Resources: M.B.; Software: M.B. and A.K.; Validation: M.B. and Z.A.; Visualization: M.B., Z.A. and A.K.; Writing—original draft: A.K., Z.A. and M.B.; Writing—review and editing: Z.A. and M.B.; Funding acquisition: M.B. All authors have read and agreed to the published version of the manuscript.

Funding

This research was funded by Nazarbayev University under the Faculty development competitive research grants program №110326FD3229, MB.

Institutional Review Board Statement

Not applicable.

Informed Consent Statement

Not applicable.

Data Availability Statement

The research data are available upon request.

Acknowledgments

The authors are grateful to UNECE for conducting the mapping of Kazakhstan’s TSFs and for making these maps publicly available.

Conflicts of Interest

The authors declare no conflicts of interest.

Appendix A

Figure A1. Results of the Mann–Kendall trend test and Sen’s slope estimator for annual and monthly air temperature, precipitation, and river level.
Sustainability 18 06479 g0a1

References

  1. Moldovan, A.; Török, A.I.; Kovacs, E.; Cadar, O.; Mirea, I.C.; Micle, V. Metal contents and pollution indices assessment of surface water, soil, and sediment from the Arieș River Basin mining area, Romania. Sustainability 2022, 14, 8024. [Google Scholar] [CrossRef] [Scilit]
  2. Del Rio, J.I.; Fernandez, P.; Castillo, E.; Orellana, L.F. Assessing climate change risk in the mining industry: A case study in the copper industry in the Antofagasta region, Chile. Commodities 2023, 2, 246–260. [Google Scholar] [CrossRef] [Scilit]
  3. Pearce, T.D.; Ford, J.D.; Prno, J.; Duerden, F.; Pittman, J.; Beaumier, M.; Smit, B. Climate change and mining in Canada. Mitig. Adapt. Strateg. Glob. Change 2011, 16, 347–368. [Google Scholar] [CrossRef] [Scilit]
  4. International Council on Mining and Metals (ICMM). Climate Change: Position Statement; ICMM: London, UK, 2021; Available online: https://www.icmm.com/website/publications/pdfs/mining-principles/position-statements_climate-change.pdf?cb=59897 (accessed on 2 February 2026).
  5. International Council on Mining and Metals (ICMM). Tailings Management: Good Practice Guide; ICMM: London, UK, 2025; Available online: https://www.icmm.com/tailings-management (accessed on 2 March 2025).
  6. Atakhanova, Z.; Azhibay, S. Assessing economic sustainability of mining in Kazakhstan. Miner. Econ. 2023, 36, 719–731. [Google Scholar] [CrossRef] [Scilit]
  7. Kunarbekova, M.; Yeszhan, Y.; Zharylkan, S.; Alipuly, M.; Zhantikeyev, U.; Beisebayeva, A.; Kudaibergenov, K.; Rysbekov, K.; Toktarbay, Z.; Azat, S. The state of the art of the mining and metallurgical industry in Kazakhstan and future perspectives: A systematic review. ES Mater. Manuf. 2024, 25, 1219. [Google Scholar] [CrossRef] [Scilit]
  8. Hausfather, Z.; Peters, G.P. Emissions—The ‘business as usual’ story is misleading. Nature 2020, 577, 618–620. [Google Scholar] [CrossRef] [Scilit] [PubMed]
  9. Ritchie, J.; Dowlatabadi, H. Why do climate change scenarios return to coal? Energy 2017, 140, 1276–1291. [Google Scholar] [CrossRef] [Scilit]
  10. Burgess, M.G.; Ritchie, J.; Shapland, J.; Pielke, R., Jr. IPCC baseline scenarios have over-projected CO2 emissions and economic growth. Environ. Res. Lett. 2021, 16, 014016. [Google Scholar] [CrossRef] [Scilit]
  11. Van Vuuren, D.P.; O’Neill, B.C.; Tebaldi, C.; Sanderson, B.M.; Chini, L.P.; Friedlingstein, P.; Hasegawa, T.; Riahi, K.; Govindasamy, B.; Bauer, N.; et al. The Scenario Model Intercomparison Project for CMIP7 (ScenarioMIP-CMIP7). Geosci. Model Dev. 2026, 19, 2627–2656. [Google Scholar] [CrossRef] [Scilit]
  12. Yao, J.; Chen, Y.; Chen, J.; Zhao, Y.; Tuoliewubieke, D.; Li, J.; Mao, W. Intensification of extreme precipitation in arid Central Asia. J. Hydrol. 2021, 598, 125760. [Google Scholar] [CrossRef] [Scilit]
  13. Karatayev, M.; Clarke, M.; Salnikov, V.; Bekseitova, R.; Nizamova, M. Monitoring climate change, drought conditions and wheat production in Eurasia: The case study of Kazakhstan. Heliyon 2022, 8, 1. [Google Scholar] [CrossRef] [Scilit] [PubMed]
  14. Karthe, D.; Chalov, S.; Borchardt, D. Water resources and their management in Central Asia in the early twenty-first century. Environ. Earth Sci. 2015, 73, 487–499. [Google Scholar] [CrossRef] [Scilit]
  15. Fallah, B.; Didovets, I.; Rostami, M.; Hamidi, M. Climate change impacts on Central Asia. Int. J. Climatol. 2024, 44, 3191–3213. [Google Scholar] [CrossRef] [Scilit]
  16. Baigaliyeva, M.; McGowan, S.; Mount, N.; Gosling, S.N. Future impacts of water abstraction and climate change on Shortandy Lake, Kazakhstan. Environ. Res. Water 2025, 1, 045008. [Google Scholar] [CrossRef] [Scilit]
  17. Liu, Z.; Huang, B.; Liu, S.; Fan, X.; Yin, J.; Duan, Q. Anatomy and assessment of surface water and energy balance components simulated by CMIP6 models in Pan Third Pole. J. Hydrol. 2025, 652, 132656. [Google Scholar] [CrossRef] [Scilit]
  18. Wu, X.; Tang, W.; Chen, F.; Wang, S.; Bakhtiyorov, Z.; Liu, Y.; Guan, Y. Attribution and risk projections of hydrological drought over water-scarce Central Asia. Earth’s Future 2025, 13, e2024EF005243. [Google Scholar] [CrossRef] [Scilit]
  19. Shen, Y.J.; Shen, Y.; Guo, Y.; Zhang, Y.; Pei, H.; Brenning, A. Review of historical and projected future Climatic and hydrological changes in mountainous semiarid Xinjiang (northwestern China), Central Asia. Catena 2020, 187, 104343. [Google Scholar] [CrossRef] [Scilit]
  20. Zhu, Y.; Yang, P.; Xia, J.; Huang, H.; Chen, Y.; Li, Z.; Lu, X. Drought propagation and its driving forces in Central Asia under climate change. J. Hydrol. 2024, 636, 131260. [Google Scholar] [CrossRef] [Scilit]
  21. Aitzhanova, M.; Zhaparova, S. Environmental risk assessment of spring floods in the Akmola Region of Kazakhstan. Int. J. Sustain. Dev. Plan. 2023, 18, 181033. [Google Scholar] [CrossRef] [Scilit]
  22. Liu, Y.; Samat, A.; Du, P.; Chen, J.; Abuduwaili, J.; Luo, K.; Zhu, E.; Shokparova, D. High-resolution spatiotemporal analysis and driver attribution of floods in Kazakhstan using SHAP and remote sensing integration. Clim. Risk Manag. 2026, 51, 100783. [Google Scholar] [CrossRef] [Scilit]
  23. Naqtybay, E. Flood Damage May Exceed 200 Billion Tenge. Kazinform 2024. Available online: https://kaz.inform.kz/news/taskinnin-shigini-200-mlrd-tengeden-asui-mumkn-erlan-sairovtin-bolzhami-3e4563/ (accessed on 1 May 2025).
  24. Zhang, W.; Li, L.; Zhou, T.; Brody, M.; He, Q.; Xu, M.; Madibekov, A. Central Asian compound flooding in 2024 Contributed by Climate Warming and Interannual Variability. Adv. Atmos. Sci. 2025, 42, 2195–2202. [Google Scholar] [CrossRef] [Scilit]
  25. Golian, S.; El-Idrysy, H.; Stambuk, D. Using CMIP6 Models to Assess Future climate change effects on mine sites in Kazakhstan. Hydrology 2023, 10, 150. [Google Scholar] [CrossRef] [Scilit]
  26. Laiskhanov, S.; Sharapkhanova, Z.; Myrzakhmetov, A.; Levin, E.; Taukebayev, O.; Nurmagambetuly, Z.; Kaster, S. Geo-ecological analysis of the causes and consequences of flooding in the western region of Kazakhstan. Urban Sci. 2025, 9, 20. [Google Scholar] [CrossRef] [Scilit]
  27. Nurbatsina, A.; Salavatova, Z.; Tursunova, A.; Didovets, I.; Huthoff, F.; Rodrigo-Clavero, M.-E.; Rodrigo-Ilarri, J. Flood modelling of the Zhabay River Basin under climate change conditions. Hydrology 2025, 12, 35. [Google Scholar] [CrossRef] [Scilit]
  28. Atakhanova, Z.; Meirambayeva, M.; Baigaliyeva, M. Mine water use in Kazakhstan. Sustainability 2024, 16, 2456. [Google Scholar] [CrossRef] [Scilit]
  29. Portnov, V.; Yurov, V.; Maussymbayeva, A.; Kassymov, S.; Zholmagambetov, N. Assessment of radiation risk at the population from pits, dumps and tailing dams of uranium mines. Int. J. Min. Reclam. Environ. 2017, 31, 3. [Google Scholar] [CrossRef] [Scilit]
  30. Nygymanova, A.; Kuterbekov, K.; Bakhtin, M.; Karpenko, E.; Kabyshev, A. Assessment of the radiation situation in the territory of the Saumalkol village, located near the mothballed uranium mine of the North Kazakhstan region. Eurasian J. Phys. Funct. Mater. 2021, 5, 3. [Google Scholar] [CrossRef] [Scilit]
  31. Baubekova, A.; Akindykova, A.; Mamirova, A.; Dumat, C.; Jurjanz, S. Evaluation of environmental contamination by toxic trace elements in Kazakhstan based on reviews of available scientific data. Environ. Sci. Pollut. Res. 2021, 28, 43315–43328. [Google Scholar] [CrossRef] [Scilit] [PubMed]
  32. Toishimanov, M.; Abilda, Z.; Daurov, D.; Daurova, A.; Zhapar, K.; Sapakhova, Z.; Kanat, R.; Stamgaliyeva, Z.; Zhambakin, K.; Shamekova, M. Phytoremediation properties of sweet potato for soils contaminated by heavy metals in South Kazakhstan. Appl. Sci. 2023, 13, 9589. [Google Scholar] [CrossRef] [Scilit]
  33. Severinenko, M.A.; Solodukhin, V.P.; Djenbaev, B.M.; Lennik, S.G.; Zholboldiev, B.K.; Snow, D.D. Occurrence of radionuclides and hazardous elements in the transboundary river basin Kyrgyzstan–Kazakhstan. Water 2023, 15, 1759. [Google Scholar] [CrossRef] [Scilit]
  34. Zhyrgalova, A.; Yelemessov, S.; Ablaikhan, B.; Aitkhozhayeva, G.; Zhildikbayeva, A. Assessment of potential ecological risk of heavy metal contamination of agricultural soils in Kazakhstan. Braz. J. Biol. 2024, 84, e280583. [Google Scholar] [CrossRef] [Scilit] [PubMed]
  35. Zhang, Y.; Juvigny-Khenafou, N.; Xiang, H.; Lin, Q.; Wu, Z. Multiple stressors in China’s freshwater ecoregions. In Multiple Stressors in River Ecosystems; Elsevier: Amsterdam, The Netherlands, 2019. [Google Scholar] [CrossRef] [Scilit]
  36. Rana, N.M.; Delaney, K.B.; Evans, S.G.; Deane, E.; Small, A.; Adria, D.A.M.; McDougall, S.; Ghahramani, N.; Take, W.A. Application of Sentinel-1 InSAR to monitor tailings dams and predict geotechnical instability: Practical considerations based on case study insights. Bull. Eng. Geol. Environ. 2024, 83, 204. [Google Scholar] [CrossRef] [Scilit]
  37. Xie, W.; Wu, J.; Gao, H.; Chen, J.; He, Y. SBAS-InSAR based deformation monitoring of tailings dam: The case study of the Dexing Copper Mine No. 4 tailings dam. Sensors 2023, 23, 9707. [Google Scholar] [CrossRef] [Scilit] [PubMed]
  38. Werner, T.T.; Mudd, G.M.; Schipper, A.M.; Huijbregts, M.A.J.; Taneja, L.; Northey, S.A. Global-scale remote sensing of mine areas and analysis of factors explaining their extent. Glob. Environ. Change 2020, 60, 102007. [Google Scholar] [CrossRef] [Scilit]
  39. Pérez-Murillo, G.; McIntyre, N.; Cohen, R.C.Z.; Prakash, M. Tailings storage facilities flood exposure assessment using a 2D hydrodynamic model. J. Flood Risk Manag. 2022, 15, e12810. [Google Scholar] [CrossRef] [Scilit]
  40. Saidaliyeva, Z.; Muccione, V.; Shahgedanova, M.; Bigler, S.; Adler, C. Adaptation to climate change in the mountain regions of Central Asia: A systematic literature review. WIREs Clim. Change 2024, 15, e891. [Google Scholar] [CrossRef] [Scilit]
  41. Salnikov, V.; Talanov, Y.; Polyakova, S.; Assylbekova, A.; Kauazov, A.; Bultekov, N.; Musralinova, G.; Kissebayev, D.; Beldeubayev, Y. An assessment of the present trends in temperature and precipitation extremes in Kazakhstan. Climate 2023, 11, 33. [Google Scholar] [CrossRef] [Scilit]
  42. Duczmal-Czernikiewicz, A.; Baibatsha, A.; Bekbotayeva, A.; Omarova, G.; Baisalova, A. Ore minerals and metal distribution in tailings of sediment-hosted stratiform copper deposits from Poland and Kazakhstan. Minerals 2021, 11, 752. [Google Scholar] [CrossRef] [Scilit]
  43. Seksenova, N.; Bykov, R.; Mamyachenkov, S.; Daumova, G.; Kozhakanova, M. Optimization of conditions for processing of lead–zinc ores enrichment tailings of East Kazakhstan. Metals 2021, 11, 1802. [Google Scholar] [CrossRef] [Scilit]
  44. Baibatsha, A.A.B.; Omarova, G.M.; Baibatchayeva, Z.T. Tailings are a reliable source of mineral reserves (Kazakhstan). In Recent Research on Geomorphology, Sedimentology, Marine Geosciences and Geochemistry (CAJG 2019); Çiner, A., Grab, S., Jaillard, E., Doronzo, D., Michard, A., Rabineau, M., Chaminé, H.I., Eds.; Advances in Science, Technology & Innovation; Springer: Cham, Switzerland, 2022. [Google Scholar] [CrossRef] [Scilit]
  45. Muratkhanov, D.; Mirlas, V.; Anker, Y.; Miroshnichenko, O.; Smolyar, V.; Rakhimov, T.; Sotnikov, Y.; Rakhimova, V. Heavy metal groundwater transport mitigation from an ore enrichment plant tailing at Kazakhstan’s Balkhash Lake. Sustainability 2024, 16, 6816. [Google Scholar] [CrossRef] [Scilit]
  46. Alipuly, M.; Rysbekov, K.; Begentayev, M.; Lee, J.; Azat, S. Mine waste and its recycling in Kazakhstan. Energy Environ. 2026, 0958305X261425530. [Google Scholar] [CrossRef] [Scilit]
  47. United Nations Economic Commission for Europe. Pilot Project to Strengthen the Safety of Mining Operations, in Particular Tailings Management Facilities (TMFs), in Kazakhstan and Beyond in Central Asia; United Nations Economic Commission for Europe: Geneva, Switzerland, 2021; Available online: https://unece.org/pilot-project-strengthen-safety-mining-operations-particular-tailings-management-facilities-tmfs (accessed on 10 April 2024).
  48. Kovacs, A.; Lohunova, O.; Winkelmann-Oei, G.; Madai, F.; Török, Z. Safety of the Tailings Management Facilities in the Danube River Basin; German Environment Agency: Dessau, Germany, 2020. Available online: https://unece.org/sites/default/files/2022-07/Safety%20of%20the%20Tailings.pdf (accessed on 10 October 2025).
  49. Lohunova, O. TMF Mapping in Central Asia: Kazakhstan, Kyrgyzstan, and Tajikistan in the Spotlight. 2019. Available online: https://unece.org/sites/default/files/2025-07/2_Ms._Oleksandra_Lohunova_TMF_mapping_ENG_0.pdf (accessed on 10 October 2024).
  50. Runfola, D.; Anderson, A.; Baier, H.; Crittenden, M.; Dowker, E.; Fuhrig, S.; Goodman, S.; Grimsley, G.; Layko, R.; Melville, G.; et al. geoBoundaries: A global database of political administrative boundaries. PLoS ONE 2020, 15, e0231866. [Google Scholar] [CrossRef] [Scilit] [PubMed]
  51. Cacciuttolo, C.; Cano, D. Spatial and temporal study of supernatant process water pond in tailings storage facilities: Use of remote sensing techniques for preventing mine tailings dam failures. Sustainability 2023, 15, 4984. [Google Scholar] [CrossRef] [Scilit]
  52. United Nations Economic Commission for Europe. Survey of the Most Hazardous TSFs in Kazakhstan, Including Those with Transboundary Risks: Recommendations and Next Steps. Available online: https://unece.org/sites/default/files/2025-07/1_RUS_TMF_hotspots_in_Kazakhstan_Mr._Yerkin_Duisenbayev.pdf (accessed on 10 May 2025).
  53. Thomas, A.; Edwards, S.; Engels, J.; McCormack, H.; Hopkins, V.; Holley, R. Earth observation data and satellite InSAR for the remote monitoring of tailings storage facilities: A case study of Cadia Mine, Australia. In Proceedings of the 22nd International Conference on Paste, Thickened and Filtered Tailings, Australian Centre for Geomechanics, Paste 2019, Perth, Australia, 8–10 May 2019; pp. 183–195. [Google Scholar]
  54. Liu, C.; Shen, Z.; Gan, L.; Xu, L.; Zhang, K.; Jin, T. The seepage and stability performance assessment of a new drainage system to increase the height of a tailings dam. Appl. Sci. 2018, 8, 1840. [Google Scholar] [CrossRef] [Scilit]
  55. Xia, H.; Zhao, J.; Qin, Y.; Yang, J.; Cui, Y.; Song, H.; Ma, L.; Jin, N.; Meng, Q. Changes in water surface area during 1989–2017 in the Huai River Basin using Landsat data and Google Earth Engine. Remote Sens. 2019, 11, 1824. [Google Scholar] [CrossRef] [Scilit]
  56. McFeeters, S.K. The use of the Normalized Difference Water Index (NDWI) in the delineation of open water features. Int. J. Remote Sens. 1996, 17, 1425–1432. [Google Scholar] [CrossRef] [Scilit]
  57. Xu, H. Modification of normalised difference water index (NDWI) to enhance open water features in remotely sensed imagery. Int. J. Remote Sens. 2006, 27, 3025–3033. [Google Scholar] [CrossRef] [Scilit]
  58. Rouse, J.W.; Haas, R.H.; Schell, J.A.; Deering, D.W. Monitoring vegetation systems in the great plains with ERTS. In Proceedings of the Third ERTS Symposium, Washington, DC, USA, 10–14 December 1973; NASA: Washington, DC, USA, 1973; Volume 1, pp. 309–317. [Google Scholar]
  59. Mann, H.B. Nonparametric tests against trend. Econometrica 1945, 13, 245–259. [Google Scholar] [CrossRef] [Scilit]
  60. Kendall, M.G. Further contributions to the theory of paired comparisons. Biometrics 1955, 11, 43–62. [Google Scholar] [CrossRef] [Scilit]
  61. Wang, F.; Shao, W.; Yu, H.; Kan, G.; He, X.; Zhang, D.; Ren, M.; Wang, G. Re-evaluation of the power of the Mann–Kendall test for detecting monotonic trends in hydrometeorological time series. Front. Earth Sci. 2020, 8, 14. [Google Scholar] [CrossRef] [Scilit]
  62. Hudson-Edwards, K.A.; Kemp, D.; Torres-Cruz, L.A.; Macklin, M.G.; Brewer, P.A.; Owen, J.R.; Thomas, C.J. Tailings storage facilities, failures and disaster risk. Nat. Rev. Earth Environ. 2024, 5, 612–630. [Google Scholar] [CrossRef] [Scilit]
  63. Rico, M.; Benito, G.; Salgueiro, A.R.; Díez-Herrero, A.; Pereira, H.G. Reported tailings dam failures: A review of the European incidents in the worldwide context. J. Hazard. Mater. 2008, 152, 846–852. [Google Scholar] [CrossRef] [Scilit] [PubMed]
  64. Lumbroso, D.; McElroy, C.; Goff, C.; Collell, M.R.; Petkovsek, G.; Wetton, M. The potential to reduce the risks posed by tailings dams using satellite-based information. Int. J. Disaster Risk Reduct. 2019, 38, 101209. [Google Scholar] [CrossRef] [Scilit]
Figure 1. Spatial distribution of TSFs in Kazakhstan (administrative boundaries of Kazakhstan and its regions from [50]; TSF locations and Tailings Hazard Index from [47]).
Sustainability 18 06479 g001
Figure 2. Workflow of satellite imagery processing.
Sustainability 18 06479 g002
Figure 3. Satellite images of the case-study TSF around the time of the 2016 failure (Source: Landsat 8).
Sustainability 18 06479 g003
Figure 4. Production at the processing plant and associated mines (Source: company reports).
Sustainability 18 06479 g004
Figure 5. Climate data for the study area: (a) annual average air temperature (2000–2024), (b) total annual precipitation (2000–2024), and (c) river water level records (1995–2023).
Sustainability 18 06479 g005
Figure 6. Water level in the nearby river.
Sustainability 18 06479 g006
Figure 7. Temporal evolution of the supernatant water pond, wet tailings, and TSF boundaries from 2010 to 2022. The wet tailings areas surrounding the pond represent the zones with the greatest potential for contaminant transport and off-pond migration.
Sustainability 18 06479 g007
Table 1. Analysis of Kazakhstan’s TSFs based on UNECE and GTP databases.
UNECE (2017–2019)GTP (2020)
Number of TSFs11820
Total volume, mln m32817687
Average volume, mln m324.734.4
Earliest commissioning year19371949
Average commissioning year19851989
Active TSF, % total7680
Tailings Hazard Index, average13n/a
Table 2. THI values in selected countries covered by UNECE studies.
CountryTHIminTHImaxTHIaverage
Armenia11.916.614.0
Georgia12.216.514.0
Kyrgyzstan11.515.913.3
Hungary8.012.910.8
Romania6.314.811.5
Serbia11.316.314.1
Kazakhstan5.715.510.3
Table 3. Preprocessing of satellite imagery in GEE.
Preprocessing StepDescription
1Cloud Cover ThresholdOnly images with less than 5% cloud coverage were retained.
2Temporal CompositingA median composite was generated for each year to reduce atmospheric variability and improve feature visibility.
3Cloud, Snow, and Shadow MaskingQuality Assessment bands were used to exclude pixels affected by clouds, shadows, and snow.
4Spectral Band SelectionBands B3 (Green), B4 (Red), B8 (NIR), and B11 (SWIR1) were extracted for further analysis in ArcGIS for the calculation of indexes.
Table 4. Description of bands used for index calculation.
BandDescriptionSentinel-2 ResolutionLandsat 8 Resolution
B3 (Green)Green reflectance, distinguishes clear and muddy water, highlights oil and vegetation, and reflects green light strongly while still showing human-made features.10 m30 m
B4 (Red)Red reflectance, reflects well from dead foliage, helping identify vegetation, soil, and urban areas, but poorly from live plants and water.10 m30 m
B8 (NIR)Near-infrared, used for the classification of vegetation10 m30 m (Band 5)
B11 (SWIR1)Short-wave infrared, effective for assessing soil and vegetation moisture and distinguishing between various vegetation types20 m30 m (Band 6)
Table 5. Air temperature at the nearest weather station (°C), average over 2014–2024.
Month LevelChange from Previous Month
January−14.8−3.1
February−13.41.4
March−6.07.4
April6.512.6
May14.88.2
June19.24.5
July20.91.7
August19.6−1.3
September12.1−7.5
October4.2−7.9
November−5.2−9.4
December−11.7−6.5
Table 6. Temporal variation in Spectral Index Values during the spring snowmelt period.
YearNDWINDVIMNDWI
Highest ValueLowest ValueHighest ValueLowest ValueHighest ValueLowest Value
20160.94182−0.882870.75812−0.8989170.928088−0.948451
20170.98715−0.7030080.977077−0.9903960.926532−0.865319
20180.85849−0.8563980.928950−0.5666310.739062−0.906881
20190.419242−0.6135850.487018−0.3155110.9122−0.692287
20200.41701−0.520530.47211−0.2712740.88633−0.554714
20210.237549−0.3962290.37491−0.1445490.797838−0.383048
20220.258644−0.4031150.387399−0.1359870.858205−0.519669
20230.569151−0.5529860.490972−0.3947480.844439−0.68291
20240.612529−0.6262390.65748−0.4618460.792193−0.65093
Table 7. Areas of wet tailings and supernatant process water (Source: authors’ calculations; company reports).
YearWater (m2)Tailings (m2)Total Area (m2)∆ prcp.,
**
Events
2016750,762456,6301,207,392+6.9%Northern embankment failure in September 2016 due to flaws in upstream raising. A shift to a downstream raising and reinforcement (a rock-fill buttress and real-time monitoring).
2017994,8340994,834−4.7%
2018823,2650823,265−7.2%
2019334,990133,941468,931−11.7%Completion of 4 construction phases and raising the elevation to 18 m. Drainage systems and geomembrane linings implemented. SF reported at 1.205. Capacity rose to 33.87 million m3.
2020 *669,875616,4651,286,340+27.2%Beginning of construction of a new TSF (30 million m3 capacity) with a goal of adding storage capacity and environmental safety.
2021 *291,939796,3411,088,280−32.6%TSF embankment raised to 22 m. Safety surveys prompted new berms and improvements to linings. Freeboard of 1.5 m introduced. SF reported around 1.205. Advanced drainage and water management systems are integrated to mitigate overtopping and seepage.
2022 *294,779742,7291,037,508−5.2%External audit revealed soil stability data gaps. Further engineering assessments followed. Impoundment volume reached 35.34 million m3. Emergency plans and environmental risk assessments were updated; SF remained the same.
2023131,356445,144576,500+42.9%Continued operation at 35.34 million m3. Design adapted to weather extremes with 2 m. freeboard. Enhanced sediment control and water recovery implemented. Audits confirmed compliance with GISTM and national regulations.
2024290,313234,730525,043+33.6%Completing construction of the new TSF. Continued reuse and recirculation of water from the original TSF. Analysis of future steps for its remediation and closure.
Notes: * Periods when major spills or seepage were detected by geospatial analysis. ** Change in precipitation with respect to the average level during the preceding years, starting from 2014.
Disclaimer/Publisher’s Note: The statements, opinions and data contained in all publications are solely those of the individual author(s) and contributor(s) and not of MDPI and/or the editor(s). MDPI and/or the editor(s) disclaim responsibility for any injury to people or property resulting from any ideas, methods, instructions or products referred to in the content.