


Abstract
Accurate monitoring of hydrological dynamics in complex perennial landscapes is a cornerstone for tropical agricultural sustainability. Traditional energy balance models based on orbital optical data often face methodological bottlenecks due to cloud cover and the “greening myth,” where optical indices fail to capture immediate water stress due to the non-linear decoupling between stomatal closure and pigment loss. This study developed a cloud-integrated multisensor framework to estimate actual evapotranspiration (ETa) at a refined 100 m resolution in mountain coffee systems, utilizing active microwave proxies from Sentinel-1. We fused polarimetric metrics—Degree of Polarization (DoP) and Shannon Entropy (SE)—with land surface temperature and soil moisture data. Multiple Linear Regression (MLR) was compared against non-linear algorithms (Random Forest and SVR) to prioritize model parsimony and physical interpretability. The results show that MLR emerged as the most parsimonious and suitable model within this localized dataset scope (R2 = 0.872; RMSE = 2.916 mm/8-day), outperforming complex “black-box” architectures. Soil moisture emerged as the dominant environmental driver of ETa variability, while SAR-based metrics served as sensitive mechanical proxies for canopy geometric heterogeneity and macro-structural variations. Cross-correlation analysis revealed a 16-day lag, empirically indicating that biophysical water shifts temporally precede geometric canopy alterations. Operationally, this framework ensures temporal continuity under persistent cloud cover and provides high-fidelity spatial detailing for precision water management. This approach offers an auditable and scalable tool for watershed planning and climate resilience in tropical agriculture.
1. Introduction
Accurate monitoring of hydrological dynamics and crop metabolism within complex perennial landscapes represents a significant challenge for the sustainability of tropical agriculture. Among these systems, mountain coffee production is particularly critical due to its high economic importance and structural vulnerability to climate variability, where thermal stress and soil water deficits directly impact yield and system resilience. Within this context, actual evapotranspiration (ETa) emerges as a pivotal biophysical property, serving as a fundamental determinant of energy balance equations and hydrological cycles at the soil-vegetation-atmosphere interface [1,2].
Traditionally, regional ETa estimation has relied on surface energy balance models derived from orbital optical and thermal data, such as the Surface Energy Balance Algorithm for Land (SEBAL) [1] and Mapping Evapotranspiration with Internalized Calibration (METRIC) [2]. While these approaches provide consistent estimates of net radiation and surface heat fluxes [1,2], they face two critical methodological bottlenecks: cloud contamination, which creates severe temporal gaps and precludes continuous monitoring during high-nebulosity periods, limiting the efficacy of optical sensors; and the so-called “greening myth.” This phenomenon arises because traditional optical indices measure vegetation vigor and density but frequently underestimate the immediate impacts of water stress due to the non-linear temporal decoupling between crop stomatal closure and actual loss of green pigmentation [3].
To address these limitations, contemporary Earth system modeling increasingly moves toward process-structured approaches grounded in physical concepts and relationships, seeking to mitigate purely statistical artifacts [4]. In this context, active microwave sensors, such as the Synthetic Aperture Radar (SAR) aboard the Sentinel-1 satellite, emerge as a robust solution due to their all-weather imaging capability and direct sensitivity to both the geometry and dielectric constant of plant tissues. Advanced polarimetric metrics, such as Shannon Entropy (SE) and Degree of Polarization (DoP), transcend raw backscatter analysis by quantifying the disorder and purity of the signal reflected by the canopy architecture. The physical foundation linking active microwave backscatter to vegetation parameters relies on canopy structural scattering and dielectric properties, as established in the seminal works of Ulaby et al. [5] and Paloscia & Pampaloni [6]. These historical benchmarks demonstrated that microwave indices are highly sensitive to vegetation water content, serving as physical proxies for crop conditions. Early integrations of microwave data into surface energy balance models, such as those by Jackson et al. [7] and Entekhabi et al. [8], laid the groundwork for modern radar-based drought monitoring and evapotranspiration mapping by using soil moisture anomalies as primary hydrologic driving controls. Building upon these classical radar-vegetation scattering physics, when perennial coffee structures face moisture variations, canopy macrostructural responses alter the backscatter signature in response to short-term environmental stresses [9]. By fusing this geometric radar sensitivity with Land Surface Temperature (LST) and deep soil moisture controls, it becomes possible to model biophysical responses and track the water-related time-lags that characterize ecosystem memory [9,10].
To ensure the fidelity and transparency required for high-stakes decision-making and agricultural auditing, this framework avoids algorithmic opacity, where the lack of causal traceability can perpetuate hidden biases [11]. Instead, we prioritize the formulation of an explainable and auditable predictive structure, where each metabolic estimate is directly linked to biophysical constraints and local ecological realities. Consequently, the primary contributions of this study are to: (1) develop an integrated, cloud-based multisensor computational framework to estimate ETa in mountain coffee production at a refined spatial resolution of 100 m; (2) quantify the structural-metabolic coupling of coffee through polarimetric metrics extracted from continuous Sentinel-1 time series; (3) evaluate the temporal precursivity and empirical lag associations of radar metrics to assess their capacity as all-weather operational precursors to canopy water variations; and (4) contrast the performance of linear and non-linear predictive algorithms. While physical models like SEBAL/METRIC rely on clear-sky optical data and complex Deep Learning hybrids require massive datasets, this research evaluates if a parsimonious approach can bridge these gaps.
Hypothesis 1 (H1).
Active microwave polarimetric structural metrics can effectively complement optical-thermal data gaps under persistent cloud cover without generating detrimental multi-collinearity in linear estimation pipelines.
Hypothesis 2 (H2).
In complex, highly fragmented perennial agroecosystems characterized by high topographic variance, a parsimonious multiple linear architecture integrated with physical soil moisture controls can match or outperform uncalibrated non-linear “black-box” machine learning structures due to reduced overfitting risks under constrained sample sizes.
2. Materials and Methods
2.1. Study Area and Reference Data
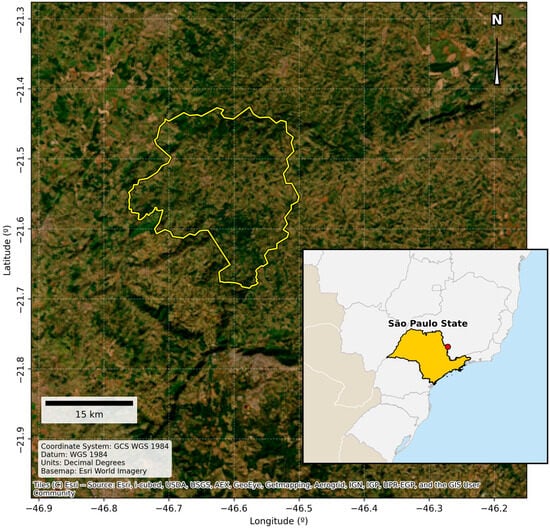
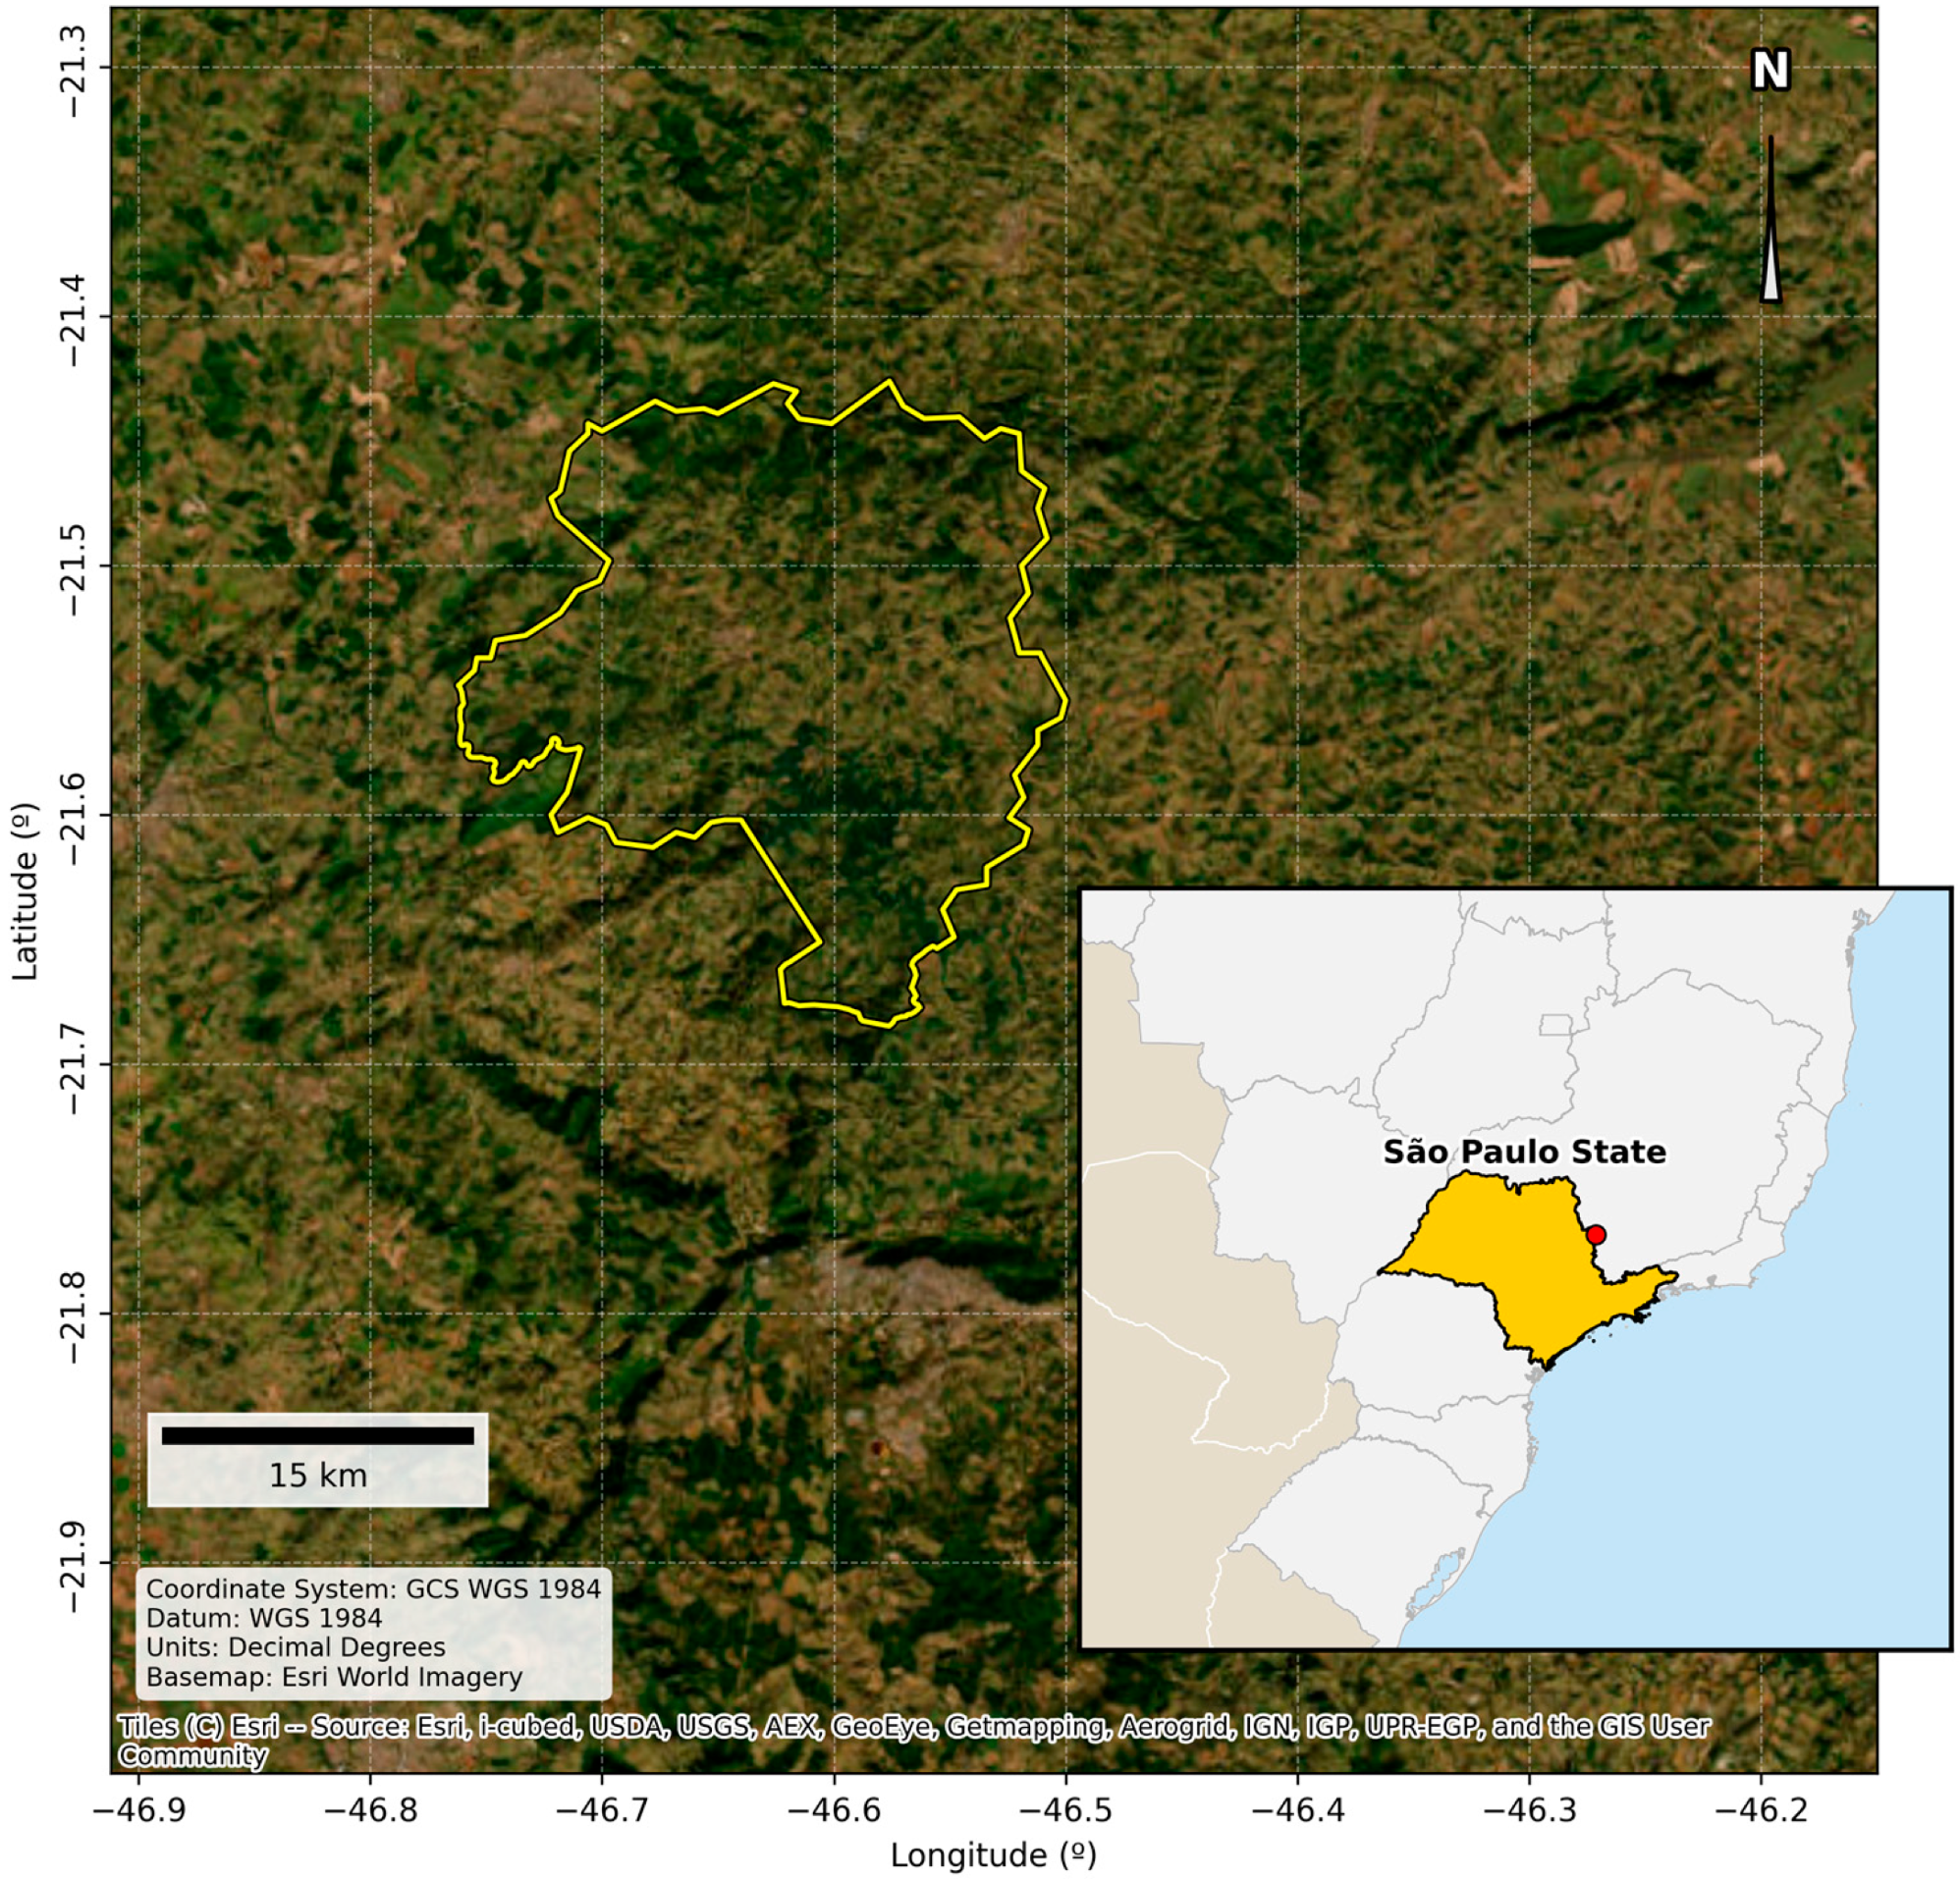
The study was conducted in the municipality of Caconde, São Paulo (Brazil) (Figure 1), a region characterized by complex topography and a predominance of mountain coffee systems. In such heterogeneous landscapes, accurate ETa estimation is essential for sustainable water management, particularly where in situ measurements fail to provide adequate regional-scale representativeness. To ensure data integrity, coffee-specific pixels were strictly isolated using the MapBiomas land-use mask (Collection 9, Class 46) [12].
Figure 1.
Geographic location of the study area application in the municipality of Caconde, São Paulo (Brazil).
It must be noted that public ground-based validation infrastructures—such as Eddy Covariance towers—are non-existent within this specialized mountain coffee watershed; thus, the framework is optimized to upscale the validated MODIS ET product at a refined resolution. Table 1 summarizes the structural, climatic, and hydrological parameters characterizing the target watershed.
Table 1.
Environmental, Morphometric, and Agrometeorological Baseline of the Study Site.
This complex physiographic configuration is highly representative of tropical high-altitude coffee cultivation zones in southeastern Brazil, where steep terrain limits automated mechanization and persistent cloud cover hampers standard optical-thermal orbital mapping pipelines.
2.2. Satellite Data Acquisition and Processing
In contrast to approaches relying solely on optical and thermal sensors—such as Landsat 8/9, which face acquisition constraints during periods of persistent cloud cover—this research integrated active microwave data with multispectral sensors:
- Sentinel-1 (SAR): Time-series collection (2015–2025) of backscatter coefficients in VH and VV polarizations, featuring a 10 m native spatial resolution and a 12-day temporal resolution (revisit frequency).
- MODIS (Optical/Thermal): Evapotranspiration (ET—MOD16A2) at 500 m spatial resolution as an 8-day composite, Land Surface Temperature (LST—MOD11A2) at 1000 m spatial resolution as an 8-day composite, and vegetation indices (NDVI and NDWI) at 250 m native spatial resolution delivered at a 16-day temporal interval.
- SMAP: Deep soil moisture data for water balance validation, formatted at a 36 km spatial resolution grid with a 3-day global revisit frequency.
To suppress standard radar speckle noise and stabilize active microwave signals, a temporal median filter (.median()) locked into synchronous 16-day moving compositing windows was implemented for the Sentinel-1 collection, effectively preserving genuine macroscopic canopy structural trends without geometric degradation. Conversely, temporal smoothing and cloud-resilience for the optical and thermal time series (MODIS) were executed via a Savitzky–Golay filtering pipeline utilizing a local polynomial order of 2 and an adaptive moving window, which is essential for noise reduction while preserving the signal’s underlying seasonal trends and phenological sensitivity [13]. This targeted combination reduces data-sparse gaps while preserving surface energy balance behaviors.
2.3. Radar Data Pre-Processing and Refinement (Sentinel-1 GRD)
SAR data pre-processing followed a rigorous workflow to ensure the geometric and radiometric fidelity of observations, which is essential for modeling energy fluxes in complex terrains [14]. Unlike optical sensors that require specific atmospheric corrections, the Ground Range Detected (GRD) data were processed through a standardized pipeline within the Google Earth Engine (GEE) cloud platform [15], structured in strict accordance with the reference methodology proposed by Filipponi [16]. This workflow comprised five sequential stages: (1) application of orbit files for precise satellite state vector updates to ensure positional accuracy; (2) thermal noise removal to eliminate low-signal artifacts and normalize backscatter across sub-swaths; (3) radiometric calibration to convert raw digital intensity values into sigma naught (σ0) backscatter coefficients [1,2]; (4) Range-Doppler terrain correction using the 30 m SRTM digital elevation model to mitigate geometric relief distortions, such as layover and foreshortening effects induced by the study area’s rugged topography; and (5) speckle filtering and temporal smoothing achieved via a temporal median filter (.median()) locked into synchronous 16-day moving compositing windows. This temporal median infrastructure suppressed random radar speckle noise and stabilized polarimetric scattering mechanisms, preserving genuine macroscopic canopy trends while reinforcing its empirical relationship with ETa.
Moving beyond purely reflectance-based methods, this workflow extracted structural disorder metrics that serve as dynamic canopy proxies, specifically SE and DoP. To ensure stable multisensor integration with soil water data and thermal variables of lower orbital resolution—such as LST derived from traditional optical sensors [17]—multi-scale spatial harmonization was managed using a standardized spatial-zonal mean reducer (ee.Reducer.mean()) linked to a high-resolution land-use mask from MapBiomas Collection 9.0 (Class 46, Perennial Crop—Coffee). To strictly mitigate mixed-pixel contamination along fragmented mountain border zones, a boundary-exclusion buffer routing was implemented, masking out transitional pixels and leaving a total of 12,415 high-confidence coffee pixels for localized zonal aggregation. The datasets were spatially aggregated at each sensor’s native grid size before being synchronized into the target database at a 100 m target grid size. This procedure provided superior spatial refinement compared to global evapotranspiration products while preserving biophysical coherence and eliminating statistical noise or edge anomalies resulting from land-use fragmentation and high landscape heterogeneity. While a pixel-by-pixel uncertainty propagation model across scales was not implemented, temporal prediction uncertainty was explicitly quantified and visualized via the ± RMSE boundaries in the time-series validation.
2.4. Polarimetric and Biophysical Metrics
The theoretical framework for monitoring crop water metabolism is based on the surface energy balance equation, mathematically represented by Equation (1) [18,19]:
where
RN = net radiation flux at the surface;
G = soil heat flux;
H = sensible heat flux;
λET = latent heat flux of evapotranspiration.
Given that traditional micrometeorological methods and thermal models face significant operational constraints—primarily due to atmospheric interference when estimating turbulent fluxes—this framework introduces active microwave sensors as stable structural proxies for indirect ETa modeling. To this end, the DoP and intensity-based SE were derived from SAR time series, establishing a direct link between the canopy’s geometric response and its water status. SE was computed on a linear power scale according to Equation (2), serving as a logarithmic indicator of the disorder and structural complexity of the signal backscattered by the canopy.
where:
SE: Scattering Estimate;
ln: Natural logarithm;
VH(lin): Backscatter coefficient in cross-polarization (Vertical–Horizontal), converted to linear scale;
VV(lin): Backscatter coefficient in co-polarization (Vertical–Vertical), converted to linear scale.
This dual-polarization approach captures transitions in plant architecture triggered by variations in canopy water content and dielectric properties, enabling the early detection of water stress compared to conventional optical spectral indices. Furthermore, the DoP was integrated into the model to assess the purity and organization of the reflected electromagnetic wave. In this capacity, the DoP serves as a physical discriminator, distinguishing predominantly volumetric scattering—originating from the dense vegetative canopy—from surface scattering contributions arising from exposed soil or defoliated branches. The fusion of these polarimetric metrics with energy demand drivers and moisture availability allows for mapping ETa dynamics within a framework of physical consistency and interpretable causality.
2.5. Statistical Analysis and Predictive Modeling
The dynamic association between canopy structural complexity—estimated via polarimetric radar metrics—and crop water metabolism was initially assessed through cross-correlation analysis. Time-lags were configured within a 0 to 16-day window based on regional agro-meteorological thresholds to identify the physical precursivity of signals and ecosystem memory effects [10]. In tropical perennial systems such as mountain coffee, this period matches the physiological timeframe required for continuous soil water depletion within the effective root zone to manifest visually as macro-structural changes in canopy geometry, while operationalizing a standardized temporal synchronization with the composite optical time-series products. For the spatially explicit prediction of ETa, three predictive algorithms with distinct logical structures were tested and compared, aiming to balance statistical generalization with physical model interpretability [11,20]:
- Multiple Linear Regression (MLR): A parametric algorithm implemented to model direct functional relationships between physical and hydraulic system drivers, providing full causal traceability of the coefficients.
- Random Forest (RF): A non-linear ensemble-based architecture, configured with 100 decision trees to capture potential synergies and complex interactions among predictors.
- Support Vector Regression (SVR): A support-vector-based model operating with a Radial Basis Function (RBF) kernel to project biophysical data into a higher-dimensional space for enhanced separability.
To mitigate disparities in the original magnitudes of the variables (e.g., LST in degrees Celsius versus backscatter in decibels), all predictors underwent standardization using the StandardScaler method. This procedure centered the distributions at zero mean with unit variance, converting the resulting linear model coefficients into standardized weights. This approach allowed for direct comparison and the establishment of an influence hierarchy for each variable on evaporative dynamics. Model validation and stability were ensured through K-fold cross-validation (k = 5), utilizing the Coefficient of Determination (R2) and Root Mean Square Error (RMSE) as rigorous metrics for performance and mathematical precision [20].
3. Results and Discussion
3.1. Data Consistency and Availability Analysis
To ensure full methodological transparency and report data completeness across the complex terrain, Table 2 summarizes the nominal temporal resolutions, theoretical observation maximums (Nmax = 251), empirical missingness rates (ω), and operational processing constraints across the monitoring timeline. While structural metrics derived from active radar (VH, SE, and DoP) and biophysical variables estimated via reflectance and passive microwaves—such as the Normalized Difference Vegetation Index (NDVI) and soil moisture respectively—exhibited high sampling regularity throughout the decade, actual ETa data from the MODIS orbital product showed severe gaps and systematic omissions between 2015 and 2020. This critical sampling restriction in passive sensors is a recurrent methodological bottleneck in the literature, stemming from persistent cloud cover in tropical regions as well as intrinsic algorithmic limitations of energy balance models, which frequently discard pixels in rugged terrains or fragmented landscapes through stringent quality control filters [15,21]. Conversely, the resilience observed in the Sentinel-1 historical series underscores the viability of the processing pipeline in circumventing these atmospheric constraints, enabling the robust consolidation of the 2021–2025 interval with fully synchronous and consistent data for the training, tuning, and final validation of the proposed multisensor models [16].
Table 2.
Multi-Sensor Spatio-Temporal Data Coverage and Missingness Matrix (2015–2025).
3.2. Exploratory Analysis: Correlation Between Radar and Biophysical Variables
Exploratory analysis of the historical data demonstrated the statistical superiority and enhanced biophysical sensitivity of advanced polarimetric metrics compared to raw backscatter coefficients (VH) for monitoring crop phytophysiognomic dynamics. To demonstrate the feature selection rationale, Table 3 presents the expanded Pearson cross-correlation matrix (r) evaluating all candidate active microwave metrics alongside the optical, thermal, and surface reference datasets (n = 111).
Table 3.
Correlation Matrix Between Top Radar Metrics and Biophysical Reference Variables (n = 111).
Specifically, the ETa rate exhibited a strong positive linear correlation with smoothed entropy (r = 0.723), evidencing a direct mechanical coupling between structural canopy turgor and latent water vapor fluxes. This behavior aligns coherently with the water sensitivity also observed in relation to soil moisture (r = 0.562). Furthermore, the DoP demonstrated a highly synchronous alignment with variables estimated by optical sensors, correlating positively with the leaf water index (NDWI, r = 0.617) and vegetative vigor expressed by the NDVI (r = 0.573). This pattern corroborates how the geometric reorganization of leaves and branches responds integratively to fluctuations in biomass and integrated vegetation water content—dynamics that traditional optical indices attempt to track but with inherent temporal limitations [3].
Finally, the inverse correlation observed between DoP and LST (r = −0.442) aligns with the expected biophysical behavior of the canopy. This empirical association suggests that increasing thermal stress and evaporative demand coincide with a depolarization of the reflected signal, serving as an early proxy for macro-structural canopy variations prior to the onset of severe pigmentary damage [9].
3.3. Synchrony and Lag Analysis
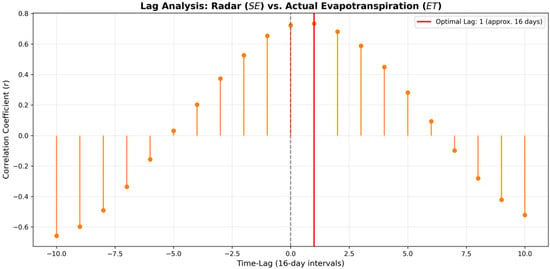
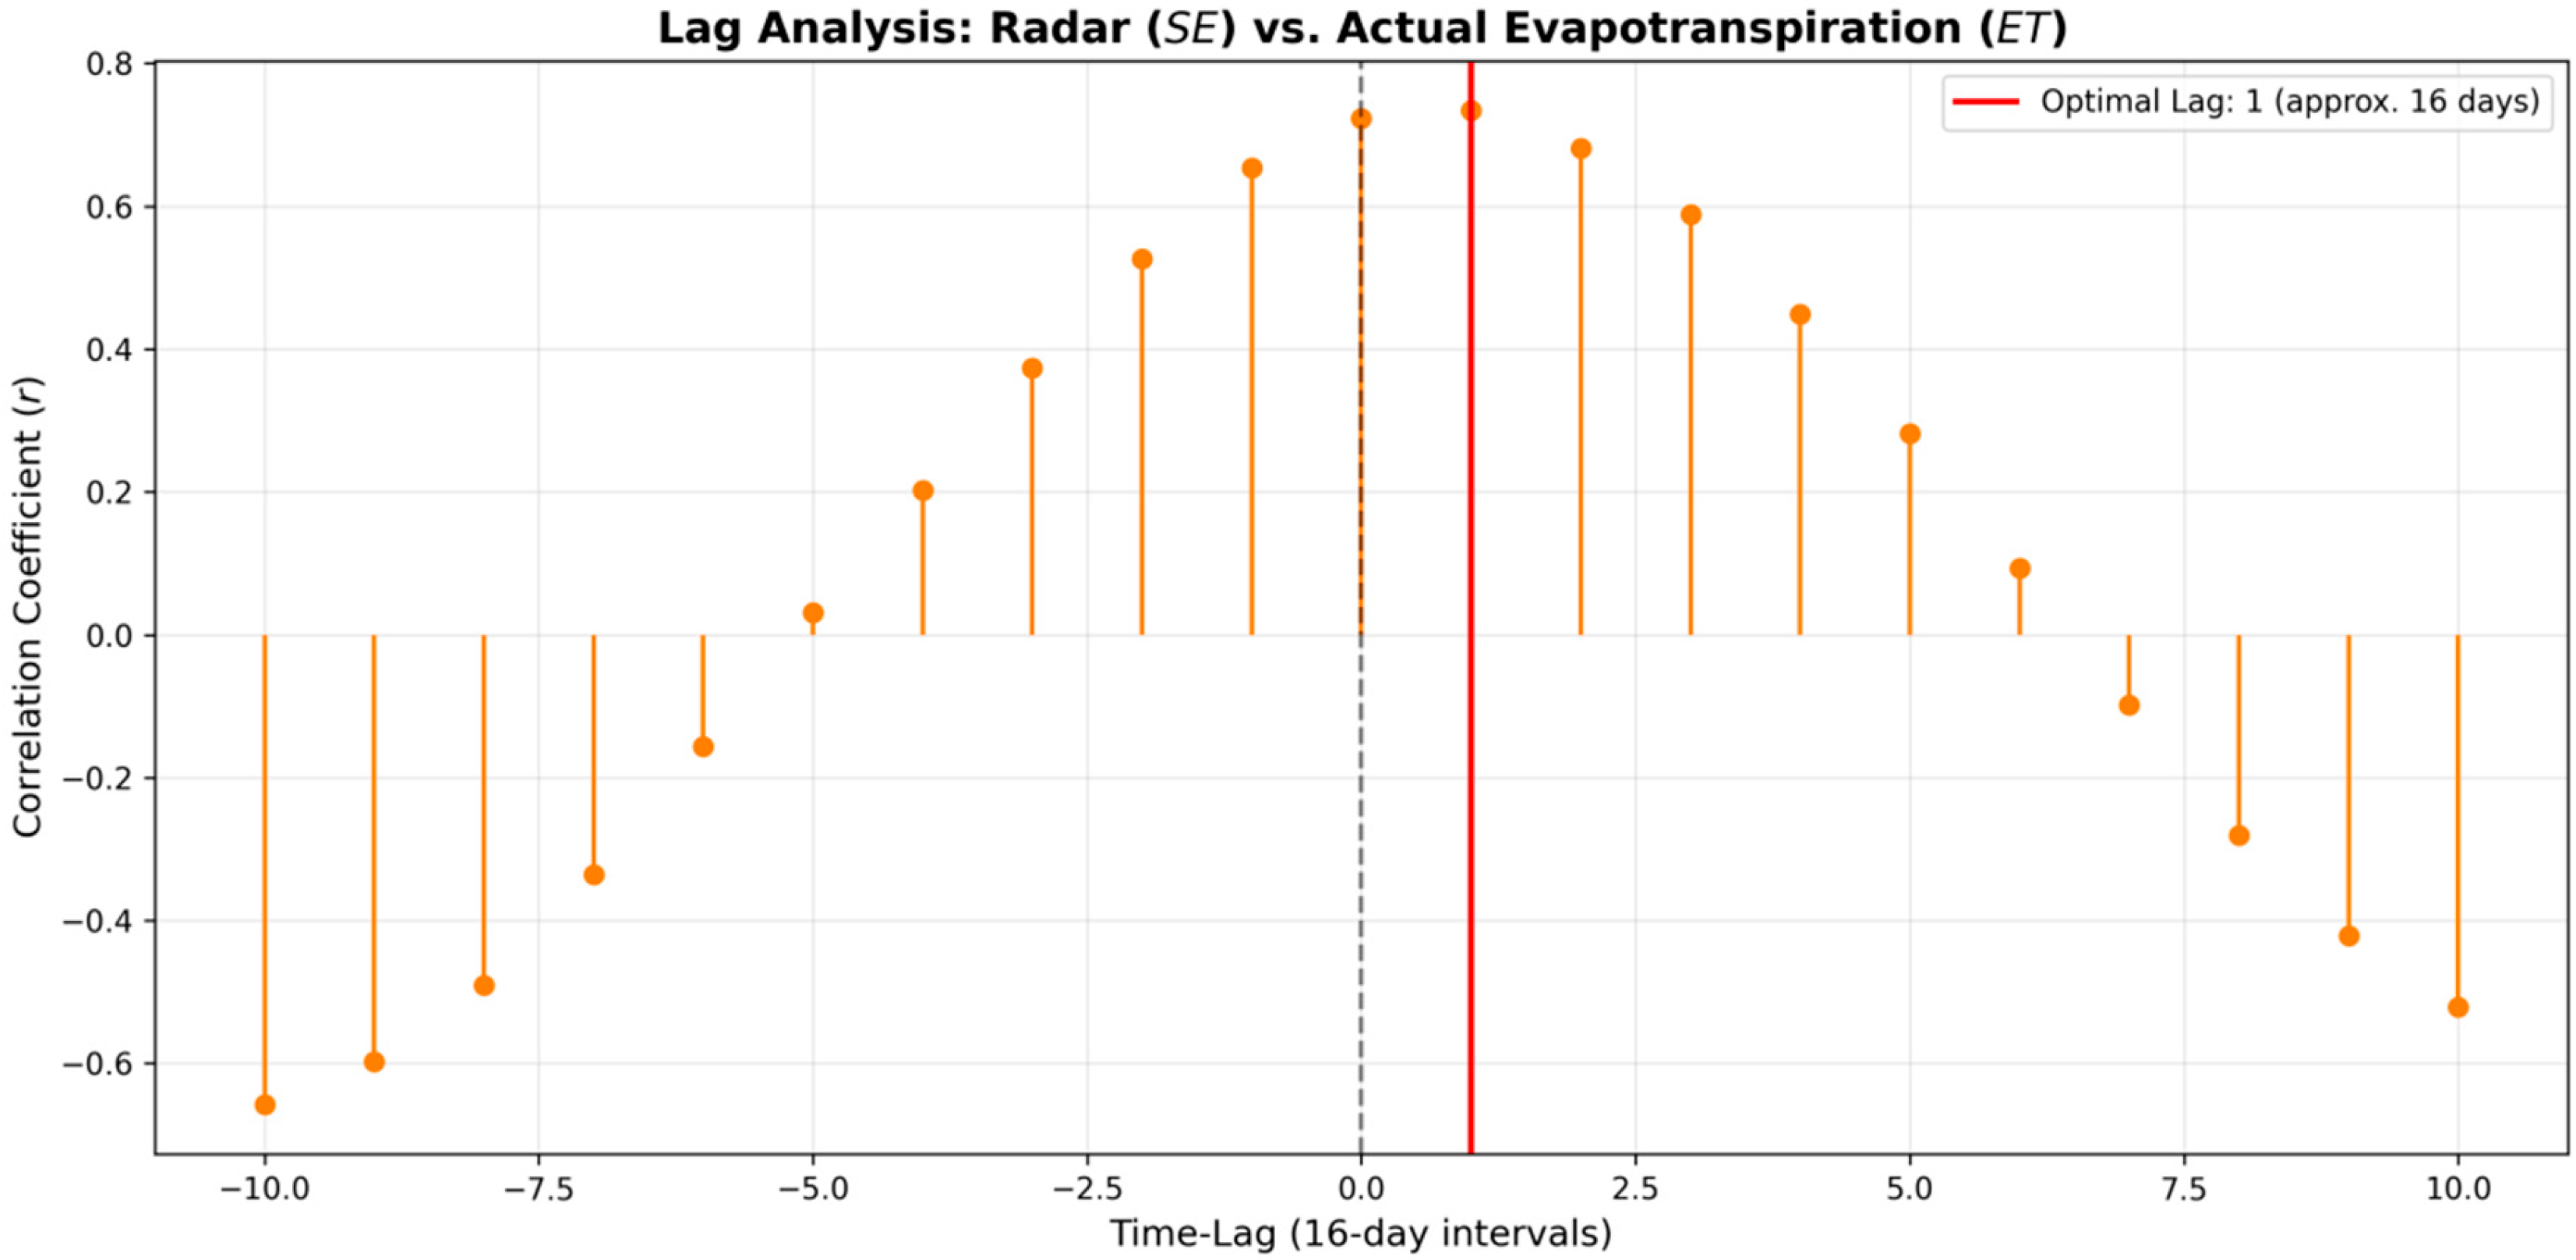
Temporal synchrony analysis, based on the application of the Cross-Correlation Function (CCF) between SE and ETa, revealed a plateau of high statistical significance, evidencing the dynamic coupling between water status and the canopy’s mechanical response. The correlation coefficient reached r = 0.723 at Lag 0, characterizing a simultaneous response within the sampling scale, and exhibited its absolute maximum peak of r = 0.734 at Lag 1, corresponding to a 16-day hydrological lag (Figure 2).
Figure 2.
Cross-correlation analysis (Lag Analysis) between active microwave structural metrics (Shannon Entropy—SE) and Actual Evapotranspiration (ET). The vertical dashed grey line denotes a synchronous response (Lag 0). The solid red line identifies the optimal maximum correlation coefficient (r = 0.734) at a positive lag of 1 (approx. 16 days), mathematically demonstrating that changes in canopy geometric structure and turgor captured by the radar precede the metabolic responses observed via thermal/optical evapotranspiration.
The analysis suggests mathematically that changes in soil water availability and surface temperature temporally precede detectable shifts in macro-structural canopy geometry as captured by active microwave metrics. The observed dynamics suggest that structural plant deformation accompanies stomatal closure and the subsequent reduction in latent flux within the 16-day observation window, manifesting a slight persistence of mechanical wilting that is ultimately captured cumulatively in the subsequent orbital cycle. This short-term lag reflects the ecophysiological mechanisms of internal crop regulation in response to stress, aligning with the concepts of ecosystem memory and biophysical inertia extensively documented in biosphere-atmosphere interaction modeling [10,22].
Additionally, the abrupt drop and immediate decay of correlation coefficients observed across negative lag intervals mathematically confirm the precedence of water metabolism over geometric vegetation changes. This causal direction demonstrates that the depletion of canopy water storage and resulting shifts in volume scattering act as the primary physical drivers forcing the spatial reorganization of branches and leaves, validating the use of radar entropy as a responsive structural sensor and a direct mechanical validator of acute water stress.
3.4. Predictive Model Comparison and Selection
The development of the predictive modeling began with a baseline simple linear regression based solely on radar signal sensitivity (Radar → ET), which yielded an initial coefficient of determination (R2) of 0.52. To more robustly capture latent energy fluxes, we subsequently evaluated multivariate formulations, integrating thermal and hydraulic variables with the satellite-derived structural signature. Statistical comparison across algorithms via K-fold cross-validation (k = 5) identified Multiple Linear Regression (MLR) as the most accurate and stable model within this localized dataset scope, outperforming all other tested algorithmic configurations, as summarized in Table 4.
Table 4.
Predictive Performance Comparison and Residual Significance Testing (n = 111).
While the multivariate linear model achieved a superior performance of R2 = 0.872 (RMSE = 2.916 mm/8-day), architectures based on Support Vector Regression (SVR) with an RBF kernel and Random Forest (RF) yielded slightly lower results, recording determination coefficients of R2 = 0.836 (RMSE = 3.152 mm/8-day) and R2 = 0.815 (RMSE = 3.223 mm/8-day), respectively, with residual distribution analysis confirming statistically significant performance groupings across all three architectures.
The statistical superiority of the multivariate linear model over the non-linear decision-tree approach (Random Forest) represents a pivotal finding of this research. It suggests that, under the specific conditions of mountain coffee cultivation in the study area, the physical relationships between LST, soil moisture, and geometric canopy structure are predominantly linear, consistent, and predictable through first-order functions. This behavior reinforces the imperative to prioritize parsimony and intrinsic interpretability when modeling complex ecological systems. Furthermore, it demonstrates that unnecessary increases in algorithmic complexity through “black-box” approaches can induce overfitting and the loss of physical traceability, without necessarily yielding gains in predictive accuracy for datasets of moderate sampling dimensions [11,20].
The framework achieved an absolute predictive error of RMSE = 2.916 mm/8-day, which aligns closely with the 3% to 5% relative error margins commonly reported in international literature for classic micrometeorological surface energy balance models, such as the Surface Energy Balance System (SEBS) and the METRIC algorithm [18,23]. When normalized against the local historical mean evapotranspiration (mean ETa = 24.5 mm/8-day), this translates to a Relative RMSE (RRMSE) of approximately 11.9%. This performance is highly consistent with, and in several cases outperforms, regional empirical downscaling models applied to complex tropical terrains, which typically report RRMSE values ranging between 12% and 22% when benchmarked against satellite target arrays. This confirms that the integration of L-band soil moisture and C-band polarimetric scattering provides substantial geometric constraint to stable linear estimators without requiring the heavy parameterization of full aerodynamic energy balance structures. This convergence of errors methodologically validates the proposed multisensor framework, proving that modeling grounded in synthetic radar data enables metabolic estimates with a precision equivalent to the global gold standard of traditional thermal approaches, while offering the conceptual advantages of temporal continuity and low degree of influence by cloud cover constraints.
3.5. Variable Importance and Model Weights
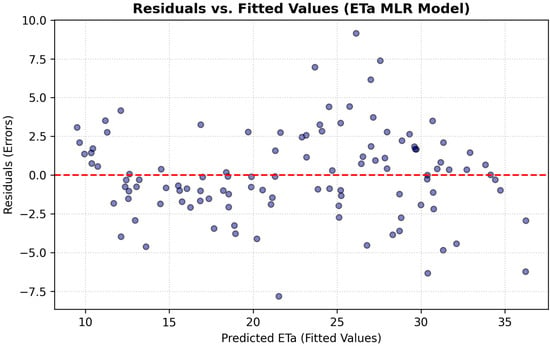
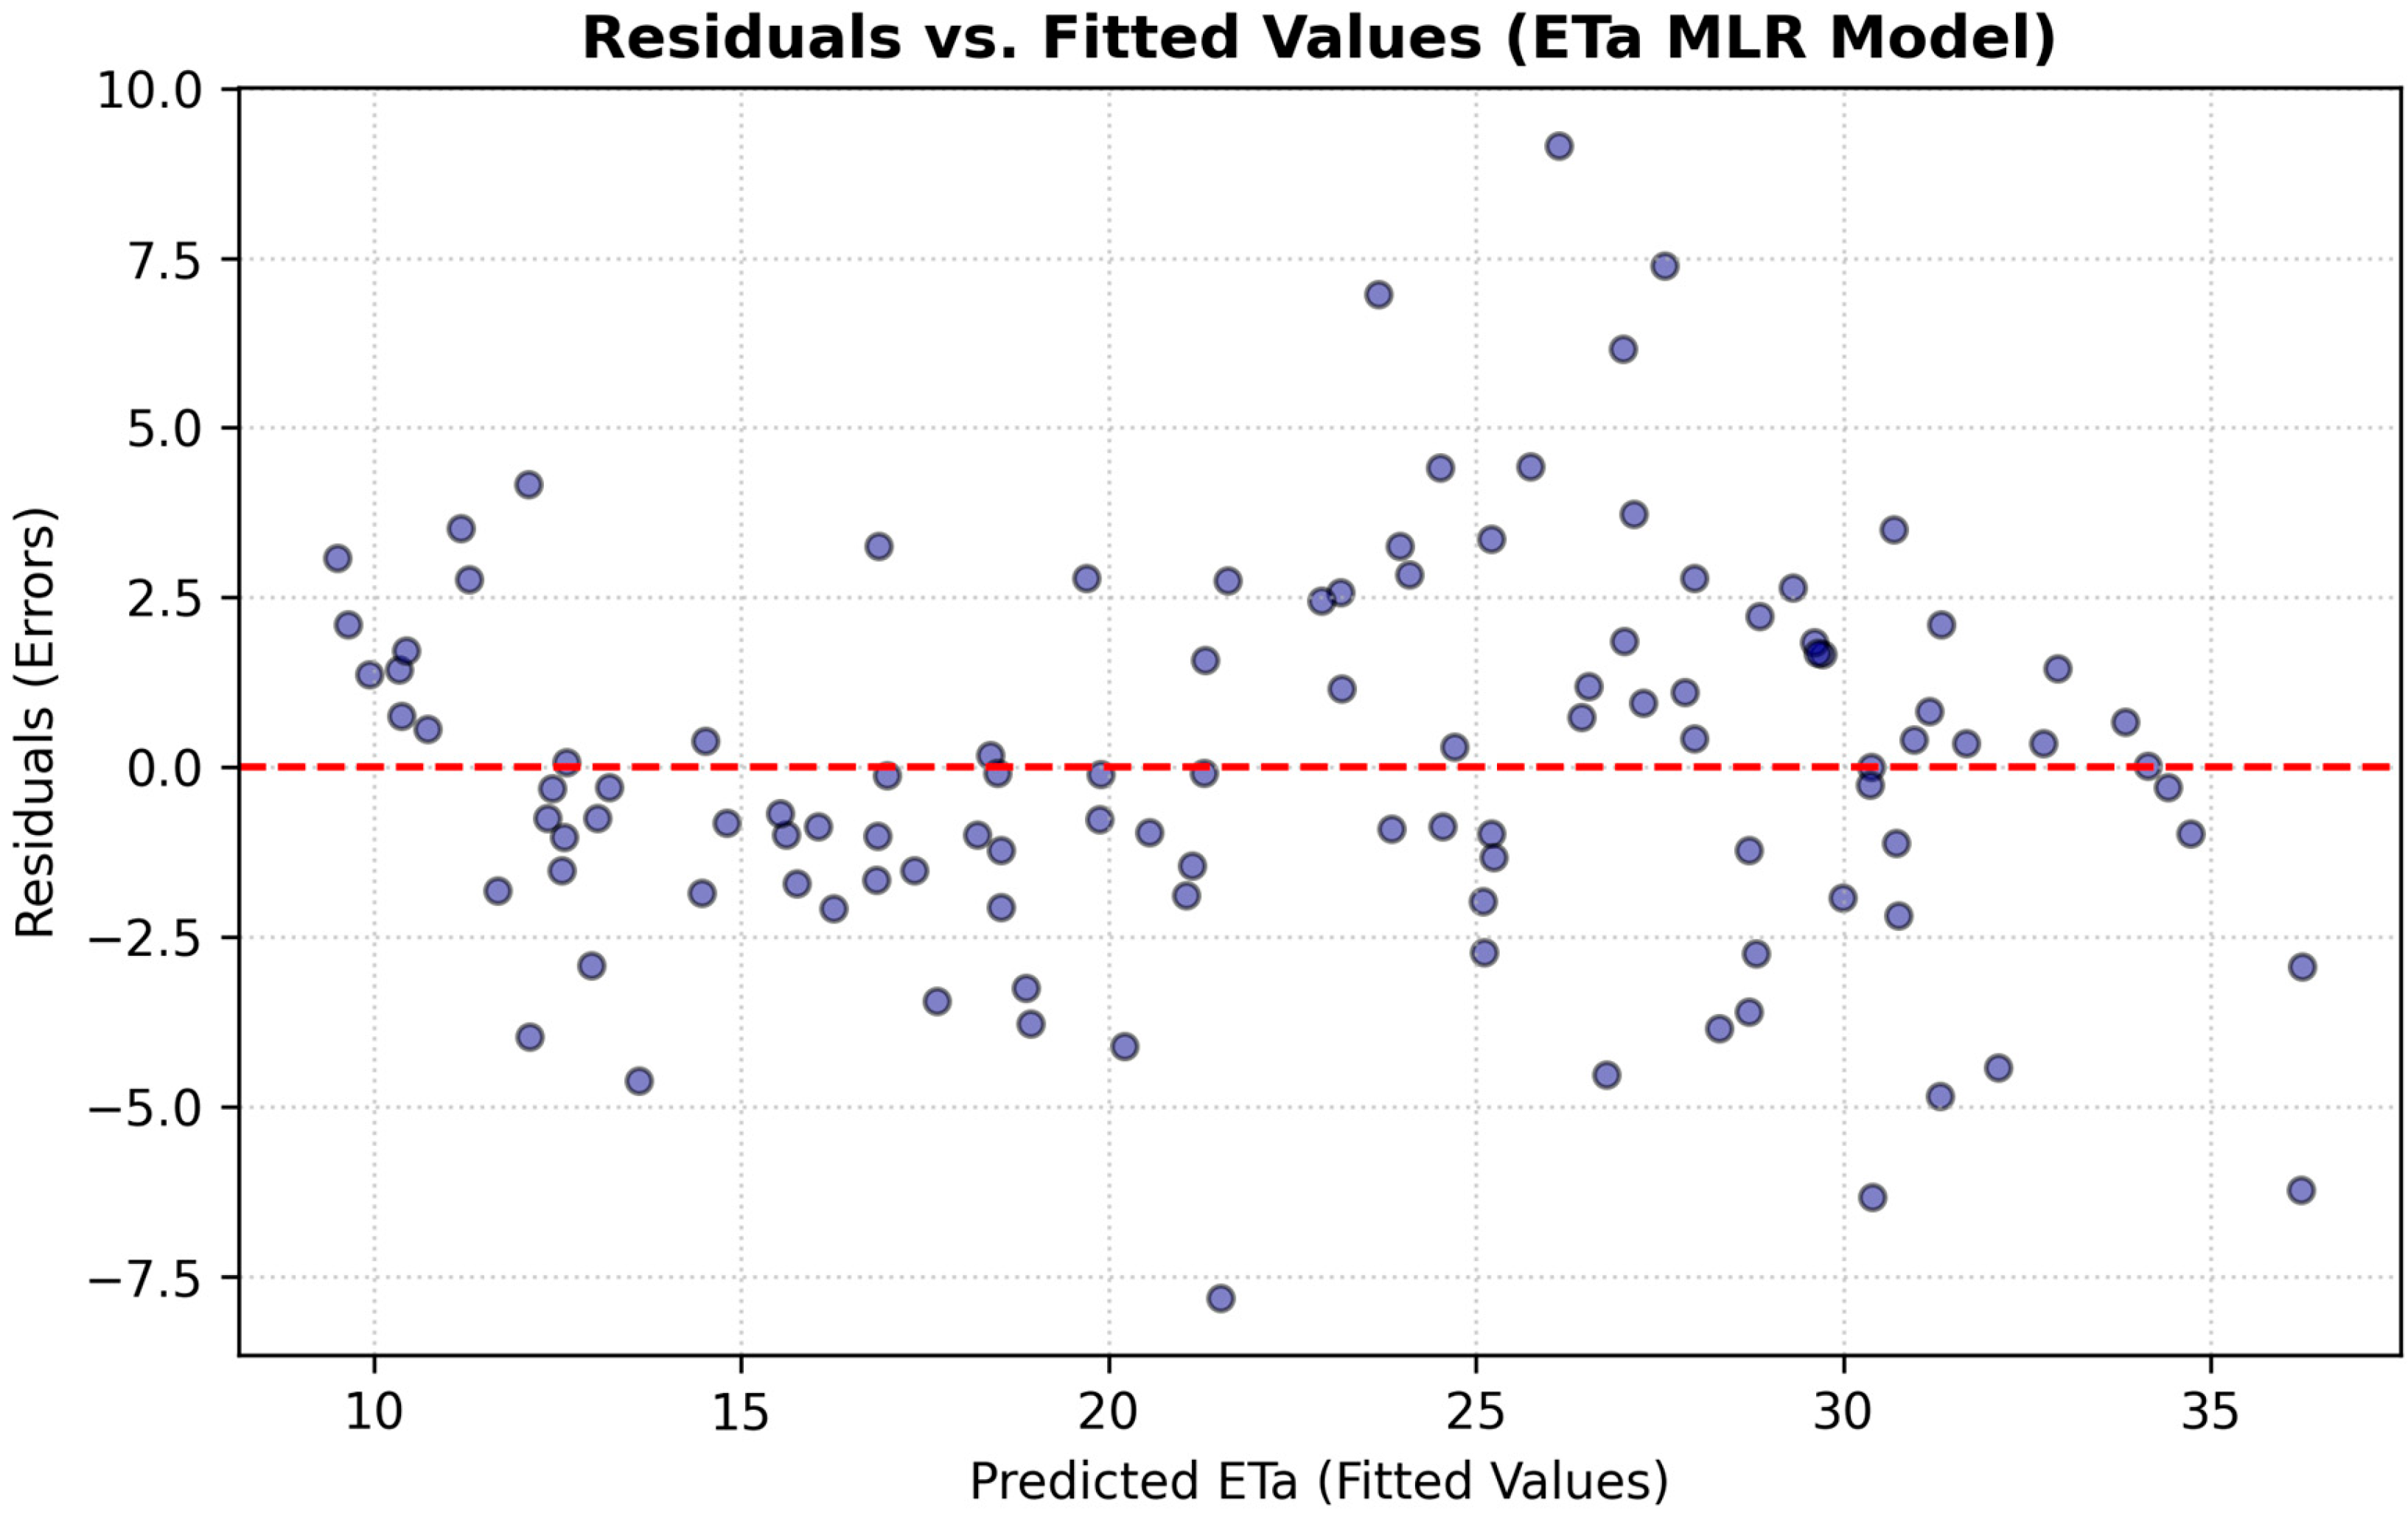
A detailed analysis of the resulting standardized coefficients from the Multiple Linear Regression (MLR) model enabled the isolation and quantitative establishment of the hierarchy of influence regarding the biophysical and environmental variables governing crop water metabolism. To validate the linear model’s rigor, a residual analysis was performed (Figure 3), which confirms the homoscedasticity and the absence of non-linear bias in the error distribution. A central finding of the model is that all selected predictors exhibited strictly positive statistical weights, providing mathematical evidence of a direct functional relationship wherein the individual increase in each component acts synergistically to drive ecosystem ETa rates.
Figure 3.
Residuals vs. Fitted Values plot for the Multiple Linear Regression (MLR) model of actual evapotranspiration (ETa). The red dashed line indicates the reference baseline of zero residual error (perfect prediction).
Table 5 presents the expanded parametric summary, explicitly reporting unstandardized coefficients (B), standard errors, standardized weights (β), t-statistics, significance levels (p-values), 95% confidence intervals, and Variance Inflation Factors (VIF) (n = 111).
Table 5.
Comprehensive MLR Model Regression Weights and Collinearity Metrics.
The random distribution of residuals around the horizontal zero-line indicates homoscedasticity, confirming that the model’s error variance is constant across the entire range of predicted ETa values. The absence of non-linear patterns (such as a “U” shape) or funnel-shaped distributions validates the suitability of the parsimonious linear architecture and confirms that the model provides non-biased estimates for mountain coffee systems.
Soil moisture emerged as the preeminent regulatory driver of the system, recording the highest unstandardized coefficient (103.04) and highly robust statistical significance (t = 9.201). This dominant weight corroborates that the actual water availability within the soil profile functions as the primary biophysical constraint, exerting mandatory control over vegetation stomatal conductance. This aligns with the premise that subsurface water deficits impose direct physiological impacts on plant transpiration, irrespective of atmospheric demand behavior [3].
Following this biophysical hierarchy, smoothed LST (LST_smooth) exhibited a highly significant unstandardized coefficient of 0.9413 (t = 9.340). From a process-physics perspective, the statistical robustness of this predictor quantifies the direct contribution of radiative energy supply and microclimatic evaporative demand, both of which govern turbulent sensible and latent heat fluxes at the soil-vegetation-atmosphere interface [18,19].
The primary differentiator of this interpretable framework, however, lies in the significant combined contribution of advanced polarimetric metrics derived from active microwaves, which provided the model’s geometric refinement. Smoothed DoP (DoP_smooth) recorded an unstandardized coefficient of 105.56 (t = 7.236), serving as a highly responsive discriminator of electromagnetic signal purity and the three-dimensional organizational level of the leaf canopy. Meanwhile, smoothed SE (SE_smooth) complemented the structural dynamics with a coefficient of 8.053 (t = 3.110), accurately mapping fluctuations in plant architectural complexity signals derived from changes in canopy geometric heterogeneity.
The significant magnitude and statistical significance of these radar coefficients demonstrate that mechanical deformations of the crop’s canopy provide consistent physical precursors of acute water stress. This enables continuous, spatially explicit, all-weather evapotranspiration tracking [9,16].
3.6. Spatial Validation and Synthetic Mapping
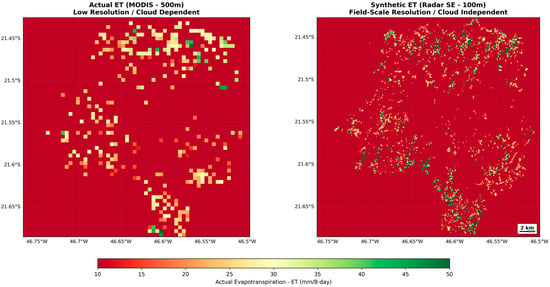
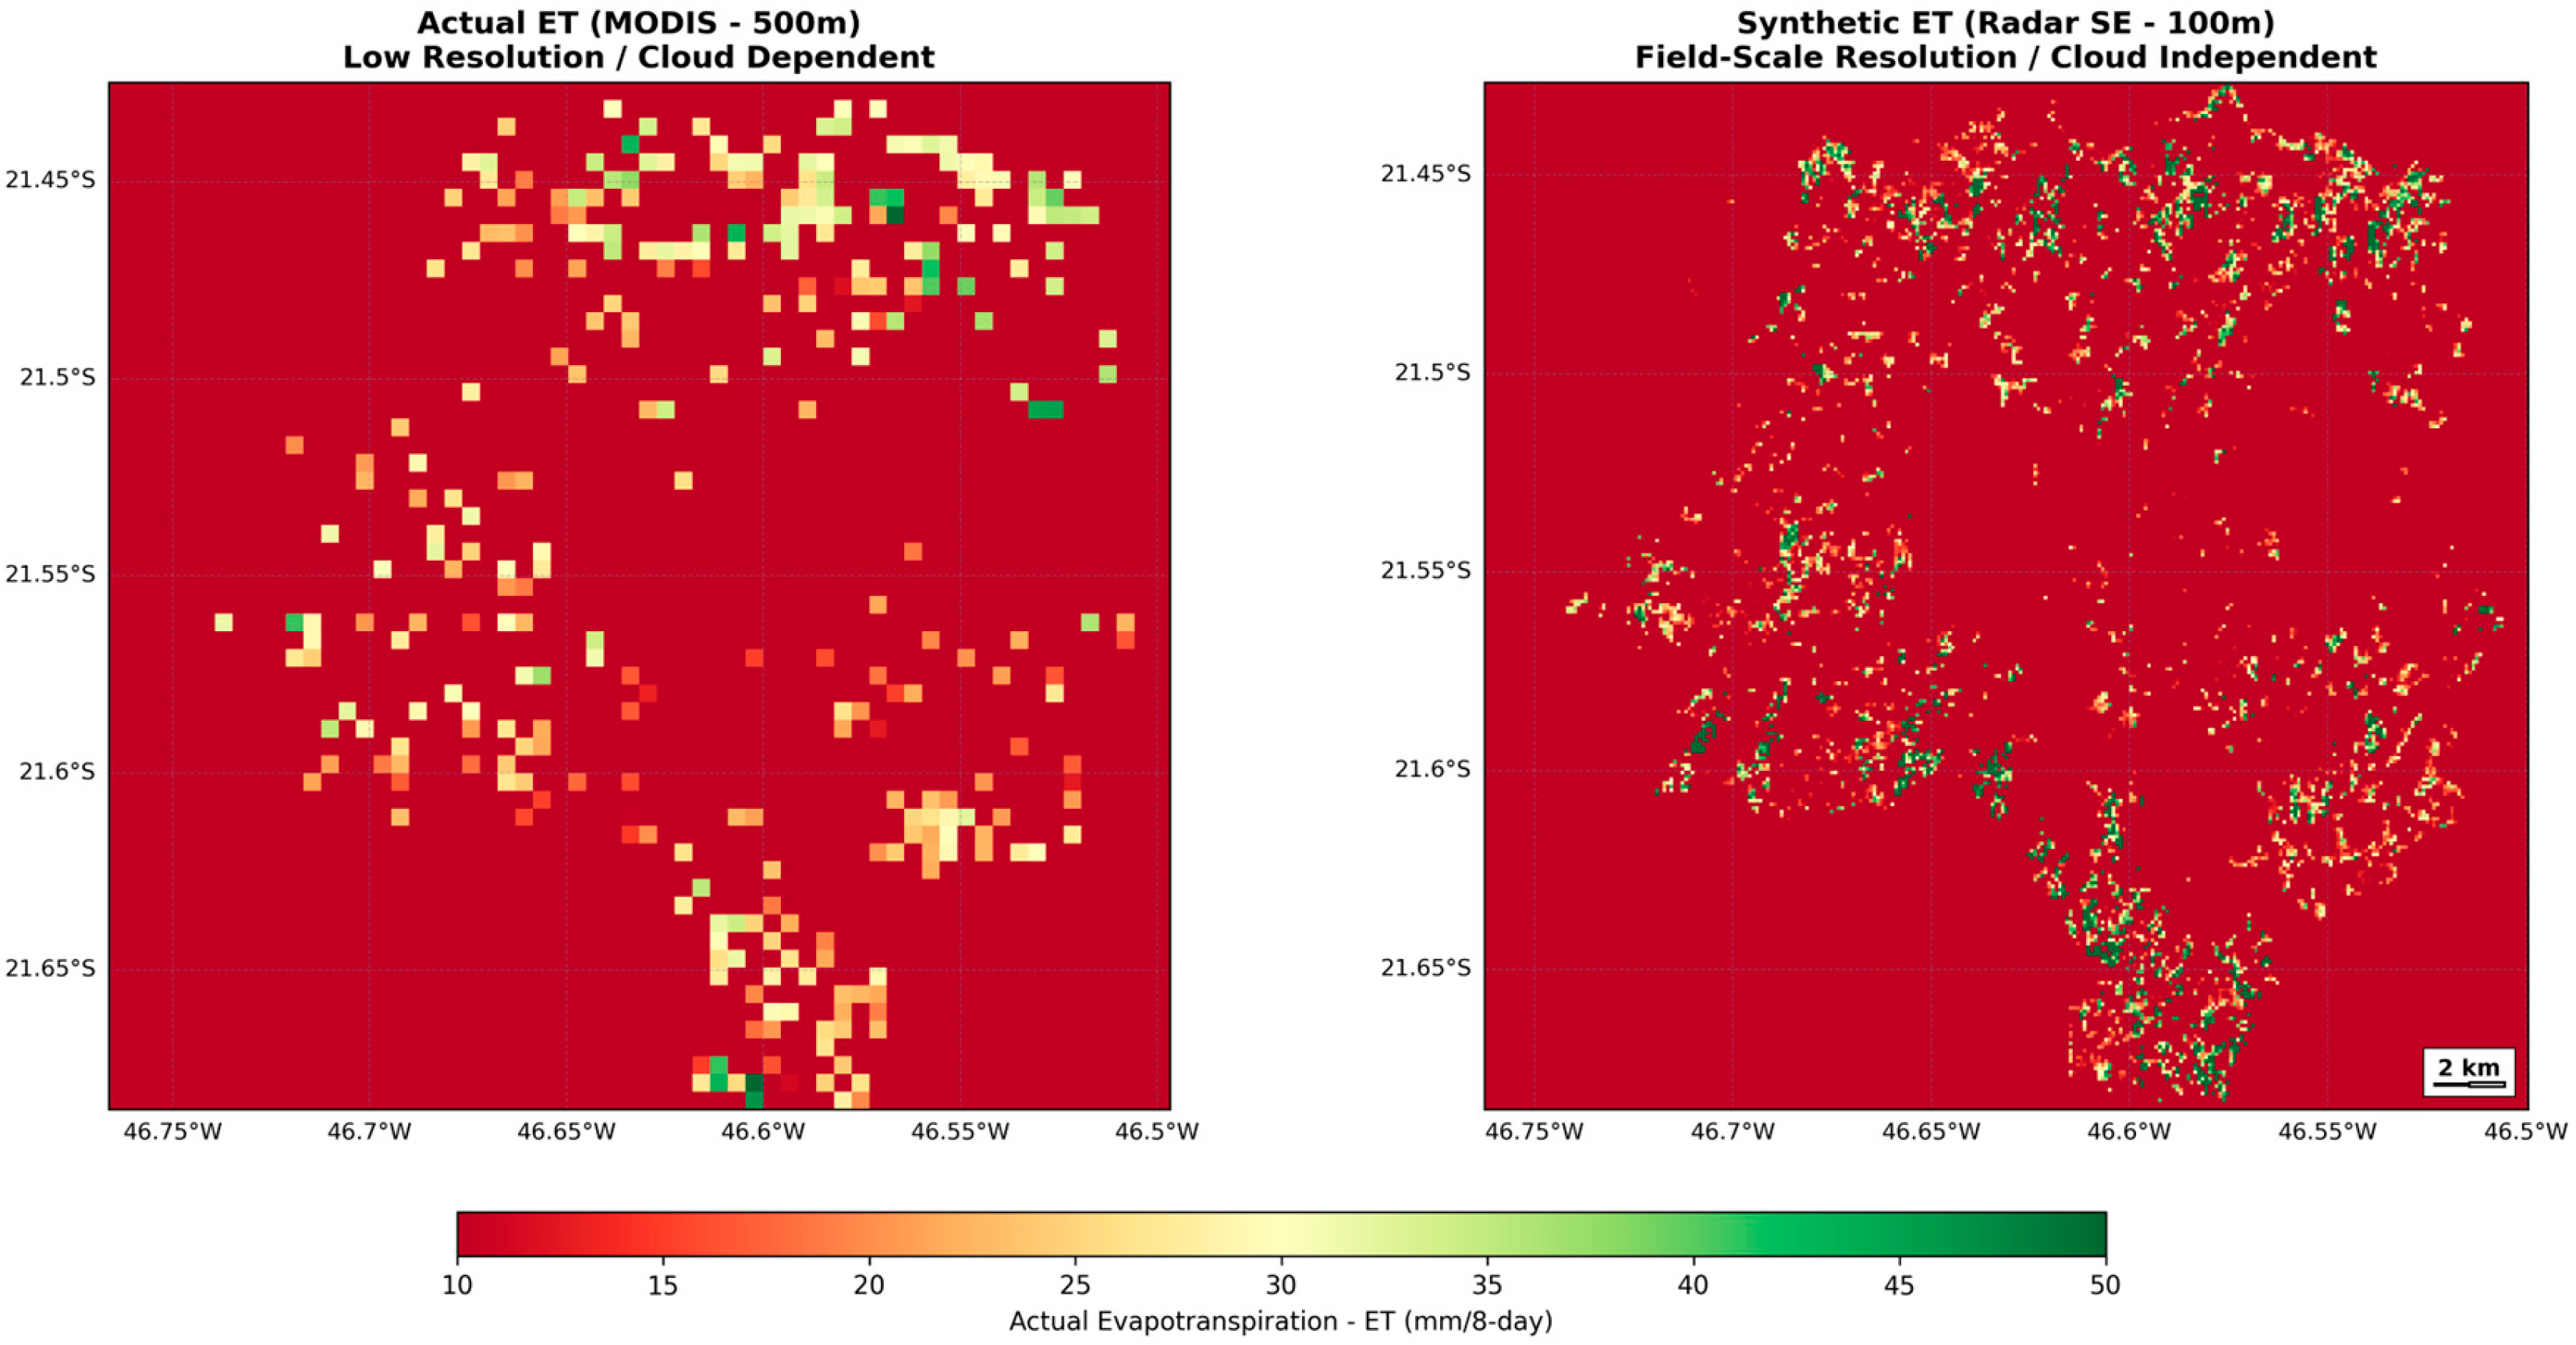
The spatially explicit implementation of the multisensor predictive model enabled the generation of continuous ETa maps at a fine spatial resolution of 100 m, representing a significant advancement in microscale water balance detailing. Compared to the global MODIS evapotranspiration product, which is restricted to a native spatial resolution of 500 m, the synthetic model structured through radar data fusion preserved the spatial heterogeneity of perennial crop plots with high fidelity (Figure 4). This approach proved capable of accurately capturing microclimatic gradients and water stress variations across slopes and valleys in rugged topographical terrains.
Figure 4.
Comparison of actual and synthetic evapotranspiration (ETa) mapping performance. The integration of active microwave data preserves the spatial heterogeneity of mountain coffee plots and captures microscale water balance variations.
Estimated ETa values ranged from 0.8 to 6.5 mm/day, exhibiting a statistical distribution and an ecophysiological amplitude fully consistent with the thermal seasonality and vegetative dynamics observed in classical surface energy balance micrometeorological modeling. These results are extensively validated by international literature in studies conducted both in complex relief areas and water-limited regions within arid and semi-arid climates [1,2].
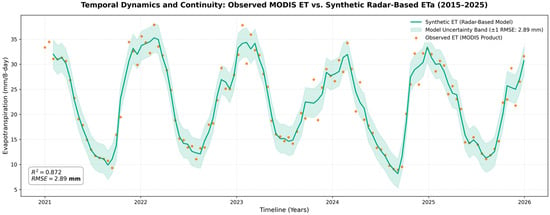
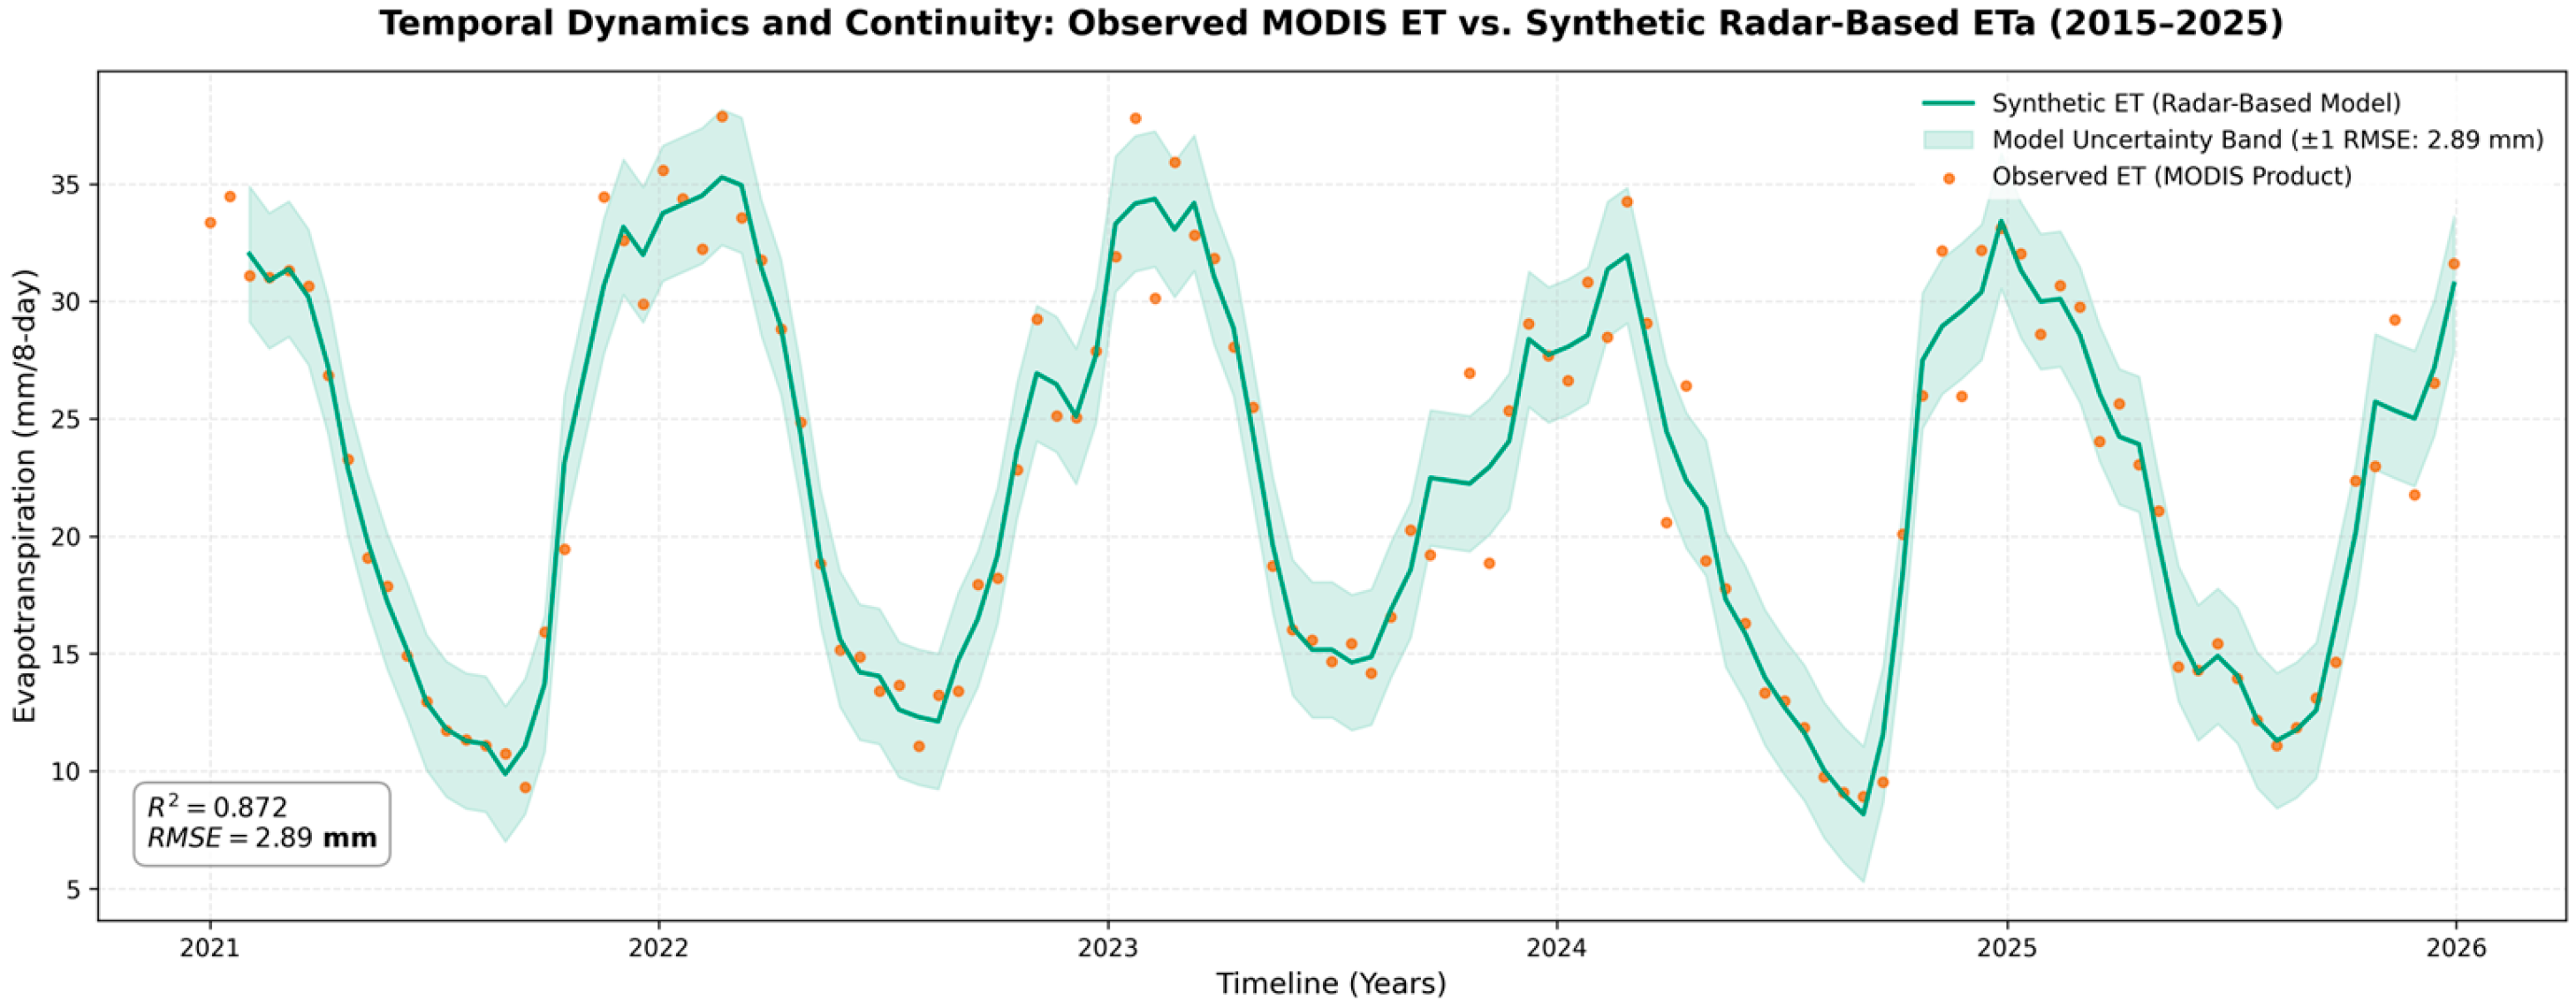
Finally, the visual validation of the cartographic time series (Figure 5) unambiguously confirmed that the active microwave-based model ensured the integrity and temporal continuity of geospatial information, even on dates characterized by heavy and persistent cloud cover. In these critical sampling scenarios, conventional passive optical and thermal sensor data were completely obscured by atmospheric impediments, underscoring the robustness of the radar pipeline as an independent and auditable tool for continuous agricultural monitoring [15,16].
Figure 5.
Temporal dynamics and validation of the synthetic radar-based actual evapotranspiration (ETa, continuous green line) against the observed MODIS ET product (orange scatter points) across the evaluation timeline. The plot illustrates high seasonal alignment, capturing annual agricultural peaks and water deficit troughs, confirming the model’s capacity to preserve phenological integrity and maintain data continuity.
3.7. Limitations and Future Research
Notwithstanding the promising results showed the potential of integrating Sentinel-1, MODIS, and soil moisture data to improve evapotranspiration mapping in mountainous coffee-growing areas, some limitations should be considered. Terrain variability may affect the quality of the estimates, while the spatial resolution of MODIS products and the limited availability of field validation data may influence the accuracy of the results. Future studies should evaluate the proposed approach in other coffee-producing regions and under different management conditions. The inclusion of higher spatial and temporal resolution data, such as PlanetScope and Sentinel-2, may further improve the results.
4. Conclusions
This study successfully demonstrated the feasibility and high precision of a cloud-integrated multisensor computational framework for estimating actual evapotranspiration (ETa) in mountainous perennial agricultural systems, achieving a refined spatial resolution of 100 m. Cross-validation confirmed the statistical superiority and parsimony of Multiple Linear Regression (MLR) over non-linear machine learning algorithms, reaching a coefficient of determination (R2) of 0.872 and a Root Mean Square Error (RMSE) of 2.916 mm per 8-day period. These results indicate a robust linear empirical association between the selected multi-sensor predictors and actual evapotranspiration under fragmented mountainous conditions, where model parsimony provided high physical interpretability.
The decomposition of the standardized coefficients revealed a clear functional hierarchy, in which soil moisture exhibited the highest standardized regression coefficient (α = 103.04), marking it as the dominant environmental driver of ETa variability. Cross-correlation analysis revealed a 16-day lag, mathematically indicating that changes in soil water availability and surface temperature temporally precede detectable shifts in macro-structural canopy geometry as captured by active microwave metrics. The primary conceptual differentiator of this research was the incorporation of polarimetric metrics from the Sentinel-1 satellite, where the Degree of Polarization (2.503) and Shannon Entropy (1.353) acted as essential geometric refiners. The strong synchronous correlation (r = 0.723) and the 16-day lag peak (r = 0.734) prove that canopy macrostructural alterations—canopy water storage depletion and resulting shifts in volume scattering—serve as highly sensitive and early mechanical proxies for acute water stress.
Operationally, the synthetic model based on active microwaves breaks the historical dependence on clear-sky meteorological conditions faced by passive optical sensors, ensuring modeling continuity and temporal integrity even under persistent cloud cover. By refining the spatial resolution relative to global 500 m evapotranspiration products, the framework preserves the topographical heterogeneity of slopes and agricultural plots. Although localized recalibration of the regression coefficients remains strictly mandatory to account for site-specific topographic, soil, and biome constraints, this approach consolidates a high-integrity, auditable, and large-scale replicable tool with direct practical implications for enhancing precision agriculture, watershed planning, and the formulation of soil and water conservation policies in the face of increasing climate volatility.
Author Contributions
Conceptualization, G.K.N., É.L.B., I.B. and A.H.O.; methodology, G.K.N. and A.J.H.G.; software, G.K.N. and A.J.H.G.; formal analysis, G.K.N.; investigation, G.K.N. and A.H.O.; data curation, G.K.N.; writing—original draft preparation, G.K.N.; writing—review and editing, G.K.N., É.L.B., I.B., A.J.H.G. and A.H.O.; visualization, G.K.N.; supervision, É.L.B. and I.B.; project administration, É.L.B.; funding acquisition, G.K.N. and É.L.B. All authors have read and agreed to the published version of the manuscript.
Funding
This study was supported by the São Paulo Research Foundation (FAPESP), Brazil, under grant numbers 2022/09319-9 (Science Center for the Development of Digital Agriculture) and 2024/02768-8 (G.K.N.), and the National Council for Scientific and Technological Development (CNPq)/Research Productivity Fellowship (E.L.B.).
Institutional Review Board Statement
Not applicable.
Informed Consent Statement
Not applicable.
Data Availability Statement
The computational scripts, GEE data extraction workflows, and predictive models developed in this study are openly available in the GitHub repository at https://github.com/gusklinke-sudo/ETa_Gus_00, accessed on 12 April 2026.
Conflicts of Interest
The authors declare no conflict of interest.
References
- Hosseinimarandi, H.; Pakparvar, M.; Khairkhah Zarkesh, M. Evaluation of the SEBAL for Estimating Actual Evapotranspiration in the Area of the Gareh Bygone Plain Floodwater Spreading Project. Water Soil Manag. Model. 2025, 5, 261–276. [Google Scholar]
- Rostamizad, G.H.; Pakparvar, M.; Abdinejhad, P.; Abdollahi, Z.; Khalafi, J. Estimating the amount of evapotranspiration in the area affected by flood spreading using METRIC algorithm. Watershed Eng. Manag. 2024, 16, 154–169. [Google Scholar]
- Stocker, B.D.; Zscheischler, J.; Keenan, T.F.; Prentice, I.C.; Seneviratne, S.I.; Peñuelas, J. Drought impacts on terrestrial primary production underestimated by satellite monitoring. Nat. Geosci. 2019, 12, 264–270. [Google Scholar] [CrossRef] [Scilit]
- Reichstein, M.; Camps-Valls, G.; Stevens, B.; Jung, M.; Denzler, J.; Carvalhais, N.; Prabhat. Deep learning and process understanding for data-driven Earth system science. Nature 2019, 566, 195–204. [Google Scholar] [CrossRef] [Scilit] [PubMed]
- Ulaby, F.T.; Moore, R.K.; Fung, A.K. Microwave Remote Sensing: Active and Passive—Volume III: From Theory to Applications; Artech House: Boston, MA, USA, 1986. [Google Scholar]
- Paloscia, S.; Pampaloni, P. Microwave vegetation indexes for detecting biomass and water conditions of agricultural crops. Remote Sens. Environ. 1992, 40, 15–26. [Google Scholar] [CrossRef] [Scilit]
- Jackson, T.J.; LeVine, D.M.; Hsu, A.Y.; Oldak, A.; Starks, P.J.; Swift, C.T.; Isham, J.D.; Haken, M. Soil moisture mapping at regional scales using microwave radiometry: The Southern Great Plains Hydrology Experiment. IEEE Trans. Geosci. Remote Sens. 1999, 37, 2136–2150. [Google Scholar] [CrossRef] [Scilit]
- Entekhabi, D.; Njoku, E.G.; O’Neill, P.E.; Kellogg, K.H.; Crow, W.T.; Edelstein, W.N.; Entin, J.K.; Goodman, S.D.; Jackson, T.J.; Johnson, J. The Soil Moisture Active Passive (SMAP) Mission. Proc. IEEE 2010, 98, 704–716. [Google Scholar] [CrossRef] [Scilit]
- Wang, H.; Xie, Q.; Thompson, S.E.; Moore, C.E.; Miller, D.L.; Veneklaas, E.J.; Smith, W.K. Satellite observations reveal ecosystem resistance and resilience to short-term water stress driven by dominant vegetation along a rainfall gradient in Australia. Remote Sens. Environ. 2026, 332, 115046. [Google Scholar]
- Ding, Y.; Li, Z.; Peng, S. Global analysis of time-lag and -accumulation effects of climate on vegetation growth. Int. J. Appl. Earth Obs. Geoinf. 2020, 92, 102179. [Google Scholar] [CrossRef] [Scilit]
- Rudin, C. Stop explaining black box machine learning models for high stakes decisions and use interpretable models instead. Nat. Mach. Intell. 2019, 1, 206–215. [Google Scholar] [CrossRef] [Scilit] [PubMed]
- MapBiomas. Collection 9.0 of the Annual Land Cover and Land Use Maps of Brazil. MapBiomas Project. 2026. Available online: https://brasil.mapbiomas.org/map/colecao-9/ (accessed on 12 April 2026).
- Chen, J.; Jönsson, P.; Tamura, M.; Gu, Z.; Matsushita, B.; Eklundh, L. A simple method for reconstructing a high-quality NDVI time-series data set based on the Savitzky–Golay filter. Remote Sens. Environ. 2004, 91, 332–344. [Google Scholar]
- Small, D. Flattening gamma: Radiometric terrain flattening for SAR imagery. IEEE Trans. Geosci. Remote Sens. 2011, 49, 3081–3093. [Google Scholar]
- Tamiminia, H.; Salehi, B.; Mahdianpari, M.; Quackenbush, L.; Adeli, S.; Brisco, B. Google Earth Engine for geo-big data applications: A meta-analysis and systematic review. ISPRS J. Photogramm. Remote Sens. 2020, 164, 152–170. [Google Scholar]
- Filipponi, F. Sentinel-1 GRD Preprocessing Workflow. Proceedings 2019, 18, 11. [Google Scholar] [CrossRef] [Scilit]
- Wan, Z. New refinements and validation of the collection-6 MODIS land-surface temperature/emissivity product. Remote Sens. Environ. 2014, 140, 36–45. [Google Scholar]
- Allen, R.G.; Tasumi, M.; Trezza, R. Satellite-based energy balance for mapping evapotranspiration with internalized calibration (METRIC)—Model. J. Irrig. Drain. Eng. 2007, 133, 380–394. [Google Scholar] [CrossRef] [Scilit]
- Bastiaanssen, W.G.; Menenti, M.; Feddes, R.A.; Holtslag, A.A.M. A remote sensing surface energy balance algorithm for land (SEBAL). 1. Formulation. J. Hydrol. 1998, 212, 198–212. [Google Scholar] [CrossRef] [Scilit]
- Bennett, N.D.; Croke, B.F.W.; Guariso, G.; Guillaume, J.H.A.; Hamilton, S.H.; Jakeman, A.J.; Andreassian, V. Characterising performance of environmental models. Environ. Model. Softw. 2013, 40, 1–20. [Google Scholar] [CrossRef] [Scilit]
- Mu, Q.; Zhao, M.; Running, S.W. Improvements to a MODIS global terrestrial evapotranspiration algorithm. Remote Sens. Environ. 2011, 115, 1781–1800. [Google Scholar] [CrossRef] [Scilit]
- Ogle, K.; Barber, J.J.; Barron-Gafford, G.A.; Bentley, L.P.; Cable, J.M.; Huxman, T.E.; Ecosystem Memory Working Group. Quantifying ecological memory in plant and ecosystem processes. Ecol. Lett. 2015, 18, 221–235. [Google Scholar] [PubMed]
- Su, Z. The Surface Energy Balance System (SEBS) for estimation of surface turbulent fluxes. Hydrol. Earth Syst. Sci. 2002, 6, 85–100. [Google Scholar]

Disclaimer/Publisher’s Note: The statements, opinions and data contained in all publications are solely those of the individual author(s) and contributor(s) and not of MDPI and/or the editor(s). MDPI and/or the editor(s) disclaim responsibility for any injury to people or property resulting from any ideas, methods, instructions or products referred to in the content. |
© 2026 by the authors. Licensee MDPI, Basel, Switzerland. This article is an open access article distributed under the terms and conditions of the Creative Commons Attribution (CC BY) license.