


Abstract
The open sharing of data as a factor of production is an important institutional mechanism for promoting sustainable innovation in the digital economy. Using Chinese A-share listed firms as the research sample and exploiting the staggered rollout of government open data (GOD) platforms across prefecture-level cities as a quasi-natural experiment, this paper constructs a staggered difference-in-differences (DID) model to examine the effect of GOD on green collaborative innovation (GCI) and its underlying mechanisms. The results show that GOD significantly promotes GCI, indicating that open government data can help firms strengthen collaboration in green innovation and contribute to more sustainable development. Mechanism analysis shows that GOD promotes GCI through four channels: increasing government subsidies, reducing information asymmetry, raising public environmental awareness, and advancing corporate digital transformation. Heterogeneity analysis reveals that the innovation-promoting effect of GOD is more pronounced in large cities, non-resource-based cities, and southern cities, and is more salient among state-owned enterprises, capital-intensive firms, and mature firms. This paper provides empirical evidence on the microeconomic effects of market-oriented data allocation and highlights the role of GOD in supporting GCI, corporate sustainable transformation, and the sustainable development of the digital economy.
1. Introduction
Data and its open sharing have become an institutional mechanism for economic development. Local governments in China have progressively built government open data (GOD) platforms, making administrative data available to the public and market participants to release data dividends and stimulate innovation. Under the dual carbon goals, green innovation drives green economic transformation. Green collaborative innovation (GCI), an advanced form of green innovation, emphasizes knowledge sharing and technological cooperation among multiple actors and matters for developing green technologies and accelerating their diffusion [1,2]. Whether and how GOD can promote GCI is therefore a question worth investigating.
The effect of GOD on GCI draws on information economics, public governance theory, and innovation economics. Information asymmetry constrains market resource allocation [3,4]. By reducing the cost of information acquisition and alleviating information asymmetry, GOD can reshape the decision-making environment for corporate innovation. As a non-rival factor, data derives its economic value from the fact that it can be used simultaneously by multiple actors without depletion [5], which gives GOD positive externalities. However, existing research has not systematically investigated how GOD affects GCI or through what mechanisms.
This paper uses Chinese A-share listed firms as the research sample and exploits the staggered rollout of GOD across prefecture-level cities as a quasi-natural experiment to systematically examine the effect of GOD on GCI. This paper makes three contributions.
First, this paper extends the research perspective on GOD to the domain of GCI. Research on the microeconomic effects of GOD has focused on firm value [6], aggregate corporate innovation [7], corporate cash holdings [8], and corporate digital transformation [9]. Although prior studies have examined the green innovation effects of GOD, they focused on the overall level of corporate green innovation without distinguishing between independent innovation and collaborative innovation [10]. The two studies closest to this paper in the field of GCI examined corporate digital capabilities [11] and network position in GCI [12] and their effects on innovation performance, but neither addressed GOD as an institutional variable. This paper shows how GOD promotes joint green technology development by changing inter-firm information conditions. We frame this contribution in measured terms: rather than claiming an entirely unprecedented question, we position the paper as the first to synthesize two previously disconnected studies, isolating the collaborative margin of green innovation that the GOD stream had left aggregated and supplying the institutional driver that the collaborative-innovation stream had lacked. The novelty therefore lies in this systematic integration, which the critical literature synthesis in Section 2.2 and Section 2.3 makes explicit and transparent, rather than in any claim of standing wholly apart from prior work.
Second, this paper constructs a four-dimensional mechanism analysis framework that includes government subsidies, information asymmetry, public environmental awareness, and corporate digital transformation, complementing and extending prior work. In prior discussions of mechanism channels, existing studies have identified information asymmetry, resource acquisition, and operational efficiency as three channels [7], financing constraints, risk-taking, and resource allocation as three channels [6], and the channels through which public data openness affects the coordinated reduction of pollutants and carbon emissions [13]. Compared with these studies, this paper adds public environmental awareness as a demand-side channel, revealing the transmission mechanism through which GOD stimulates public green consumption preferences via environmental information disclosure, which in turn pressures firms to engage in GCI. Prior literature has not systematically examined this pathway. At the same time, this paper tests corporate digital transformation as an independent channel, supplementing the finding that data openness promotes digital transformation [9], and further extends it to the subsequent effects on GCI.
Third, this paper conducts six sets of heterogeneity analysis along three regional dimensions (city size, resource dependence type, and north–south region) and three firm dimensions (ownership type, factor intensity, and firm life cycle), bringing together perspectives scattered across prior studies. Prior heterogeneity analyses have focused on corporate financing constraints and regional marketization levels [6], industry technology intensity and firm size [7], and corporate environmental sensitivity [10]. Building on these dimensions, this paper introduces the dynamic perspective of firm life cycle and finds that the policy effect is most significant among growth-stage firms and mature firms but insignificant among declining firms, revealing the moderating role of firm development stage on the effectiveness of open data policy and offering evidence for differentiated policy design.
The remainder of this paper is organized as follows: Section 2 reviews the relevant literature; Section 3 presents the institutional background and theoretical hypotheses; Section 4 describes the research design; Section 5 reports the empirical results; Section 6 conducts mechanism analysis; Section 7 performs heterogeneity analysis; Section 8 provides an in-depth discussion of the findings; Section 9 summarizes the conclusions and offers policy implications.
2. Literature Review
2.1. Economic Effects of GOD
GOD refers to the institutional arrangement whereby governments proactively make public data available to society in standardized, machine-readable formats, allowing free access, use, and redistribution. Research on the economic effects of GOD is extensive. Early studies discussed the potential value and implementation barriers of GOD. Research has pointed out that GOD can create public value by improving transparency, promoting public participation, and stimulating innovation, but that inconsistent technical standards and uneven data quality constitute major obstacles [14]. Subsequent work analyzed the design and implementation of open data policies [15]. A systematic review of global GOD initiatives found that the actual economic effects of data openness vary significantly due to differences in governance environments and technological infrastructure [16].
As empirical research has progressed, scholars have turned their attention to the specific economic effects of GOD. The theoretical framework of data-driven innovation suggests that open government data can promote economic innovation by facilitating information flows and knowledge sharing [17]. Analysis based on multi-country cases found that GOD has a significant positive effect on the development of entrepreneurial ecosystems [18]. Recent studies have begun to focus on the micro-level firm effects of GOD. GOD can improve corporate ESG performance, with increased information transparency serving as an important transmission channel [19]. Other research has found that GOD significantly increases firm value, and this effect is more evident in regions with better information infrastructure [6]. GOD also significantly reduces corporate cash holdings, indicating that data openness improves firms’ financing environment and resource allocation efficiency by alleviating information asymmetry [8]. From the perspective of green effects, GOD has a significant positive effect on corporate green innovation [10]. Regarding transmission channels, public data openness promotes corporate digital transformation through information resource sharing and the alleviation of financing constraints [9], and significantly promotes corporate innovation through channels such as reducing information asymmetry, expanding firms’ resource access, and improving operational efficiency [7].
2.2. Determinants of Corporate GCI
Corporate GCI refers to joint innovation activities undertaken by two or more innovation actors in the area of green technology R&D. Its essence is the knowledge complementarity and technological cooperation among innovation actors. Theoretically, GCI is best understood through the lens of inter-organizational innovation theory, which holds that innovation increasingly takes place across, rather than within, firm boundaries and depends on the formation and governance of inter-firm ties [2,20]. Within this framework, jointly filed green patents are not merely an output count but the observable ties of an inter-firm co-patenting network, in which each joint application links two or more organizations into a collaborative green technology relationship. Conceptualizing collaborative green innovation as the edges of such a co-patenting network clarifies both why partner search and information frictions are the binding constraints on its formation and why an institutional data infrastructure that lowers these frictions, such as GOD, operates directly on the conditions for tie formation. Regarding the drivers of green innovation, existing research has primarily discussed three dimensions: environmental regulation, market incentives, and firms’ internal capabilities.
In the dimension of environmental regulation, the Porter hypothesis argues that appropriate environmental regulation can stimulate firms’ innovation compensation effect, prompting firms to achieve a win-win outcome in both environmental and economic performance through technological innovation [21]. Since then, a large body of empirical research has tested and extended this hypothesis. Research based on micro-level data from German firms found that the innovation-incentive effect of environmental regulation varies by regulation type and industry characteristics [22]. Using quasi-natural experiments based on Chinese environmental policies, the significant promoting effect of command-and-control environmental regulation on green technology innovation has been further confirmed [23]. Digital transformation has also been found to strengthen the green innovation incentive effect of environmental regulation, revealing a synergistic mechanism between digital technology and environmental governance [24]. The carbon trading pilot policy has effectively stimulated firms’ green innovation through market mechanisms [25].
In terms of market incentives, government subsidies, as an important fiscal incentive instrument, have received extensive attention. Government R&D subsidies have a significant positive effect on corporate green innovation, though the marginal effect of subsidies diminishes as subsidy scale increases [26]. Firms with strong ESG performance can obtain greater external resource support, thereby creating favorable conditions for green innovation [27].
At the level of collaborative innovation, classical studies indicate that the performance of cooperative R&D depends on the type of partners and the alignment of cooperation objectives. Collaboration with competitors is more conducive to incremental innovation, while collaboration with research institutions is more conducive to breakthrough innovation [2]. Technological complementarity and absorptive capacity play a critical role in the success of collaborative innovation [28]. In recent years, with the rapid development of digital technology, the influence of digital factors on collaborative innovation has gradually become a research frontier. The theoretical framework of digital innovation management suggests that digital platforms and data sharing can substantially reduce the coordination costs and information search costs of collaborative innovation [29]. Empirical research based on large-sample firm data shows that firms with higher levels of digitalization are more inclined to engage in GCI, and their collaborative innovation efficiency is also higher [30]. From the perspective of green relational learning, corporate digital capabilities significantly improve GCI performance by promoting green knowledge acquisition and green relational coordination [11]. Research based on social network analysis methods shows that the higher a firm’s centrality in the GCI network, the better its green total factor productivity [12]. In addition, government disclosure of public data can effectively stimulate firms’ green transformation behavior [31], and public data openness also has a significant promoting effect on firms’ coordinated pollution reduction and carbon abatement [13]. Synthesizing this literature critically, a key unresolved tension emerges: the collaborative innovation stream treats partner search costs and information asymmetry as the binding constraints on co-patenting, yet it has not examined the institutional data infrastructures that could relax these constraints, whereas the GOD stream documents firm-level benefits without isolating the collaborative margin. Recent evidence further shows that firms’ digital and governance capabilities jointly shape how they convert external resources into sustainability outcomes [32], underscoring that the enabling conditions for collaborative green innovation remain only partially understood.
2.3. Literature Assessment
A synthesis of the above two streams of literature reveals that research on the economic effects of GOD and research on the determinants of GCI have both accumulated substantial scholarship, but research connecting the two remains limited. This gap has several dimensions.
First, at the level of research focus, no study has directly tested the causal relationship between GOD and GCI. Existing micro-level research on the effects of GOD has concentrated on three categories of outcome variables: the first is corporate financial performance, including firm value [6], cash holdings [8], and operating performance [33]; the second is aggregate innovation output, including patent applications [7] and the degree of corporate digital transformation [9]; the third is macro-environmental effects, including coordinated reduction of pollutants and carbon emissions [13] and firms’ green transformation behavior [31]. Only one study has extended the analysis to the green innovation dimension, but its measure of total firm-level green patents fails to distinguish between independent innovation and cooperative innovation [10]. On the other hand, existing research in the GCI field has primarily focused on firm-level capability factors. Corporate digital capabilities can promote GCI through green relational learning [11], and network position has a significant effect on green total factor productivity [12], yet none incorporated GOD as an institutional variable. This paper fills this gap by directly testing the causal link from GOD to GCI.
Second, in terms of transmission mechanisms, existing studies on the channels through which GOD affects firm behavior have largely focused on supply-side effects. The literature has identified three channels: reduction of information asymmetry, expansion of resource access, and improvement of operational efficiency [7]; three channels of alleviation of financing constraints, increased risk-taking, and optimization of resource allocation [6]; and two channels of information resource sharing and alleviation of financing constraints [9]. These studies focus on supply-side conditions for firms, but the demand-side transmission effect—namely how data openness creates market demand for green technology through social mobilization—has not been systematically examined. Building on existing supply-side mechanisms (government subsidies and information asymmetry), this paper adds two new channels: public environmental awareness (a demand-side effect) and corporate digital transformation (a technological capability effect), building a mechanism framework that links supply and demand sides.
Third, at the level of heterogeneity analysis, the dimensions examined in existing literature are relatively narrow. Prior studies have conducted heterogeneity analyses along the dimensions of firm financing constraints and regional marketization levels [6], industry technology intensity and firm size [7], and firm environmental sensitivity and executive environmental awareness [10]. Each addresses one facet, but no systematic framework covers both regional and firm-level characteristics. This paper conducts six sets of heterogeneity analyses across three regional dimensions (city size, resource dependence type, and north–south location) and three firm-level dimensions (ownership type, factor intensity, and firm life cycle). The firm life cycle dimension, in particular, has not been explored in GOD research. This paper finds that growth-stage and mature firms respond most actively to data openness policies, whereas the effect is insignificant for declining firms, showing that firm development stage moderates the policy effect.
Accordingly, this paper adopts the perspective of market-oriented allocation of data as a factor of production, and systematically examines the causal effect and underlying mechanisms of GOD on GCI, contributing to both theory and policy in this area. In short, the gap is not merely that no study has linked GOD to GCI, but that neither stream alone can explain the collaborative margin: the GOD literature lacks a collaboration-specific outcome, while the GCI literature lacks an institutional driver capable of lowering partner search and coordination costs. This paper synthesizes the two by treating GOD as exactly such an institutional driver.
3. Institutional Background and Theoretical Analysis
3.1. Institutional Background of GOD in China
China’s GOD practices began in 2012, when Shanghai took the lead in establishing the country’s first provincial-level government data portal, the Shanghai Government Data Service Website, marking the transition of GOD from concept to practice. Subsequently, Beijing, Zhejiang, Guangdong, and other regions successively established their own government data portals. In 2015, the State Council of China issued the Action Plan for Promoting Big Data Development, which explicitly proposed accelerating the opening and sharing of government data, promoting resource integration, and improving governance capacity, thereby elevating GOD to a national strategy. Guided by these policies, an increasing number of prefecture-level cities began building government data portals, forming a pattern of staggered policy implementation.
In terms of the specific content of policy implementation, local government data portals primarily cover government affairs data across multiple domains, including economic development, social welfare, urban management, and environmental ecology. These data are made available to the public and market participants in standardized formats, permitting free download, use, and secondary development. The types of data opened include statistical data, administrative licensing information, public resource transaction information, and environmental monitoring data, providing important information resources for firms’ production, operations, and innovation activities. The timing, scope, and data quality of data openness vary considerably across regions, and this cross-regional variation in policy implementation provides a natural experimental setting for identifying causal effects using the staggered difference-in-differences (DID) method in this paper.
3.2. Theoretical Analysis
GOD may affect GCI through multiple pathways. This paper organizes them into four dimensions: information effects, resource effects, demand effects, and technology effects. Beyond enumerating these channels, it is essential to clarify why GOD should differentially encourage collaborative rather than independent green innovation, which is the central distinction of this paper. Transaction cost theory provides the core logic: relative to in-house innovation, collaborative green innovation is far more exposed to partner search costs, information asymmetry over partners’ true capabilities, and contracting and coordination hazards. By supplying standardized, verifiable, and machine-readable public data, GOD lowers precisely these transaction costs, so its marginal effect on the collaborative margin exceeds its effect on independent innovation. This transaction-cost logic grounds our central claim that GOD operates as a collaboration-enabling institution rather than merely a general stimulus to innovation.
(1) Information asymmetry hinders collaborative innovation [3]. In the process of cooperative green technology R&D, information asymmetry among potential partners increases search costs and transaction costs, reducing both the willingness to cooperate and cooperation efficiency. By providing standardized, machine-readable public data resources, GOD can effectively reduce the degree of information asymmetry between firms and between firms and the government. On the one hand, open data helps firms more accurately evaluate potential partners’ technological capabilities, creditworthiness, and operating performance, thereby reducing the risk of adverse selection in collaborative innovation. On the other hand, the opening of environmental monitoring data and industry development data enables firms to more precisely identify market demand for green technology and the direction of policy, leading to more informed innovation decisions [34]. As a non-rival factor [5], open sharing of data can provide decision support to a greater number of innovation agents without diminishing the original information value, generating significant positive externalities.
(2) The construction of GOD platforms is often accompanied by increased local government attention to innovation activities and greater resource investment. Open data allows governments to more accurately identify firms and technological directions with green innovation potential, improving the targeting precision and allocation efficiency of fiscal subsidies. At the same time, data transparency strengthens public oversight of the subsidy allocation process, which helps curb rent-seeking behavior and improves the innovation incentive effect of subsidies [26]. Government subsidies provide financial support for firms to cover the upfront costs of GCI, reduce the financial risk of cooperative innovation, and thereby stimulate firms’ willingness to participate in GCI.
(3) The opening of environmental data enables the public to access environmental quality information more conveniently, strengthening public perception of and attention to environmental issues [35]. Rising public environmental awareness affects firms’ green innovation decisions through two channels: consumer preferences and public opinion. On the consumption side, stronger green consumption preferences create market demand for green products and green technologies, providing commercial incentives for firms to engage in GCI. On the public opinion side, rising public environmental awareness intensifies the environmental compliance pressure and reputational risk that firms face, pushing them to strengthen green technology R&D and to share R&D risks and reduce innovation costs through collaborative innovation [20].
(4) GOD creates foundational conditions for firms to apply big data, artificial intelligence, and other digital technologies, advancing the process of corporate digital transformation. Higher levels of digitalization promote GCI at two levels: at the technical level, digital technologies enable firms to process and analyze massive volumes of data more efficiently, identify opportunities for green technology innovation and potential partners, and reduce the coordination costs of collaborative innovation [29]. At the organizational level, digital transformation encourages firms to establish more open innovation architectures, strengthening their capacity for knowledge sharing and technological collaboration with external entities [30]. This capability-based pathway is consistent with the natural-resource-based view, under which digital transformation and governance mechanisms jointly build the dynamic capabilities that firms need in order to translate external data resources into sustainability outcomes [32]; firms with stronger digital capabilities are thus better positioned to convert open data into collaborative green innovation.
4. Research Design
4.1. Model Specification
To examine the effect of GOD on GCI, this paper constructs the following staggered difference-in-differences (DID) model:
where the subscripts i and t denote firm and year, respectively. The dependent variable GCIit represents firm i’s joint green patent applications in year t. The key explanatory variable GODit = Treatedi × Timet, where Treatedi is a dummy variable indicating whether the firm is located in a pilot city, and Timet is a time dummy variable. Controlsit is a set of control variables. μi and λt represent firm fixed effects and year fixed effects, respectively. εit is the error term.
4.2. Variable Definitions
(1) Dependent variable (GCI): This paper measures the level of GCI using the number of joint green patent applications. A joint green patent application is filed by two or more applicants for patents related to environmental protection, resource conservation, and ecological balance. Green patents are directed at solving environmental problems, reducing pollution, and saving energy and resources. Joint applications imply that multiple parties engage in collaborative R&D and share application and maintenance costs. This approach encourages multi-party cooperation in green technology development, reduces disputes over rights allocation, and promotes the innovation and diffusion of environmentally friendly technologies.
(2) Explanatory variable (GOD): This paper treats the successive opening of government data across prefecture-level cities as a quasi-natural experiment. Cities that have opened government data are assigned a value of 1 and constitute the treatment group. The time dummy variable takes the value of 0 before and 1 after the opening of government data.
(3) Control variables. To ensure analytical accuracy, this study controls for the following firm-level variables: firm size (size), measured as the natural logarithm of total annual assets; leverage ratio (lev), defined as the ratio of total liabilities to total assets at year-end; return on assets (ROA), expressed as the ratio of net operating income to total assets; revenue growth rate (Growth), measured directly by the growth rate of operating revenue; current asset ratio (cr), calculated as the ratio of total current assets to total assets; Tobin’s Q (TobinQ), defined by comparing a firm’s market value to its net asset value; and board size (board), measured by the number of board members. We retain board size as a governance control because board composition shapes firms’ responsiveness to sustainability-oriented institutional incentives and disclosure [36]. All seven control variables listed above are activated simultaneously in every reported specification in Tables. The baseline sample is the intersection of the dependent variable, the treatment, and all controls. In the mechanism tests, the effective sample for each channel is further bounded by the data coverage of that channel’s specific mediator proxy, which is why the four columns report slightly different observation counts even though the control set is held constant across columns.
4.3. Sample Selection and Data Sources
This paper collects annual report data from Chinese A-share listed firms over the period 2010–2019. The year 2019 is chosen as the endpoint because the COVID-19 pandemic made it difficult for R&D personnel to meet and collaborate in person, which impeded joint R&D activities and distorted empirical results. Firms in the financial sector, real estate sector, and those designated as ST, *ST, or PT (i.e., firms under special or particular trading status) are excluded. All variables are winsorized at the 1% level on both tails. The data are drawn primarily from the CSMAR and Wind databases. Descriptive statistics for the main variables are presented in Table 1.
Table 1.
Descriptive statistics of main variables.
5. Empirical Tests and Analysis
5.1. Parallel Trends Test
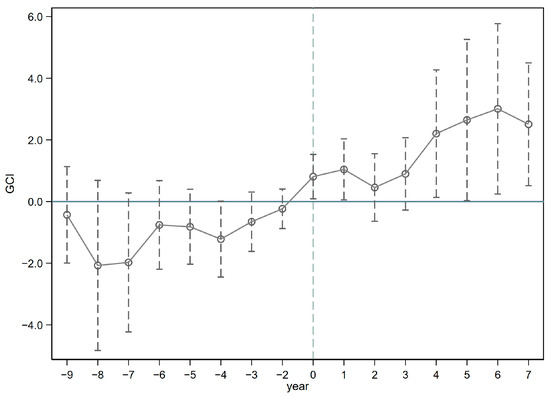
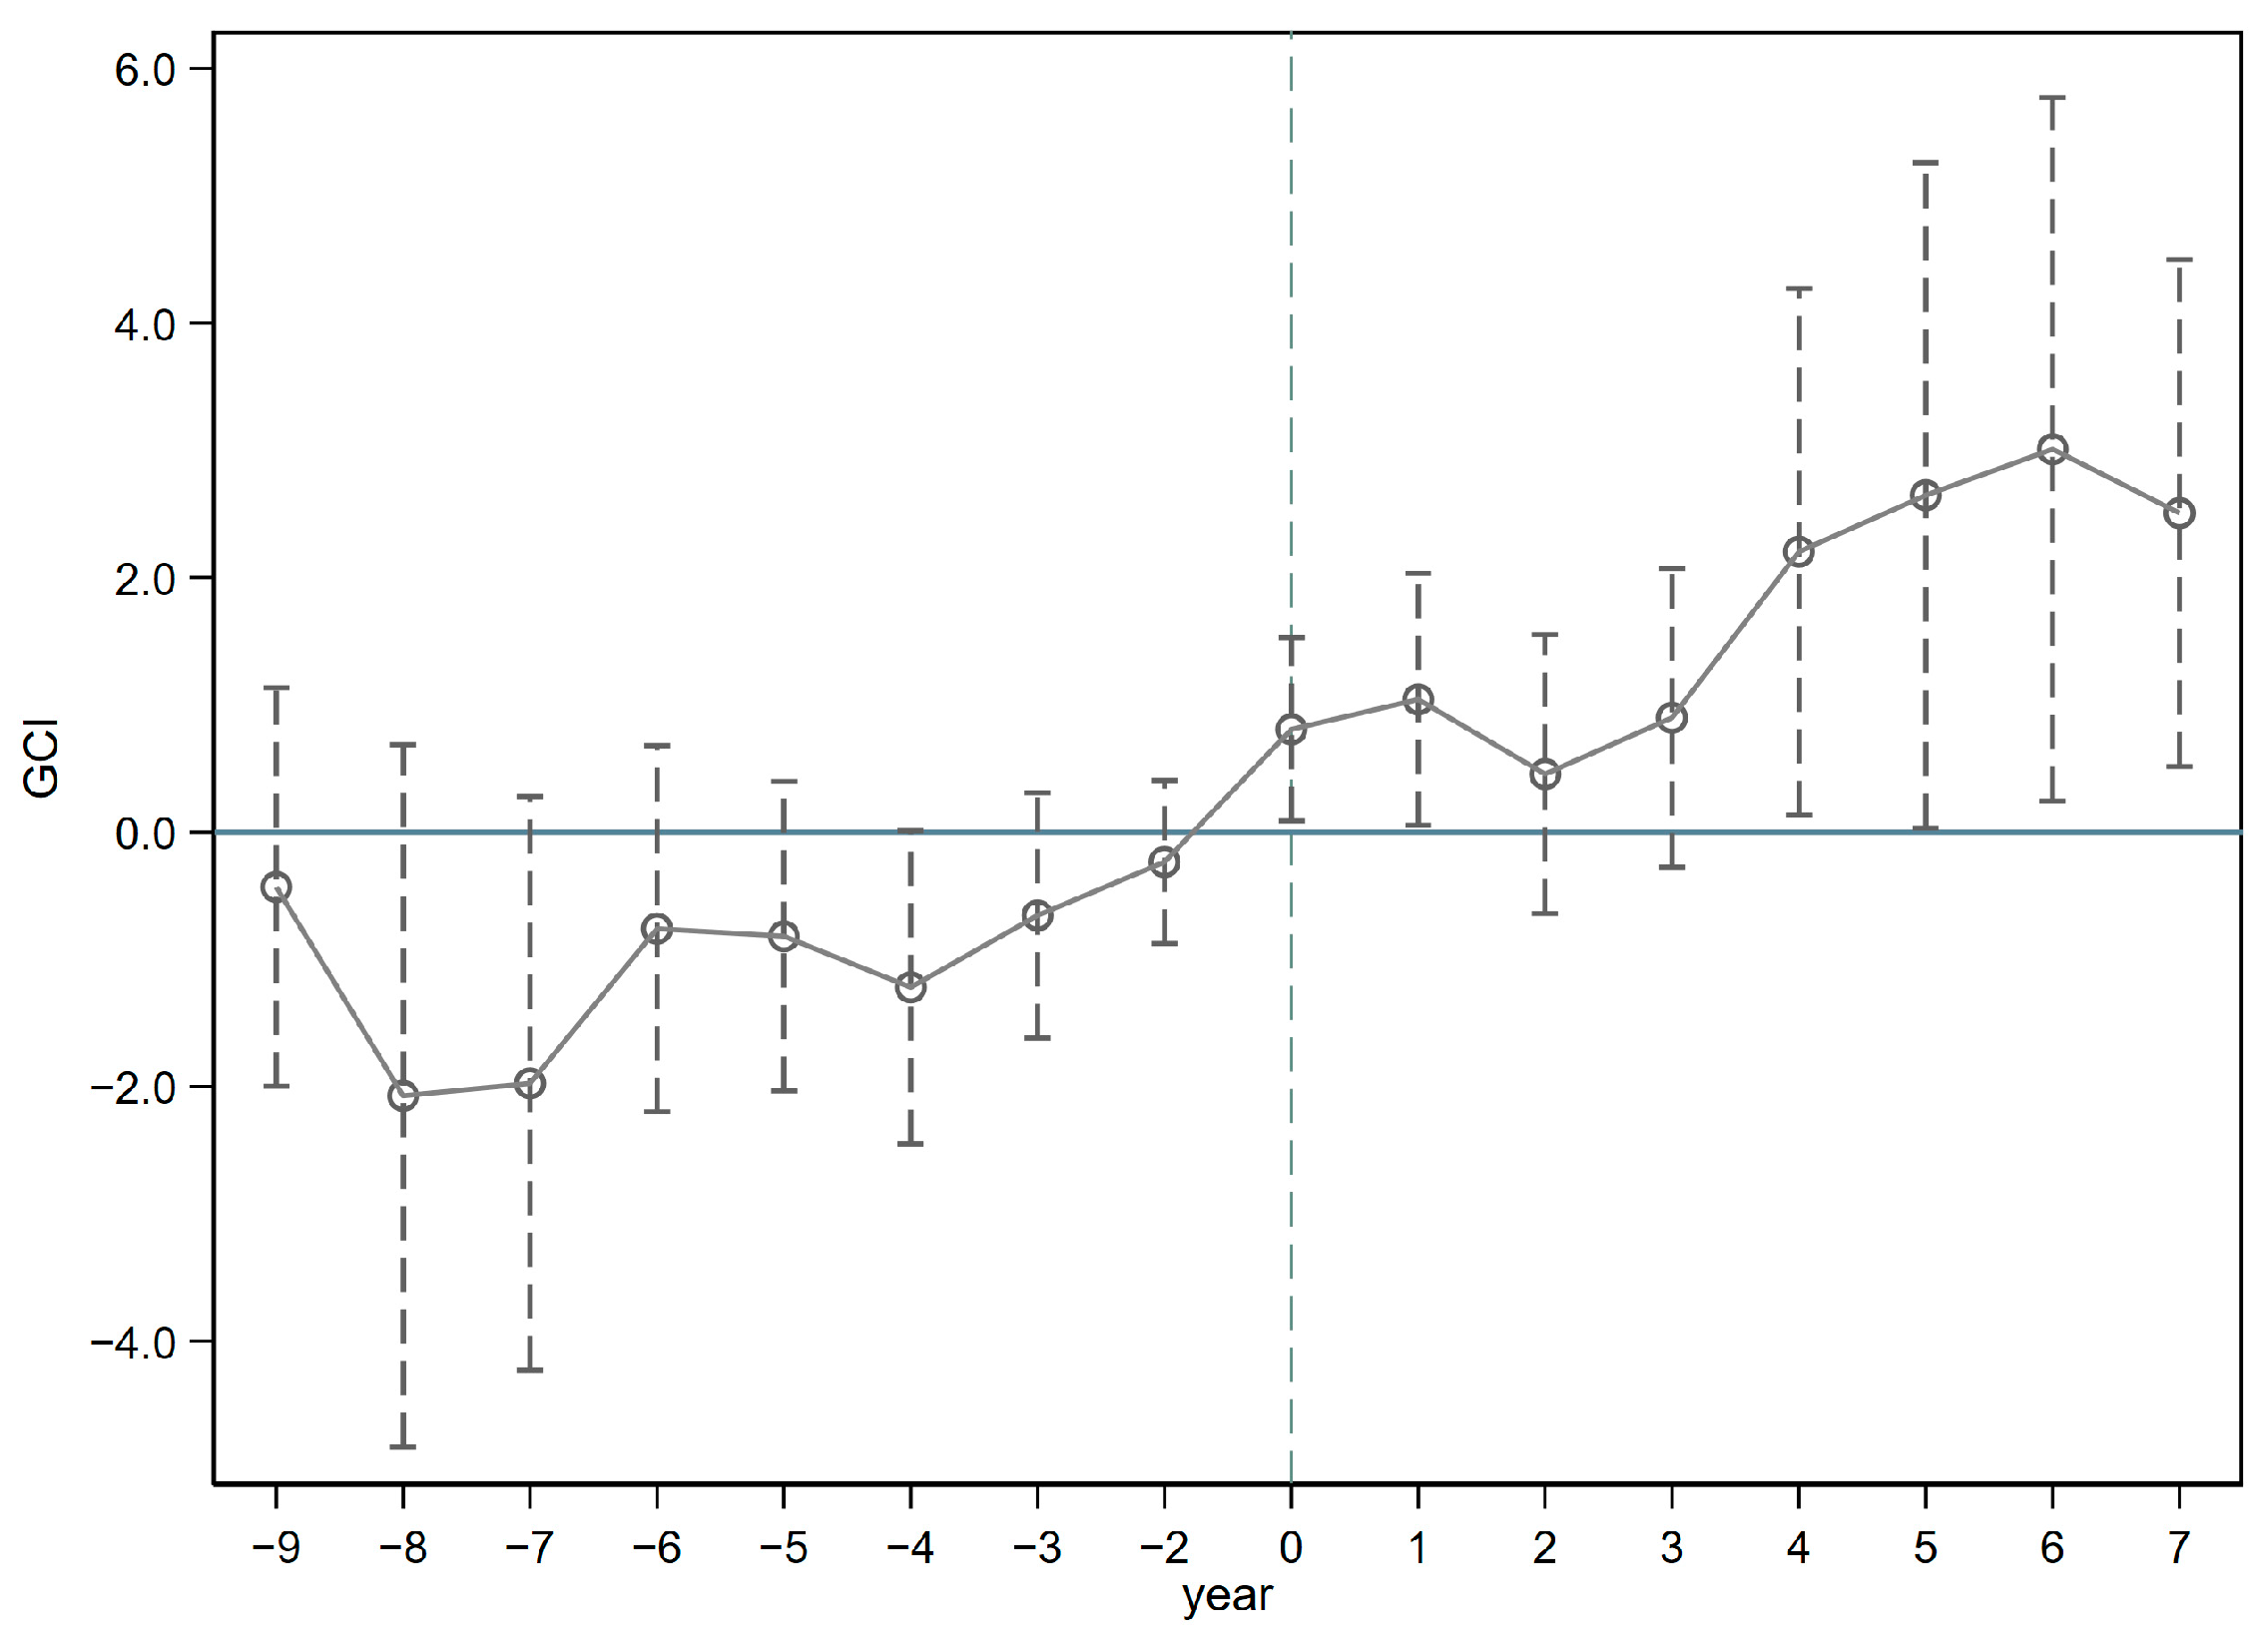
This study employs an event-study approach to examine the dynamic pattern of GCI and to conduct a parallel trends test. As shown in Figure 1, the X-axis displays periods from −9 to −2 before the opening of government data, 0 for the year of the pilot, and 1 through 7 for the years after. The Y-axis displays the estimated coefficients of GOD on GCI. The interaction terms for the pre-treatment periods are mostly statistically insignificant, indicating no significant difference between the treatment group and the control group before the policy. This result satisfies the parallel trends assumption required by the DID model.
Figure 1.
Parallel trends test results.
5.2. Baseline Regression
This study empirically tests the effect of GOD on GCI among Chinese listed firms. The baseline regression results are reported in Table 2. Column 1 reports the estimates after adding firm-level control variables. Column 2 includes both firm and year fixed effects. Column (3) clusters standard errors at the firm level, while Column (4) re-clusters them at the prefecture-city level. Because all firms within a city share the same GOD rollout timing, their innovation residuals may be spatially correlated and firm-level clustering could understate the standard errors; the coefficient on GOD remains positive and statistically significant under prefecture-city clustering, indicating that the inference is robust to cross-sectional spatial dependence. Across all four specifications, GOD has a significant positive effect on GCI. Taking Column 3 as the benchmark, the construction of data as a factor of production market increases the number of joint green patent applications by 1.419 on average.
Table 2.
Baseline regression results.
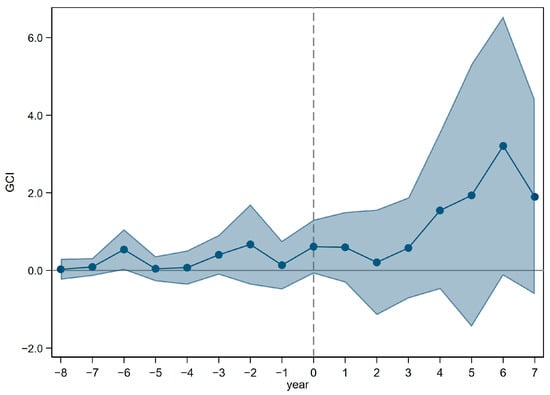
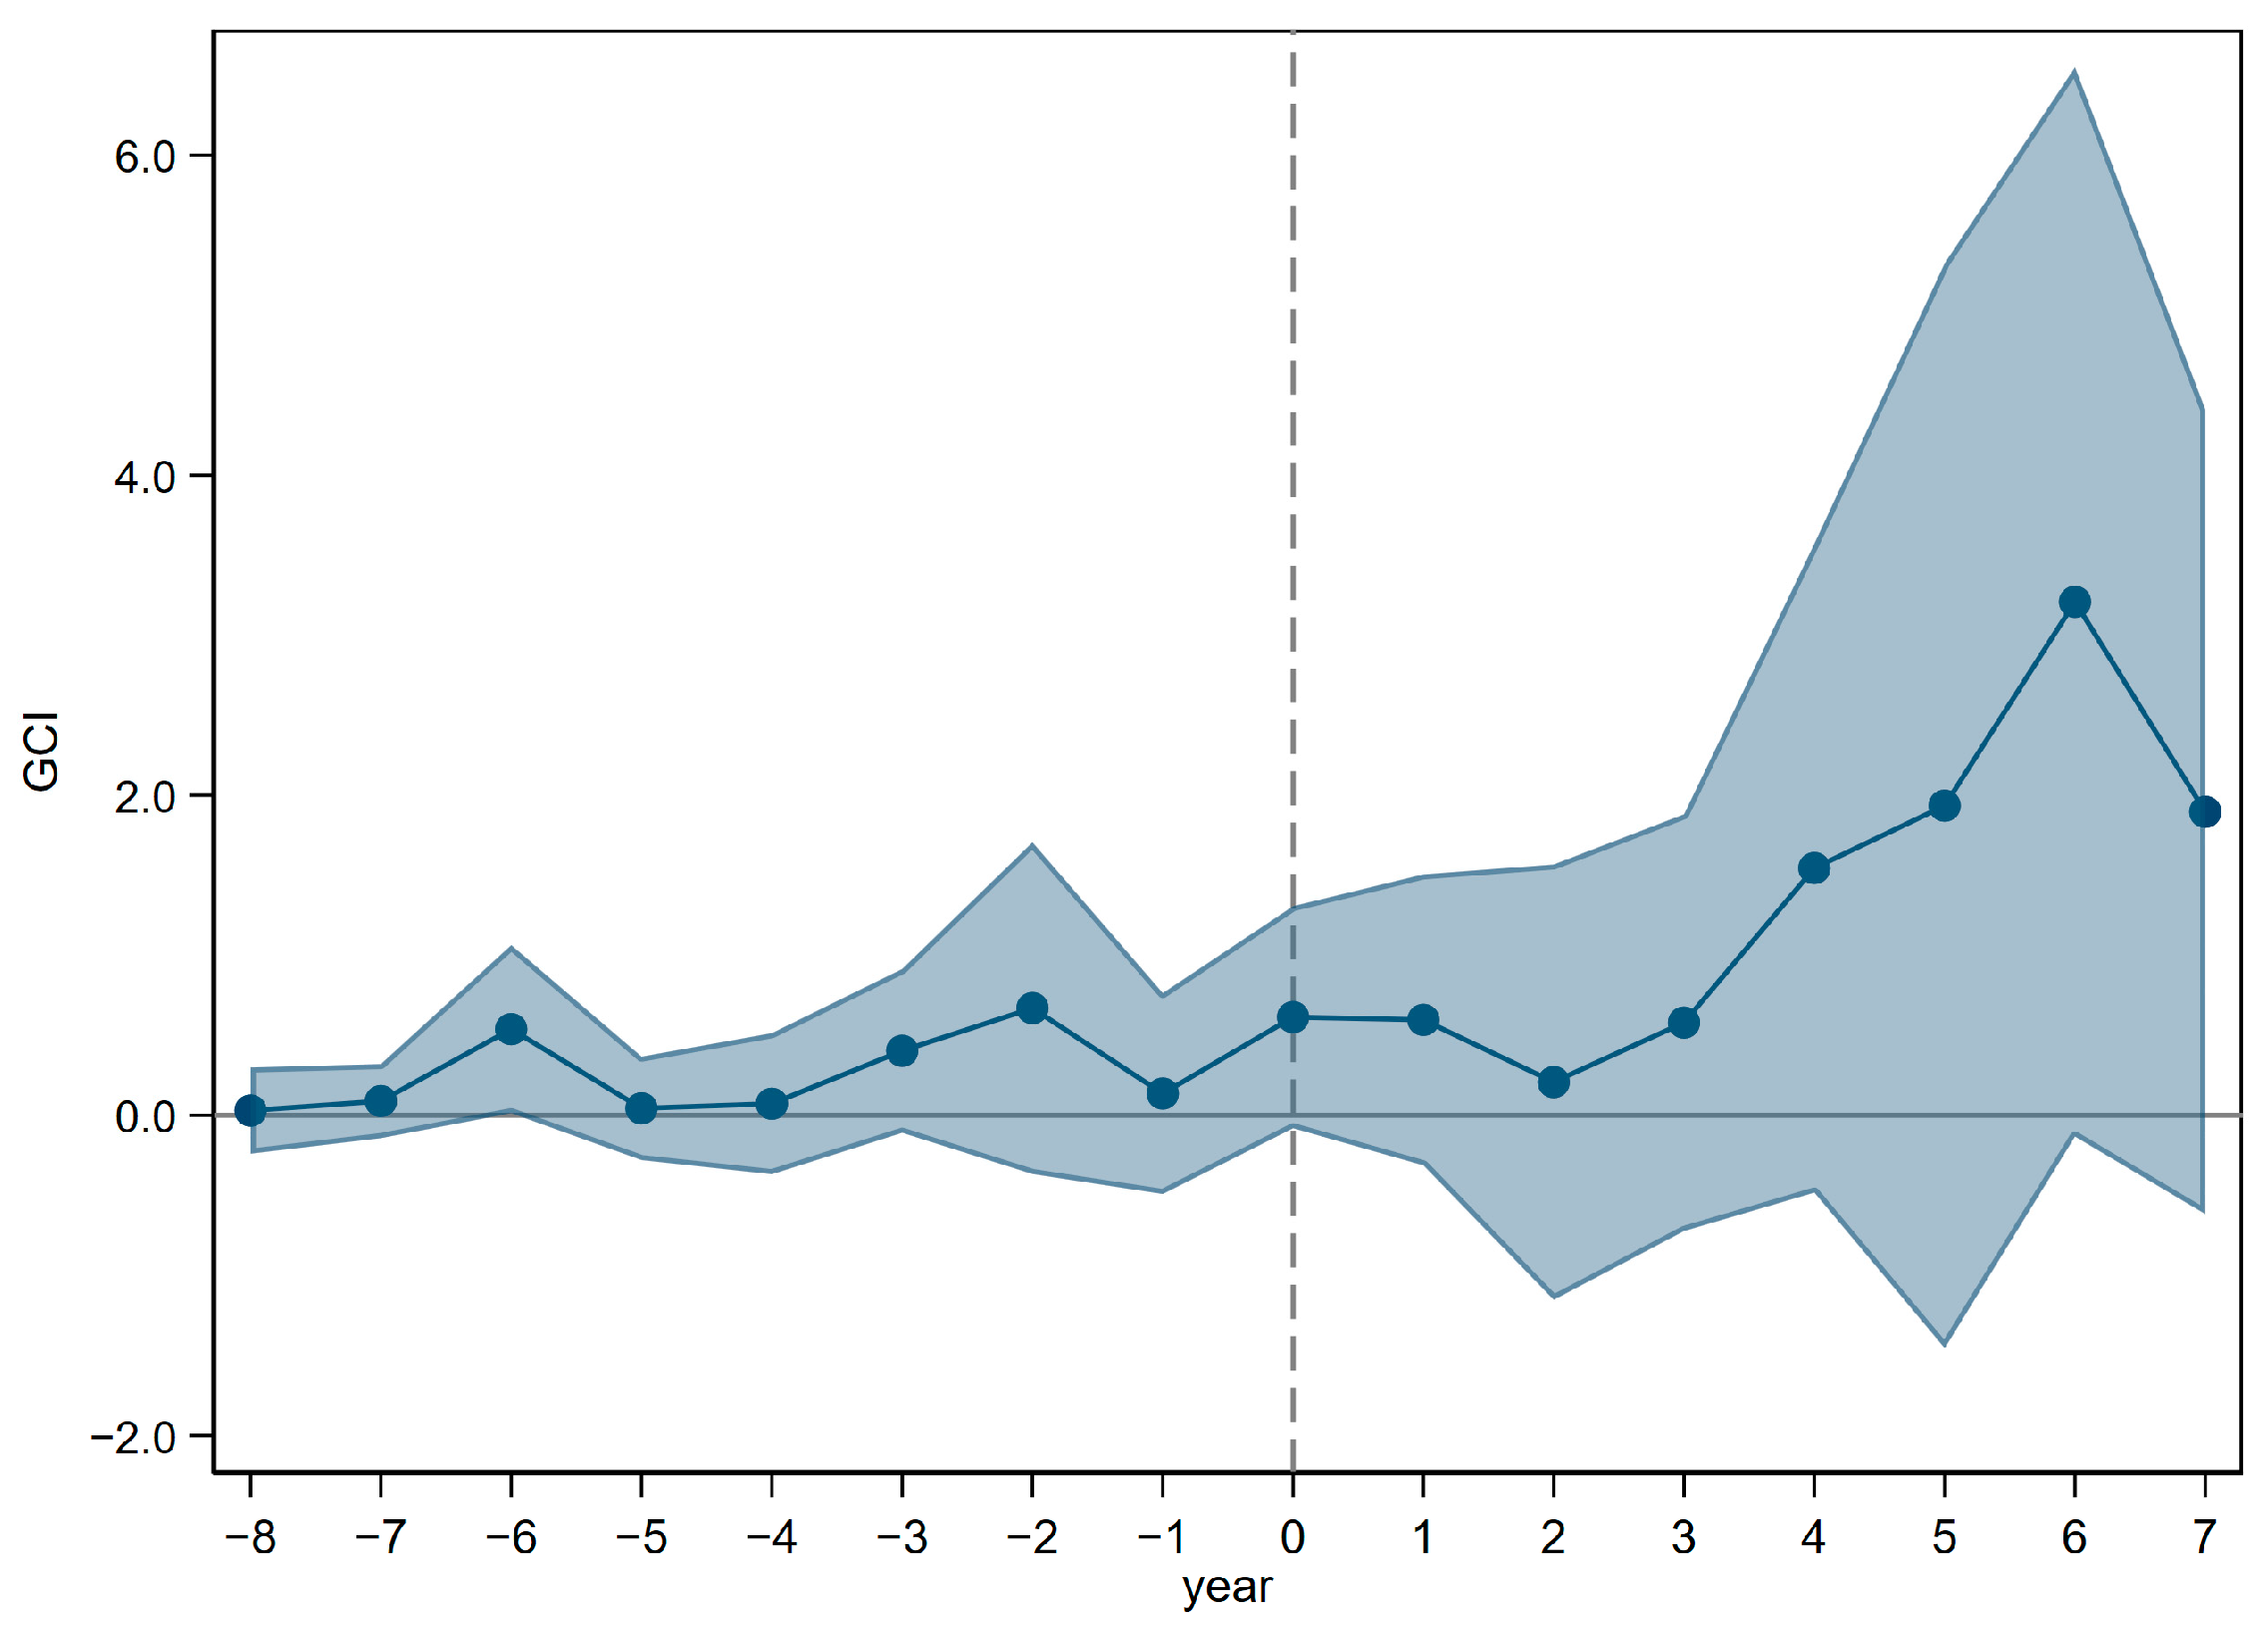
In the DID framework, the treatment effects estimated by fixed effects regressions may vary across treatment groups or across treatment timing, potentially giving rise to a “bad control group” problem [37,38]. To mitigate estimation bias, we further employ the two-stage difference-in-differences (did2s) estimator, a heterogeneity-robust approach that first isolates the treatment and time effects in a first stage and then estimates the policy effect on the residualized outcome. The results are reported in Table 3, and the coefficient remains significant at the 1% level. Our core conclusions are therefore robust. In addition, we apply the heterogeneity-robust estimator of de Chaisemartin and D’Haultfoeuille [38] to recover the dynamic treatment effects. As shown in Figure 2, the pre-treatment estimates are not significantly different from zero, confirming the absence of pre-trends, while the post-treatment effects are positive, which further supports the robustness of our findings.
Table 3.
Two-stage DID result.
Figure 2.
Dynamic treatment effects estimated by the de Chaisemartin and D’Haultfoeuille estimator.
5.3. Robustness Checks
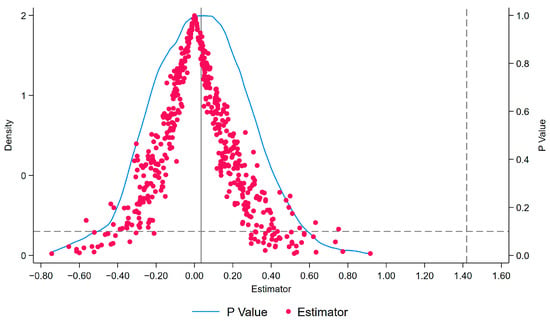
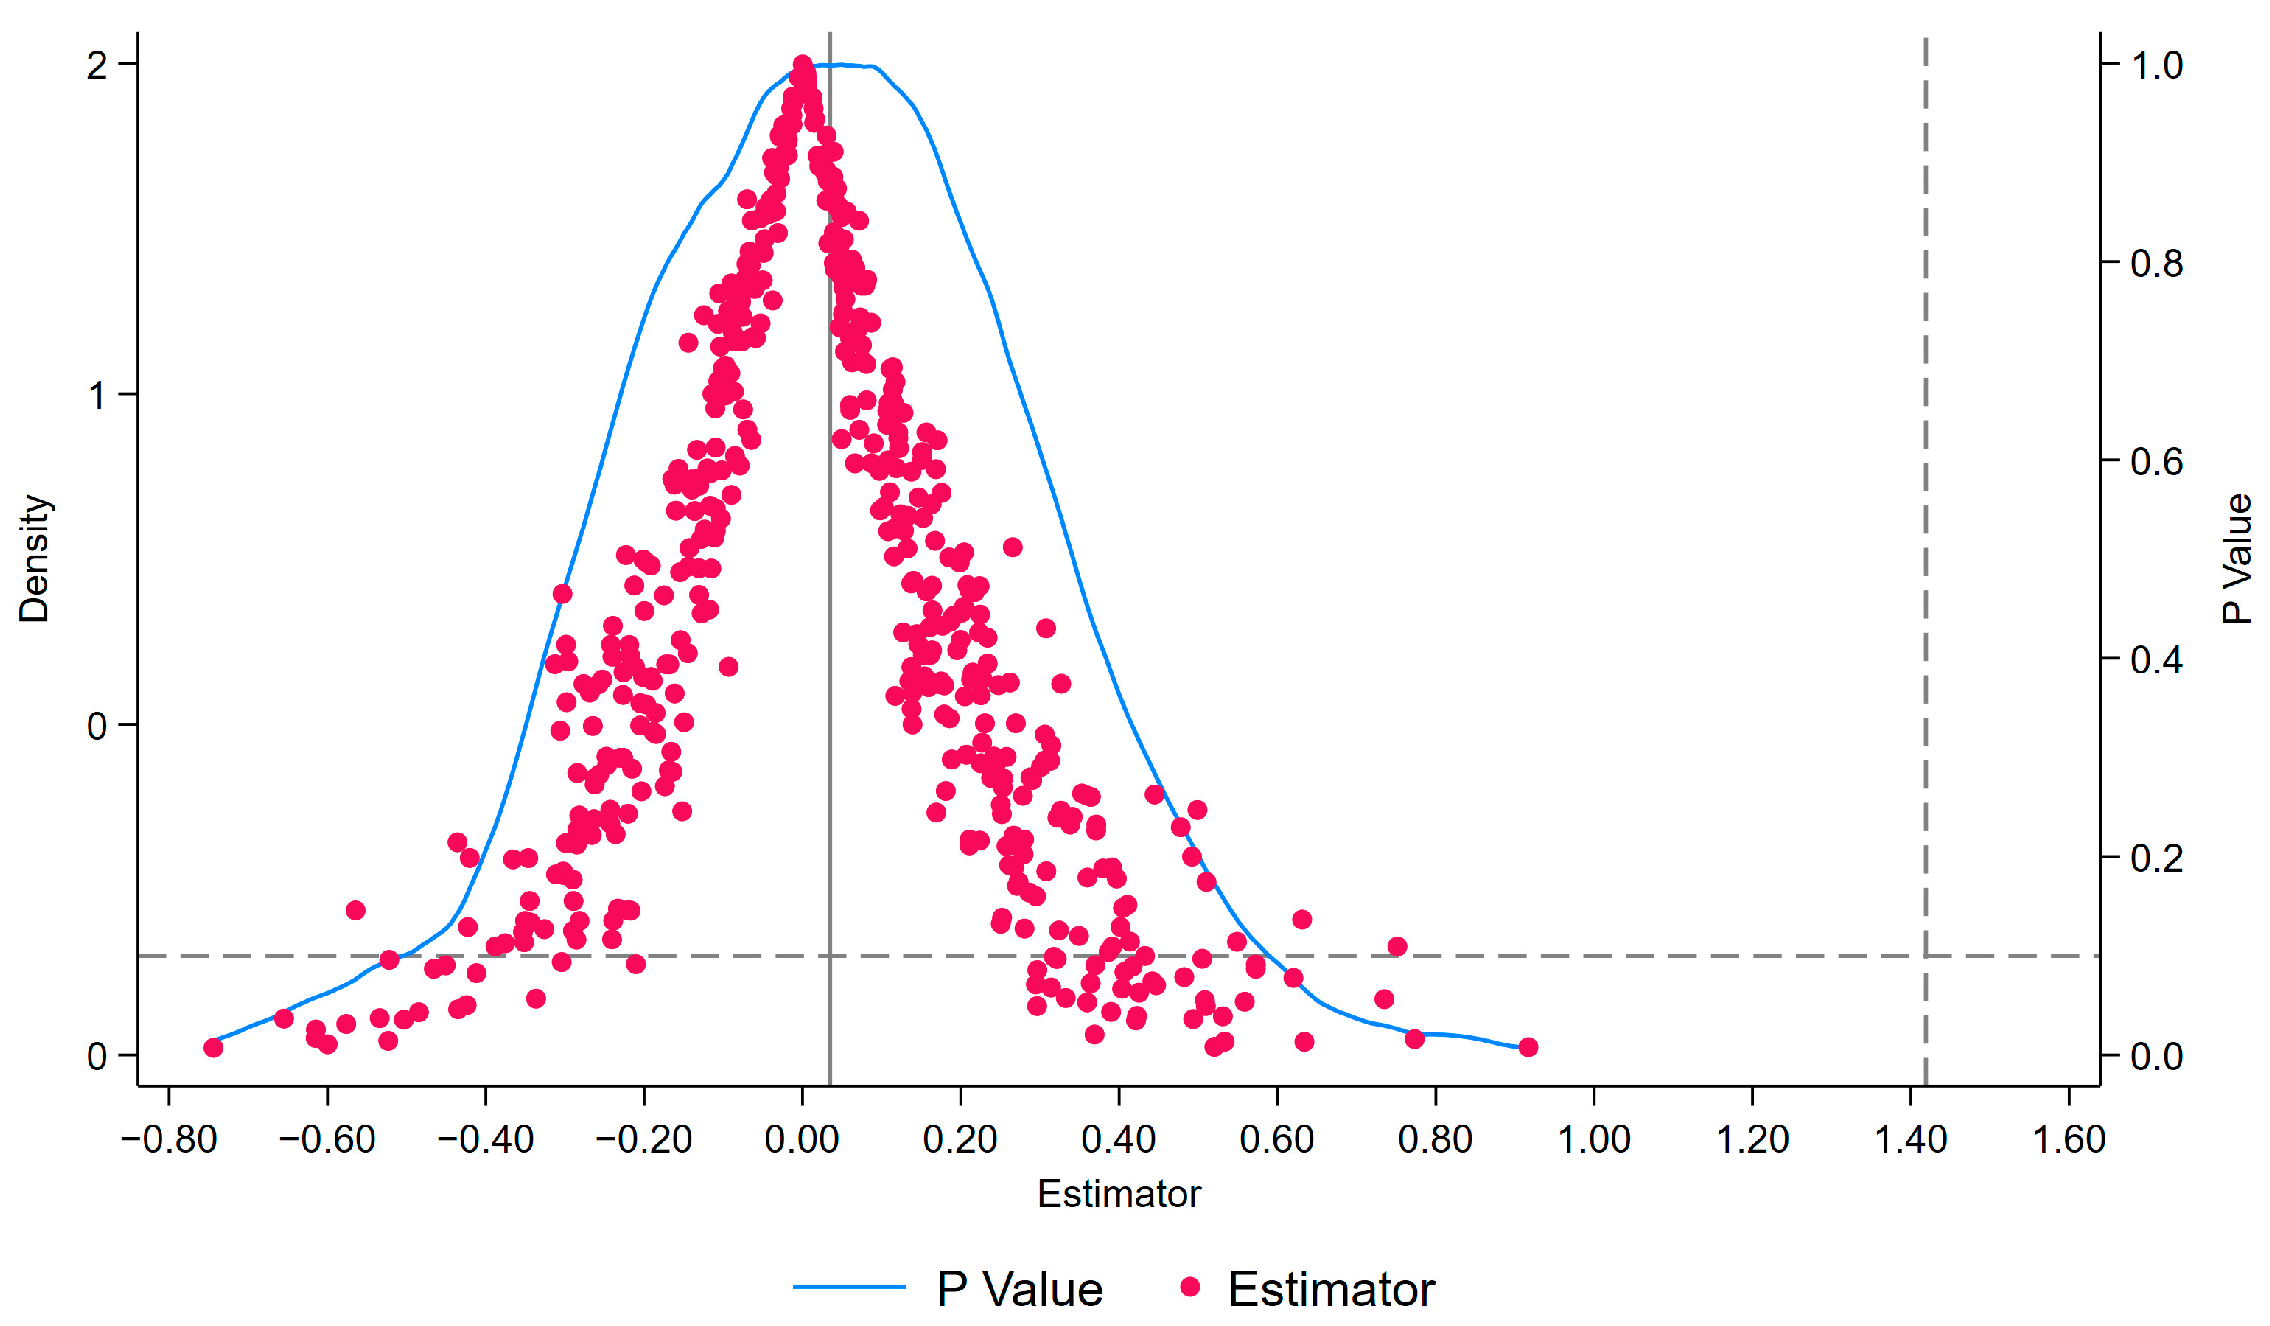
(1) Placebo test. This paper simulates the timing of GOD by randomly reassigning the treatment 500 times and examining whether the pilot policy promotes GCI. The results are presented in Figure 3, where each red circle represents the estimated coefficient of the key explanatory variable from one iteration. After randomly assigning the policy implementation year, the estimated coefficients of GOD cluster around zero, and their distribution bears no relation to the baseline estimate of 1.419. These findings strengthen the credibility of our main conclusions.
Figure 3.
Placebo test.
(2) Alternative dependent variable. We use joint green invention patent applications as an alternative dependent variable for a robustness test. Compared with utility model and design patents, invention patents better reflect the quality of corporate innovation. As shown in Column (1) of Table 4, GOD significantly promotes joint green invention patent applications, which reinforces the robustness of our results.
Table 4.
Robustness checks results.
(3) Other robustness checks. We conduct a series of additional robustness checks. First, we replace the sample with a balanced panel; results are reported in Column (2) of Table 4. Second, we adopt propensity score matching (PSM-DID): for each treatment group firm, we identify and match the control firm with the most similar observable characteristics, using the existing control variables as covariates and performing year-by-year 1:1 nearest-neighbor matching before re-estimating the regression on the matched sample; results appear in Column (3) of Table 4. Third, we exclude potential confounding effects from the innovative city pilot and the information benefit pilot, with results reported in Columns (4) and (5) of Table 4, respectively. Across all these specifications, the key explanatory variable remains highly significant, confirming that our core conclusions are robust.
(4) Alternative estimator for the count outcome. Because the dependent variable is a count with a right-skewed distribution and a large share of zeros, a linear estimator may be inappropriate. We therefore re-estimate the model using the Poisson pseudo-maximum-likelihood (PPML) estimator, which accommodates the count nature of the outcome and is robust to overdispersion and zero inflation. The result is reported in Column (6) of Table 4. GOD remains positive and statistically significant, confirming that our conclusions are not an artifact of the linear specification.
6. Identification Tests for Mechanism Pathways
6.1. Model Specification and Variable Description
To further reveal the mechanisms through which GOD affects GCI, we specify the following mechanism test model: We adopt a stepwise (causal-steps) mediation procedure. The first step regresses GCI on GOD to establish the total effect, which corresponds to the baseline model. The second step regresses each mediator M on GOD, as specified in the equation below. The third step regresses GCI on GOD and the mediator jointly. The equations are as follows:
where M denotes various potential mechanism variables. (1) Government subsidies. Government subsidies for listed firms refer to economic support that the government provides to listed companies in order to encourage the development of specific industries or sectors, promote technological innovation, safeguard social stability, or achieve other macroeconomic and social objectives. Such subsidies may take the form of direct fiscal transfers, tax exemptions, interest subsidies, or other instruments. Listed firms typically must satisfy certain conditions or complete designated tasks to receive these subsidies. Government subsidies can both alleviate financial pressure on firms and steer their investment and development in targeted directions. (2) Information asymmetry. Following the approach of Yu et al. [39], we measure corporate information asymmetry. Drawing on strategies from the market microstructure literature, we use firm-level stock trading data to capture the degree of information asymmetry between uninformed and informed traders regarding firm value, and treat this measure as a proxy for information asymmetry between capital providers and firms. In stock trading, informed traders who maintain close ties with a firm typically possess more information about its operating conditions and prospects than other traders. Uninformed traders, concerned about losses arising from their informational disadvantage, demand a “lemon premium” as compensation for the potential costs of adverse selection. The intensity of information asymmetry about asset value is a key determinant of asset liquidity: greater information asymmetry and more severe adverse selection lead to a higher lemon premium and lower stock liquidity. (3) Public green attention. Some scholars have used Google search data to construct indicators of public demand and attention [35]. Baidu commands over 70% of the mainland Chinese search market. We construct a public environmental attention indicator for listed firms using the Baidu Index of searches for the keywords “environmental pollution” and “smog.” (4) Corporate digitalization. We collect annual reports of listed firms from 2010 to 2019 and perform text analysis on 76 digitalization-related terms across five dimensions: artificial intelligence, big data, cloud computing, blockchain, and digital technology application. After removing stop words, we count the frequency of these terms throughout each annual report to measure the degree of corporate digital transformation.
6.2. Mechanism Tests
Table 5 reports the results of the stepwise mechanism tests, in which the second and third steps are presented side by side for each channel: for every mechanism variable, the odd-numbered column estimates the effect of GOD on the mediator, and the adjacent even-numbered column estimates the effect of the mediator on GCI once GOD is also controlled for. The government subsidies channel is examined in Columns (1) and (2). GOD significantly increases the government subsidies that firms receive, and these subsidies in turn significantly raise GCI. This pattern shows that an important part of the influence of GOD works by channeling fiscal support toward collaborative green projects. The information asymmetry channel is examined in Columns (3) and (4). GOD significantly reduces the degree of information asymmetry, and lower information asymmetry is in turn associated with higher GCI, which confirms that by improving information transparency and lowering search costs, open data helps firms identify and evaluate suitable green technology partners. The public environmental attention channel is examined in Columns (5) and (6). GOD significantly raises public environmental attention, and stronger public attention is in turn associated with more GCI, suggesting that the disclosure of environmental data mobilizes the green consumption preferences and public oversight that pull firms toward collaborative green innovation. The corporate digital transformation channel is examined in Columns (7) and (8). GOD significantly advances corporate digital transformation, and a higher level of digitalization is in turn associated with more GCI, consistent with the view that digital capabilities lower coordination costs and strengthen the knowledge-sharing on which joint innovation depends. Across the four channels the evidence satisfies both steps of the mechanism logic, as GOD moves each mechanism variable and each mechanism variable subsequently moves GCI, so that these channels carry a substantial share of the overall effect of GOD on GCI rather than being merely correlated with the policy.
Table 5.
Mechanism test results.
7. Heterogeneity Analysis
We further examine heterogeneity in the effect of GOD on GCI along two dimensions: regional and firm-level.
7.1. Regional Heterogeneity
Table 6 reports the results for regional heterogeneity. In terms of city size, the innovation-promoting effect of GOD is significantly stronger in large cities than in small and medium-sized cities, suggesting that large cities, with their more developed digital infrastructure, denser concentration of innovators, and richer human capital, can absorb and utilize GOD more fully and thereby promote GCI more effectively. In terms of resource dependence, the policy effect is stronger in non-resource-based cities than in resource-based cities, likely because non-resource-based cities rely more heavily on technological innovation and industrial upgrading for economic growth, creating a more pressing demand for data resources and a more active response to GOD. In terms of the north–south divide, the policy effect is significant in both southern and northern cities, yet the generally higher levels of digital economy development and marketization in southern cities provide a more favorable institutional environment for releasing the innovation effects of GOD.
Table 6.
Regression results for regional heterogeneity.
7.2. Firm-Level Heterogeneity
Table 7 reports the regression results for firm-level heterogeneity. In terms of ownership type, the policy effect for state-owned enterprises (SOEs) is significantly stronger than that for non-SOEs. This likely reflects the advantages SOEs have in resource acquisition, policy responsiveness, and social responsibility. SOEs have closer informational ties with the government, allowing them to use GOD more effectively. SOEs also bear greater obligations in green development and social responsibility, giving them stronger incentives to engage in GCI under policy guidance [25].
Table 7.
Regression results for firm-level heterogeneity.
In terms of factor intensity, the policy effect is most significant for capital-intensive firms and technology-intensive firms, while it is not significant for labor-intensive firms. Capital-intensive firms have greater financial capacity and technological reserves, enabling them to convert data resources into innovation inputs more effectively. Technology-intensive firms have a stronger demand for data-driven innovation and superior capabilities in data analysis and utilization, and therefore respond more actively to GOD. These patterns echo the dynamic-capability logic that firms richer in digital and financial resources convert open data into green innovation more effectively [32].
In terms of the firm life cycle, the policy effect is most pronounced for growth-stage firms and mature firms, while declining firms show no significant effect. Mature firms possess the richest innovation resources and the most stable collaborative networks, allowing them to make the fullest use of GOD to expand GCI. Growth-stage firms have the most pressing need for external information and resources, and GOD provides them with important informational support. Declining firms face substantial operational pressures, and their strategic focus tends to be on survival rather than innovation investment, resulting in an insufficient response to the innovation incentives of open data.
8. Discussion
8.1. General Discussion
The baseline regression results indicate that GOD increases the number of jointly filed green patents by approximately 1.419 per firm on average. This finding suggests that the open sharing of data factors is both a digital governance tool and an institutional mechanism that stimulates green innovation among micro-level agents. From the perspective of the economic properties of data factors, the non-rival and non-excludable characteristics of government data [5] allow its open sharing to benefit multiple innovators simultaneously without increasing marginal costs. This zero-marginal-cost knowledge diffusion effect is the economic logic of how GOD promotes collaborative innovation.
The core findings complement recent studies on the micro-level economic effects of GOD. Existing research has confirmed that GOD can significantly increase firm value [6], reduce corporate cash holdings [8], and promote firm innovation [7]. This paper further reveals the causal effect of GOD on GCI as a specific form of innovation, extending the research perspective from general firm performance and innovation activity to multi-agent cooperative innovation in the green technology domain. Although existing studies on the green effects of GOD have examined overall levels of corporate green innovation [10], they have not yet explored the specific dimension of collaborative innovation. This paper identifies the incentive effect of open data on inter-firm green technology cooperation, a finding that corroborates recent evidence on the role of corporate digital capabilities in promoting GCI [11].
Regarding mechanism pathways, the finding on the information asymmetry channel is consistent with prior research showing that GOD reduces transaction costs and coordination costs among firms by breaking down information barriers [9,13]. The finding on the government subsidies channel supplements existing research on how government subsidies promote green innovation [26], revealing how GOD improves the precision of fiscal resource allocation. Prior studies have emphasized that the promotion of green innovation through digital transformation requires time accumulation and capacity building [40], and the findings of this paper are complementary to that line of research.
The heterogeneity analysis reveals a significantly negative policy effect in small and medium-sized cities, a counterintuitive result that may reflect a resource crowding-out effect of GOD in these cities. Small and medium-sized cities have relatively weak digital infrastructure and a shortage of specialized talent, limiting firms’ ability to use open data. Meanwhile, the construction of GOD platforms may divert already scarce public resources, generating a short-term negative shock to innovation activities. This finding alerts policymakers that the effectiveness of open data policies depends heavily on supporting infrastructure and human capital conditions, and that indiscriminate promotion may prove counterproductive. We interpret this negative coefficient with caution. Rather than evidence that data openness actively dismantles existing green collaborative networks, we read it as a major regional barrier in the policy rollout: in fiscally and technically constrained small and medium-sized cities, the upfront construction of data platforms can temporarily divert scarce administrative and innovation resources before complementary digital infrastructure and human capital are in place. Because we do not observe direct municipal budget reallocation data, we frame this crowding-out as a plausible boundary condition and a limitation of the early-stage rollout rather than a fully validated causal mechanism, and we leave its rigorous validation with finer fiscal data to future research.
The result that labor-intensive firms and declining firms fail to benefit from GOD also warrants attention. Labor-intensive firms have weaker technological absorptive capacity, and their production models rely less on data resources, so the informational dividends of GOD are difficult to translate into actual inputs for GCI. Declining firms face severe survival pressures, and their strategic focus lies in maintaining operations rather than exploring new collaborative innovation opportunities. This finding partly confirms the proposition in firm life cycle theory that declining firms lack innovation momentum. These insignificant results do not weaken the conclusions of this paper; rather, they provide important information for understanding the boundary conditions of the policy effect. The innovation-promoting effect of open data is not a one-size-fits-all universal benefit but instead exhibits clear conditional dependencies. Theoretically, these null results delineate the scope conditions of our argument rather than weakening it. The proposed mechanism operates through firms’ absorptive capacity and their strategic orientation toward growth; where either is absent, as in labor-intensive firms with limited data-processing capability or declining firms preoccupied with survival, the causal chain from open data to collaborative green innovation breaks down at the firm’s internal conversion stage. This is consistent with the resource-based and firm life-cycle perspectives and implies that complementary capability-building, not data access alone, is the binding constraint for these firms.
8.2. Practical Implications
This paper has several practical implications.
First, GOD should be expanded in both breadth and depth. Local governments at all levels should, on the premise of ensuring data security, further broaden the scope and coverage of data openness, especially data on environmental protection, industrial development, and technological innovation. Data quality and standardization also matter: unified formats and interface standards would lower the technical barriers for firms.
Second, the supporting policy framework for data openness should be improved. The government should integrate data openness with innovation incentive policies such as fiscal subsidies and tax preferences to create a support system combining data, funding, and policy. The government should also increase financial support for GCI projects to help firms convert data resources into green innovation outcomes.
Third, differentiated data openness strategies should be adopted. Given that policy effects vary significantly across regions and firm types, policymakers should tailor their GOD strategies to local development stages and firm characteristics. For small and medium-sized cities and resource-based cities, priority should be given to strengthening digital infrastructure and providing data application training to improve their capacity to use open data. For non-state-owned enterprises, labor-intensive firms, and declining firms, more targeted data services and technical support should be offered to help them overcome capability bottlenecks in data utilization. More concretely, the heterogeneity results should guide how this differentiation is sequenced. Because the innovation-promoting effect is robust and economically meaningful in large cities yet reverses to a significantly negative effect in small and medium-sized cities, open data policy cannot be rolled out uniformly and be expected to work everywhere. For less developed regions, three preconditions should be put in place before, or alongside, platform construction for the policy to become effective. First, digital infrastructure and data-governance capacity should be financed through dedicated fiscal transfers from higher levels of government, so that platform construction does not crowd out the scarce administrative and innovation resources whose diversion drives the observed negative effect in these cities. Second, targeted talent cultivation and data-application training should raise local firms’ absorptive capacity, since the heterogeneity and firm life-cycle results show that the gains from open data materialize only where firms can actually process and recombine the data. Third, the rollout in these regions should be phased and paired with measurable data-quality and interoperability standards, prioritizing high-value environmental and industrial datasets over sheer breadth of coverage, so that limited local capacity is concentrated where the marginal return to collaborative green innovation is highest. Only when these complementary conditions are met can open data policy be expected to shift from neutral or counterproductive to growth-enhancing in the regions that currently benefit least.
Fourth, a data-driven ecosystem for GCI should be developed. Governments should build green technology cooperation platforms based on open data to facilitate data sharing and technical collaboration among industry-university-research partners. Firms should be encouraged to use GOD for cross-regional and cross-industry joint research on green technologies, promoting a green innovation ecosystem with diverse participants. At the same time, greater public disclosure of environmental information should be pursued to strengthen the market pressure that public environmental awareness exerts on corporate green innovation.
8.3. Limitations and Future Directions
This study has several limitations. Regarding internal validity, this study employs a staggered difference-in-differences (DID) approach and confirms the reliability of core findings through multiple robustness checks. However, the implementation of GOD policies is not entirely exogenous. The timing of data openness at the local level may correlate with regional economic development, technological capacity, and political factors, and this non-random policy rollout poses a potential threat to causal identification. While the parallel trends test and placebo test results partly alleviate this concern, omitted variable bias remains possible. Future research could seek more exogenous instrumental variables or apply alternative causal identification strategies such as regression discontinuity design for cross-validation. Regarding external validity, listed firms are relatively large and subject to more comprehensive disclosure requirements, so their responses to GOD may differ from those of small and medium-sized enterprises (SMEs) and unlisted firms. Given the important role of SMEs in green innovation and the more severe information asymmetry they face, the effect of GOD on GCI among SMEs warrants investigation in future research. A further limitation concerns the temporal scope of the sample. The window ends in 2019 to avoid the confounding disruption of COVID-19 on joint R&D, but this means the analysis captures a relatively early stage of GOD construction in China. More mature data ecosystems that developed after 2019, with richer datasets, higher data quality, and more sophisticated corporate data-use capabilities, may produce effects that differ in magnitude, or even in kind, from those documented here. Our estimates should therefore be read as evidence from the formative period of open data policy.
Future research can also extend the present study in several directions. First, scholars could examine how the type, quality, and depth of GOD differentially affect GCI, identifying which categories of government data are most valuable for green innovation. Second, social network analysis methods [12] could be used to map how GOD reshapes the network structure of inter-firm GCI, and to assess the role of network effects in the innovation-promoting impact of data openness. Third, the research perspective could be broadened to international comparisons, examining how GOD affects GCI under different institutional environments and providing cross-country empirical evidence for global data governance.
9. Conclusions
Using a sample of Chinese A-share listed firms from 2010 to 2019, this paper exploits the staggered rollout of GOD across prefecture-level cities as a quasi-natural experiment and constructs a staggered difference-in-differences (DID) model to systematically examine the effect of GOD on GCI and the underlying mechanisms. The main findings follow. First, GOD significantly promotes GCI. The baseline regression results show that GOD increases joint green patent applications by approximately 1.419 on average, indicating a causal effect on GCI. Second, the mechanism analysis reveals four transmission channels through which GOD promotes GCI. GOD provides financial support for GCI by increasing government subsidies, creates a favorable information environment for partner search and project evaluation by reducing information asymmetry, generates market demand pull for green technology products by raising public environmental awareness, and strengthens firms’ technical and organizational capacity for collaborative innovation by advancing corporate digital transformation. Third, the heterogeneity analysis shows that the innovation-promoting effect of GOD is significantly context-dependent. At the regional level, policy effects are stronger in large cities, non-resource-based cities, and southern cities, reflecting the role of digital infrastructure, innovation ecosystems, and market orientation. At the firm level, state-owned enterprises (SOEs), capital-intensive firms, and mature firms respond more actively, suggesting that resource endowments, technological capacity, and development stage moderate how firms use GOD for GCI.
Funding
This research was funded by the Xinyang City Soft Science Research Project (No. 20250002) and Henan Province Soft Science Research Project (No. 262400411116).
Data Availability Statement
Data will be made available on request.
Conflicts of Interest
The author declares no conflicts of interest.
Abbreviations
| GOD | Government Open Data |
| GCI | Green Collaborative Innovation |
| DID | Difference-in-Differences |
| SOE | State-Owned Enterprise |
| ESG | Environmental, Social, and Governance |
| PSM | Propensity Score Matching |
References
- Chesbrough, H.W. Open Innovation: The New Imperative for Creating and Profiting from Technology; Harvard Business School Press: Boston, MA, USA, 2003. [Google Scholar]
- Belderbos, R.; Carree, M.; Lokshin, B. Cooperative R&D and Firm Performance. Res. Policy 2004, 33, 1477–1492. [Google Scholar] [CrossRef] [Scilit]
- Akerlof, G.A. The Market for “Lemons”: Quality Uncertainty and the Market Mechanism. Q. J. Econ. 1970, 84, 488–500. [Google Scholar] [CrossRef] [Scilit]
- Stiglitz, J.E. The Contributions of the Economics of Information to Twentieth Century Economics. Q. J. Econ. 2000, 115, 1441–1478. [Google Scholar] [CrossRef] [Scilit]
- Jones, C.I.; Tonetti, C. Nonrivalry and the Economics of Data. Am. Econ. Rev. 2020, 110, 2819–2858. [Google Scholar] [CrossRef] [Scilit]
- Lan, F.; Lan, S.; Gong, Y. Open Government Data and Firm Value: A Quasi-Natural Experiment from China. Account. Financ. 2025, 65, 2281–2305. [Google Scholar] [CrossRef] [Scilit]
- Zheng, T.; Pan, H.; Gu, X. Open Government Data and Enterprise Innovation: Evidence from China. Appl. Econ. 2025, 1–15. [Google Scholar] [CrossRef] [Scilit]
- Liu, H.L.; Xie, J.; Yang, Y.N. Government Data Opening and Corporate Cash Holdings: Evidence from a Quasi-Natural Experiment in China. Econ. Anal. Policy 2024, 84, 1394–1414. [Google Scholar] [CrossRef] [Scilit]
- Chen, K.; Zhang, S. How Does Open Public Data Impact Enterprise Digital Transformation? Econ. Anal. Policy 2024, 83, 178–190. [Google Scholar] [CrossRef] [Scilit]
- Wang, J.; Chen, Y.; Luo, Q. Does Government Data Openness Have a Green Effect? An Examination from the Perspective of Green Innovation. Front. Environ. Sci. 2025, 13, 1530892. [Google Scholar] [CrossRef] [Scilit]
- Xie, X.M.; Wang, M.G. Firms’ Digital Capabilities and Green Collaborative Innovation: The Role of Green Relationship Learning. J. Innov. Knowl. 2025, 10, 100663. [Google Scholar] [CrossRef] [Scilit]
- Di, K.; Xu, R.; Liu, Z.; Liu, R. How Do Enterprises’ Green Collaborative Innovation Network Locations Affect Their Green Total Factor Productivity? Empirical Analysis Based on Social Network Analysis. J. Clean. Prod. 2024, 438, 140766. [Google Scholar] [CrossRef] [Scilit]
- Wu, D.S.; Xie, Y. Unveiling the Impact of Public Data Access on Collaborative Reduction of Pollutants and Carbon Emissions: Evidence from Open Government Data Policy. Energy Econ. 2024, 138, 107822. [Google Scholar] [CrossRef] [Scilit]
- Janssen, M.; Charalabidis, Y.; Zuiderwijk, A. Benefits, Adoption Barriers and Myths of Open Data and Open Government. Inf. Syst. Manag. 2012, 29, 258–268. [Google Scholar] [CrossRef] [Scilit]
- Zuiderwijk, A.; Janssen, M. Open Data Policies, Their Implementation and Impact: A Framework for Comparison. Gov. Inf. Q. 2014, 31, 17–29. [Google Scholar] [CrossRef] [Scilit]
- Attard, J.; Orlandi, F.; Scerri, S.; Auer, S. A Systematic Review of Open Government Data Initiatives. Gov. Inf. Q. 2015, 32, 399–418. [Google Scholar] [CrossRef] [Scilit]
- Jetzek, T.; Avital, M.; Bjorn-Andersen, N. Data-Driven Innovation through Open Government Data. J. Theor. Appl. Electron. Commer. Res. 2014, 9, 100–120. [Google Scholar] [CrossRef] [Scilit]
- Verhulst, S.G.; Young, A. Open Data in Developing Economies: Toward Building an Evidence Base on What Works and How; The GovLab: New York, NY, USA, 2017. [Google Scholar]
- Xu, X.; Li, J. Can Open Government Data Drive Corporate ESG Performance? Evidence from Chinese Listed Companies. Financ. Res. Lett. 2023, 58, 104553. [Google Scholar]
- Hagedoorn, J. Inter-Firm R&D Partnerships: An Overview of Major Trends and Patterns Since 1960. Res. Policy 2002, 31, 477–492. [Google Scholar] [CrossRef] [Scilit]
- Porter, M.E.; van der Linde, C. Toward a New Conception of the Environment-Competitiveness Relationship. J. Econ. Perspect. 1995, 9, 97–118. [Google Scholar] [CrossRef] [Scilit]
- Horbach, J.; Rammer, C.; Rennings, K. Determinants of Eco-Innovations by Type of Environmental Impact—The Role of Regulatory Push/Pull, Technology Push and Market Pull. Ecol. Econ. 2012, 78, 112–122. [Google Scholar] [CrossRef] [Scilit]
- Cai, X.; Zhu, B.; Zhang, H.; Li, L.; Xie, M. Can Direct Environmental Regulation Promote Green Technology Innovation in Heavily Polluting Industries? Evidence from Chinese Listed Companies. Sci. Total Environ. 2020, 746, 140810. [Google Scholar] [CrossRef] [Scilit] [PubMed]
- Li, J.; Chen, L.; Chen, Y.; He, J. Digital Economy, Technological Innovation, and Green Economic Efficiency—Empirical Evidence from 277 Cities in China. Manag. Decis. Econ. 2022, 43, 616–629. [Google Scholar]
- Wang, H.; Cui, H.R.; Zhao, Q.Z. Effect of Green Technology Innovation on Green Total Factor Productivity in China: Evidence from Spatial Durbin Model Analysis. J. Clean. Prod. 2022, 334, 130150. [Google Scholar]
- Hao, X.; Li, Y.; Ren, S.; Wu, H.; Hao, Y. The Role of Digitalization on Green Economic Growth: Does Industrial Structure Optimization and Green Innovation Matter? J. Environ. Manag. 2023, 325, 116504. [Google Scholar] [CrossRef] [Scilit]
- Yu, E.P.; Guo, C.Q.; Luu, B.V. Environmental, Social and Governance Transparency and Firm Value. Bus. Strategy Environ. 2022, 27, 987–1004. [Google Scholar]
- Miotti, L.; Sachwald, F. Co-Operative R&D: Why and with Whom? An Integrated Framework of Analysis. Res. Policy 2003, 32, 1481–1499. [Google Scholar] [CrossRef] [Scilit]
- Nambisan, S.; Wright, M.; Feldman, M. The Digital Transformation of Innovation and Entrepreneurship: Progress, Challenges and Key Themes. Res. Policy 2019, 48, 103773. [Google Scholar] [CrossRef] [Scilit]
- Lee, C.C.; He, Z.W.; Yuan, Z. A Pathway to Sustainable Development: Digitization and Green Productivity. Energy Econ. 2022, 124, 106772. [Google Scholar]
- Luo, H.L.; Chen, L.S.; Xu, X. How the Disclosure of Government Public Data Stimulates Corporate Green Transitions. Int. Rev. Econ. Financ. 2025, 103, 104448. [Google Scholar] [CrossRef] [Scilit]
- Alkaraan, F.; Elmarzouky, M.; Hussainey, K.; Venkatesh, V.G.; Shi, Y.; Gulko, N. Reinforcing Green Business Strategies with Industry 4.0 and Governance towards Sustainability: Natural-Resource-Based View and Dynamic Capability. Bus. Strategy Environ. 2024, 33, 3588–3606. [Google Scholar] [CrossRef] [Scilit]
- Zhou, M.; Wang, Y.; Jiang, H.; Li, M.; Li, G. Can Open Government Data Policy Improve Firm Performance? Evidence from Listed Firms in China. Manag. Decis. Econ. 2023, 44, 2593–2603. [Google Scholar] [CrossRef] [Scilit]
- Goldfarb, A.; Tucker, C. Digital Economics. J. Econ. Lit. 2019, 57, 3–43. [Google Scholar] [CrossRef] [Scilit]
- Kahn, M.E.; Kotchen, M.J. Business Cycle Effects on Concern about Climate Change: The Chilling Effect of Recession. Clim. Change Econ. 2011, 2, 257–273. [Google Scholar] [CrossRef] [Scilit]
- Mintah, E.O.; Elmarzouky, M.; Shohaieb, D. Examining Airlines’ Environmental and Social Disclosure: Does Board Gender Diversity Matter? Bus. Strategy Environ. 2026, 35, 1–17. [Google Scholar]
- Goodman-Bacon, A. Difference-in-Differences with Variation in Treatment Timing. J. Econom. 2021, 225, 254–277. [Google Scholar] [CrossRef] [Scilit]
- de Chaisemartin, C.; D’Haultfoeuille, X. Two-Way Fixed Effects Estimators with Heterogeneous Treatment Effects. Am. Econ. Rev. 2020, 110, 2964–2996. [Google Scholar] [CrossRef] [Scilit]
- Yu, W.; Wang, C.; Jin, X. Political Connections and Financing Constraints: Information Effects and Resource Effects. Econ. Res. J. 2012, 9, 125–139. (In Chinese) [Google Scholar]
- Sun, Z.; Zhao, L.; Mehrotra, A.; Salam, M.A.; Yaqub, M.Z. Digital Transformation and Corporate Green Innovation: An Affordance Theory Perspective. Bus. Strategy Environ. 2025, 34, 433–449. [Google Scholar]

Disclaimer/Publisher’s Note: The statements, opinions and data contained in all publications are solely those of the individual author(s) and contributor(s) and not of MDPI and/or the editor(s). MDPI and/or the editor(s) disclaim responsibility for any injury to people or property resulting from any ideas, methods, instructions or products referred to in the content. |
© 2026 by the author. Licensee MDPI, Basel, Switzerland. This article is an open access article distributed under the terms and conditions of the Creative Commons Attribution (CC BY) license.