


Abstract
Surface water-groundwater interaction zones are critical ecohydrological interfaces in arid regions, yet quantitative spatiotemporal patterns and soil-vegetation responses under coupled water-salt-heat gradients remain poorly documented. Based on a one-year monitoring period (August 2024–August 2025) at four sites along a river-to-desert transect (LW3: 25 m, LW2: 200 m, LW1: 300 m, LW4: 400 m from the Niya River) in the hyper-arid Tarim Basin, this study reveals the following quantitative patterns. Groundwater depth increased with distance from the river and followed an annual decrease-increase trend, with an anomalous shallow peak in March 2025 (−20 cm) linked to precipitation recharge. Soil temperature stability increased with depth: the 20 cm layer recorded the widest annual fluctuation (e.g., −1.5 °C to 24 °C at LW1), whereas the 80 cm layer varied only between approximately −0.2 °C and 28 °C. Proximity to the river dampened thermal extremes. Shallow soil moisture was highly dynamic (with a coefficient of variation [CV] reaching 40–50% at LW1 and LW4), while deeper layers remained stable; LW3 near the river stayed saturated year-round (CV = 0). Soil electrical conductivity (EC) decreased with distance from the river: LW3 exhibited the highest surface values (5000–16,000 μS cm−1), whereas LW1 recorded the lowest (1000–2700 μS cm−1). Vegetation performance was governed by coupled water-salt conditions rather than moisture alone: P. australis at LW1 achieved the tallest growth (>200 cm) and highest photosynthetic rates (20.25–37.38 μmol m−2 s−1), outperforming LW3 (104 cm, winter photosynthesis dropping to 2.01) and LW4 (~100 cm). Correlation analysis further showed strong vertical temperature coupling (r > 0.96 across all depths) and depth-stratified water-salt relationships (e.g., EC-volumetric water content r = 0.95 at 20 cm in LW4), reflecting spatial differentiation driven by freeze-thaw cycles, evaporative enrichment, and homogeneous silt-textured soils (54–96% fine fraction). These quantitative findings provide a detailed observational baseline for riparian ecohydrology in hyper-arid inland rivers and underscore that sustainable vegetation management requires balancing water availability against salinity stress.
1. Introduction
The surface water-groundwater interaction zone is a key hydrological interface linking rivers with underground aquifers and serves as a core hub for matter cycling and energy exchange in terrestrial ecosystems. This interaction zone forms a unique eco-hydrological gradient through a sequence of complex processes such as water exchange, solute transport, and heat conduction, playing an indispensable role in sustaining watershed water resource use, protecting biodiversity, and ensuring ecosystem service functions [1,2,3]. In recent years, with the increasing frequency of extreme climate events and intensified human activities, the hydrological connectivity and ecological functions of the surface water-groundwater interaction zone have faced severe challenges. Globally, surface water-groundwater interaction zones in arid and semiarid regions are generally under dual pressure from climate change and human activities. Studies in Nevada, USA, show that nearly 40% of monitoring wells exhibit significant groundwater level declines, and climate change will further exacerbate drought stress and threaten the stability of groundwater-dependent ecosystems [4]. Global-scale assessments indicate that more than 53% of groundwater-dependent ecosystems in arid regions occur in areas with declining groundwater reserves, with Asia, Europe, and North America being particularly prominent [5]. In the San Pedro River in Arizona, groundwater decline has led to pronounced desertification succession of riparian vegetation, with wetland indicator species coverage sharply decreasing when groundwater levels exceed 0.25 m [6]. Four decades of monitoring in the Essaouira Basin in Morocco reveal that groundwater levels in semiarid zones continue to fall by up to 8 m, and water quality has shifted from the Na-Cl type to the Ca-Mg-Cl type [7]. These findings indicate that the hydrogeochemical connectivity and ecological function degradation of surface water-groundwater interaction zones in global arid regions are widespread.
Water, soil, and vegetation are important components of the Earth system [8]. The dynamic coupling and interactions within the soil-vegetation-hydrology system are profoundly influenced by human activities such as agricultural cultivation and mineral resource development. Improper land-use practices readily lead to soil quality degradation and vegetation community decline, which in turn have significant negative impacts on the stability of regional agricultural production and the health of the ecological environment [9,10,11]. At the same time, human disturbances can alter the natural hydrological cycle of a watershed, causing noticeable changes in the temporal and spatial evolution of key hydrological elements such as evapotranspiration and runoff [12,13,14,15].
As the largest inland river basin in China, the Tarim River Basin’s lower reaches and the small rivers along its southern margin (including the Niya River, the Keriya River, and the Cherchen River) constitute an important ecological barrier on the southern edge of the Taklamakan Desert. This region is characterized by a typical temperate continental hyper-arid climate, with an average annual precipitation of less than 50 mm, whereas potential evapotranspiration exceeds 2756 mm. Water scarcity has therefore become the primary bottleneck constraining the sustainable development of the ecosystem [16]. As an important zone for the storage and transformation of limited water resources in arid regions, the surface water-groundwater interaction zone plays a decisive role in maintaining regional ecological security [17,18]. However, hydrological processes in arid-zone ecotones exhibit pronounced spatiotemporal heterogeneity: seasonal fluctuations in groundwater levels not only alter soil water availability, but also indirectly regulate vegetation nutrient uptake efficiency by affecting the soil redox environment [19]. Meanwhile, the coupled transport of soil water and salts forms a complex gradient of ecological stress, profoundly influencing the distribution patterns and successional trajectories of vegetation communities [20]. In observational studies of the middle and lower reaches of the Tarim River, Hao et al. (2010) used detrended canonical correspondence analysis (DCCA) to identify the optimal groundwater depth for vegetation growth in desert riparian forests as 2–4 m, with an ecological threshold of approximately 6 m; when the groundwater depth exceeds 8 m, vegetation undergoes marked degradation [21]. This conclusion is consistent with the findings of Sousa et al. (2022) in the Amazon Basin, who showed that groundwater table depth (WTD) can significantly affect forest biomass productivity and community dynamics by regulating soil water availability [22]. In shallow water table environments (<2 m), plants are prone to hypoxic stress and have relatively weak root anchorage, thereby exhibiting higher mortality and lower productivity [22].
The response patterns of vegetation to water and salt stress involve complex physiological and ecological processes. Plant responses to salt stress can be divided into two stages: a rapid osmotic stress stage that inhibits the growth of young leaves, and a slower ionic stress stage that accelerates the senescence of mature leaves [23]. In the Yangguan Wetland of Dunhuang, P. australis can adapt to gradient changes in environmental factors such as soil moisture by adjusting the spatial expansion strategy of clonal modules, including morphological traits such as internode length and branching angle, as well as the spatial distribution pattern of the population, while simultaneously regulating the allocation characteristics of non-structural carbohydrates (NSC) [24]. Moreover, moderate salt stress can promote the accumulation of photosynthates in P. australis through osmotic regulation, whereas the combined effects of water and salt stress significantly inhibit its ramet number and clonal growth [25,26]. These studies indicate that an in-depth analysis of the spatiotemporal heterogeneity of water and soil environmental factors in the interaction zone, as well as their synergistic relationship effects on Phragmites growth, is crucial for understanding the patterns underlying the maintenance of ecosystem stability in extreme arid regions. These studies highlight that clarifying the spatiotemporal heterogeneity of soil-water environmental factors and their synergistic effects on P. australis growth is essential for revealing ecosystem stability maintenance patterns in extreme arid regions.
So far, a variety of modeling approaches have been employed to assess the soil water-salt thermal dynamics in arid regions. Physics-based models (such as HYDRUS-1D/2D/3D) have been widely used to simulate the coupled transport of water, heat, and solutes in unsaturated media [27]. For the shallow groundwater basins of arid regions, improved tools for soil and water resources assessment (SWAT), including M-SWAT and SWAT-Salt, have been developed to mechanistically simulate soil water-salt transport and its interactions with shallow groundwater [28,29]. For cold, arid regions undergoing freeze-thaw cycles, the SHAW (heat and water) model has also been improved to enhance the simulation of water-heat-salt dynamics [30]. These modeling efforts help deepen understanding of water-salt transport processes, irrigation management, and the interactions between vegetation and groundwater. However, most existing studies rely on simplified basin-scale models of the vertical soil profile or discrete sampling at limited depths and spacings. Consequently, the synchronous, high-frequency co-evolution of water, salt, and temperature across different soil depths and their layered coupling patterns has not been fully captured. This study employs a novel multi-sensor, multi-depth (20–80 cm) continuous monitoring technique to observe soil moisture, salinity, and temperature over an annual cycle. The design uniquely reveals the coupling relationships among water, salt, and heat across depths, as well as vegetation responses, which single-layer or discrete sampling cannot achieve, providing a vertical-resolution foundation for ecohydrological research in arid riparian zones.
Against this background, this study focuses on the typical surface water-groundwater interaction zone in the Niya River Basin, an arid inland river in the southern Tarim Basin. By monitoring groundwater dynamics, soil-water-salt-temperature conditions, and P. australis growth-physiological traits along a river-to-desert gradient, the objectives of this study are: (1) to describe the spatiotemporal variations in groundwater, soil water, salt, and temperature in the interaction zone; (2) to reveal the response patterns of soil properties and vegetation under hydrological gradients; and (3) to explore the observed coupling relationships of soil water-salt-heat and their associated characteristics with vegetation growth.
This study is designed as a site-specific observational gradient analysis rather than a study intended to derive generalizable patterns across arid regions. The results provide a scientific basis for ecological conservation, water resource management, and vegetation restoration in arid inland river surface water-groundwater interaction zones.
2. Materials and Methods
2.1. Study Area
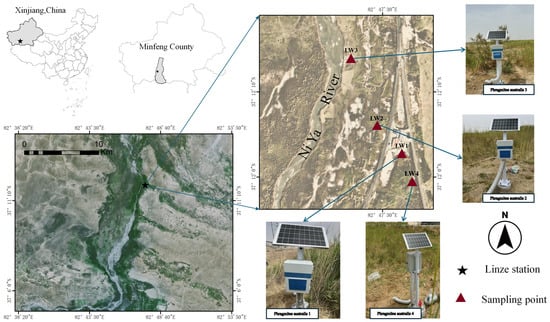
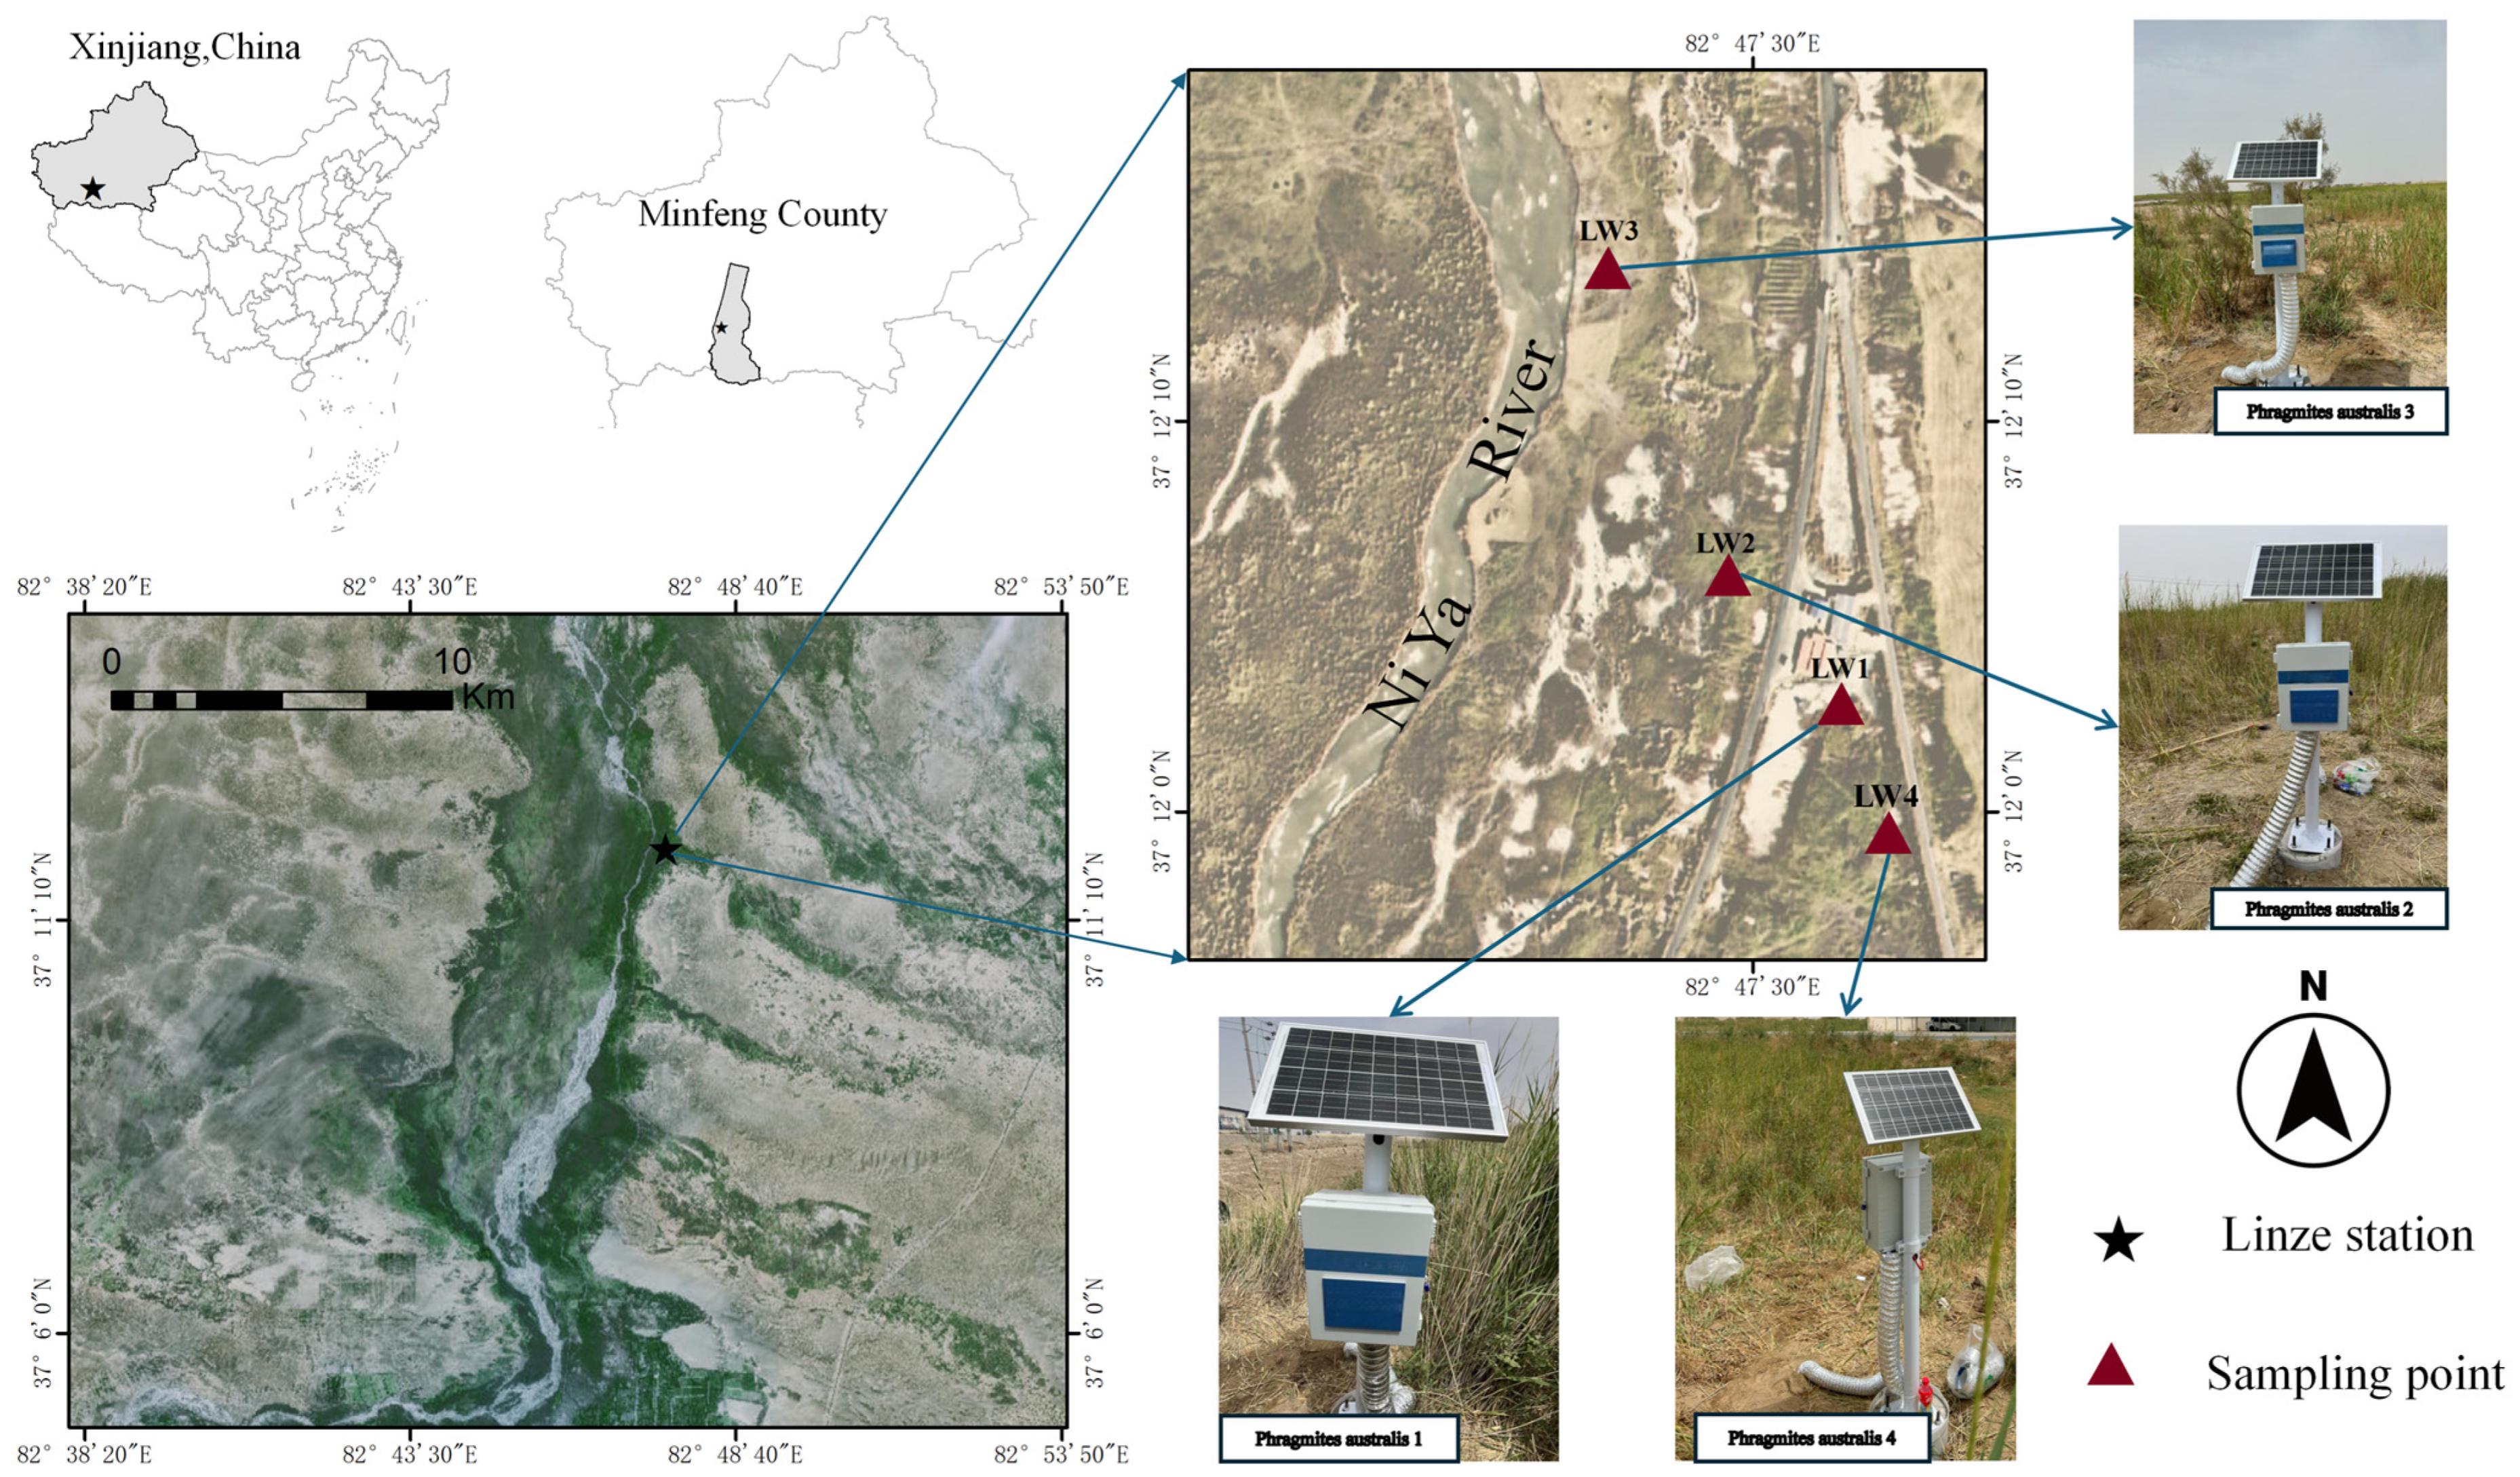
This study was conducted in the Niya River Basin of Minfeng County, Hotan Prefecture, Xinjiang Uygur Autonomous Region (37° N–38° N, 82° E–84° E), located on the southern margin of the Taklamakan Desert at an elevation of approximately 1400 m. This region has a temperate continental arid climate, with an annual mean precipitation of approximately 30 mm, an annual mean temperature of 10.5 °C, an annual mean wind speed of 1.2 m s−1, and an annual evaporation of about 2756 mm. Natural vegetation predominates along the Niya River Basin, and the main vegetation type is common reed (P. australis), representing the transition from the river to the desert. As shown in Figure 1, LW3 is the closest to the river, located 25 m from the river on the floodplain; LW2 is located 200 m from the river in the near-river oasis zone; LW1 is located 300 m from the river in the near-river oasis zone; and LW4 is located 400 m from the river at the edge of the transition from the near-river oasis zone to the desert.
Figure 1.
Location of the study area.
2.2. Sampling and Monitoring
The Niya River is a seasonal river, and the surface water-groundwater interaction pattern varies across hydrological periods. Surface water recharges groundwater in the wet season, while groundwater feeds surface water in the dry season. The Niya River was selected as the study site because it encapsulates the defining hydrogeological characteristics of hyper-arid inland rivers on the southern margin of the Tarim Basin, while offering distinct advantages for observing surface water-groundwater interactions. Compared with other rivers in the Tarim Basin—such as the Keriya River, Cherchen River, or the mainstream Tarim River—the Niya River exhibits a naturally preserved river-to-desert transect with minimal anthropogenic disturbance (e.g., no large-scale irrigation diversions or reservoir regulation along the studied reach). This allows for a clearer signal of climate- and hydrology-driven soil-vegetation responses. Furthermore, the Niya River features sharp lateral environmental gradients over a short distance (0–400 m from the river): groundwater depth increases rapidly, soil texture transitions subtly but consistently (dominated by silt), and vegetation shifts from near-river dense reed stands to desert edge sparse coverage. Such compressed yet continuous gradients make it possible to capture coupled water-salt-heat dynamics with a feasible number of monitoring sites. In contrast, the mainstream Tarim River is heavily influenced by intermittent ecological water transfers and complex irrigation return flows, which obscure natural interaction patterns. The Keriya and Cherchen Rivers, while also arid, have less pronounced vertical soil profile homogeneity and experience more sporadic surface flow, reducing the ability to isolate groundwater-soil-vegetation feedbacks. Therefore, the Niya River serves as an ideal natural laboratory for investigating spatiotemporal patterns of groundwater, soil water-salt-heat, and Phragmites australis responses in a typical surface water-groundwater interaction zone of a hyper-arid inland river system.
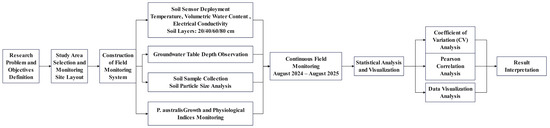
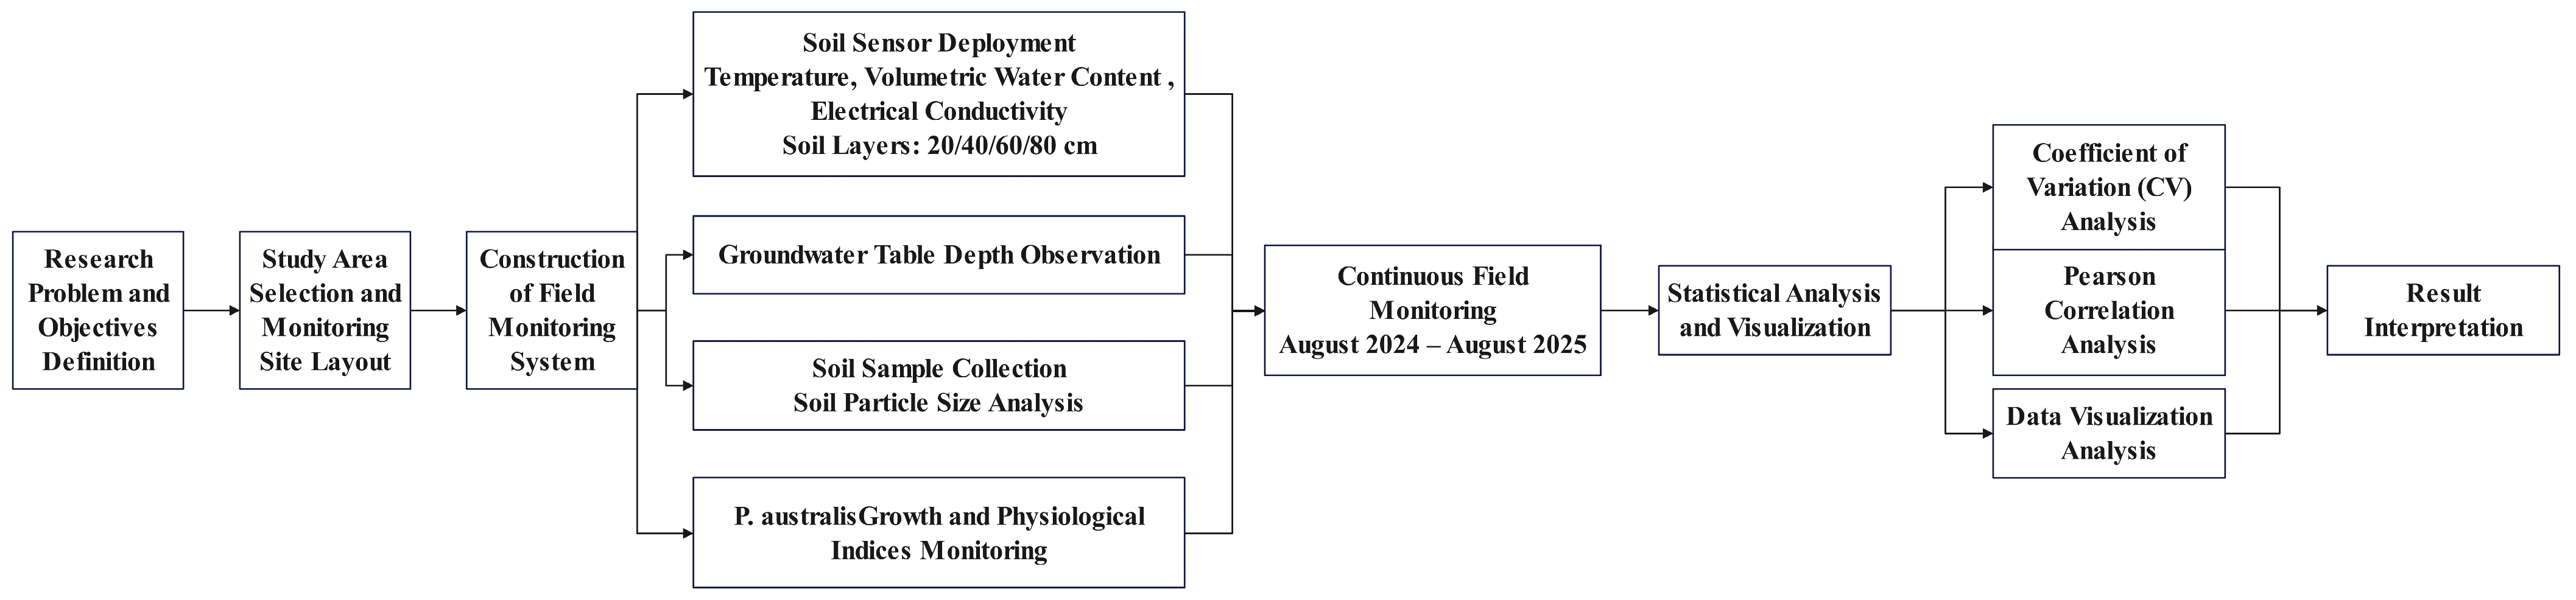
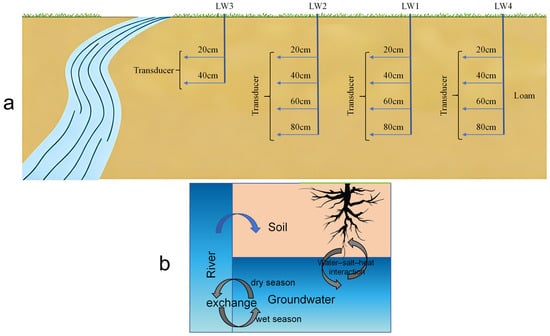
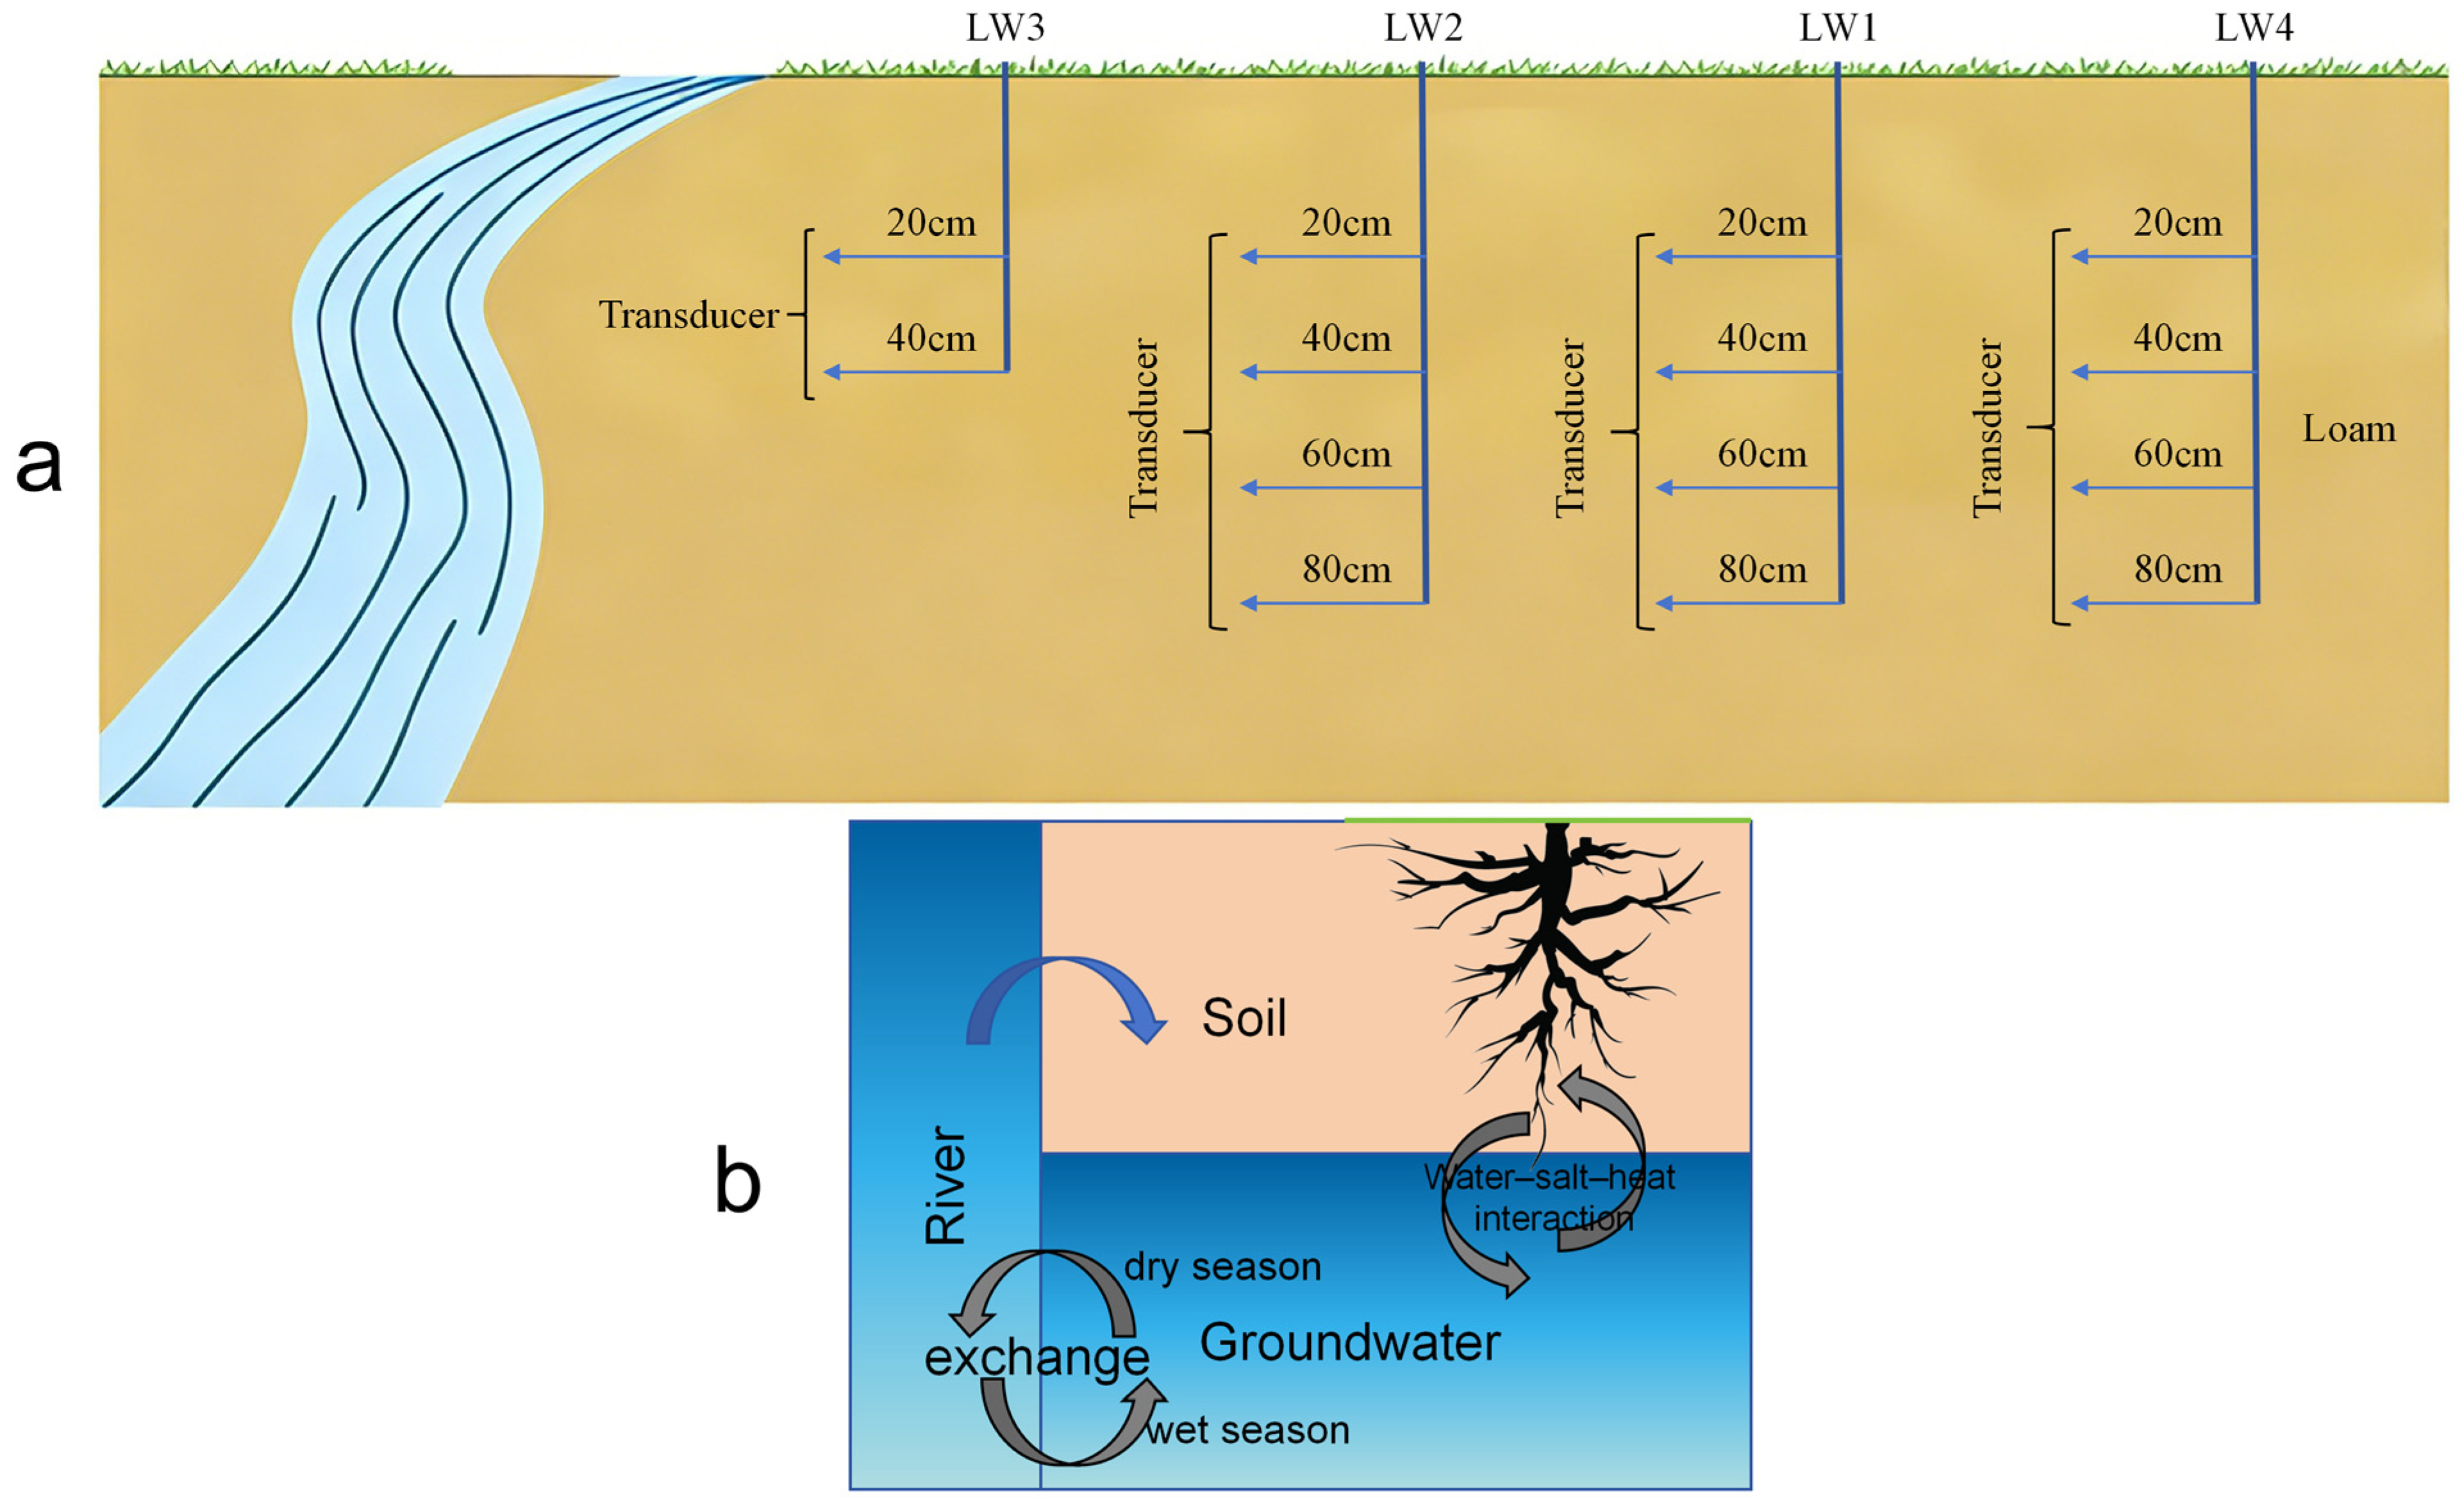
In the study area, a typical surface water-groundwater interaction zone exists where four sampling points (monitoring sites) were established (The technical roadmap is presented in Figure 2). This study aims to investigate the dynamic changes in soil, water, and vegetation within such an interaction zone. The area exhibits a pronounced vertical ecohydrological gradient, primarily governed by the exchange processes between surface water and groundwater. As illustrated in Figure 3b, the interaction between surface water and groundwater is persistent and varies over different periods. During this interaction, soil acts as an intermediate medium through which soil temperature, water content, and salinity also vary and migrate. Furthermore, vegetation influences the transport of water and salt, while water and salt migration, in turn, affects vegetation growth, thereby driving the soil-vegetation response within the interaction zone.
Figure 2.
Flowchart (This flowchart outlines the complete methodological workflow of the study, organized horizontally to clearly illustrate the sequential and parallel relationships between different phases. The process begins with defining the research problem and objectives, followed by study area selection and the layout of monitoring sites along a river-to-desert transect. A multi-component field monitoring system was then constructed, including soil sensors, groundwater wells, vegetation quadrats, and soil sampling, all of which fed into a one-year continuous monitoring campaign. Raw data were preprocessed to remove noise and ensure reliability, then analyzed through coefficient of variation, correlation analysis, and visualization to address each research objective. These analyses enabled the interpretation of groundwater dynamics, soil property variations, vegetation responses, and water-salt-heat coupling patterns. Finally, the results were discussed in the context of ecohydrological mechanisms, leading to the main conclusions. Each methodological step is logically connected, ensuring that the workflow directly answers the research questions and achieves the study goals).
Figure 3.
(a) Sensor placement depths at different sites along the soil profile; (b) Conceptual diagram of water, salt, and temperature interaction patterns among water, soil, and vegetation.
Since early August 2024, four representative sites were selected within 400 m of the river in the study area, establishing a typical cross-sectional network perpendicular to the river. Common reed (Phragmites australis) exhibits the highest vegetation coverage along the Niya River. Therefore, four representative reed growth locations were selected at different positions along the river-perpendicular transect. Soil moisture monitoring stations (equipped with soil moisture, temperature, and electrical conductivity sensors) were installed along soil profiles from 20 cm to 80 cm depth for long-term monitoring (as shown in Figure 1). These stations continuously collect large volumes of data; thus, data recorded at 12:00 noon each day were selected for subsequent analysis. During the installation of the soil moisture monitoring stations, soil moisture at a depth of 40 cm at site LW3 had already reached saturation; therefore, probes were installed only at the 20 cm and 40 cm depths at this site. For sites LW1, LW2, and LW4, probes were installed at 20 cm intervals from 20 cm to 80 cm depth (as shown in Figure 3a). To investigate the influence of soil texture differences on observations at each monitoring site, particle-size distribution analysis was performed on soil samples collected from different sites. During sample collection and field investigation, it was found that the soils along the transect in the study area did not exhibit distinct horizon differentiation, and the overall soil structure was relatively homogeneous. The field vegetation growth monitoring experiment was primarily aimed at assessing the growth status of the surface ecosystem.
According to the Technical Specification for Ecological Environment Investigation and Observation in Nature Reserves (HJ 1311-2023) [31], quadrats were established for typical surface ecosystem vegetation (reed) in the Niya River Basin to monitor field vegetation growth and physiological indicators. For the reed quadrats at the four sites, four 1 × 1 m quadrats were established. A photosynthesis instrument (IN-GH2) was used to conduct long-term monitoring of vegetation physiological indicators. Fifteen representative plants were randomly selected within each quadrat to measure vegetation physiological parameters such as photosynthetic rate and respiration rate, and plant height was measured with a measuring tape. To ensure that the monitoring results were statistically meaningful, different plants within the quadrats were selected for repeated measurements. The monitoring frequency is shown in Table 1. Long-term groundwater observations primarily consisted of groundwater table monitoring, which was conducted simultaneously with field monitoring of vegetation growth indicators. Groundwater table monitoring was mainly obtained by manual drilling: a hand auger was used to drill vertically downward beside the vegetation quadrat to observe soil moisture conditions, and the groundwater table was determined based on the saturated soil state, and its depth was measured with a measuring tape.
Table 1.
Table of field vegetation and groundwater monitoring times and frequencies.
2.3. Data Analysis
In this study, Excel was used for preliminary data processing. SPSS v. 26 was employed to analyze the coefficient of variation (CV) and to perform correlation and regression analyses of soil temperature, moisture, and electrical conductivity. It should be emphasized that Pearson correlation and regression only reflect the degree of linear covariation between variables and cannot be used to infer causal relationships. Normality testing (Shapiro-Wilk), homoscedasticity testing, and temporal autocorrelation analyses were not conducted in this study. Therefore, the relevant analyses should be regarded as exploratory data analysis rather than strict statistical inference. Advanced multivariate analyses such as PCA, RDA, SEM, and PERMANOVA were not applied, which is a methodological limitation of this study. Origin 2021, Python 3.11, and Matplotlib 3.8 were used for plotting and visualization.
3. Results
3.1. Changes in Groundwater Level in a Typical Surface Water-Groundwater Interaction Zone
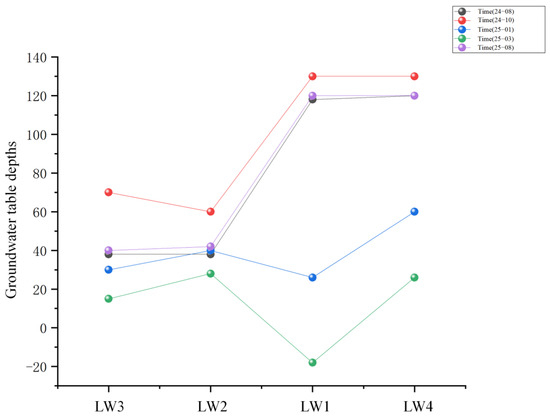
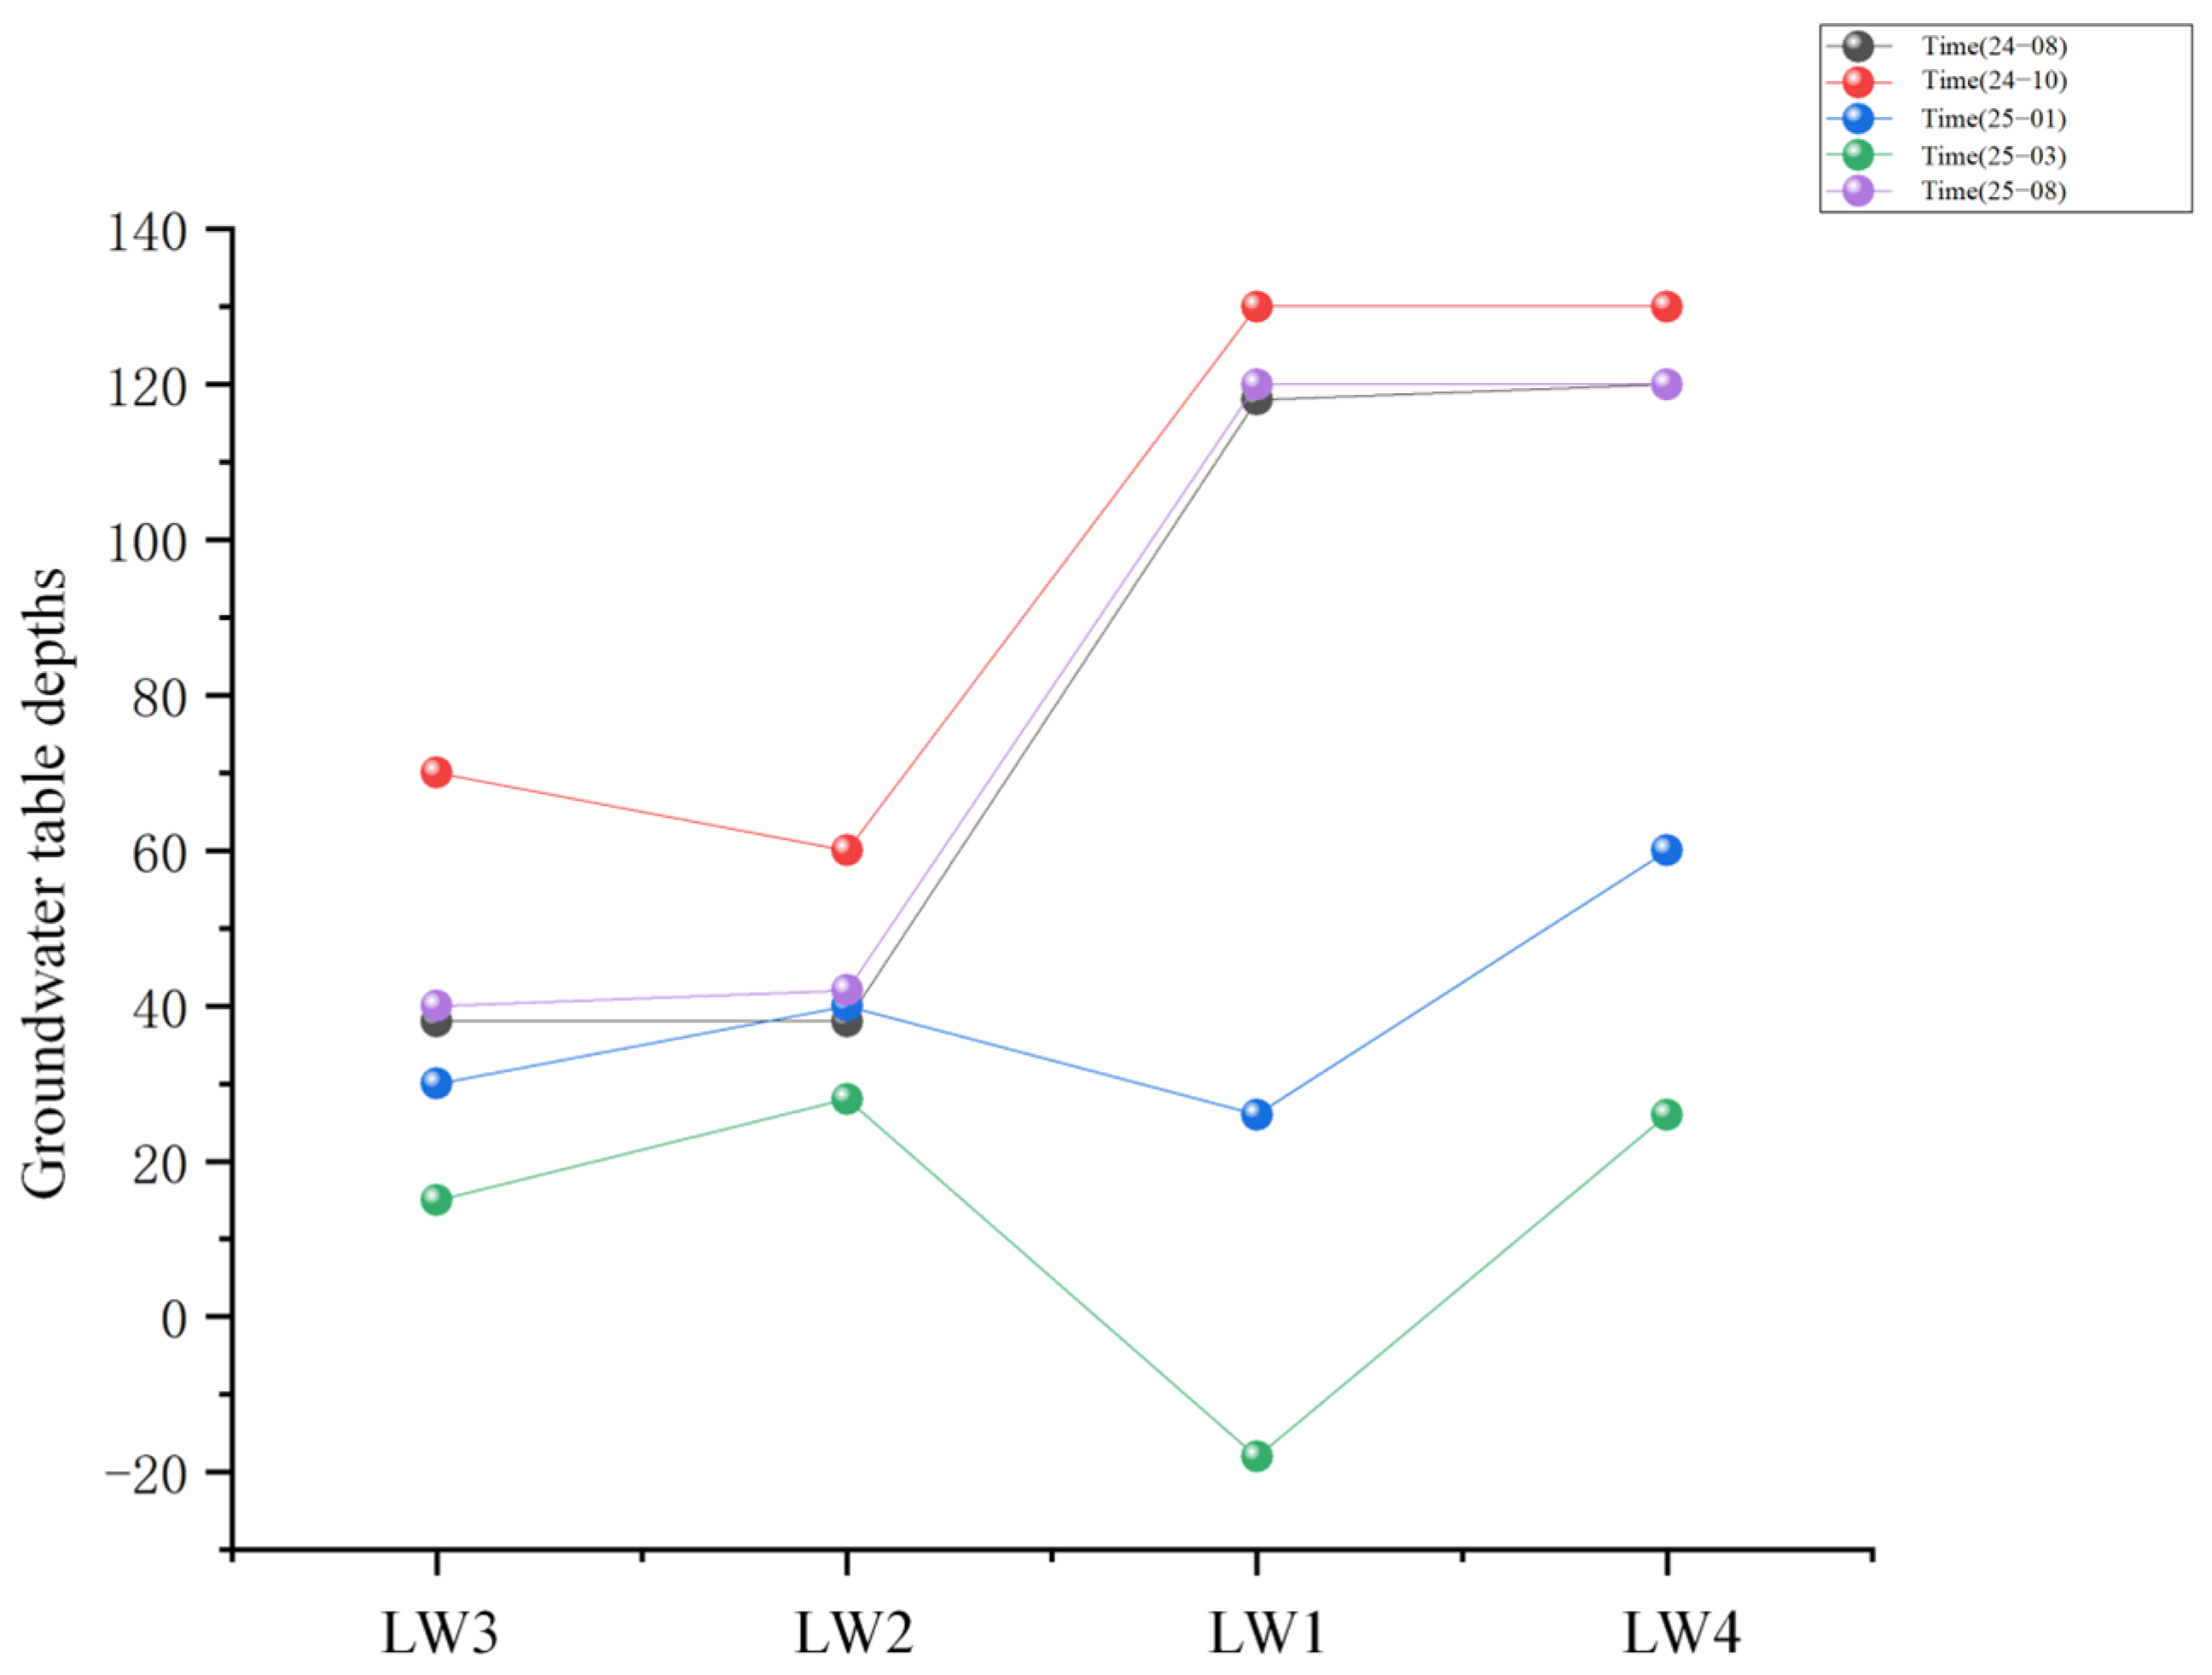
As shown in Figure 4, groundwater depth also varied over time. During the period from August 2024 to August 2025, it generally exhibited a pattern of initially decreasing and then increasing. The closer to the river, the shallower the groundwater depth. An anomaly of −20 cm in groundwater depth occurred in March 2025, which may have been caused by recharge from atmospheric precipitation.
Figure 4.
Changes in groundwater depth at different times (unit: cm).
3.2. Particle-Size Fractionation Experiment
According to the particle-size analysis results of four representative soil samples conducted in accordance with GB 50021-2009 [32], all samples were dominated by fine particles (<0.075 mm, 54.3–95.9%) and classified as silt. The sand fraction (≥0.075 mm) was low or absent across all sites. Although subtle differences in particle-size distribution were observed along the transect, all sites exhibited uniformly fine-textured soils with no major contrast in soil texture type. These modest differences may have some influence on soil hydraulic properties, but supporting properties, including bulk density, porosity, organic matter content, hydraulic conductivity, field capacity, or capillary behavior, were not directly measured in this study.
3.3. Variations in Soil Temperature and Water-Salt Conditions in a Typical Surface Water-Groundwater Interaction Zone
3.3.1. Variations in Soil Temperature and Water-Salt Conditions Along a Typical Transect Perpendicular to the River
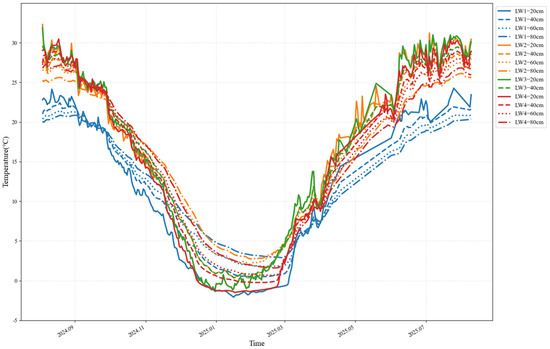
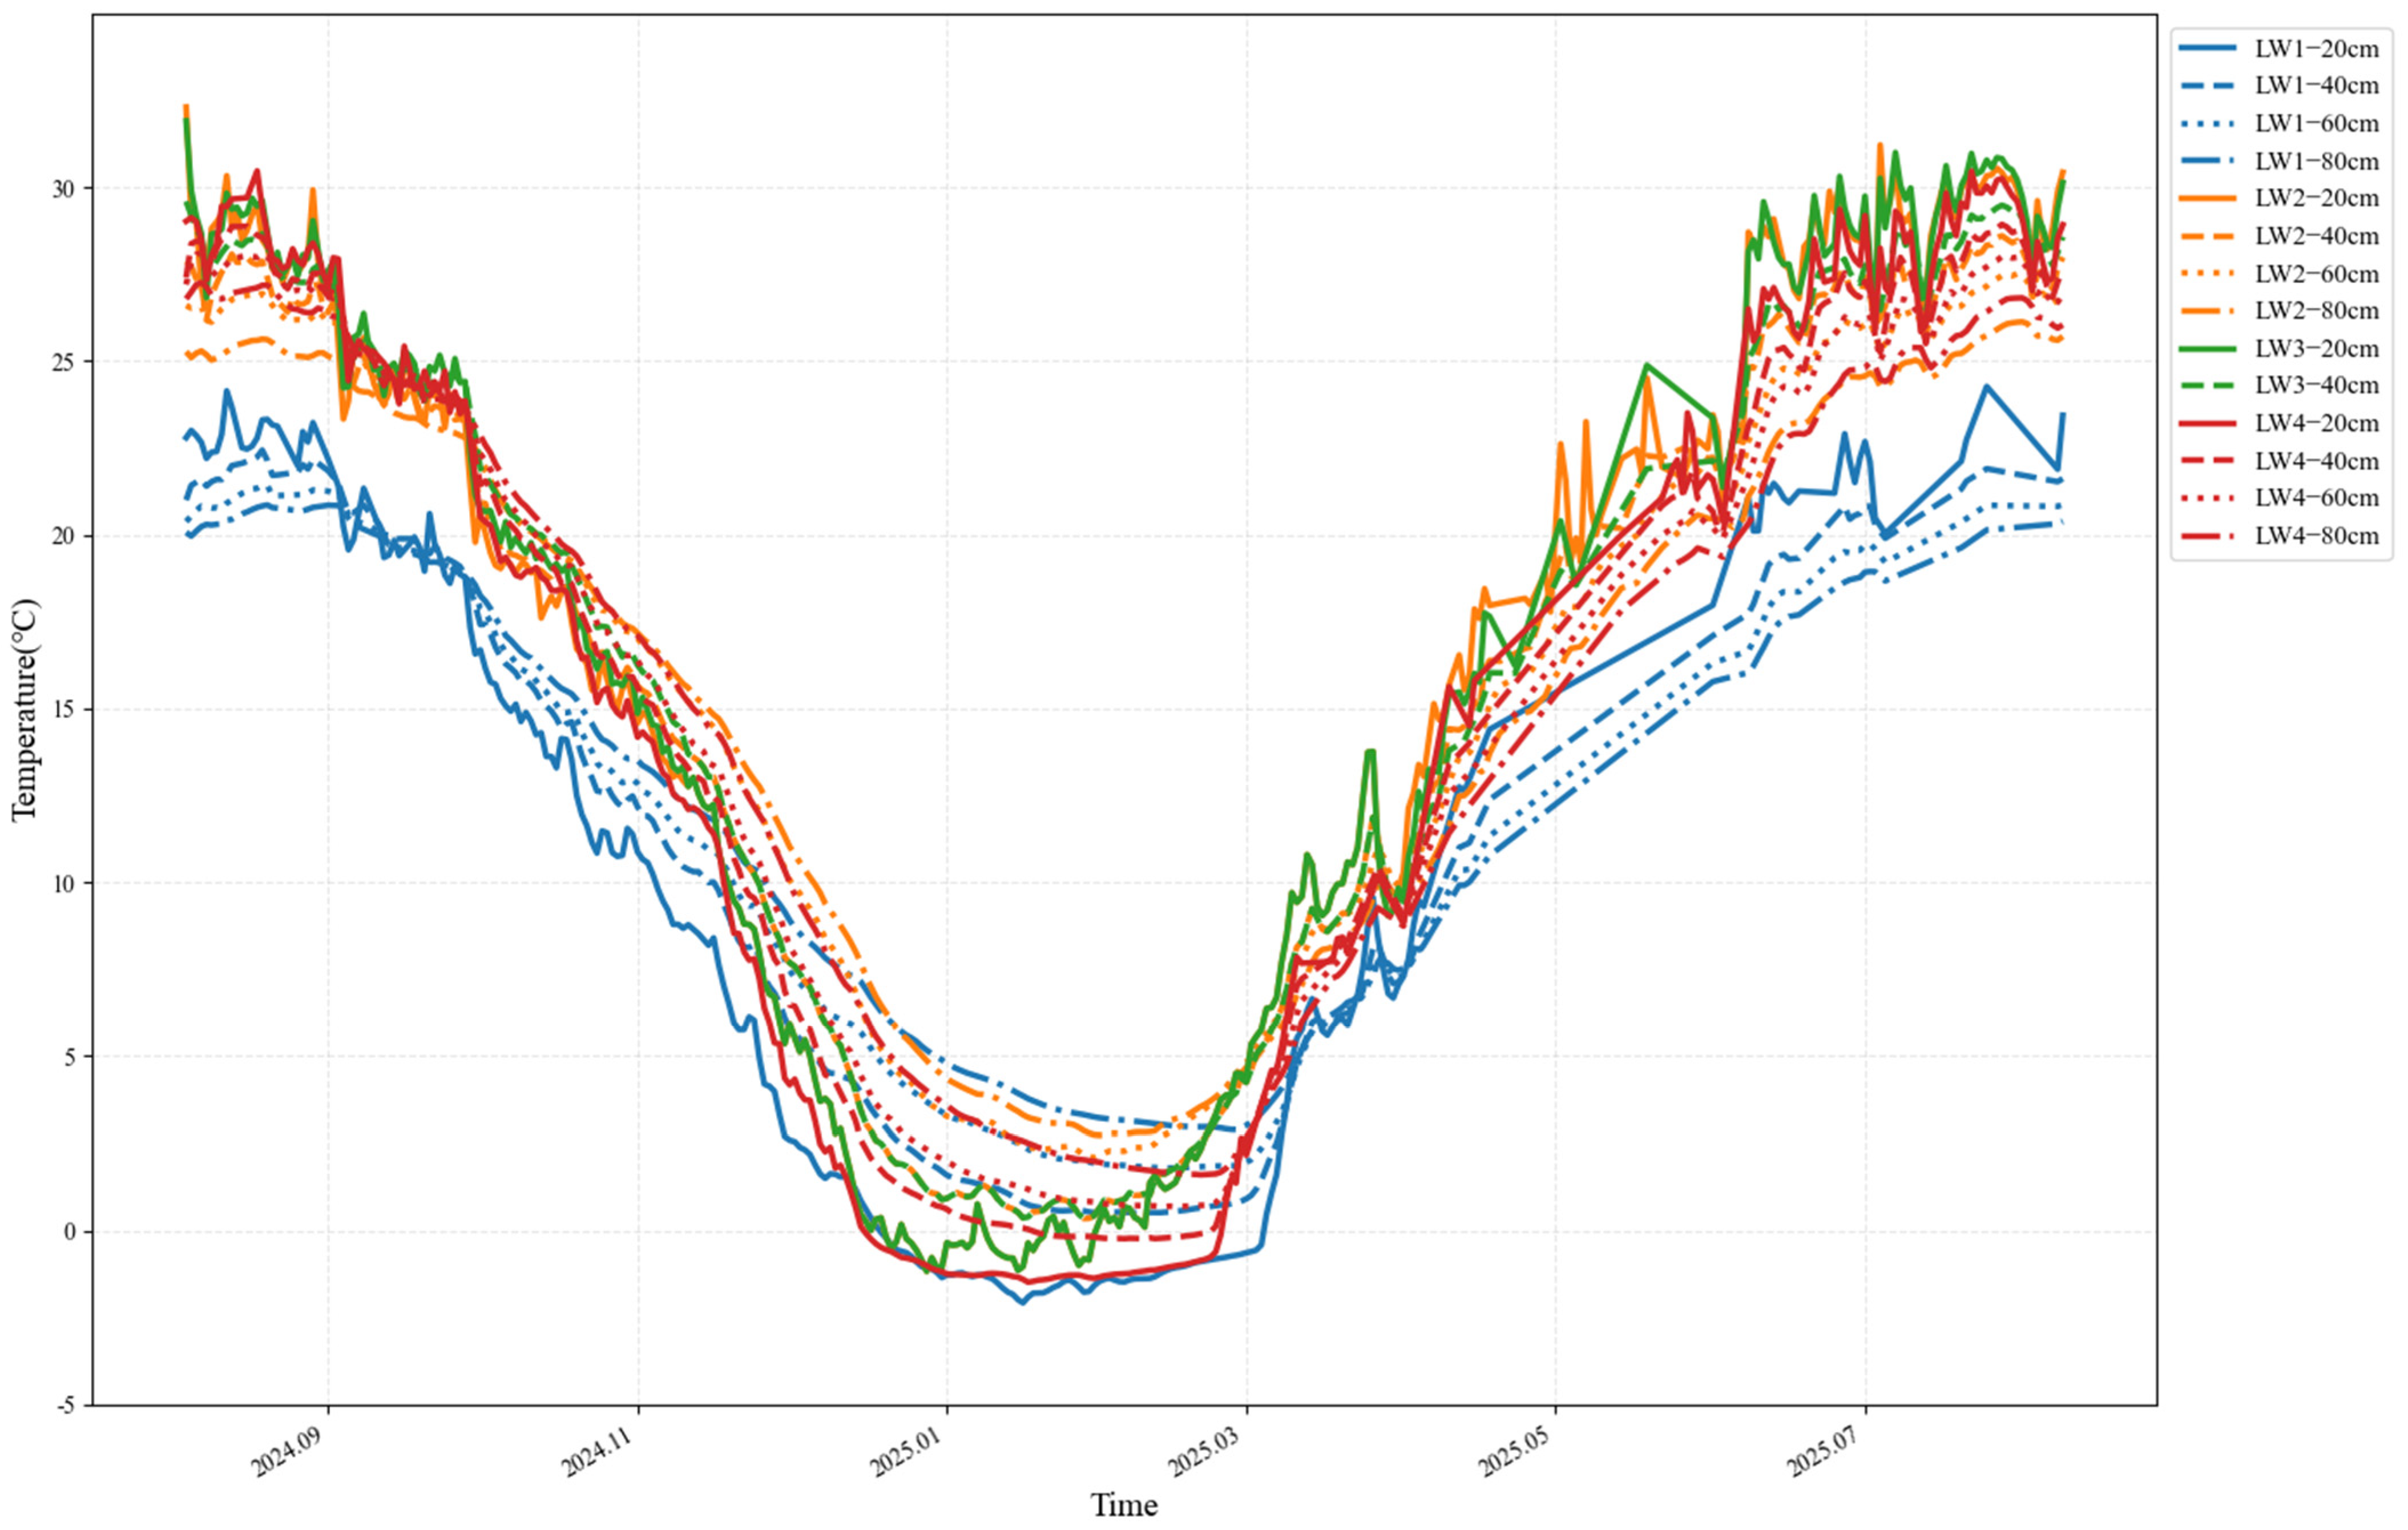
As shown in Figure 5, from August 2024 to August 2025, soil temperature at different depths exhibited consistent seasonal fluctuations, with an overall pattern of first decreasing and then increasing, and the temporal dynamics of soil temperature were significantly correlated with depth. At the initial stage in August 2024, soil temperatures differed among depths: the shallow layer (20 cm) had an initial temperature of approximately 22–23 °C, lower than the 27–29 °C observed in the middle and deep layers (40, 60, and 80 cm). Subsequently, until January 2025, soil temperatures at all depths declined continuously. The 20 cm depth exhibited the fastest cooling rate, reaching a minimum of −1.5 °C, the lowest among all depths, whereas the deep layer (80 cm) cooled most gradually, with a minimum temperature of approximately −0.2 °C, significantly higher than that of the shallow layer. After January 2025, the system entered a warming phase, and the temperature gradually recovered. The 20 cm depth still showed the fastest warming rate, rising to 21–24 °C from July to August 2025. The middle and deep layers (40 and 60 cm) reached higher levels of 26–32 °C during the same period, while the 80 cm depth warmed most slowly and remained at 25–28 °C. Notably, the amplitude of soil temperature variation decreased with increasing depth. The 20 cm depth showed the largest annual temperature range, whereas the 80 cm depth had the smallest range. In addition, although the timing of extreme values during the cooling and warming phases in deep soil was generally consistent with that in the shallow layer, a slight lag effect in temperature response was evident. Overall, the deeper the soil, the stronger the temperature stability. This characteristic is consistent with the physical properties of soil heat conduction and reflects the more pronounced buffering effect of deeper soil against changes in ambient temperature.
Figure 5.
Temperature variations at different depths and different monitoring sites.
From August 2024 to August 2025, soil temperature in reed plots at different distances from the river exhibited pronounced seasonal fluctuations, generally following a “decrease-then-increase” pattern, and the dynamic characteristics of soil temperature were closely associated with distance from the river. Among them, LW3, the plot closest to the river, had a relatively high initial soil temperature (approximately 28–29 °C in August 2024). Its cooling phase, extending to January 2025, proceeded at a relatively moderate rate, with a minimum temperature of about −0.3 °C. Thereafter, temperature increased steadily, remaining at 26–30 °C during July–August 2025, with comparatively small annual fluctuations. LW2, which was second closest to the river, had a slightly lower initial temperature (approximately 27–28 °C in August 2024) than LW3, and both its cooling and warming rates were moderate, with a minimum temperature of about −0.5 °C. During July–August 2025, its temperature ranged from 26–32 °C, and its fluctuation range was intermediate between those of LW3 and LW1. LW1, located farther from the river, had the lowest initial temperature (approximately 22–23 °C in August 2024) and the fastest cooling rate, with the minimum temperature reaching −1.5 °C in January 2025, the lowest among all plots. Its warming phase was marked by a pronounced increase, and temperatures recovered to 21–24 °C during July–August 2025, showing the largest fluctuation range. LW4, the plot farthest from the river, had an initial temperature (approximately 28–29 °C in August 2024) similar to that of LW3 and LW2, but its cooling phase was more gradual, with a minimum temperature of about −0.2 °C, the highest among all plots. Its warming phase was also the mildest, with temperatures maintained at 25–28 °C during July–August 2025, resulting in the smallest fluctuation range. Overall, the closer a plot was to the river, the more moderate the seasonal fluctuation in soil temperature, the higher the minimum temperature during the cold period, and the stronger the thermal stability. This phenomenon may be related to the river’s thermal regulation effect: through moisture evaporation and heat conduction, the river buffers temperature changes in surrounding soils. As the distance from the river increases, this buffering effect weakens, making soil temperature more sensitive to climatic conditions and resulting in larger fluctuations.
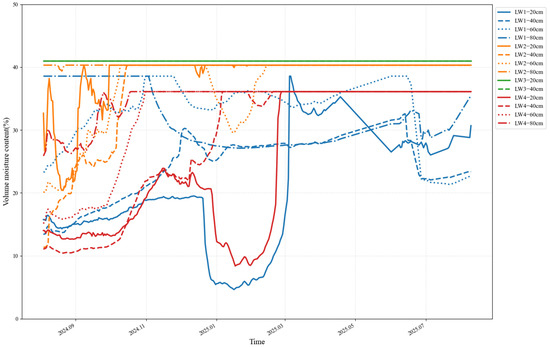
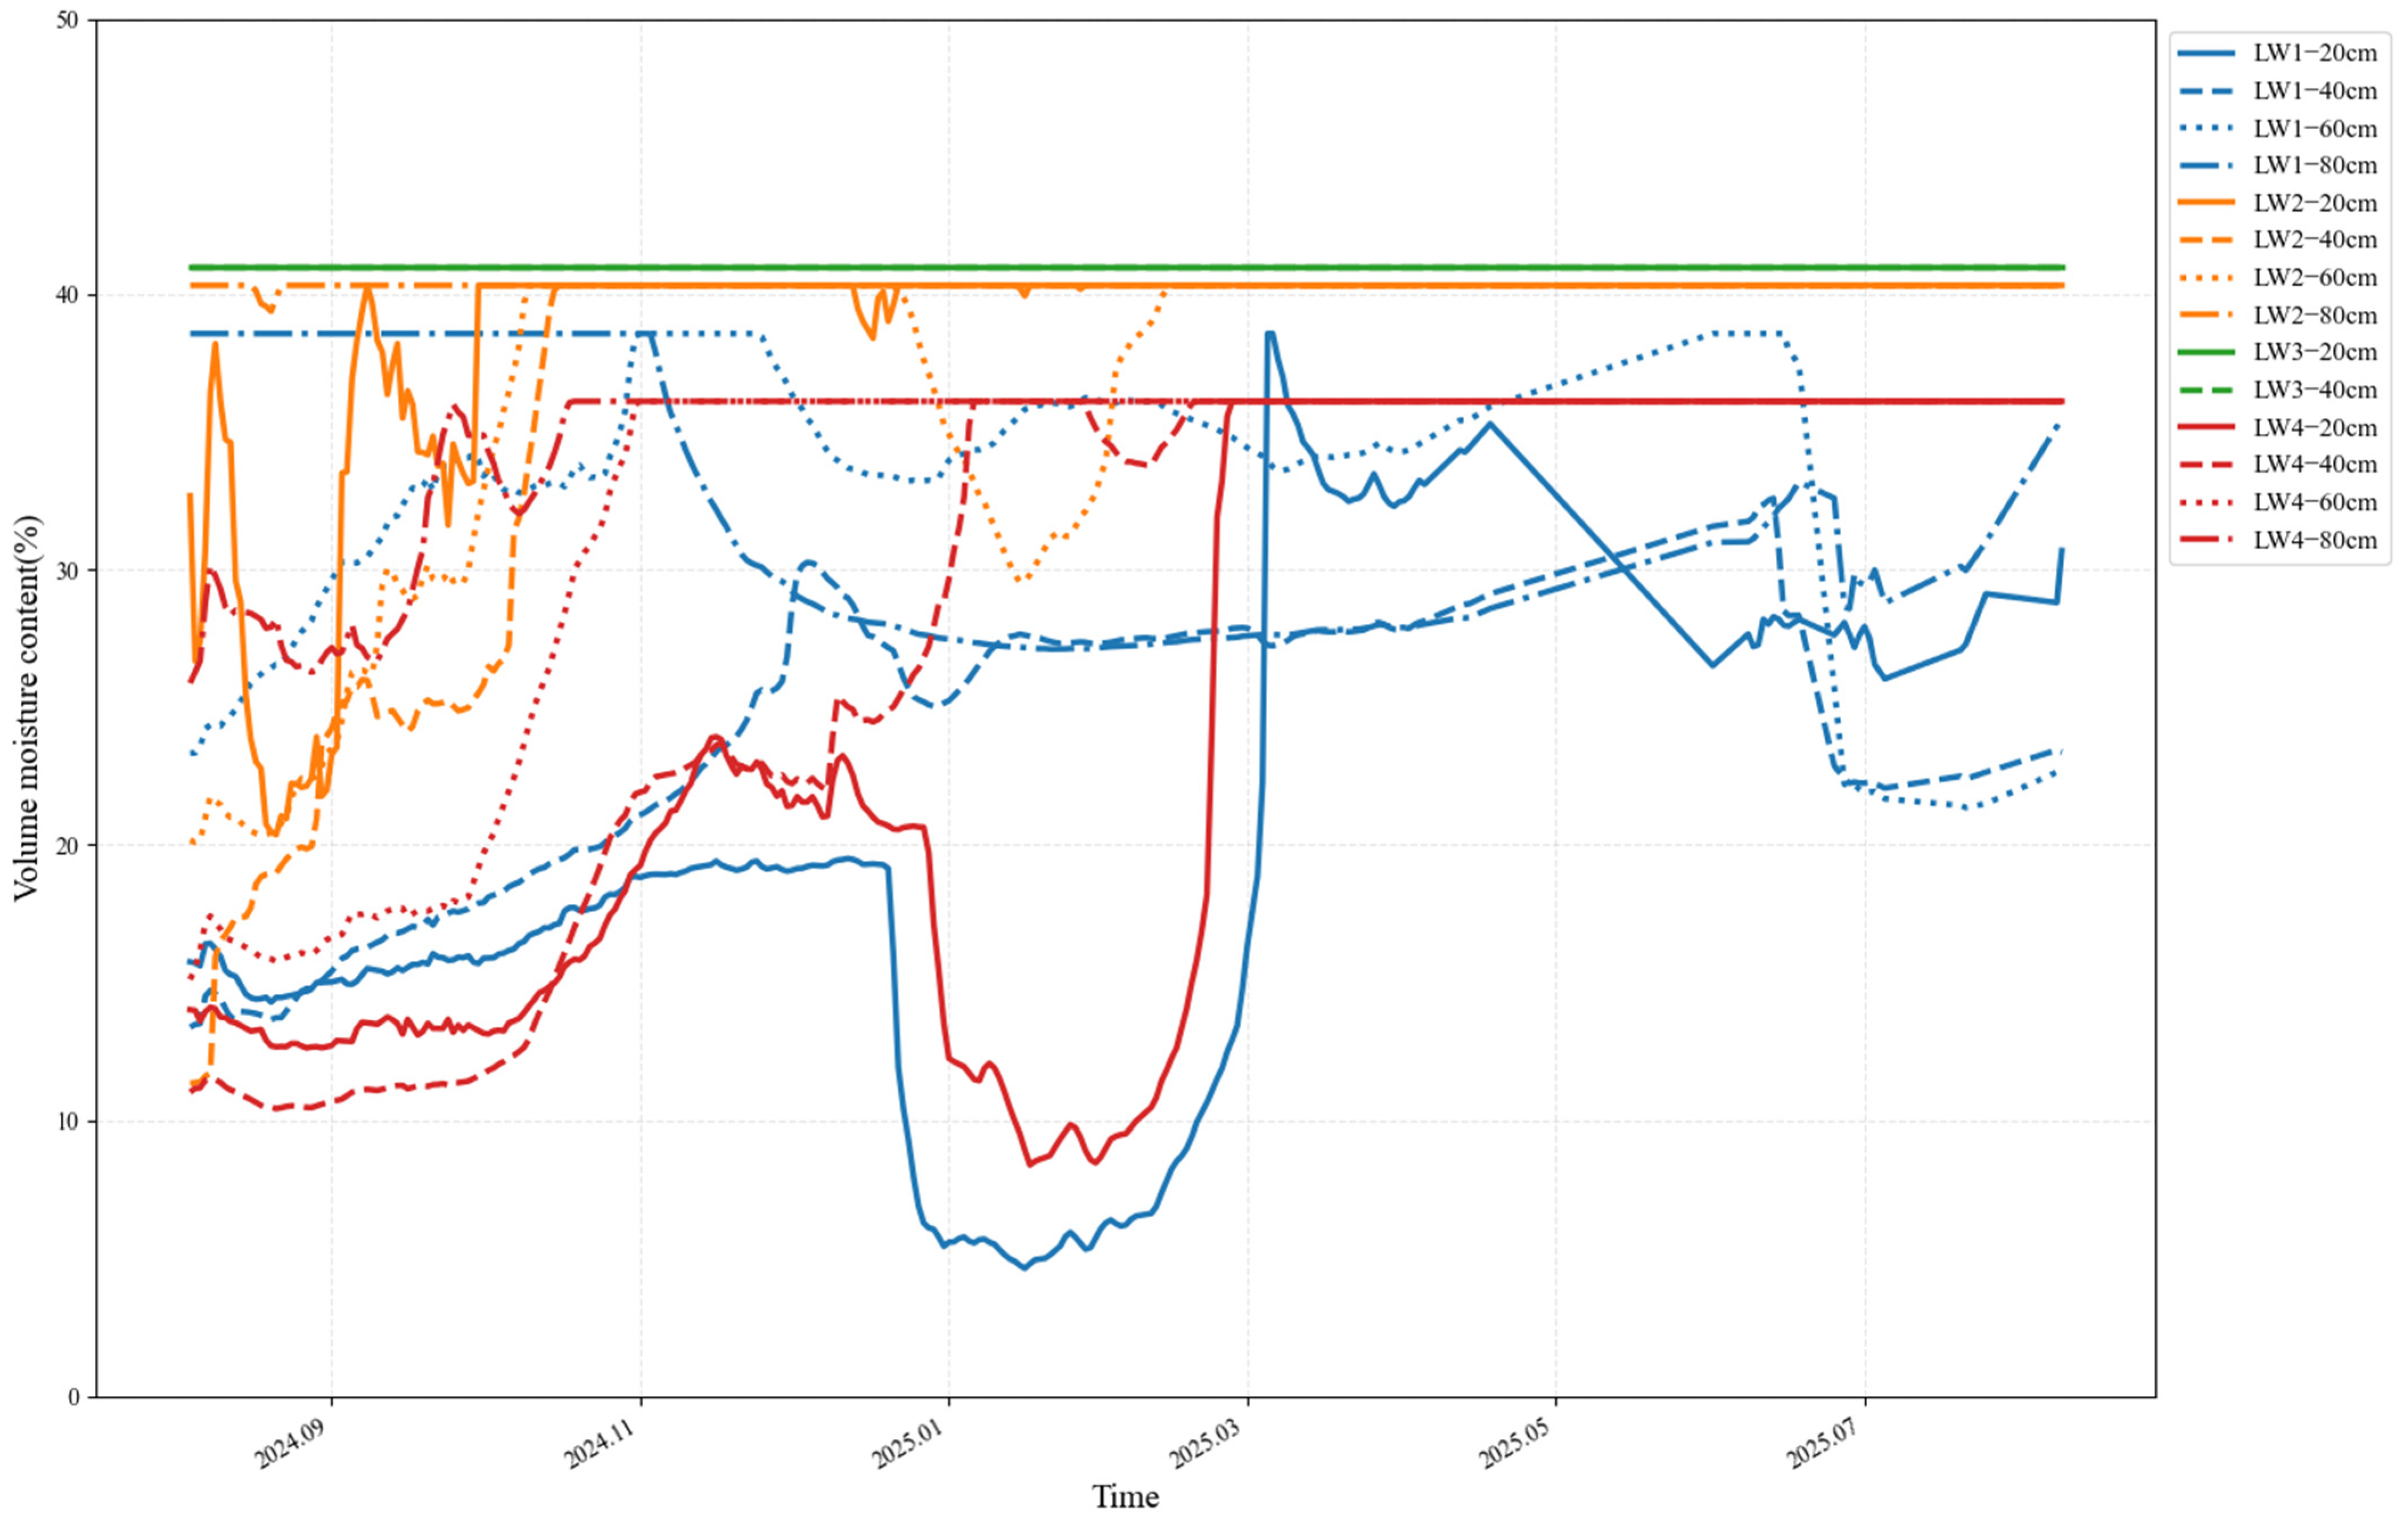
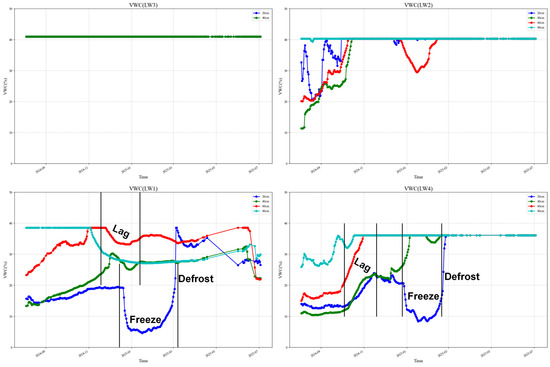
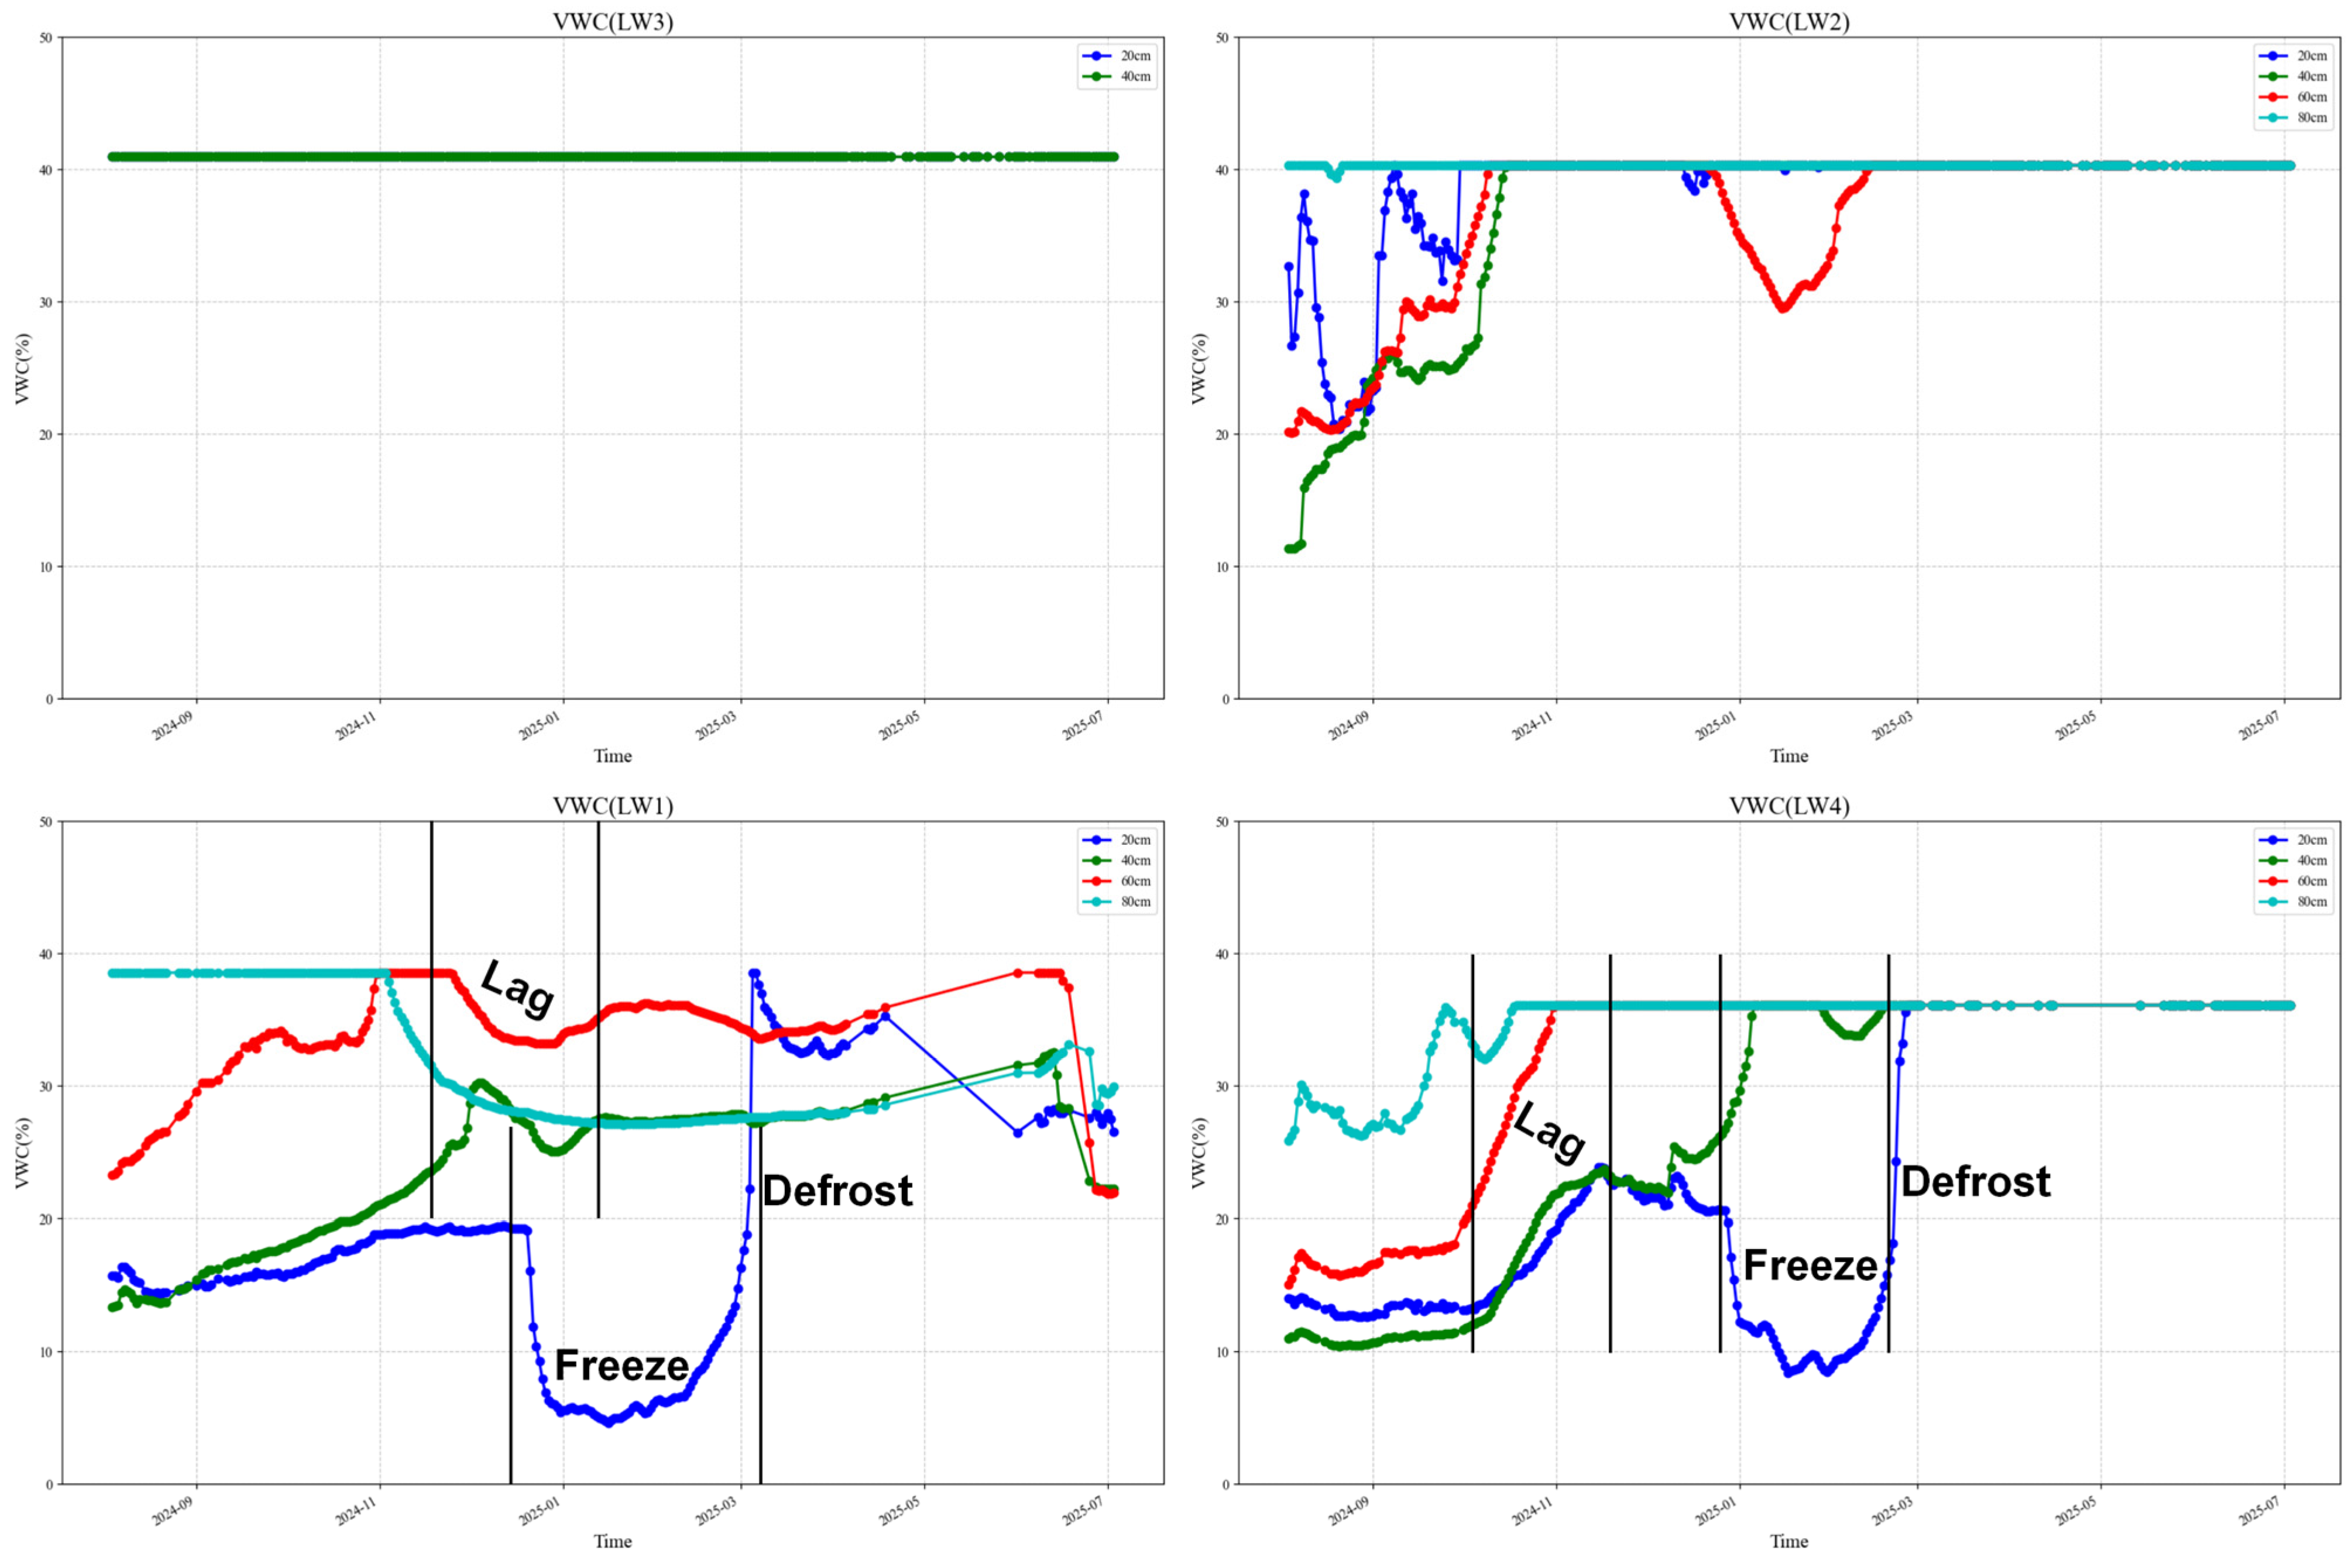
As shown in Figure 6, dynamic monitoring of soil moisture in representative profiles at different depths revealed pronounced vertical differentiation and temporal response characteristics, with a clear association with distance from the river. In the shallow profiles at 20 cm and 40 cm, LW3, which is closest to the river, consistently maintained soil moisture above 40%, demonstrating a strong capacity to retain shallow soil water. LW2, which is second closest to the river, showed a continuous increase in soil moisture at 40 cm depth from 18% to 40% before stabilizing, with only brief fluctuations at the 20 cm depth in the early stage. For the more distant LW1 and LW4, shallow soil moisture fluctuated more markedly during the initial monitoring period (August 2024 to February 2025), with soil moisture at 20 cm depth in LW1 dropping to a minimum of approximately 5% before rapidly recovering to around 38% after March 2025. In the deeper profiles at 60 cm and 80 cm, the overall stability of soil moisture improved across all communities. LW2, which is closer to the river, maintained soil moisture at approximately 40% at both 60 cm and 80 cm depths, with only a temporary decline at 60 cm during January–February 2025. In contrast, soil moisture at 60 cm depth in LW1, which is farther from the river, dropped rapidly to 22% after June 2025, whereas at 80 cm depth it first decreased and then increased, eventually recovering to a range of 30–35% in the later stage. Overall, shallow soil moisture was more sensitive to environmental factors such as precipitation and evaporation, whereas communities closer to the river exhibited smaller fluctuations and stronger moisture retention due to more stable groundwater recharge. Deep soil moisture, by contrast, showed stronger buffering capacity, and the effects of differences among reed communities on soil moisture displayed differentiated stability patterns with increasing profile depth and changing distance from the river.
Figure 6.
Volume moisture content variations at different depths and different monitoring sites (Volumetric water content at monitoring sites LW3, 20 cm and 40 cm soil depths maintains long-term saturated conditions.).
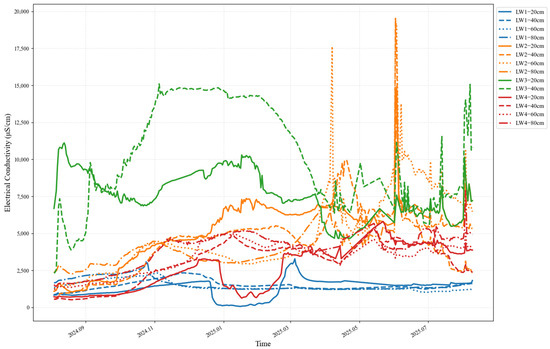
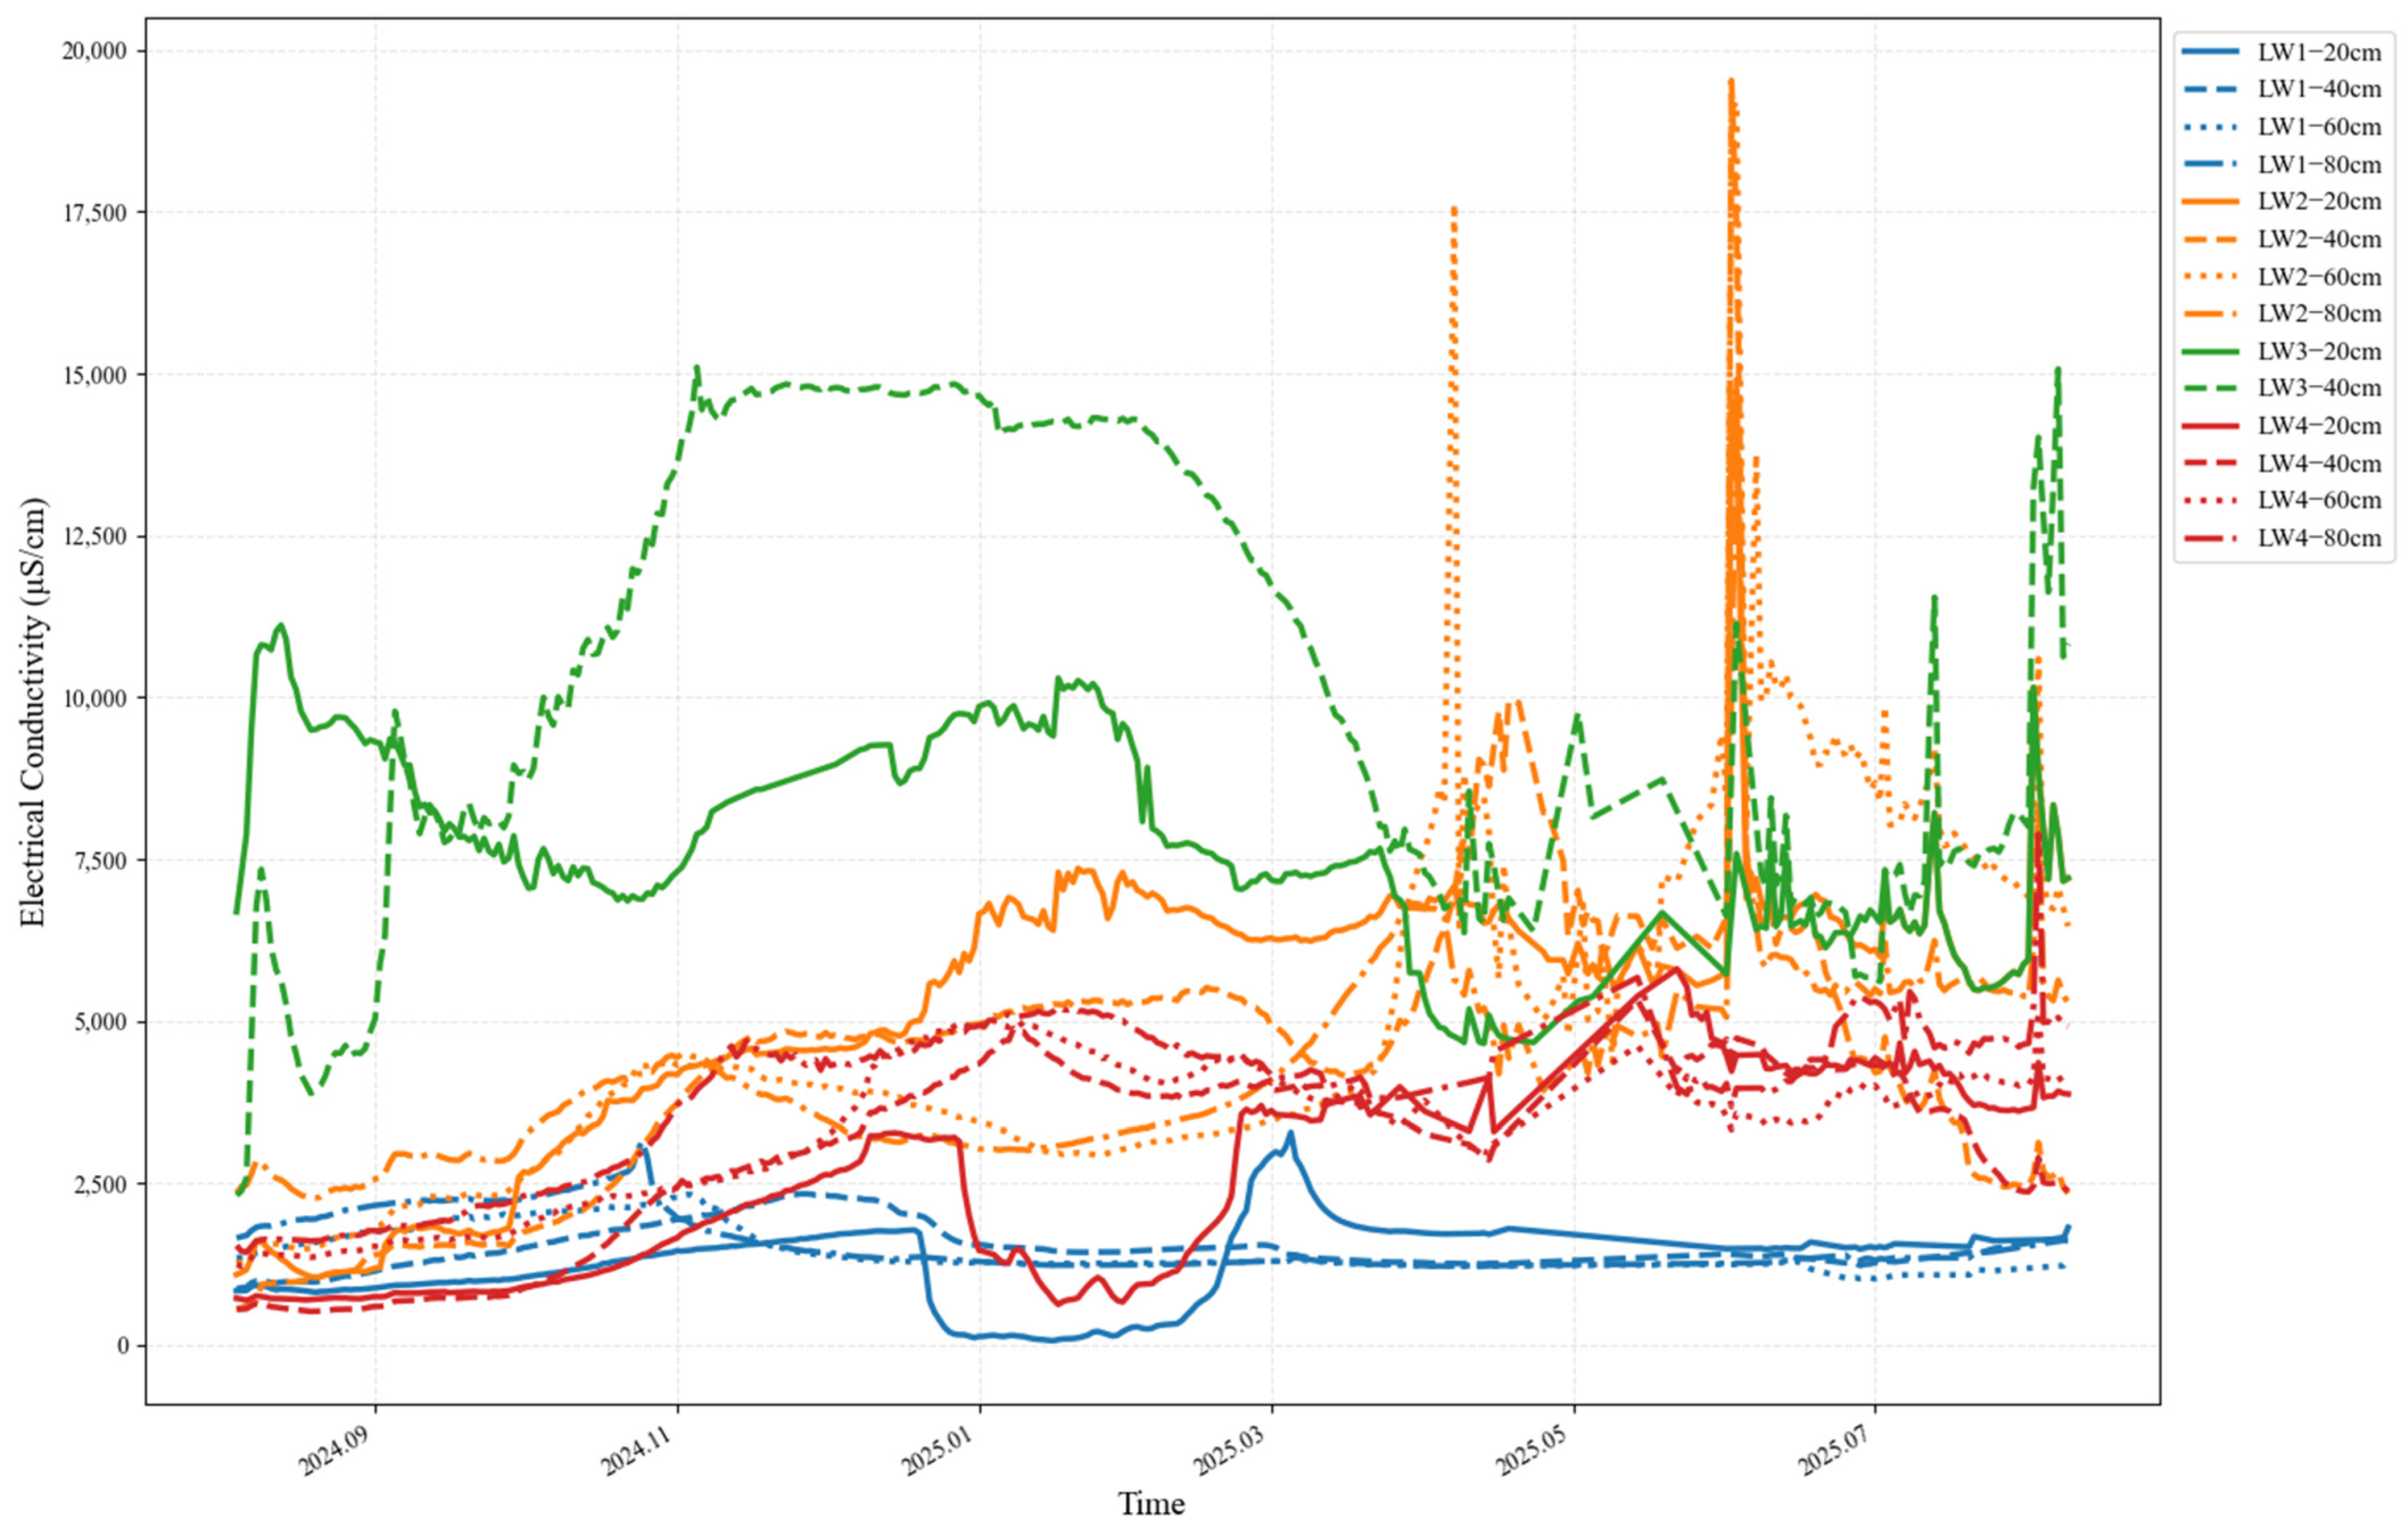
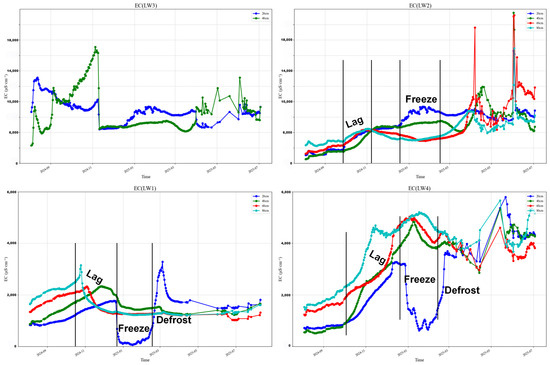
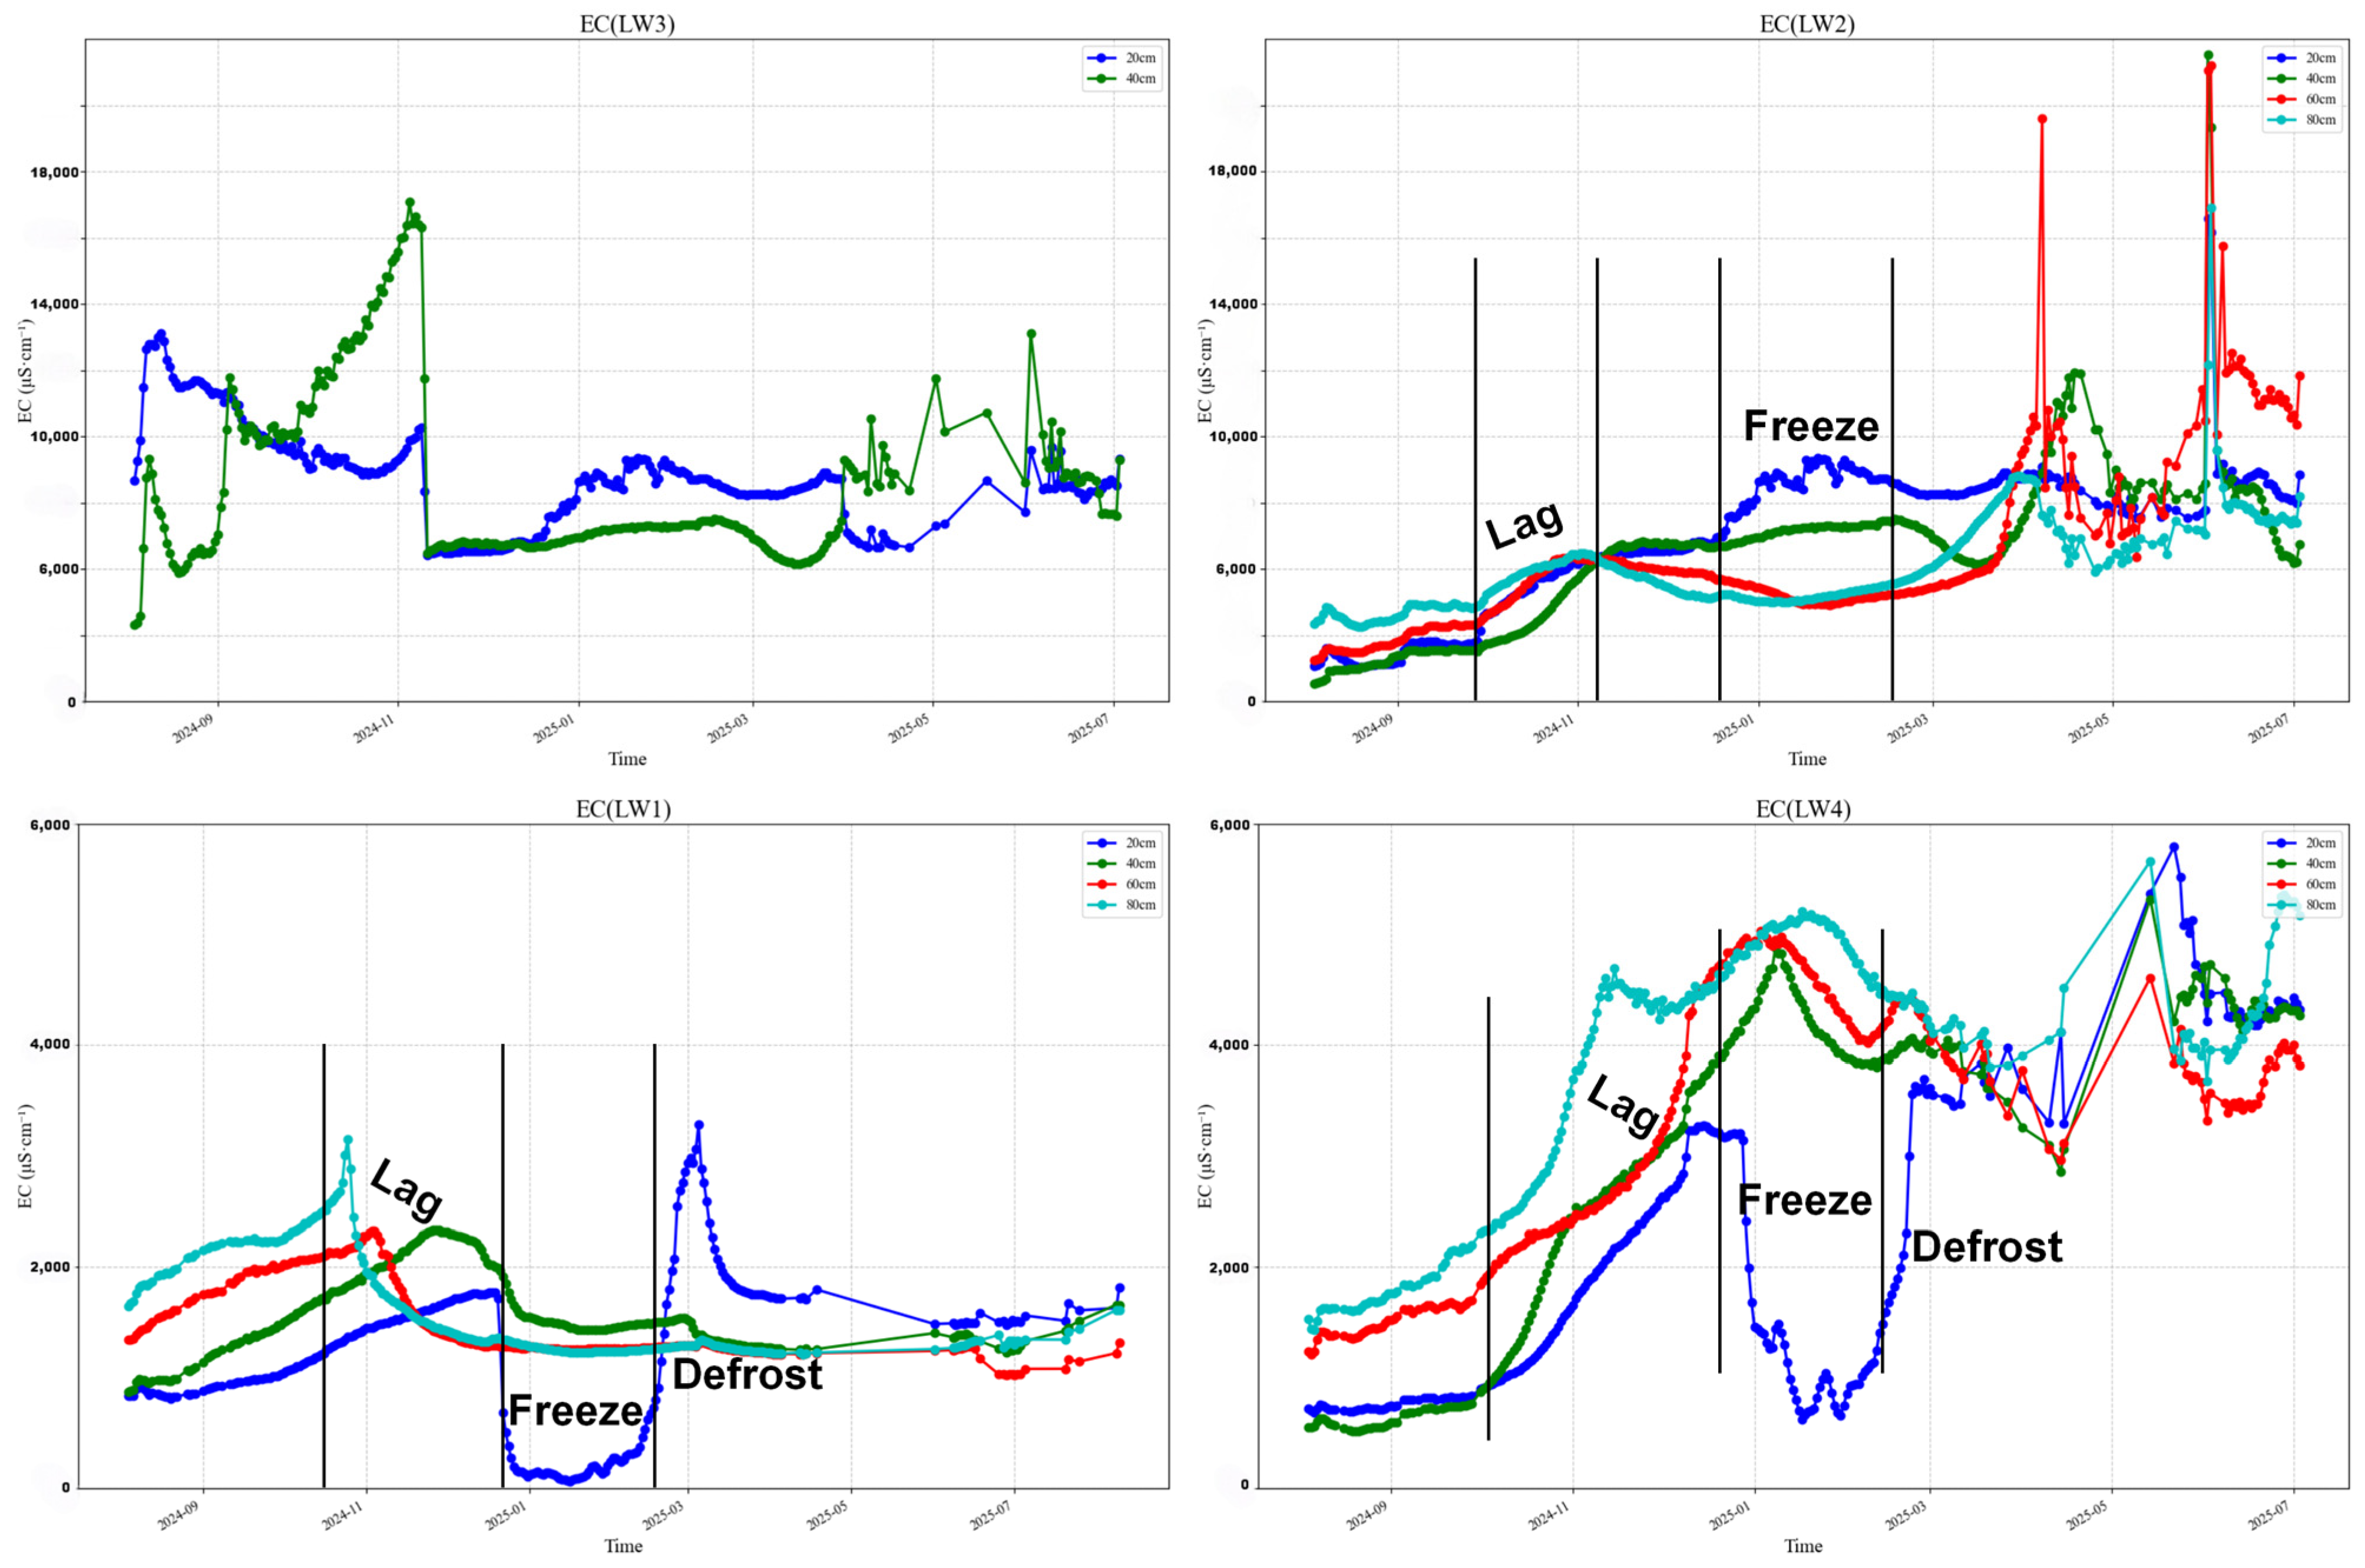
Dynamic monitoring of electrical conductivity at reed monitoring sites located at 20 cm, 40 cm, 60 cm, and 80 cm in typical profiles was conducted over a complete annual cycle. As shown in Figure 7, the results indicate that electrical conductivity exhibited pronounced spatiotemporal differentiation and was closely associated with distance from the river. At the profile-depth scale, electrical conductivity at all depths showed distinct phase fluctuation patterns, and these fluctuations were jointly related to profile depth and the distance of the plants from the river. At 20 cm and 40 cm depths, which included LW1–LW4, LW3, the closest to the river, maintained the highest electrical conductivity at both depths, with ranges of 5000–11,000 μS/cm and 4000–16,000 μS/cm, respectively. It showed initial fluctuations between increases and decreases, mid-stage stability at a relatively high level, and a gradual decline in the later stage; moreover, the 40 cm samples exhibited several abrupt peaks during July–August 2025. At 60 cm and 80 cm depths, where LW3 was not included, LW2, the second closest to the river, displayed the highest electrical conductivity, reaching 6000–19,000 μS/cm and 4000–16,700 μS/cm, respectively. This pattern presented a trend of rapid increase in the early stage, high-level fluctuation in the middle stage, and declining fluctuations in the later stage, with pronounced anomalously high values occurring in June or August 2025. In terms of the coupling relationship with distance from the river, electrical conductivity generally showed a negative correlation with river distance: from near to far, LW3, LW2, LW1, and LW4 exhibited sequentially decreasing conductivity levels. Notably, LW1, located in the middle section perpendicular to the river, did not exhibit the lowest electrical conductivity at all monitored depths. Its conductivity values were concentrated within the range of 1000–2700 μS/cm, and the fluctuation amplitude was distinctly weaker compared with the other sampling points. By contrast, LW4, which was also among the farthest sites from the river, consistently had conductivity values between those of LW1 and LW2, showing a trend of continuous increase in the early stage, stability in the middle stage, and fluctuating decline in the later stage at all depths, remaining within a relatively stable range during July–August 2025. In terms of temporal dynamics, electrical conductivity at all reed sites exhibited a consistent seasonal pattern: an upward trend from August to December 2024, predominantly high-level stability from January to March 2025, and a gradual fluctuating decline after March–April 2025, with slight recovery observed at some sites in the later stage. These findings suggest that the spatiotemporal differentiation of reed electrical conductivity results from the combined effects of profile depth and distance from the river. This differentiation reflects heterogeneous responses of reeds at different positions to environmental factors such as soil moisture and salt transport, and differences in water and salt supply associated with river proximity may be the key driver of electrical conductivity differentiation.
Figure 7.
Electrical Conductivity variations at different depths and different monitoring sites.
3.3.2. Changes in Soil, Water, and Salinity Across Different Hydrological Periods
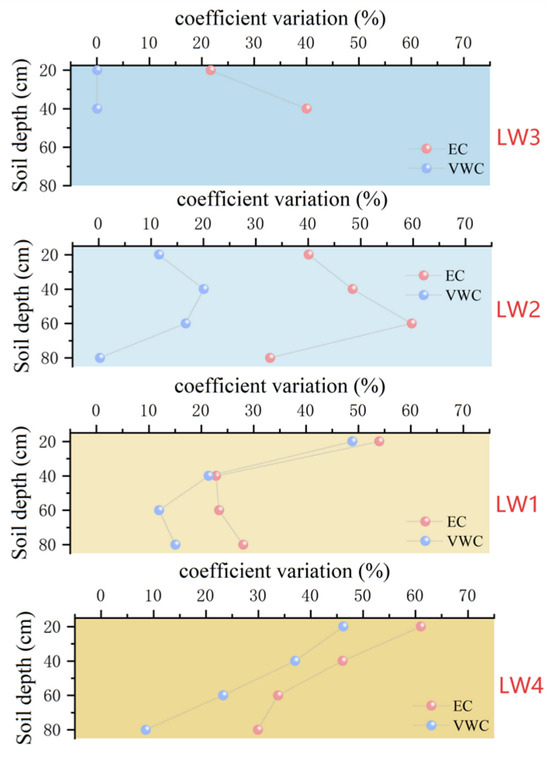
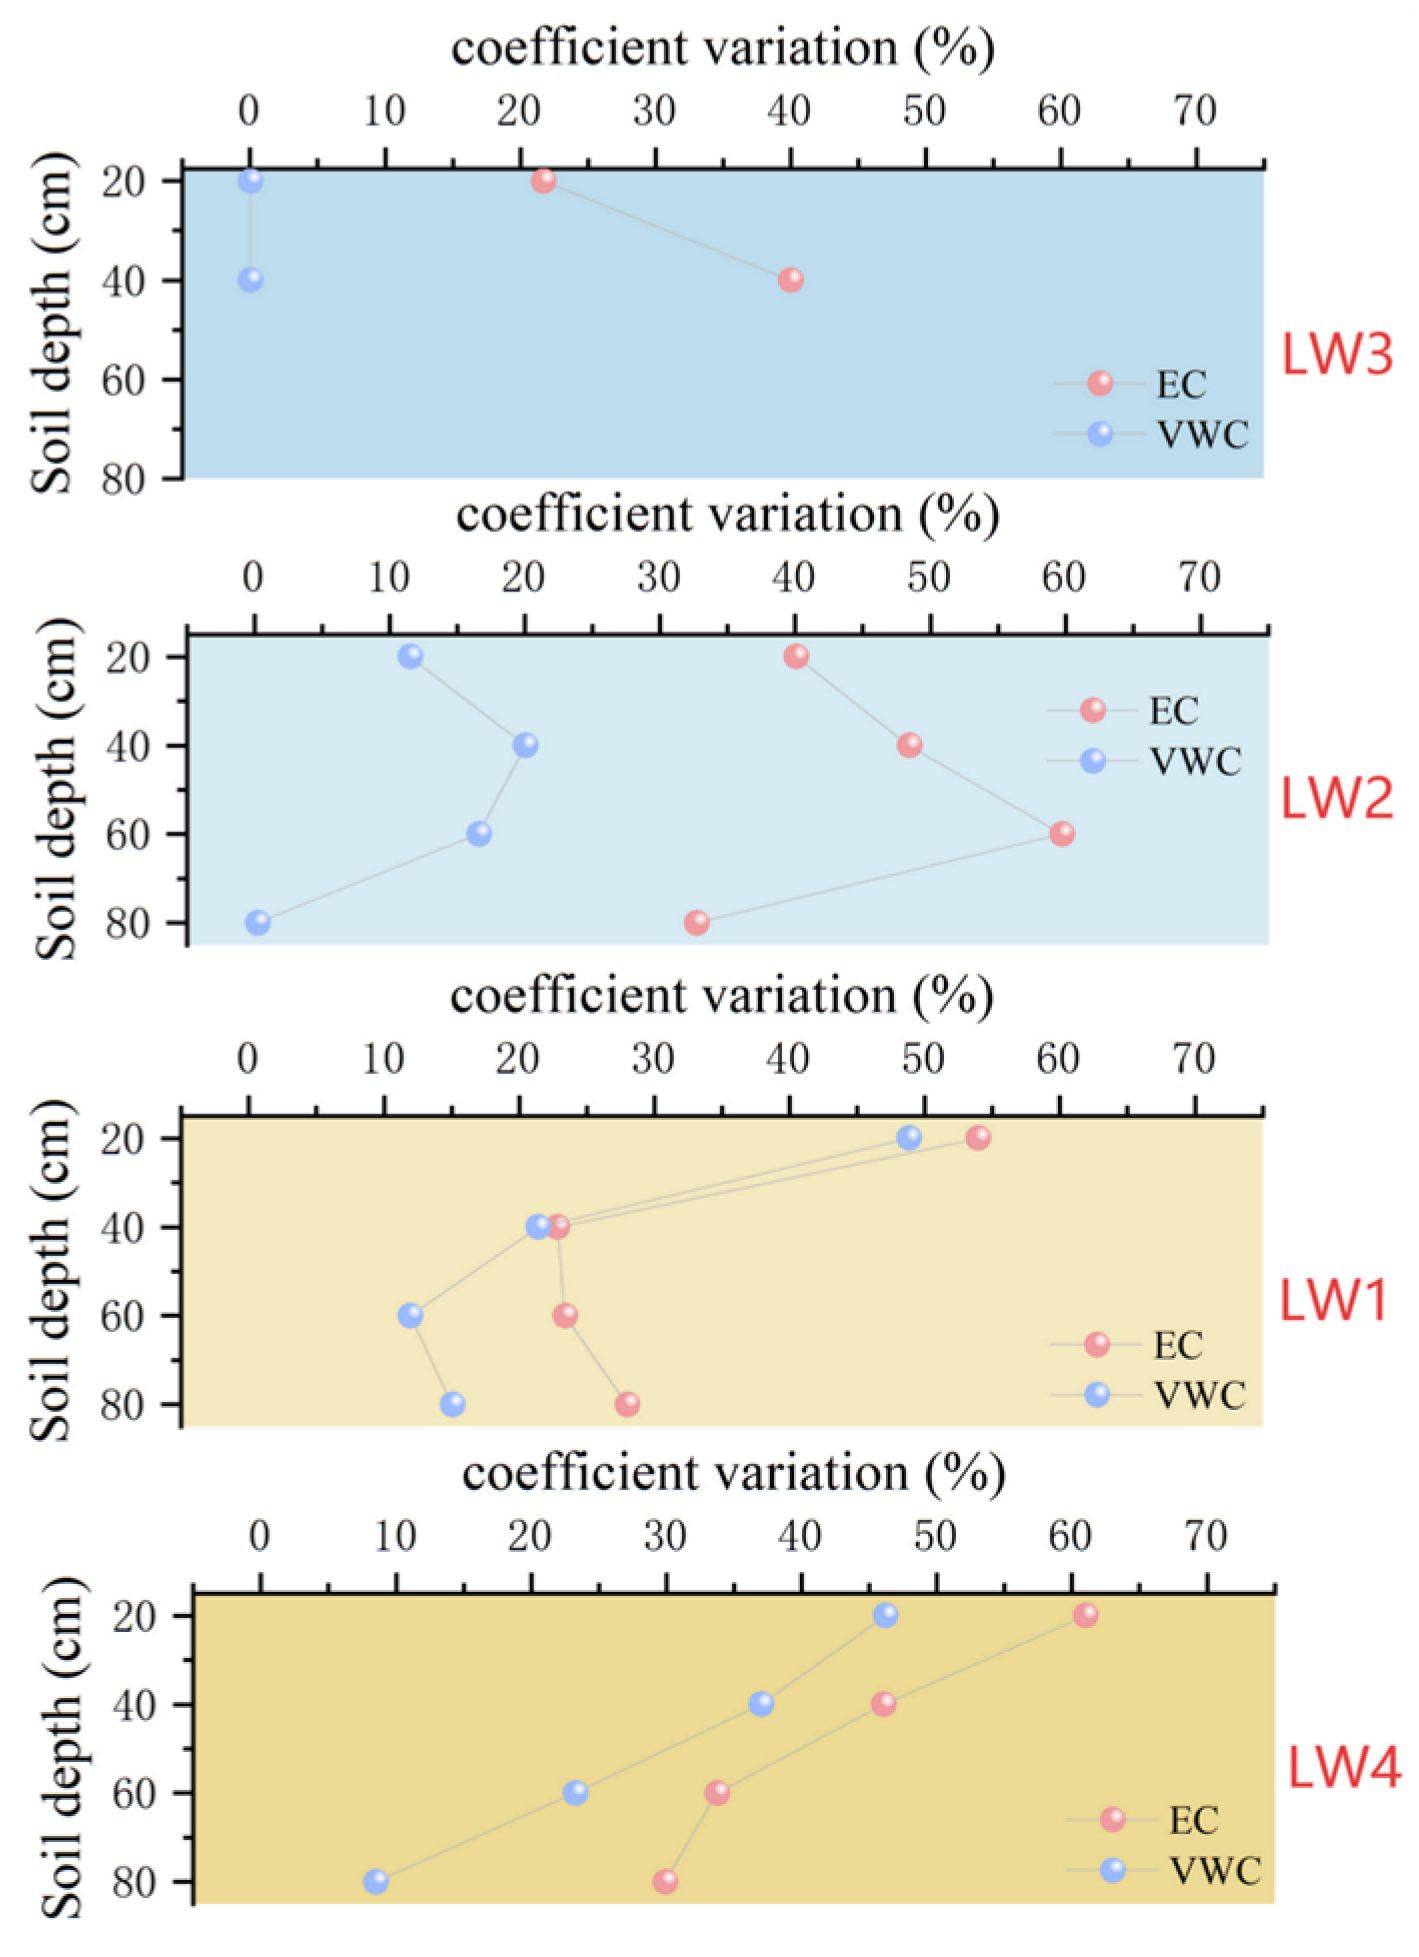
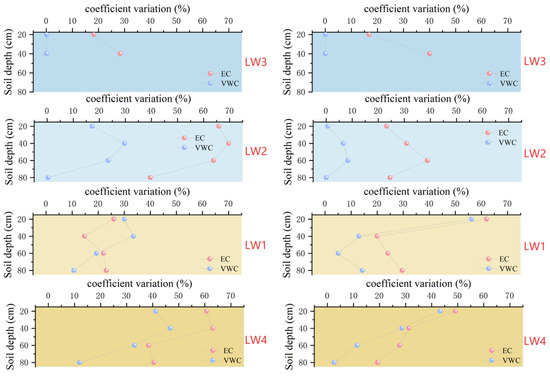
As shown in Figure 8, over the course of the year, the variation trends of the water-salinity CV (coefficient of variation) were similar at each site, and the CV of VWC (volumetric moisture content) was consistently lower than that of EC (electrical conductivity); however, the water-salinity CV trends differed among sites. Because the soil moisture at LW3 remained saturated throughout the year, its CV was constantly zero, whereas the CV of EC increased with increasing soil depth. For LW2, both VWC and EC initially increased and then decreased with increasing soil depth; after 60 cm, they declined, with a reduction of approximately 20–30, indicating a relatively large magnitude of change. For LW1, the CVs of both VWC and EC decreased sharply with increasing soil depth, decreasing by about 30 at the 40 cm depth, then gradually increasing thereafter. For LW4, the CVs of both VWC and EC gradually decreased with increasing soil depth, with an overall decline of about 50.
Figure 8.
Annual Variation in the CV of Soil VWC and EC at Different Positions Perpendicular to the River.
As shown in Figure 9, the patterns of variation in soil VWC and EC perpendicular to the river differed across hydrological periods. As distance increased, during the wet season, the CV of soil VWC at the same depth showed an increasing trend, whereas the CV of EC first increased and then decreased. For LW2, VWC and EC differed markedly at the same depth; for LW3, VWC and EC exhibited opposite trends with increasing depth; and for LW4, VWC and EC showed the same trend with increasing depth. During the dry season, however, the trends in EC and VWC were broadly similar. For LW2, as depth increased, EC and VWC first increased and then decreased at 60 cm, with a variation range of 10–20. For LW1, as depth increased, EC and VWC first decreased and then gradually declined at 40 cm, with the largest variation range of up to 40 between 20 and 40 cm. For LW4, the CV gradually decreased with increasing depth, with a reduction range of 40–50.
Figure 9.
Changes in the CV of Soil VWC and EC at Different Positions Perpendicular to the River During Different Periods (Wet and Dry Seasons).
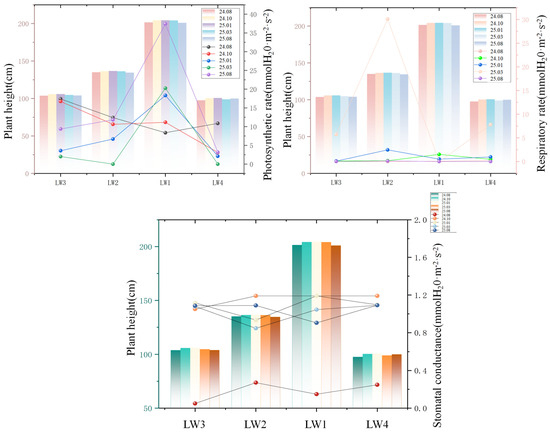
As shown in Figure 10, differences in air temperature in the same month across different years may be associated with higher photosynthetic rates. LW1 exhibited the greatest fluctuations in photosynthetic and respiratory rates, and its values were higher than those of the other three sites during most periods. From August 2024 to August 2025, the photosynthetic rate and plant height of the four reed individuals in the typical profiles showed different trends. LW1 showed the most pronounced growth performance: its photosynthetic rate continued to rise after January 2025, reaching peak values of 20.25 and 37.38 in March and August, respectively. This strong photosynthetic capacity also supported its consistently leading height growth, with plant height remaining above 200 cm throughout the year, indicating vigorous growth. The photosynthetic rate of LW3 remained at a relatively high level of 16–17 during the early period (August–October 2024) but declined markedly in winter (January–March 2025), reaching a minimum of only 2.01, before increasing again to 9.36 in August. This fluctuation was also reflected in its plant height and growth cycle: after slow growth in the early period, growth slowed in winter, and plant height stabilized at 104 cm in August. LW2 had a moderate photosynthetic rate in the early period, but it briefly dropped to 0 in March 2025 before recovering to 11.83 in August. Correspondingly, its plant height increased steadily in the early period and eventually stabilized at 134.6 cm. LW4 exhibited the weakest overall photosynthetic performance, reaching only 10.87 in August 2024 before declining continuously, dropping to 0 in March 2025, and recovering only to 3.18 in August. This directly resulted in the lowest plant height throughout the year, which eventually remained around 100 cm.
Figure 10.
Changes in plant physiology and growth indicators.
From August 2024 to August 2025, fluctuations in the respiration rate of reeds at different locations showed a clear association with plant height growth. The respiration rate of LW2 increased rapidly in March 2025, reaching a peak of 30.08. At this stage, its plant height was also at a relatively high level after steady growth, indicating that active respiratory metabolism provided energy support for growth; by August, the respiration rate had declined. The respiration rate of LW3 remained at a low level in the early period, rising only briefly to 5.75 in March 2025 before quickly declining again, while plant height remained stable at 103–106 cm throughout the year. LW1 reached a small peak of 1.52 in October 2024 before declining, dropped to 0 in March 2025, and remained at an extremely low level in August; however, its plant height consistently remained above 200 cm, the highest among all sites. The respiration rate of LW4 gradually increased after January 2025, peaking at 7.80 in March, but its overall metabolic intensity remained low, consistent with its lowest plant height throughout the year, suggesting that limited respiratory capacity was insufficient to support vigorous growth demands.
From August 2024 to August 2025, fluctuations in stomatal conductance in the four reed strains showed a pronounced association with plant height growth. The stomatal conductance of LW1 remained at a relatively high level of around 1.19 from October 2024 to January 2025, ensuring active gas exchange, which was also associated with its consistently leading plant height, remaining above 200 cm throughout the year. Although stomatal conductance declined slightly later, plant height remained stable, indicating that the photosynthetic products accumulated in the early period were sufficient to sustain growth. The stomatal conductance of LW2 reached a peak of 1.19 in October 2024 and then gradually declined, reaching a low of 0.85 in March 2025; this fluctuation was also reflected in its plant height, which increased steadily in the early period and eventually stabilized at 134.6 cm. LW3 had an extremely low stomatal conductance of 0.05 in August 2024, but it then rose rapidly to above 1.05 and remained stable, while plant height stayed at 103–106 cm throughout the year, demonstrating the growth-promoting effect of increased stomatal conductance. LW4 maintained a relatively high stomatal conductance of 1.09–1.19 after October 2024, yet its plant height remained the lowest, indicating that although it could maintain stable gas exchange, it may have been constrained by other metabolic processes and thus failed to translate this advantage into more vigorous growth.
3.3.3. Interaction Between the Ecotone and Soil Water-Salt-Temperature Dynamics
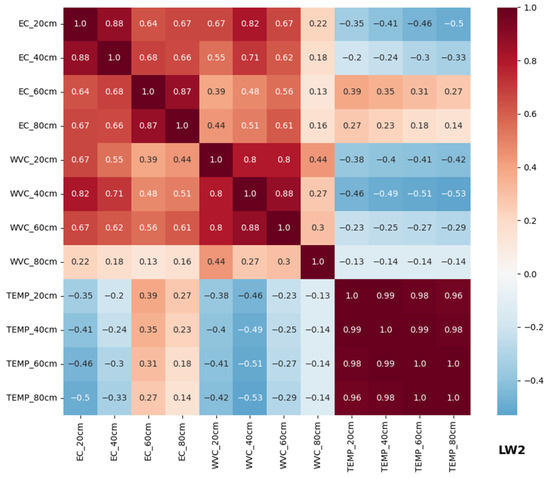
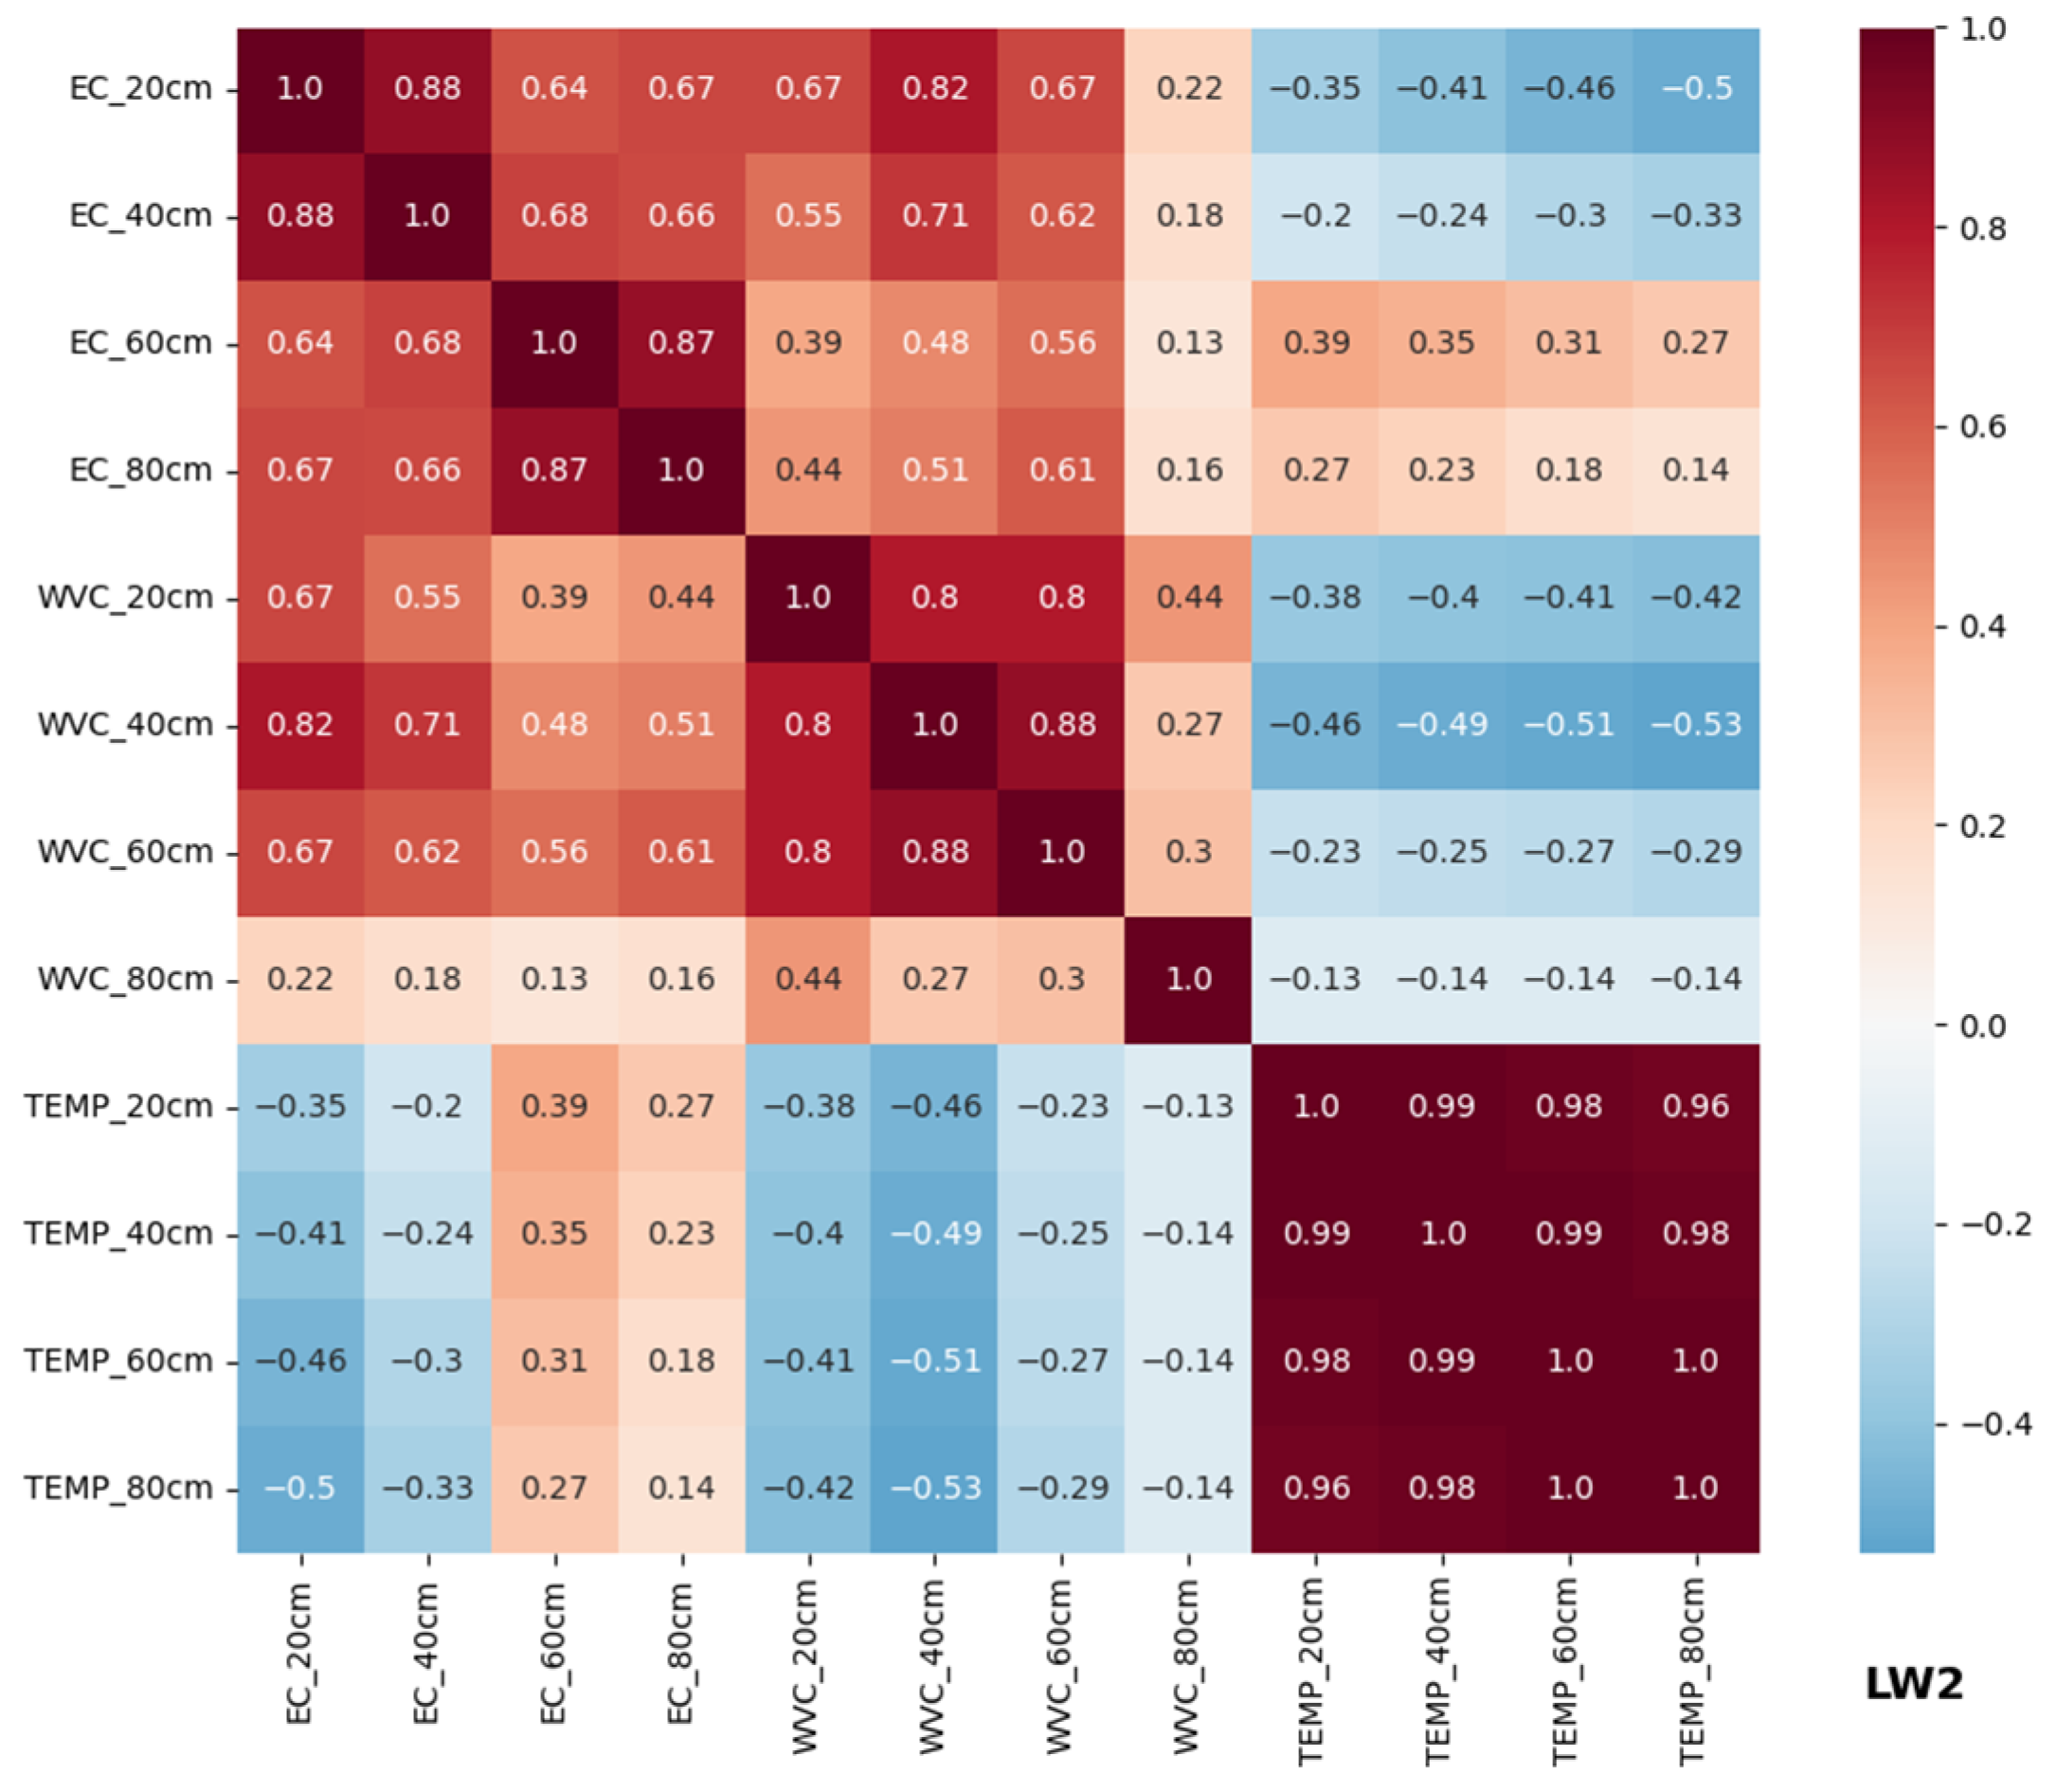
As shown in Figure 11, soil temperature (TEMP) at different depths in the LW2 area exhibited a very strong positive correlation (r > 0.96). It reflects consistent vertical variation trends and synchronized fluctuation characteristics of soil temperature across soil layers. Vertical correlation of soil electrical conductivity (EC) displayed obvious stratified features. The correlation coefficient reached 0.88 between 20 cm and 40 cm depths, and 0.87 between 60 cm and 80 cm depths, revealing high synchronous variation in EC within the top layer (20–40 cm) and the deep layer (60–80 cm). The correlation values between the top and deep layers ranged from 0.64 to 0.67, which demonstrated continuous variation along vertical profiles and notable stratification differences. At identical depths, EC and soil volumetric water content (VWC) showed a significant positive correlation, with coefficients of 0.67 at 20 cm, 0.71 at 40 cm, 0.56 at 60 cm, and 0.16 at 80 cm. Relatively close covariation existed between EC and VWC in the 20–60 cm soil layer, while the correlation degree dropped sharply at 80 cm depth. The correlation between EC and TEMP varied distinctly with soil depth. Negative correlations were observed at 20 cm and 40 cm with coefficients of −0.35 and −0.20, and weak positive correlations occurred at 60 cm and 80 cm with coefficients of 0.39 and 0.27, presenting varied correlation states along vertical soil profiles. Soil water content also showed stratified vertical correlation. Correlation coefficients among the 20–60 cm layers ranged from 0.80 to 0.88, reflecting highly synchronized moisture variation in the top and middle soil layers. By comparison, the correlation values between the 80 cm depth and other layers were only 0.16–0.44, meaning deep soil moisture varied relatively independently and had a weak linkage with upper soil moisture. VWC and TEMP maintained a significant negative correlation, with respective coefficients of −0.38 (20 cm), −0.46 (40 cm), −0.23 (60 cm), and −0.13 (80 cm). Soil moisture in the 20–40 cm layer had the closest covariation with temperature fluctuation.
Figure 11.
Heatmap of the correlations among soil moisture, temperature, and salinity across different soil layers at the LW2 location.
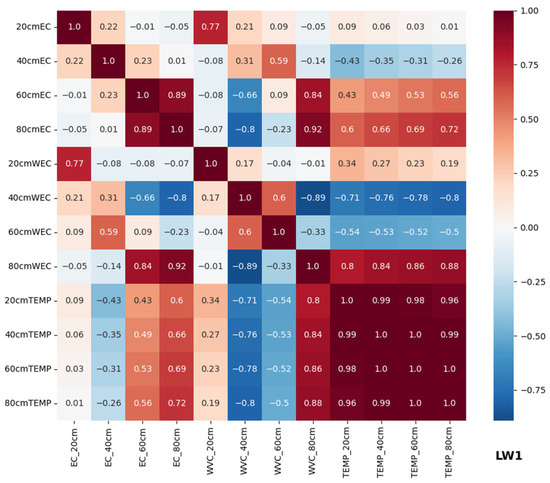
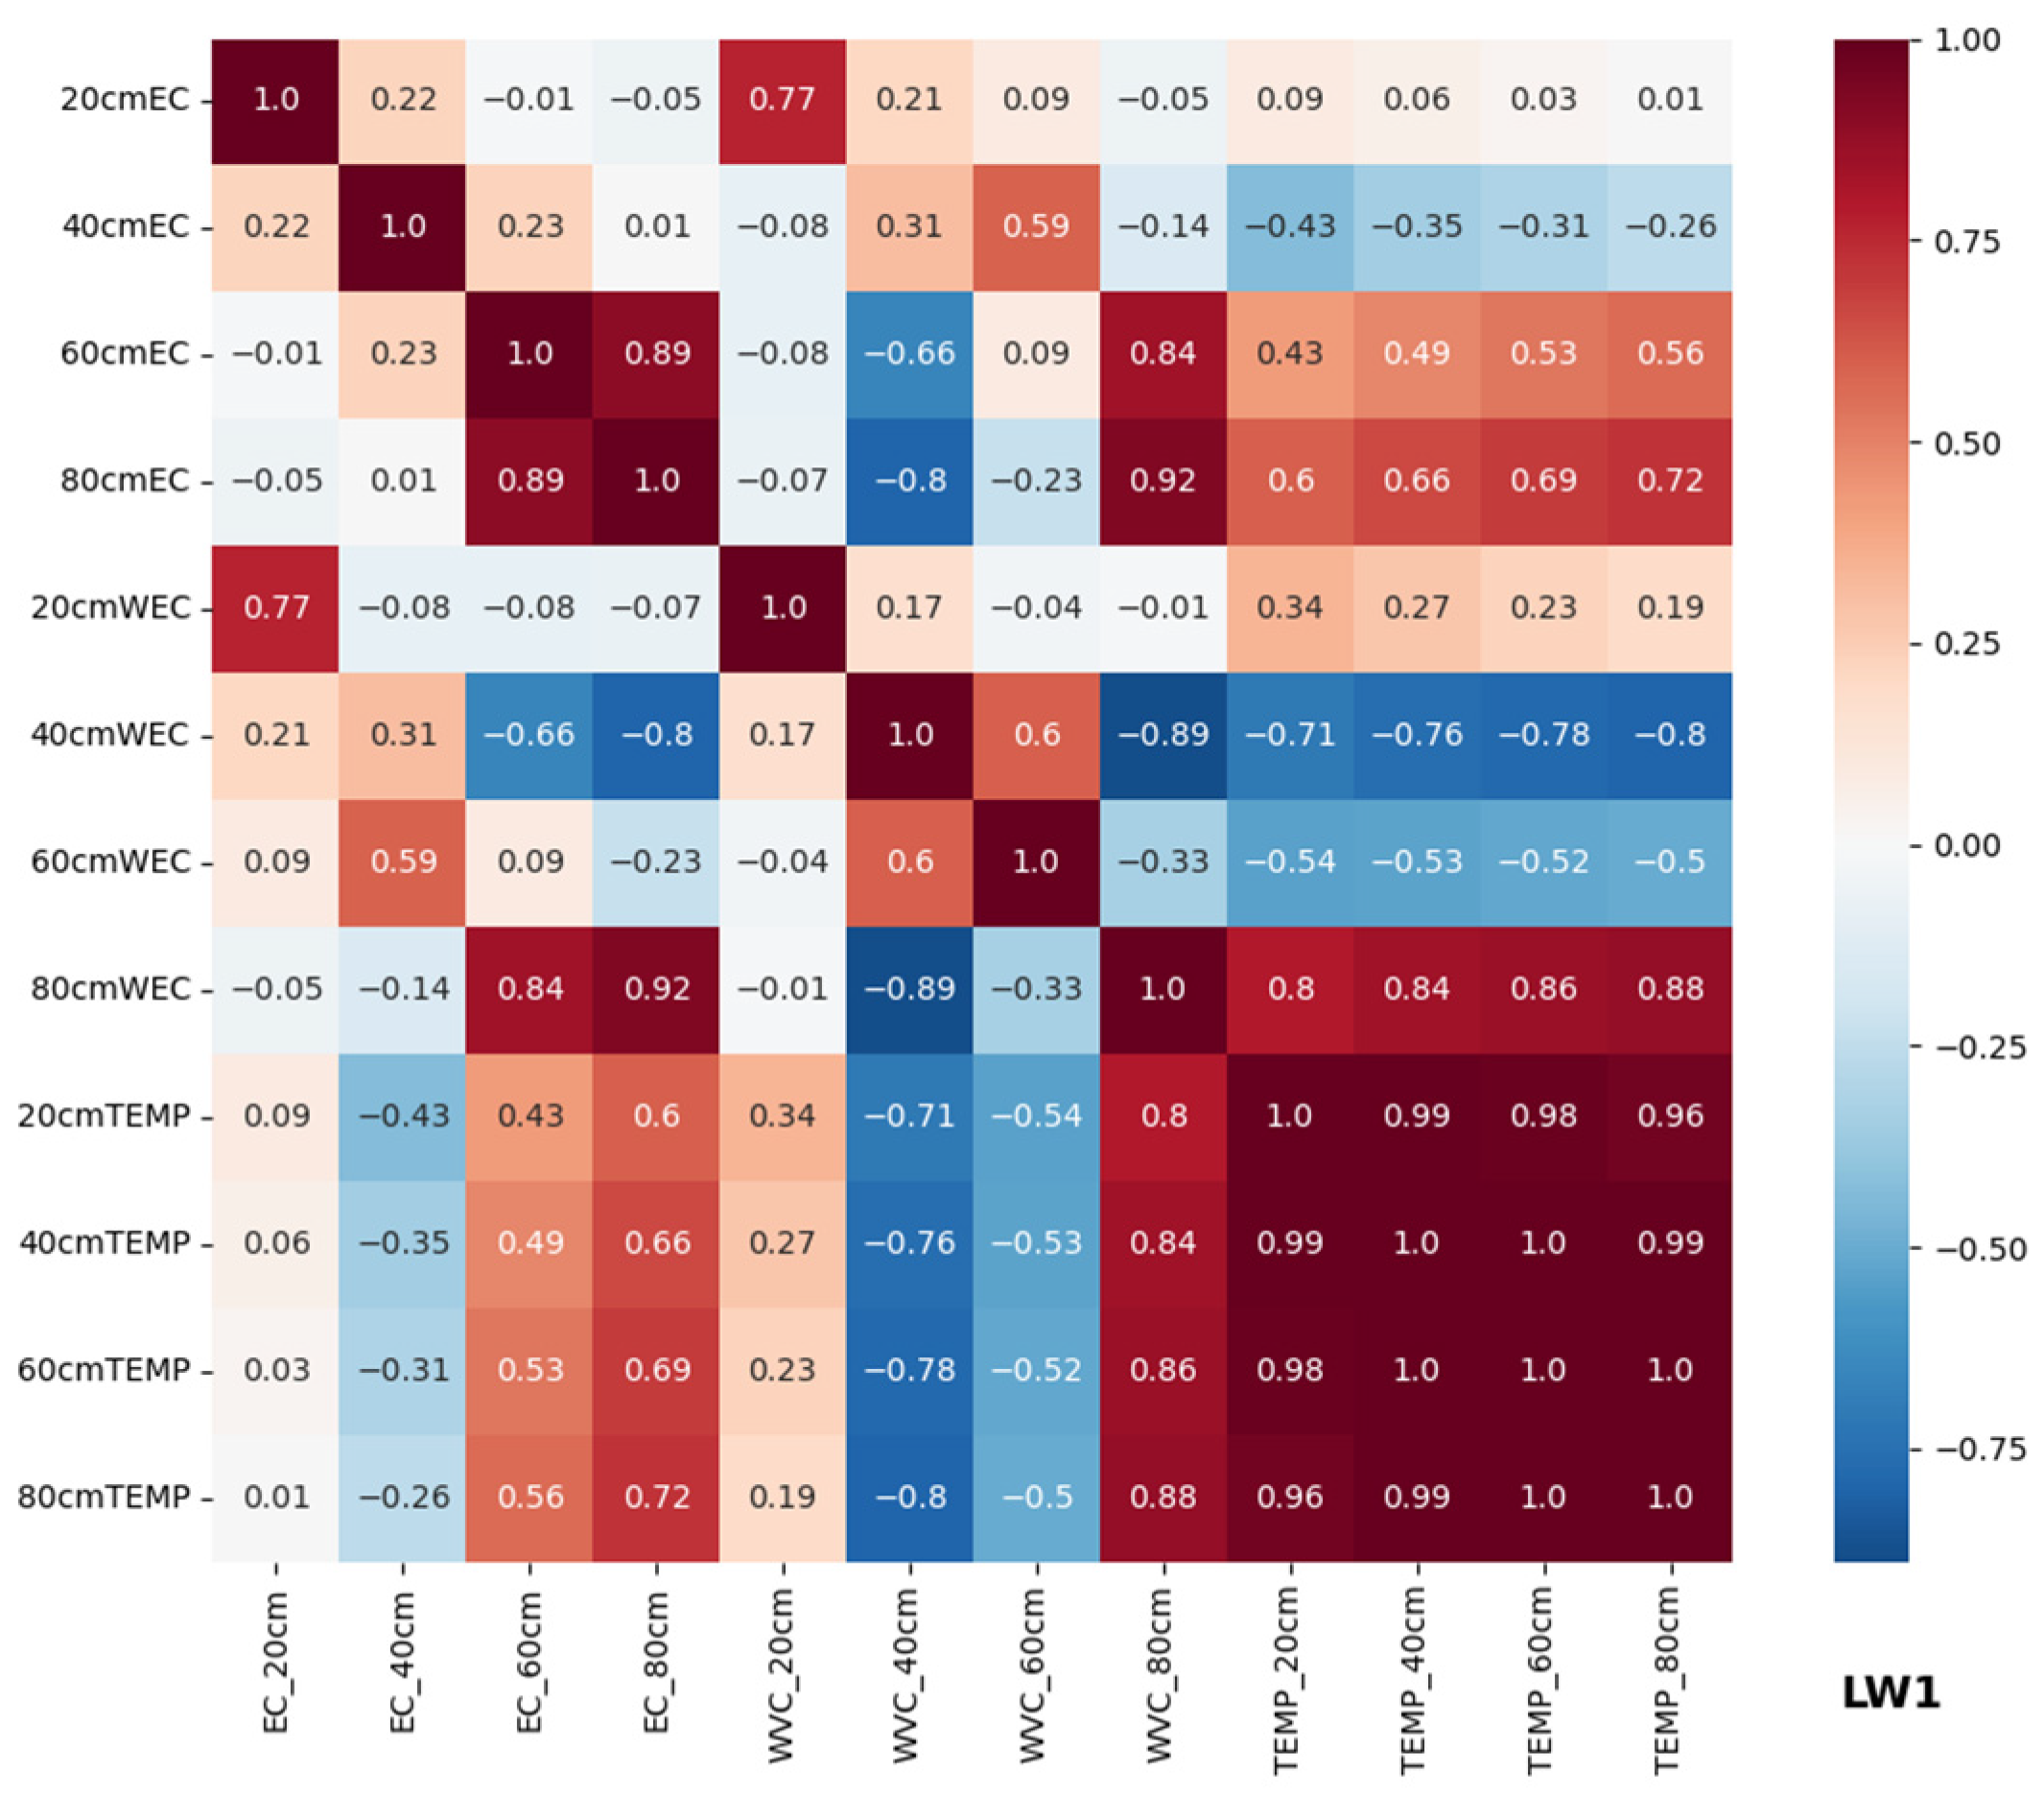
As shown in Figure 12, soil temperatures (TEMP) at different depths in the LW1 area exhibited extremely strong positive correlations (r > 0.96), which reflected consistent vertical variation trends and synchronized temporal fluctuations of soil temperature across layers. Vertical correlations of soil electrical conductivity (EC) presented obvious stratified traits. The correlation coefficient between EC at 60 cm and 80 cm reached 0.89, showing strong synchronous variation in EC across deep soil layers. By comparison, EC values at 20 cm and 40 cm showed weak correlation with those at 60–80 cm, with coefficients ranging from −0.05 to 0.23, which demonstrated notable vertical differentiation. EC in the 60–80 cm layers showed strong positive covariation with volumetric water content (VWC) and TEMP at corresponding depths. Specifically, EC at 80 cm had correlation coefficients of 0.92 and 0.72 with local VWC and TEMP, respectively, revealing close concurrent variation among these three indicators in deep soil. VWC at 40 cm displayed contrasting correlations with deeper soil moisture. The coefficient was 0.60 between 40 cm and 60 cm VWC, while it was −0.89 between 40 cm and 80 cm VWC, suggesting evident stratification of soil moisture around the 40 cm layer. Correlations between VWC and TEMP differed greatly along the vertical profile. VWC at 40 cm showed a strong negative correlation with TEMP at all depths, with coefficients from −0.71 to −0.80. In contrast, VWC at 80 cm showed a strong positive correlation with TEMP across depths, ranging from 0.80 to 0.88, presenting divergent concurrent variation characteristics of middle and deep soil moisture against temperature changes. VWC at 40 cm showed a strong negative correlation with deep-layer EC (r = −0.80), while deep VWC shared prominent positive covariation with local EC, with the coefficient reaching 0.92 at 80 cm. Such phenomena reflect distinct vertical matching relationships between soil moisture and salt distribution. TEMP was positively correlated with deep EC and VWC, and negatively correlated with VWC at 40 cm.
Figure 12.
Heatmap of the correlations among soil moisture, temperature, and salinity across different soil layers at the LW1 location.
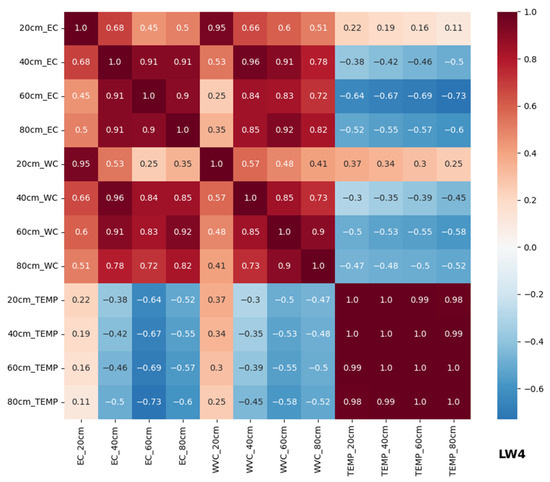
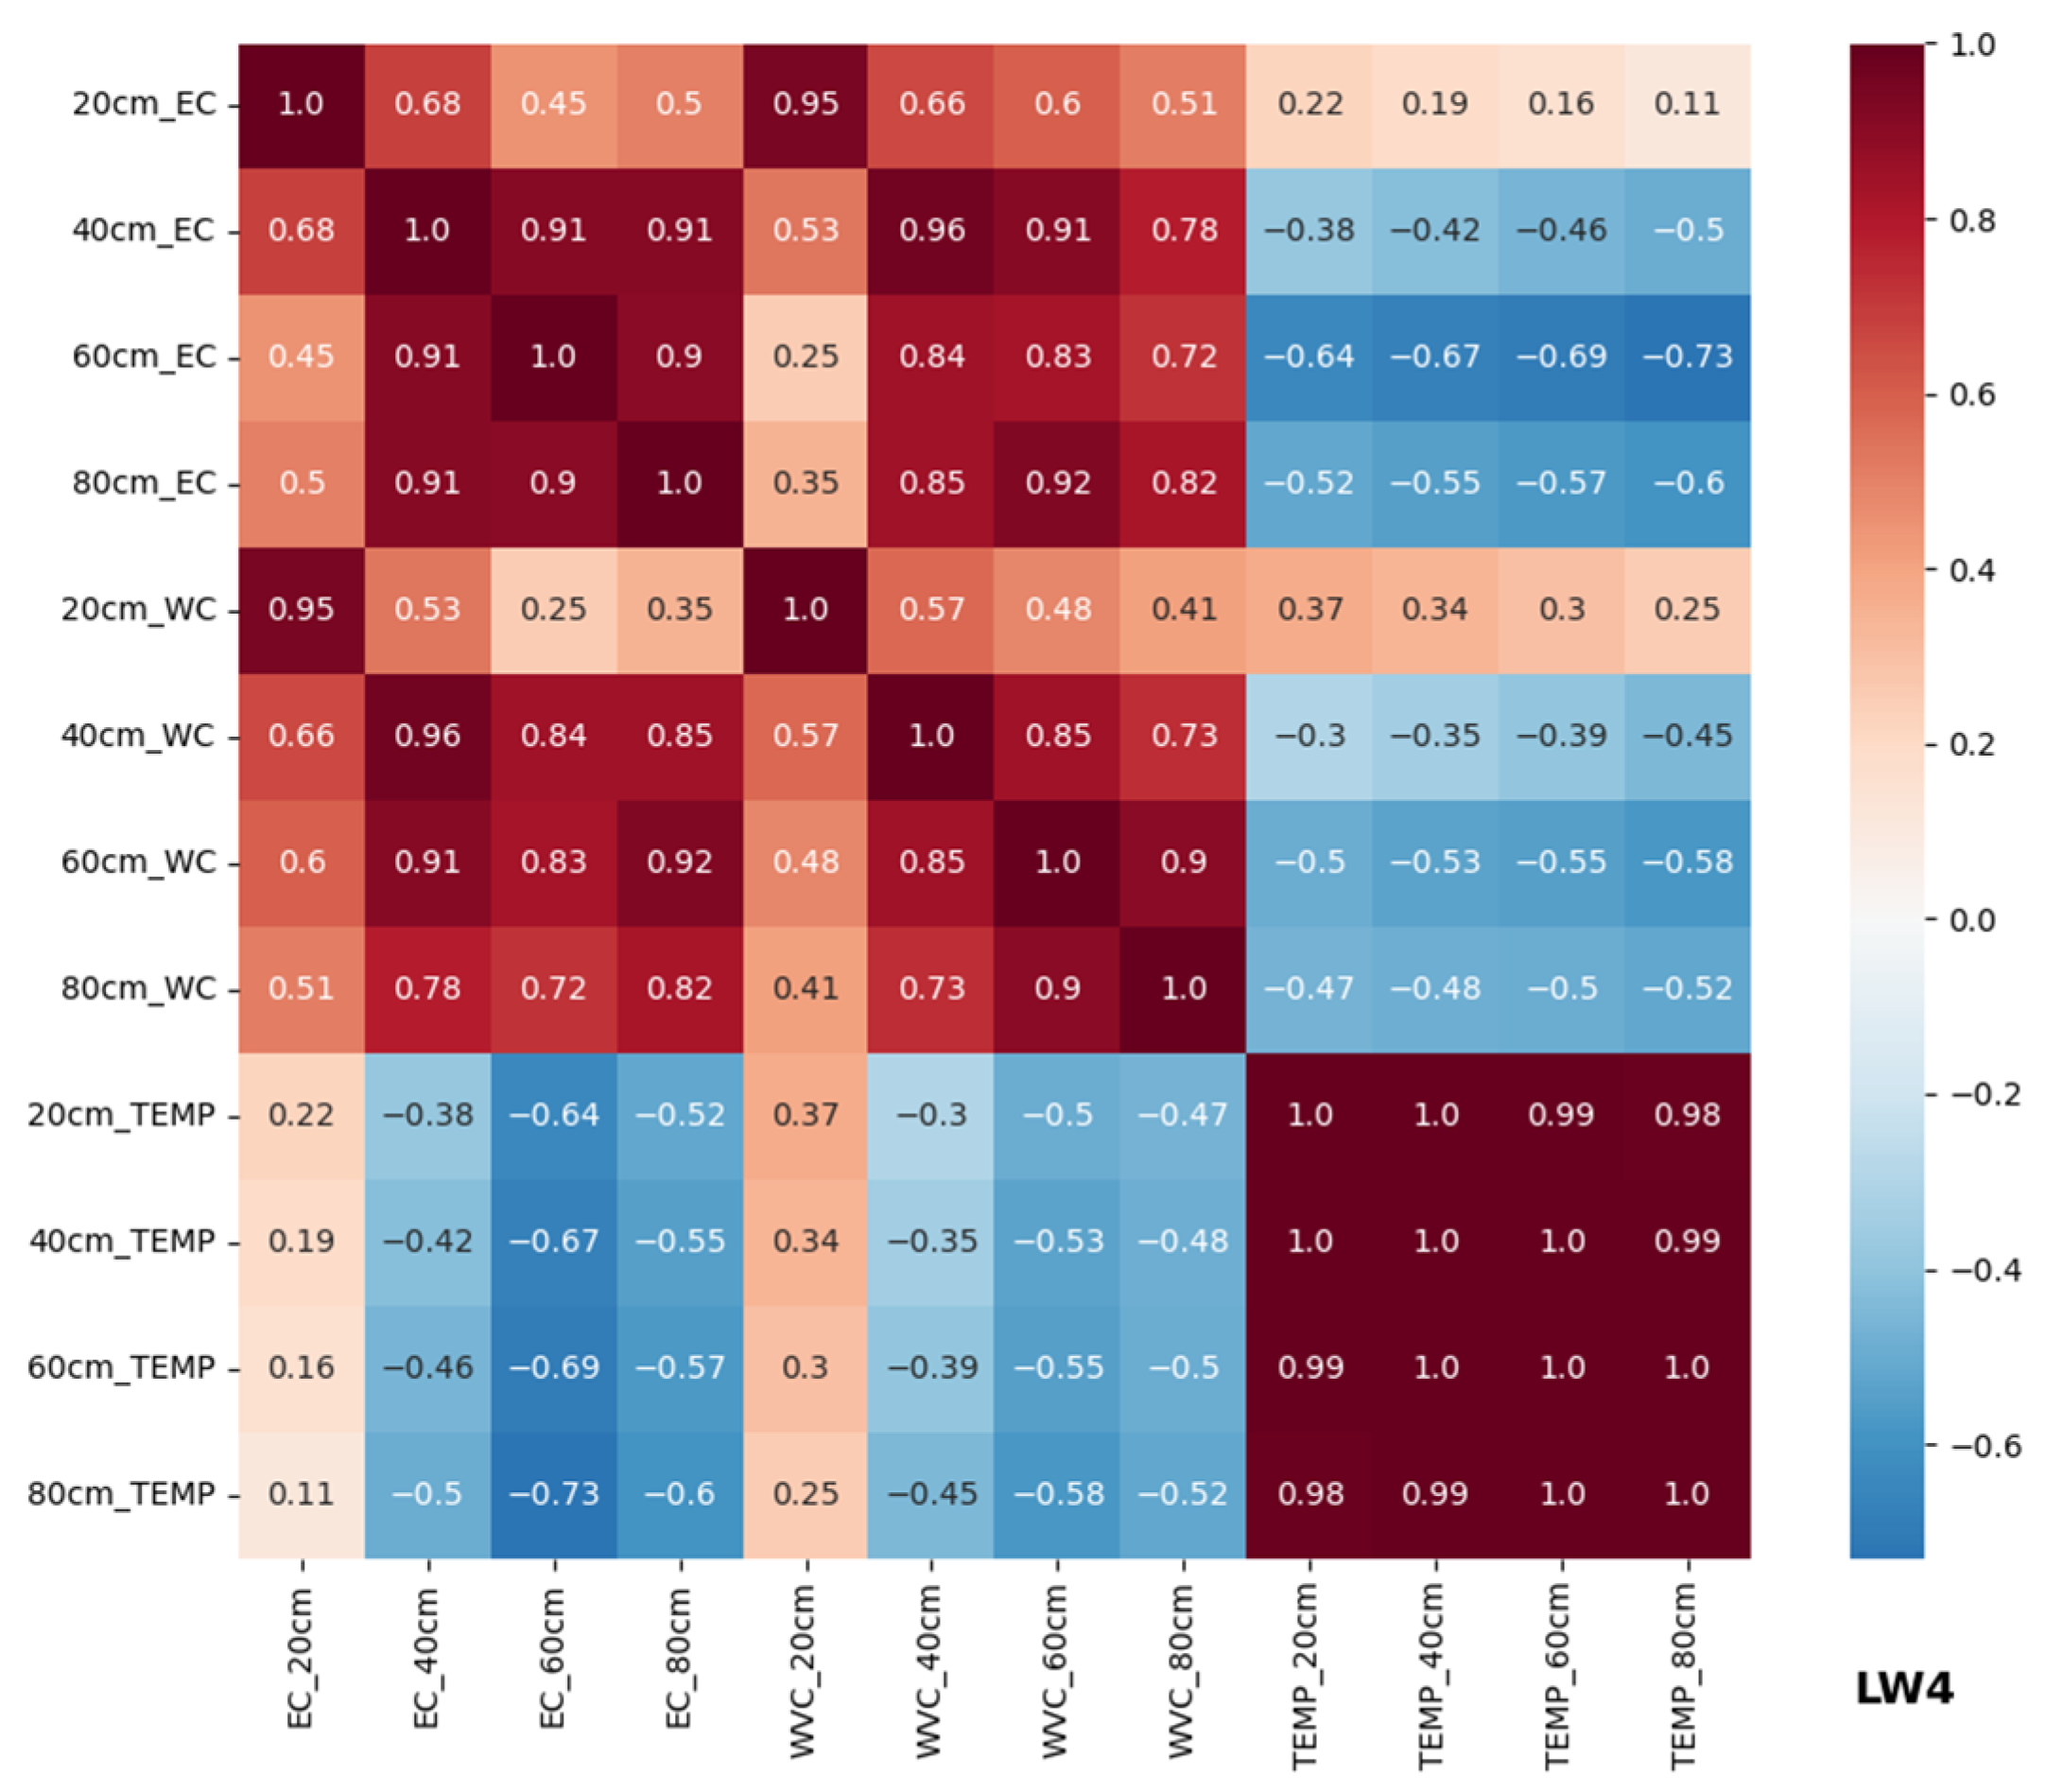
As shown in Figure 13, soil temperature (TEMP) across different depths in the LW4 area exhibited extremely strong positive correlations (r > 0.98), reflecting consistent variation trends and synchronized fluctuations along the vertical soil profile. EC values at 40 cm, 60 cm, and 80 cm showed correlation coefficients ranging from 0.90 to 0.91, indicating high synchronous variation in electrical conductivity in the middle and deep soil layers. EC at 20 cm showed correlation coefficients of 0.45 to 0.68 with middle and deep layers, revealing partial continuity alongside obvious vertical stratification characteristics. At identical depths, EC displayed prominent positive covariation with volumetric water content (VWC), with coefficients recorded as 0.95, 0.96, 0.83, and 0.82 at 20 cm, 40 cm, 60 cm, and 80 cm, respectively. The closest concurrent variation between water and salt occurred at depths of 20–40 cm, and the association maintained a relatively high level in deeper soil. The association between EC and TEMP varied by depth, with corresponding coefficients of 0.22, −0.38, −0.64, and −0.52 at the four layers. The negative correlation strength gradually increased as soil depth increased, presenting differentiated correlation patterns at different vertical positions. VWC at 40 cm, 60 cm, and 80 cm shared strong synchronous variation, with correlation coefficients between 0.85 and 0.90. Moisture at 20 cm had a relatively weak linkage with middle- and deep-soil water, with coefficients ranging from 0.41 to 0.57. Close covariation between VWC and EC dominated the 20–40 cm layer, and the correlation stayed high in deeper strata, suggesting strong overall water-salt co-variation in this zone. VWC correlated negatively with TEMP at all depths, with coefficients of 0.37, −0.30, −0.50, and −0.47, respectively. The negative association intensified with increasing depth, following a similar variation tendency to that observed between EC and temperature. TEMP maintained nearly perfect synchronous changes throughout vertical layers, with correlation coefficients over 0.98, and many values close to 1.00, and no evident stratification was observed. Correlation patterns of TEMP with EC and VWC presented clear vertical gradient differences, showing a weak positive association in topsoil and a remarkable negative covariation in middle and deep layers, and the negative correlation became more distinct at greater depths.
Figure 13.
Heatmap of the correlations among soil moisture, temperature, and salinity across different soil layers at the LW4 location.
4. Discussion
This study is designed as a gradient-based observational case study focused on the specific hydro-ecological conditions of the Niya River riparian zone. It aims to characterize the spatiotemporal patterns of groundwater, soil water-salt-heat dynamics, and vegetation responses along a river-to-desert gradient. The results presented here reflect the unique climatic, soil, and hydrological settings of this hyper-arid inland river basin. Accordingly, this work does not attempt to provide universally generalizable patterns for surface water-groundwater interaction zones across all arid regions. Instead, it offers detailed, site-specific evidence to support the understanding of local ecohydrological processes.
4.1. Water and Salt Migration Patterns in the Interacting Zone of Arid Areas
Soil electrical conductivity (EC) at all sites showed notable seasonal fluctuations and spatial heterogeneity, with synchronous changes observed around November (Figure 14). At LW2, EC at different depths exhibited minor peaks in early November, whereas peaks at LW1 were delayed. This phenomenon coincided with evaporation-related conditions; as soil depth increased, the influence associated with evaporation gradually weakened [33]. Surface soil was more exposed to near-surface environmental influences, while deeper soil was less disturbed. During periods of groundwater-river interaction, salts displayed vertical movement tendencies, and deep-layer EC often reached high values in advance. These observations are consistent with a descriptive pattern of “surface and deep-layer accumulation” of salts in arid interaction zones.
Figure 14.
Soil Salinity Response Diagrams at Different Locations.
In January, surface soil EC at LW3 and LW4 decreased noticeably, which coincided with field-observed precipitation and snowmelt inputs during this period. Dilution associated with seasonal water input coincided with reduced surface salinity, reflecting a synchronous response between short-term hydrological events and surface salinity. However, continuous quantitative data on precipitation, snowmelt, temperature, and evapotranspiration were unavailable, so the relative contributions of these factors could not be distinguished.
The dynamic changes in soil volumetric water content (VWC) were closely coupled with temperature and salt migration [34]. LW3, close to the river, maintained high soil moisture throughout the year with low variability (Figure 15). In January, VWC and EC at LW1 and LW4 declined simultaneously, coinciding with the period when soil temperature fell below 0 °C. The reduction in liquid water coincided with downward movement of water and salts in the profile, leading to synchronous decreases in surface VWC and EC. This pattern coincides with the typical freeze-thaw-related water-salt movement observed in cold arid regions but remains an interpretive inference rather than a directly verified pattern.
Figure 15.
Soil Moisture Response Diagrams at Different Locations. (Volumetric water content at monitoring sites LW3, 20 cm and 40 cm soil depths maintains long-term saturated conditions.).
4.2. Water and Salt Migration Patterns in the Interacting Zone of Arid Areas
Vegetation growth conditions coincided with combined soil water, salinity, and environmental conditions. Reed height at LW1 was higher than at other sites, and plant height generally increased with distance from the river. This pattern does not support a simple “more water = better growth” relationship. At sites near the river (LW3, LW2), soil moisture was high, but EC values were also elevated, and these conditions coincided with relatively weak vegetation growth. With increasing distance from the river, lower EC and moderate moisture coincided with more vigorous reed growth. These observations suggest that vegetation performance coincided with a combined water-salt condition rather than a single factor [35,36,37].
Soil temperature at all sites showed strong seasonal synchrony, and stability increased with depth. Sites closer to the river exhibited smaller temperature fluctuations and higher minimum temperatures during cold periods. These thermal patterns coincided with river proximity and may relate to heat-related processes associated with high soil moisture and water bodies [38,39]. However, direct verification of the “thermal buffering effect” was not conducted, and this remains an interpretive statement.
Vertical coupling patterns among temperature, moisture, and salinity differed among sites. At LW4, temperature was negatively related to EC and VWC in deeper layers. At LW1, temperature was positively related to deep-layer EC. These different covariation patterns coincided with contrasting vegetation growth status among sites, but causal relationships were not established.
4.3. Interaction Characteristics and Patterns Among Soil Water, Salinity, and Temperature in the Interacting Zone
4.3.1. Spatial Differentiation of Water-Salt-Heat Coupling Driven by Soil Texture Variability
Water-Salt-Heat coupling patterns from near-river to far-river sites coincided with differences in groundwater conditions, soil particle composition, and environmental disturbance. At LW2, groundwater was shallow. Soil temperatures at different depths were highly vertically synchronized, indicating efficient heat transfer. These characteristics coincided with previous observations that finer soil particles correspond to higher thermal conductivity [40].
Vertical EC structure at LW2 showed stratified synchronization: high correlation within upper layers and within deep layers, and lower correlation between upper and deep layers. This stratification coincided with vertical moisture movement patterns and may be related to root-related water use processes, but it lacks direct root observation evidence [41]. The zero content of coarse and medium sand (Table 2) indicates a fine pore-dominated structure (silt and very fine sand). This texture typically results in low saturated hydraulic conductivity (due to increased flow resistance) and strong capillary rise (due to high specific surface area). Consequently, water and salt movement along the transect was governed by capillary rather than gravitational flow. This explains the persistently high moisture at LW3 and the elevated surface electrical conductivity at near-river sites, as upward capillary transport during evaporation exceeds downward leaching. The absence of coarse sand also reduces deep percolation, reinforcing the observed water-salt accumulation patterns in shallow soils near the river.
Table 2.
Table of soil particle-size fractionation results.
4.3.2. Water-Salt Redistribution and Temperature-Related Patterns During the Freeze-Thaw Process
Synchronous declines in surface VWC and EC at LW1 and LW4 in winter coincided with seasonal freezing periods. During periods when surface soil was frozen, liquid water content decreased, and water and salt displayed concurrent downward movement tendencies. This pattern coincides with widely reported freeze-thaw water-salt behaviors in seasonally frozen regions [42,43], but remains an interpretive inference.
Soil texture differences among sites coincided with different coupling strengths of water-salt-heat. LW4 had a higher proportion of fine sand and showed relatively strong coupling in deep layers. These vertical stratification patterns coincided with textural effects on permeability and moisture-holding capacity, but without measured hydraulic conductivity, capillary rise, or porosity, interpretive power is limited [40].
4.3.3. Biological Correlations of Vertical Water-Salt Distribution Through Root-Soil Interactions
Reed growth performance coincided with vertical water-salt distribution. At LW1, where vegetation was most vigorous, the middle soil layer (20–40 cm) coincided with weakened vertical EC correlation. This pattern may be related to root water uptake processes, but root distribution and activity were not directly measured. Thus, biological regulation remains a plausible hypothesis rather than a confirmed pattern [41].
Deep soil (60–80 cm) at most sites exhibited high synchronization among EC, VWC, and TEMP, which coincided with stable environmental conditions and uniform texture. The sharp reduction in correlation between EC and VWC at 80 cm in some profiles coincided with relatively stable deep moisture and slow movement, which may limit salt leaching and transport.
4.3.4. Vertical Differentiation Characteristics of Temperature-Water-Salt Coupling
Temperature-EC relationships differed vertically: negative in upper layers and weakly positive in deep layers. These patterns coincided with vertical differences in evaporation intensity and groundwater influence. Upper layers were more affected by near-surface heat and evaporation, while deep layers were more stable and less disturbed. These are interpretive summaries of covariation patterns, not verified driving patterns.
4.4. Global Implications of Water-Salt-Heat Dynamics and Comparison with Regional and Global Basins
The water-salt-heat coupling patterns and vegetation response thresholds observed in this study can be compared with global basins to contextualize regional characteristics. In the Amazon Basin, shallow groundwater (<2 m) coincides with reduced forest productivity, while 2–4 m coincides with favorable growth [19]. In our study, excessively shallow groundwater near the river (<1.5 m) coincided with high salinity and weak vegetation growth, while moderate depths (2–3 m) coincided with optimal performance. This consistency suggests that 2–4 m may represent a broadly favorable groundwater depth range for riparian vegetation across different climate zones [21,22].
Major differences arise from salinity and evaporative demand. Unlike the humid Amazon, the Niya River Basin is characterized by strong evaporation and salt accumulation. Vegetation performance coincided with water-salt balance rather than water alone. This pattern is consistent with observations from other arid basins in Central Asia, where salinity gradients strongly coincide with vegetation distribution [16,19]. These comparisons highlight that in hyper-arid endorheic basins, water-salt-heat covariation replaces single hydrological factors as a key descriptor of ecological conditions.
Freeze-Thaw Salinity Migration in Cold Arid and Permafrost Regions
The observed freeze-thaw-related water-salt movement coincides with patterns reported in seasonally frozen regions of the Qinghai-Tibet Plateau and Central Asia, where freezing coincides with downward water and salt movement [40,42]. However, the Niya River area is not underlain by permafrost, and vertical flow is less restricted. The silt-dominated soil and continuous groundwater recharge coincide with nearly complete seasonal resetting of salinity profiles. This fills a descriptive gap between permafrost and non-permafrost cold desert hydrology, but does not establish a new general pattern.
4.5. Comparison with Global Basins: Water-Salt-Heat Thresholds and Vegetation Responses
Our findings reveal several quantitative thresholds that can be compared with those reported from other major river basins worldwide. Specifically, we observed that P. australis achieved optimal growth (height >200 cm, highest photosynthetic rates) at groundwater depths of approximately 2–3 m (LW1), while excessively shallow groundwater (<1.5 m at LW3) combined with high salinity (EC up to 16,000 μS cm−1) coincided with reduced growth (height ~104 cm). This pattern is broadly consistent with the Amazonian forests studied by Sousa et al. [22], who found that water table depths <2 m reduced forest biomass productivity due to hypoxic stress, whereas depths of 2–4 m supported favorable growth. Thus, a moderate groundwater depth range of 2–4 m appears to be a favorable condition across biomes for riparian vegetation, from hyper-humid tropics to hyper-arid deserts.
However, a major discrepancy emerges when salinity is considered. In the Amazon, where precipitation greatly exceeds evapotranspiration, salt accumulation is negligible, and vegetation response is primarily governed by oxygen availability and root anchorage. In contrast, our study site in the Tarim Basin experiences extreme evaporative demand (potential evapotranspiration ~2756 mm vs. precipitation ~30 mm). Under such conditions, salinity becomes a co-dominant driver that can override the positive effect of shallow groundwater. For example, LW3 had the shallowest groundwater and highest soil moisture but exhibited poor vegetation performance due to severe salt stress. This water-salt antagonism is rarely reported in humid basins but aligns with findings from other arid inland basins in Central Asia, such as the Heihe River and the Tarim River mainstream, where salinity gradients strongly correlate with vegetation distribution [18,20].
Regarding soil thermal regimes, our observed vertical damping of temperature fluctuations (20 cm amplitude: −1.5 °C to 24 °C; 80 cm amplitude: −0.2 °C to 28 °C) is typical of unsaturated zones globally. However, the river-proximity effect on thermal stability (smaller fluctuations near rivers) has been quantified in only a few arid-zone studies. This buffering capacity, likely linked to high soil moisture and latent heat exchange, is comparable to observations in large tropical rivers (e.g., the Amazon), but its ecological significance is amplified in cold deserts where freeze-thaw cycles affect root survival and salt redistribution.
Finally, the freeze-thaw-driven downward migration of water and salt observed in winter (surface EC and VWC synchronous decline at LW1 and LW4) is consistent with seasonal freezing patterns documented in the Qinghai-Tibet Plateau and Central Asian permafrost-affected regions [40,43]. Unlike permafrost sites, however, the Niya River transect lacks persistent frozen ground, allowing near-complete seasonal resetting of the salinity profile during the following warm season. This highlights a distinct hydrologic behavior of non-permafrost cold arid interaction zones, which remains underrepresented in global comparisons.
In summary, our study confirms that a groundwater depth of 2–4 m is favorable for riparian vegetation across contrasting climates, but in hyper-arid endorheic basins, water-salt-heat co-variation replaces single-factor hydrological control. This dual constraint (water availability and salinity) should be incorporated into ecohydrological models and groundwater management strategies for dryland regions worldwide.
4.6. Limitations of the Study
Several limitations should be acknowledged. First, the one-year monitoring period (August 2024–August 2025) may not capture inter-annual climatic variability, which could affect long-term soil and vegetation stability. Second, the absence of continuous groundwater chemical data prevents direct linkage between solute sources and surface soil salinity, as well as quantification of geochemical processes. Third, only one transect perpendicular to the river was established; multiple transects would be needed to strengthen spatial generalization. Additionally, we did not apply isotopic tracing to separate physical hydrological processes from biological root uptake. These limitations provide clear directions for future research involving multi-year monitoring, groundwater geochemistry, replicated transects, and isotope-based partitioning.
5. Conclusions
(1) In the surface water-groundwater interaction zone of the Niya River Basin, groundwater level, soil water, salinity, and temperature all exhibited pronounced spatiotemporal heterogeneity. Groundwater depth increased with distance from the river and showed an overall “decrease-then-increase” trend from August 2024 to August 2025. The anomalously shallow groundwater depth observed in March 2025 coincided with field-observed atmospheric precipitation recharge. Soil temperature stability increased with depth, and seasonal fluctuations were milder at sites closer to the river. Soil moisture fluctuations decreased with increasing depth, and deep layers generally remained relatively stable. Soil salinity was negatively correlated with distance from the river, with greater variability in surface layers than in deep layers. The coefficients of variation (CV) of soil moisture and salinity also differed noticeably between wet and dry seasons.
(2) Vegetation growth in the arid interaction zone was not related to water availability alone. Reed growth corresponded to combined conditions of soil moisture, salinity, and aeration. Sites farther from the river with more balanced moisture-salinity conditions and better aeration corresponded to more favorable reed growth performance.
(3) Soil moisture, salinity, and temperature showed distinct spatial differences in their correlation structures. At LW4, deep layers (40–80 cm) exhibited strong coupling between salinity and moisture; shallow layers showed negative temperature correlations, while deep layers showed positive correlations. At LW1, deep moisture and salinity were closely correlated, and temperature was positively related to deep salinity. At LW2, shallow moisture and salinity were highly consistent and positively correlated overall. Soil temperature at all sites showed extremely strong vertical positive correlations, indicating highly synchronized vertical temperature dynamics.
(4) Ecological patterns in the arid surface water-groundwater interaction zone are characterized by coordinated changes involving groundwater, soil water, salt, heat, and vegetation. Vegetation responses to soil and water conditions show clear spatial heterogeneity that corresponds to multiple environmental gradients. These findings provide a site-specific observational basis for understanding riparian ecohydrological patterns in hyper-arid inland rivers.
Author Contributions
All authors contributed to the conception and design of the study. The trial preparation, data collection, and analysis were carried out jointly by Y.Z. The first draft of the manuscript was written by T.L. (Tianchao Liu) and T.L. (Tong Li), Y.G., T.L. (Tong Li), S.L. and F.J. proposed revisions. All authors have read and agreed to the published version of the manuscript.
Funding
Supported by the Open Foundation of the Key Laboratory of Coupling Process and Effect of Natural Resources Elements (No.2024KFKT013).
Institutional Review Board Statement
Not applicable.
Informed Consent Statement
Not applicable.
Data Availability Statement
The data that support the findings of this study are available from the corresponding author upon reasonable request.
Conflicts of Interest
The authors declare no conflicts of interest.
References
- Sophocleous, M. Interactions between groundwater and surface water: The state of the science. Hydrogeol. J. 2002, 10, 52–67. [Google Scholar] [CrossRef] [Scilit]
- Boulton, A.J.; Findlay, S.; Marmonier, P.; Stanley, E.H.; Valett, H.M. The functional significance of the hyporheic zone in streams and rivers. Annu. Rev. Ecol. Syst. 1998, 29, 59–81. [Google Scholar] [CrossRef] [Scilit]
- Krause, S.; Hannah, D.M.; Fleckenstein, J.H.; Heppell, C.M.; Kaeser, D.; Pickup, R.; Trimmer, M.; Waddington, J.; Wood, P.J. Inter-disciplinary perspectives on processes in the hyporheic zone. Ecohydrology 2011, 4, 481–499. [Google Scholar] [CrossRef] [Scilit]
- Saito, L.; Byer, S.; Munn, L.; Badik, K.; Provencher, L.; McEvoy, D.J.; Rohde, M.M. Strategies to address risks to groundwater dependent ecosystems. Hydrol. Process. 2025, 39, e70229. [Google Scholar] [CrossRef] [Scilit]
- Rohde, M.M.; Albano, C.M.; Huggins, X.; Klausmeyer, K.R.; Morton, C.; Sharman, A.; Zaveri, E.; Saito, L.; Freed, Z.; Howard, J.K.; et al. Groundwater-dependent ecosystem map exposes global dryland protection needs. Nature 2024, 632, 101–107. [Google Scholar] [CrossRef] [Scilit] [PubMed]
- Stromberg, J.C.; Tiller, R.; Richter, B. Effects of groundwater decline on riparian vegetation of semiarid regions: The San Pedro, Arizona. Ecol. Appl. 1996, 6, 113–131. [Google Scholar] [CrossRef] [Scilit]
- Bahir, M.; Ouhamdouch, S.; Ouazar, D.; El Moçayd, N. Climate change effect on groundwater characteristics within semi-arid zones from western Morocco. Groundw. Sustain. Dev. 2020, 11, 100380. [Google Scholar] [CrossRef] [Scilit]
- Zhu, Y.; Li, G.; Zhang, G.; Fu, B. Soil security: From Earth’s critical zone to ecosystem services. Acta Geogr. Sin. 2015, 70, 1859–1869. [Google Scholar] [CrossRef]
- Yang, A.; Zhang, X.; Li, Z. Quantitative impacts of climate change and human activities on vegetation net primary productivity in Qilian Mountain National Park. Acta Ecol. Sin. 2023, 43, 1784–1792. [Google Scholar] [CrossRef] [Scilit]
- Prashar, P.; Shah, S. Impact of fertilizers and pesticides on soil microflora in agriculture. In Sustainable Agriculture Reviews; Lichtfouse, E., Ed.; Springer: Cham, Switzerland, 2016; Volume 19, pp. 331–361. [Google Scholar] [CrossRef] [Scilit]
- Gao, Q.; Shi, X.; Zhang, C. Dynamic assessment and prediction on quality of agricultural eco-environment in county area. Trans. Chin. Soc. Agric. Eng. 2014, 30, 228–237. [Google Scholar]
- Song, J.; Gao, J.; Li, X. Variation law of evapotranspiration and its driving factors in the Loess Plateau in recent 20 years. J. Northwest Univ. Nat. Sci. Ed. 2023, 53, 974–990. [Google Scholar]
- Yuan, Y.J.; Gao, X.R.; Huang, K.J. Quantitative simulation of hydrological elements based on RHESSys model in Yanhe River Basin. South North Water Transf. Water Sci. Technol. 2023, 21, 116–126. [Google Scholar] [CrossRef]
- Huang, X.; Zhang, J.; Yang, X. Spatial and temporal characteristics of hydrological drought in the Yellow River Basin. J. North China Univ. Water Resour. Electr. Power Nat. Sci. Ed. 2023, 44, 25–34. [Google Scholar] [CrossRef]
- Luo, S.; Xu, Y.; Wang, Q.; Yu, Z.; Lin, Z.; Tang, R.; Jiang, R. The evolution of annual maximum daily runoff and its influencing factors under the background of urbanization: An example of Qinhuai River Basin in the lower reaches of the Yangtze River. J. Lake Sci. 2023, 35, 2123–2132. [Google Scholar]
- Chen, Y.; Li, Z.; Xu, J.; Shen, Y.; Xing, X.; Xie, T.; Li, Z.; Yang, L.; Xi, H.; Zhu, C.; et al. Changes and protection suggestions in water resources and ecological environment in arid region of northwest China. Bull. Chin. Acad. Sci. 2023, 38, 385–393. [Google Scholar] [CrossRef]
- Huang, F.; Zhang, Y.; Zhang, D.; Chen, X. Environmental groundwater depth for groundwater-dependent terrestrial ecosystems in arid/semiarid regions: A review. Int. J. Environ. Res. Public Health 2019, 16, 763. [Google Scholar] [CrossRef] [Scilit] [PubMed]
- Zhu, Y.; Chen, Y.; Ren, L.; Lü, H.; Zhao, W.; Yuan, F.; Xu, M. Ecosystem restoration and conservation in the arid inland river basins of northwest China: Problems and strategies. Ecol. Eng. 2016, 94, 629–637. [Google Scholar] [CrossRef] [Scilit]
- Hao, L.; Liu, X.; Ji, R.; Ma, Y.; Wu, P.; Cao, Q.; Xin, Y. Indirect regulation of topsoil nutrient cycling by groundwater depth: Impacts on sand-fixing vegetation and rhizosphere bacterial communities. Front. Microbiol. 2023, 14, 1285922. [Google Scholar] [CrossRef] [Scilit] [PubMed]
- Yin, X.W.; Feng, Q.; Liu, W.; Zhu, M.; Zhang, J.T.; Liu, W.; Zhang, Z.Y.; Chen, W.J.; Su, Y.Q.; Chai, N.Y.; et al. Revisiting soil properties and plant salt tolerance: Influence of water and salt stress mediated by acute atmospheric drought and chronic groundwater decline on dryland ecosystem stability. J. Hydrol. 2026, 666, 134798. [Google Scholar] [CrossRef] [Scilit]
- Hao, X.; Li, W.; Huang, X.; Zhu, C.; Ma, J. Assessment of the groundwater threshold of desert riparian forest vegetation along the middle and lower reaches of the Tarim River, China. Hydrol. Process. 2010, 24, 178–186. [Google Scholar] [CrossRef] [Scilit]
- Sousa, T.R.; Schietti, J.; Ribeiro, I.O.; Emílio, T.; Fernández, R.H.; ter Steege, H.; Castilho, C.V.; Esquivel-Muelbert, A.; Baker, T.; Pontes-Lopes, A.; et al. Water table depth modulates productivity and biomass across Amazonian forests. Glob. Ecol. Biogeogr. 2022, 31, 1571–1588. [Google Scholar] [CrossRef] [Scilit]
- Munns, R.; Tester, M. Mechanisms of salinity tolerance. Annu. Rev. Plant Biol. 2008, 59, 651–681. [Google Scholar] [CrossRef] [Scilit] [PubMed]
- Jiao, L.; Liu, X.; Wang, S.; Dong, X. Spatial expansion strategy and soil environmental response of the clonal architectures for P. australis in Yangguan Wetland of Dunhuang. Acta Ecol. Sin. 2019, 39, 5317–5325. [Google Scholar] [CrossRef] [Scilit]
- Yang, Z.; Xie, T.; Liu, Q. Physiological responses of P. australis to the combined effects of water and salinity stress. Ecohydrology 2014, 7, 420–426. [Google Scholar] [CrossRef] [Scilit]
- Yang, L.; Lou, Y.; Tang, Z. The response of the functional traits of P. australis and Bolboschoenus planiculmis to water and saline-alkaline stresses. Plants 2025, 14, 2112. [Google Scholar] [CrossRef] [Scilit] [PubMed]
- Liu, S.; Chen, S.; Shang, S. Advances and perspectives of water-heat-salt-crop modelling under film-mulched drip irrigation: A review. J. Irrig. Drain. 2025, 44, 27. [Google Scholar] [CrossRef]
- Mu, D.; Xun, Y.; Gao, Y.; Ren, D.; Sun, C.; Ma, X.; Xu, X. A modified SWAT model for mechanistic simulation of soil water-salt transport and the interactions with shallow groundwater. Hydrol. Process. 2023, 37, e14980. [Google Scholar] [CrossRef] [Scilit]
- Bailey, R.T.; Tavakoli-Kivi, S.; Wei, X. A salinity module for SWAT to simulate salt ion fate and transport at the watershed scale. Hydrol. Earth Syst. Sci. 2019, 23, 3155–3174. [Google Scholar] [CrossRef] [Scilit]
- Liu, S.; Huang, Q.; Zhang, W.; Ren, D.; Huang, G. Improving soil hydrological simulation under freeze-thaw conditions by considering soil deformation and its impact on soil hydrothermal properties. J. Hydrol. 2023, 619, 129336. [Google Scholar] [CrossRef] [Scilit]
- HJ 1311-2023; Technical Specification for Ecological and Environmental Investigation and Monitoring of Protected Areas. Ministry of Ecology and Environment of the People’s Republic of China: Beijing, China, 2023.
- GB 50021-2001; Code for Investigation of Geotechnical Engineering. China Architecture & Building Press: Beijing, China, 2009.
- Sun, C.; Meng, S.; Chen, W. Fluctuations of continuous soil moisture evaporation under different rainfall conditions during the growing period of the non-monsoon season, the eastern Loess Plateau. PeerJ 2024, 12, e18514. [Google Scholar] [CrossRef] [Scilit] [PubMed]
- Zhang, D.; Zhang, J.; Zhang, M.; Lai, Y.; Chen, Z.; Chen, Y. Feedback of hydro-thermal-chemical dynamics on salt-frost heave in sulfate-affected soils: Insights from freeze-thaw cycle experiments. Cold Reg. Sci. Technol. 2026, 241, 104693. [Google Scholar] [CrossRef] [Scilit]
- Zhang, Z.H.; Hu, G.; Zhu, J.D.; Ni, J. Spatial heterogeneity of soil nutrients and its impact on tree species distribution in a karst forest of southwest China. Chin. J. Plant Ecol. 2011, 35, 1038–1049. [Google Scholar]
- Mentges, M.I.; Reichert, J.M.; Rodrigues, M.F.; Awe, G.O.; Mentges, L.R. Capacity and intensity soil aeration properties affected by granulometry, moisture, and structure in no-tillage soils. Geoderma 2016, 263, 47–59. [Google Scholar] [CrossRef] [Scilit]
- Pan, J.; Wang, L.; Huang, C.; You, Q.; Guo, P.; Guo, Q.; Xue, X. Review on effects of salt stress on plant energy metabolism processes in arid regions. J. Desert Res. 2024, 44, 111–118. [Google Scholar]
- Ran, M.X.; Ding, J.J.; Sun, D.B.; Gu, F.X. A review of the response characteristics of soil respiration to temperature and moisture changes under global climate change. Chin. J. Agrometeorol. 2024, 45, 1–11. [Google Scholar]
- Budzey, B.F.; Landhäusser, S.M.; Stewart, K.J. The influence of abiotic (snow fences) and biotic (hedgerows) vertical structures on soil moisture, temperature, and planted seedlings in subarctic mine site reclamation. Geoderma 2025, 462, 117512. [Google Scholar] [CrossRef] [Scilit]
- Wang, E.; Chen, J.; Liu, L.; Cui, L.; Xue, J.; Ren, J.; Du, Q. Effect of soil texture on water and salt transport in freeze-thaw soil in the shallow groundwater area. Water 2023, 15, 2587. [Google Scholar] [CrossRef] [Scilit]
- Meng, Y.; He, Z.; Liu, B.; Chen, L.; Lin, P.; Luo, W. Soil salinity and moisture control the processes of soil nitrification and denitrification in riparian wetlands in extremely arid regions of northwestern China. Water 2020, 12, 2815. [Google Scholar] [CrossRef] [Scilit]
- Zheng, F.; Li, W.; Song, Z.; Xu, D.; Wang, J.; Wang, Y.; Zhang, Y. Simulation test on water and salt transport characteristics of saline soil in Uzbekistan under large temperature difference. PLoS ONE 2025, 20, e0336386. [Google Scholar] [CrossRef] [Scilit] [PubMed]
- Cui, L.; Zhu, Y.; Zhao, T.; Yang, J.; Wu, J. Soil ion components and soil salts transport in frozen layer in seasonal freezing-thawing areas. Trans. Chin. Soc. Agric. Eng. 2019, 35, 75–82. [Google Scholar] [CrossRef]

Disclaimer/Publisher’s Note: The statements, opinions and data contained in all publications are solely those of the individual author(s) and contributor(s) and not of MDPI and/or the editor(s). MDPI and/or the editor(s) disclaim responsibility for any injury to people or property resulting from any ideas, methods, instructions or products referred to in the content. |
© 2026 by the authors. Licensee MDPI, Basel, Switzerland. This article is an open access article distributed under the terms and conditions of the Creative Commons Attribution (CC BY) license.