


Abstract
Against the backdrop of China’s strategic goals of achieving carbon peaking and carbon neutrality, a key question is whether renewable electricity generation (REG) is associated with lower carbon emission intensity (CEI). To address this issue, this study employs panel data from 30 Chinese provinces from 2005 to 2024 and combines the Tapio decoupling model, Moran’s I test, and the spatial Durbin model (SDM), with the ordinary least squares (OLS) used as a benchmark to analyze the decoupling evolution, spatial spillover associations, and potential transmission channels between REG and CEI. The findings show that: (1) the relationship between REG and CEI evolves from weak decoupling to strong decoupling, suggesting a potentially nonlinear relationship; (2) CEI exhibits significant spatial autocorrelation and regional clustering; (3) REG is significantly associated with lower CEI, with both local and spatial spillover associations; (4) the local mitigation association is stronger in eastern and higher-CEI provinces, while spillover effects are more pronounced in western, northeastern, and resource-based provinces; and (5) the REG-CEI association may operate through energy structure (ES) optimization and energy intensity (EI) reduction, while environmental regulation (ER) may strengthen this association. The endogeneity tests provide supplementary evidence consistent with these findings, although they should not be interpreted as definitive causal proof. Overall, this study contributes to the sustainability literature by showing that the REG-CEI relationship is not merely a static local association, but a dynamic and spatially differentiated pattern shaped by regional coordination and energy-system adjustment. These findings provide evidence relevant to sustainability-oriented energy policy by suggesting that renewable electricity development should be assessed not only by generation scale, but also by its association with carbon-intensity reduction, spatial coordination, and energy-system efficiency.
1. Introduction
Achieving carbon peaking and carbon neutrality has become a central policy objective for China, requiring a fundamental transformation of the energy system. As the largest energy consumer and carbon emitter in the world, China faces increasing pressure to decouple economic growth from carbon emissions while maintaining sustainable development [1,2]. In response, the Chinese government has introduced a series of measures to reduce fossil-fuel dependence, promote clean energy development, and improve energy efficiency. These policies have accelerated the expansion of renewable energy and supported the transition toward a cleaner energy system. However, China’s total carbon emissions remain high, even though carbon emission intensity (CEI) has declined over time (as shown in Figure 1 and Figure A1 in Appendix B). This contrast suggests that carbon intensity, rather than total emissions alone, provides an important perspective for understanding whether economic growth is becoming less carbon-intensive under the low-carbon transition.
Figure 1.
Annual average of carbon emissions and carbon emission intensity (CEI), 2005–2024.
Renewable electricity generation (REG) is widely regarded as a key pathway for mitigating carbon emissions and supporting the energy transition [3,4]. In China, REG has expanded rapidly in recent years (as shown in Figure 2), driven by the growth of hydropower, wind power, and solar power. Nevertheless, the expansion of renewable electricity does not automatically translate into proportional carbon mitigation. The carbon-intensity association of REG may depend on whether renewable electricity can effectively substitute fossil-based electricity, whether it can be absorbed by the grid, and whether electricity can be transmitted from resource-abundant provinces to high-demand regions. These issues are particularly important in China, where renewable resources, electricity demand, industrial structure, and grid transmission capacity are unevenly distributed across provinces. Therefore, it is necessary to examine not only whether REG is associated with lower CEI, but also how this relationship evolves over time and operates across space.
Figure 2.
Renewable electricity generation (REG) (total and share) trend, 2005–2024.
Existing studies have examined renewable energy development and carbon emissions from different perspectives, but several gaps remain. First, many studies focus on the static relationship between renewable energy and emissions, while less attention has been paid to the dynamic [5] and decoupling relationship [6,7] between REG and CEI. Second, existing research often examines either spatial spillovers [3] or decoupling relationships [6,7] separately, making it difficult to understand whether the role of REG is purely local or spatially transmitted. Third, studies based on national averages may overlook regional heterogeneity, especially differences between resource-abundant and high-demand provinces. Fourth, although energy structure (ES) [8,9] and energy intensity (EI) [3,10] have been discussed as important channels, relatively limited evidence jointly examines these mechanisms together with the moderating role of environmental regulation (ER). Finally, some prior studies rely on relatively limited data periods or a single measure of REG or CEI, which may restrict their ability to capture recent changes in China’s renewable electricity development and carbon intensity dynamics [3,11].
Against this background, this study provides an integrated analysis of the relationship between REG and CEI in China. Using panel data from 30 provinces over the period 2005 to 2024, this study first applies the Tapio decoupling model to examine whether the REG-CEI relationship has shifted over time as renewable electricity has expanded. It then uses Moran’s I and the spatial Durbin model (SDM) to examine whether the REG-CEI association is confined to local provinces or extends across neighboring regions. Further analyses examine robustness, endogeneity, regional heterogeneity, and potential transmission channels through ES, EI, and ER. Rather than treating renewable electricity development as a single national average association, this design allows the study to describe how the REG-CEI relationship evolves dynamically, operates spatially, differs across provincial contexts, and is consistent with possible energy-system adjustment channels.
This study contributes to the literature in three main ways. First, it moves beyond a static average assessment of renewable electricity and carbon outcomes by showing that the REG-CEI relationship evolves from weak decoupling toward strong decoupling during 2005–2024. This provides new evidence that the carbon-intensity relevance of renewable electricity should be understood as an evolving transition pattern rather than a fixed average association. Second, it links decoupling analysis with spatial econometric evidence and shows that the REG-CEI relationship contains both local mitigation associations and cross-regional spillover associations. This distinction is important because renewable electricity generation, electricity consumption, and carbon-intensive production are spatially uneven across China, meaning that the CEI relevance of REG cannot be fully assessed within provincial boundaries alone. Third, it provides a differentiated explanation of the REG-CEI relationship by jointly considering regional heterogeneity, resource endowments, high- and low-CEI provinces, and evidence consistent with possible channels through ES, EI, and ER. These findings suggest that renewable electricity development should not be evaluated only by generation scale or installed capacity, but also by whether it is associated with lower CEI, spatial coordination, energy-structure optimization, energy-efficiency improvement, and environmental regulation. More broadly, the study strengthens the link between energy economics and sustainability by providing evidence on how renewable electricity development is related to sustainable low-carbon transition through dynamic decoupling, spatial coordination, and energy-system adjustment.
The results show that the relationship between REG and CEI evolves from weak decoupling to strong decoupling over the sample period. CEI exhibits significant spatial clustering, and the SDM results indicate that REG is significantly associated with lower CEI, with both local and spatial spillover associations. Further analyses suggest that this association is heterogeneous across regions and is more pronounced in eastern and higher-CEI provinces, while spatial spillovers are stronger in western, northeastern, and resource-based provinces. Mechanism analysis provides evidence consistent with the roles of ES optimization, EI reduction, and ER in shaping the REG-CEI relationship.
The remainder of this paper is organized as follows. Section 2 reviews the related literature and develops the research hypotheses. Section 3 describes the data, variable construction, and empirical strategy. Section 4 presents the empirical results, including descriptive analysis, baseline SDM estimates, robustness checks, endogeneity tests, heterogeneity analysis, and mechanism analysis. Section 5 discusses policy implications and limitations. The Appendices provide supplementary formulas, figures, model specifications, and empirical results.
2. Literature Review and Hypothesis Development
This section develops the theoretical foundation and research hypotheses of this study. It first reviews the relationship between REG and CEI, with particular attention to local mitigation associations and potential spatial spillover patterns. It then discusses the moderating role of ER and the possible transmission channels through ES and EI. Based on these theoretical discussions, four hypotheses are proposed to guide the subsequent empirical analysis.
2.1. Renewable Electricity Generation and Carbon Emission Intensity
A large body of the literature has examined the relationship between REG and carbon emissions globally [12,13,14]. Existing studies largely focus on the determinants and impacts of renewable electricity generation. Empirical evidence indicates that factors such as renewable electricity policies [15], green finance development [16], energy intensity targets [17], and natural resource endowments [18] can promote REG, thereby enhancing economic welfare [19] and fostering economic growth [20]. Meanwhile, research on CEI primarily concentrates on its driving factors, including industrial structure adjustment or tertiary industry development [21,22], new quality productivity [23], foreign direct investment [4], and green technological innovation [24].
From a theoretical perspective, renewable energy is characterized by low carbon intensity and can generate clean electricity, thereby enabling green energy consumption and supporting carbon-emission mitigation [12,25,26]. According to energy system theory, including the energy production service system, energy consumption system, energy-environment system, and the 3E (Energy–Economy–Environment) framework [27], renewable energy plays a dual role in both energy production and energy consumption processes. Specifically, renewable energy sources such as wind and solar may generate certain carbon emissions during the construction phase of power generation facilities, but once operational, they provide electricity for end-users, thereby capturing both the production and utilization of clean energy within the energy system. In this sense, the construction and generation processes correspond to energy input and clean electricity output, jointly shaping their overall association with carbon emissions.
From a macro perspective, CEI reflects the coupling relationship between economic growth and carbon emissions, and the transition toward low-carbon energy is widely viewed as an important driver of this decoupling process [20,28]. Specifically, REG may be associated with lower emissions through multiple channels. First, from the supply side, by weakening the dependence of economic growth on fossil fuels, particularly coal [29], renewable energy may be associated with lower carbon intensity of energy generation, promoting a decoupling between economic activity and carbon emissions [18,30]. Furthermore, renewable energy provides low- or zero-carbon heat through direct use (e.g., solar, biomass, and geothermal), which may further be associated with lower carbon emissions [11]. Second, from the consumption stage, renewable electricity enables the electrification of end-use sectors such as transportation, industry, and buildings, which is likely to be associated with lower emissions [11]. Finally, through the process of industrial transition, the expansion of renewable energy may reshape industrial structure by reallocating resources toward low-carbon sectors and technologies, thus facilitating a structural transition toward cleaner production systems [31]. Accordingly, REG is expected to be associated with lower CEI at the local level.
However, recent studies suggest that the estimated association of renewable energy is not confined to local regions but may also exhibit spatial spillover associations [3,32]. Due to substantial regional differences in resource endowments across China, renewable energy is often generated in resource-abundant regions and transmitted to other regions through interprovincial electricity grids (e.g., west-to-east power transmission). In addition, interregional economic linkages, energy trade, and technological diffusion allow renewable energy development in one region to influence carbon emission outcomes in other regions [33,34]. Therefore, REG may be associated with lower CEI not only locally but also in adjacent regions, reinforcing the spatial interdependence of emission reduction processes.
Hypothesis 1 (H1).
Renewable electricity generation is associated with lower carbon emission intensity and may exhibit spatial spillover effects.
2.2. Moderating Role of Environmental Regulation
ER may condition the REG-CEI association. Existing studies show that ER is associated with pollution governance and emission-mitigation outcomes by increasing the cost of pollution-intensive activities and encouraging cleaner production [35,36]. More importantly, ER may also condition the carbon-related association of energy consumption, as stronger regulation has been found to weaken the carbon-enhancing effect of energy consumption in China [37]. In addition, recent evidence suggests that ER can promote renewable energy consumption and support clean energy transition [38]. Building on these findings, this study argues that stronger ER may strengthen the negative REG–CEI association by increasing the pressure to substitute fossil-based electricity with cleaner electricity and improving the implementation conditions of renewable energy policies. Therefore, ER is expected to strengthen the negative REG-CEI association.
Hypothesis 2 (H2).
Environmental regulation may strengthen the negative association between REG and CEI.
2.3. Mediating Role of Energy Structure
The REG-CEI association may operate through changes in the ES. From the perspective of energy substitution, the expansion of renewable energy weakens dependence on fossil fuels, particularly coal, and promotes a transition toward a cleaner energy mix [18]. As renewable energy penetration increases, carbon-intensive energy sources may be gradually replaced by cleaner alternatives, which are associated with a lower carbon content of total energy consumption. In this context, ES, defined as the composition of energy use, particularly the relative share of fossil fuels versus low-carbon sources, plays a crucial role in determining carbon emission outcomes. Existing studies suggest that a higher share of low-carbon energy is associated with lower carbon intensity [30]. Therefore, REG is expected to be associated with lower CEI through a cleaner ES, which operates through structural substitution, i.e., changing “what type of energy is used”.
Hypothesis 3 (H3).
The REG-CEI association may partly operate through energy structure optimization.
2.4. Mediating Role of Energy Intensity
Another possible mechanism underlying the REG-CEI association is EI. While the ES channel operates through changes in the composition of energy use, the EI channel reflects changes in the amount of energy required to support economic production. Renewable energy development is often accompanied by technological progress and may be linked to lower energy input requirements for economic output. As cleaner electricity replaces traditional energy sources and production processes become less energy-intensive, the amount of energy required per unit of output may be lower, which is generally associated with lower carbon-emission pressure even if the structure of electricity generation remains unchanged. In this sense, lower EI reflects a process in which economic output becomes less dependent on energy input. Existing studies indicate that reduction in EI is associated with lower CEI, while renewable energy development may be linked to this process through technological innovation and lower energy input requirements [39]. Therefore, this channel may help explain the association between REG and lower CEI by linking renewable electricity development to lower energy requirements per unit of output. Accordingly, REG is expected to be associated with lower CEI through reductions in EI.
Hypothesis 4 (H4).
The REG-CEI association may partly operate through lower energy intensity.
3. Data and Methodology
This section describes the data, variable construction, and empirical strategy used in this study. The analysis proceeds in four steps. First, the main variables are defined and the provincial panel dataset is constructed. Second, the Tapio decoupling model is used to examine the dynamic evolution of the relationship between REG and CEI. Third, Moran’s I statistics and the spatial Durbin model (SDM) are employed to test spatial dependence and estimate both local and spillover associations. Finally, robustness checks, endogeneity tests, heterogeneity analyses, and mechanism-related tests are conducted to evaluate the stability and potential channels of the baseline findings. A fixed-effects ordinary least squares (OLS) benchmark model is also estimated in Appendix C. To maintain a clear methodological narrative, more detailed operational procedures and supplementary specifications are reported in the Appendix A, Appendix B, Appendix C and Appendix D. All empirical analyses and figure generation were conducted using Stata 18.0 (StataCorp LLC, College Station, TX, USA).
3.1. Variable Definitions and Construction
3.1.1. Explained Variable: CEI
CEI is selected as the explained variable. Considering the potential measurement differences in carbon accounting, this study employs three alternative indicators of CEI derived from the Emissions Database for Global Atmospheric Research (EDGAR) and Carbon Emission Accounts and Datasets (CEADs) database [3]. Given its updated coverage, EDGAR is adopted as the primary data source, as it provides consistent carbon emission estimates up to 2024 and thus supports a more recent and comprehensive analysis.
The EDGAR database estimates carbon emissions under the IPCC framework, in which emissions are calculated by combining activity data and emission factors across sectors and energy types. Specifically, carbon emissions are derived from energy consumption, industrial processes, and other emission sources using internationally standardized parameters such as calorific values, carbon content, and oxidation rates. Based on this approach, the EDGAR-based carbon emission measure is used to construct as the baseline proxy for CEI.
By contrast, the CEADs database is only available for earlier years. Accordingly, CEADs-based measures are used as robustness checks. Two alternative carbon emission measures are constructed from CEADs. One is based on the sectoral accounting approach (IPCC method), while the other is based on the apparent energy consumption approach.
Based on these two carbon emission measures, CEI is further defined as CO2 emissions per unit of provincial gross domestic product, as presented in Equation (1). Accordingly, , and are used as three alternative dependent variables throughout the empirical analysis.
where denotes CEI in province and year under accounting approach , denotes carbon emissions measured using approach , and denotes provincial gross domestic product. Accordingly, , and are employed as three alternative dependent variables throughout the empirical analysis. Detailed formulas for the sectoral accounting and apparent energy consumption approaches are provided in Appendix A.
3.1.2. Core Explanatory Variable: REG
REG is the core explanatory variable. Renewable energy refers to non-fossil energy sources such as hydropower, wind, solar, biomass, and geothermal energy [11]. As a clean and low-carbon energy source, it is primarily used for power generation and plays an important role in ES improvement, carbon-emission mitigation, ecological protection, and climate-change responses. Following the existing literature, this study uses REG as the key proxy. Specifically, total REG is measured as the sum of hydropower generation, wind power generation, and solar power generation, as shown in Equation (2) [3,17,18].
To capture the relative importance of renewable energy in the provincial electricity mix, this study further constructs defined as the ratio of total REG to total electricity generation, as shown in Equation (3). This indicator reflects the penetration of renewable energy in the power structure and serves as an alternative explanatory variable in the baseline regression.
In addition, to capture the scale effect of renewable energy development, the logarithmic form of total REG, , is constructed according to Equation (4). This indicator reflects the scale of REG and is used as an alternative explanatory variable in the robustness checks.
By considering both the logarithmic scale measure and the share-based measure, this study captures renewable energy development from both absolute and relative perspectives, thereby providing a more comprehensive evaluation of its relationship with CEI.
where denotes total REG; denotes the share of REG in total electricity generation; and denotes the natural logarithm of total REG.
3.1.3. Control Variables
Several key control variables are included as follows: Economic development is measured by the logarithm of per capita GDP (), capturing the level of economic activity and scale effects [40,41,42]. Urbanization level () is included to reflect population concentration and changes in consumption patterns associated with urban development [43,44,45]. Industrial structure () is measured by the ratio of added value of tertiary industry to that of secondary industry, reflecting structural upgrading and the relative importance of less energy-intensive sectors [43,46,47]. In addition, ER () is incorporated to capture government efforts in pollution control and environmental protection [35,36,48,49].
3.2. Data Source
This study examines the evolution of the decoupling relationship, spatial spillover associations, and characteristic trends between REG and CEI in China over the period 2005 to 2024. Data on CEI are obtained from EDGAR and CEADs, including indicators calculated based on both the apparent energy consumption method and the sectoral accounting approach. Due to data availability constraints, the provincial wind and solar power generation data for 2024 are estimated using linear interpolation. All other data on REG are sourced from the China Energy Statistical Yearbook and the China Electric Power Statistical Yearbook. Control variables are collected from the China Statistical Yearbook and the National Bureau of Statistics. Due to data limitations, Tibet, Hong Kong, Taiwan, and Macau are excluded from the analysis. The final sample consists of 30 provinces and 600 province-year observations over the 20-year period. To mitigate the influence of outliers, all continuous variables are winsorized at the 1% level at both tails. To address this data limitation, a robustness check excluding 2024 observations is conducted in Section 4.2.2.
3.3. Model Specification
3.3.1. Tapio Model Specification
To preliminarily examine the relationship between REG and CEI, this study adopts the Tapio decoupling model, as shown in Equation (5). The Tapio model provides a flexible framework to assess the relative change between environmental pressure and economic or energy-related drivers and has been widely used in studies on energy-environment dynamics [50]. Compared with simple correlation or regression analysis, the Tapio decoupling elasticity captures the dynamic interaction between variables in a relative-growth framework, allowing for the identification of different decoupling states (e.g., strong decoupling, weak decoupling, or negative decoupling). It is therefore well suited to examining the evolution of the relationship between REG and CEI over time.
where represents the Tapio decoupling elasticity between REG and CEI. denotes , and , respectively.
3.3.2. Spatial Weight Matrix and Moran’s Index Setting
Given the strong regional interconnections in energy consumption, industrial structure, and environmental policies across provinces in China, CEI is likely to exhibit spatial dependence. Ignoring such spatial interactions may lead to biased estimation results. Therefore, this study first constructs spatial weight matrices and employs Moran’s I statistic to test for spatial autocorrelation [4,5,24]. The spatial weight matrix defines the structure of spatial interactions across provinces, with the baseline specification based on geographical contiguity. Moran’s I is then used to evaluate whether provinces with similar levels of CEI tend to cluster in space. A significantly positive Moran’s I indicates spatial clustering, suggesting that regional CEI is shaped not only by local conditions but also by neighboring provinces. This study employs three spatial weight matrices and constructs the following Moran’s I model:
where if provinces and are geographically adjacent, and 0 otherwise.
where for , and denotes the geographical distance between provinces.
where for , and denotes the difference in average per capita GDP between provinces.
where denotes the global Moran’s I statistic used to test spatial autocorrelation of CEI. represents , , and , respectively.
3.3.3. SDM Specification
Since the OLS framework assumes cross-sectional independence across provinces and does not account for potential spatial spillover effects, the OLS results offer useful preliminary evidence but may be incomplete if spatial dependence is present. To account for potential spatial dependence and spillover effects, this study employs the SDM [3,17,24]. Compared with traditional spatial econometric models such as the spatial lag model (SLM) and the spatial error model (SEM), the SDM incorporates both the spatial lag of the dependent variable and the spatial lags of explanatory variables, allowing for a more comprehensive characterization of spatial interactions. The SDM is particularly suitable in this context because renewable energy development, industrial structure, and environmental policies may generate cross-regional associations through channels such as technology diffusion, policy imitation, and inter-provincial energy markets. By including spatially lagged explanatory variables, the SDM enables the identification of both local and spillover associations of REG on CEI. The model is specified as follows:
where denotes the spatial weight matrix, and represents the spatial interaction between province and province . The parameter captures the spatial dependence of the dependent variable, indicating the extent to which CEI in one province is associated with that in neighboring regions. The coefficients and measure the spatial spillover associations of REG and control variables, respectively, reflecting how changes in explanatory variables in surrounding provinces are related to local CEI. Consistent with the baseline specification, includes economic development (), urbanization level (), industrial structure (), and environmental regulation (). Furthermore, and denote province and year fixed effects, respectively, controlling for unobserved heterogeneity across regions and over time, and is the idiosyncratic error term.
Since the decoupling analysis shows that the relationship between REG and CEI evolves over time, this study further adds the squared term of to test potential nonlinear effects, such as diminishing marginal returns or threshold effects.
where refers to the square term of REG, proxied by .
Table 1 provides detailed definitions and descriptions of all variables used in this study.
Table 1.
Variable definitions and measurement (provincial level).
4. Empirical Analysis
4.1. Descriptive Trend Analysis
Table 2 reports the descriptive statistics of the main variables. REG exhibits substantial variation across provinces. In particular, the mean of is 0.234, with a standard deviation of 0.237, while also shows wide dispersion, indicating clear regional differences in the scale and structure of REG. For the dependent variables, the mean values of , and are 2.118, 2.212, and 2.515, respectively, suggesting that the apparent accounting approach generally yields a higher level of CEI than the sectoral accounting approach. Among the control variables, , , and show relatively stable distributions, whereas and have fewer observations because of data availability constraints. The descriptive statistics indicate considerable cross-provincial heterogeneity and provide a suitable basis for the subsequent empirical analysis.
Table 2.
Descriptive summary statistics.
Table 3 presents the pairwise correlation coefficients among the main variables used in the baseline analysis. is negatively correlated with urbanization, ER, and, to a lesser extent, industrial structure, suggesting that provinces with higher levels of urbanization and stricter ER tend to have a lower share of renewable energy in total electricity generation. This pattern reflects structural differences in energy consumption across regions. Similarly, also shows negative correlations with these variables, indicating that both the scale and the share of renewable energy are systematically associated with regional economic and structural characteristics. These findings imply that the spatial distribution of renewable energy is not random but closely linked to underlying economic development and policy conditions.
Table 3.
Correlation coefficient.
4.1.1. Decoupling Relationship Evolution
Figure 3 (including Figure A2 in Appendix B) illustrates the evolution of the decoupling relationship between REG and CEI. The results show that the relationship has gradually shifted from an unstable and weak decoupling state to a more stable strong decoupling state over the sample period. In the early stage before around 2008, the decoupling elasticity fluctuates around zero and occasionally enters expansive or weak decoupling states, suggesting that the expansion of REG was not yet consistently associated with lower CEI. This may reflect the relatively limited scale of renewable electricity deployment and the continued dominance of fossil-fuel-based energy consumption during the early transition period. During the intermediate stage from approximately 2008 to 2014, the elasticity becomes more stable and gradually moves toward weak decoupling, indicating that renewable electricity development became more consistently linked to improvements in carbon efficiency. This transition coincides with the acceleration of clean energy policies, technological progress, and the gradual expansion of renewable electricity capacity. After around 2014, the decoupling relationship further strengthens into strong decoupling, with REG continuing to increase while CEI declines. This pattern suggests that renewable electricity development is not only expanding in scale, but is also increasingly associated with structural improvements in the energy system and carbon efficiency. Overall, Figure 3 suggests that the role of renewable electricity in China’s low-carbon transition has evolved from an initially unstable association to a more stable association with carbon-intensity decoupling.
Figure 3.
Decoupling trend between REG and CEI, 2005–2024. Note: The dashed horizontal line indicates the zero-decoupling threshold.
Figure 4 (including Figure A3 and Figure A4 in Appendix B) illustrates the spatial distribution of CEI across provinces in selected years under different accounting approaches. Rather than showing a random distribution, the maps reveal a persistent spatial pattern characterized by relatively high CEI in northern and northwestern China and relatively low CEI in coastal and southern provinces. In 2005, high-CEI provinces were mainly concentrated in Inner Mongolia, Shanxi, Ningxia, Xinjiang, and parts of Hebei, which are generally characterized by coal-abundant resource endowments, heavy industrial structures, and higher dependence on fossil energy. By contrast, lower CEI values were mainly observed in coastal and southern provinces such as Guangdong, Fujian, Jiangxi, and Hainan, where industrial structures are relatively less energy-intensive and the service sector accounts for a larger share of economic activity. Over time, the overall level of CEI declines, particularly in eastern and central provinces, indicating improvements in carbon efficiency. However, the relative spatial ranking of provinces remains highly stable. The core high-CEI regions in northern and northwestern China continue to exhibit relatively high carbon intensity even in the later period, while many coastal and southern provinces remain in lower-intensity groups. This pattern suggests that the decline in CEI is not sufficient to eliminate the underlying spatial imbalance. Instead, carbon intensity appears to be shaped by persistent structural factors, including coal dependence, industrial composition, energy infrastructure, and regional development patterns.
Figure 4.
Spatial distribution of across 30 provinces in selected years (2005, 2010, 2015, 2020, 2024).
The maps therefore provide useful descriptive evidence that CEI in China is path-dependent and regionally clustered, which supports the use of spatial econometric models in the subsequent analysis. The stable concentration of high-CEI provinces and the similarity of spatial patterns across EDGAR, sectoral, and apparent accounting approaches indicate that local carbon outcomes may be linked to neighboring provinces through energy supply chains, industrial linkages, and regional policy interactions. This provides visual evidence that distinguishing local associations from spatial spillover associations is important in the regression analysis.
4.1.2. Moran’s Index Analysis
Table 4 reports the global Moran’s I statistics of CEI under three accounting approaches and two spatial weight matrices. The results show that all reported Moran’s I values are positive and statistically significant at the 1% level throughout the sample period, indicating a stable and significant positive spatial autocorrelation in provincial CEI. Specifically, under the contiguity matrix , the Moran’s I values of range from 0.294 to 0.489 during 2005 to 2024, while those of range from 0.327 to 0.442 (2005 to 2021), and those of range from 0.265 to 0.431 (2005 to 2022). These results suggest that the spatial clustering pattern is consistently strong across different accounting methods, with EDGAR-based estimates exhibiting slightly higher spatial dependence in recent years. Under the distance matrix , the corresponding Moran’s I values are smaller, ranging from approximately 0.106 to 0.123 for , from 0.070 to 0.108 for , and from 0.053 to 0.097 for , but they remain significantly positive in all reported years. This indicates that although spatial dependence weakens with increasing geographic distance, it remains statistically significant. These findings indicate that CEI in China is not randomly distributed across provinces. Instead, provinces with relatively high CEI tend to be located near provinces with similarly high levels, while low-emission-intensity provinces are more likely to cluster with each other. Moreover, the spatial dependence captured by the contiguity matrix is consistently stronger than that captured by the distance matrix, implying that direct geographic adjacency plays a more important role than pure geographic distance in shaping the spatial pattern of CEI.
Table 4.
Moran’s Index using two weight matrices.
Figure 5 presents the Moran scatterplots of CEI under different accounting approaches. The positive slope of the fitted line is consistent with significant positive spatial autocorrelation, in line with the global Moran’s I results. More importantly, the distribution of provinces across the four quadrants provides additional insight into the spatial structure of CEI. A large number of provinces fall into the high–high (HH) and low–low (LL) quadrants, indicating that provinces with high CEI tend to be surrounded by similarly high-intensity provinces, while low-intensity provinces tend to cluster with other low-intensity provinces. The HH clustering pattern is mainly associated with resource-dependent and heavy-industrial provinces, such as Inner Mongolia, Shanxi, and Ningxia. These provinces are often embedded in fossil-energy production systems and energy-intensive industrial chains, which may reinforce similar carbon intensity patterns across neighboring regions. In contrast, the LL clustering pattern is more common in coastal and southern provinces, such as Guangdong, Fujian, and Hainan, where relatively cleaner industrial structures, higher energy efficiency, and stronger service-sector development may contribute to lower carbon intensity. The relatively small number of observations in the low–high (LH) and high–low (HL) quadrants suggests that spatial outliers exist but are not dominant, implying that CEI is mainly characterized by regional clustering rather than isolated provincial deviations.
Figure 5.
Moran’s Index scatterplot of using provincial neighbor matrix weight () in selected years (2005, 2010, 2015, 2020, 2024). Note: The diagonal fitted line indicates the spatial association between provincial CEI and its spatial lag.
From an economic perspective, such clustering may be driven by several structural factors. First, provinces often share similar energy resource endowments, such as coal abundance or renewable energy potential, which leads to comparable energy consumption patterns and carbon intensity levels. Second, neighboring regions tend to exhibit similar industrial structures due to geographic proximity and economic linkages, particularly the concentration of energy-intensive industries. Third, regional policy environments and environmental regulations may display spatial correlation, as local governments often learn from or imitate policy practices in adjacent regions. Finally, interregional economic interactions, including energy trade and technological diffusion, further reinforce the spatial dependence in CEI. Overall, these factors jointly contribute to the observed spatial clustering pattern. These findings further imply that changes in CEI in one region may be linked to developments in neighboring regions, suggesting the need to examine potential spatial spillover associations in the regression analysis.
4.2. Regression Analysis
4.2.1. Baseline Analysis
Table 5, Table A1 and Table A2 in Appendix D report the results of spatial econometric model selection tests using three spatial weight matrices. The LM and robust LM tests for both SLM and SEM are highly significant, indicating the presence of spatial dependence in CEI. Furthermore, the LR and Wald tests both reject the null hypotheses that the SDM can be simplified into either the SLM or the SEM, suggesting that the SDM specification should be retained. In addition, the joint significance of both individual and time fixed effects suggests that the two-way fixed effects SDM specification is appropriate. Therefore, the two-way fixed effects SDM is selected as the baseline model.
Table 5.
Test results of spatial econometric model selection using .
Table 6 presents the SDM estimation results using matrix . In Panel A, Columns (1) to (3) report the association between and , while Columns (4) to (6) report the results for and . In each group, the first column reports the coefficients of the main explanatory variables, the second column reports the spatial lag terms (), and the third column presents the full specification including spatial dependence. Focusing on the main coefficients, REG is significantly associated with lower CEI in both Panel A specifications, suggesting a negative local association between REG and CEI. The magnitude of the coefficients remains relatively stable, suggesting a robust local association. Regarding the spatially lagged term (), the coefficient of REG is also significantly negative, suggesting the presence of negative spatial interaction across regions. This result suggests that higher REG in one province is associated not only with lower local CEI but also with lower CEI in neighboring provinces.
Table 6.
SDM baseline results using .
The spatial autoregressive coefficient is significantly negative across specifications. This result should be interpreted cautiously and does not necessarily contradict the positive spatial clustering indicated by Moran’s I. Moran’s I captures the unconditional spatial association of CEI, whereas reflects conditional spatial dependence after controlling for REG, socioeconomic characteristics, and province and year fixed effects. Therefore, the positive Moran’s I indicates that provinces with similar carbon-intensity levels tend to cluster spatially, while the negative suggests that, after accounting for observed determinants and fixed effects, changes in CEI may involve a substitutive or redistributive relationship across neighboring provinces.
This interpretation is consistent with previous spatial environmental studies. For example, clean energy investment has been found to be associated with lower domestic carbon emissions while generating adverse spillover effects in neighboring economies, which has been interpreted as a carbon leakage effect [51]. Similarly, studies on China’s energy-consuming right trading policy show that energy-efficiency improvements in pilot areas may be accompanied by industrial transfer and negative spatial spillovers to neighboring non-pilot areas [52]. Spatial econometric studies of China’s carbon emissions also indicate that regional carbon outcomes are shaped by both local factors and spatial interactions, rather than by purely local processes [53]. In this context, the negative may reflect cross-regional adjustment mechanisms, such as the relocation of energy-intensive industries, interprovincial electricity trade, and competition for energy-intensive investment. Thus, the results suggest that regional carbon mitigation is not always spatially reinforcing; instead, it may also involve redistribution and adjustment across provinces. This finding highlights the importance of coordinating renewable electricity development, industrial policy, and interprovincial energy allocation across regions.
To further interpret the spatial effects, Panel B reports the decomposition into direct, indirect, and total effects. Columns (1) to (3) report the direct effect, indirect effect and total effect of on , while Columns (4) to (6) present the same effects of on . The results show that the direct effect of REG is significantly negative, indicating that renewable electricity development is associated with lower CEI within the local province. Economically, this local association may be related to the substitution of fossil-fuel-based electricity, improvements in the provincial energy mix, and greater use of low-carbon electricity in industrial and residential consumption. The indirect effect is also significantly negative, suggesting that REG is associated with lower CEI beyond provincial boundaries. This spillover effect may reflect the interregional nature of China’s electricity system. Renewable electricity generated in one province may be linked to neighboring provinces through interprovincial power transmission, electricity market linkages, energy supply-chain adjustment, and the diffusion of low-carbon technologies and policy practices. In this sense, renewable electricity development may be understood not only as a local environmental strategy, but also as part of a cross-regional mitigation framework. The significantly negative total effect further suggests that the overall association between REG and lower CEI is larger than the local association alone, highlighting the importance of coordinated regional energy governance and grid integration.
Table A3 in Appendix D reports the OLS estimation results. Columns (1) to (3) show the associations of with , and , respectively. The coefficients of REG remain significantly negative, providing benchmark evidence consistent with the SDM results.
Overall, the baseline results provide evidence that REG is significantly associated with lower CEI, and that this association exhibits clear spatial spillover patterns across provinces.
4.2.2. Robustness Checks
- (1)
- Summary of robustness checks
To examine whether the baseline findings are sensitive to data coverage, variable measurement, spatial dependence specification, regional policy heterogeneity, and model dynamics, this study conducts a series of robustness checks. First, since the 2024 wind and solar power generation data are estimated by interpolation, the sample excluding 2024 is used to test whether the baseline findings are driven by interpolated observations. In addition, the 2005–2019 sample is used to match the period of the mechanism analysis and examine whether the results are sensitive to sample-period differences. Second, alternative CEI measures based on the sectoral accounting approach and the apparent energy consumption approach are employed to test measurement robustness. Third, region-by-year fixed effects are included to absorb time-varying regional policy shocks and regional development differences. Fourth, alternative spatial weight matrices are used to examine whether the results depend on the definition of spatial linkages. Fifth, a dynamic SDM is estimated to account for the persistence of CEI. Finally, additional control variables, including foreign direct investment (), technological innovation (), and forest coverage (), are also gradually introduced into the OLS regression model.
Table 7a summarizes the main robustness results. Across the alternative sample periods, alternative CEI measures, region-by-year fixed effects, alternative spatial matrices, and dynamic SDM specifications, REG remains negatively associated with CEI in most specifications. More importantly, the direct, indirect, and total effects of REG are generally negative and statistically significant, indicating that the baseline conclusions are not driven by a specific sample period, carbon accounting method, spatial matrix, fixed-effect structure, or model specification. These results provide consistent support for the robustness of the local and spatial mitigation associations identified in the baseline SDM. To maintain readability, Table 7a reports only the core coefficients and SDM effect decompositions, while the full estimation results are reported in Appendix D, Table A4, Table A5, Table A6, Table A7, Table A8, Table A9, Table A10 and Table A11. Table A12 in Appendix D reports the results of adding more control variables using OLS. Although the inclusion of these variables leads to a reduction in sample size due to missing observations, the coefficient of REG remains significantly negative. This helps alleviate concerns that the baseline association is driven by omitted variables and suggests that the results are robust to the inclusion of additional controls.
Table 7.
(a) Summary of robustness checks. (b) Nonlinear SDM test with the square term of .
- (2)
- SDM: Nonlinear effects of REG
The preceding analysis assumes that the association between REG and CEI is linear. However, the decoupling results suggest that the REG-CEI relationship has evolved over time, and the marginal mitigation association of renewable electricity may not remain constant as renewable electricity penetration increases. In particular, when the share of renewable electricity is relatively low, additional renewable electricity may replace fossil-based electricity more directly and generate larger carbon-intensity improvements. As renewable penetration rises, however, grid integration constraints, renewable curtailment, storage limitations, and the declining substitution space for fossil electricity may weaken the marginal mitigation association. Therefore, this study adds the squared term of to the SDM specification to examine whether the REG-CEI relationship exhibits nonlinear characteristics.
Table 7b reports the nonlinear SDM results. The coefficient of is significantly negative, while the coefficient of its squared term is significantly positive. This provides evidence consistent with a diminishing marginal mitigation pattern: renewable electricity penetration is associated with lower CEI, but the marginal association becomes weaker as the renewable electricity share increases. Economically, this finding implies that expanding renewable electricity capacity alone may not be sufficient once renewable penetration reaches a higher level. To sustain the carbon-intensity mitigation association of REG, renewable electricity expansion needs to be accompanied by improvements in grid flexibility, storage capacity, interprovincial transmission, and electricity-market mechanisms that support effective renewable electricity consumption.
Overall, these robustness checks indicate that the baseline association between REG and CEI is not driven by a specific sample period, carbon accounting method, spatial weight matrix, fixed-effect structure, or dynamic specification. In addition, the mitigation association of REG may weaken at higher levels of renewable electricity penetration, highlighting the importance of grid integration and effective renewable electricity consumption.
4.2.3. Endogeneity Issue
Potential endogeneity may arise from reverse causality, omitted variables, measurement errors, and policy selection. Provinces with lower CEI or stronger low-carbon transition capacity may be more likely to develop REG, while unobserved factors such as renewable resource endowments, grid infrastructure, policy intensity, and industrial upgrading may affect both REG and CEI. Therefore, this section conducts supplementary IV tests to assess the reliability of the baseline association. These tests are not interpreted as definitive causal identification.
- (1)
- Supplementary lagged REG IV test
To partially mitigate the endogeneity issue, this study adopts the lagged values of REG as instrumental variables (IV) and applies a two-stage least squares (2SLS) estimation [54]. The use of lagged explanatory variables as instruments is well established in the empirical literature, particularly in studies examining energy, environment, and economic relationships, where lagged terms are commonly used to help address endogeneity concerns [55,56,57]. The rationale is that past REG is strongly correlated with current REG, while it is less likely to be affected by contemporaneous shocks to current CEI. However, lagged variables may still be correlated with persistent unobserved provincial characteristics. Therefore, this test is used as a supplementary internal-IV check rather than a primary identification strategy.
Table 8a reports the 2SLS results using lagged REG as the IV. The first-stage coefficients of and are positive and significant, indicating strong persistence in REG. The diagnostic tests further support instrument relevance. In Panel A, the statistics are far above conventional weak-instrument thresholds, and the statistics reject the null of underidentification. The Anderson–Rubin Wald tests are also statistically significant, providing additional support for the second-stage association under weak-instrument-robust inference. In Panel B, the and statistics also support instrument relevance, although the Anderson–Rubin tests are weaker for some CEI measures. Overall, the lagged-IV results are broadly consistent with the baseline findings and provide supplementary evidence that REG is associated with lower CEI.
Table 8.
(a) Endogeneity test: 2SLS regression using lagged one period . (b) Endogeneity test: 2SLS regression using external climate-geography instruments.
- (2)
- Supplementary external climate-geography IV tests
In addition, this study further constructs external IV based on climate and geographical renewable-resource conditions. Existing research shows that wind speed can provide exogenous variation in wind electricity generation [58], and that the environmental effects of renewable electricity depend on resource conditions, electricity-system constraints, and geographical factors [59]. Accordingly, is used to capture the joint annual availability of wind and hydrological resources, while combines terrain relief with annual wind speed and precipitation conditions to reflect the interaction between long-term geographical suitability and time-varying renewable-resource availability. The rationale is that wind speed is closely related to wind-power generation potential, precipitation affects hydropower availability, and terrain relief is associated with hydropower development conditions and the geographical feasibility of REG. These variables therefore provide plausibly exogenous variation in REG related to renewable-resource conditions, although the exclusion restriction cannot be fully verified with province-level data.
Table 8b reports the 2SLS results using these external climate-geography Ivs. The first-stage results show that both instruments are positively associated with , and the statistics reject the null of underidentification, suggesting that the instruments are correlated with REG. The second-stage coefficients of remain negative when is used as the dependent variable, which is directionally consistent with the baseline results. However, the statistics are relatively low, especially for , indicating that weak-instrument concerns may remain. Therefore, the external-IV results are interpreted cautiously as supplementary evidence rather than definitive evidence of causality.
4.2.4. Heterogeneity Analysis
The heterogeneity analysis further examines whether the REG-CEI association differs across provinces with different positions in China’s electricity geography. This section interprets heterogeneity from a demand-side and supply-side perspective. Eastern and high-CEI provinces are more closely related to the demand-side substitution logic, where industrial and electricity demand is concentrated and renewable electricity can more directly replace fossil-based electricity consumption. By contrast, western, northeastern, and resource-based provinces are more closely related to the supply-side and spatial spillover logic, where renewable resources and electricity generation bases are more concentrated but local absorption capacity is relatively limited, making interprovincial transmission and spatial reallocation more important.
- (1)
- Regional heterogeneity in local and spatial effects
The regional heterogeneity results in Table 9a show clear differences across eastern, central, western, and northeastern China. The coefficient of REG is largest and most significant in the eastern region, suggesting that the local mitigation association is strongest in economically developed and electricity-demand-intensive provinces. This finding is consistent with the demand-side substitution logic. Eastern provinces have higher industrial and electricity demand, more developed power markets, and stronger capacity to absorb green electricity. Therefore, an increase in renewable electricity penetration may be more directly associated with fossil-based electricity substitution and lower local carbon intensity.
Table 9.
(a) SDM regional heterogeneity analysis using . (b) SDM resource endowment heterogeneity analysis using . (c) SDM CEI heterogeneity analysis using .
By contrast, the spatial effects are more pronounced in western and northeastern regions. The spatial autoregressive coefficient is insignificant in the eastern region but significantly negative in western and northeastern regions, indicating that CEI in these regions is more closely linked to interregional interactions. This pattern reflects the supply-side role of these regions in China’s electricity system. Western and northeastern provinces often have richer renewable resources and serve as important electricity generation and transmission bases, but their local electricity demand and absorption capacity are relatively limited. As a result, the carbon-intensity implications of REG in these regions are more likely to operate through interprovincial transmission, spatial reallocation of electricity supply, and interactions with neighboring provinces. Overall, the regional results suggest that REG mainly operates through local demand-side substitution in eastern provinces, while it works more through supply-side spillovers and spatial transmission in western and northeastern provinces.
- (2)
- Resource endowment heterogeneity in local and spatial effects
The resource endowment heterogeneity results in Table 9b further support the supply-side interpretation. Resource-based provinces in this study include Shanxi, Inner Mongolia, Liaoning, Jilin, Heilongjiang, Anhui, Jiangxi, Henan, Hubei, Hunan, Guangxi, Chongqing, Sichuan, Guizhou, Yunnan, Shaanxi, Gansu, Qinghai, Ningxia, and Xinjiang, while non-resource-based provinces include Beijing, Tianjin, Hebei, Shanghai, Jiangsu, Zhejiang, Fujian, Shandong, Guangdong, and Hainan. REG is significantly associated with lower CEI in both resource-based and non-resource-based provinces, indicating that the local mitigation association is not limited to one type of region. However, the spatially lagged REG term is significantly negative only in resource-based provinces, suggesting that spatial spillover effects are stronger in regions with heavier resource dependence and deeper participation in interregional energy supply networks.
This result can be explained by the role of resource-based provinces in China’s energy system. Many of these provinces are traditional fossil-energy bases and are also important locations for renewable electricity development. Their energy production, industrial structure, and electricity transmission are more closely connected with surrounding regions. Therefore, renewable electricity expansion in resource-based provinces may be linked to neighboring regions through power transmission, energy supply-chain adjustment, and the relocation or upgrading of energy-intensive industries. In contrast, non-resource-based provinces are more likely to be electricity-consuming regions, where the association of REG with CEI is reflected more in local substitution than in spatial transmission. These findings indicate that resource endowments shape not only the local association of REG with lower CEI but also the strength of its cross-regional spillover associations.
- (3)
- Carbon emission intensity heterogeneity in local and spatial effects
Table 9c reports the heterogeneity results for high- and low-CEI provinces. The coefficient of REG is significantly negative in both groups, but its magnitude is larger in high-CEI provinces. This suggests that the mitigation association of renewable electricity is stronger where carbon intensity is initially higher. The result is consistent with the demand-side substitution logic because high-CEI provinces usually have heavier industrial structures, stronger fossil-energy dependence, and greater room for replacing carbon-intensive electricity with renewable electricity. In these provinces, an increase in renewable electricity penetration may be associated with larger marginal improvements in carbon efficiency.
However, the spatial transmission pattern is not identical across high- and low-CEI provinces. High-CEI provinces are often embedded in fossil-energy and heavy-industrial systems, which makes their local carbon-intensity improvement more closely related to energy-structure adjustment and industrial upgrading. Low-CEI provinces, by contrast, may have relatively cleaner industrial structures and less room for marginal reduction. Therefore, the stronger coefficient in high-CEI provinces indicates that REG is especially important for regions where the potential for fossil-energy substitution is larger.
Taken together, the heterogeneity results reveal a consistent economic logic. Eastern and high-CEI provinces mainly reflect demand-side substitution effects, because renewable electricity can be more directly absorbed and used to replace fossil-based electricity consumption. Western, northeastern, and resource-based provinces mainly reflect supply-side and spatial spillover effects, because REG is more closely linked to resource endowments, transmission networks, and interregional electricity allocation. Therefore, the REG–CEI association depends not only on REG itself, but also on whether renewable electricity can be consumed locally, transmitted efficiently, and integrated into regional industrial and electricity systems.
4.2.5. Mechanism Analysis
The previous results show that REG is significantly associated with lower CEI and that this association differs across regions. To further explain the possible channels behind this relationship, this section examines three mechanism-related pathways: the moderating role of ER, the mediating role of ES, and the mediating role of EI [3,23]. Conceptually, ER represents the policy-pressure channel, ES captures the energy-substitution channel, and EI reflects the energy-efficiency channel. Specifically, stronger ER may increase the cost of fossil-energy use and strengthen the incentive to consume renewable electricity; ES optimization may be associated with lower CEI through a lower share of coal and other carbon-intensive energy sources; and EI improvement may be associated with lower CEI through lower energy requirements per unit of economic output. These mechanisms are not interpreted as definitive evidence of causality, but as evidence consistent with possible transmission channels through which REG may be associated with lower CEI.
Due to data availability, ES and EI are no longer officially reported after 2020. Therefore, this study uses a balanced panel dataset covering the period from 2005 to 2019 to conduct the mediation tests. To examine the moderating effect of ER and the mediating effects of ES and EI, the corresponding SDM specifications are presented in Equations (12)–(14).
where, in Equation (12), is the interaction term. captures the moderating effect of ER. The fixed effects are defined consistently with the baseline specification. In Equation (13), denotes the mediating variable, including ES or EI. The parameter captures the spatial dependence of the mediating variable. The coefficients and measure the direct and spatial spillover effects of REG on the mediating variable, respectively. In Equation (14), measures the direct effect of the mediating variable, while captures its spatial spillover effect. The control variables and fixed effects are defined consistently with the baseline specification.
Because the SDM framework allows both local and spatial spillover channels, the mechanism analysis reports direct, indirect, and total effects where appropriate. The direct effect captures the local mechanism within a province, while the indirect effect reflects spatial transmission across neighboring provinces.
- (1)
- Moderating effect of ER
Table 10a reports the moderating effect of ER. In Panel A, the interaction term between REG and ER is significantly negative, providing evidence consistent with the view that ER strengthens the negative association between REG and CEI. Economically, this result suggests that renewable electricity penetration is more closely associated with lower CEI when environmental regulatory pressure is stronger. Stricter ER can increase the relative cost of carbon-intensive production and fossil-energy use, thereby encouraging firms and local governments to substitute fossil-based electricity with cleaner electricity. In this sense, ER may strengthen the REG-CEI association by improving the institutional and policy conditions under which renewable electricity is consumed and integrated into the energy system.
Table 10.
(a) Panel A. SDM moderation test: ER using . Panel B. SDM moderation test: ER using . (b) Panel A. SDM mediation test: ES using . Panel B. SDM mediation test: ES using . (c) Panel A. SDM mediation test: EI using . Panel B. SDM mediation test: EI using .
Panel B further decomposes the moderating effect into direct, indirect, and total effects. The direct effect of the interaction term is significantly negative, indicating that the synergy between REG and ER is mainly reflected in a stronger local association with lower CEI. By contrast, the indirect effect is not statistically significant, suggesting that the moderating role of ER does not generate a strong spatial spillover effect. This is reasonable because ER is usually implemented and assessed within local administrative boundaries, while its enforcement intensity, policy design, and compliance pressure are more directly tied to local governments and local firms. Overall, the results provide evidence consistent with a local policy-synergy mechanism: ER strengthens the carbon-intensity mitigation association of REG mainly by reinforcing fossil-energy substitution within the same province.
- (2)
- Mediating effect of ES
Table 10b reports the SDM mediation results for ES. In this study, ES is measured by the share of coal consumption in primary energy consumption; therefore, a lower value of ES reflects a cleaner energy structure. The mediator regression shows that REG is significantly negatively associated with ES, indicating that higher renewable electricity penetration is associated with a lower reliance on coal-based energy. This result is consistent with the energy-substitution mechanism: higher REG is associated with a lower share of carbon-intensive energy in the energy mix, thereby creating conditions for lower CEI.
When ES is included in the CEI equation, its coefficient is significantly positive, indicating that a more coal-intensive energy structure is associated with higher CEI. At the same time, the coefficient of REG remains negative but decreases in magnitude, providing evidence consistent with a partial mediation channel through ES. The effect decomposition in Panel B further shows that the direct effect of REG remains significantly negative, while the direct effect of ES is significantly positive. This suggests that the ES channel is mainly reflected in local energy-structure adjustment: renewable electricity expansion is associated with lower reliance on coal and other carbon-intensive energy sources within a province, which is linked to lower local CEI. The indirect effect of REG is also significantly negative, indicating that REG may generate spatial mitigation associations through interprovincial electricity transmission and regional energy-system adjustment. Overall, the ES results provide evidence consistent with the view that REG expansion is associated with a reduction in coal dependence and an improvement in the energy structure, which in turn is linked to lower CEI.
- (3)
- Mediating effect of EI
Table 10c presents the SDM mediation results for EI. EI captures the amount of energy consumed per unit of economic output, and therefore reflects the energy-efficiency channel. The mediator regression shows that REG is significantly negatively associated with EI, suggesting that renewable electricity development is accompanied by lower energy intensity. This may reflect cleaner electricity-system development, technological upgrading, improvements in energy-use efficiency, and the gradual replacement of energy-intensive production processes.
When EI is included in the CEI equation, its coefficient is significantly positive, indicating that higher energy intensity is associated with higher CEI. Meanwhile, the coefficient of REG remains negative but decreases in magnitude, providing evidence consistent with a partial mediation channel through EI. The decomposition results in Panel B show that the direct effect of REG remains significantly negative, while the direct and total effects of EI are significantly positive. This suggests that the EI mechanism mainly operates through local energy-efficiency improvement: REG is associated with lower energy use per unit of output, which in turn is associated with lower CEI. Although the indirect effect of EI is negative, the total effect remains positive, indicating that EI still represents an overall carbon-intensity-enhancing factor when energy use remains inefficient. Overall, the EI results provide evidence consistent with the view that REG expansion may be accompanied by a cleaner electricity system and improved energy efficiency, which is consistent with lower energy use per unit of GDP and lower CEI.
Taken together, the mechanism results provide a more coherent explanation of the REG-CEI association. ER strengthens the association mainly through local policy synergy, ES captures the substitution away from coal-intensive energy, and EI reflects improvements in energy-use efficiency. These findings suggest that REG is more closely associated with lower CEI when renewable electricity expansion is combined with stricter environmental governance, a cleaner energy structure, and lower energy intensity. These mechanism tests should be interpreted as evidence consistent with plausible transmission channels rather than as strict causal mediation estimates.
4.3. Summary of Empirical Findings
Overall, the empirical results provide consistent evidence on the relationship between REG and CEI in China. First, the descriptive and decoupling analyses show that the REG-CEI relationship has gradually shifted from weak decoupling to strong decoupling, suggesting that renewable electricity development has become increasingly associated with improvements in carbon efficiency over time. Second, the Moran’s I results and spatial distribution maps reveal significant spatial clustering in CEI, indicating that provincial carbon intensity is not randomly distributed but shaped by regional structural conditions and spatial interactions. Third, the baseline spatial Durbin model (SDM) results show that REG is significantly associated with lower CEI, and the decomposition results further indicate that this association operates through both local and spillover channels. Fourth, the robustness and endogeneity tests provide support for the stability of the baseline findings, although the instrumental-variable results should be interpreted as supplementary evidence rather than definitive causal proof. Fifth, the heterogeneity results show that the local mitigation association is stronger in eastern and higher-CEI provinces, while spatial spillover associations are more pronounced in western, northeastern, and resource-based provinces. Finally, the mechanism analysis suggests that the REG-CEI association may partly operate through energy structure optimization and energy intensity reduction, while environmental regulation may strengthen the mitigation association of REG. Taken together, these findings indicate that the carbon-intensity implications of REG are dynamic, spatially interconnected, regionally heterogeneous, and shaped by both structural and policy-related mechanisms.
5. Policy Implications and Limitations
Based on the above empirical findings, several policy implications can be drawn for sustainability-oriented energy policy. Because renewable electricity development is closely connected to carbon-intensity reduction, energy-structure optimization, energy-efficiency improvement, and regional coordination, the results provide practical implications for promoting a sustainable low-carbon energy transition in China. First, renewable electricity policy should shift from capacity expansion alone to effective consumption and system integration. In eastern and high-CEI provinces, where the local mitigation association is stronger, policy should focus on increasing the share of green electricity consumption. Local governments and grid enterprises can promote industrial electrification, expand distributed photovoltaic use in industrial parks and public buildings, encourage long-term green power purchase agreements, and strengthen the linkage between green electricity trading, green certificates, and carbon markets. These measures can help translate renewable electricity supply into actual carbon-intensity reduction on the demand side.
Second, for western and northeastern provinces, where spatial spillover associations are more pronounced, the priority should be cross-regional transmission and grid flexibility. Grid enterprises should improve interprovincial transmission capacity, alleviate renewable electricity curtailment, strengthen peak-shaving and energy storage systems, and better coordinate renewable electricity bases with receiving markets. In addition, interprovincial electricity pricing should more clearly reflect not only grid investment and operating costs, but also the carbon-reduction value of renewable electricity delivered to other regions. This would improve incentives for both renewable electricity exporting provinces and consuming provinces.
Third, resource-based provinces require a more differentiated transition strategy. These provinces should avoid a policy path in which renewable electricity expansion coexists with continued dependence on coal-based industries. Policy efforts should therefore combine renewable electricity development with the flexible transformation of coal power, industrial low-carbon upgrading, and stricter control of energy-intensive capacity. Renewable energy consumption responsibility weights should also be refined at the provincial level, taking into account renewable resource endowments, electricity demand, grid absorption capacity, industrial structure, and CEI. This would prevent uniform targets from placing excessive pressure on resource-exporting regions while ensuring that receiving provinces also bear responsibility for low-carbon electricity consumption.
Finally, differentiated assessment mechanisms should be established for local governments and grid enterprises. For local governments, evaluation indicators should move beyond installed renewable capacity and include renewable electricity consumption, curtailment alleviation, CEI improvement, EI improvement, and the share of green electricity in industrial electricity use. For grid enterprises, assessment should focus on renewable electricity integration capacity, interprovincial transmission efficiency, grid flexibility, storage coordination, and support for green electricity trading. These indicators would make policy implementation more consistent with the spatially differentiated associations identified in this study. Together, these policy measures can help transform renewable electricity expansion from a capacity-oriented strategy into a sustainability-oriented energy transition pathway that integrates carbon-intensity reduction, efficient energy use, and coordinated regional development.
This study also has several limitations. Although the empirical analysis provides supportive evidence on the association between REG and CEI, the study is not based on a natural experiment, and province-level panel data and instrumental variables cannot provide definitive causal proof. In addition, the 2024 wind and solar power generation data are estimated by interpolation and should therefore be interpreted with caution, although the robustness check excluding 2024 produces consistent results. Future research could use more refined grid-level electricity transmission data, renewable resource potential data, and firm- or city-level energy consumption information to provide stronger causal identification and more detailed practical validation.
Author Contributions
J.L.: Writing—review and editing, Y.G.: Conceptualization, Data curation, Methodology, Software, Visualization, Writing—original draft, Writing—review and editing. S.F.: Conceptualization, Funding acquisition, Project administration, Supervision, Writing—review and editing. J.P.: Conceptualization, Writing—review and editing. J.T.: Writing—review and editing. M.L.: Writing—review and editing. All authors have read and agreed to the published version of the manuscript.
Funding
This research was funded by the National Natural Science Foundation of China (Grant No. 72303174), the China Postdoctoral Science Foundation (Grant No. 2025M773682), the Key Project of Social Sciences Foundation by the Department of Education of Hubei Province (Grant No. 24D044), and Major Project of Hubei Higher Education Institutions for Philosophical and Social Science Research (Grant No. 22ZD077), Major Project of the Innovation Fund of the Ministry of Education’s Engineering Research Center for Integration and Application of Digital Learning Technologies (Grant No. 1331002); General Project of Hubei Provincial Education Science Planning (Grant No. 2022GB035); Humanities and Social Sciences Research Fund of Wuhan Institute of Technology (Grant No. R202105); Higher Education Research Project of Wuhan Institute of Technology (Grant No. 2025ZD03); Research Project of the Science and Technology Innovation Think Tank, Hubei Provincial Association for Science and Technology (Grant No. ZK2026-8); Graduate Innovative Fund of Wuhan Institute of Technology (Grant No. CX2025461, CX2025463, CX2025464).
Institutional Review Board Statement
Not applicable.
Informed Consent Statement
Not applicable.
Data Availability Statement
The data used in this study are mainly derived from publicly available sources, including EDGAR, CEADs, China Statistical Yearbook, China Energy Statistical Yearbook, China Electric Power Statistical Yearbook, and the National Bureau of Statistics. Researchers wishing to access the data may contact the authors via email (email: yge@massey.ac.nz) for detailed information on data access.
Acknowledgments
The authors thank the editors and reviewers for their constructive comments and suggestions.
Conflicts of Interest
The authors declare no conflicts of interest.
Abbreviations
The following abbreviations are used in this manuscript:
| EDGAR | Emissions Database for Global Atmospheric Research |
| CEADs | Carbon Emission Accounts and Datasets |
| REG | Renewable Electricity Generation |
| CEI | Carbon Emission Intensity |
| ES | Energy Structure |
| EI | Energy Intensity |
| ER | Environmental Regulation |
| SDM | Spatial Durbin Model |
| SLM | Spatial Lag Model |
| SEM | Spatial Error Model |
| OLS | Ordinary Least Squares |
| 2SLS | Two-Stage Least Squares |
| IV | Instrumental Variables |
Appendix A. Carbon Accounting Formulas
Following the sectoral accounting method [60], carbon emissions are first calculated by energy type and sector and then aggregated across all energy types and sectors to obtain total provincial CO2 emissions, as shown in Equations (A1) and (A2). This approach provides a relatively detailed measure by accounting for sector-specific fossil fuel combustion.
where denotes the CO2 emissions generated from energy type in sector j in province at time ; represents the activity data of fossil fuel consumption; is the net calorific value of energy type ; denotes the carbon content per unit of energy; and is the oxidation factor.
where represents total CO2 emissions in province at time , obtained by aggregating emissions across all energy types and sectors.
The apparent accounting approach estimates provincial carbon emissions from apparent fossil fuel consumption, which is derived from the balance identity of indigenous production, imports, exports, inter-provincial inflows and outflows, stock changes, non-energy use, and losses, as shown in Equations (A3) and (A4) [61,62]. Compared with the sectoral approach, this method focuses more directly on the production-side balance of energy use.
where denotes apparent fossil fuel consumption in province at time , calculated based on the balance method including indigenous production, imports, exports, inter-provincial inflow and outflow, stock changes, non-energy use, and losses.
where denotes CO2 emissions calculated using the apparent energy consumption method, where is the emission factor. In Equations (A1)–(A4), denotes the province, represents the type of energy, refers to the sector, and indicates time.
Appendix B. Supplementary Figures
Figure A1.
Annual average of carbon emissions and CEI using alternative measurements, 2005–2024.
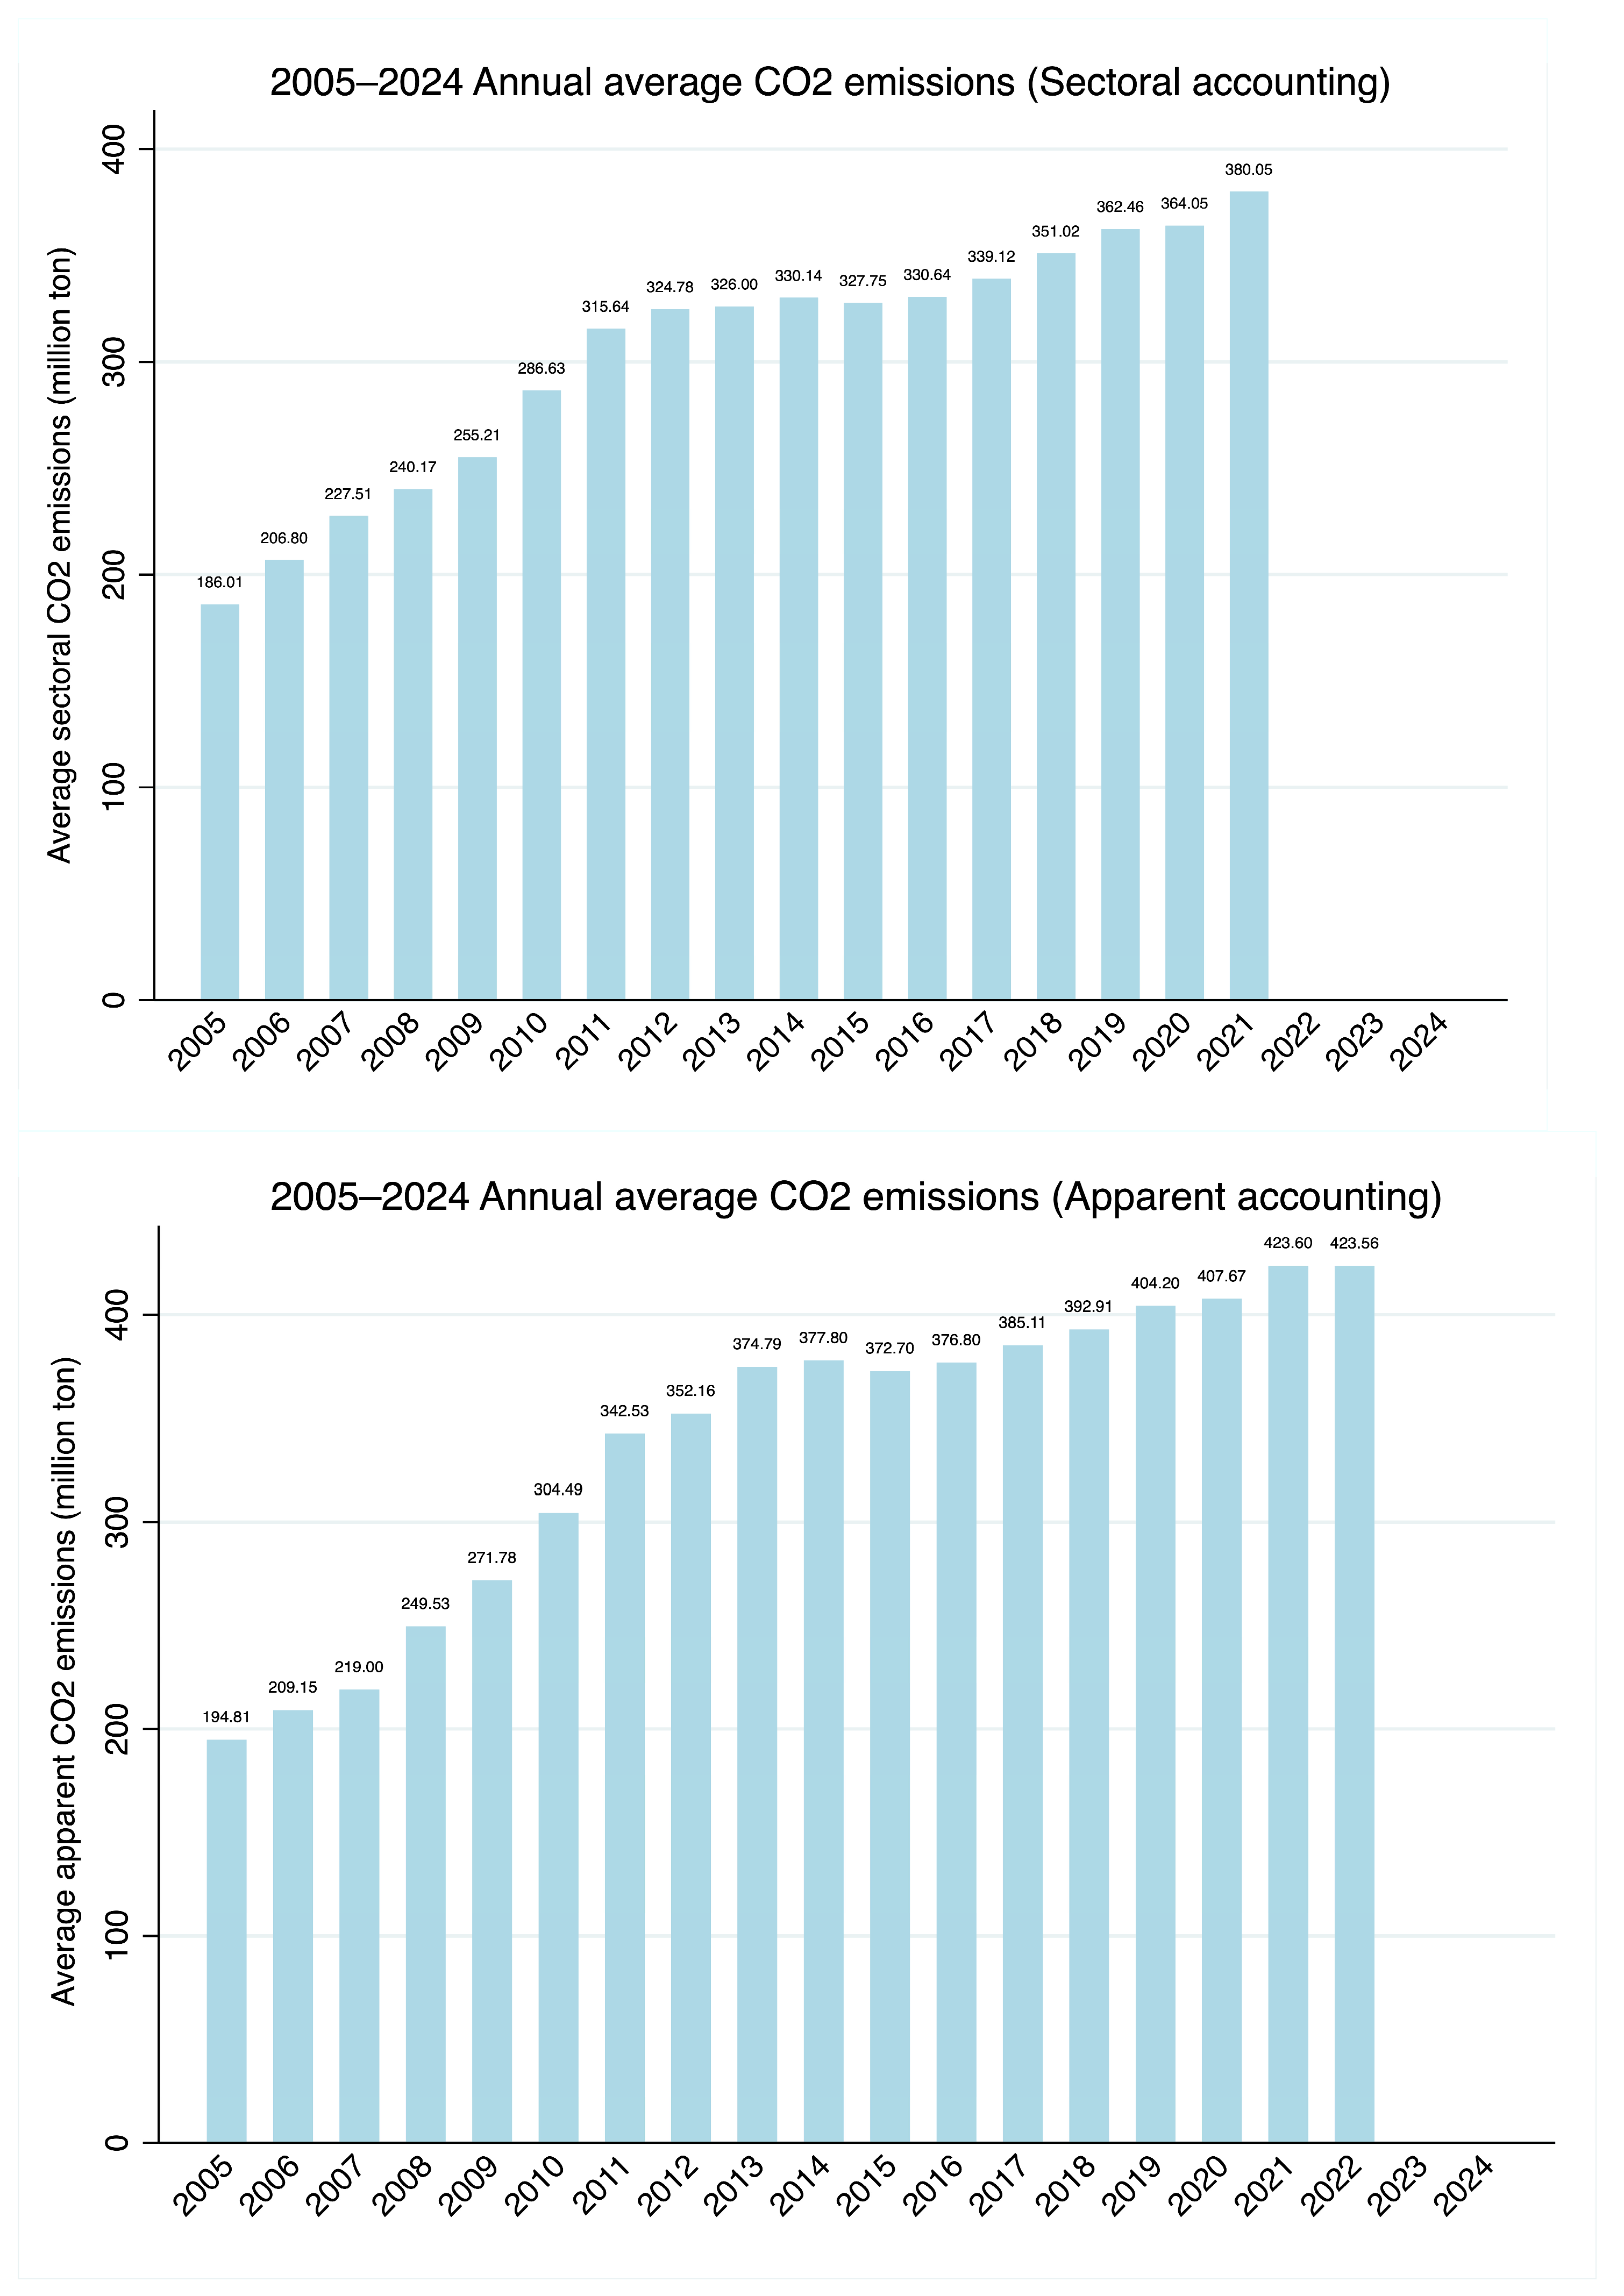
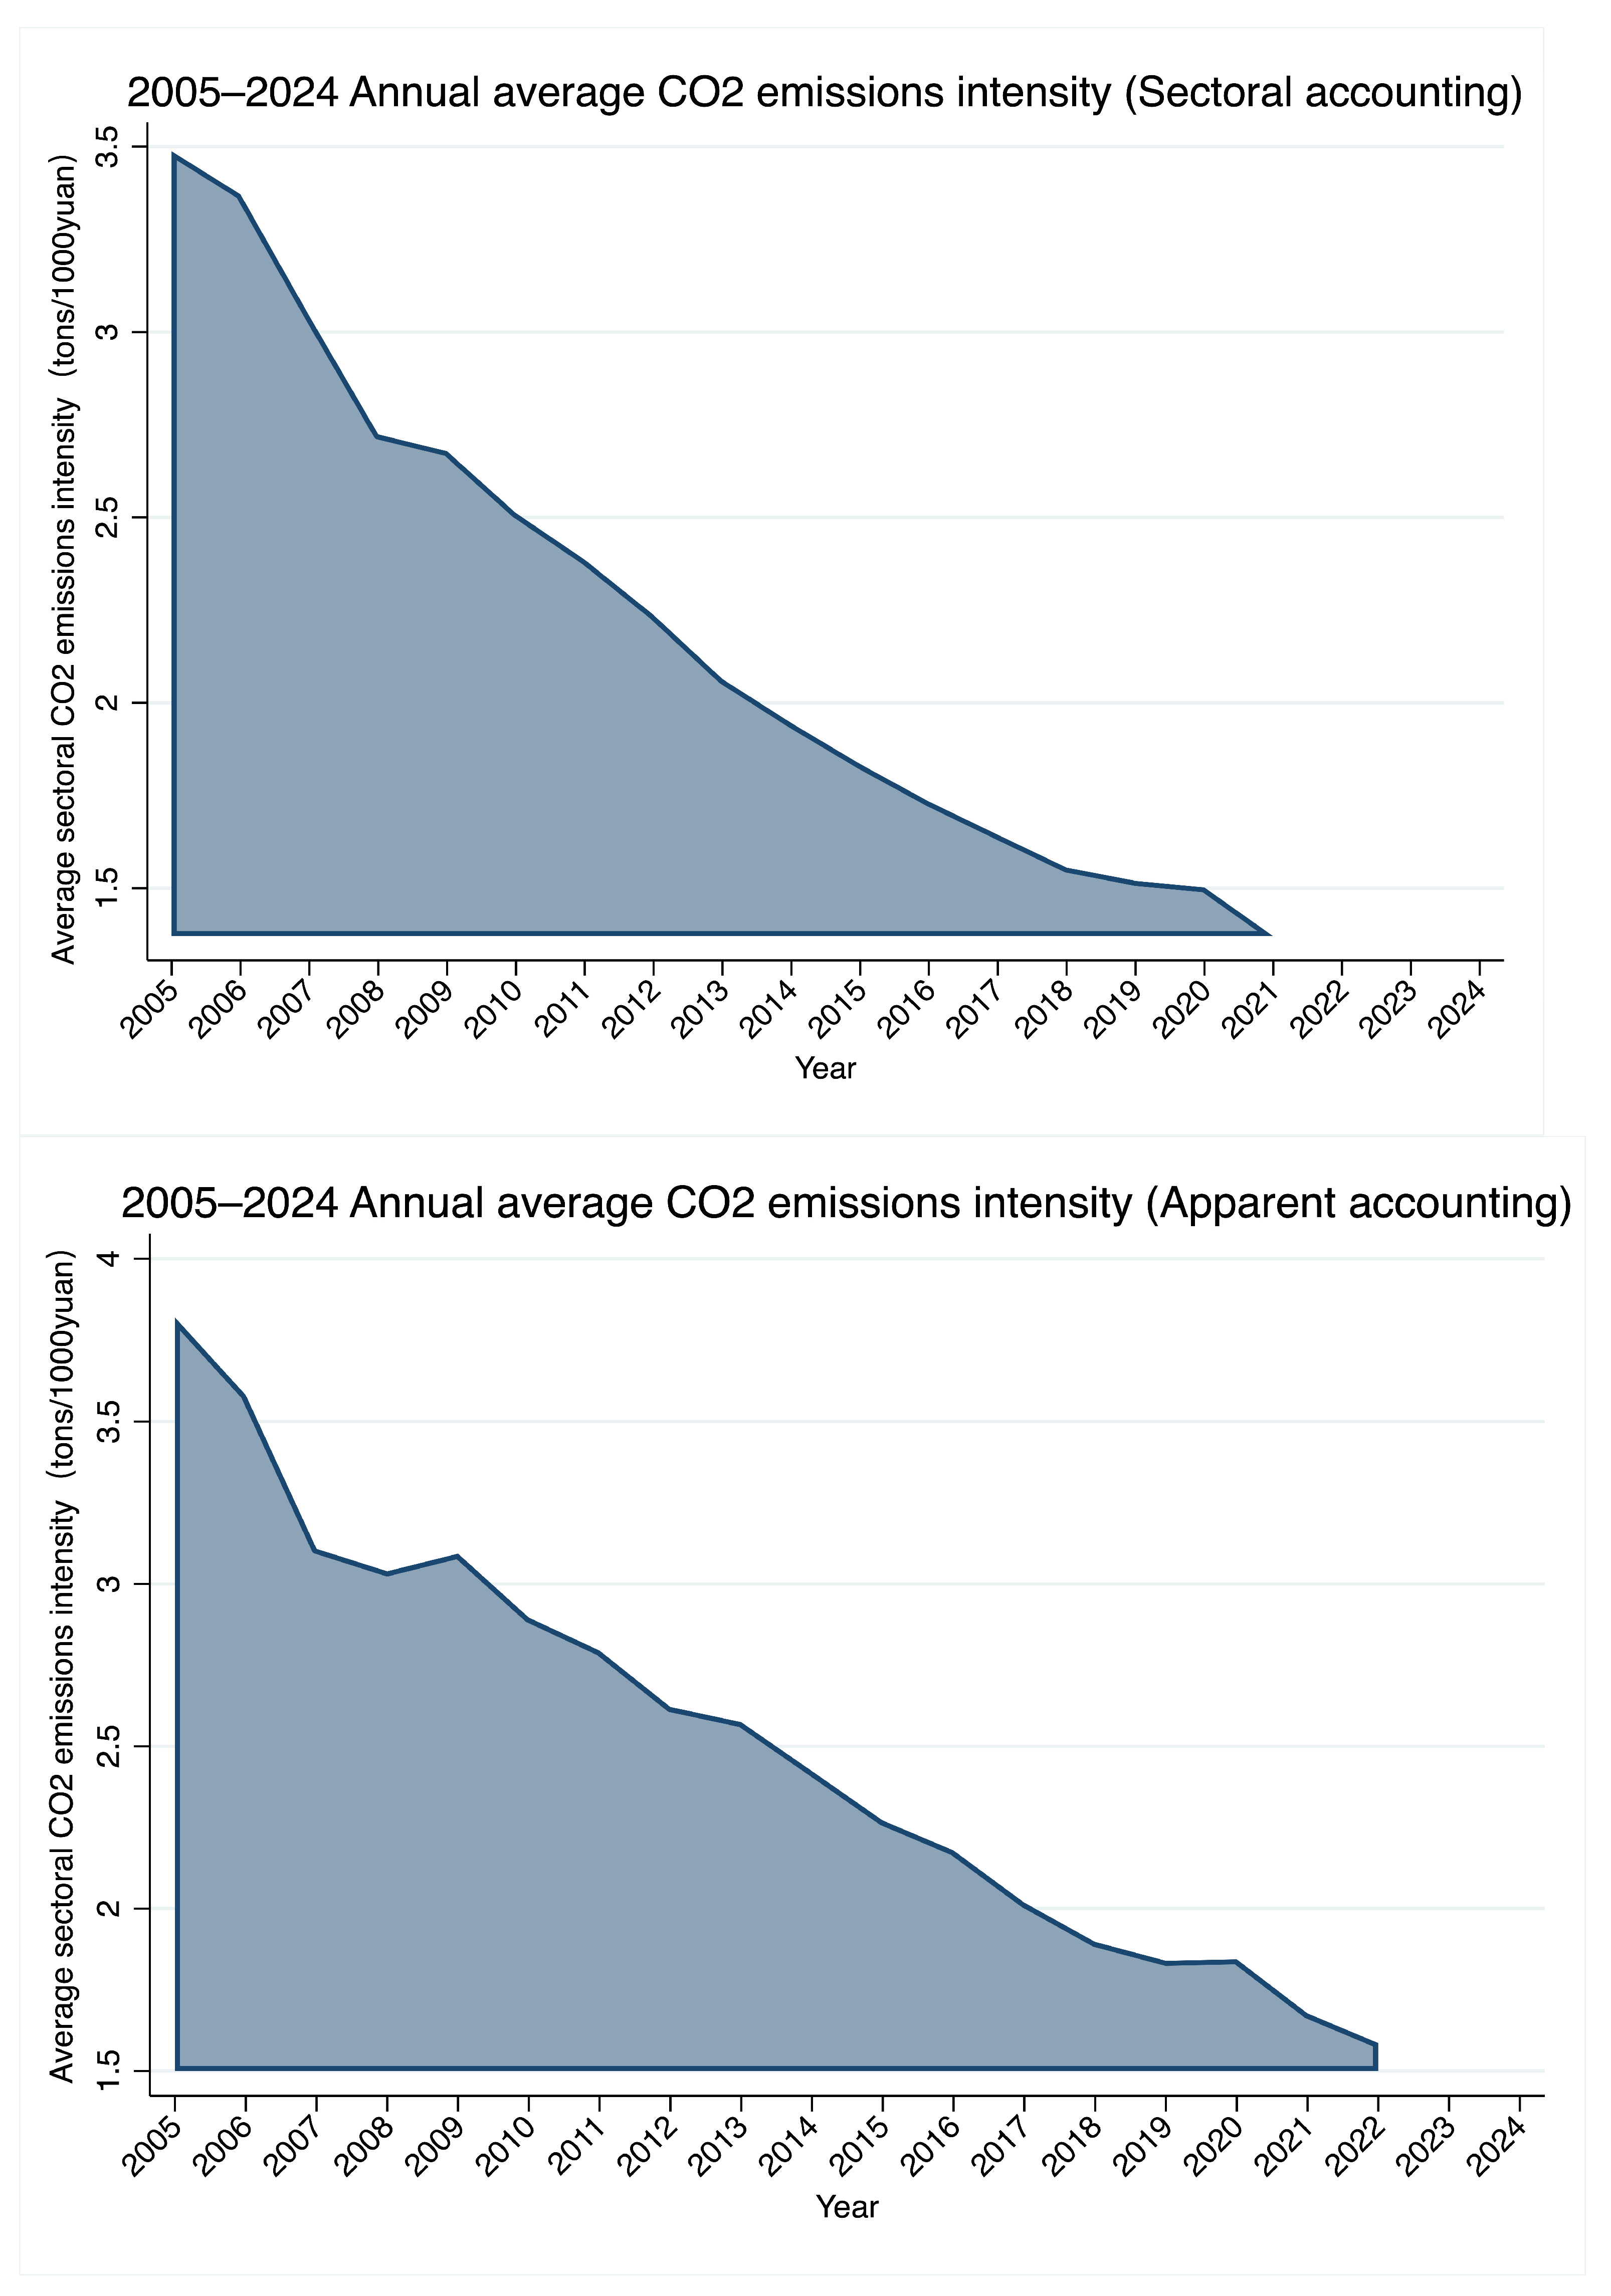
Figure A2.
Decoupling trend between REG and CEI using alternative measurements, 2005–2024.
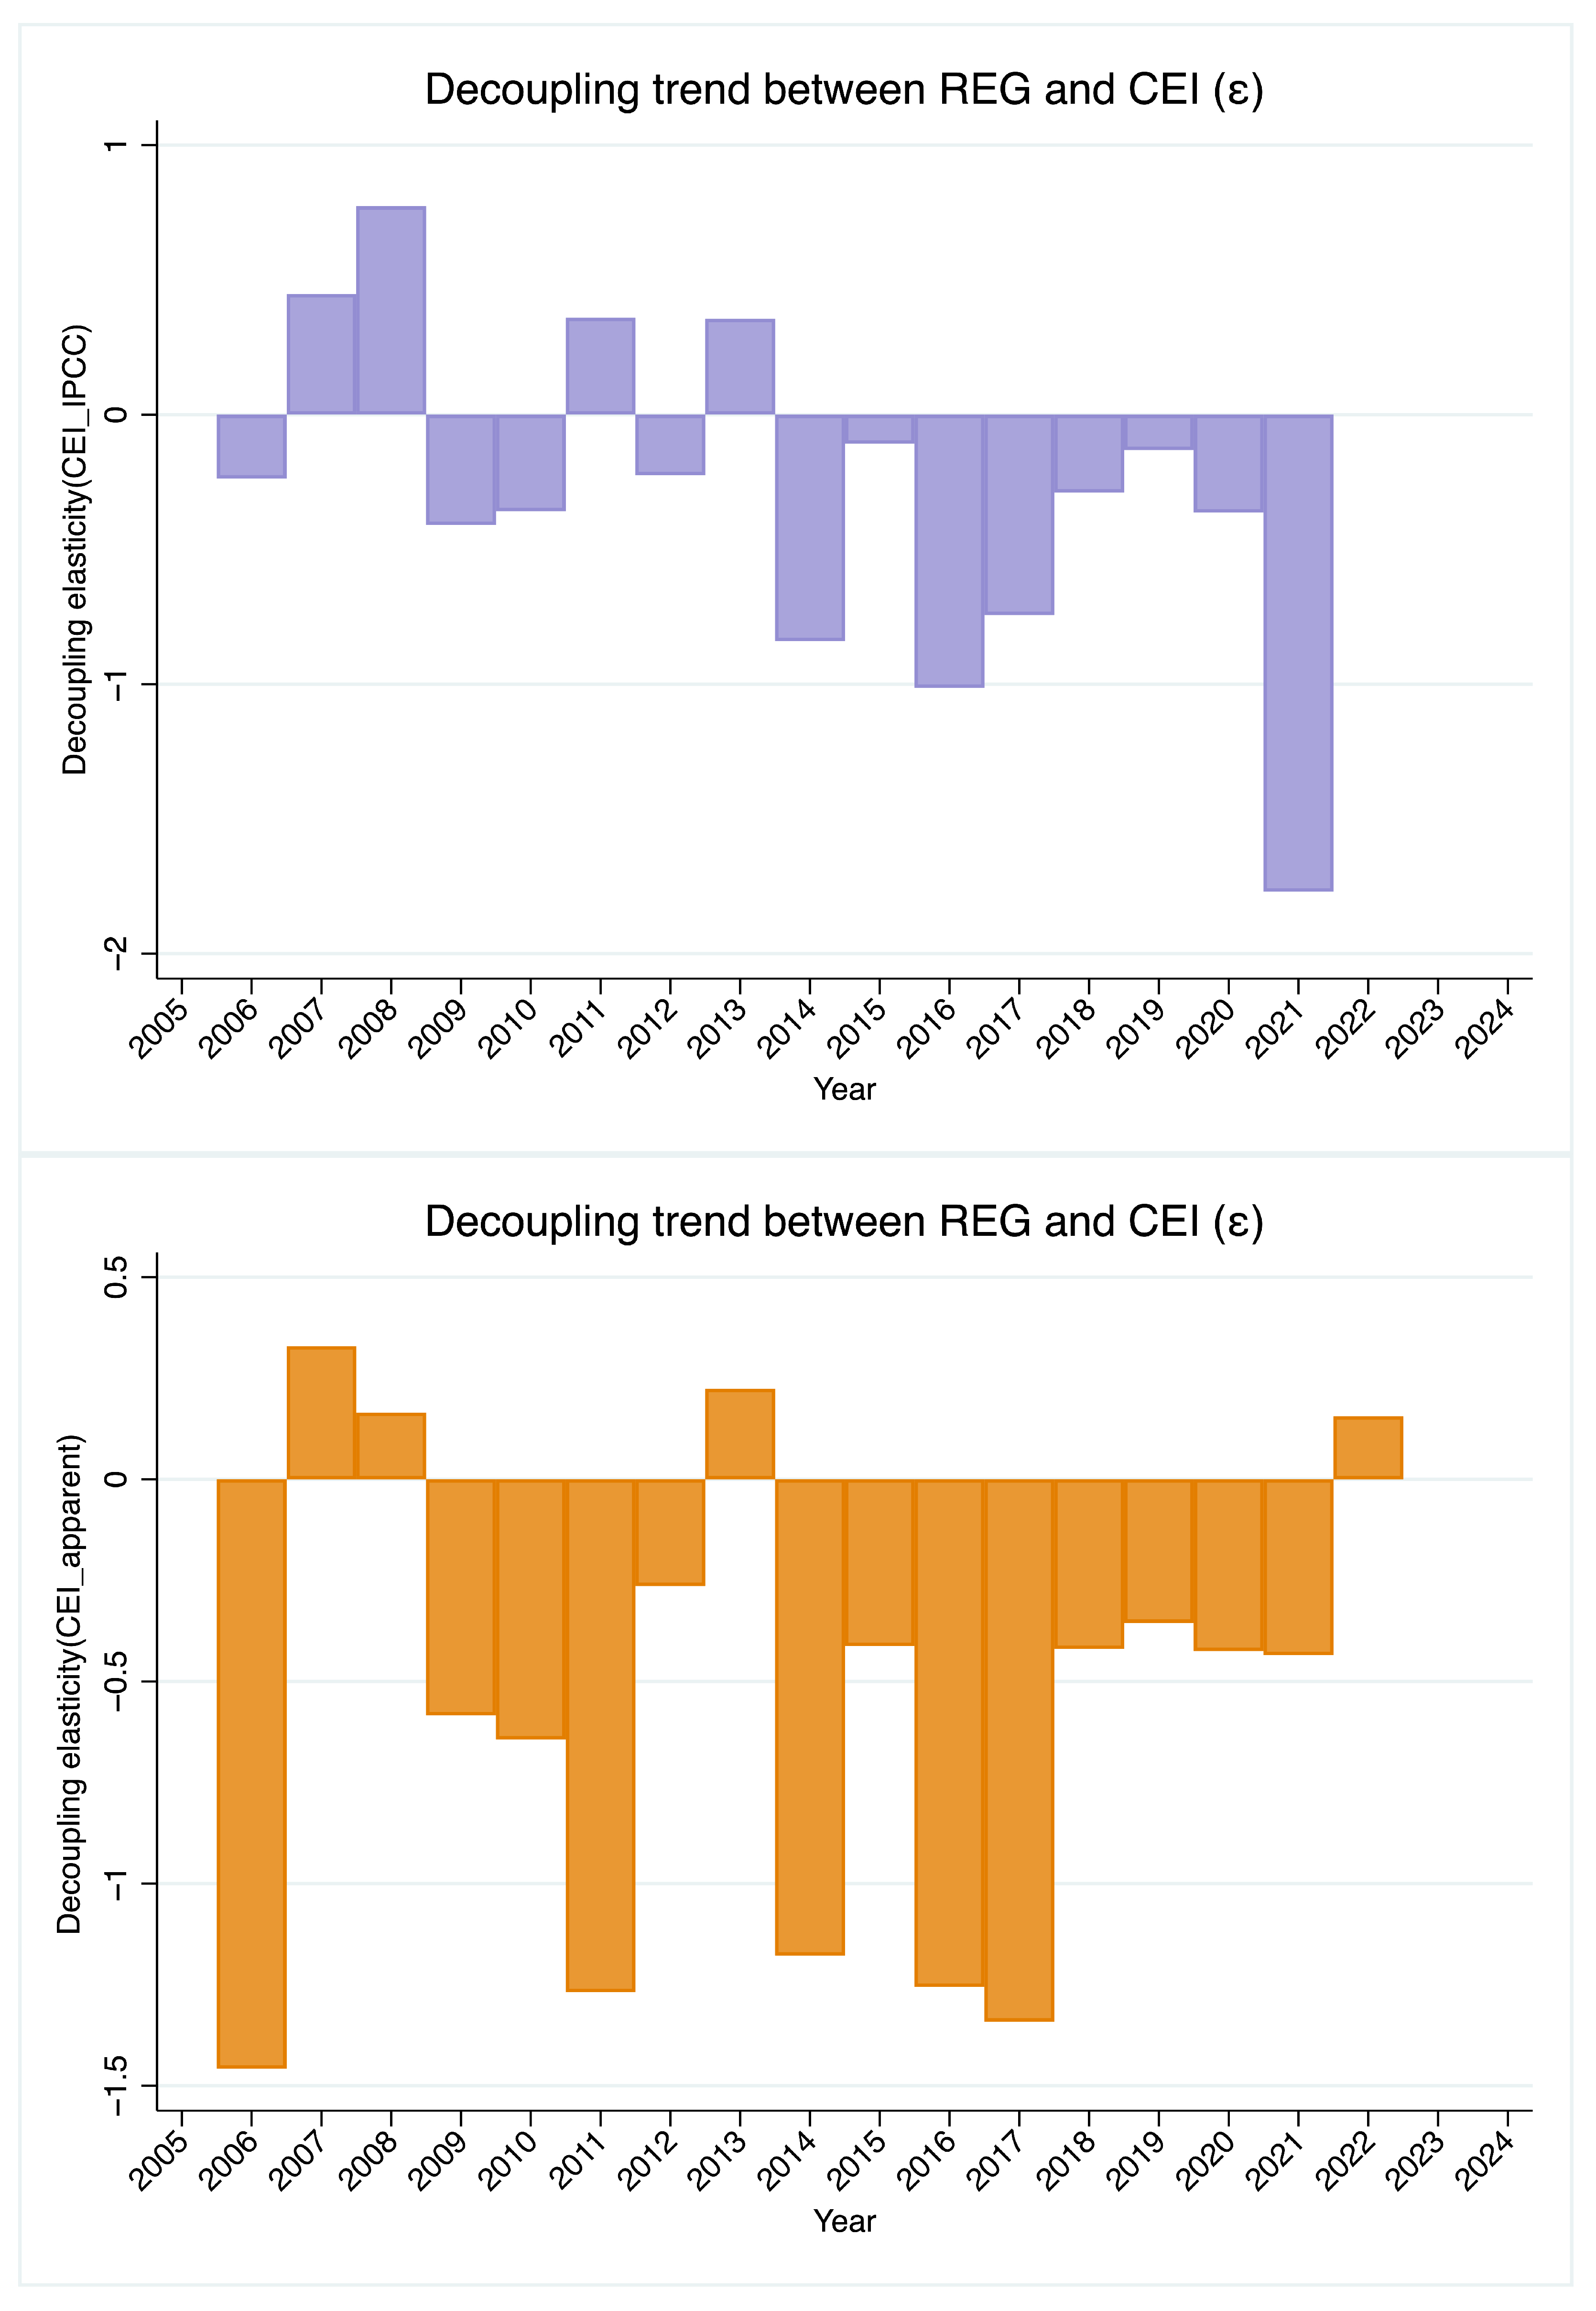
Figure A3.
Spatial distribution of across 30 provinces in selected years (2005, 2010, 2015, 2020, 2021).
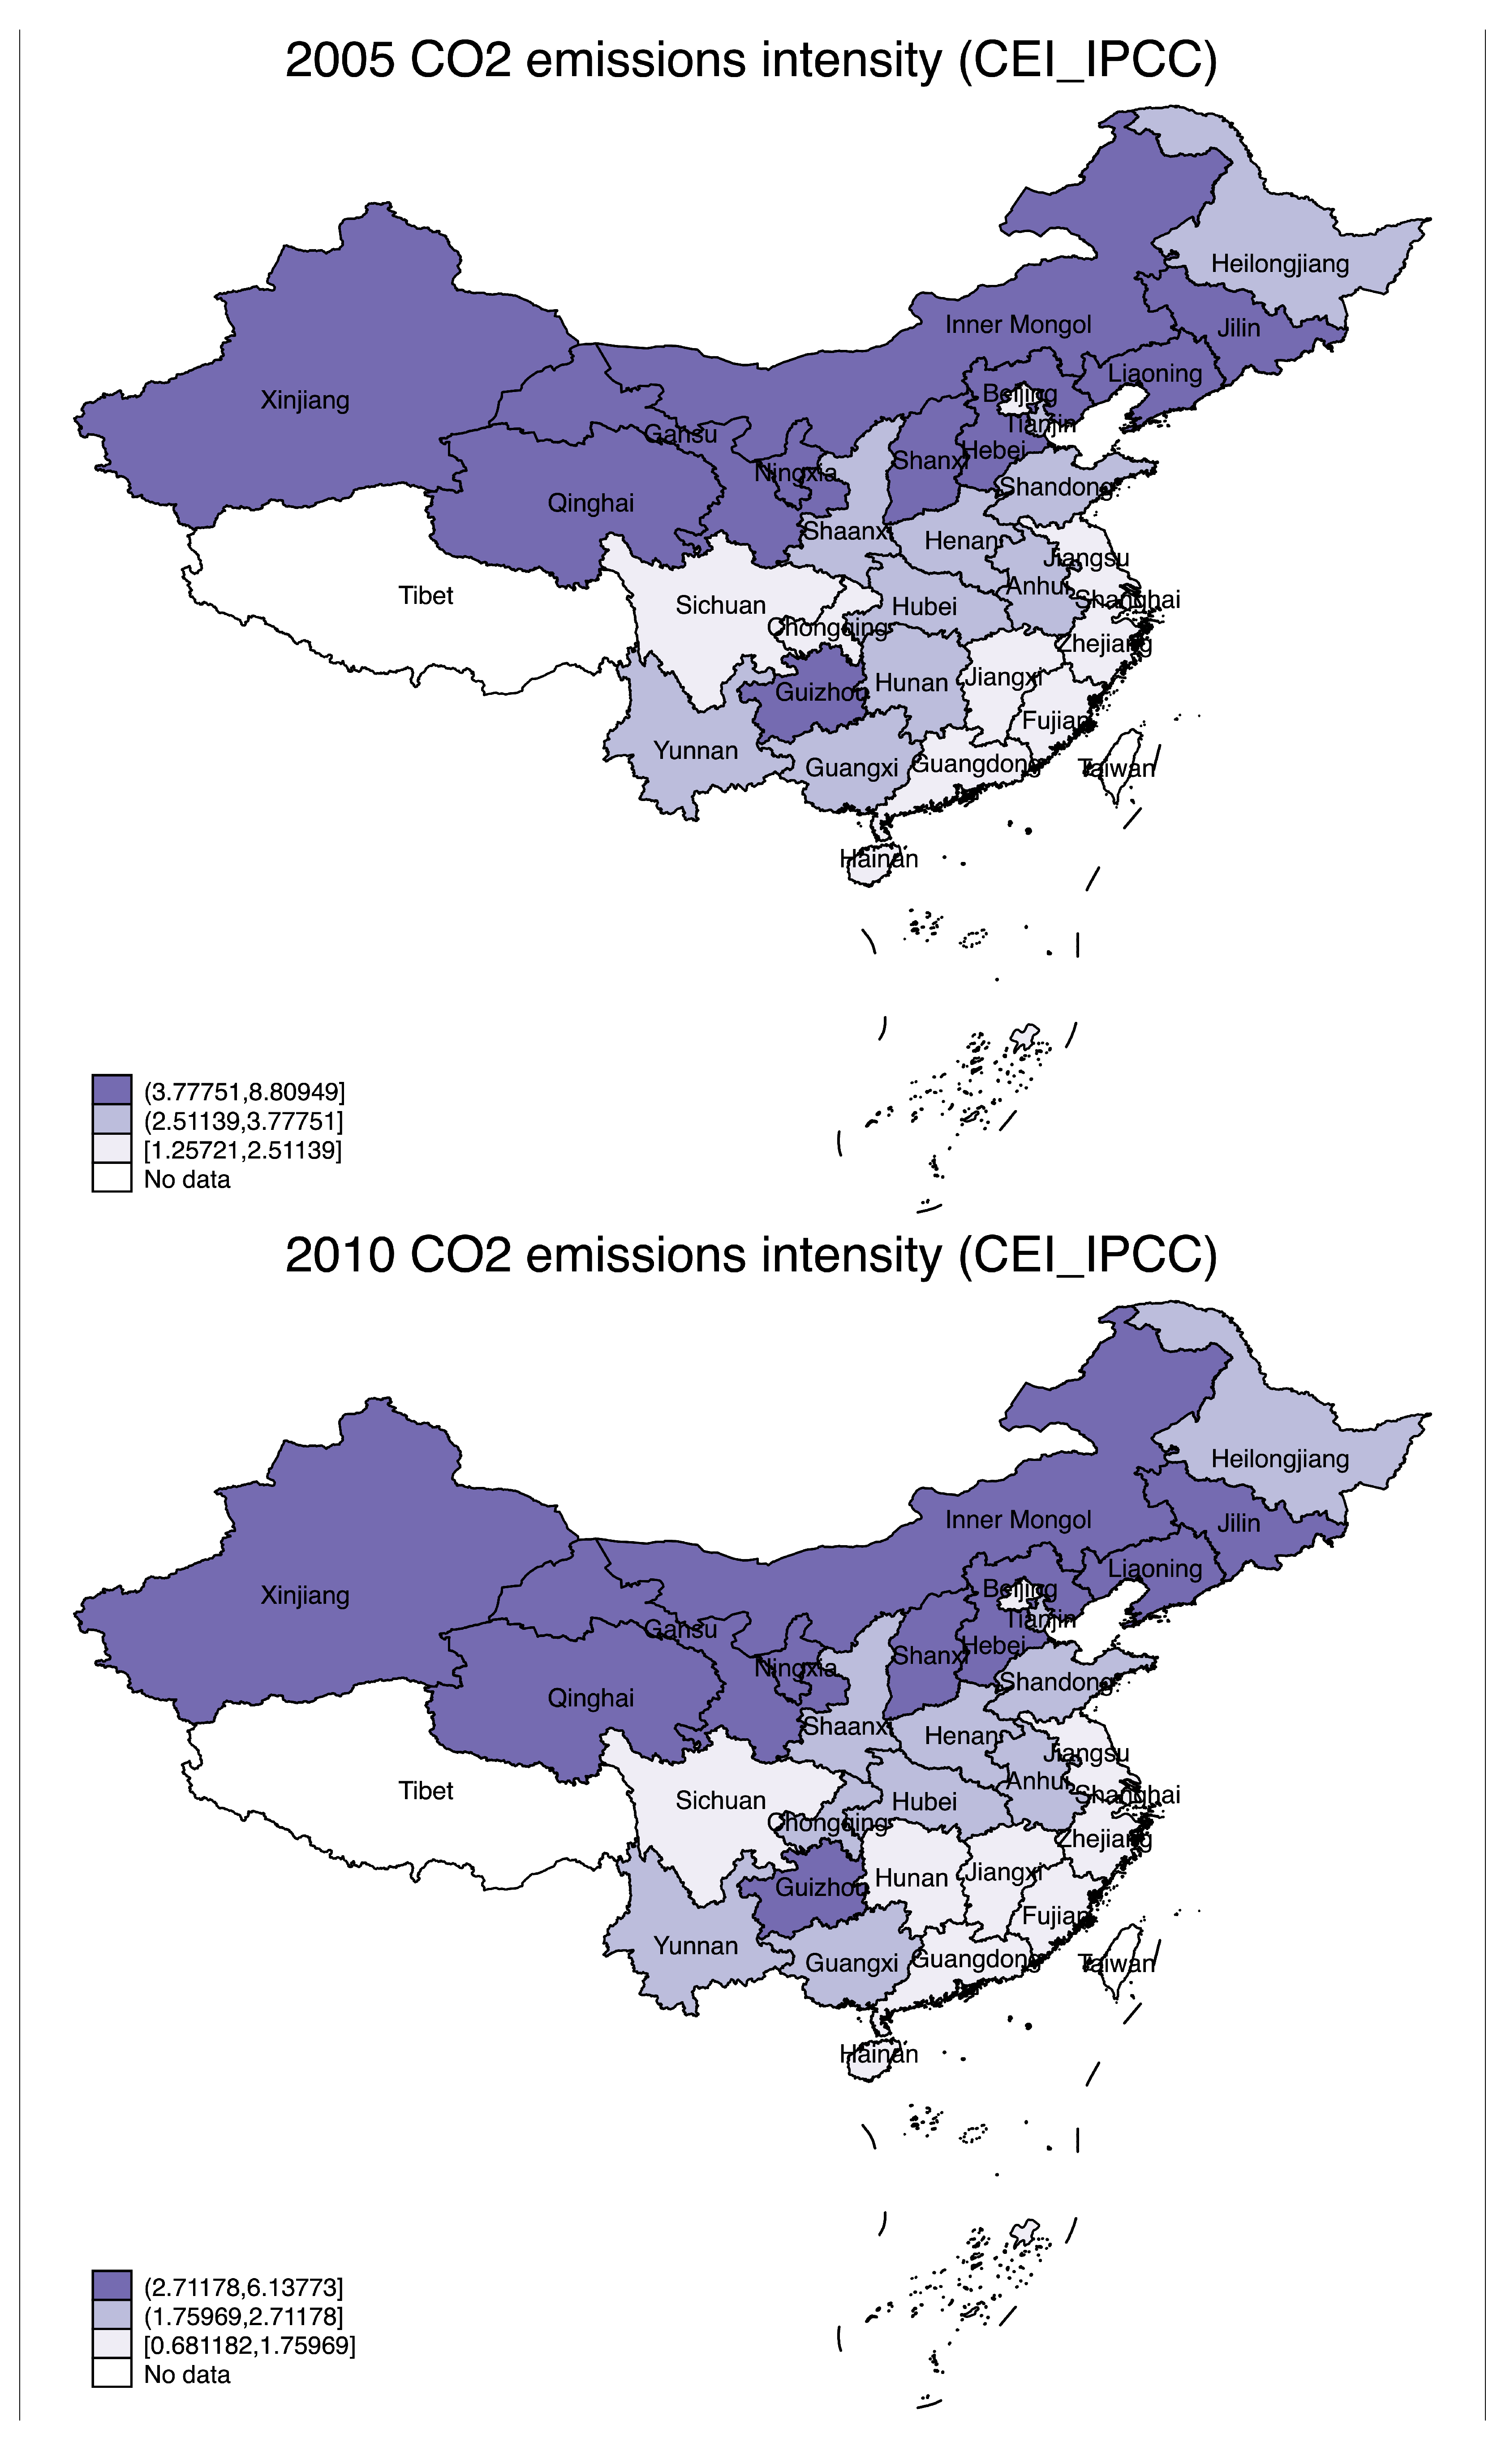
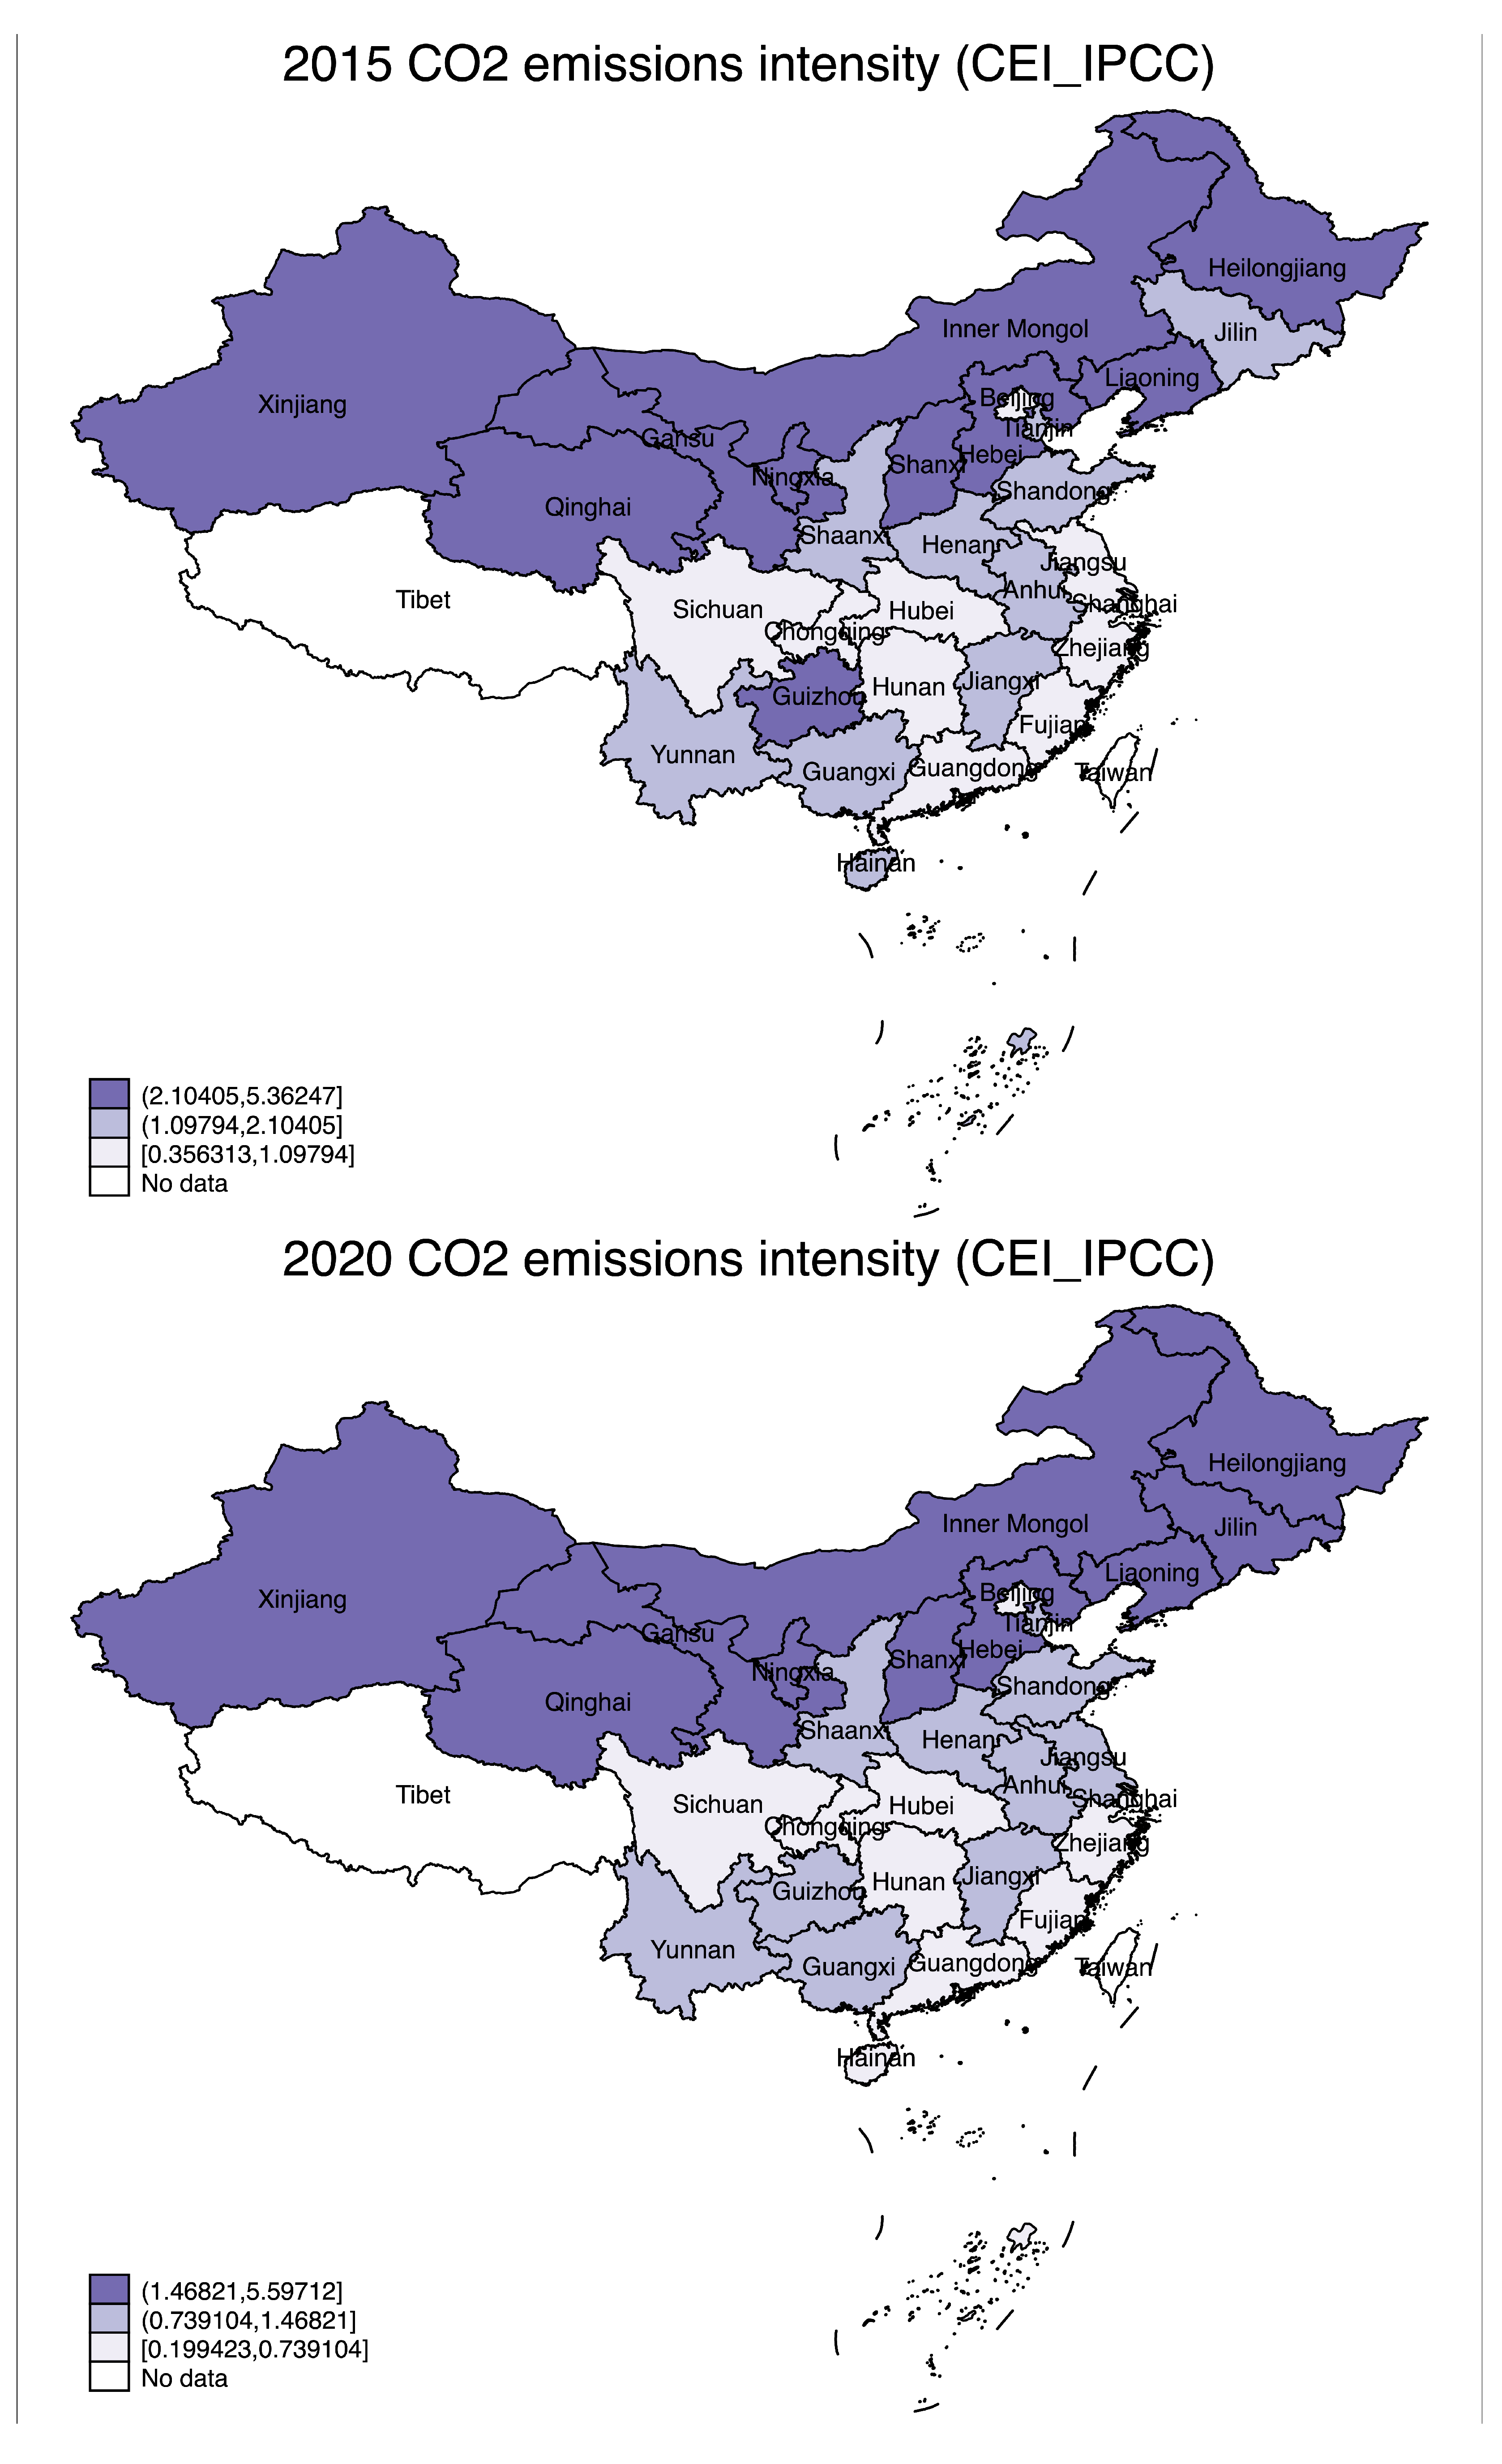
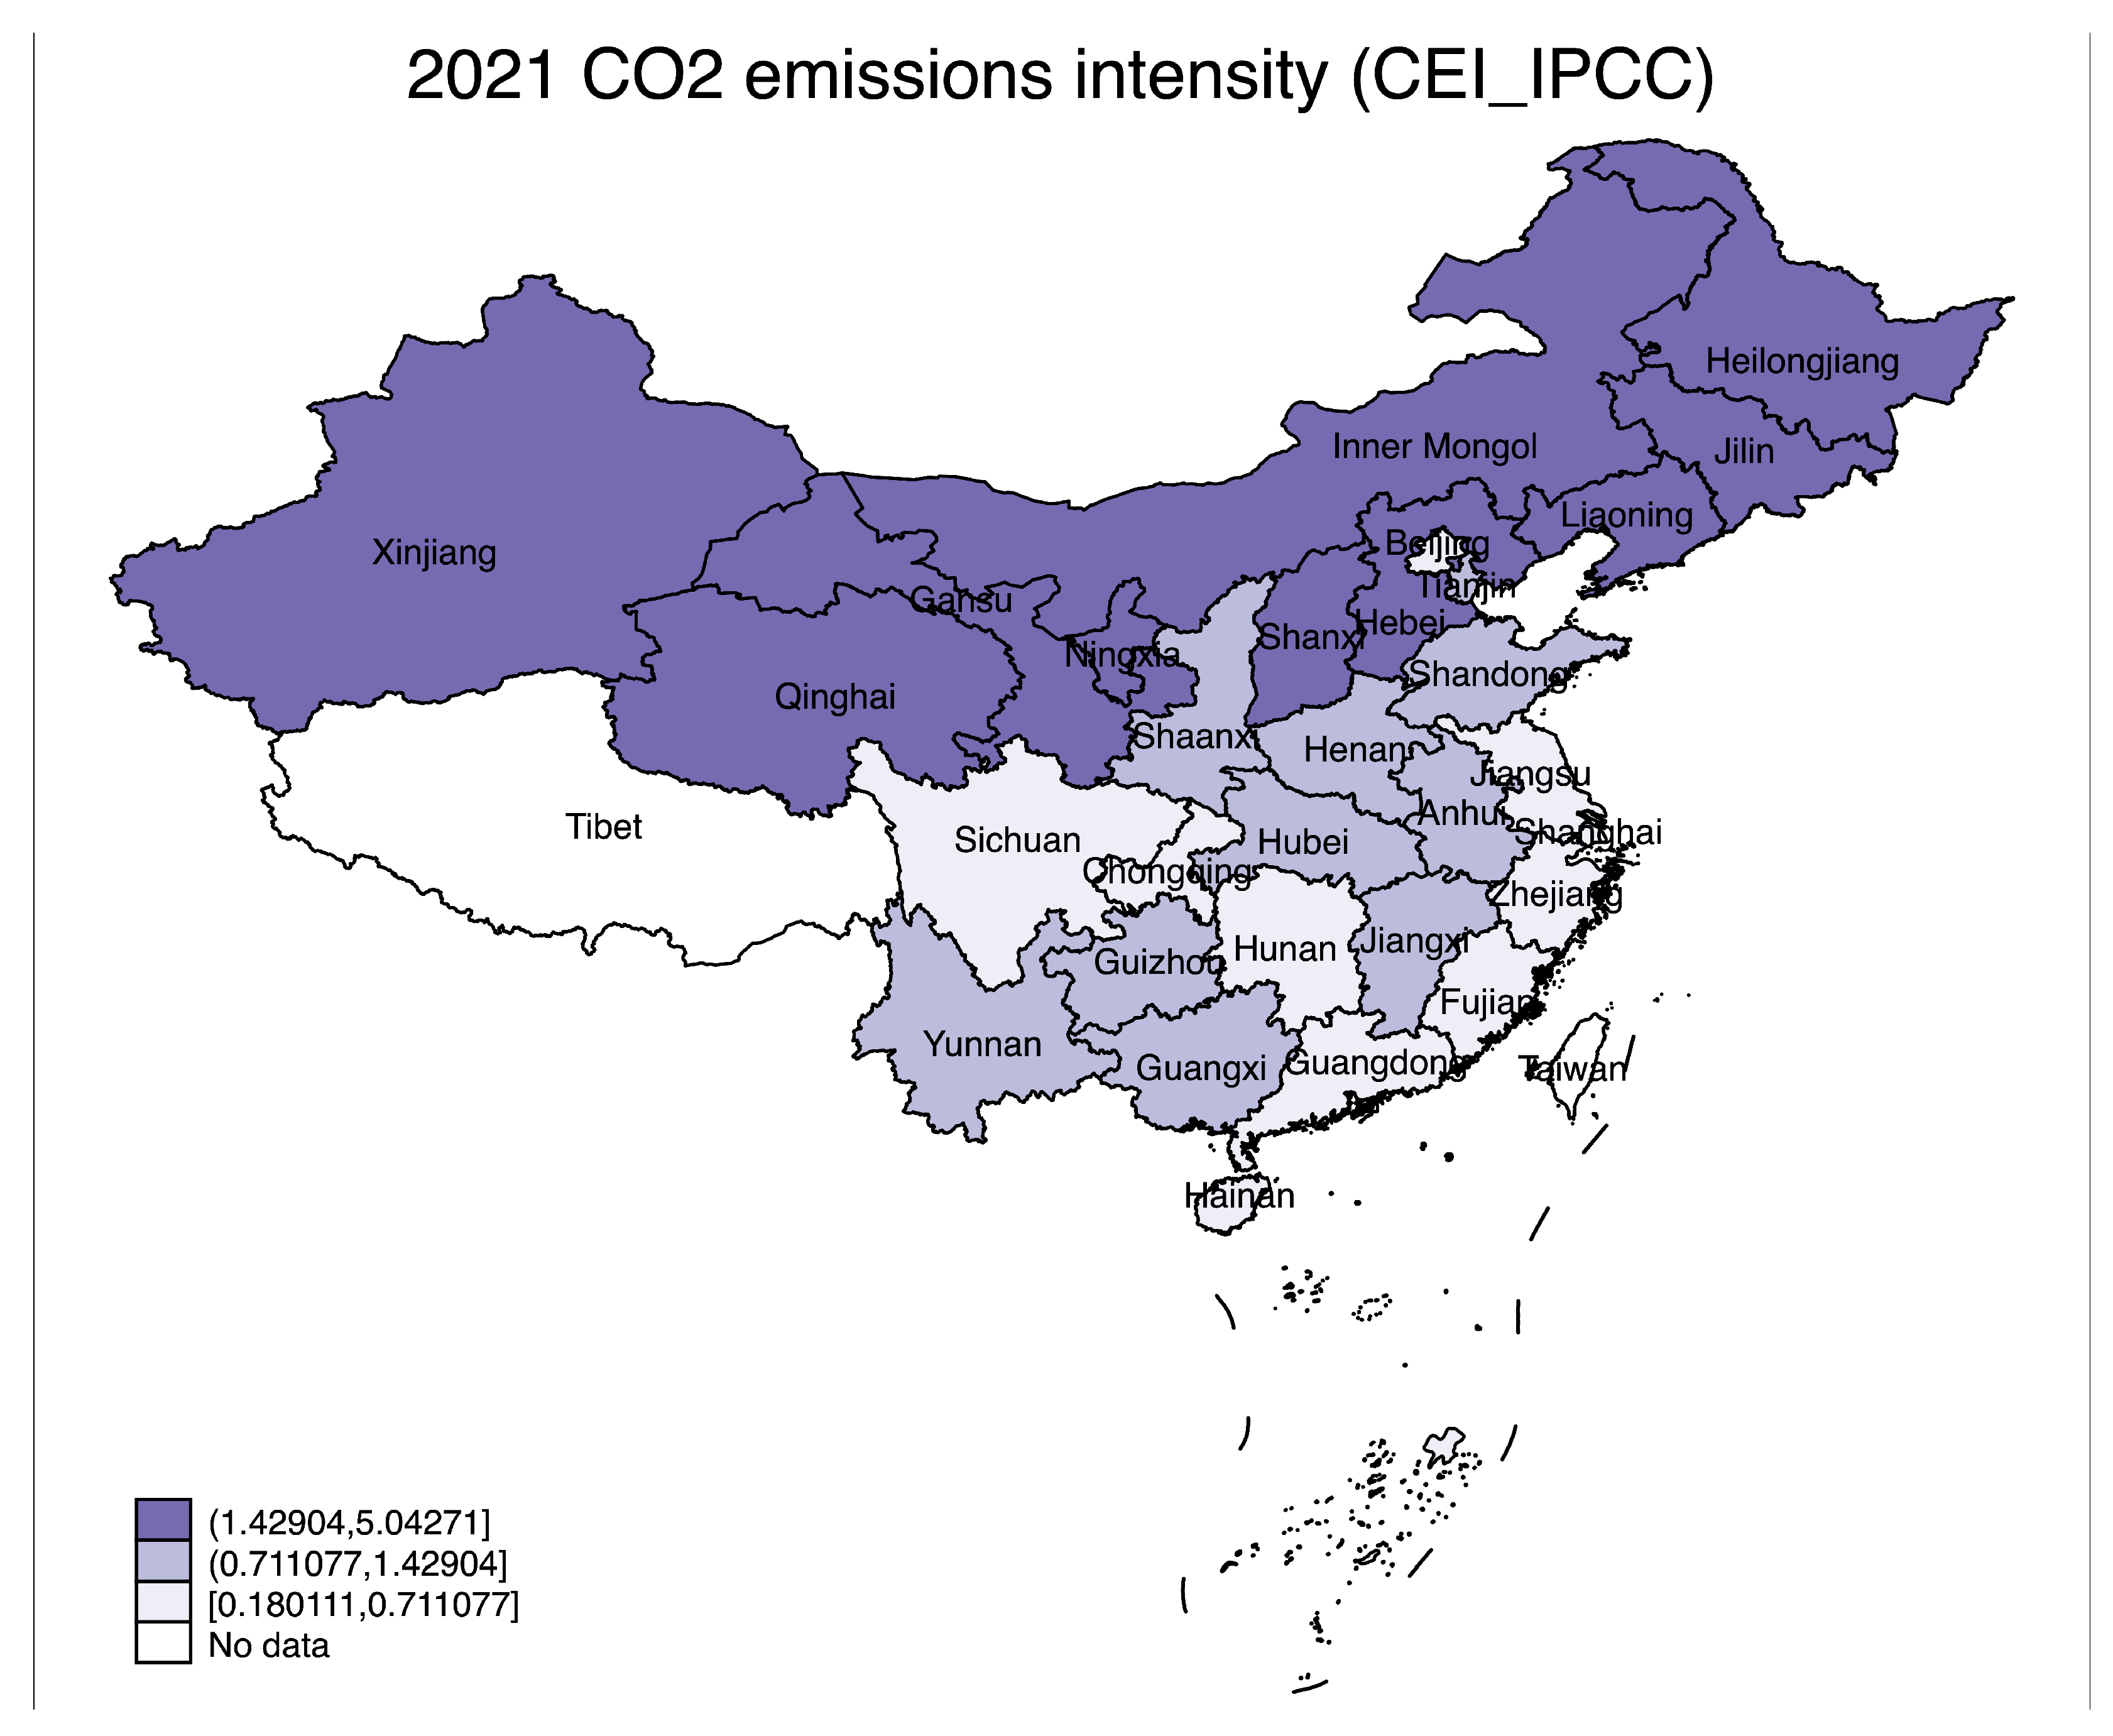
Figure A4.
Spatial distribution of across 30 provinces in selected years (2005, 2010, 2015, 2020, 2022).
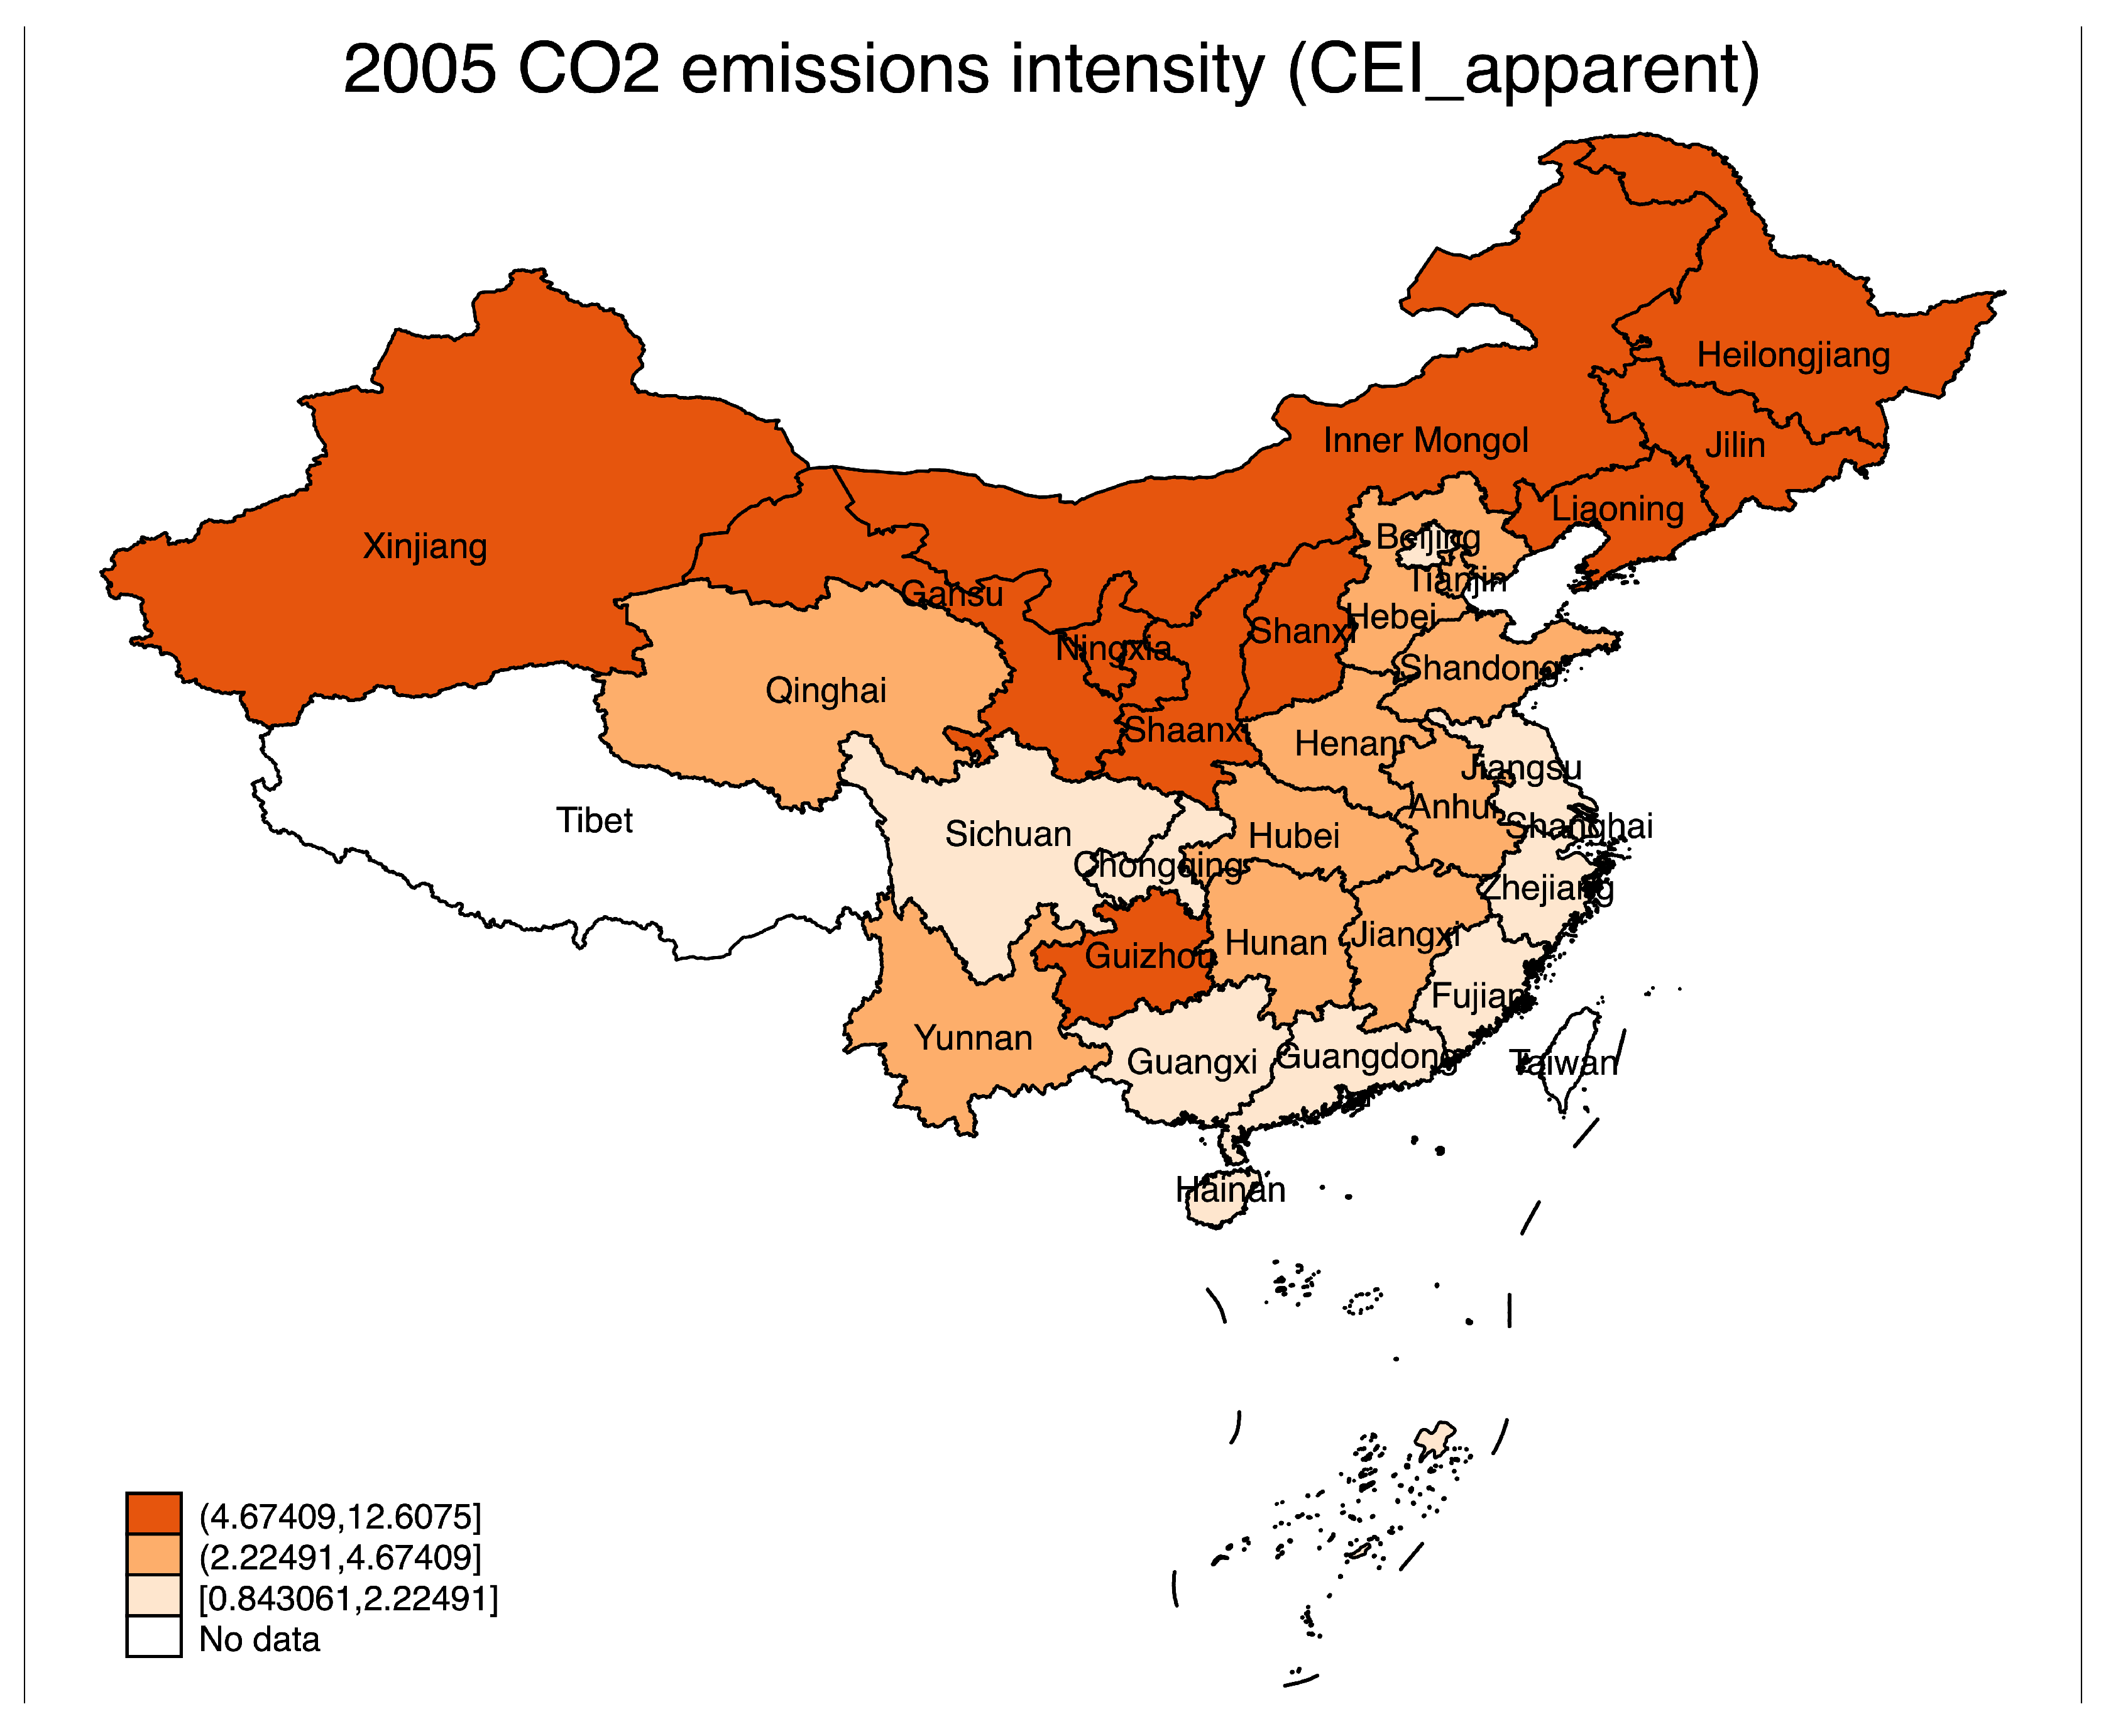
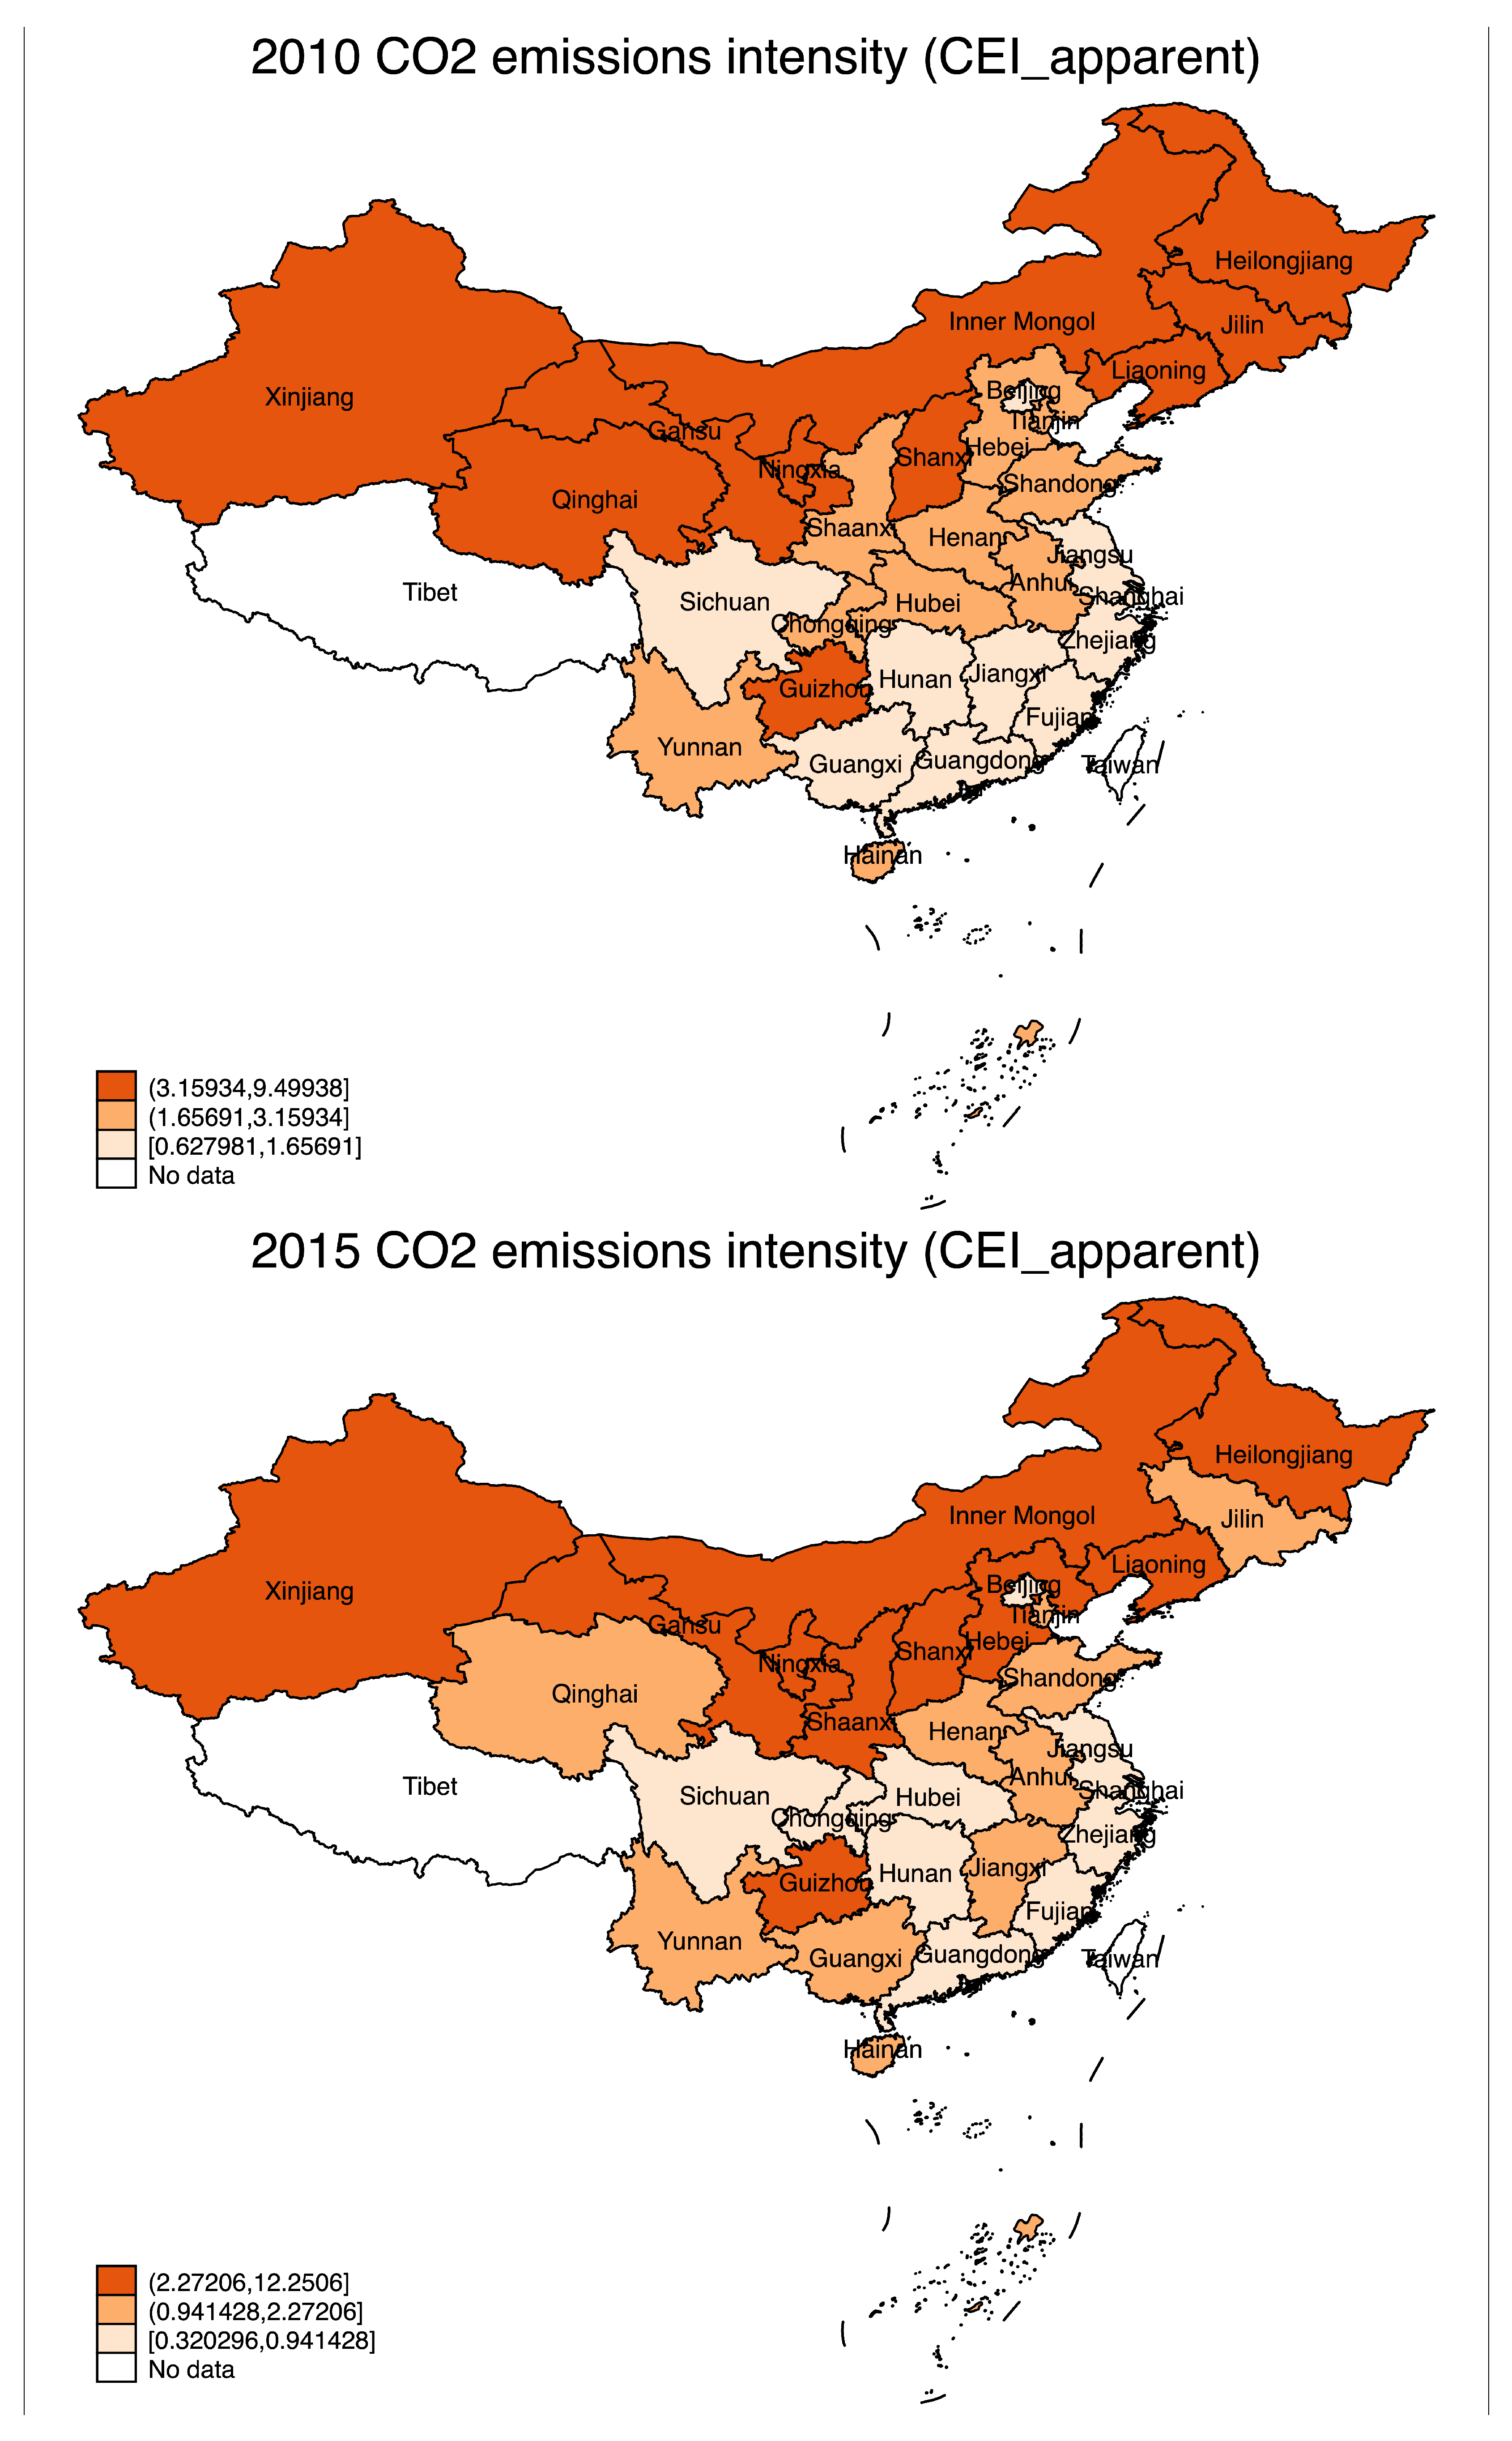
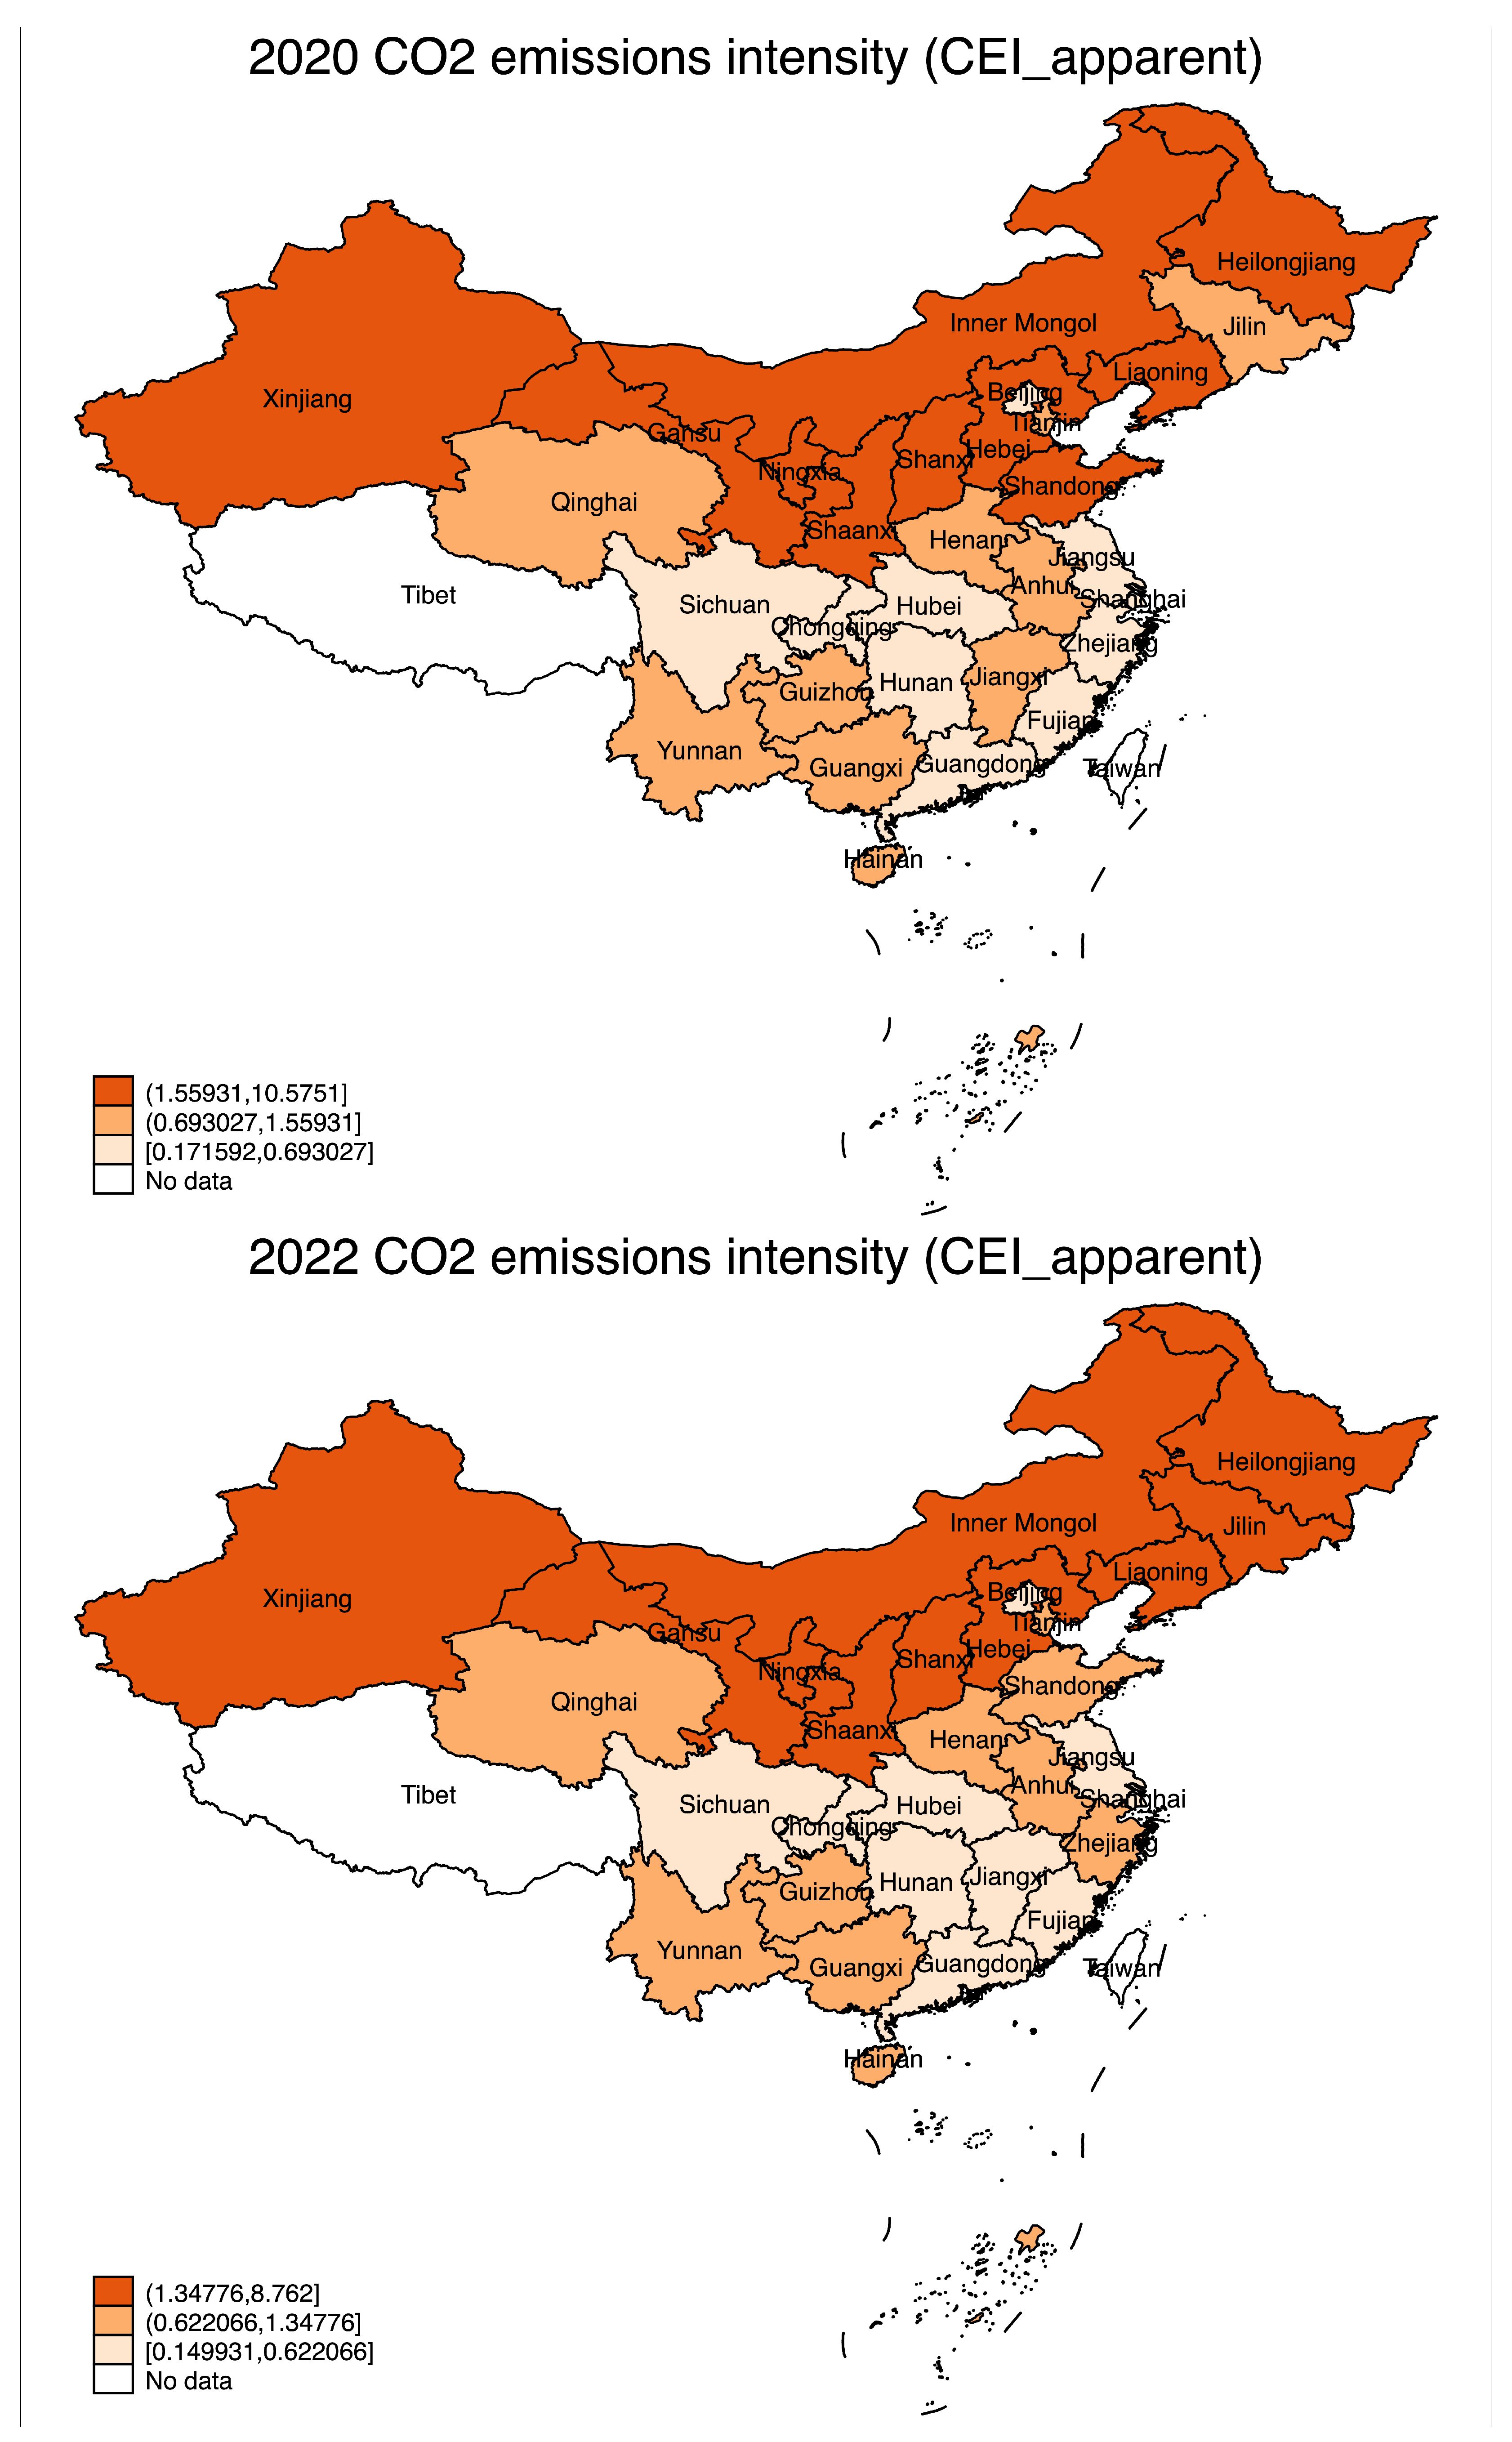
Figure A5.
Moran’s Index scatterplot of using provincial neighbor matrix weight () in selected years (2005, 2010, 2015, 2020, 2021). Note: The diagonal fitted line indicates the spatial association between provincial CEI and its spatial lag.
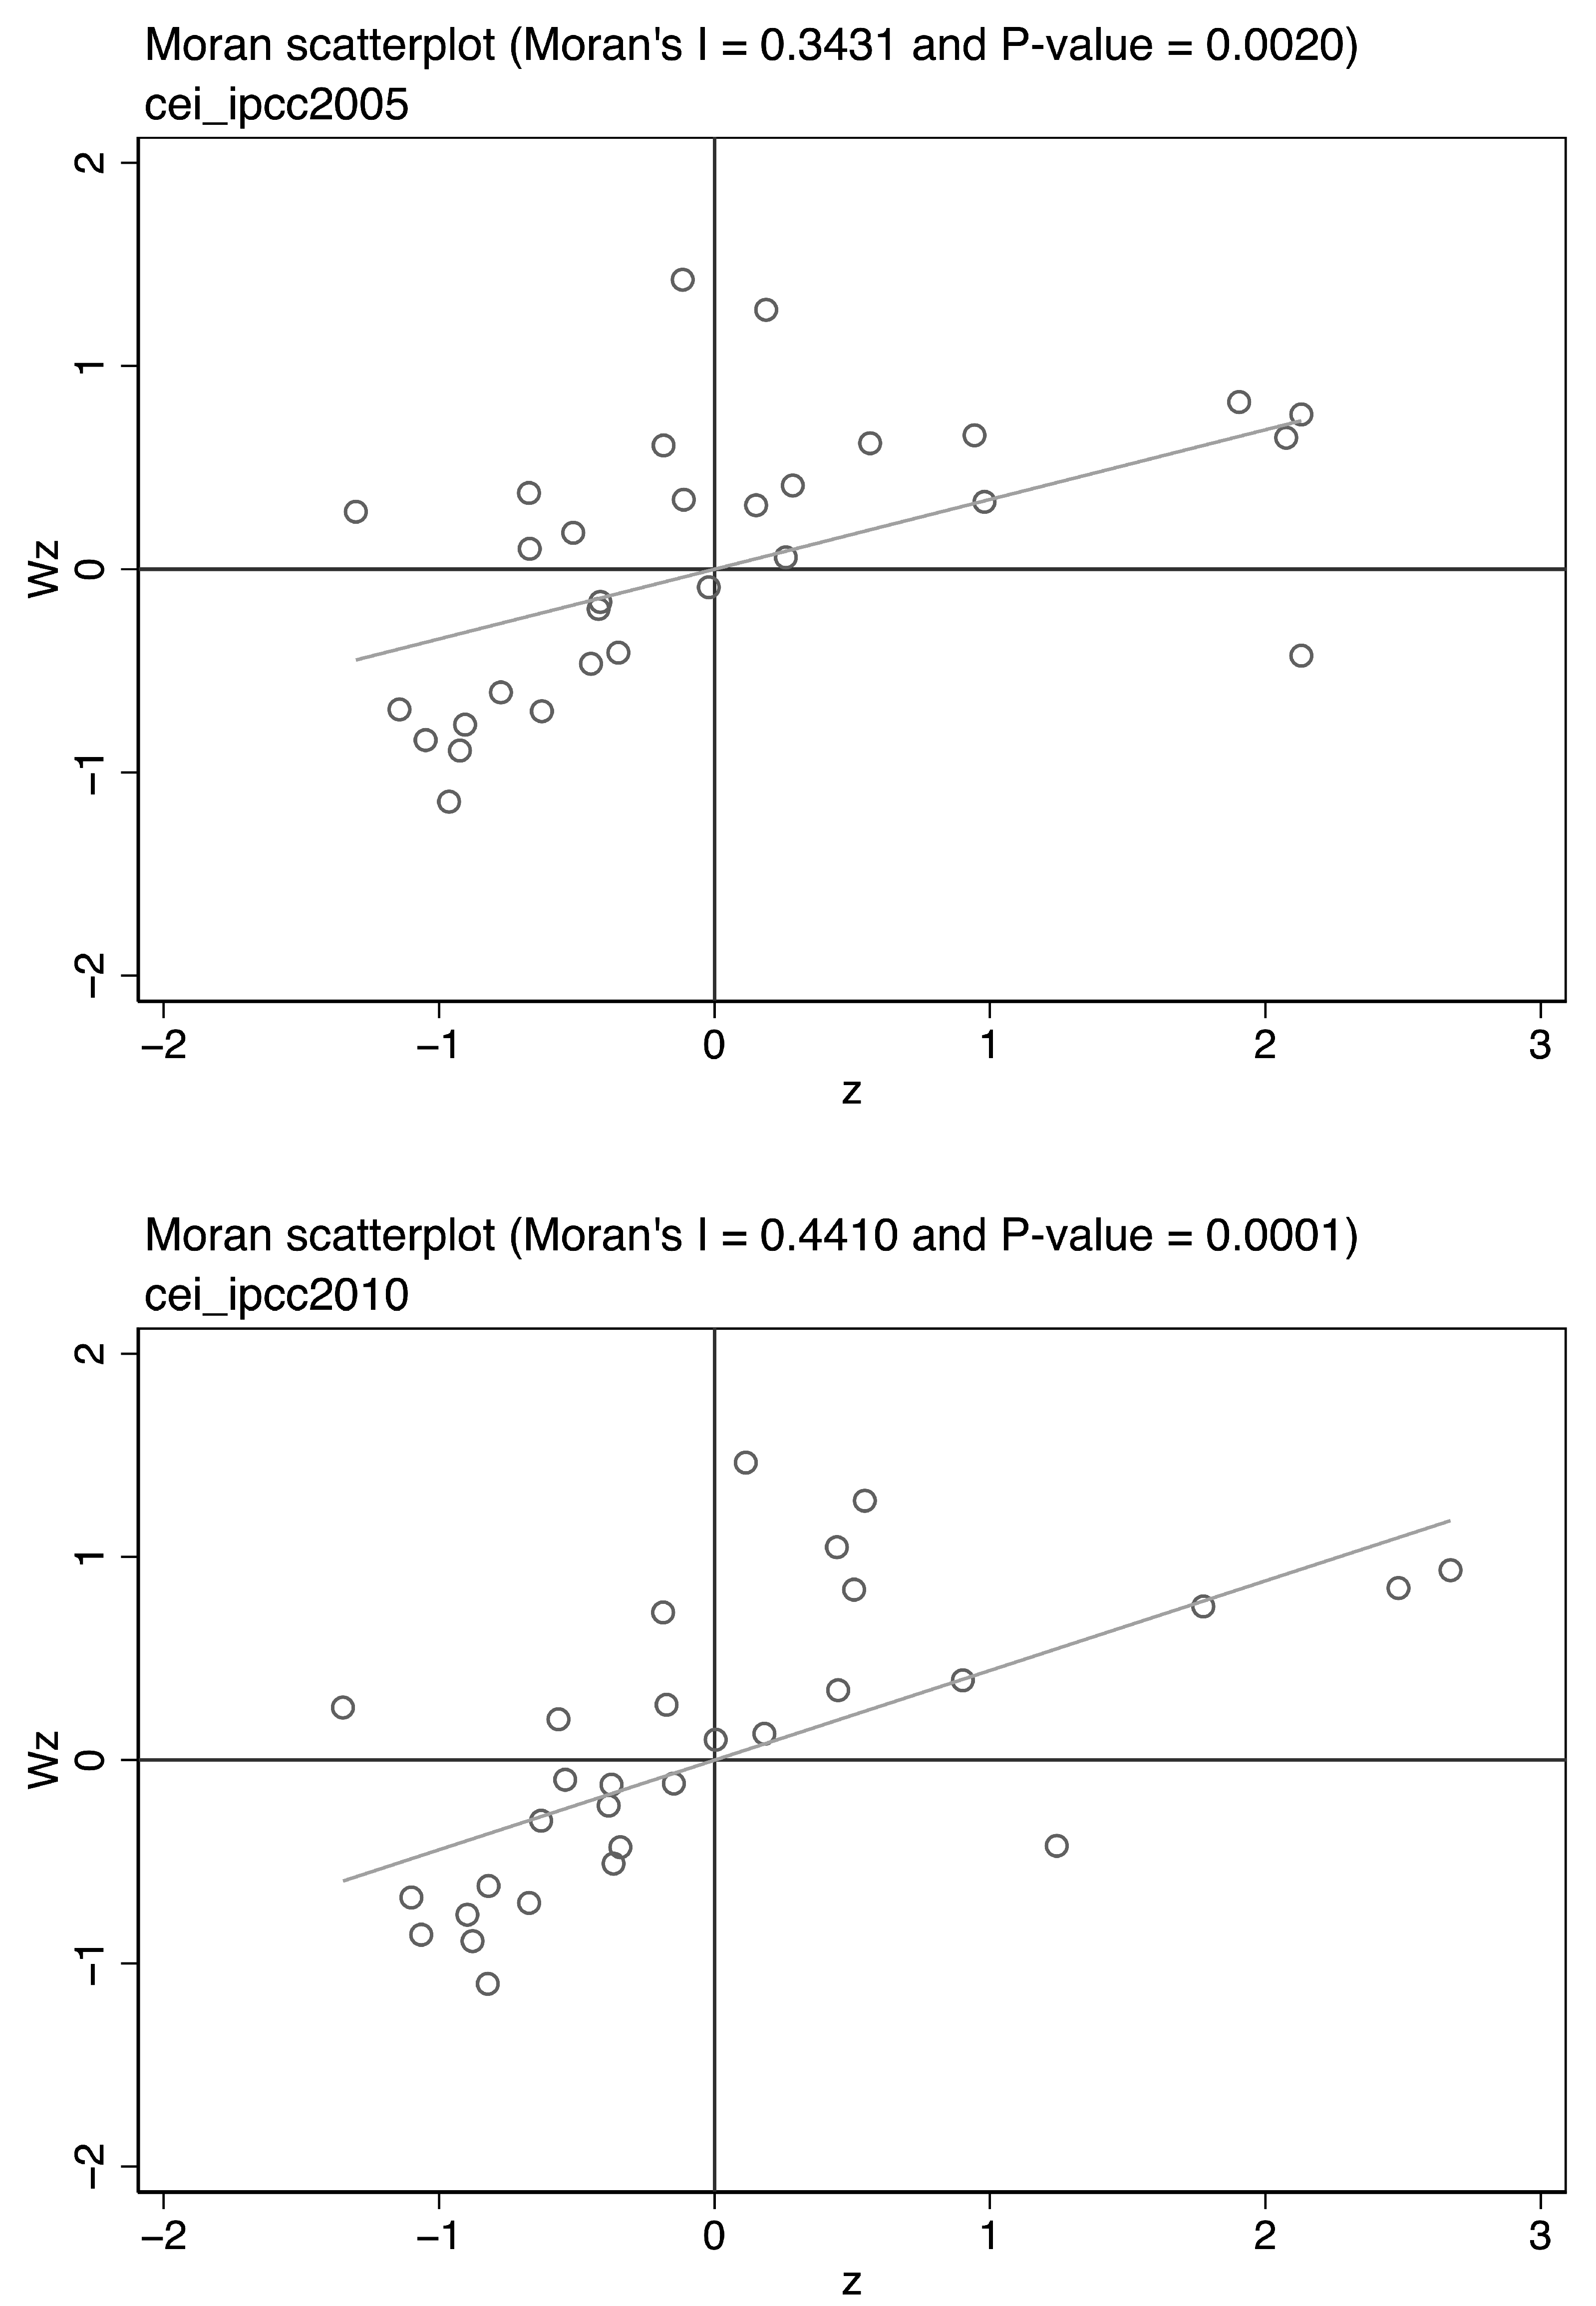
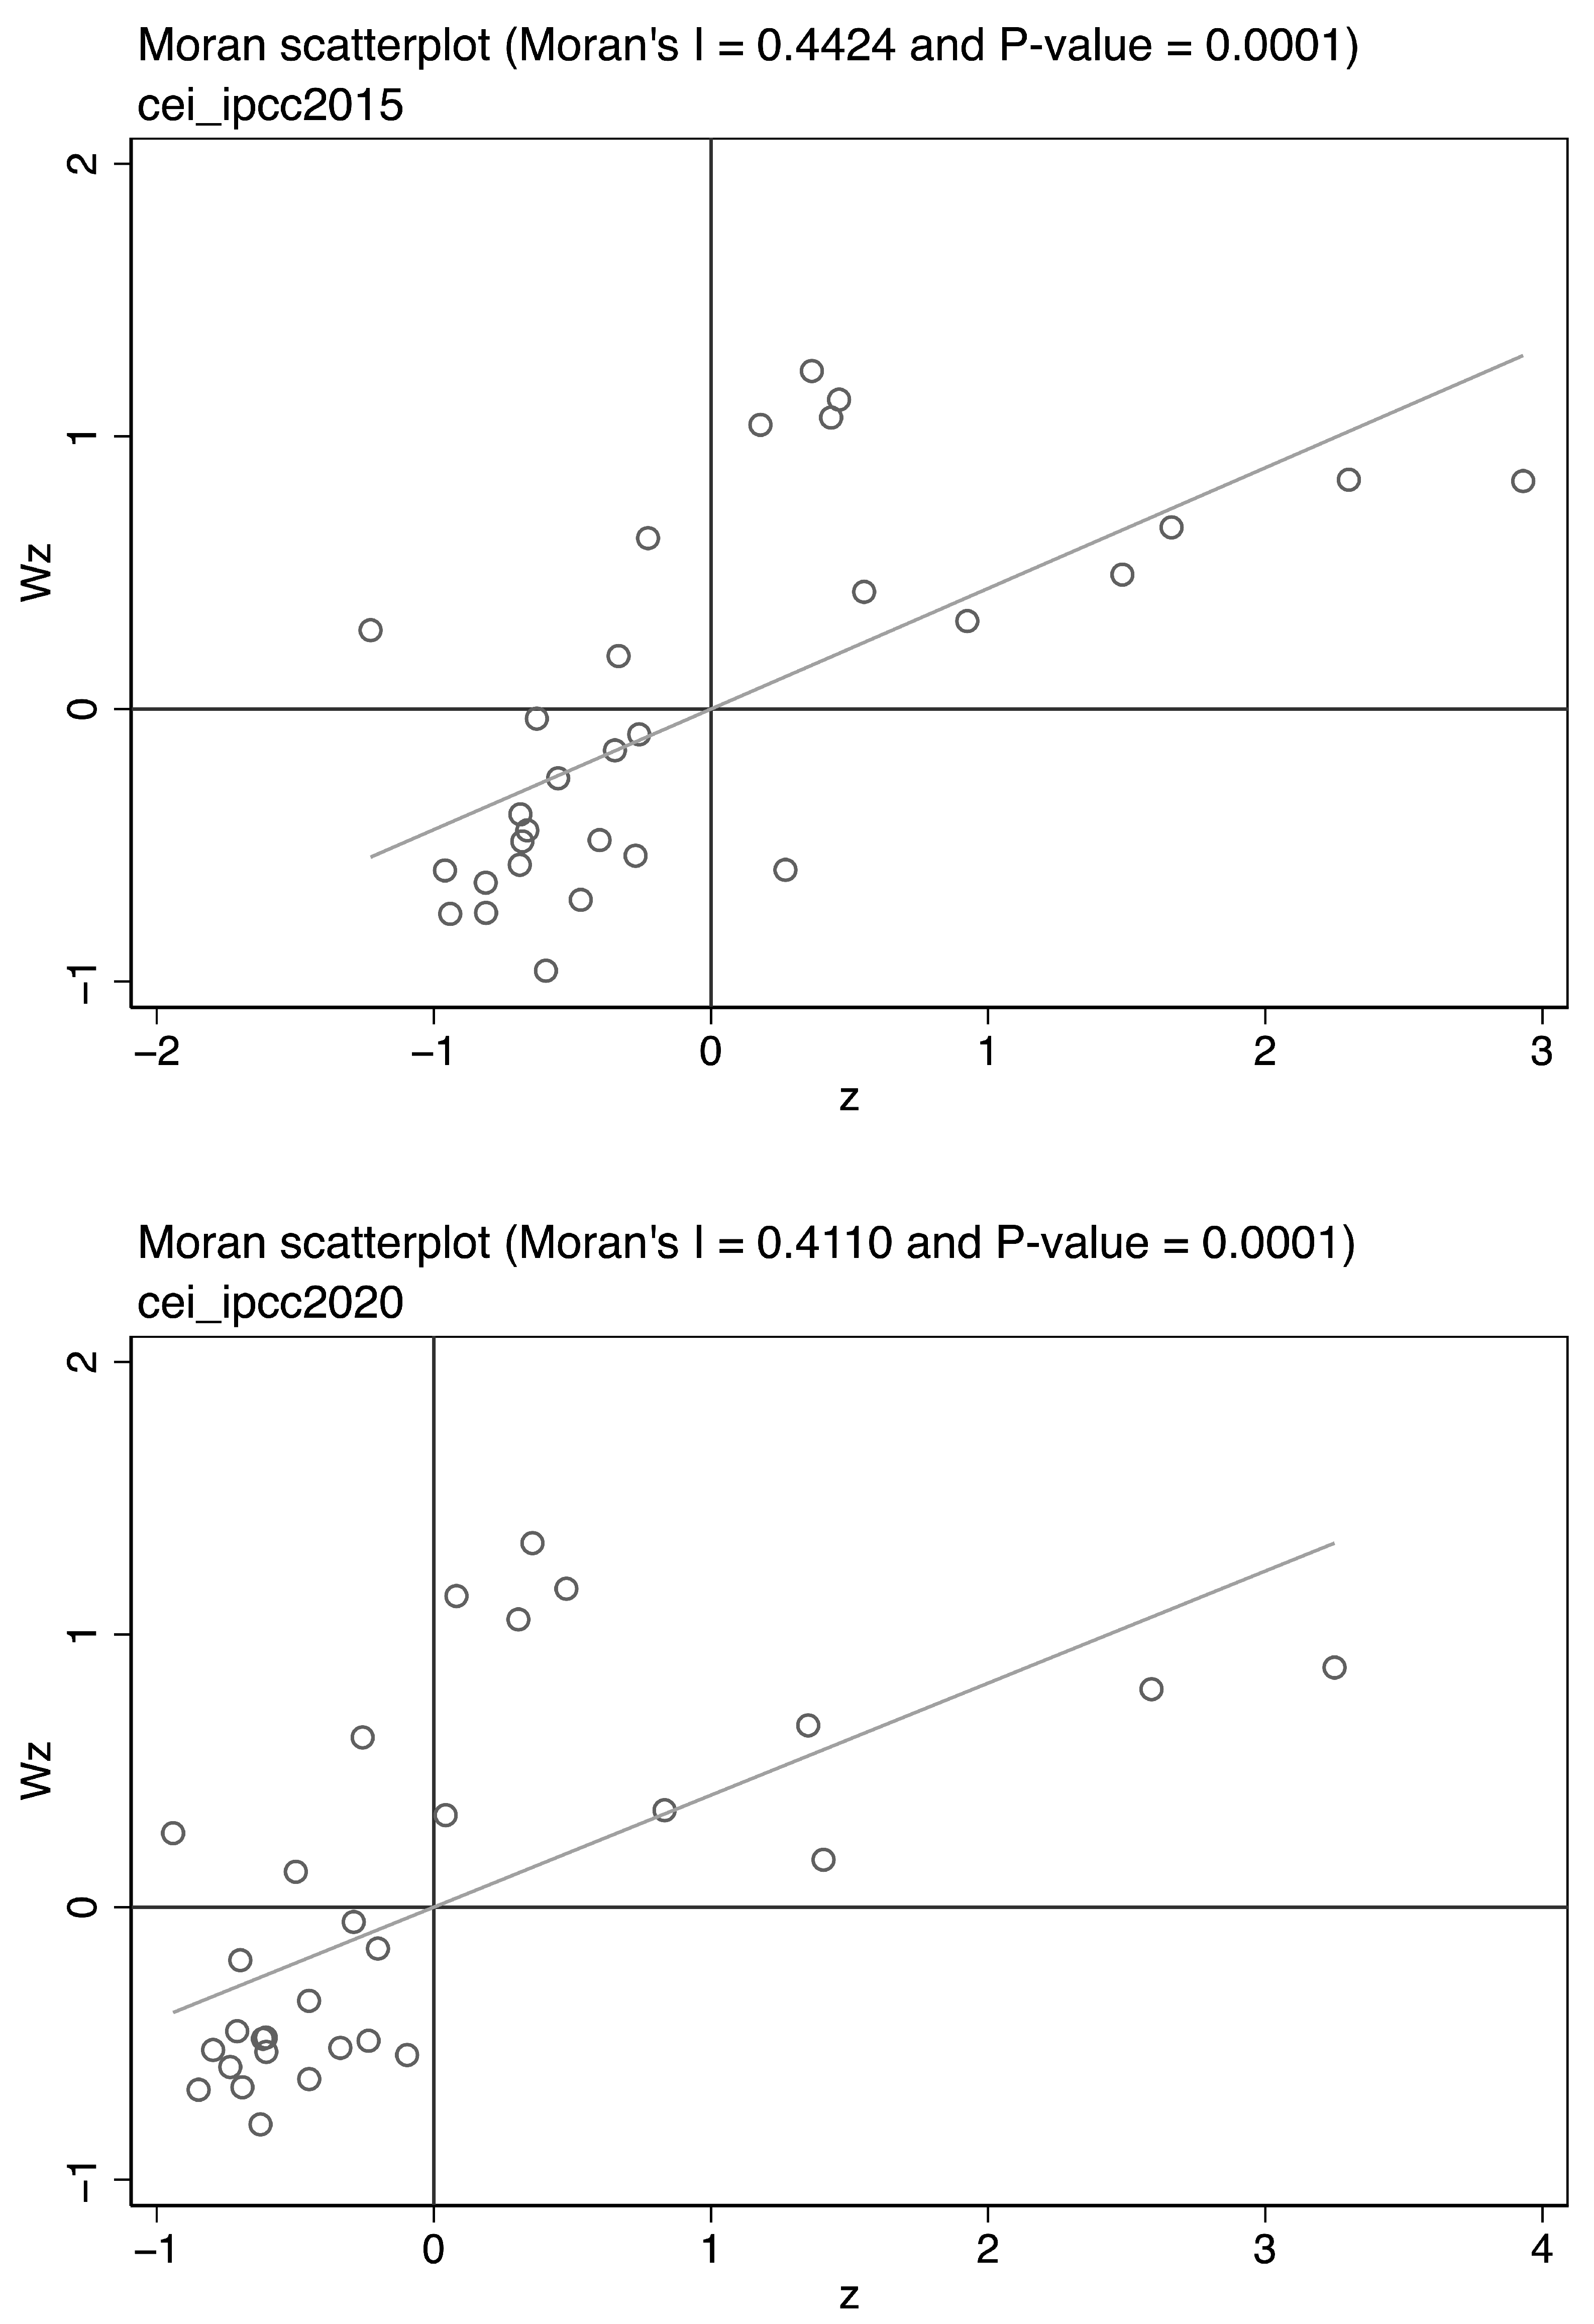
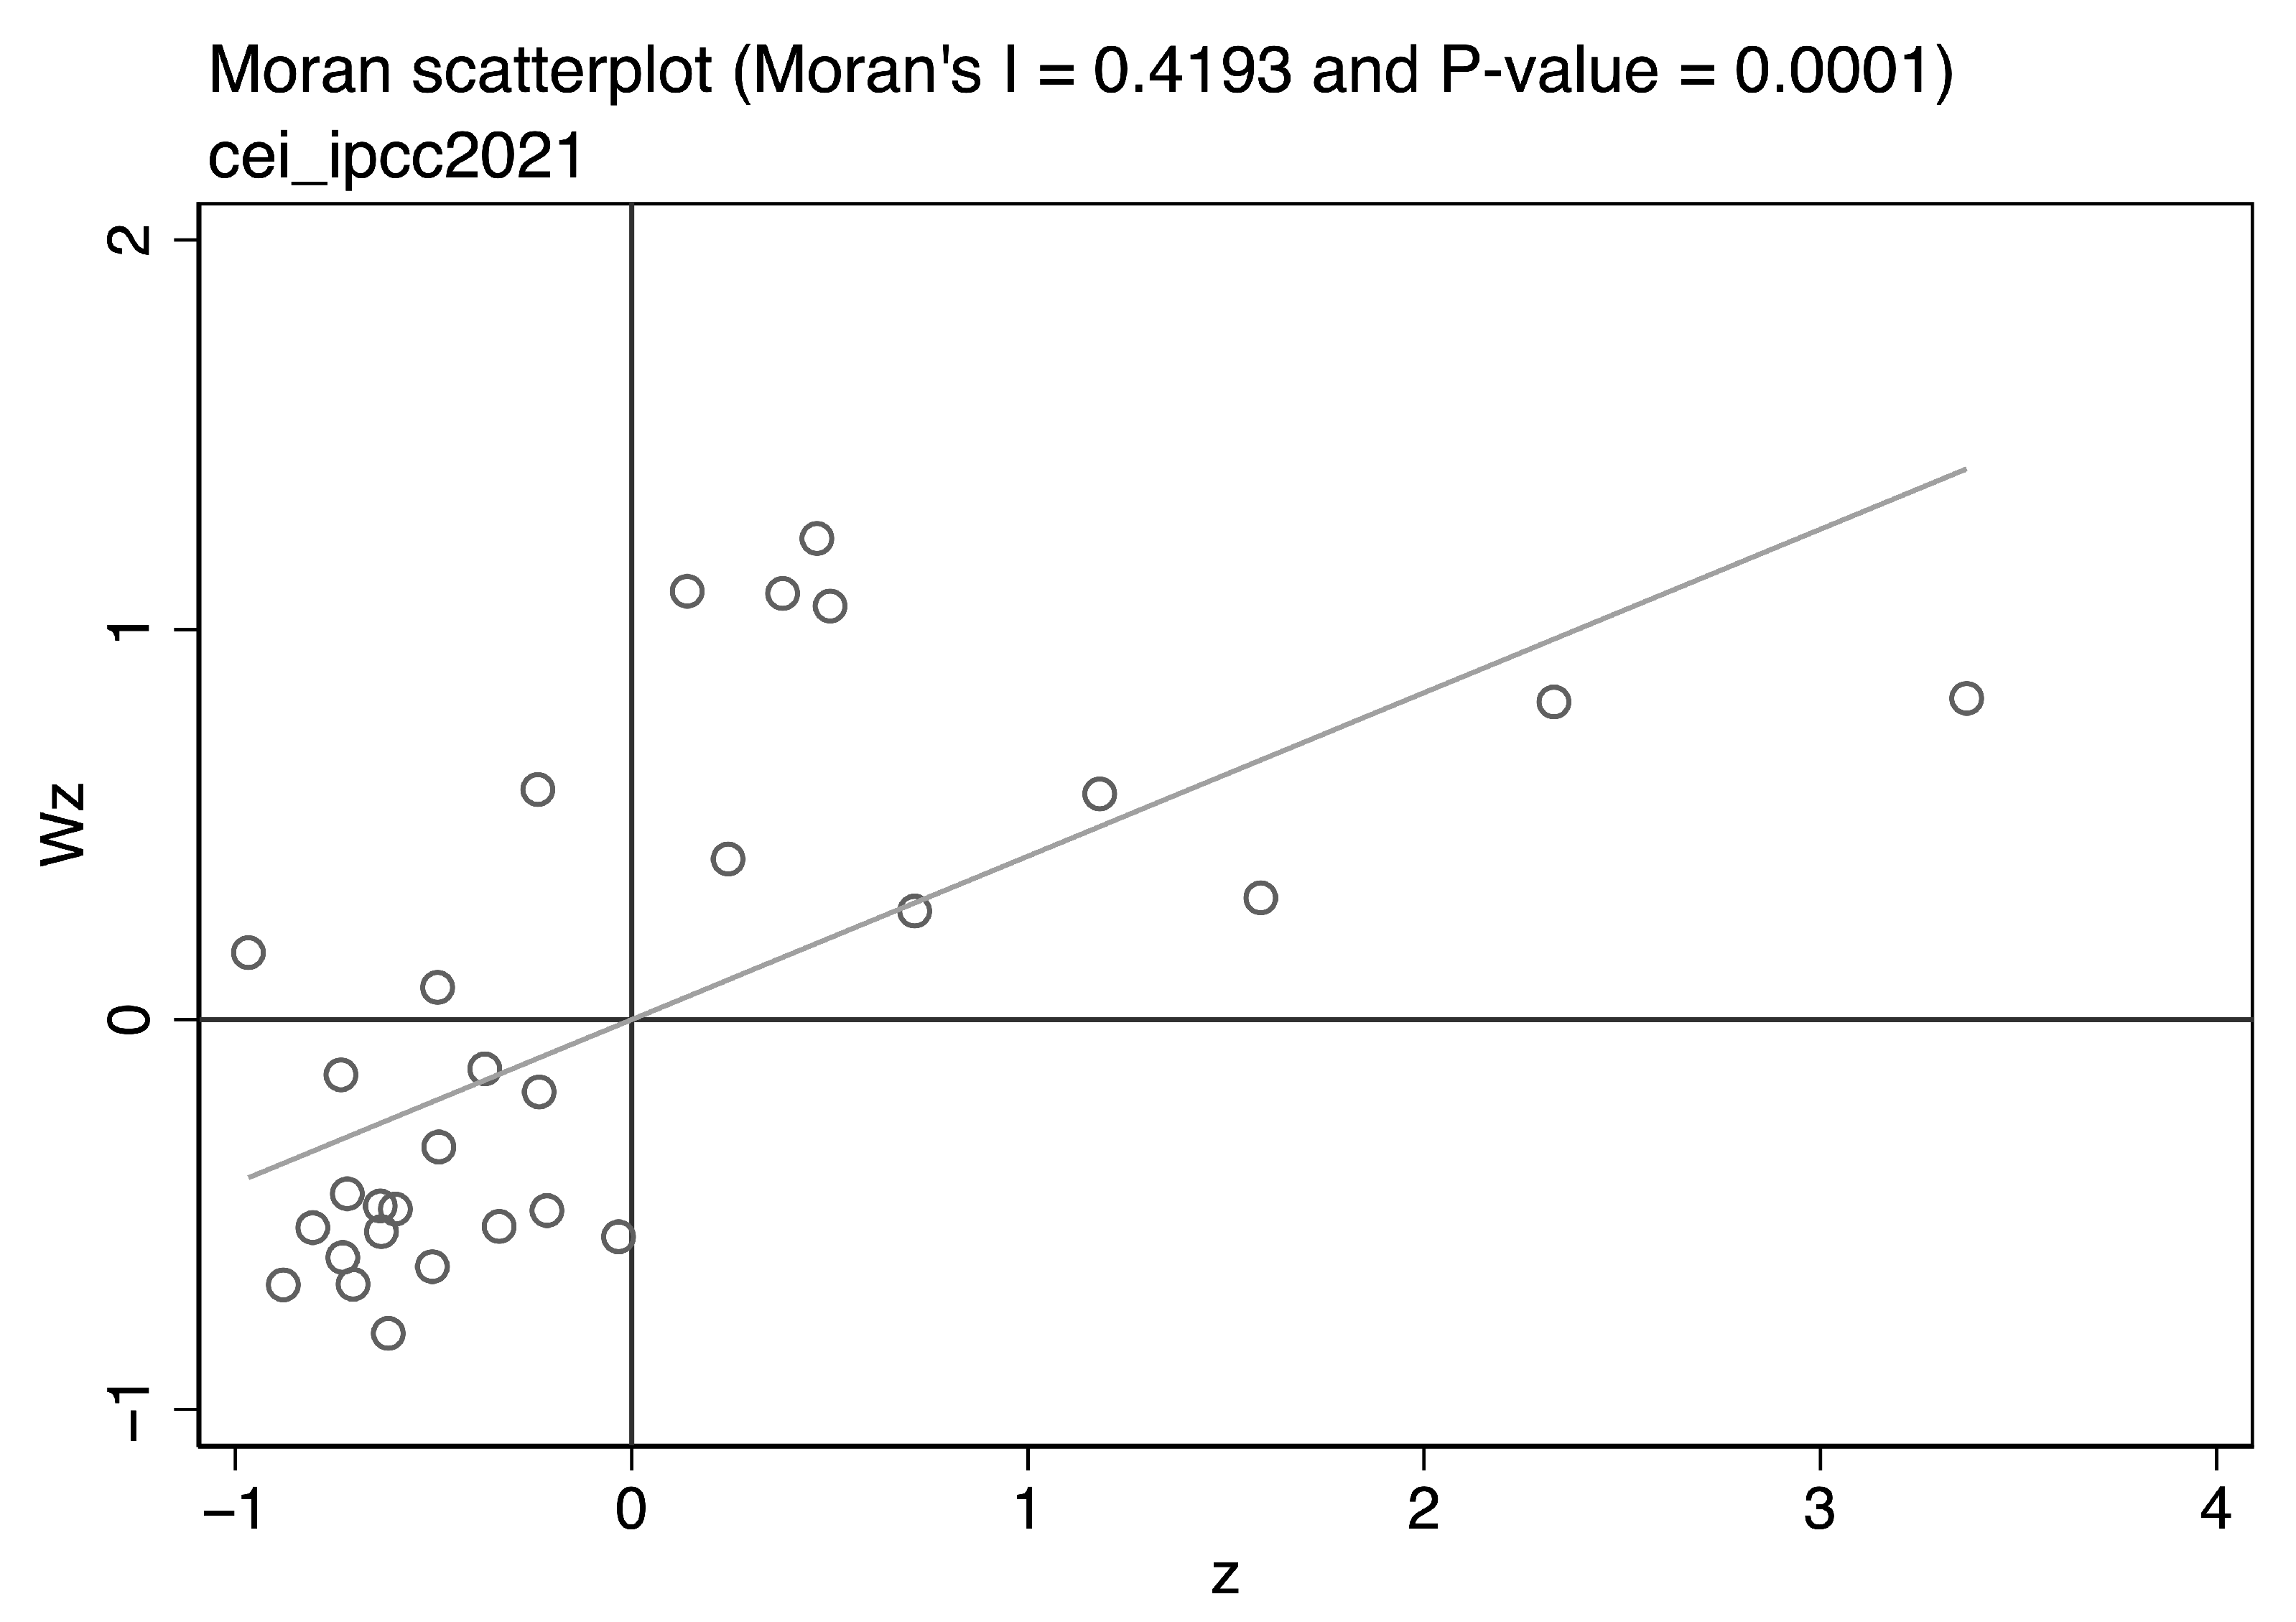
Figure A6.
Moran’s Index scatterplot of using provincial neighbor matrix weight () in selected years (2005, 2010, 2015, 2020, 2022). Note: The diagonal fitted line indicates the spatial association between provincial CEI and its spatial lag.
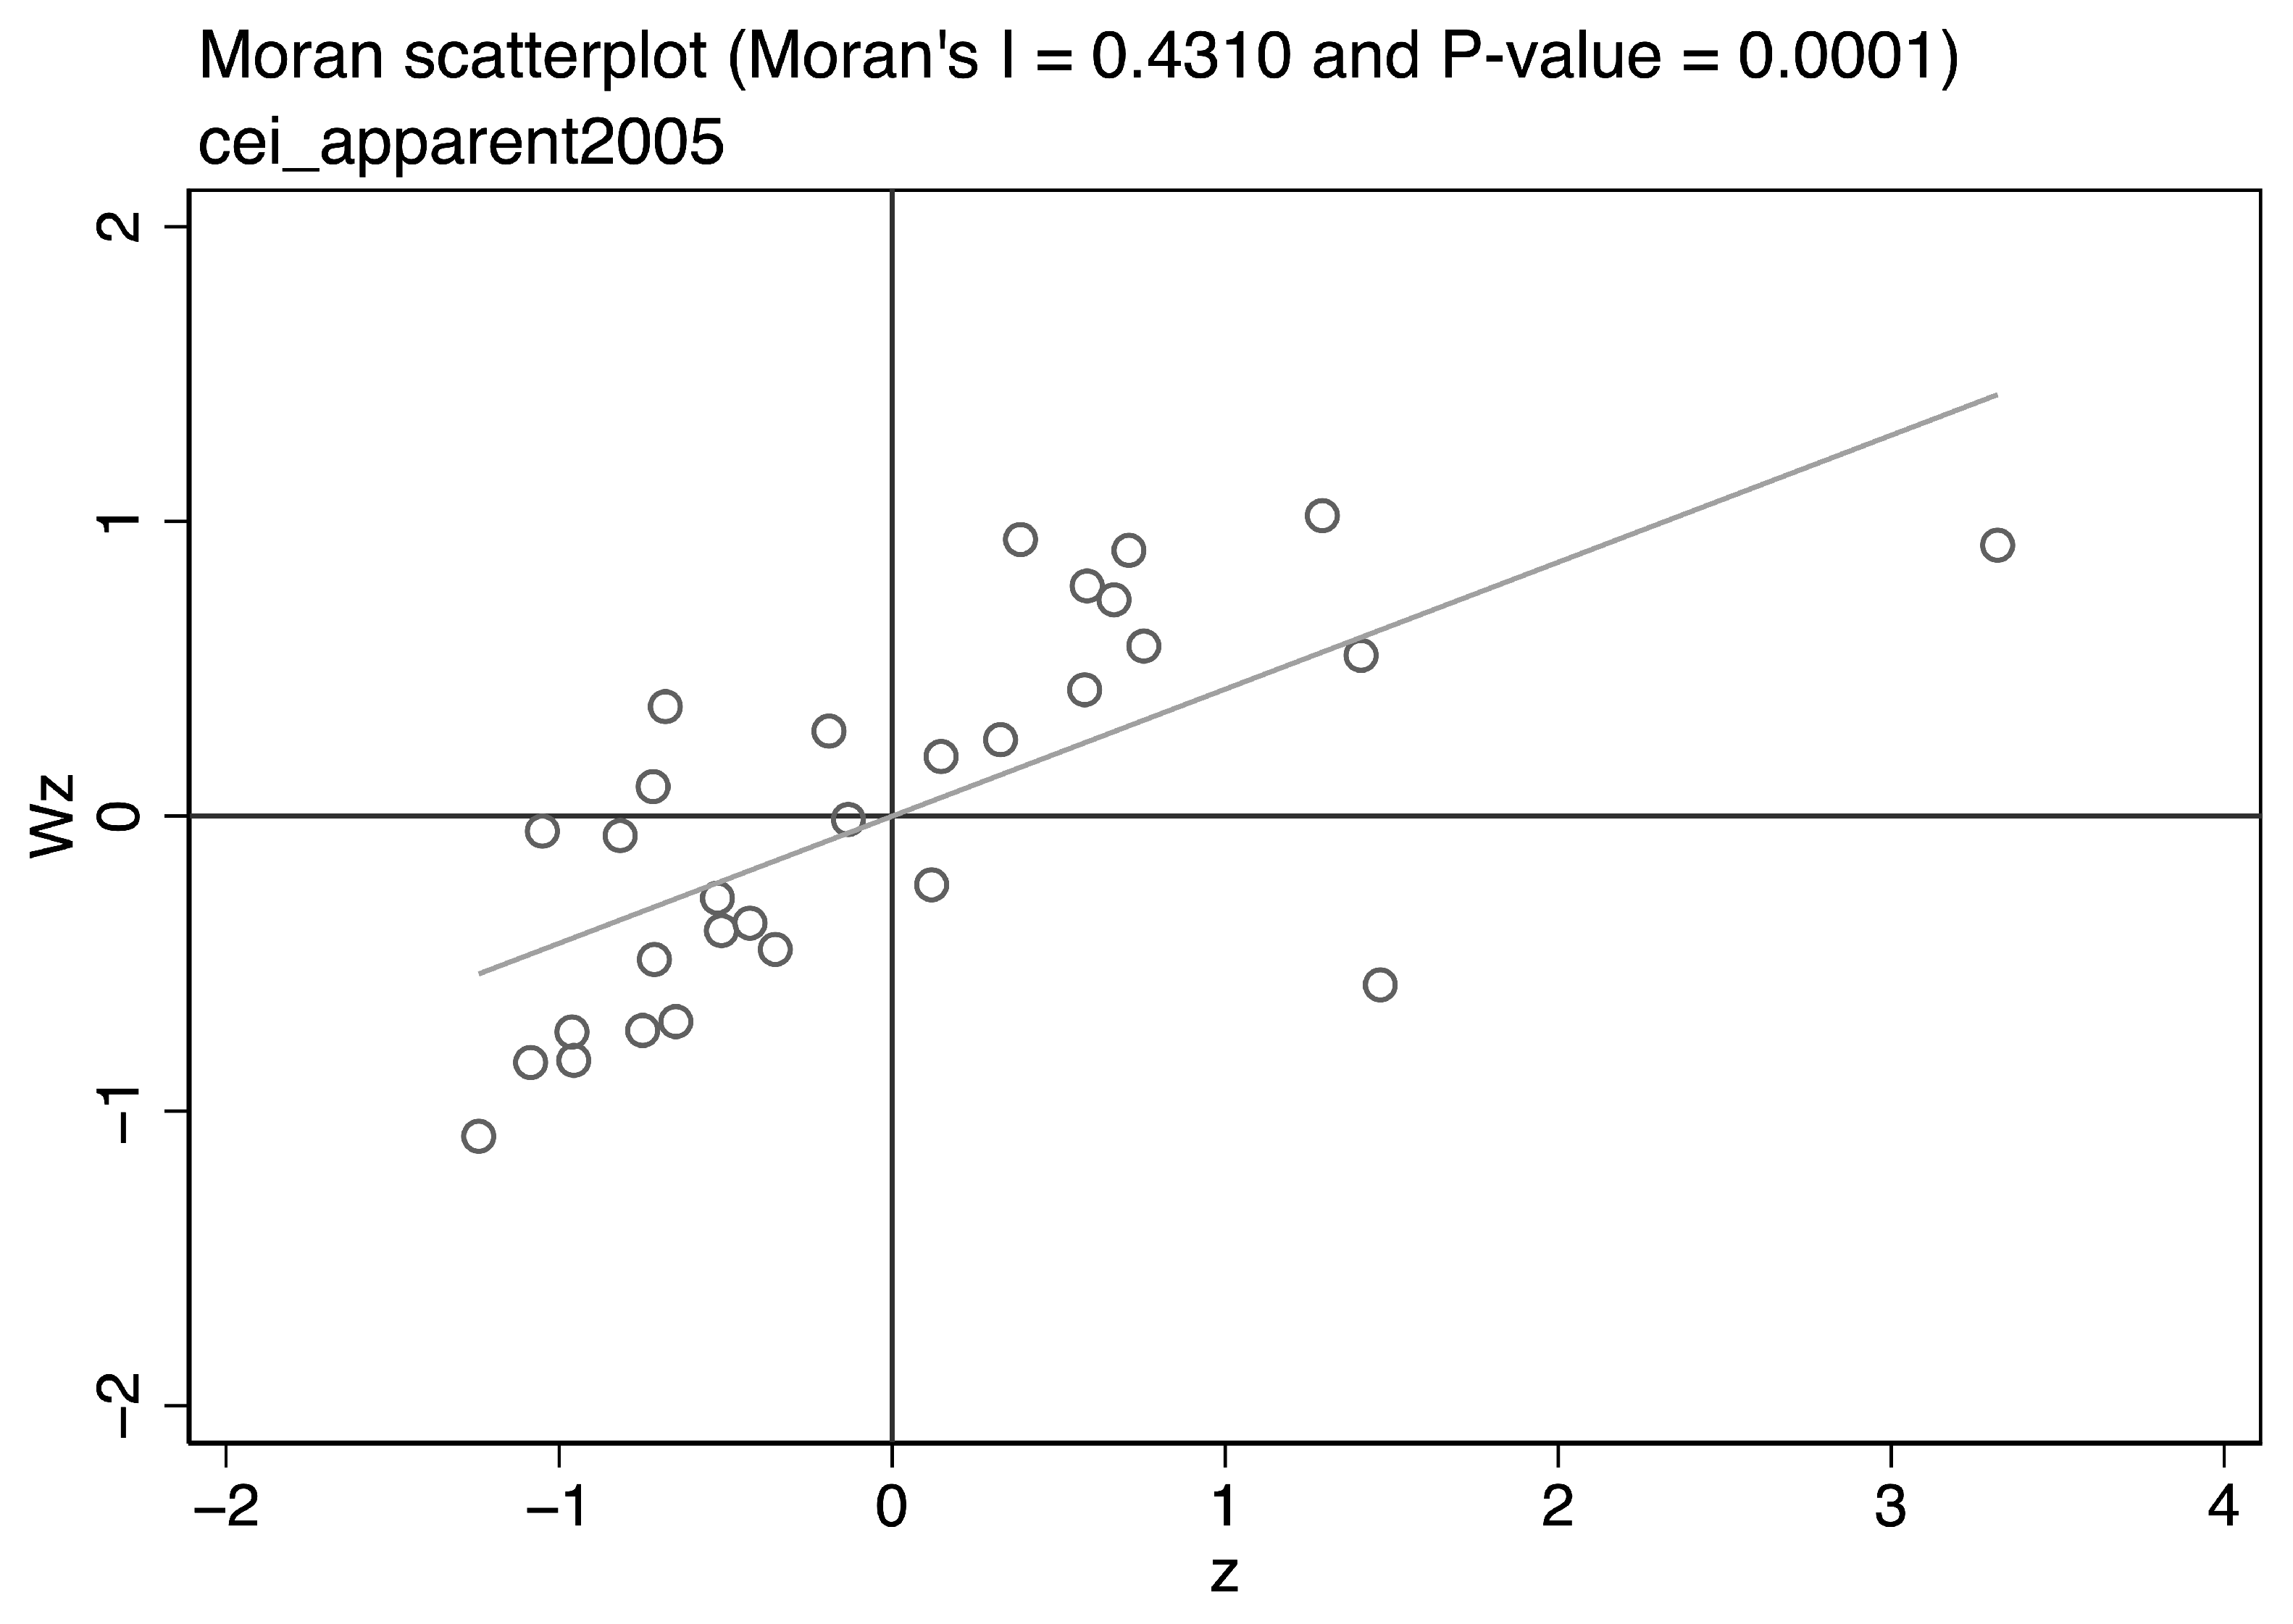
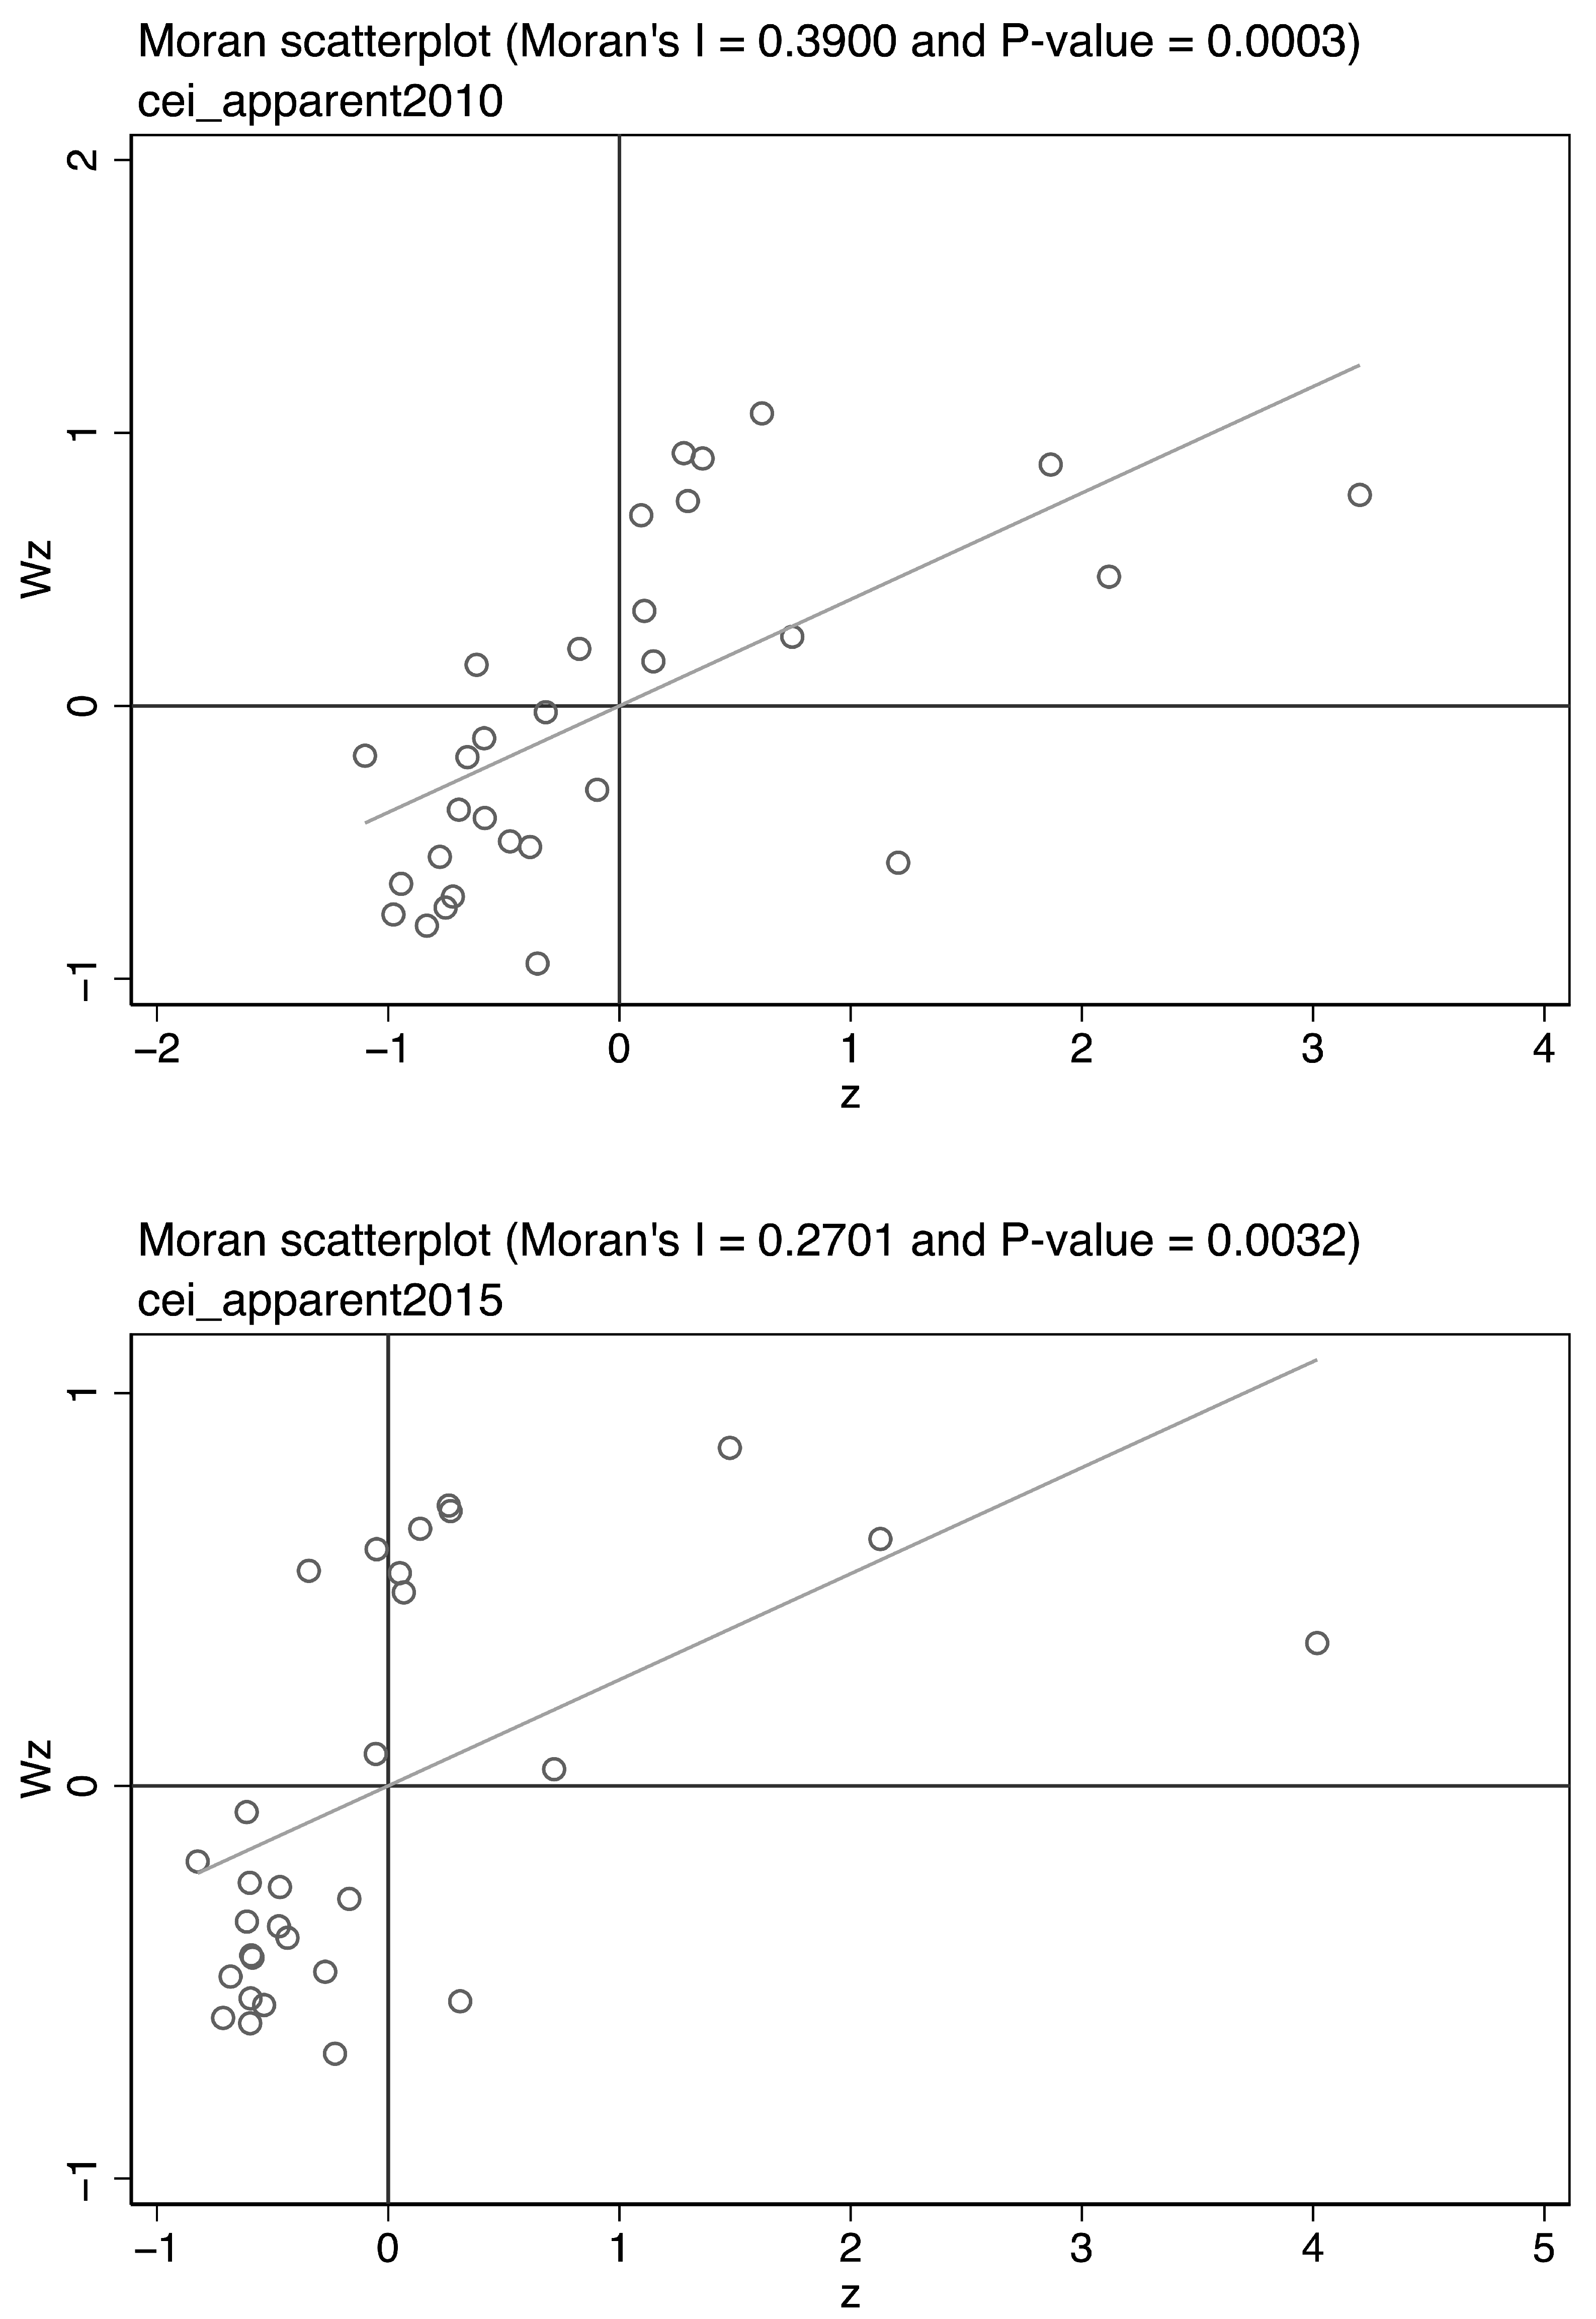
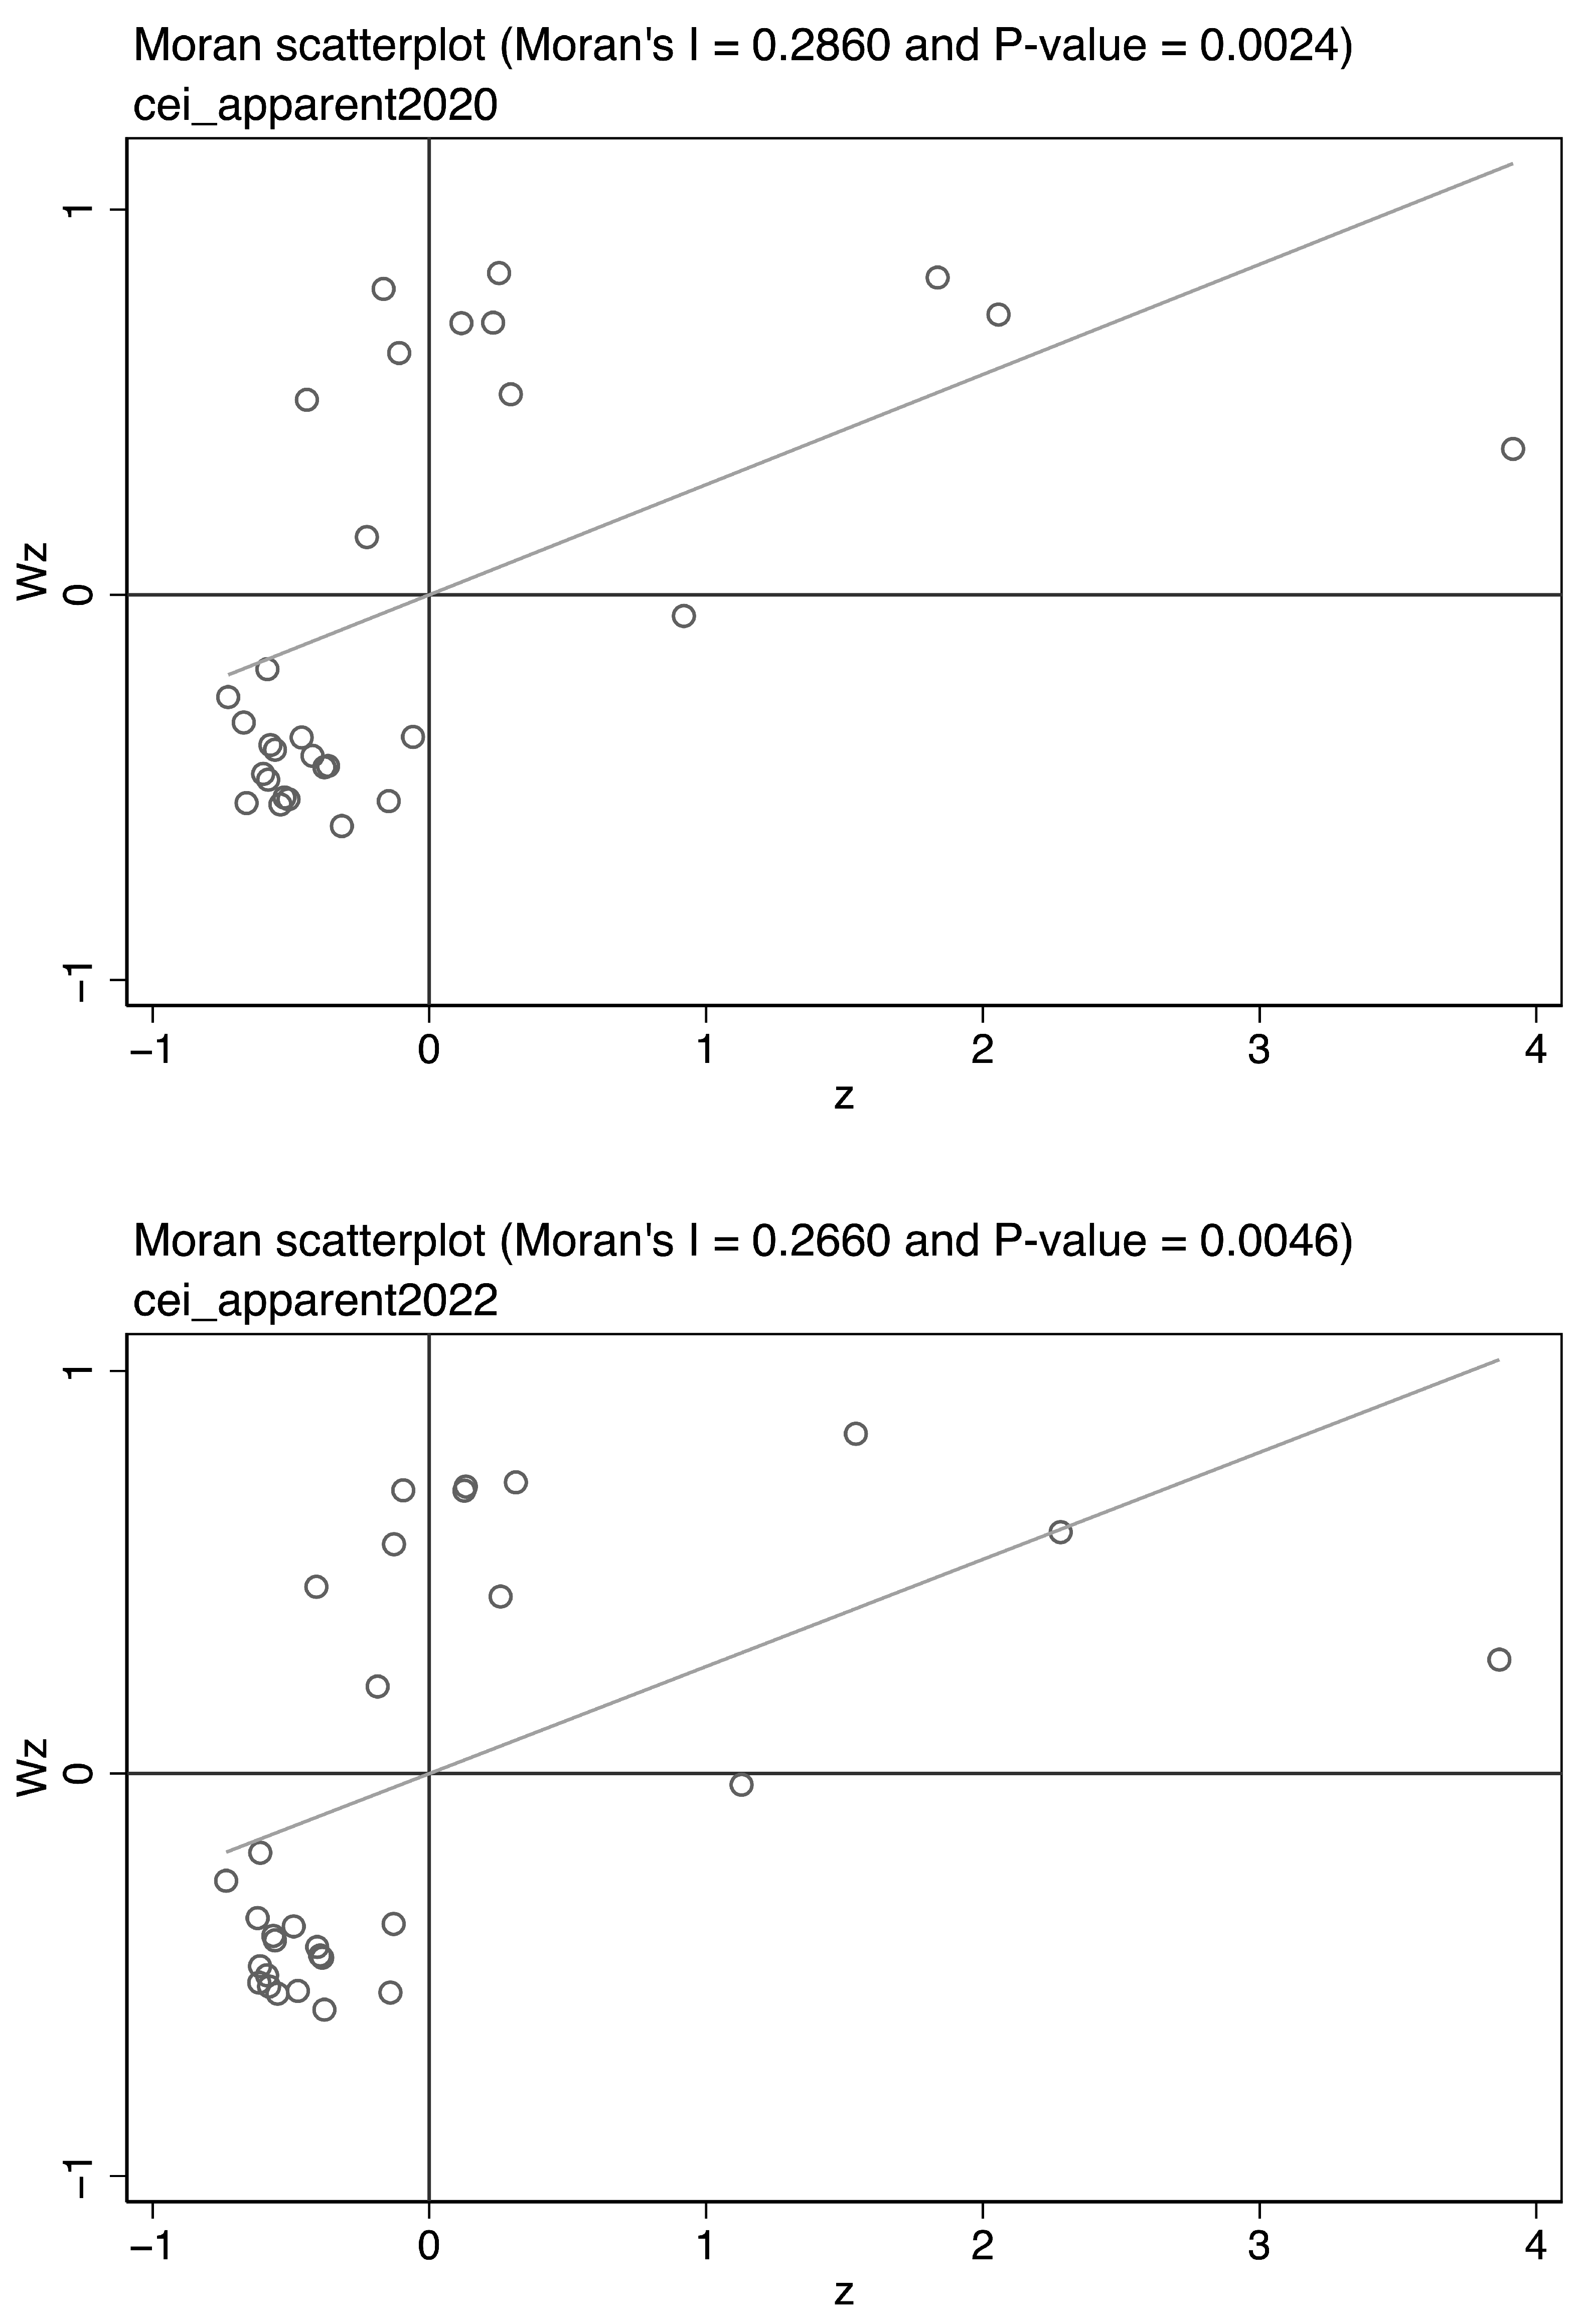
Appendix C. Supplementary Model Construction: OLS
To establish a baseline relationship between REG and CEI, this study first estimates a conventional panel data model using ordinary least squares (OLS) [3,4]. The OLS model serves as a benchmark specification that captures the average effect of REG while controlling for key socio-economic variables and unobserved heterogeneity through fixed effects. The inclusion of province and year fixed effects helps control for time-invariant regional characteristics and common shocks over time, respectively, thereby mitigating omitted variable bias. This specification provides an initial assessment of the direction and significance of the relationship between REG and CEI.
where additional control variables, including foreign direct investment (), technological innovation (), and forest coverage (), are not incorporated in the baseline model due to substantial missing observations in certain years. Instead, these variables are gradually introduced in the robustness checks to examine the sensitivity of the results.
Appendix D. Supplementary Empirical Analysis
Appendix D.1. Spatial Econometric Model Selection
Table A1.
Test results of spatial econometric model selection using .
Table A2.
Test results of spatial econometric model selection using .
Appendix D.2. OLS Benchmark Results
Table A3.
OLS baseline results.
Appendix D.3. Robustness Checks
Appendix D.3.1. SDM: Changing Sample Period
Table A4.
SDM robustness check: using sample period from 2005 to 2023 ().
Table A5.
SDM robustness check: using sample period from 2005 to 2019 ().
Appendix D.3.2. SDM: Changing Measurements of Y
Table A6.
SDM robustness check: using as Y ().
Table A7.
SDM robustness check: using as Y ().
Appendix D.3.3. SDM: Changing Fixed Effect
Table A8.
SDM robustness check: adding region × year fixed effect ().
Appendix D.3.4. SDM: Changing Spatial Matrix
Table A9.
SDM robustness check: changing spatial matrix using .
Table A10.
SDM robustness check: changing spatial matrix using .
Appendix D.3.5. SDM: Changing Regression Model
Table A11.
SDM robustness check: using dynamic SDM ().
Appendix D.3.6. OLS: Adding Control Variables
Table A12.
OLS robustness check: adding more control variables.
References
- Liu, X.; Wang, W.; Wu, W.; Zhang, M. Using cooperative game model of air pollution governance to study the cost sharing in Yangtze River Delta region. J. Environ. Manag. 2022, 301, 113896. [Google Scholar] [CrossRef] [Scilit] [PubMed]
- Zheng, H.; Song, M.; Shen, Z. The evolution of renewable energy and its impact on carbon reduction in China. Energy 2021, 237, 121639. [Google Scholar] [CrossRef] [Scilit]
- Liu, X.; Niu, Q.; Dong, S.; Zhang, M. How does renewable energy consumption affect carbon emission intensity? Temporal-spatial impact analysis in China. Energy 2023, 284, 128690. [Google Scholar] [CrossRef] [Scilit]
- Wang, Y.; Liao, M.; Xu, L.; Malik, A. The impact of foreign direct investment on China’s carbon emissions through energy intensity and emissions trading system. Energy Econ. 2021, 97, 105212. [Google Scholar]
- Zhang, M.; Ge, Y.; Liu, L.; Zhou, D. Impacts of carbon emission trading schemes on the development of renewable energy in China: Spatial spillover and mediation paths. Sustain. Prod. Consum. 2022, 32, 306–317. [Google Scholar] [CrossRef] [Scilit]
- Guo, X.; Shi, R.; Ren, D. Reduce carbon emissions efficiently: The influencing factors and decoupling relationships of carbon emission from high-energy consumption and high-emission industries in China. Energy Environ. 2024, 35, 1416–1433. [Google Scholar]
- Zhang, Y.-J.; Da, Y.-B. The decomposition of energy-related carbon emission and its decoupling with economic growth in China. Renew. Sustain. Energy Rev. 2015, 41, 1255–1266. [Google Scholar] [CrossRef] [Scilit]
- Xiao, H.; Ma, Z.; Zhang, P.; Liu, M. Study of the impact of energy consumption structure on carbon emission intensity in China from the perspective of spatial effects. Nat. Hazards 2019, 99, 1365–1380. [Google Scholar]
- Yu, S.; Zheng, S.; Li, X. The achievement of the carbon emissions peak in China: The role of energy consumption structure optimization. Energy Econ. 2018, 74, 693–707. [Google Scholar] [CrossRef] [Scilit]
- Altın, H. The impact of energy efficiency and renewable energy consumption on carbon emissions in G7 countries. Int. J. Sustain. Eng. 2024, 17, 134–142. [Google Scholar] [CrossRef] [Scilit]
- Chen, Y.; Kong, X.; Wen, X.; Wang, D.; Zhou, H. Analysis of the spatial spillover effect of electricity generation from renewable energy on carbon emissions: Based on empirical evidence from Chinese provinces and cities. J. Environ. Plan. Manag. 2025, 68, 1449–1471. [Google Scholar]
- Mirziyoyeva, Z.; Salahodjaev, R. Renewable energy and CO2 emissions intensity in the top carbon intense countries. Renew. Energy 2022, 192, 507–512. [Google Scholar] [CrossRef] [Scilit]
- Zafar, M.W.; Zaidi, S.A.H.; Sinha, A.; Gedikli, A.; Hou, F. The role of stock market and banking sector development, and renewable energy consumption in carbon emissions: Insights from G-7 and N-11 countries. Resour. Policy 2019, 62, 427–436. [Google Scholar] [CrossRef] [Scilit]
- Rasoulinezhad, E.; Saboori, B. Panel estimation for renewable and non-renewable energy consumption, economic growth, CO2 emissions, the composite trade intensity, and financial openness of the commonwealth of independent states. Environ. Sci. Pollut. Res. 2018, 25, 17354–17370. [Google Scholar] [CrossRef] [Scilit] [PubMed]
- Zhao, Y.; Tang, K.K.; Wang, L.-l. Do renewable electricity policies promote renewable electricity generation? Evidence from panel data. Energy Policy 2013, 62, 887–897. [Google Scholar] [CrossRef] [Scilit]
- Wang, H.; Jiang, L.; Duan, H.; Wang, Y. The impact of green finance development on China’s energy structure optimization. Discret. Dyn. Nat. Soc. 2021, 2021, 2633021. [Google Scholar] [CrossRef] [Scilit]
- Ge, T.; Ding, Z.; Lu, X.; Yang, K. Spillover effect of energy intensity targets on renewable energy consumption in China: A spatial econometric approach. Renew. Energy 2023, 217, 119174. [Google Scholar] [CrossRef] [Scilit]
- Xu, W.; Ghaffar, A.; Ch, I. Natural resource dependency and renewable energy consumption in China: A U-shaped nexus with dynamic policy effects using quantile regression for panel data. Energy Strategy Rev. 2026, 64, 102118. [Google Scholar] [CrossRef] [Scilit]
- Fang, Y. Economic welfare impacts from renewable energy consumption: The China experience. Renew. Sustain. Energy Rev. 2011, 15, 5120–5128. [Google Scholar] [CrossRef] [Scilit]
- Inglesi-Lotz, R. The impact of renewable energy consumption to economic growth: A panel data application. Energy Econ. 2016, 53, 58–63. [Google Scholar] [CrossRef] [Scilit]
- Zhou, X.; Zhang, J.; Li, J. Industrial structural transformation and carbon dioxide emissions in China. Energy Policy 2013, 57, 43–51. [Google Scholar] [CrossRef] [Scilit]
- Zhang, W.; Xu, Y.; Wang, C.; Liu, G. Assessment of the driving factors of CO2 mitigation costs of household biogas systems in China: A LMDI decomposition with cost analysis model. Renew. Energy 2022, 181, 978–989. [Google Scholar] [CrossRef] [Scilit]
- Zhao, H.; Li, C.; Yang, Z.; Yang, J. How can new quality productivity decrease carbon emission intensity? Evidence from 30 provincial regions in China. Energy 2025, 327, 136487. [Google Scholar] [CrossRef] [Scilit]
- Cheng, G.; Shi, Y.; Zhou, H. Analysis of the effects of green technology innovation and industrial structure upgrading on carbon emission intensity. Int. Rev. Econ. Financ. 2025, 102, 104163. [Google Scholar] [CrossRef] [Scilit]
- Shahnazi, R.; Shabani, Z.D. The effects of renewable energy, spatial spillover of CO2 emissions and economic freedom on CO2 emissions in the EU. Renew. Energy 2021, 169, 293–307. [Google Scholar] [CrossRef] [Scilit]
- Sahin, H.; Esen, H. The usage of renewable energy sources and its effects on GHG emission intensity of electricity generation in Turkey. Renew. Energy 2022, 192, 859–869. [Google Scholar] [CrossRef] [Scilit]
- Ng, K.S.; Hernandez, E.M. A systematic framework for energetic, environmental and economic (3E) assessment and design of polygeneration systems. Chem. Eng. Res. Des. 2016, 106, 1–25. [Google Scholar] [CrossRef] [Scilit]
- Dong, K.; Sun, R.; Dong, X. CO2 emissions, natural gas and renewables, economic growth: Assessing the evidence from China. Sci. Total Environ. 2018, 640, 293–302. [Google Scholar] [CrossRef] [Scilit] [PubMed]
- Zhang, Z.; Kang, C. Challenges and prospects of building a new power system under the goal of carbon neutrality. Proc. CSEE 2022, 42, 2806–2819. [Google Scholar]
- Wang, Y.; Li, K.; Peng, L. Revesting the spatial spillover effects of renewable energy in curbing carbon emissions: Evidence from China. Energy Environ. 2024, 0958305X241296447. [Google Scholar] [CrossRef] [Scilit]
- Acemoglu, D.; Akcigit, U.; Hanley, D.; Kerr, W. Transition to clean technology. J. Political Econ. 2016, 124, 52–104. [Google Scholar] [CrossRef] [Scilit]
- Jankiewicz, M.; Szulc, E. Analysis of spatial effects in the relationship between CO2 emissions and renewable energy consumption in the context of economic growth. Energies 2021, 14, 5829. [Google Scholar] [CrossRef] [Scilit]
- Wu, L.; Sun, L.; Qi, P.; Ren, X. Energy endowment, industrial structure upgrading, and CO2 emissions in China: Revisiting resource curse in the context of carbon emissions. Resour. Policy 2021, 74, 102329. [Google Scholar] [CrossRef] [Scilit]
- Bai, J.; Li, S.; Kang, Q.; Wang, Y. Spatial spillover effects of renewable energy on carbon emissions in less-developed areas of China. Environ. Sci. Pollut. Res. 2022, 29, 19019–19032. [Google Scholar]
- Liu, X.; Yang, M.; Niu, Q.; Zhang, M. Cost accounting and sharing of air pollution collaborative emission reduction: A case study of Beijing-Tianjin-Hebei region in China. Urban Clim. 2022, 43, 101166. [Google Scholar] [CrossRef] [Scilit]
- Song, Y.; Liu, J.; Wei, Y.; Zhang, M. Study on the direct and indirect effectiveness of wind power policy: Empirical evidence from 30 provinces in China. Renew. Energy 2021, 170, 749–763. [Google Scholar] [CrossRef] [Scilit]
- Wu, H.; Xu, L.; Ren, S.; Hao, Y. How do energy consumption and environmental regulation affect carbon emissions in China? New evidence from a dynamic threshold panel model. Resour. Policy 2020, 67, 101678. [Google Scholar] [CrossRef] [Scilit]
- Shahzad, K.; Raza, H.A.; Shahbaz, M. Environmental regulations’ impact on clean energy consumption: Under the assistance of governance measures. Renew. Energy 2024, 237, 121766. [Google Scholar] [CrossRef] [Scilit]
- Rahman, M.M.; Sultana, N.; Velayutham, E. Renewable energy, energy intensity and carbon reduction: Experience of large emerging economies. Renew. Energy 2022, 184, 252–265. [Google Scholar] [CrossRef] [Scilit]
- Liu, X.; Zhong, S.; Li, S.; Zhang, M. Evaluating the impact of central environmental protection inspection on air pollution: An empirical research in China. Process Saf. Environ. Prot. 2022, 160, 563–572. [Google Scholar] [CrossRef] [Scilit]
- Song, Y.; Zhang, X.; Zhang, M. The influence of environmental regulation on industrial structure upgrading: Based on the strategic interaction behavior of environmental regulation among local governments. Technol. Forecast. Soc. Chang. 2021, 170, 120930. [Google Scholar] [CrossRef] [Scilit]
- Zhang, M.; Liu, X.; Ding, Y. Assessing the influence of urban transportation infrastructure construction on haze pollution in China: A case study of Beijing-Tianjin-Hebei region. Environ. Impact Assess. Rev. 2021, 87, 106547. [Google Scholar]
- Zhao, J.; Jiang, Q.; Dong, X.; Dong, K. How does industrial structure adjustment reduce CO2 emissions? Spatial and mediation effects analysis for China. Energy Econ. 2022, 105, 105704. [Google Scholar] [CrossRef] [Scilit]
- Zhu, Q.; Chen, X.; Song, M.; Yang, J. Impacts of renewable electricity standard and Renewable Energy Certificates on renewable energy investments and carbon emissions. J. Environ. Manag. 2022, 306, 114495. [Google Scholar] [CrossRef] [Scilit] [PubMed]
- Zhang, F.; Deng, X.; Phillips, F.; Fang, C.; Wang, C. Impacts of industrial structure and technical progress on carbon emission intensity: Evidence from 281 cities in China. Technol. Forecast. Soc. Chang. 2020, 154, 119949. [Google Scholar] [CrossRef] [Scilit]
- Wang, J.; Dong, X.; Dong, K. How does ICT agglomeration affect carbon emissions? The case of Yangtze River Delta urban agglomeration in China. Energy Econ. 2022, 111, 106107. [Google Scholar] [CrossRef] [Scilit]
- Yu, Y.; Deng, Y.-R.; Chen, F.-F. Impact of population aging and industrial structure on CO2 emissions and emissions trend prediction in China. Atmos. Pollut. Res. 2018, 9, 446–454. [Google Scholar] [CrossRef] [Scilit]
- Zhang, M.; Liu, X.; Ding, Y.; Wang, W. How does environmental regulation affect haze pollution governance?—An empirical test based on Chinese provincial panel data. Sci. Total Environ. 2019, 695, 133905. [Google Scholar] [CrossRef] [Scilit] [PubMed]
- Zhang, M.; Liu, X.; Sun, X.; Wang, W. The influence of multiple environmental regulations on haze pollution: Evidence from China. Atmos. Pollut. Res. 2020, 11, 170–179. [Google Scholar] [CrossRef] [Scilit]
- Zhao, X.; Wang, W.; Xie, P.; Zhang, M. Construction and Application of a Decoupling Model for Sustainable Development and Carbon Emissions. Resour. Sci. 2024, 46, 2194–2209. [Google Scholar] [CrossRef] [Scilit]
- Weng, C.; Huang, J.; Greenwood-Nimmo, M. The effect of clean energy investment on CO2 emissions: Insights from a Spatial Durbin Model. Energy Econ. 2023, 126, 107000. [Google Scholar] [CrossRef] [Scilit]
- Qiu, X.; Jin, X.; Huang, S.; Ge, F. Market-incentive environmental regulation and total factor energy efficiency: Evidence from China’s energy-consuming right trading pilot. Humanit. Soc. Sci. Commun. 2025, 12, 1926. [Google Scholar] [CrossRef] [Scilit]
- Yang, Y.; Zhou, Y.; Poon, J.; He, Z. China’s carbon dioxide emission and driving factors: A spatial analysis. J. Clean. Prod. 2019, 211, 640–651. [Google Scholar] [CrossRef] [Scilit]
- Wooldridge, J.M. Econometric Analysis of Cross Section and Panel Data; MIT Press: Cambridge, MA, USA, 2010. [Google Scholar]
- Wang, Y.; Bellemare, M.F. Lagged Variables as Instruments; Working Paper; Department of Applied Economics, University of Minnesota: St. Paul, MN, USA, 2019. [Google Scholar]
- Angrist, J.D.; Pischke, J.-S. Mostly Harmless Econometrics: An Empiricist’s Companion; Princeton University Press: Princeton, NJ, USA, 2009. [Google Scholar]
- Hou, J.; Yang, S.; Fan, G.; Guo, R. The impact of energy consumption on carbon emissions intensity in China: Evidence from a dynamic panel quantile regression model. Int. J. Low.-Carbon Technol. 2024, 19, 268–288. [Google Scholar] [CrossRef] [Scilit]
- Novan, K. Valuing the wind: Renewable energy policies and air pollution avoided. Am. Econ. J. Econ. Policy 2015, 7, 291–326. [Google Scholar] [CrossRef] [Scilit]
- Fell, H.; Kaffine, D.T.; Novan, K. Emissions, transmission, and the environmental value of renewable energy. Am. Econ. J. Econ. Policy 2021, 13, 241–272. [Google Scholar] [CrossRef] [Scilit]
- Huang, X.; Deng, Z.; Jin, N.; Zhang, H. Provincial CO2 emission peak and drivers in China based on near-real-time data. Adv. Appl. Energy 2025, 21, 100260. [Google Scholar]
- Shan, Y.; Liu, J.; Liu, Z.; Xu, X.; Shao, S.; Wang, P.; Guan, D. New provincial CO2 emission inventories in China based on apparent energy consumption data and updated emission factors. Appl. Energy 2016, 184, 742–750. [Google Scholar] [CrossRef] [Scilit]
- Shan, Y.; Guan, D.; Zheng, H.; Ou, J.; Li, Y.; Meng, J.; Mi, Z.; Liu, Z.; Zhang, Q. China CO2 emission accounts 1997–2015. Sci. Data 2018, 5, 170201. [Google Scholar] [CrossRef] [Scilit] [PubMed]
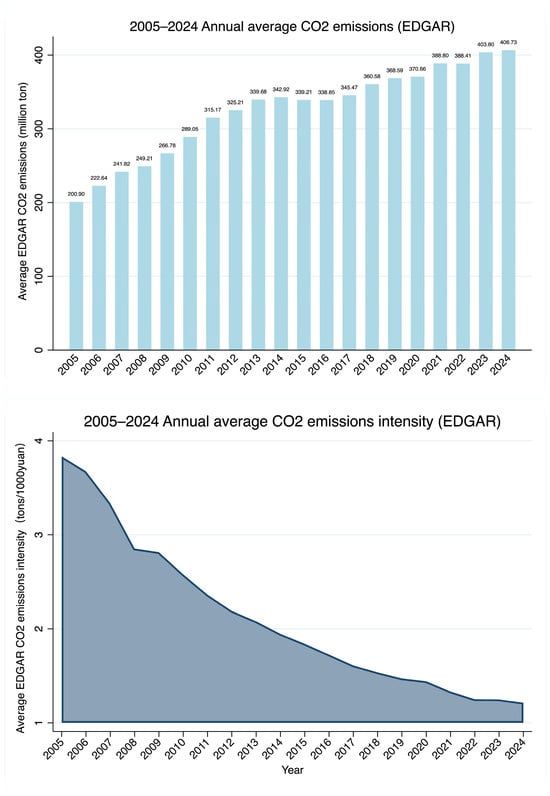
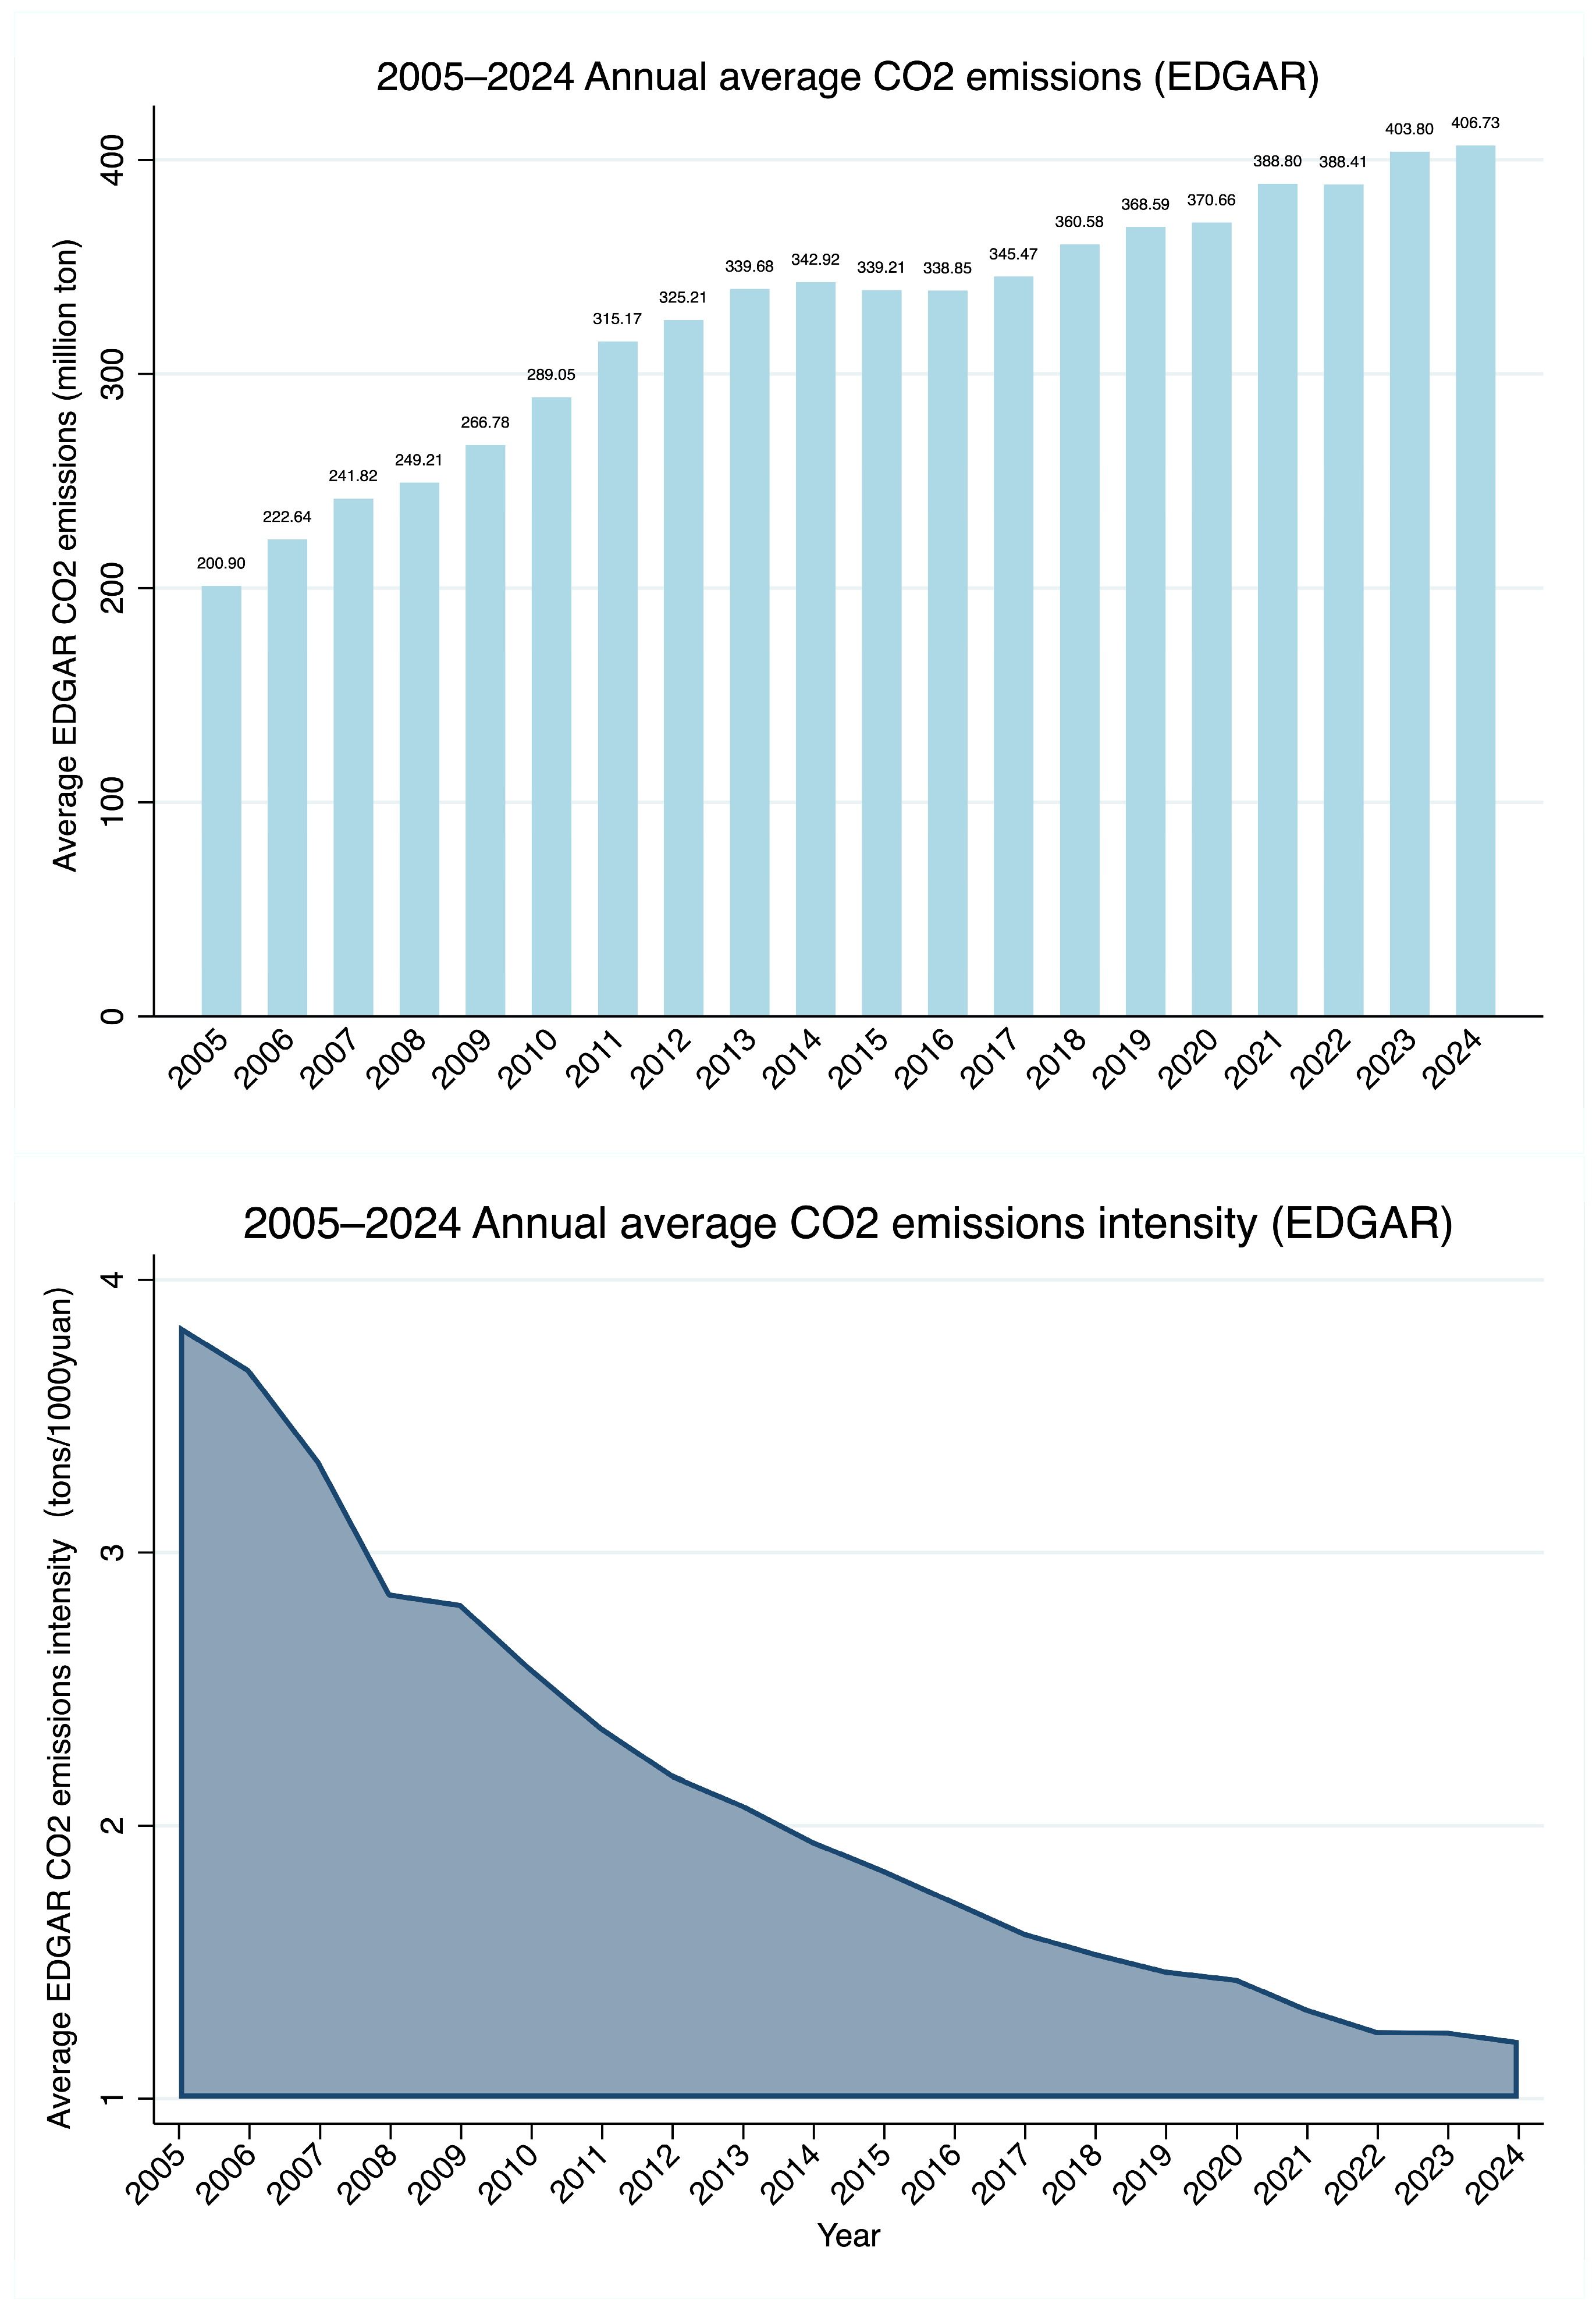
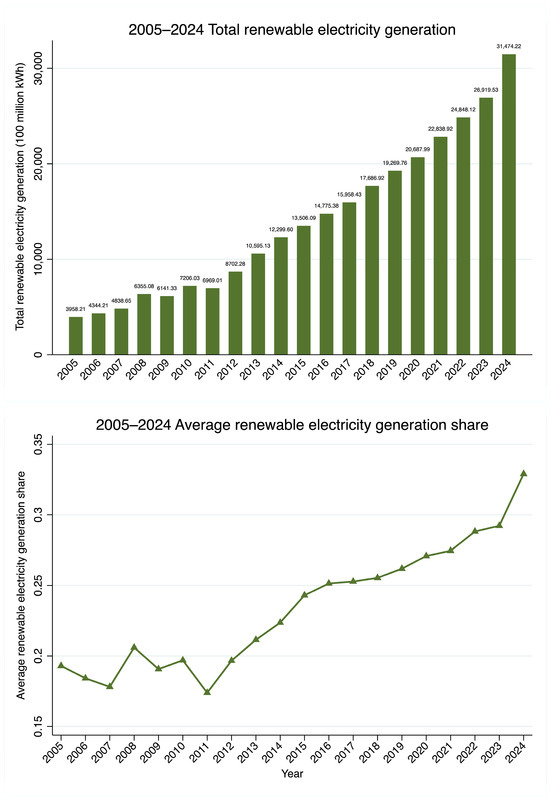
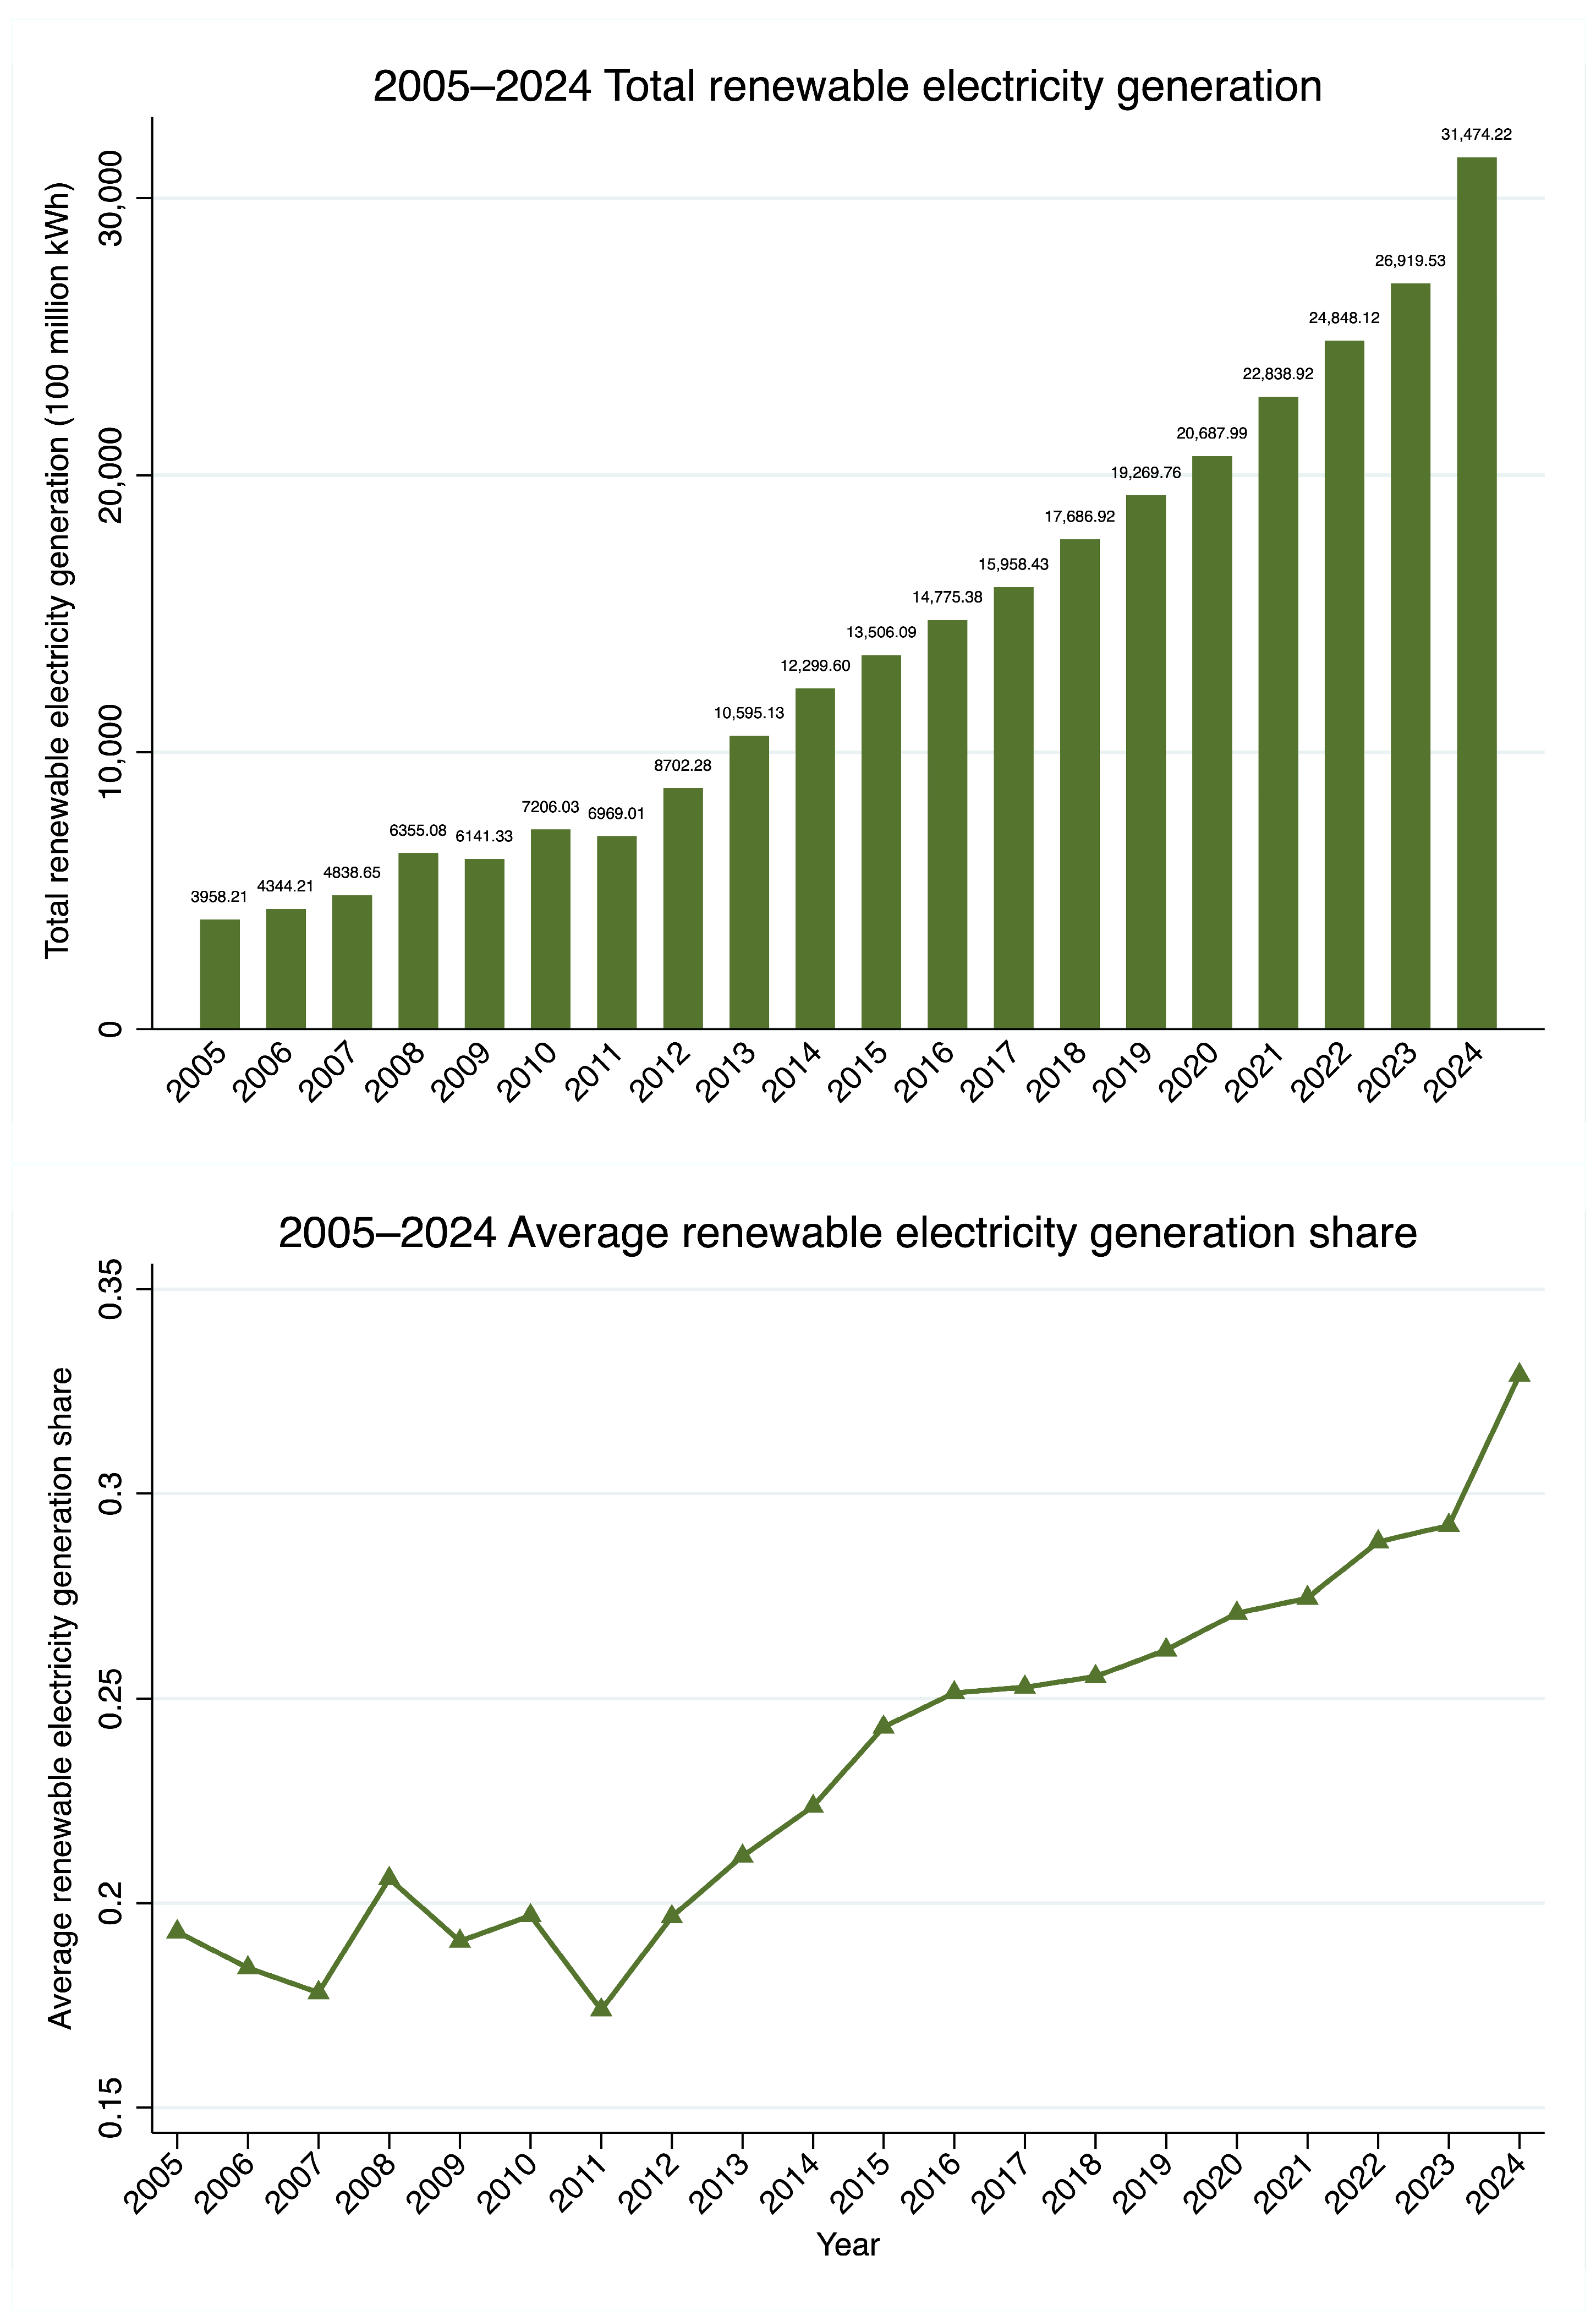
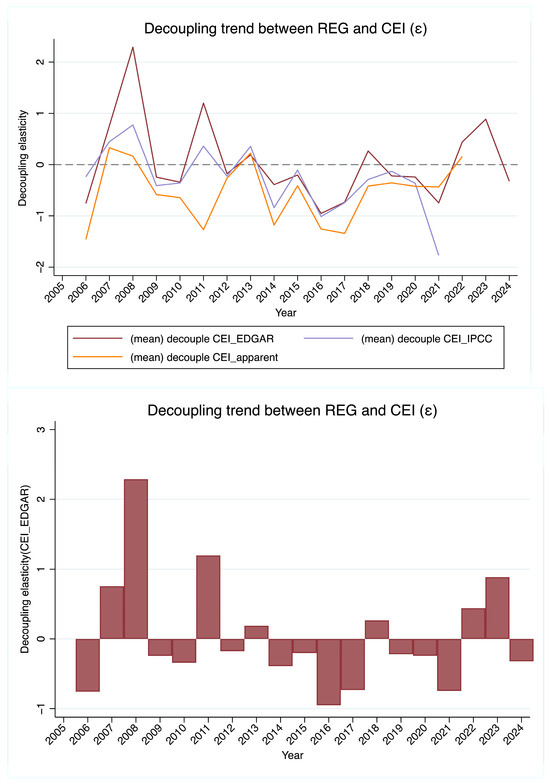
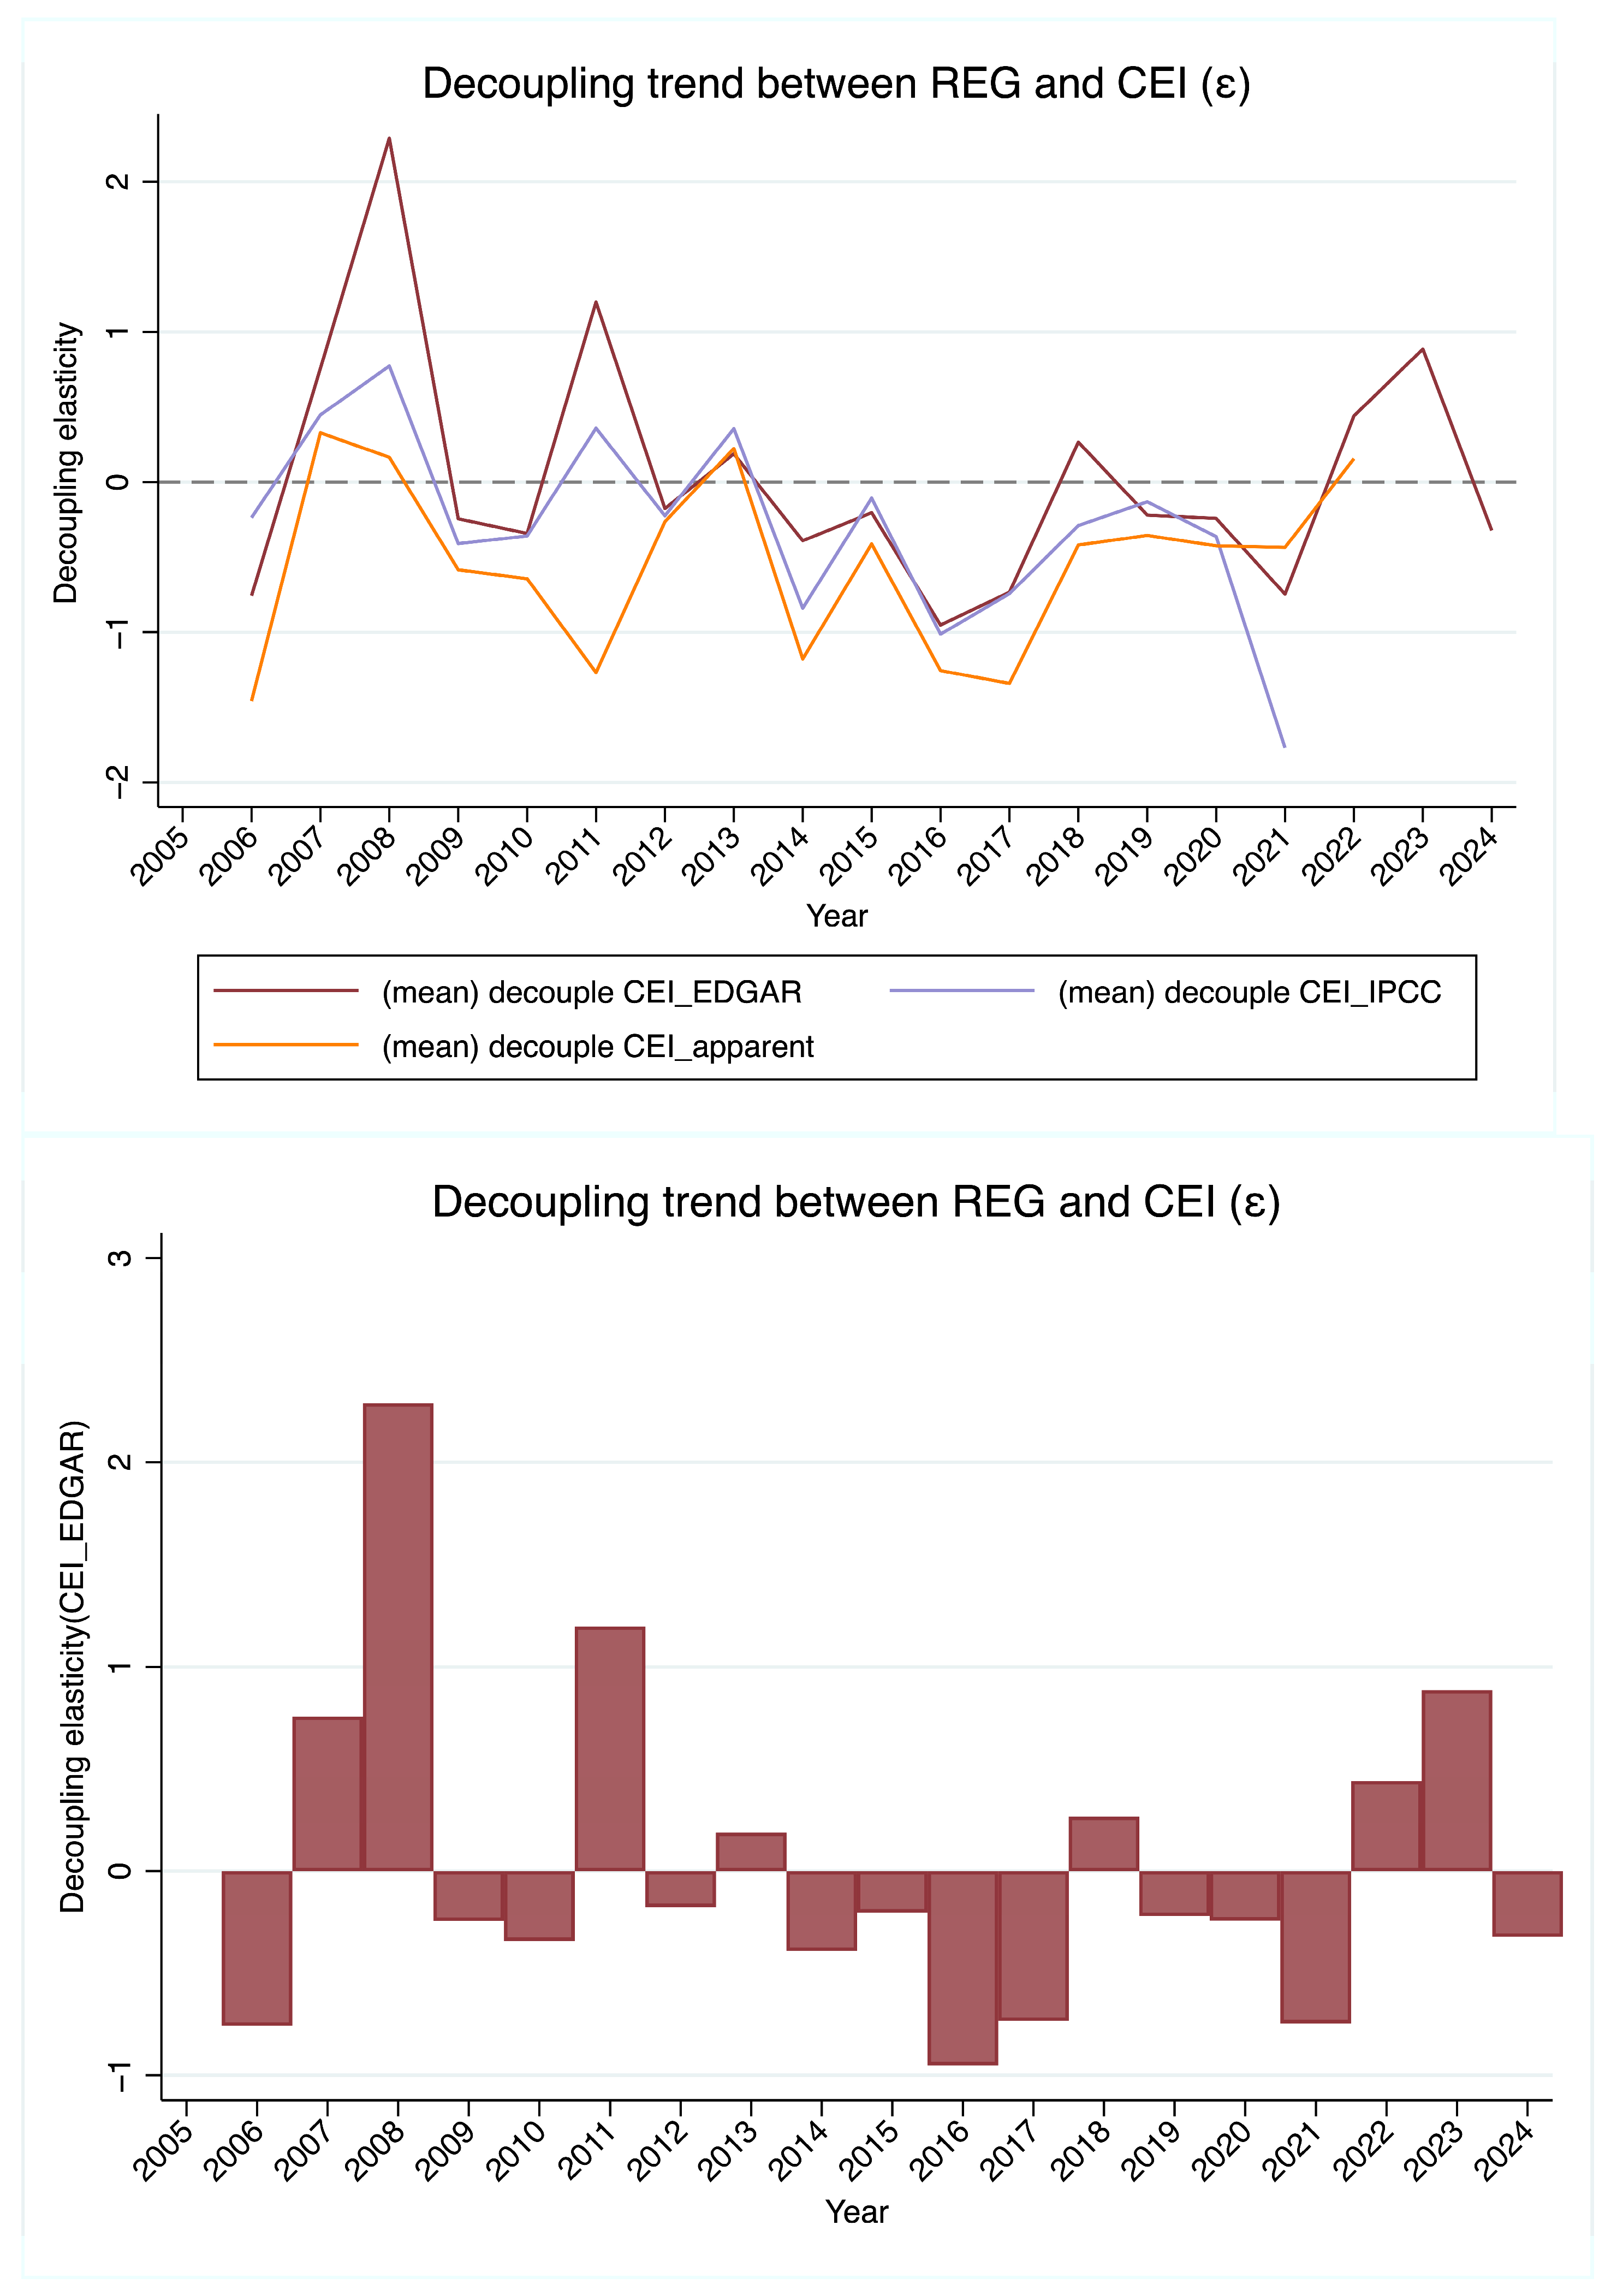
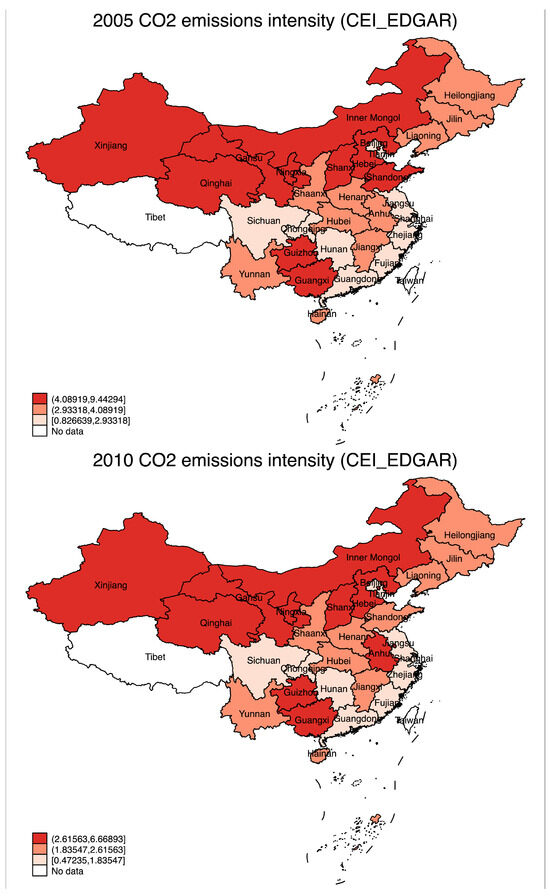
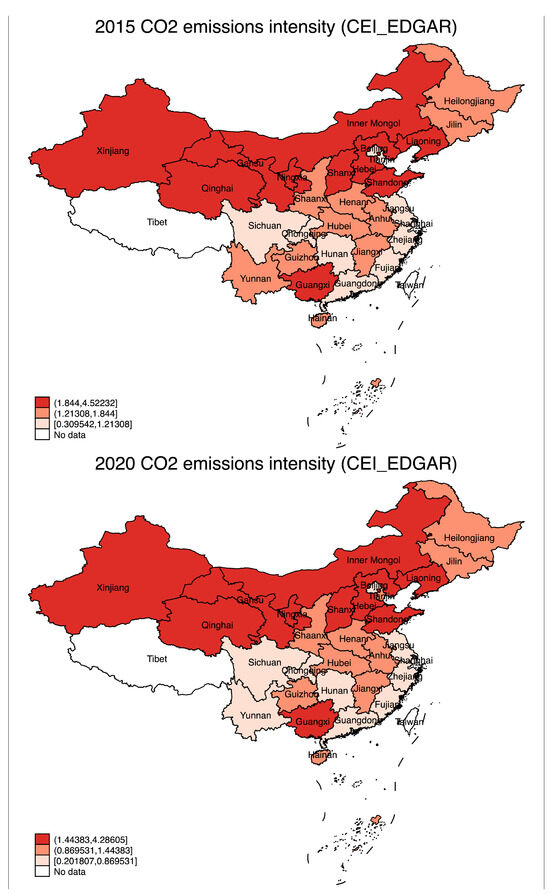
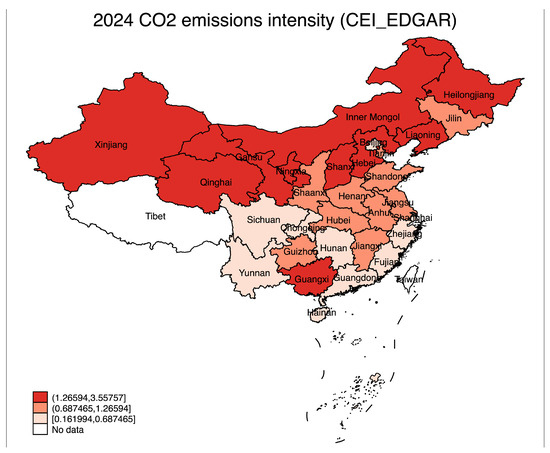
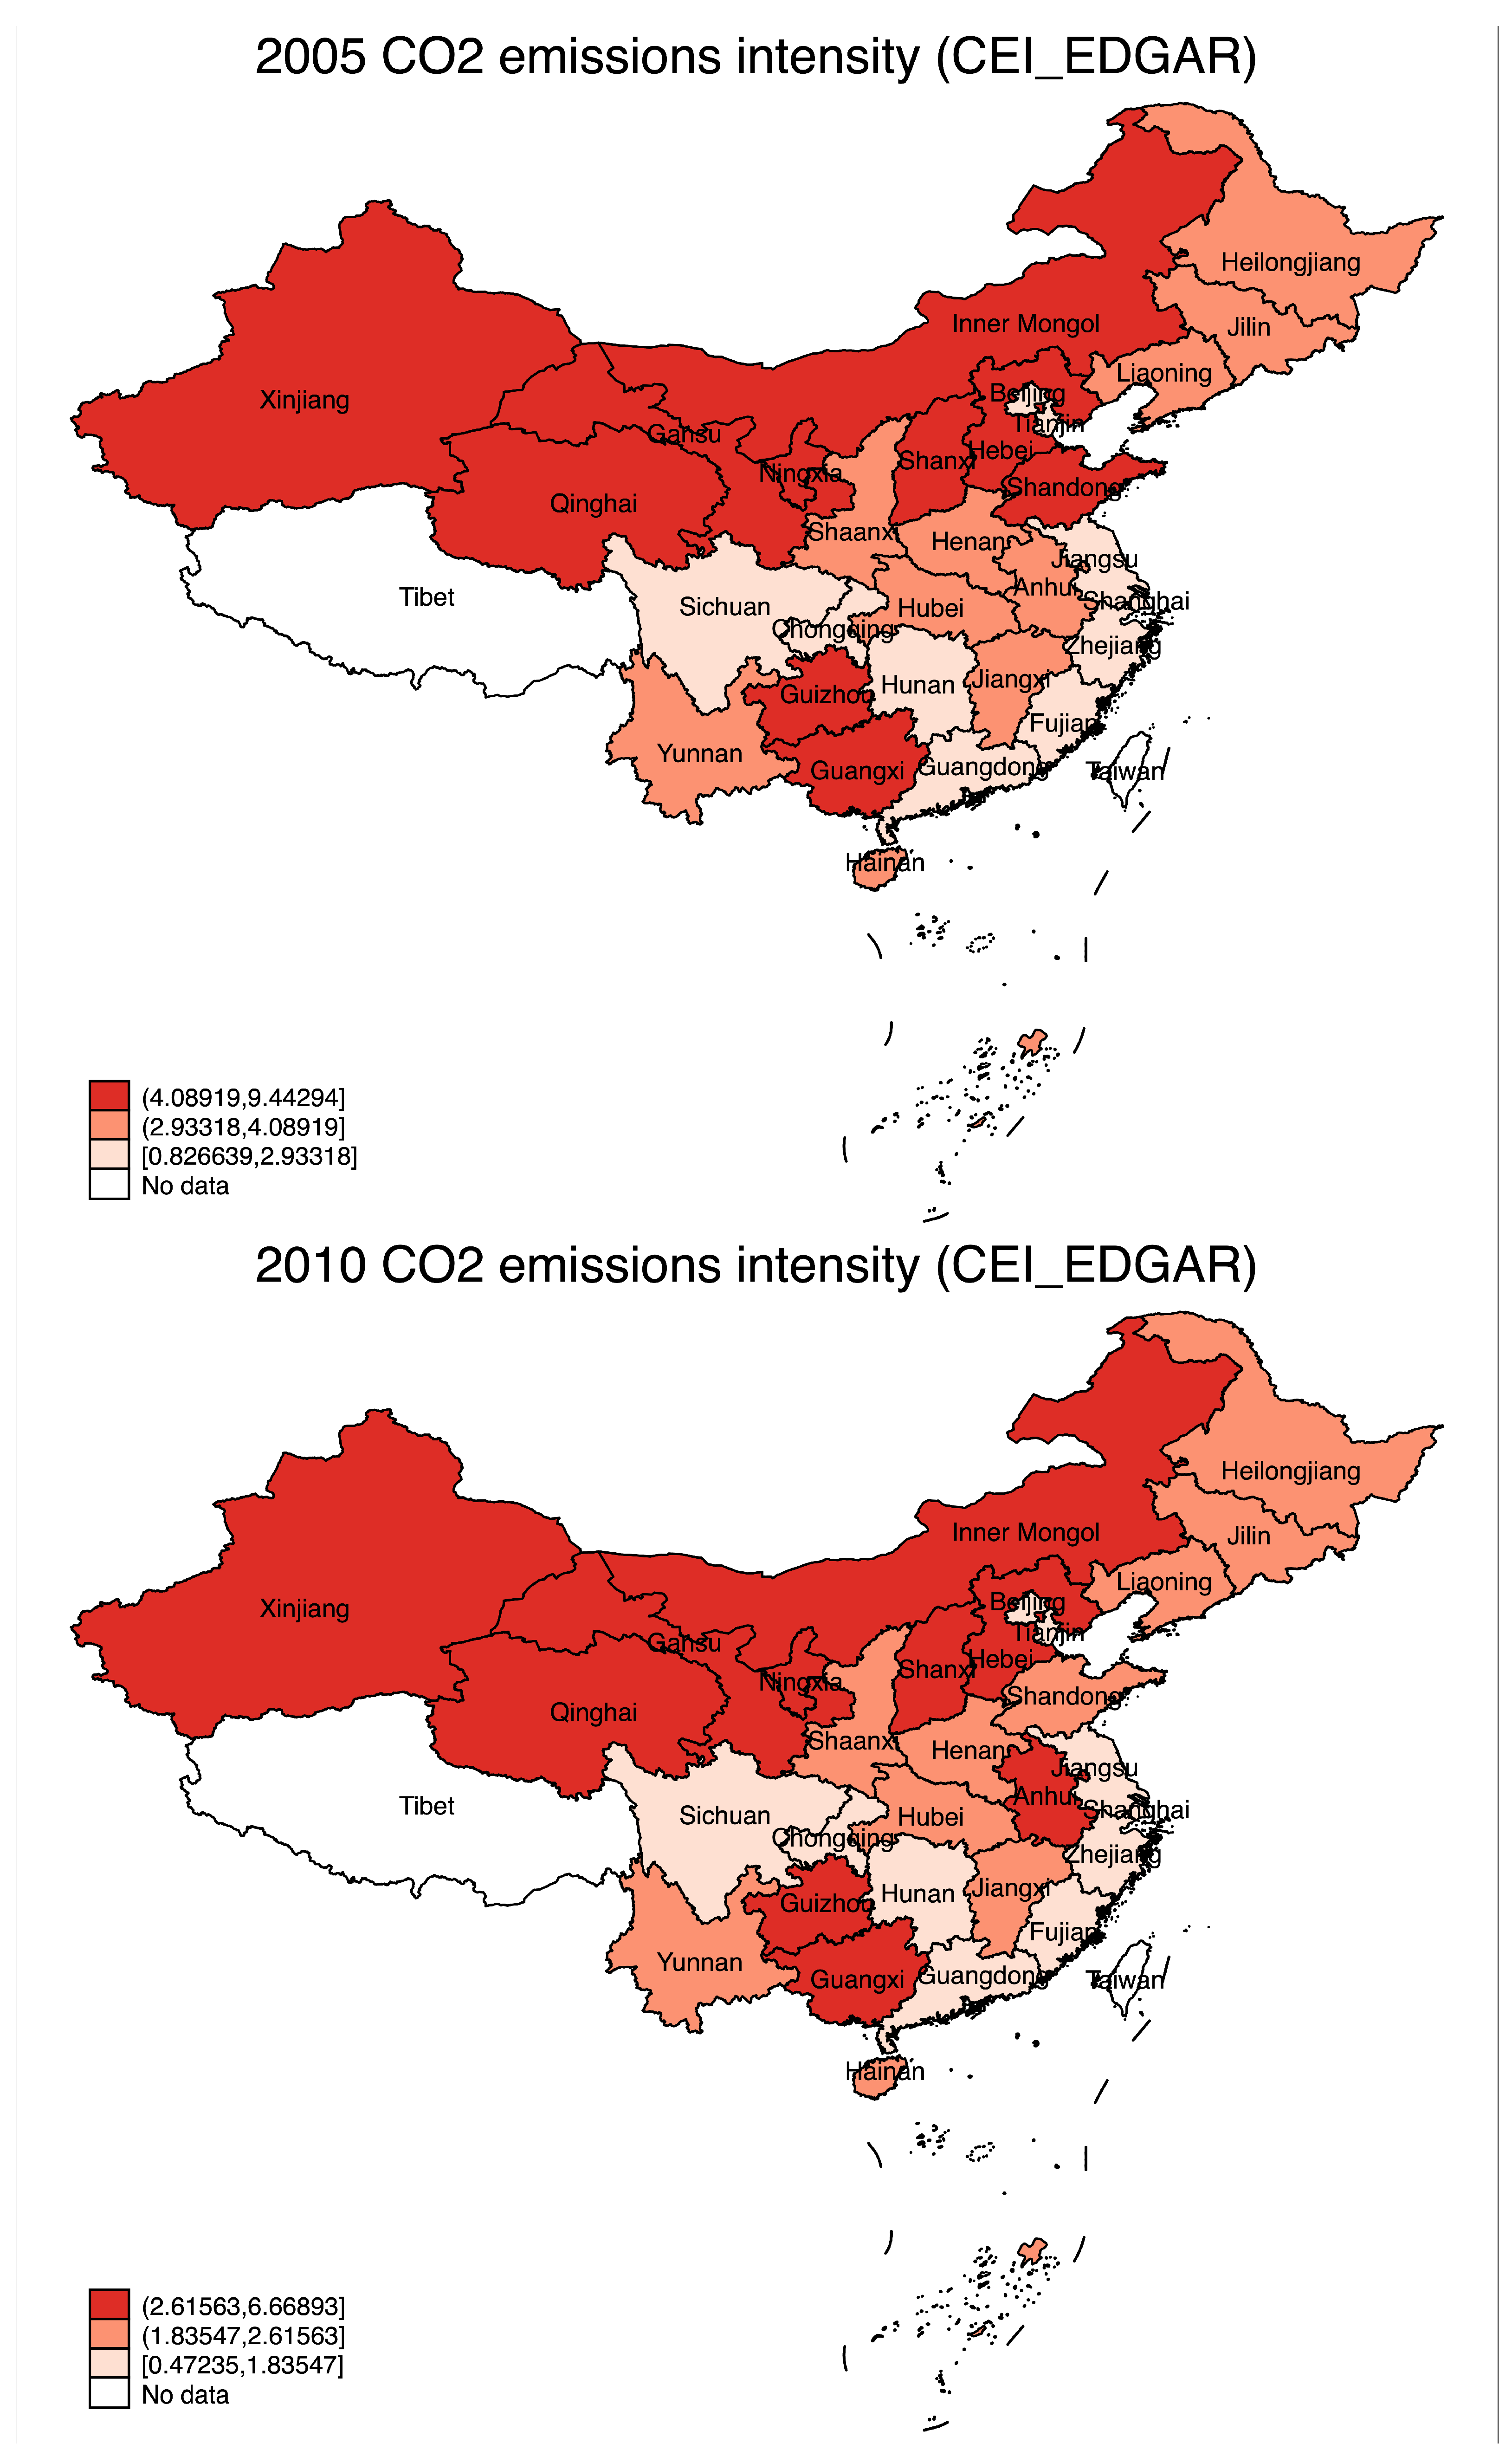
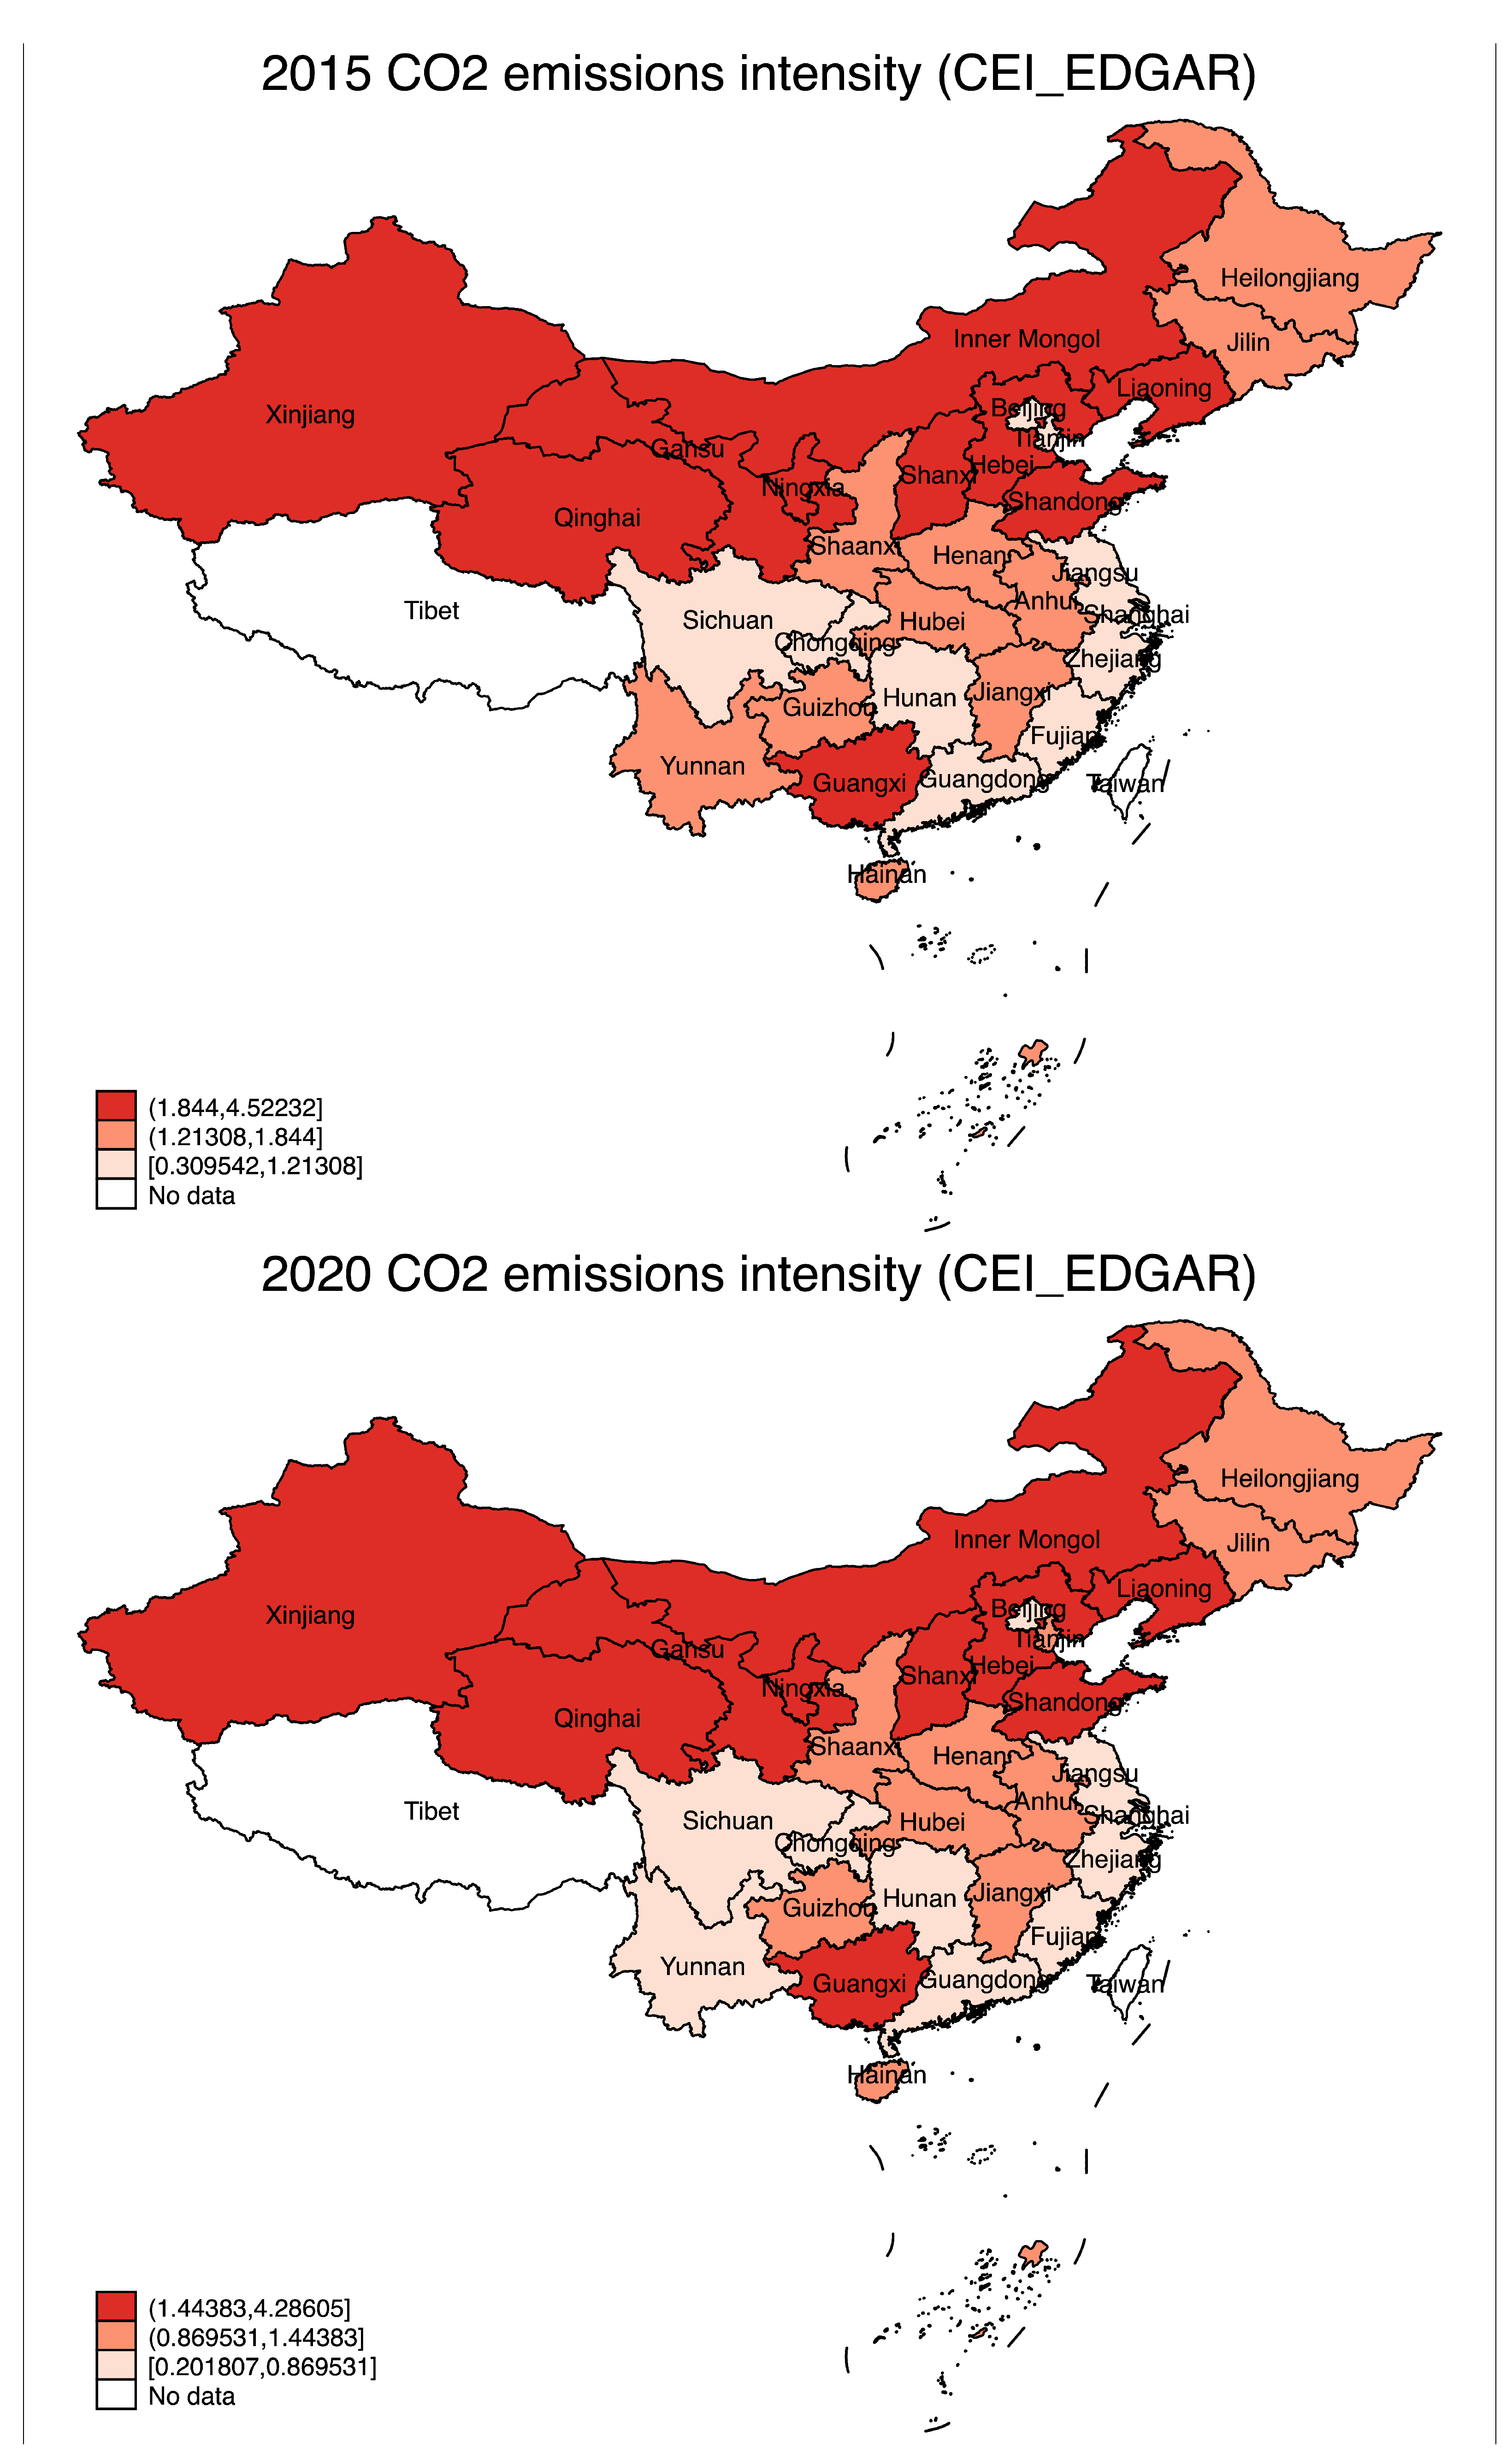
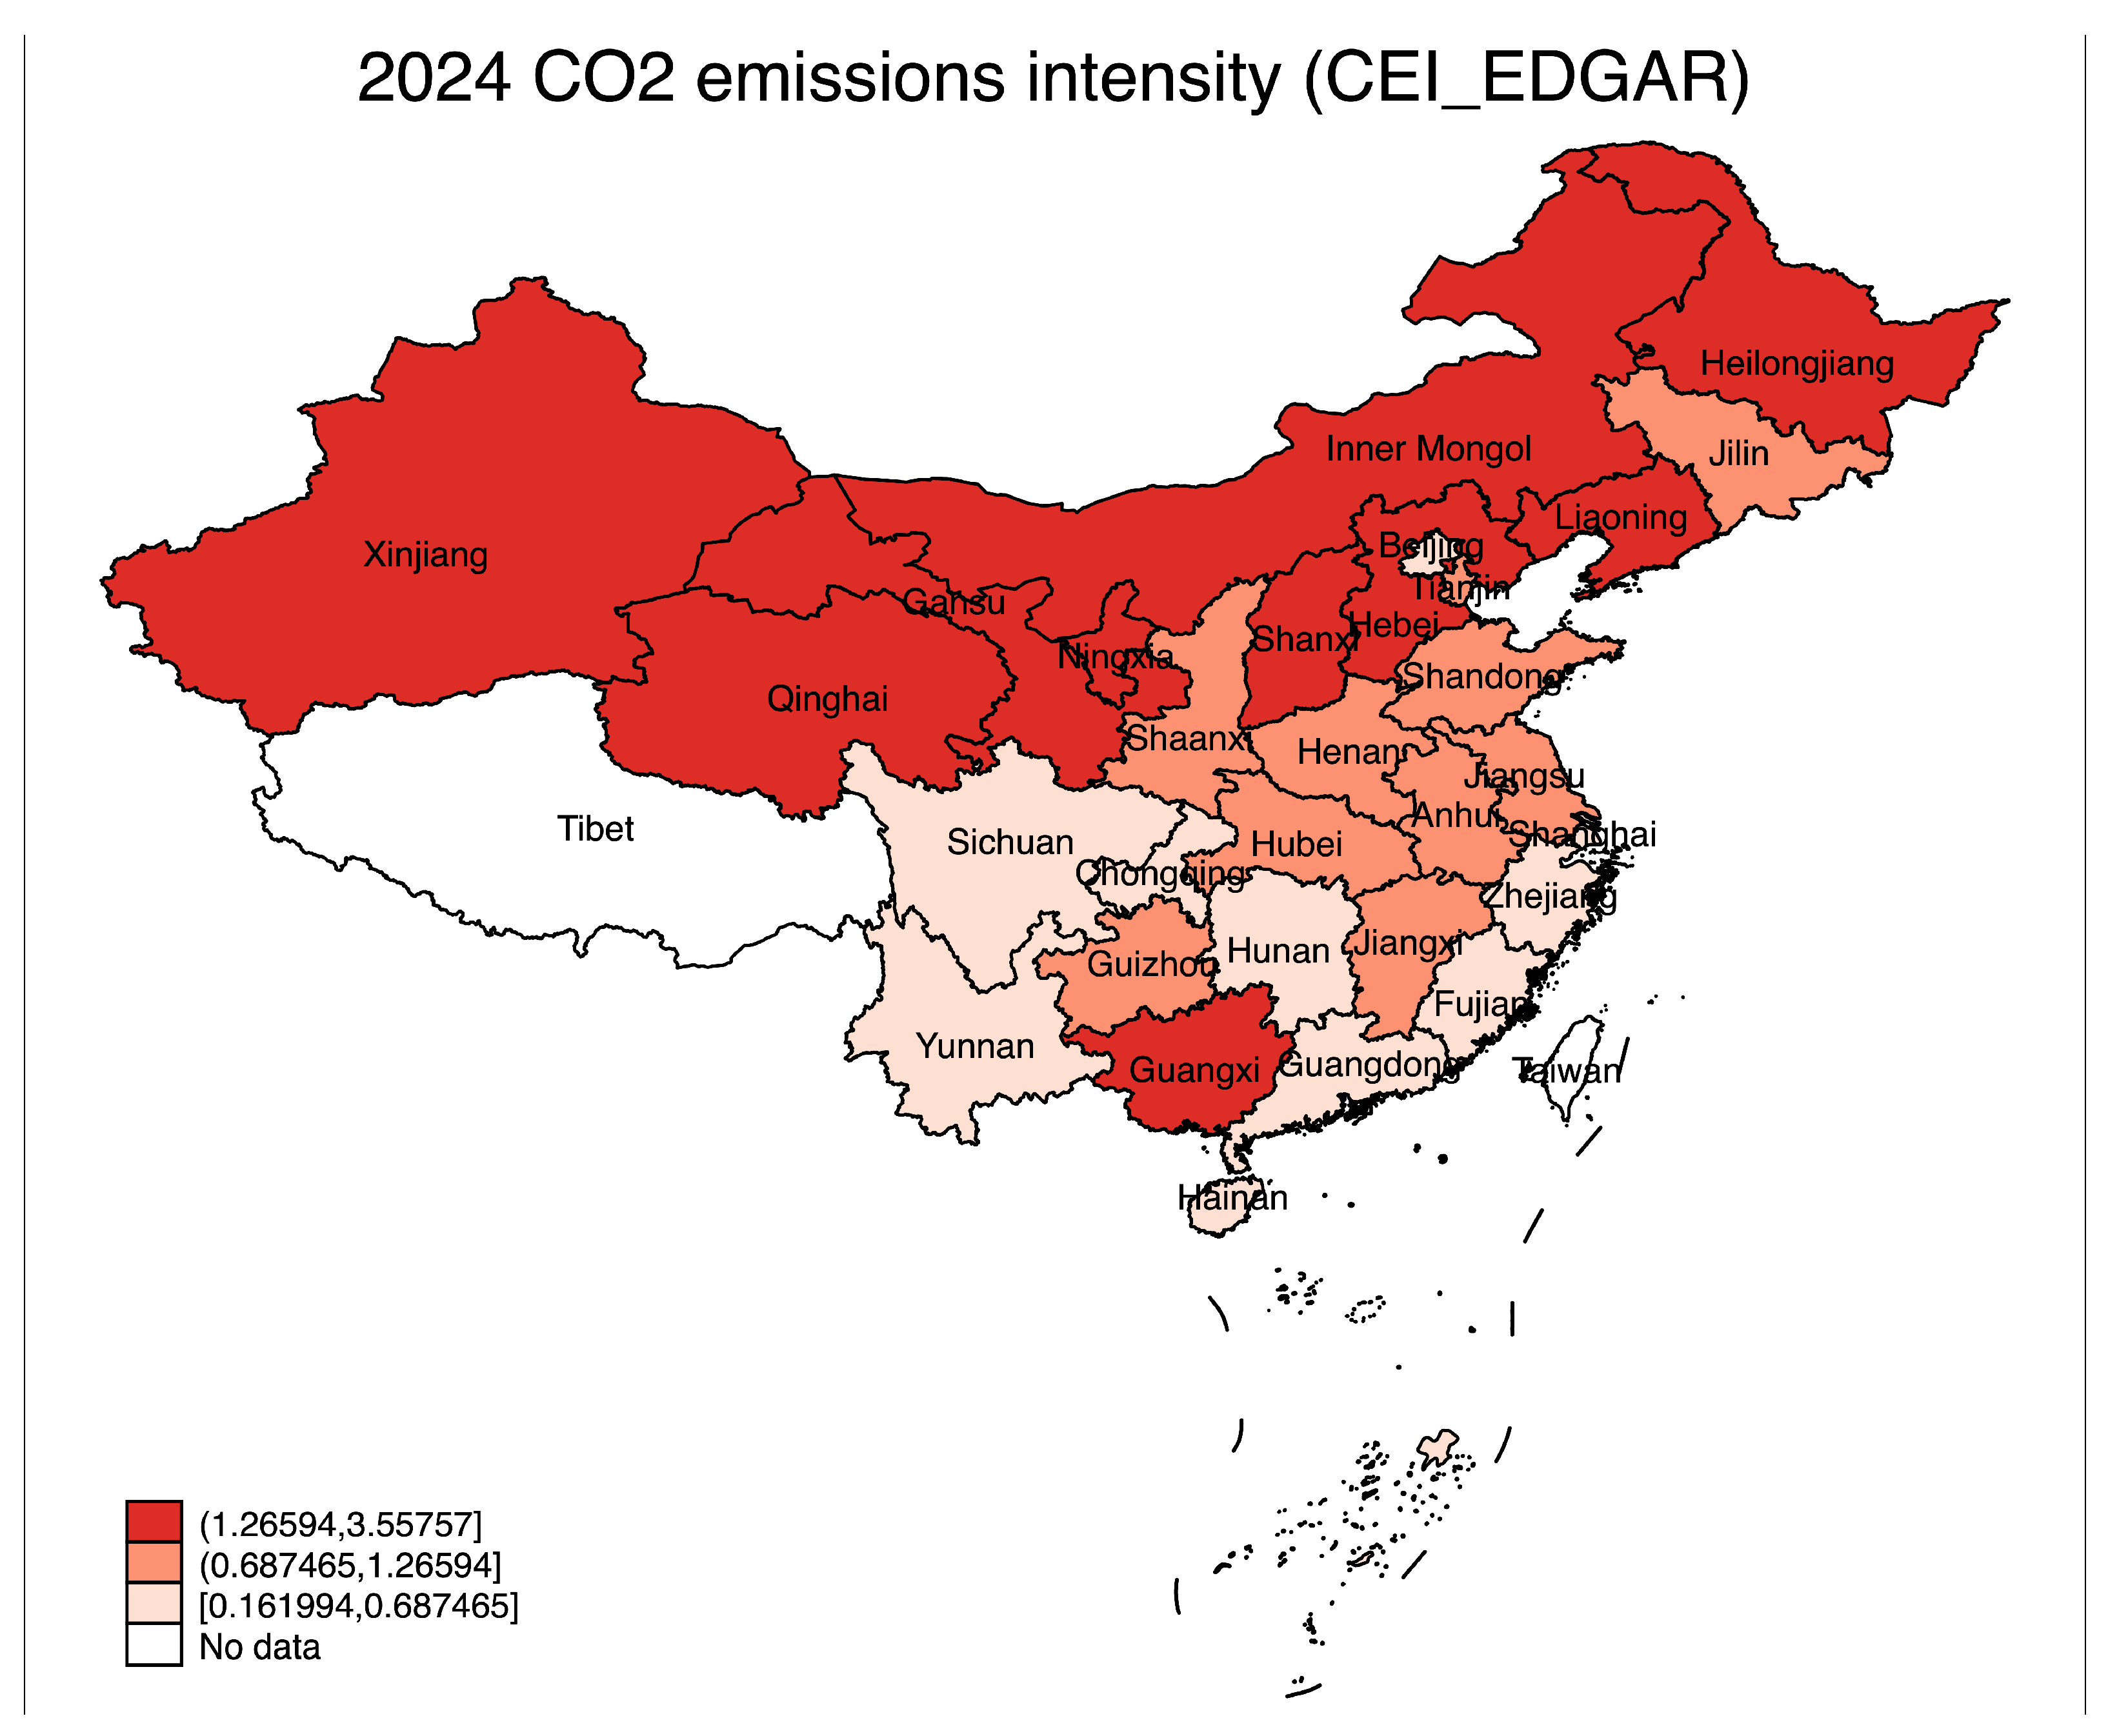
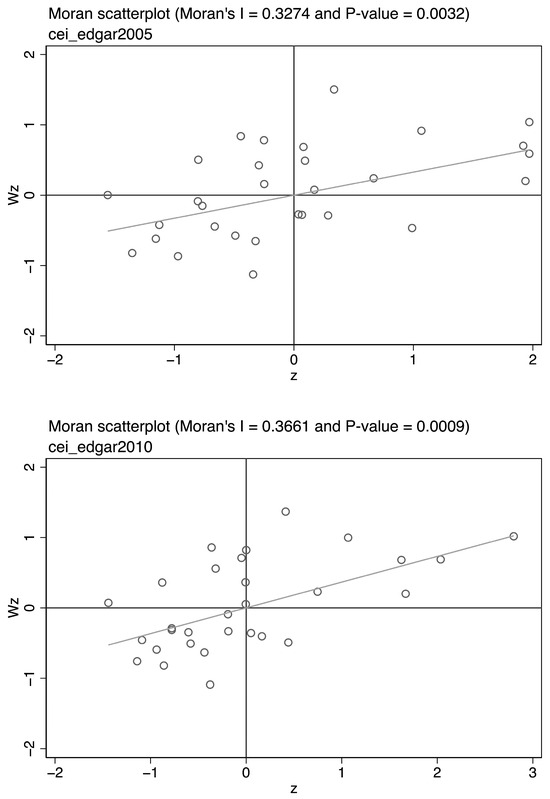
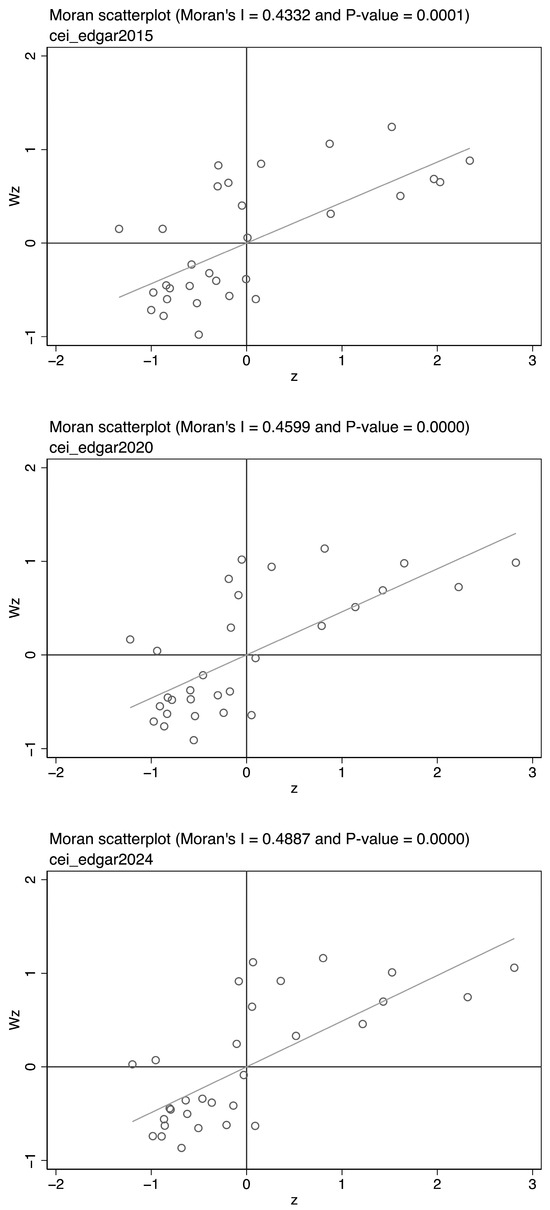
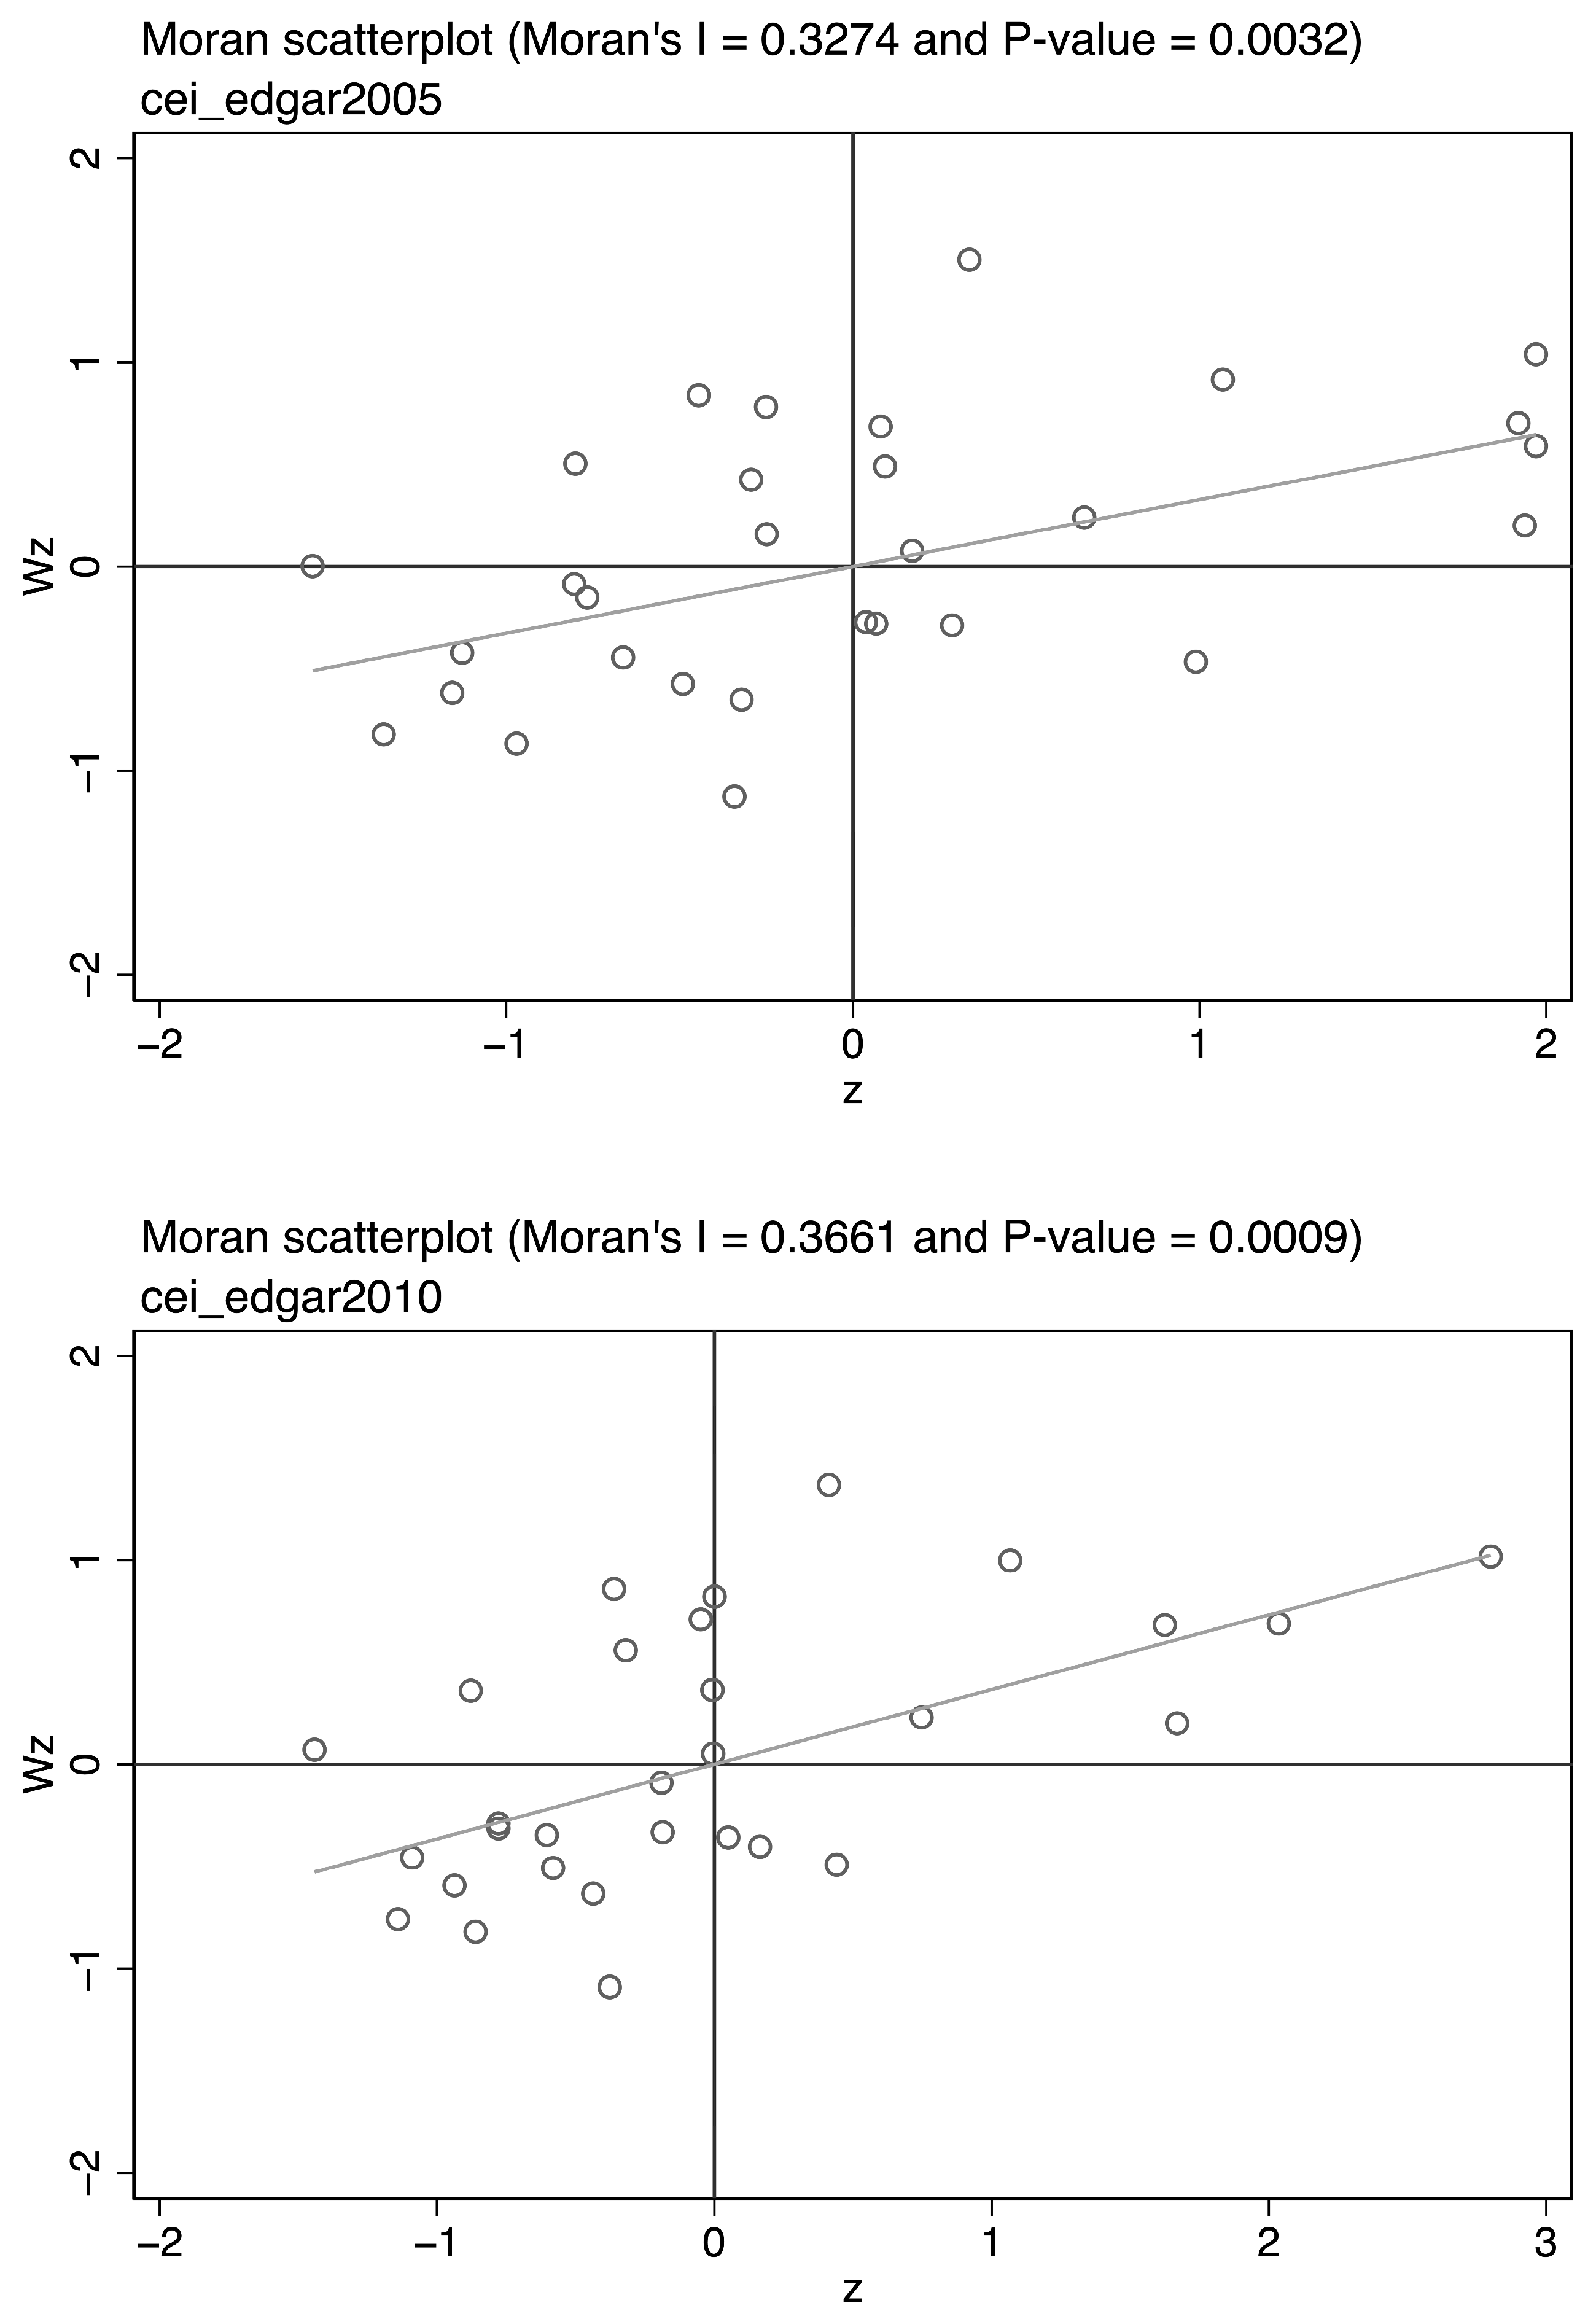
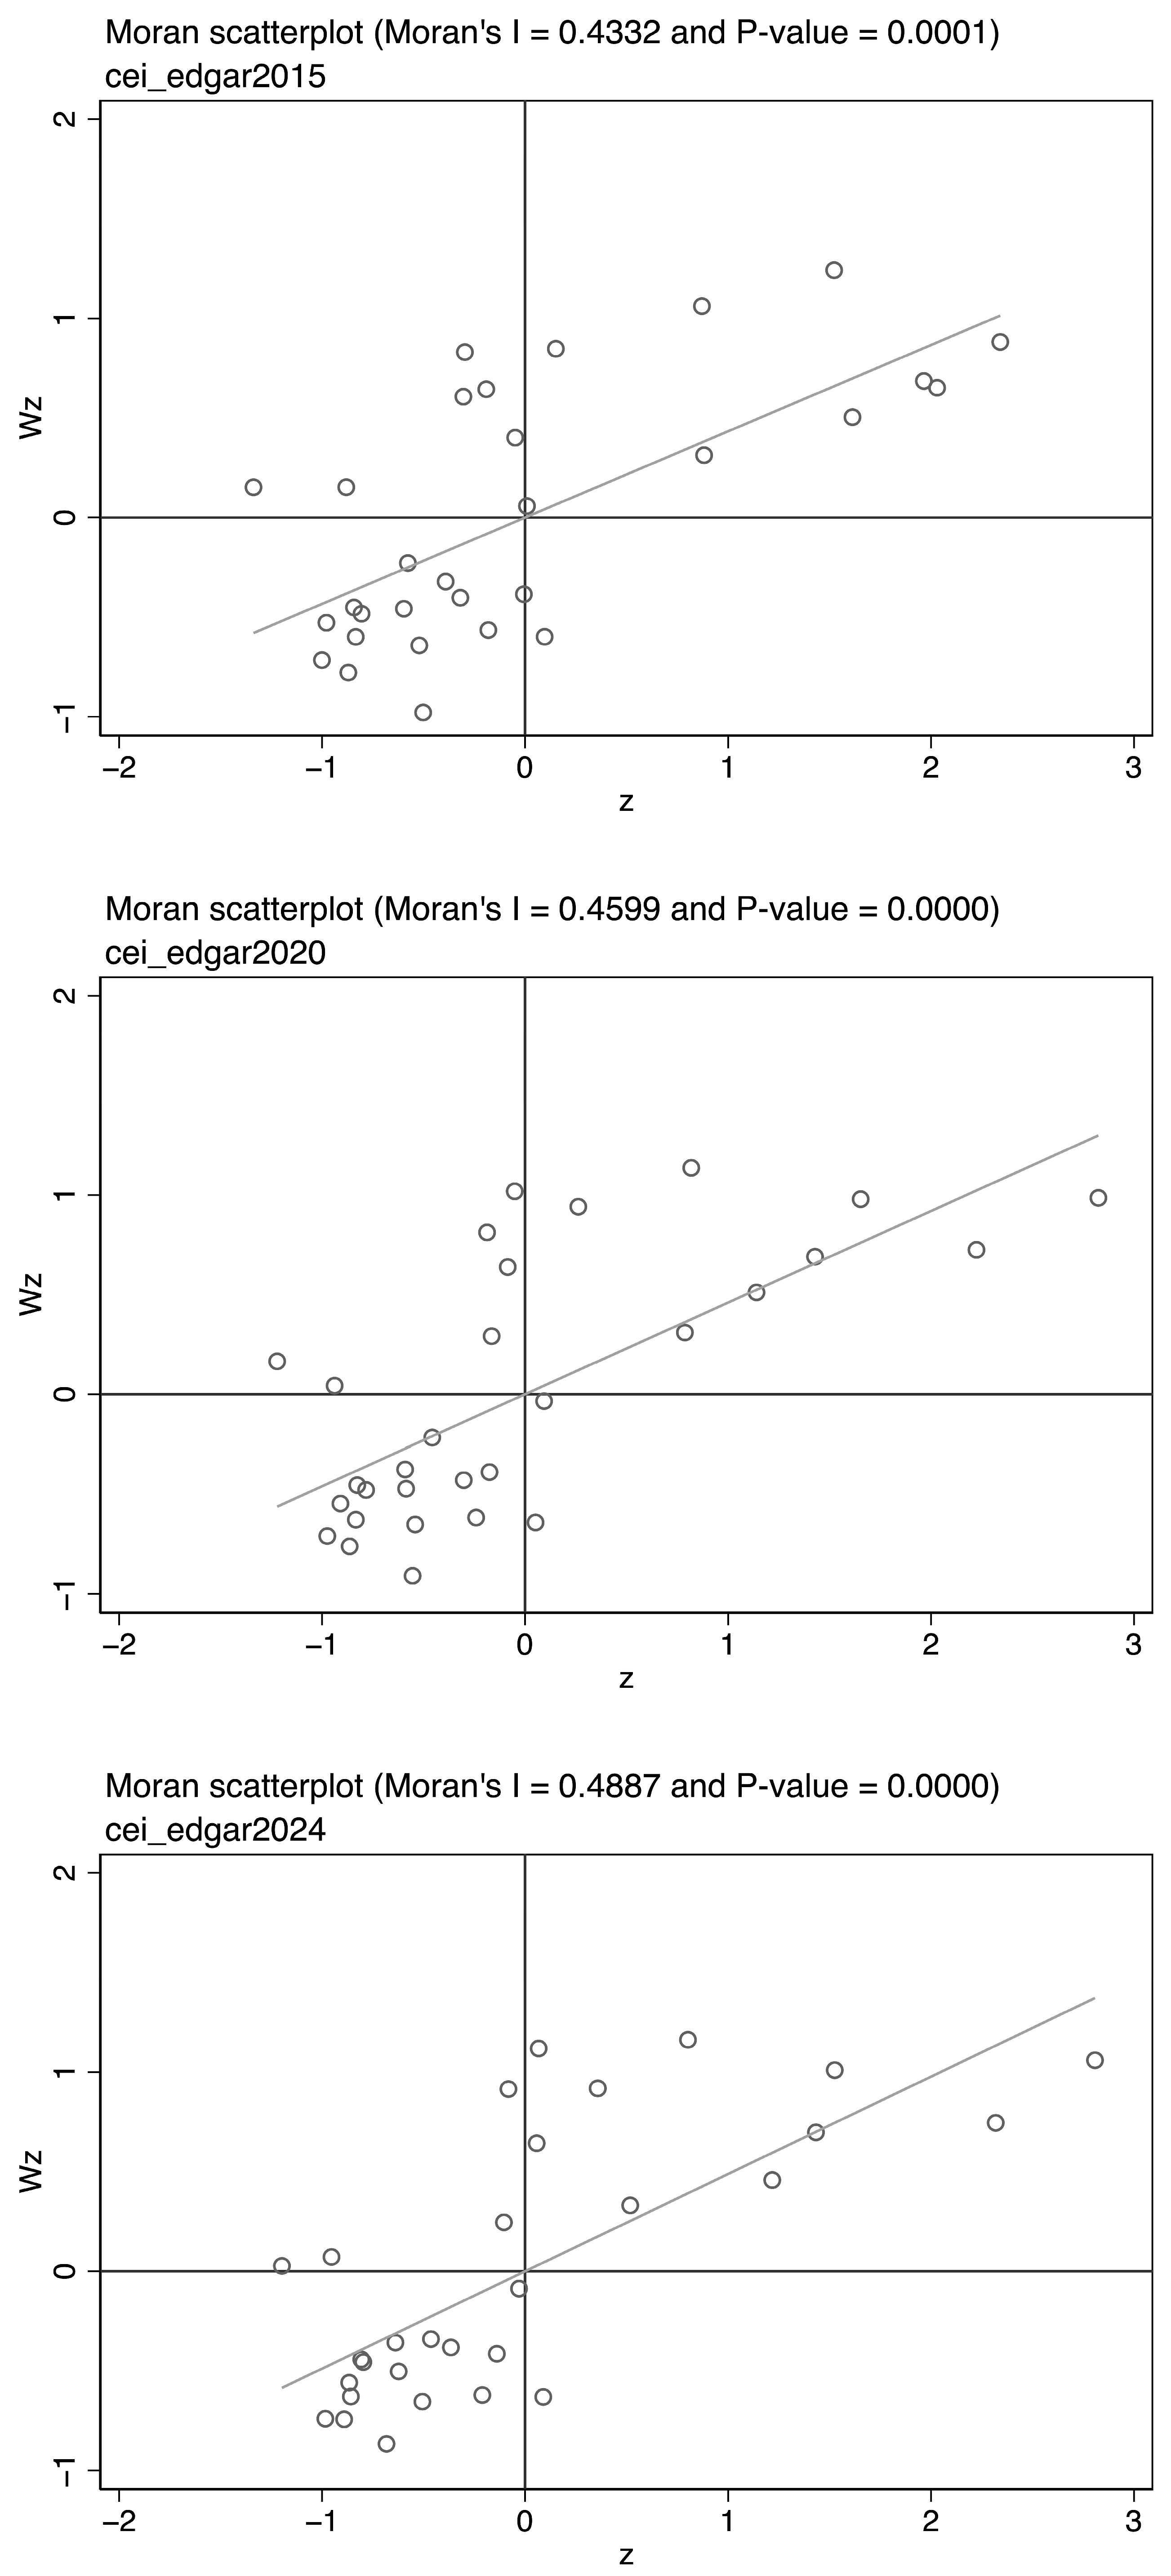

Disclaimer/Publisher’s Note: The statements, opinions and data contained in all publications are solely those of the individual author(s) and contributor(s) and not of MDPI and/or the editor(s). MDPI and/or the editor(s) disclaim responsibility for any injury to people or property resulting from any ideas, methods, instructions or products referred to in the content. |
© 2026 by the authors. Licensee MDPI, Basel, Switzerland. This article is an open access article distributed under the terms and conditions of the Creative Commons Attribution (CC BY) license.