


Abstract
The measurement and improvement of urban land use efficiency (ULUE) are crucial for sustainable development in China’s Canal Cities (CCCs). Drawing on the theories of production factors, spatial externalities, and agglomeration economy, this study proposes a framework that explicitly addresses the trade-offs and synergies of sustainable land use. A comprehensive ULUE evaluation index system was established. The super-SBM (Slack-Based Measure) and Global Malmquist–Luenberger (GML) index models were employed to assess the green efficiency of urban land use from 2002 to 2023, while Kernel Density Estimation (KDE) and the optimal parameters-based geographical detector (OPGD) model were used to investigate the spatiotemporal evolution and influencing factors of ULUE. The results reveal a distinctive V-shaped trend in efficiency, marked by significant spatial disequilibrium and predominantly technology-driven sustainable growth. Furthermore, ULUE exhibits a spatial distribution characterized by bipolar and multipolar differentiation, accompanied by concurrent concentration and dispersion, with high-value clusters dominating the spatial clustering type. Government regulation emerges as the dominant factor influencing ULUE, underscoring the pivotal role of policy intervention in guiding the sustainable development of land use. The interactions among pairs of influencing factors strengthened over time; notably, the interaction between government regulation and other factors is the strongest. Four-quadrant analysis profoundly reveals the underlying mechanism, distinguishing a high-quality, sustainable development model driven by technological innovation and a resource-dependent economic growth model. The findings provide valuable insights for promoting green development and formulating sustainable land use policies in CCCs.
1. Introduction
Canals have been indispensable to human civilization, serving as vital waterways and spatial corridors that significantly shape urban development [1,2]. From the Nile and Suez Canal in Egypt [3,4] to the Manchester, Birmingham, Kiel, and Regent canals in Europe, these waterways have long fostered economic and cultural prosperity and served as ecological corridors along their banks [1,5,6,7]. China’s Canal Cities (CCCs) are a defining embodiment of global legacy [8]. Furthermore, they are a powerful testament to how these waterway systems drove regional integration throughout history, while also enhancing both urban development and ecological efficiency [9]. However, they currently face the challenge of modern development. Rapid growth in CCCs has significantly intensified land demand. This growth has led to extensive land consumption, irrational land use structures, and inefficient resource allocation [10]. These patterns directly undermine the sustainable use of land resources [11,12,13,14]. This gives rise to various environmental problems, including land pollution and natural ecosystem degradation [15]. The land intensification level is a representative indicator of land use change [16], and a necessary response to land scarcity [17]. However, simple factor input fails to translate into efficient utilization. Under the dual constraints of sustainable development and China’s “dual carbon” goals, the focus of scholarship and policy must shift from “input intensity” to “output efficiency”. Improving urban land use efficiency (ULUE) is therefore imperative. ULUE measures the comprehensive economic, social, and environmental benefits generated by land use. Reconciling development pressures with sustainability requires the efficient and intensive allocation of land resources. This, in turn, demands a clear understanding of how ULUE varies across space. Elucidating the spatial patterns of ULUE in canal cities is thus critical for fostering high-quality regional development.
Early research on urban land use has primarily employed theoretical approaches, such as location theory, scale-economy theories, regional spatial structure, and the impact of urban structure on land use [18], thereby establishing a robust theoretical foundation for subsequent studies. As urban land expanded rapidly, foreign scholars introduced the “compact city” and “smart growth” theories, which have broadened research perspectives. Currently, theoretical researchers, especially those focusing on canal cities, mainly examine how to shape the urban space and structure [2], revealing the spatial evolution and underlying mechanism shaped by the canal corridor. Meanwhile, studies also use canals to guide urban growth, such as analyzing spatial functional relationships in Amsterdam and Venice [19]. These studies have provided valuable insights and inspirations for comprehensively and deeply understanding the intrinsic relationship between the spatial structure and morphological characteristics of canal cities.
Research on ULUE has been explored from multiple perspectives, including evaluation index systems [20,21], spatiotemporal characteristics, and influencing factors [22,23]. Some researchers have directly applied a series of economy-associated indicators, exploring both single and multiple factors [24]. Others have emphasized the necessity of incorporating both social and ecological impacts into the ULUE evaluation system [25]. Consequently, numerous studies have explored ULUE in an attempt to realize sustainable development from social and ecosystem perspectives [26]. In response to growing concerns about environmental issues, the evaluation system has gradually begun to consider undesirable outputs, including emissions of waste gas, wastewater, smoke, and carbon dioxide [27]. Zhou et al. [28] assessed urban land green use efficiency across 284 cities in China by the applying of multiple indicators that include undesired outputs. In terms of the spatial–temporal characteristics and influencing factors, significant inter-regional differences exist in ULUE during different urbanization stages [23,29]. The spatial distribution of ULUE in China tends to decrease from east to west [30], and the influencing factors vary across regions [31]. Investigating the influence of per capita GDP, urbanization rate, investment in fixed assets, economic development, and other factors on ULUE is crucial. Studies have demonstrated a positive correlation between ULUE and economic development [32], and an N-shaped relationship between ULUE and GDP. Demographic factors such as population density [33] and policy interventions have profoundly shaped urban spatial configurations in China. This influence operates through historical processes of population redistribution policies, real estate markets, and community development [34]. These macro-level drivers remain largely absent from ULUE analyses. The omission constrains the interpretation of the observed efficiency patterns, particularly in CCCs. Furthermore, the internal heterogeneity of cities is typically overlooked in such evaluations, leading to a widespread divergence in ULUE assessment. Therefore, adopting a dynamic multi-perspective analysis to explore the spatiotemporal heterogeneity of ULUE is crucial. It provides essential insights for government policymakers intending to formulate effective strategies [35].
In summary, while research on urban agglomerations (e.g., Economic Belt regions) has advanced considerably [36], studies specifically addressing ULUE in canal cities remain scarce and exhibit several key limitations. First, the existing literature predominantly focuses on a single canal within a specific country, lacking cross-regional comparative analysis. Second, although ULUE evaluations often incorporate both desirable and undesirable outputs, the latter are typically confined to environmental indicators such as pollutant emissions, leaving social pressure metrics largely overlooked. Third, the underlying mechanisms driving the spatiotemporal heterogeneity of ULUE in CCCs remain underexplored, particularly the interactive effects of multiple factors. This gap is largely attributed to the absence of an assessment framework that captures the geographical distinctiveness and cultural diversity of canal cities, which restricts the expansion and deepening of the research on a broader spatial scope.
To fill these gaps, this study investigates the spatiotemporal evolution of ULUE in CCCs, its driving mechanisms, and policy implications. Three questions need to be addressed: (Q1) How has ULUE in CCCs evolved from 2002 to 2023? (Q2) What drives spatial heterogeneity, and how do these drivers interact? (Q3) How can the findings inform a targeted policy framework for sustainable land use? To answer these questions, a ULUE evaluation system was developed that considers socio-economic factors and the positive and negative environmental externalities. This comprehensive approach allows for a detailed analysis of ULUE and its influencing factors in CCCs. First, ULUE was assessed using the super-SBM and the Global Malmquist–Luenberger (GML) index models. Subsequently, this study employed Kernel Density Estimation (KDE) and optimal parameter-based geographical detector (OPGD) methods to delineate the dynamic evolution of ULUE and its influencing factors. This study represents an essential step towards clarifying the land use status and improving regional high-quality regional development in CCCs.
This study offers several innovations: (1) The ULUE evaluation system was established from the input–output perspective, incorporating both desirable and undesirable outputs. Efficiency was measured from 2002 to 2023 using the super-SBM and GML index models, followed by a detailed analysis of spatiotemporal evolution and its driving factors to enrich ULUE research. (2) A four-quadrant analysis framework and corresponding improvement measures are proposed, which are intended for government adoption to promote high-quality and sustainable urban development.
2. Theoretical Analysis
2.1. ULUE’s Connotations in the CCCs
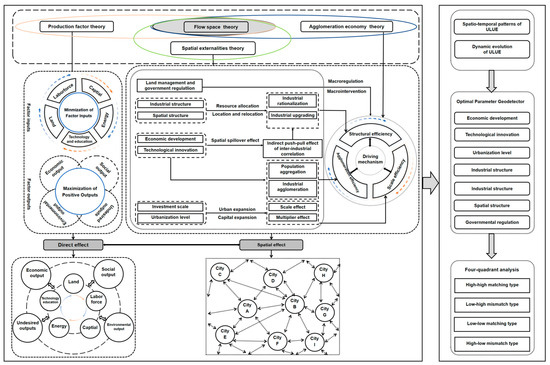
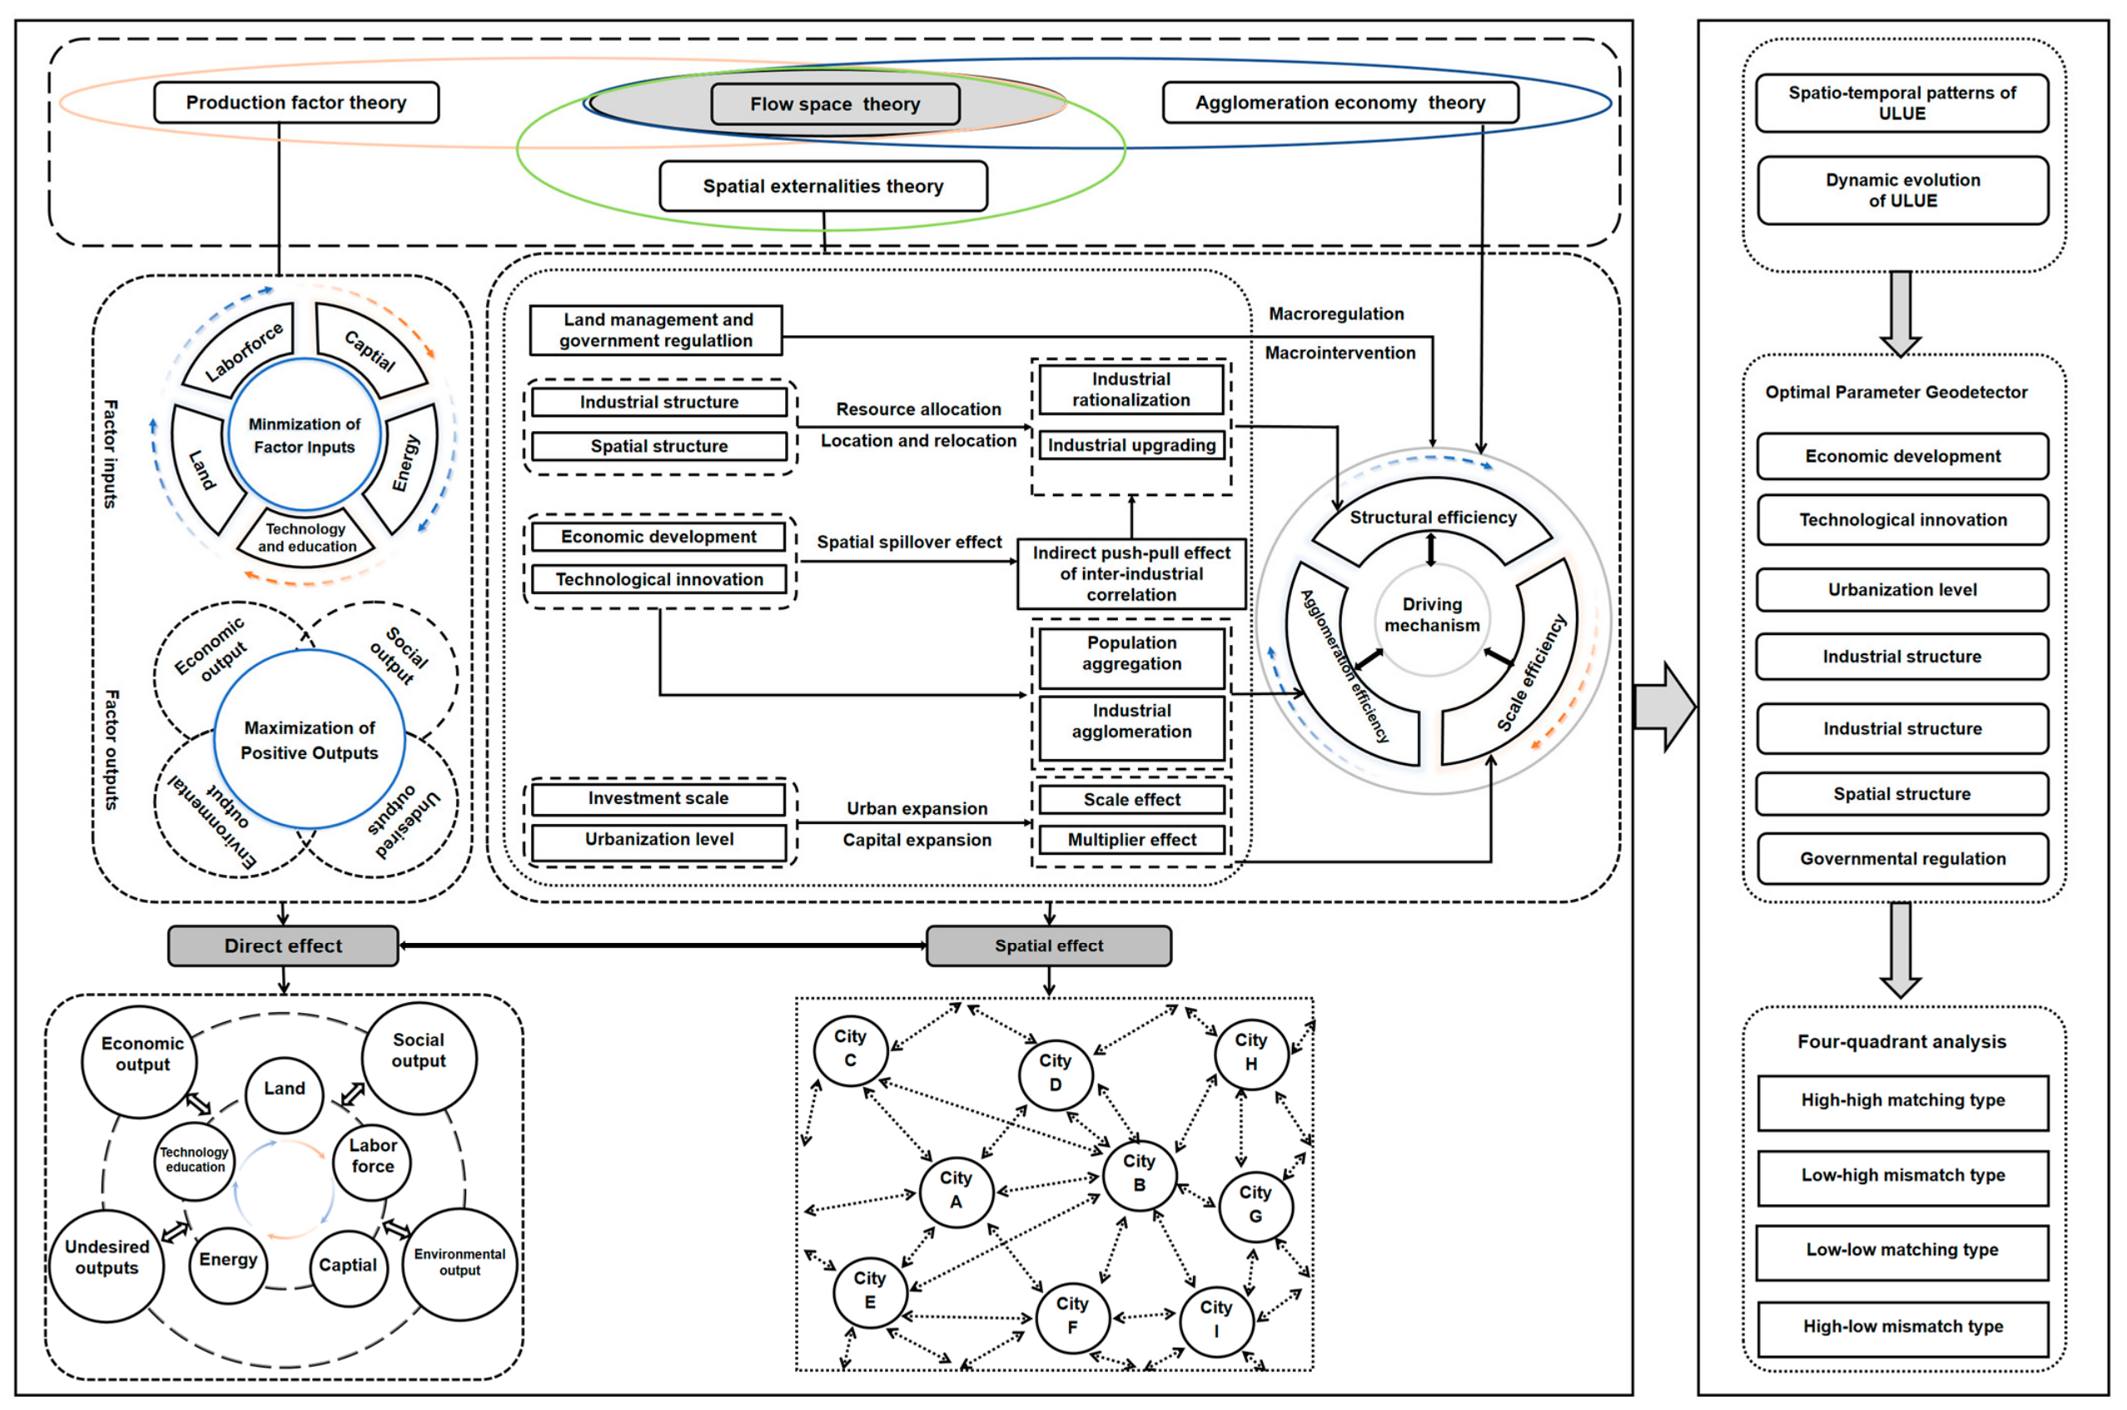
Canal, as an important channel of regional production factors, has a profound impact on urban development. Leveraging their unique advantage of linear connection and the superimposed socio-economic and ecological factors, canal cities have broken through geographical barriers and promoted the efficient flow and optimal allocation of production factors across regions. The efficient flow and optimal allocation of production factors necessarily depend on efficient land resource utilization. Such utilization is essential for achieving Pareto optimality given the inherent scarcity of land resources. ULUE incorporates both the effectiveness of land use and the resources expended in achieving this effectiveness [37]. It is defined as the relative efficiency of a set of socio-economic resources, which primarily comprise land, labor, and capital [38] (Figure 1). It directly reflects the interaction of the human–land system and measures intensive and economical land use for a given combination of inputs. Improvements in ULUE promote the integration of production factors, as reflected in the maximization of output efficiency.
Figure 1.
Illustration of the influence mechanism on urban land use efficiency (ULUE).
2.2. Theoretical Analysis of ULUE
This study constructs its theoretical framework for land management on sustainable development. It combines the theories of flow space, production factors, spatial externalities, and agglomeration economies. This combination explains the spatial synergy in resource allocation. Flow space theory serves as the central analytical framework. It emphasizes the networked, cross-regional movement of information, capital, technology, and people. Within this perspective, production factors theory focuses on optimizing the allocation of land, capital, and technology to improve efficiency. Spatial externalities theory extends beyond simple geographical proximity, capturing the spillover effects of socio-economic and ecological activities that influence surrounding areas. Furthermore, flow space theory reshapes the connotation of agglomeration economies. It argues for concentration based on flows, not just physical clustering, to yield greater benefits through low costs and higher efficiency. These theories are interconnected. Effective allocation of production factors can strengthen spatial externalities. Enhanced externalities, in turn, support agglomeration economies. This creates a logical closed loop at the theoretical level. However, this theoretical logic overlooks a practical tension: while flow space emphasizes networked connectivity, agglomeration economies still fundamentally depend on physical proximity. In China, state ownership of land, the household registration system, and regional development policies actively guide and often constrain the mobility and clustering of production factors. Rooted in the country’s centralized governance, these institutional frictions directly shape how spatial spillovers and agglomeration benefits actually materialize.
The influence mechanism of ULUE centers on the dynamic interplay among structural, agglomeration, and scale efficiencies. Structural efficiency underpins industrial clustering by optimizing industrial structure and factor allocation. As industries concentrate, agglomeration efficiency emerges, fostering resource sharing and intensified division of labor that generate scale economies. These scale effects attract further production factors, continuously refining the industrial structure and strengthening structural efficiency. This self-reinforcing cycle drives the sustainable enhancement of urban land use and reflects its balanced performance across economic, social, and environmental dimensions. From the perspective of external influencing factors, the development of ULUE is comprehensively influenced by multiple factors such as economic development, new urbanization, technological innovation, and policy regulation. Sustainable economic growth serves as the primary driver, while urbanization amplifies scale effects through compact, resource-efficient spatial expansion. Increased capital investment plays a pivotal role in stimulating industrial structure adjustment towards higher value-added and higher efficiency, resource-efficient sectors, thus raising scale efficiency. Green technological innovation converts advances into production factors, improving productivity and tilting the capital-land substitution rate in favor of sustainable land use, while its spatial spillovers strengthen inter-industry correlation and agglomeration efficiency [39]. Policy frameworks support sustainable, orderly land development through macro-level regulation of resource allocation [40]. By directing factor allocation and accelerating industrial upgrading toward low-carbon, high-value-added sectors, policies enhance structural efficiency, and the resulting environmentally sound spatial reorganization further promotes industrial rationalization, maximizing structural efficiency potential for sustainable urban development (Figure 1). It is worth noting, however, that, in China, state-led land supply and directed industrial clustering can distort self-reinforcing efficiency dynamics, constrain spatial spillovers, and undermine market mechanisms, thereby necessitating a more nuanced institutional contextualization.
Theoretically, ULUE relies on the rational allocation of production factors to achieve sustainable urban development. A resource-efficient allocation across both industrial and spatial levels is a prerequisite for balancing drivers of sustainable growth, including industrial upgrading, agglomeration, and economies of scale. Thus, ULUE not only has a direct impact on local land use, but also indirectly generates synergistic improvements in surrounding areas through spatial externalities. Figure 1 visually depicts the theoretical analysis of ULUE.
3. Materials and Methods
3.1. Study Area
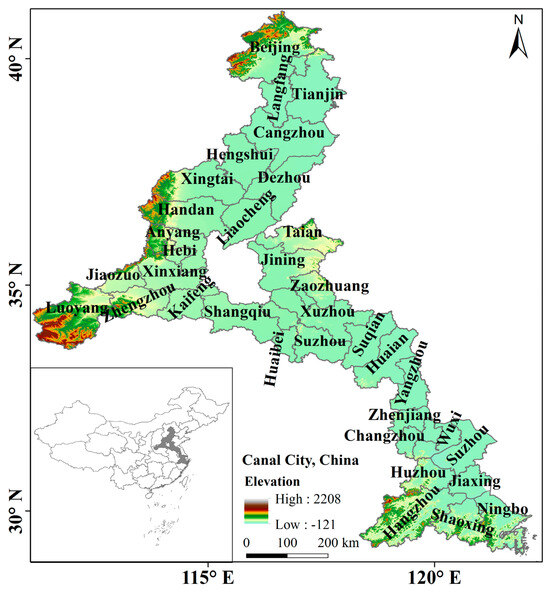
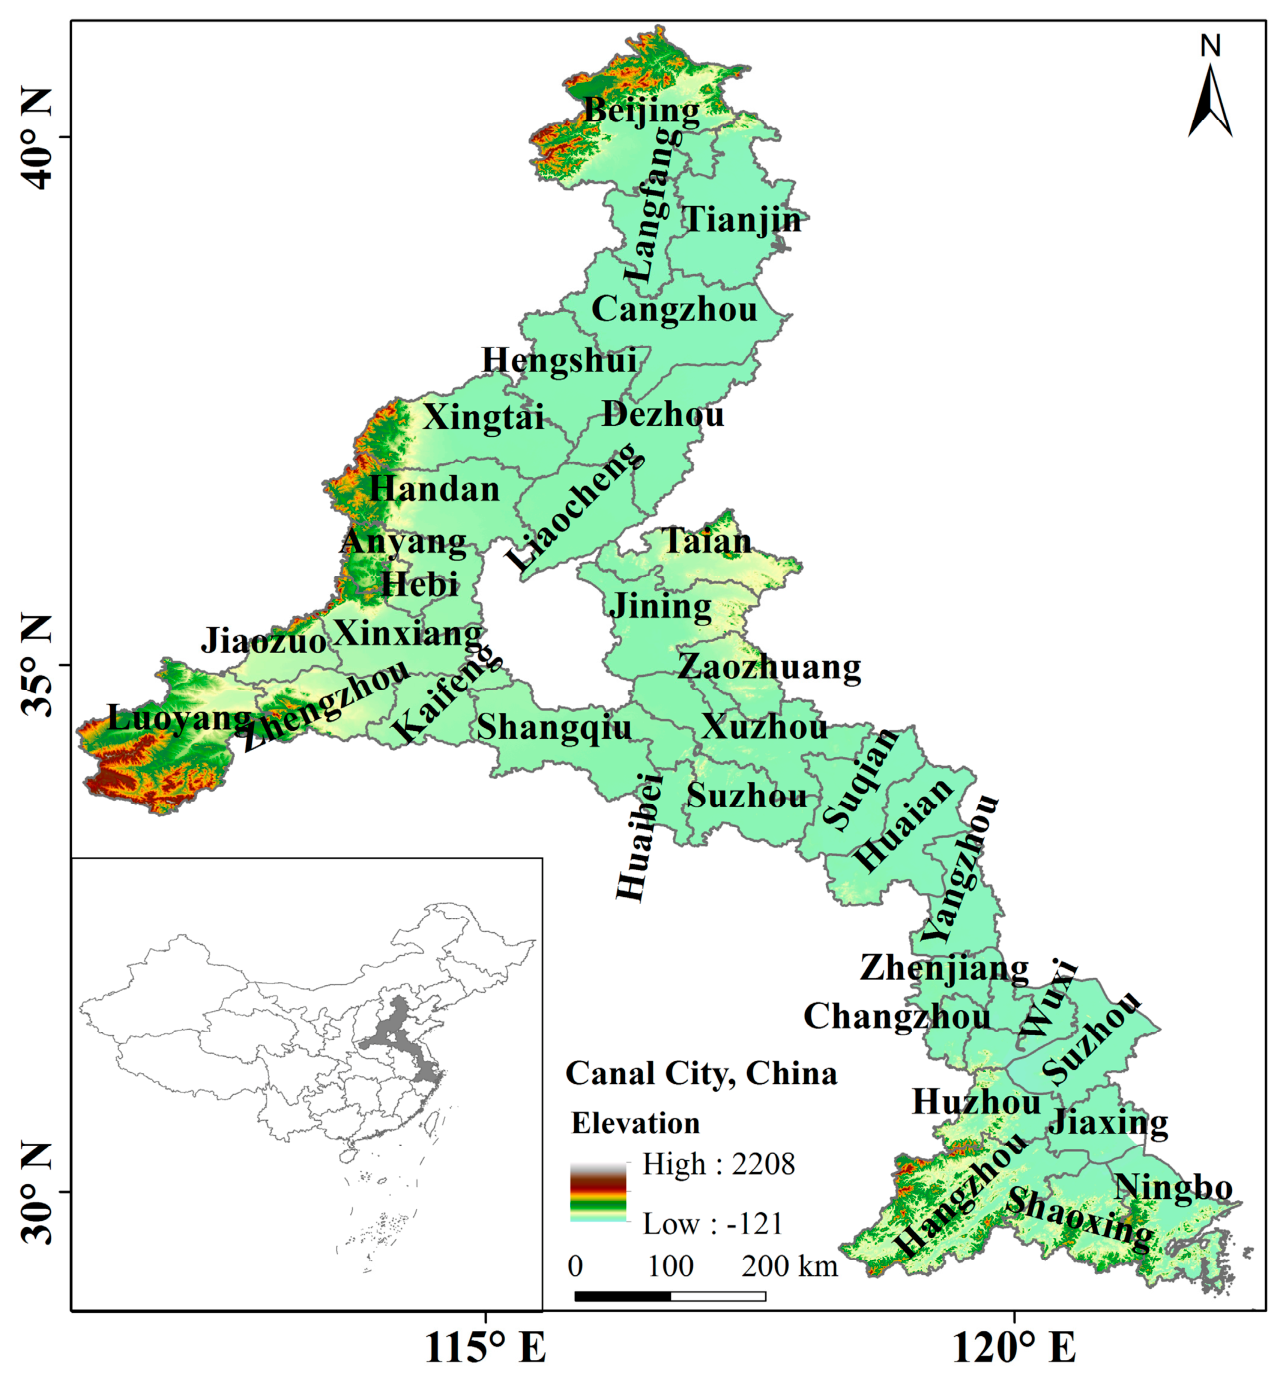
CCCs are of strategic importance to the country. As an inland economic and cultural belt with worldwide significance, the canal-traversing cities stretch from Beijing in the north to Hangzhou in the south, covering 35 cities across 8 provinces or municipalities directly under the central government (Figure 2, Table S1). The study area is characterized by intensive internal transport connectivity and frequent flows of production factors, serving as an essential channel for economic circulation, social development, and integration. However, the CCCs face unprecedented pressure and challenges arising from historical vicissitudes, such as severe degradation in the Hangzhou section, disordered land use development in Wuxi City, and the decline of social and economic functions. Therefore, it is crucial to rethink and redefine the value and function of the CCCs along the “golden waterway”. Addressing these issues is essential for improving ULUE, overcoming barriers to urban development, and establishing a cohesive framework that integrates social and economic growth.
Figure 2.
Location and range of the CCCs.
3.2. Data Sources
There are 35 cities of great political and socio-economic importance, which are divided into northern areas, including Beijing, Tianjin, Hebei, Henan, Shandong, and Anhui, and southern areas, including Jiangsu and Zhejiang, in terms of Qinling–Huai River geographic demarcation and provincial administrative integrity (Table S1). The expansion ratio of built-up areas (https://www.stats.gov.cn/), referring to the growth rate of built-up areas from 2002 to 2023 relative to the 2002 level, exhibits an annual average growth rate of 4.91% in the CCCs. These cities have experienced rapid urban sprawl over the past several years, which exerts substantial impacts on ULUE. Therefore, these cities can be regarded as representative cases of the Grand Canal region.
The study’s data originate from the China Statistical Yearbook (2003–2024) (https://www.stats.gov.cn/), the China Urban Construction Statistical Yearbook (2003–2024) (https://www.mohurd.gov.cn/gongkai/fdzdgknr/sjfb/tjxx/jstjnj/) (3 November 2025), and the statistical yearbooks of provincial-level municipalities and prefecture-level statistical yearbooks (2003–2024). Some data were also collected from the “Statistical Bulletin of National Economic and Social Development” and “China’s Economic and Social Big Data Research Platform”. GDP and social fixed assets investment were deflated to constant 2002 prices using corresponding price indices to eliminate interference from price changes.
During the preparation of this work, the Gen DeepSeek AI tool was used to enhance the readability and language of the manuscript. Following its use, the authors reviewed and revised the content as necessary and assume full responsibility for the published work.
3.3. Research Method
3.3.1. Super-SBM and GML Index Models
- Super-SBM method
Data Envelopment Analysis (DEA) was initially introduced by Charnes et al. [41] as a mathematical model to determine the relative efficiency of Decision-Making Units (DMUs), employing multiple input and output indicators. The efficiency scores of DMUs measured by the DEA are independent of the units of measurement and avoid the influence of subjective factors. However, the conventional radial DEA model neglects input and output slacks and cannot handle undesirable outputs. Thus, slack variables were introduced into the objective function to yield a non-radial and non-angular slacks-based measure (SBM) model [42] to evaluate ULUE with undesirable outputs. However, the SBM model cannot distinguish among efficient DMUs when their efficiency scores are all equal to 1. To solve this problem, a super-SBM model with undesirable outputs has been well recognized and is more appropriate for input–output-oriented efficiency measurements of ULUE [43,44]. The equation is formulated as follows, incorporating the SBM model’s principles:
where denotes the efficiency of the DMUs. If ρ is less than 1, the DMU has room for improvement; if ρ is greater than 1, it indicates an increasingly efficient state. x and y represent input and output variables, respectively, i and q are the number of input and output indicators, including k input indicators, l1 desirable output, and l2 undesirable output indicators; xio, , and are the optimal values of input, desirable output, and undesirable output, respectively; n is the number of DMUs of ULUE in this study; , , and are slack variables of input, desirable output and undesirable output, respectively. λj denotes the weight of the j-th DMU obtained through linear programming.
- 2.
- GML index
The method is derived from the Malmquist index, which was initially used to measure changes in the production efficiency of DMUs over time. However, the conventional Malmquist index is limited in its ability to handle undesirable output. Consequently, the Malmquist–Luenberger (ML) index was introduced. However, it does not resolve the issues of circularity and may encounter infeasible situations when solving linear programming. Oh [45] integrated a global perspective technology with the directional distance functions to propose the GML index, which is used to evaluate efficiency changes at the factor level [46,47]. This enables the comparison of DMUs within the global reference set, effectively addressing the limitations present in the ML index. Additionally, the GML index can be decomposed into the efficiency change (EC) and technical change (TC) index, providing a more comprehensive analysis of dynamic changes. Based on this, EC can be further decomposed into pure technical efficiency index (PEC) and scale efficiency index (SEC), and TC can be further decomposed into pure technical change (PTC) and scale technical change (STC) [48,49].
The GML index is derived from the global directional distance function, which is based on the global production possibility set PG (x):
where the changes in the GML index from period t to t + 1, denoted as GML t to t + 1, measure the efficiency change in each DMU over these two periods. If the value of GML is greater (less) than 1, it indicates an increase (decrease) in efficiency, while GML = 1 indicates no change in ULUE. Here, x, y, and b represent DMUs’ input, desirable output, and undesirable output, respectively; β represents the value of the directional distance function, which aims to maximize desirable output and minimize undesirable output.
3.3.2. KDE
KDE is a powerful nonparametric method for estimating probability density functions [50]. Given a set of random variables, it constructs a continuous density curve to depict their distributional patterns. The estimated density is given by
where is the estimated probability density. The Kernel function, denoted by K, is a function of the bandwidth h. Here, i denotes the sample index; n denotes the number of observed values. The parameter h is the bandwidth of the Kernel, which determines the smoothness of the underlying probability distribution: a larger h produces a smoother distribution.
This study employs KDE to capture the dynamic evolution of ULUE. A leftward or rightward shift in the density curve indicates a sustained increase or decrease in overall efficiency. A flattening or steepening of the main peak reflects a widening or narrowing of regional disparities. The emergence or disappearance of multiple peaks signals a polarization or convergence, while longer or shorter tails point to expanding or shrinking efficiency gaps.
3.3.3. OPGD
To accurately identify spatial correlation and heterogeneity between potential influencing factors and the target variable, this study employs the OPGD model proposed by Song et al. [51] as an extension of the geographical detector [52]. The OPGD model optimizes spatial parameters to avoid subjective bias in discretization, thereby providing more rigorous technical support for analyzing the driving mechanism. Statistical significance is assessed via Monte Carlo simulations that construct a q-distribution, with p < 0.05 confirming that the explanatory power is non-random.
(1) Parameter Optimization
Parameter optimization comprises variable discretization optimization and spatial scale optimization, enhancing the extraction of geographical attributes and intrinsic information from spatial explanatory variables. Five distinct discretization methods are used—natural breaks, standard deviation, geometric, quantile, and equal interval—within the number of classes uniformly set between three and eight to improve the accuracy and interpretability. The parameter combination that yields the maximum q value from the factor detector is selected as the optimal discretization parameter set.
(2) Factor Detection
Factor detection identifies the dominant factors of ULUE, while interaction detection examines pairwise factor interactions. The q-statistic quantifies the degree of spatial heterogeneity. The formula used was as follows:
where q is the q-statistic, with values ranging from 0 to 1; N represents the number of units, and σ2 denotes the response variance. The study area is stratified into L distinct strata (h = 1, 2, …, L). The notations and N refer to the variance and number of units within stratum h, respectively. SSW is the within-sum of squares, while SST is the total sum of squares.
(3) Interaction Detector
The interaction detector identifies the nature of interactions between two individual factors by comparing their q-statistics when they act independently versus collectively. Interactions are classified into five types: nonlinear-weakened, uni-variable weakened, bi-variable enhanced, independent, and nonlinear-enhanced, following the criterion of Song et al. [51].
3.3.4. Methodological Complementarity
Each method has distinct limitations. The super-SBM model provides a static efficiency. The GML index introduces the temporal dimension by measuring productivity change; however, as a frontier-based “black box,” it quantifies change without revealing its causes. KDE is a descriptive tool constrained by bandwidth sensitivity and boundary effects. OPGD is inherently cross-sectional, which limits its ability to capture temporal dynamics and spatial dependence; it quantifies the explanatory power of individual factors on spatial heterogeneity and detects interaction effects, but its reliance on cross-sectional data restricts the analysis of temporal dynamics. Critically, the integration of these methods forms a coherent framework. This multi-method design enables a temporally dynamic, spatially explicit, and mechanistically informed assessment of ULUE.
3.4. Establishment of ULUE Evaluation Indicators
From a sustainability perspective, ULUE in CCCs is defined as the efficiency with which land benefits are maximized while maintaining ecological health and generating socio-economic and cultural value. Based on the principles of authenticity, accessibility, consistency, and representativeness, 29 indicators (Table 1) were selected through principal component analysis and ridge regression.
Table 1.
Evaluation index system for ULUE.
(1) Inputs
Land, labor, and capital. They are the classical production factors. In economic research, land, as the most basic factor of the production process, must be studied together with labor force and capital inputs [53,54]. Urban construction land is used to represent land input, as it serves as the spatial foundation of production and living space in each region. The integration of labor and capital as production factors affects the economic efficiency and competitiveness of a country or region. Therefore, this study selected the number of employees in secondary and tertiary industries to represent effective labor input, with fixed assets and real estate development investment serving as capital indicators.
Energy. Although energy is often excluded from production functions in several theoretical growth models, it is increasingly recognized for its impact on ULUE [46]. Given canal cities’ strong dependence on water and electricity, total water consumption and total electricity consumption are selected as energy input variables [55].
Technology and education. These factors are also treated as input variables, measured respectively by technological investment and educational investment [20]; the spatial flow of science and education they enable serves as key drivers of ULUE improvement.
(2) Desirable outputs
Desirable outputs. They represent positive externalities of land use. Economic benefit reflects the economic outcomes of ULUE, which can be measured by industrial structure, urban economy, and resident wealth. Social benefit captures the services and welfare generated for the population, measured by infrastructure level, social development, and fundamental public services. Environmental output reflects the positive environmental friendliness of public services. Cultural benefit reflects the transformation of land-based cultural heritage into socio-economic and cultural value.
(3) Undesirable outputs
Undesirable outputs represent negative externalities of ULUE. Environmental pressures reflect the interference of land use on the environment, including traditional pollution emissions as well as urban metabolic indicators (such as energy consumption intensity and carbon emission intensity). Socio-economic pressures reflect the social costs and stress arising from the development process. Population density is treated as a pressure indicator, as excessive density can strain infrastructure and livability [56]. Housing costs and unemployment reflect housing affordability crises and labor market failures. These pressures are rooted in land development patterns.
The measurement of ULUE proceeds as follows: First, data are normalized to eliminate dimensional effects. The normalized inputs, desirable outputs, and undesirable outputs are then entered into the predefined non-oriented super-SBM model under variable returns to scale (VRS) for estimation, yielding a static efficiency score ρ, where ρ ≥ 1 indicates relative efficiency. Dynamic ULUE is subsequently assessed through the GML index, which quantifies intertemporal total factor productivity change and is decomposed into EC and TC to uncover driving factors.
3.5. Influencing Factors
Based on the aforementioned theoretical analysis, the following influencing factors were selected in this study (Table 2). (1) Economic development has both positive and negative effects [57]. First, it accelerates land circulation and enhances utilization efficiency. Conversely, rapid economic growth may also intensify the supply–demand tensions, which is not conducive to ULUE improvement. (2) Technological innovation is the key driving factor of efficient land use and can be effectively promoted through the application of scientific and technological advances [28]. (3) Urbanization level captures the dynamics of population concentration and spatial expansion. These processes reconfigure land demand and resource allocation across regions, which in turn influence land use. (4) Investment scale can contribute to urban socio-economic development, thus enhancing ULUE [31]. (5) Industrial structure upgrading promotes the efficient allocation of land resources by optimizing land use structure. (6) Urban construction land expansion drives economic growth; however, it also constrains ULUE improvement [29]. (7) Government regulation plays an essential role: subsidies and incentives can raise ULUE and facilitate technology diffusion in land use, though their overall effect remains nuanced [58].
Table 2.
Description of indicator variable.
4. Results
4.1. Descriptive Analysis of ULUE
4.1.1. Temporal Characteristics of ULUE
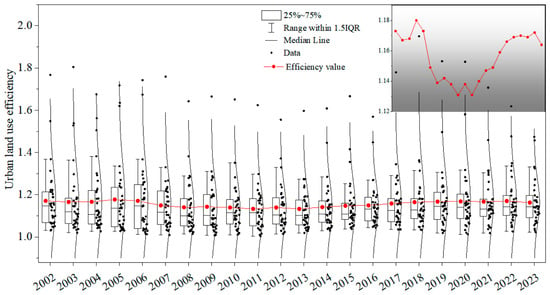
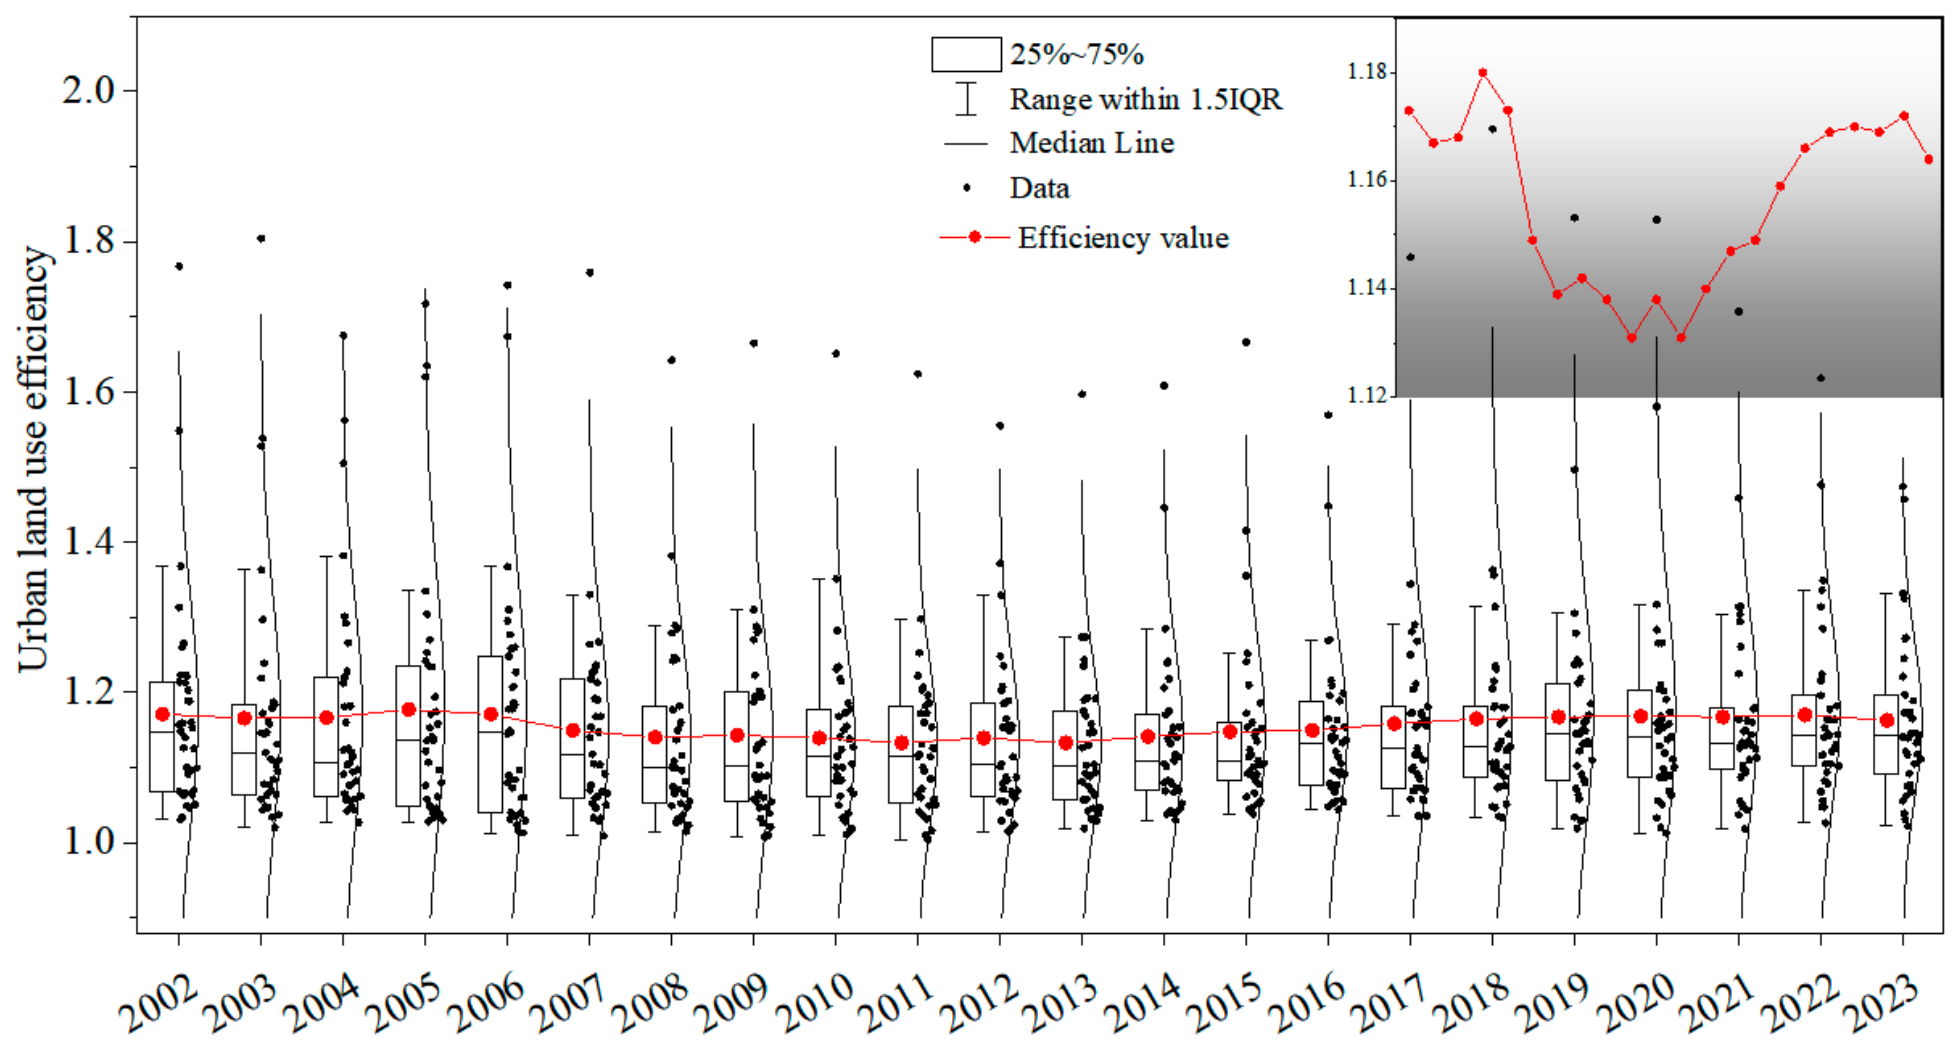
The annual mean of ULUE in CCCs fluctuated between 1.131 and 1.180 from 2002 to 2023, exhibiting an overall “V-shape” trend (Figure 3). The value in 2023 remained below that of 2002. From 2002 to 2012, ULUE declined from 1.173 to 1.138. This drop coincided with rapid urbanization, during which urban expansion prioritized economic growth. Land policies at the time favored scale over efficiency, and inefficient expansion of outputs combined with an imbalanced output structure reduced overall performance. From 2012 to 2023, ULUE recovered, rising from 1.138 to 1.164. This shift aligned with a broader policy emphasis on high-quality development. Improvements were achieved through optimized input structure, better output quality, and supportive local policies.
Figure 3.
Box chart of ULUE in CCCs.
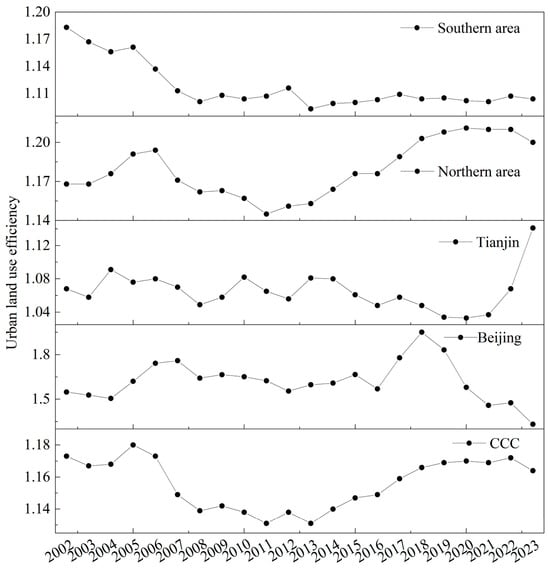
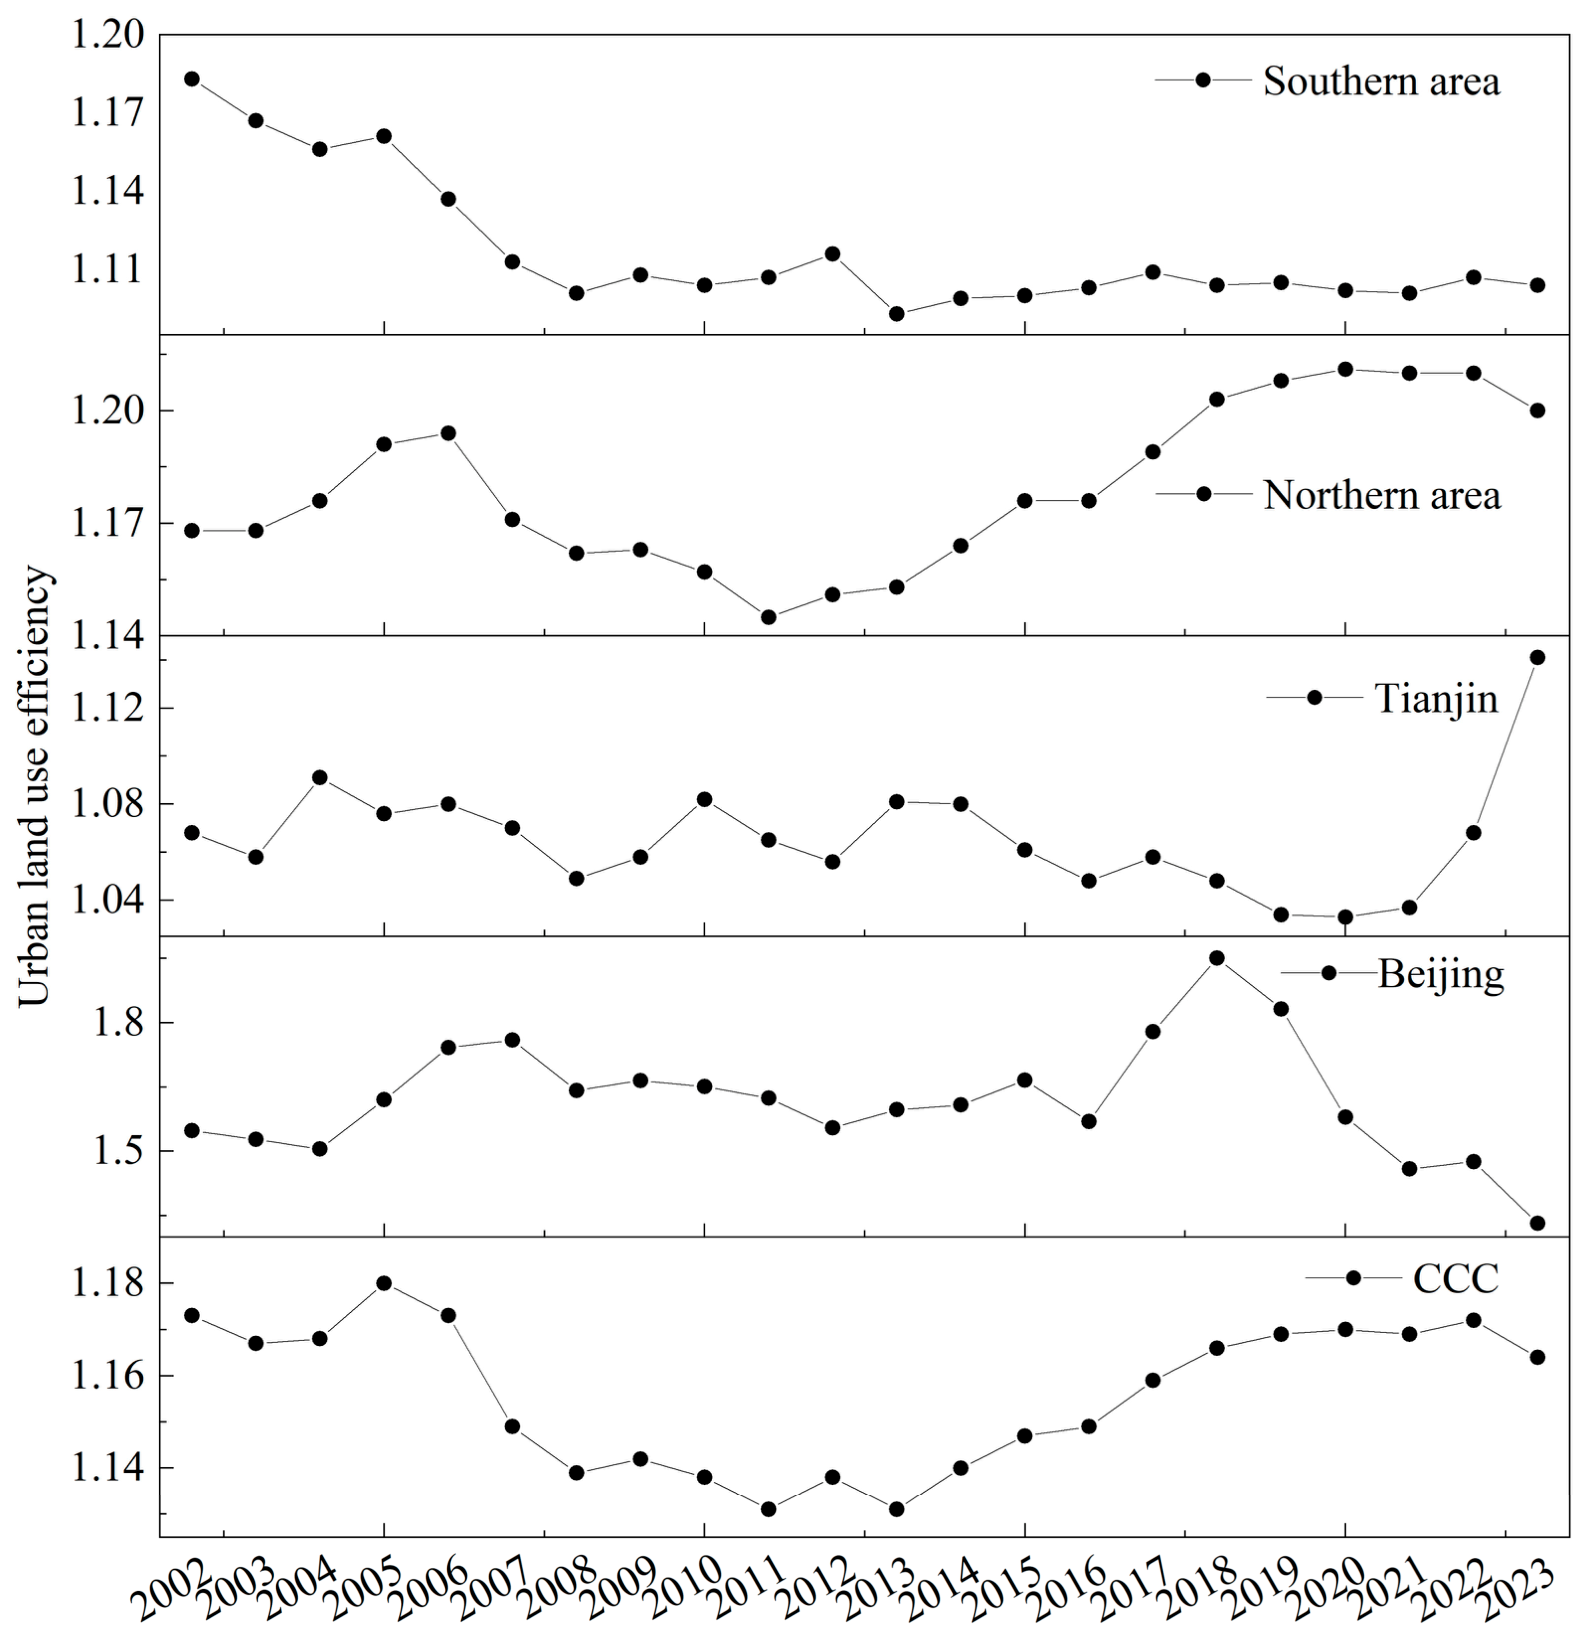
A clear north–south division emerged. In the north, ULUE trended upward, increasing from 1.168 to 1.200 (Figure 4). Beijing, the core of the Canal Culture Belt, recorded a notably high average of 1.622, reflecting efficiency gains parallel to broader economic advancement. Tianjin exhibited a contrasting trend, declining from 1.068 in 2002 to 1.033 in 2020 and before recovering to 1.141 in 2023. In the south, however, ULUE fell rapidly from 1.183 to 1.104. This decline indicates that efficiency is not proportional to economic development. It suggests that the land system plays a more decisive role than the economic scale itself.
Figure 4.
ULUE in different areas of the CCCs.
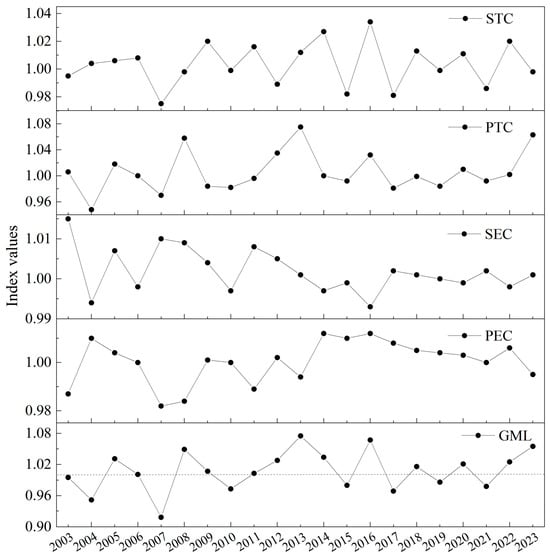
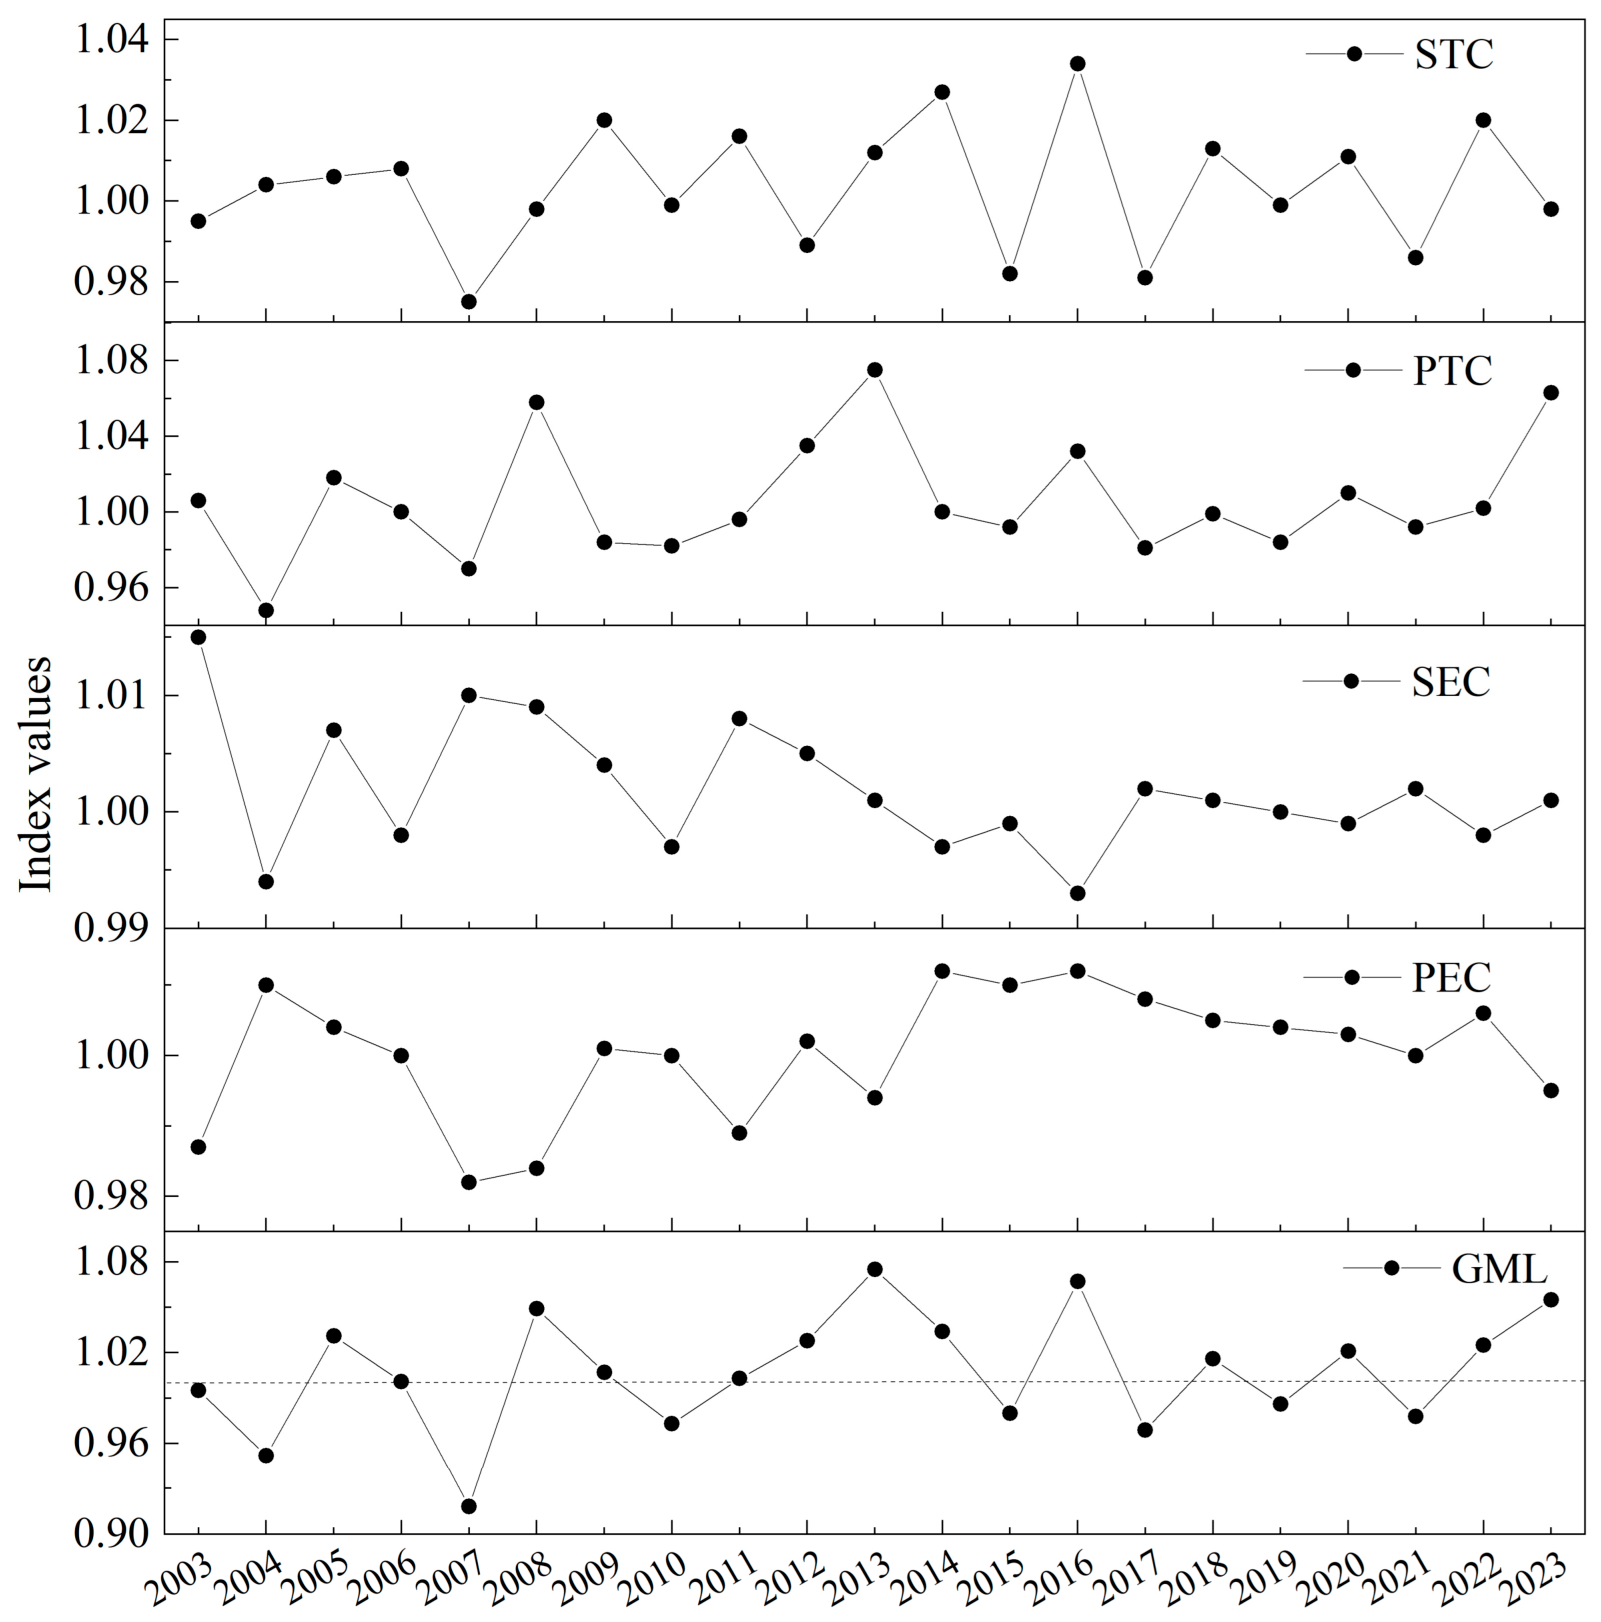
The GML index served as a measure of dynamic efficiency. Its mean value was 1.077, with an annual growth rate of 5.64%. It exhibited a slow, fluctuating trend from 2012 to 2023. Decomposition reveals that PTC entirely dominated the GML index, with superimposed influences of PEC from 2003 to 2011 and STC from 2014 to 2022 (Figure 5). This indicates that TC played an extremely important role. At a higher stage of urban development, local governments began to prioritize high-quality growth, particularly through the exploration of advanced planning technologies and increasing construction investment. These efforts continuously stimulated urban vitality and development potential, which in turn drove the steady upward trend of the GML index.
Figure 5.
GML index and its composite indicators from 2002 to 2023 in CCCs.
4.1.2. Spatial Pattern of ULUE
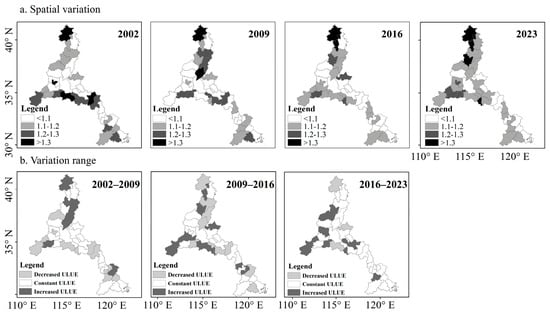
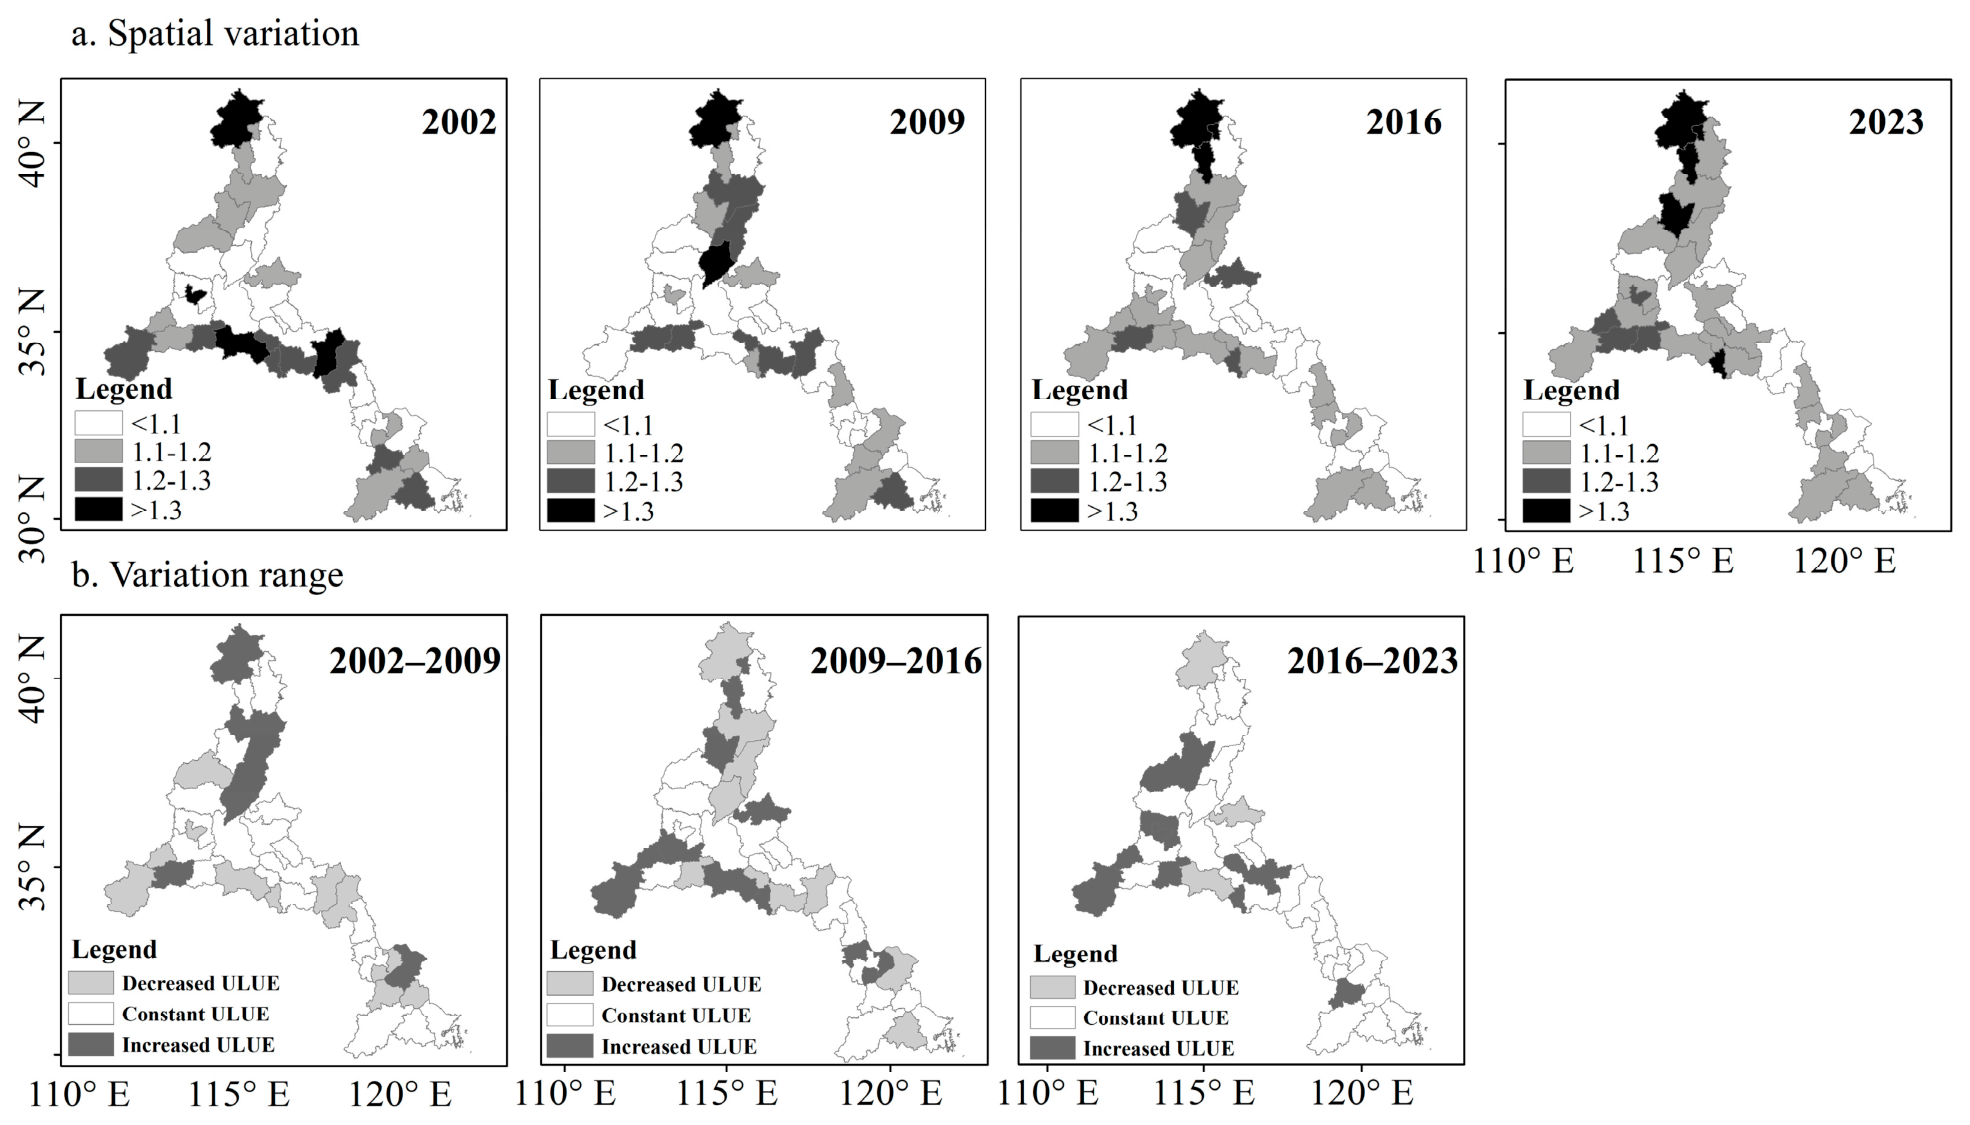
The spatial pattern of ULUE in CCCs is shown for 2002, 2009, 2016, and 2023. ULUE was grouped into four intervals: <1.1, 1.1–1.2, 1.2–1.3, and >1.3 (Figure 6a). ULUE showed a clear north-high and south-low spatial disequilibrium. Most northern cities had ULUE below 1.3 and southern cities below 1.2. Beijing recorded the highest efficiency, above 1.3. In recent years, Beijing has controlled urban sprawl while sustaining economic development, adopting land management policies and population influx control. These measures partly slowed land expansion driven by economic growth. This north–south gap stems from different regional development dynamics. Northern cities matched land development with economic growth, ensuring balanced factor input–output. Southern cities lagged due to underinvestment in land and weak technological innovation. Such constraints lowered land use output. Overall, the spatial pattern was shaped by policy orientation, regional development imbalances, and underlying endowments.
Figure 6.
Changes in the spatial distribution of ULUE in CCCs.
Figure 6b classifies ULUE into three groups: increased ULUE, constant ULUE, and decreased ULUE, revealing substantial shifts over time. From 2002 to 2009, only 17.14% of cities achieved improvements, while 31.43% fell into decreased ULUE. This reflects widespread productivity decline under an extensive, land-driven growth regime. From 2009 to 2016, 25.71% of cities still experienced decreased ULUE, pointing to persistent structural inefficiencies. A notable shift occurred from 2016 to 2023. The share of cities with increased ULUE rose to 28.57%, while those with decreased ULUE fell sharply to 8.57%. This progress marks a structural transition from early-stage efficiency deterioration to broad-based recovery. It demonstrates ULUE’s responsiveness to changing input–output configurations as urban development moves from factor accumulation to productivity-driven growth.
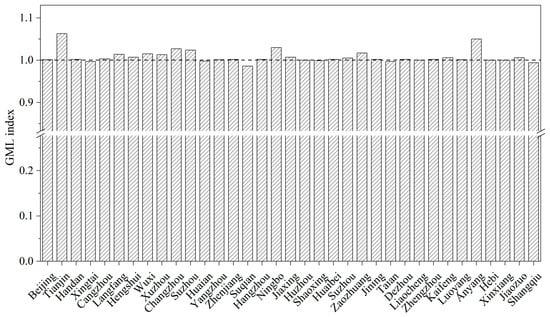
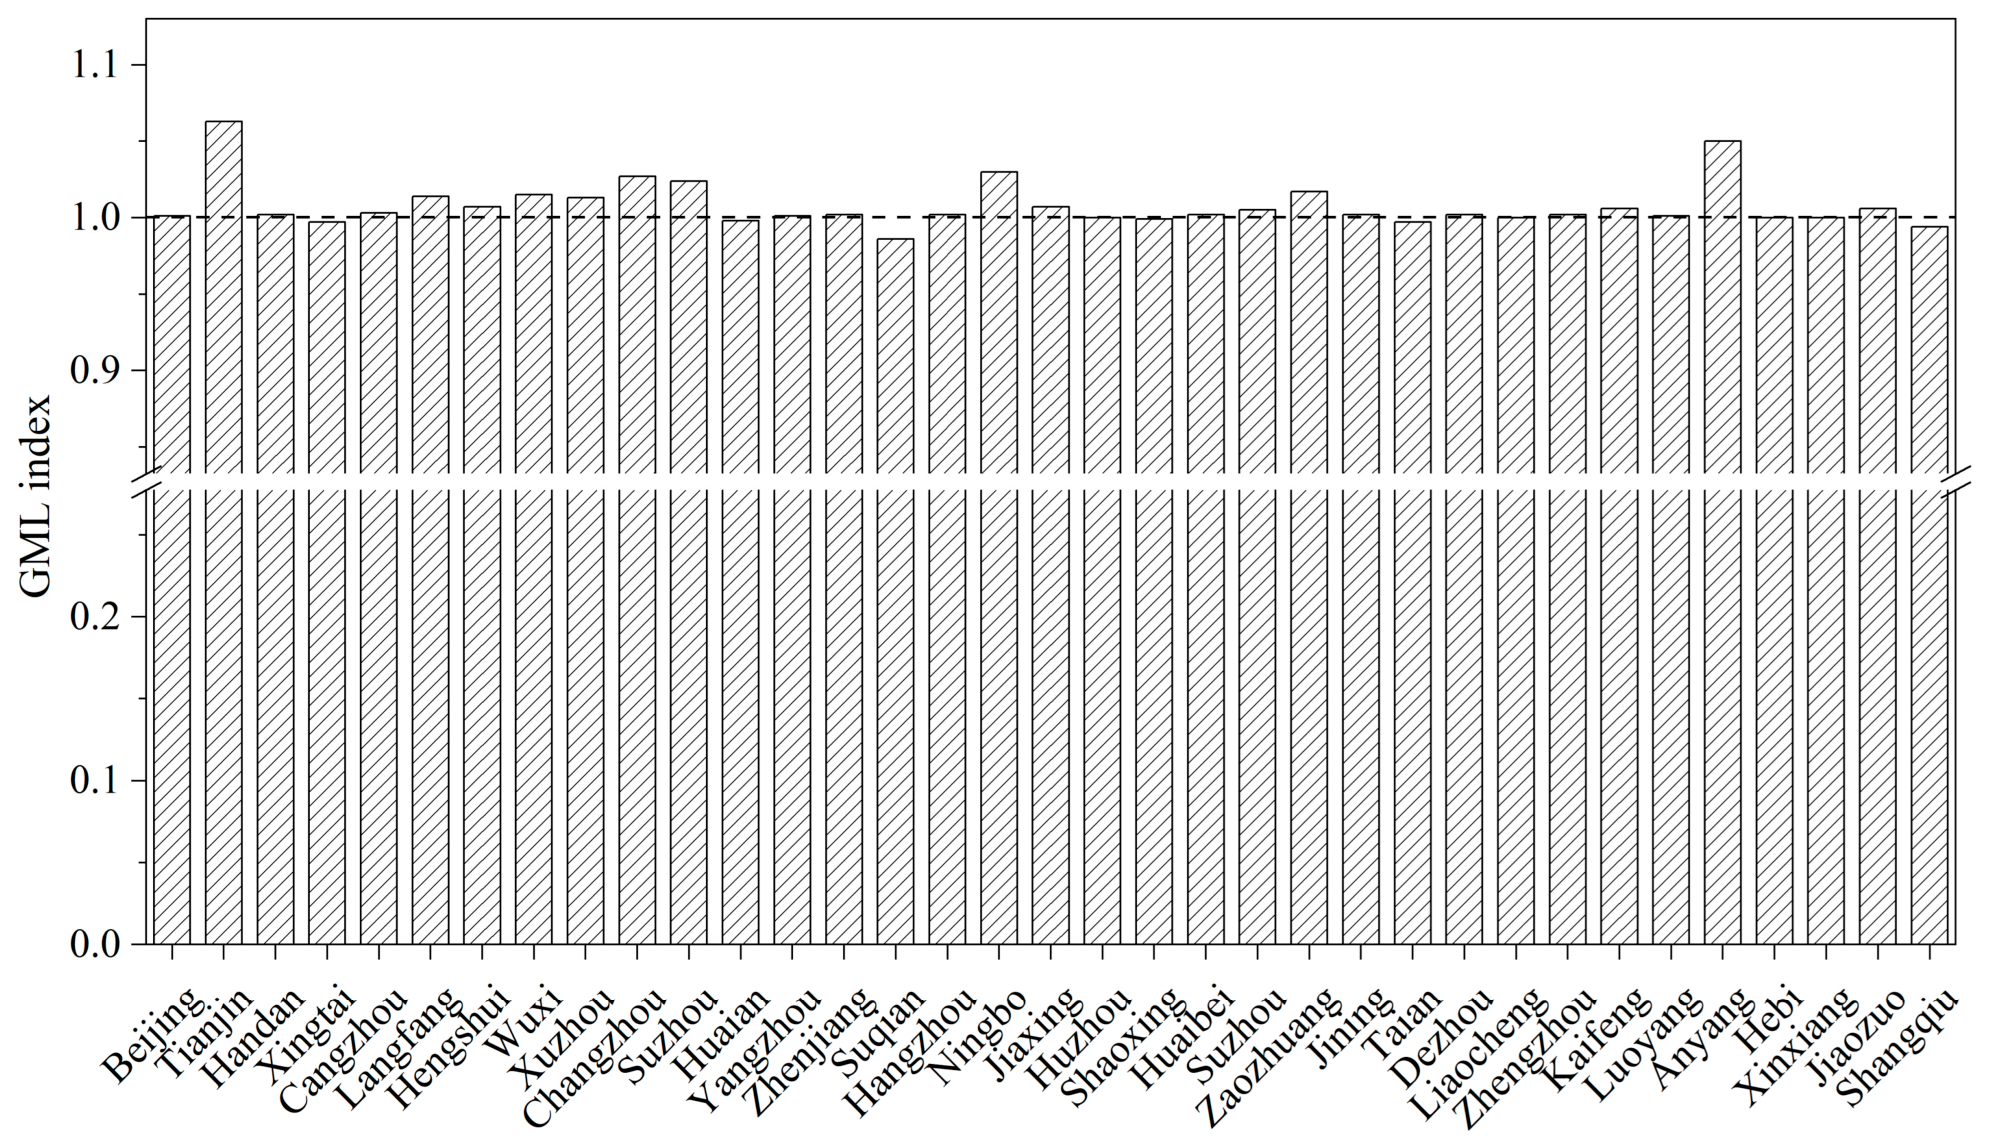
Figure 7 depicts the spatial analysis of the GML index in CCCs. The GML index exhibited negative growth in only 6 cities, attributable to input–output imbalance. In the remaining cities, the GML index values were greater than 1, indicating a positive growth trend. These changes in GML are mainly determined by PTC. The GML improvement is achieved through the outward shift in the production frontier, optimization of resource allocation, reduction in pollution and technology diffusion.
Figure 7.
Change in the GML index in CCCs.
4.2. Dynamic Evolution of ULUE
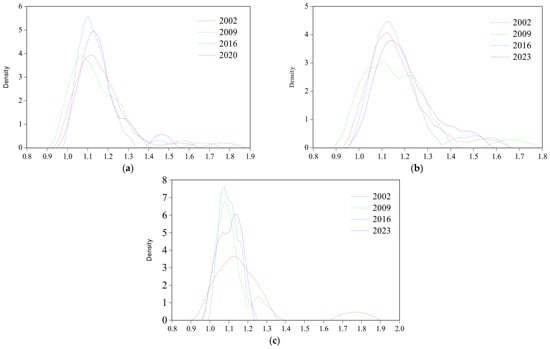
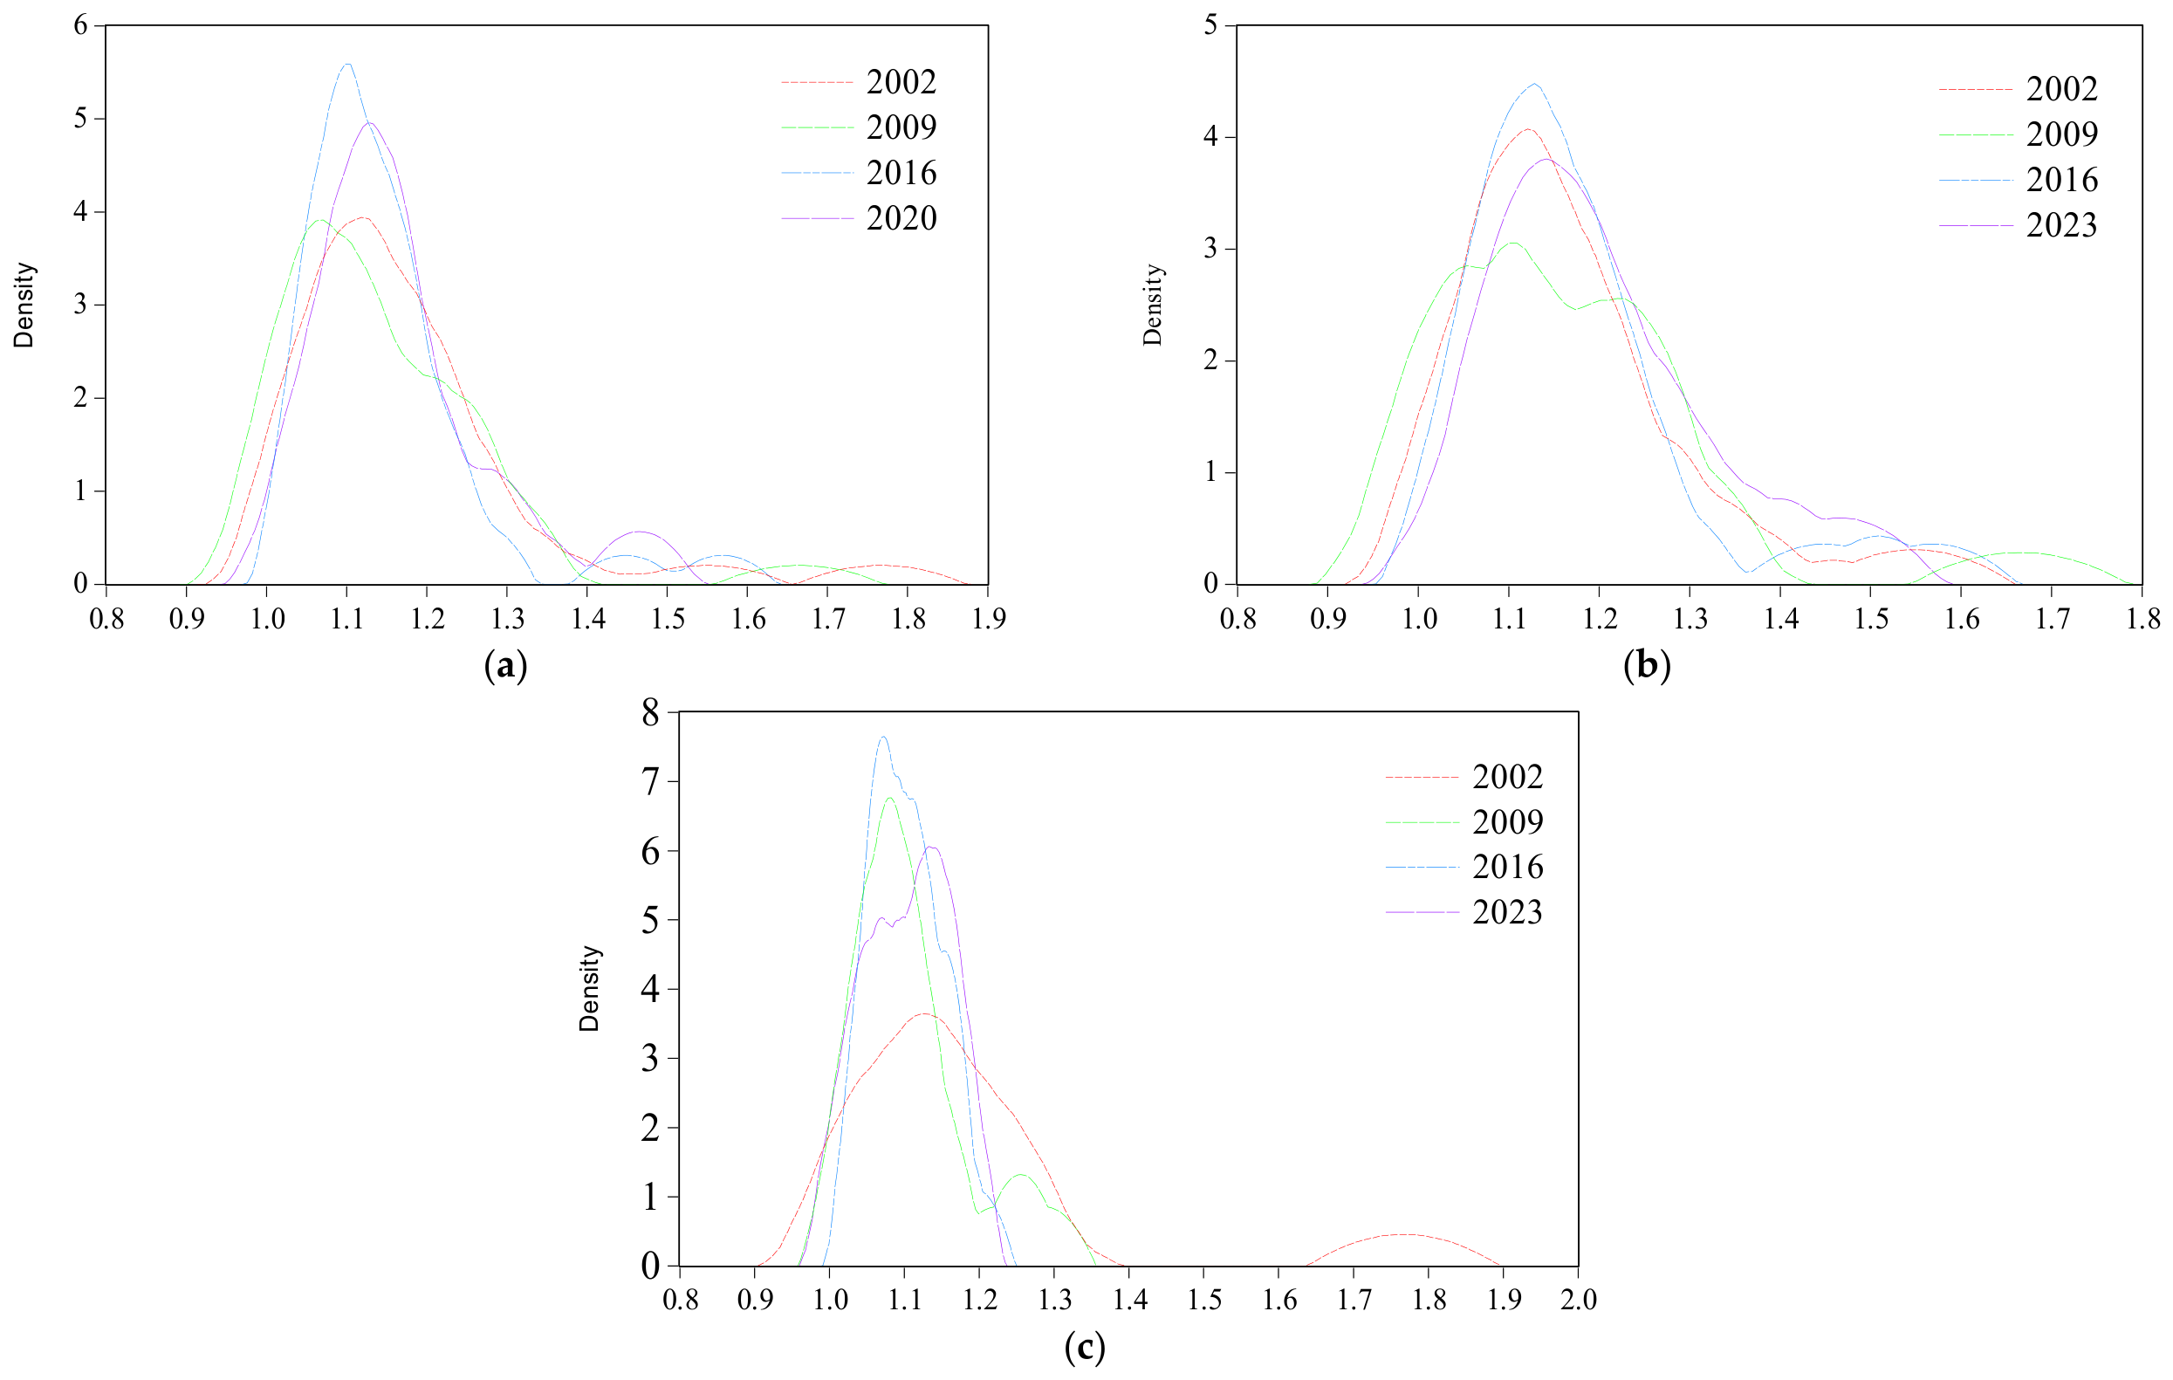
Figure 8 illustrates the dynamic evolution of the ULUE distribution. (1) The curve initially shifted leftward and then rightward. In CCCs, ULUE decreased from 2002 to 2009 and then increased from 2016 to 2023. A similar shift occurred in the northern area. In the southern area, however, the curve shifted only leftward, indicating a persistent decrease. (2) The main peak of the distribution remained generally flat, reflecting significant regional disparity within CCCs. The peak shape in the north was similar to that of the canal cities overall. In the south, the main peak transitioned from flat to steep and back to flat. This suggested pronounced intra-regional differences in 2002 and 2023, with a phase of convergence in 2009 and 2016. (3) The distribution exhibited a transition from bimodal to multimodal trend, indicating a shift from bipolar to multipolar differentiation at both local and regional scales. (4) A right-tailed extension was observed, confirming a clustering pattern characterized by a minority of high-efficiency cities.
Figure 8.
ULUE’s evolution. (a) CCCs. (b) Northern area. (c) Southern area.
4.3. Influencing Factor Analysis
4.3.1. Parameter Optimization
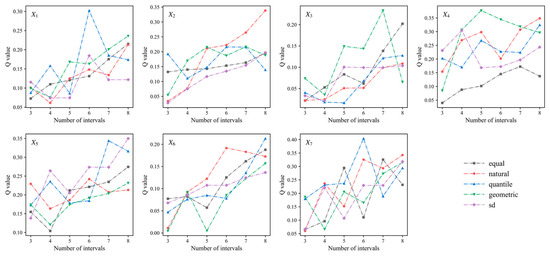
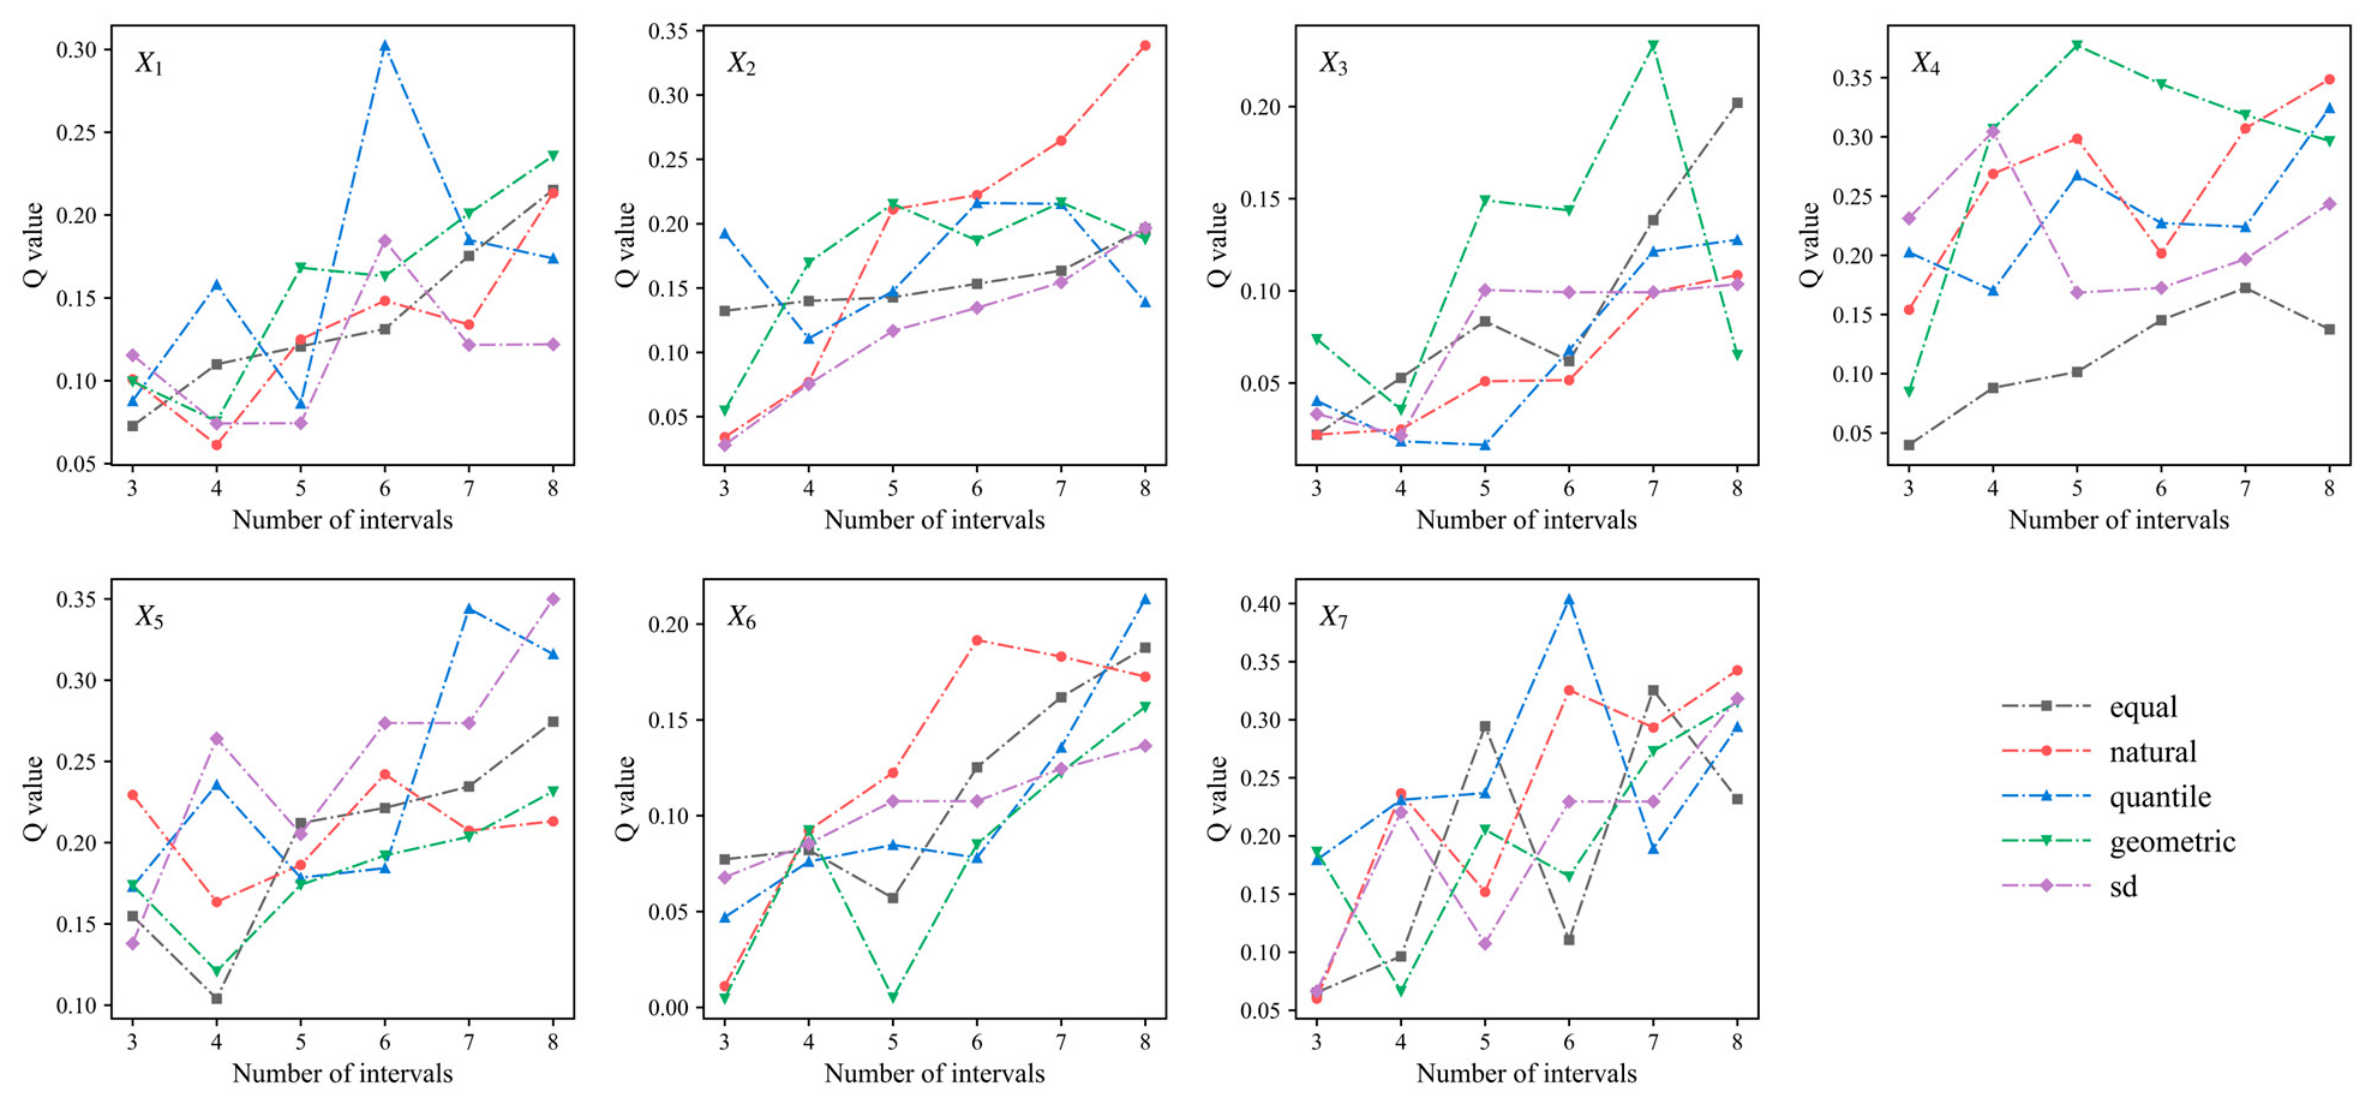
This study employed the OPGD model to assess factors influencing ULUE. The model handles both categorical and continuous variables. Categorical variables directly enter the model, while continuous variables require discretization. This optimal classification method and the number of intervals are selected to maximize the Q-statistic, as different explanatory variables lead to different breakpoints. Using 2023 as an example (Figure 9), this study shows discretization optimization for continuous explanatory variables in CCCs. X1, X6 and X7 employ the quantile method to balance the sample size across intervals. X2 adopts the natural breaks to capture the data’s hierarchical structure. X3 and X4 adopt the geometric method, matching their geometric growth pattern. X5 applies the standard deviation (SD) method to identify data dispersion and outliers.
Figure 9.
OPGD-based explanatory variables of ULUE changes (economic development X1, technological innovation X2, urbanization level X3, investment scale X4, industrial structure X5, spatial structure X6, government regulation X7).
4.3.2. Factor Detection Analysis
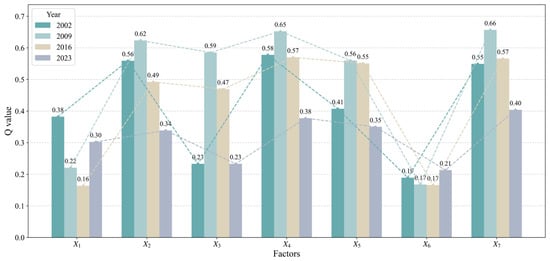
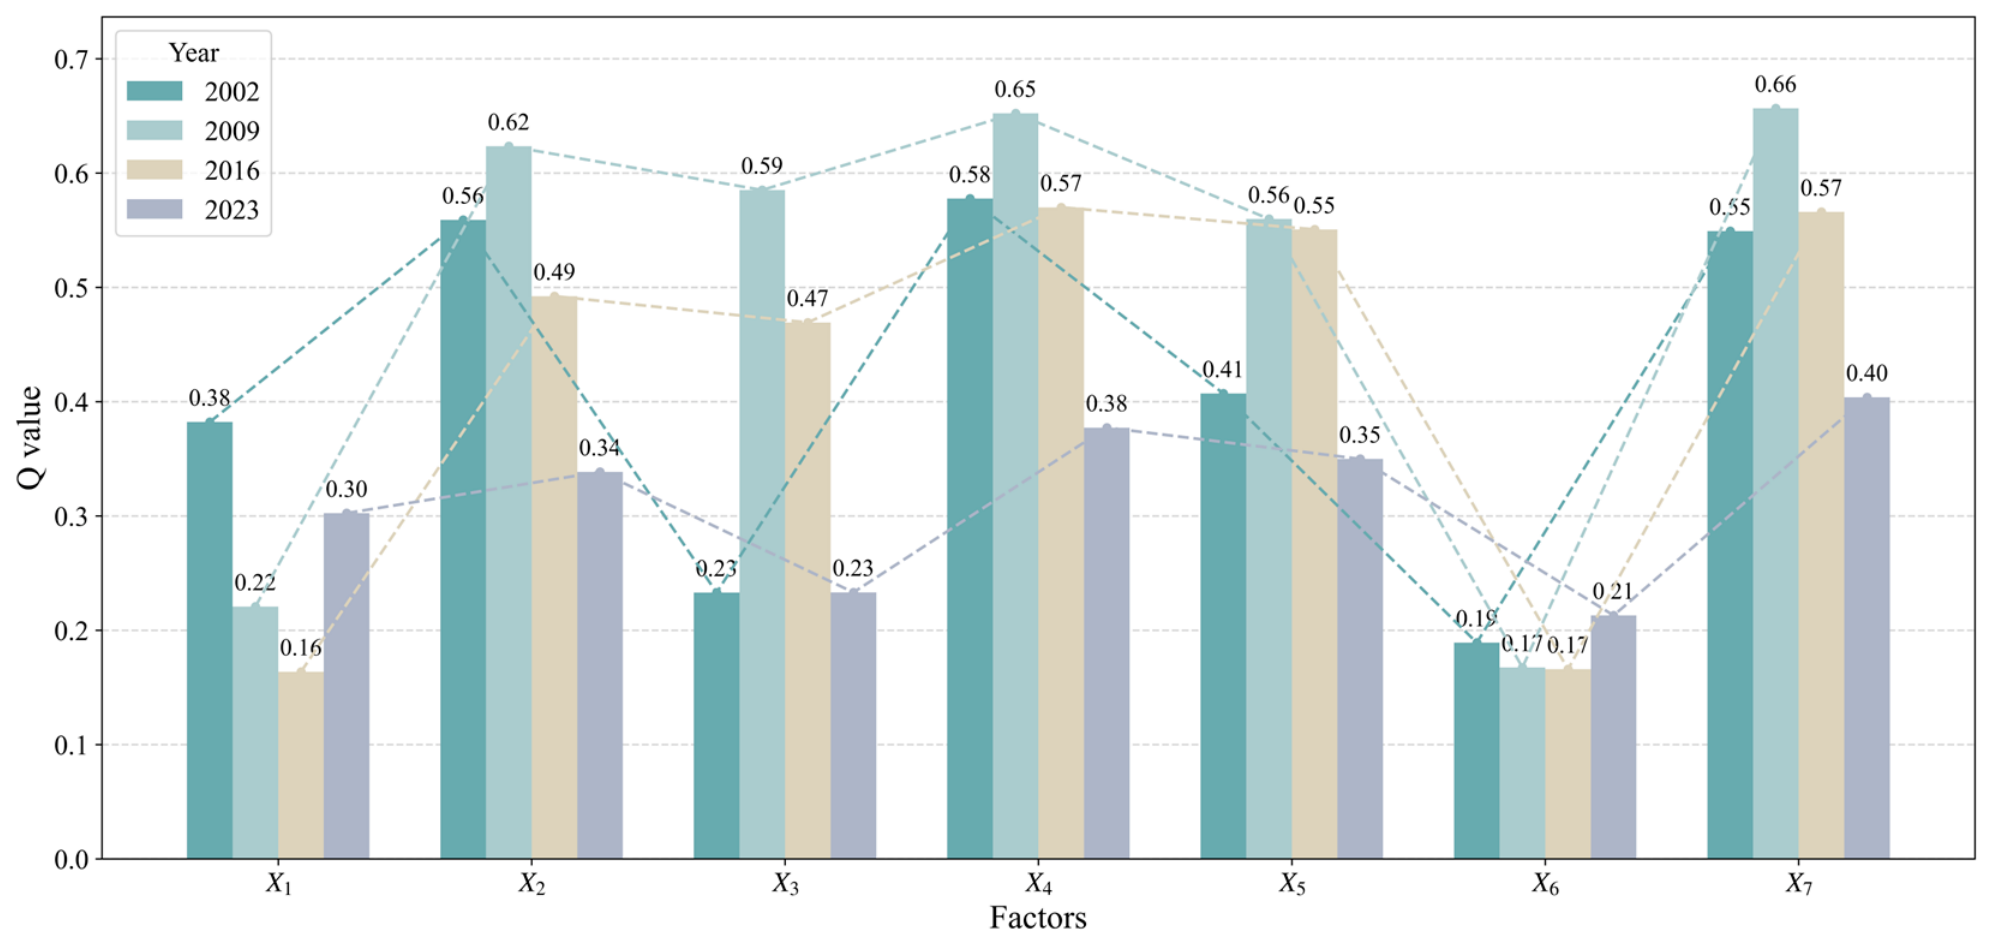
Factor detection evaluates the explanatory power of each factor through Q-values, significance level, and factor ranking. As shown in Figure 10, all selected factors significantly explain ULUE’s spatial distribution (p < 0.05). X7 and X4 are the dominant factors, with the highest Q-values, explaining over 50% of the explanatory power. These variables are identified as “policy guiding factors”. Through institutional supply such as land use planning, industrial policies, and ecological protection, the government defines land use functions, development intensity, and allocation rules. Its direct investment flows correct resource misallocation and drive urban renewal, thus shaping the spatio-temporal evolution of ULUE. The explanatory power of X2 and X5 exceeds 45%. These are referred to as “technological driving factors”. Technological innovation upgrades land use efficiency. Industrial optimization reconfigures industrial space, enabling efficient land allocation. X3, X1, and X6 have lower Q-values. These are foundational constraining factors, serving as “spatial structure adaptation factors”. Urbanization level determines land intensification. Economic development sets land demand and expected benefits. Spatial structure affects accessibility. According to spatial economics theory, favorable spatial compatibility reduces transaction costs and generates agglomeration effects, supporting both policy implementation and innovation.
Figure 10.
Q-value of single variables on ULUE changes investigated by the factor detector.
4.3.3. Interaction Detection Analysis
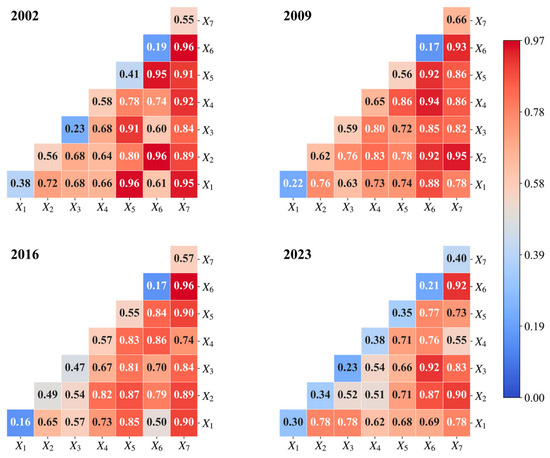
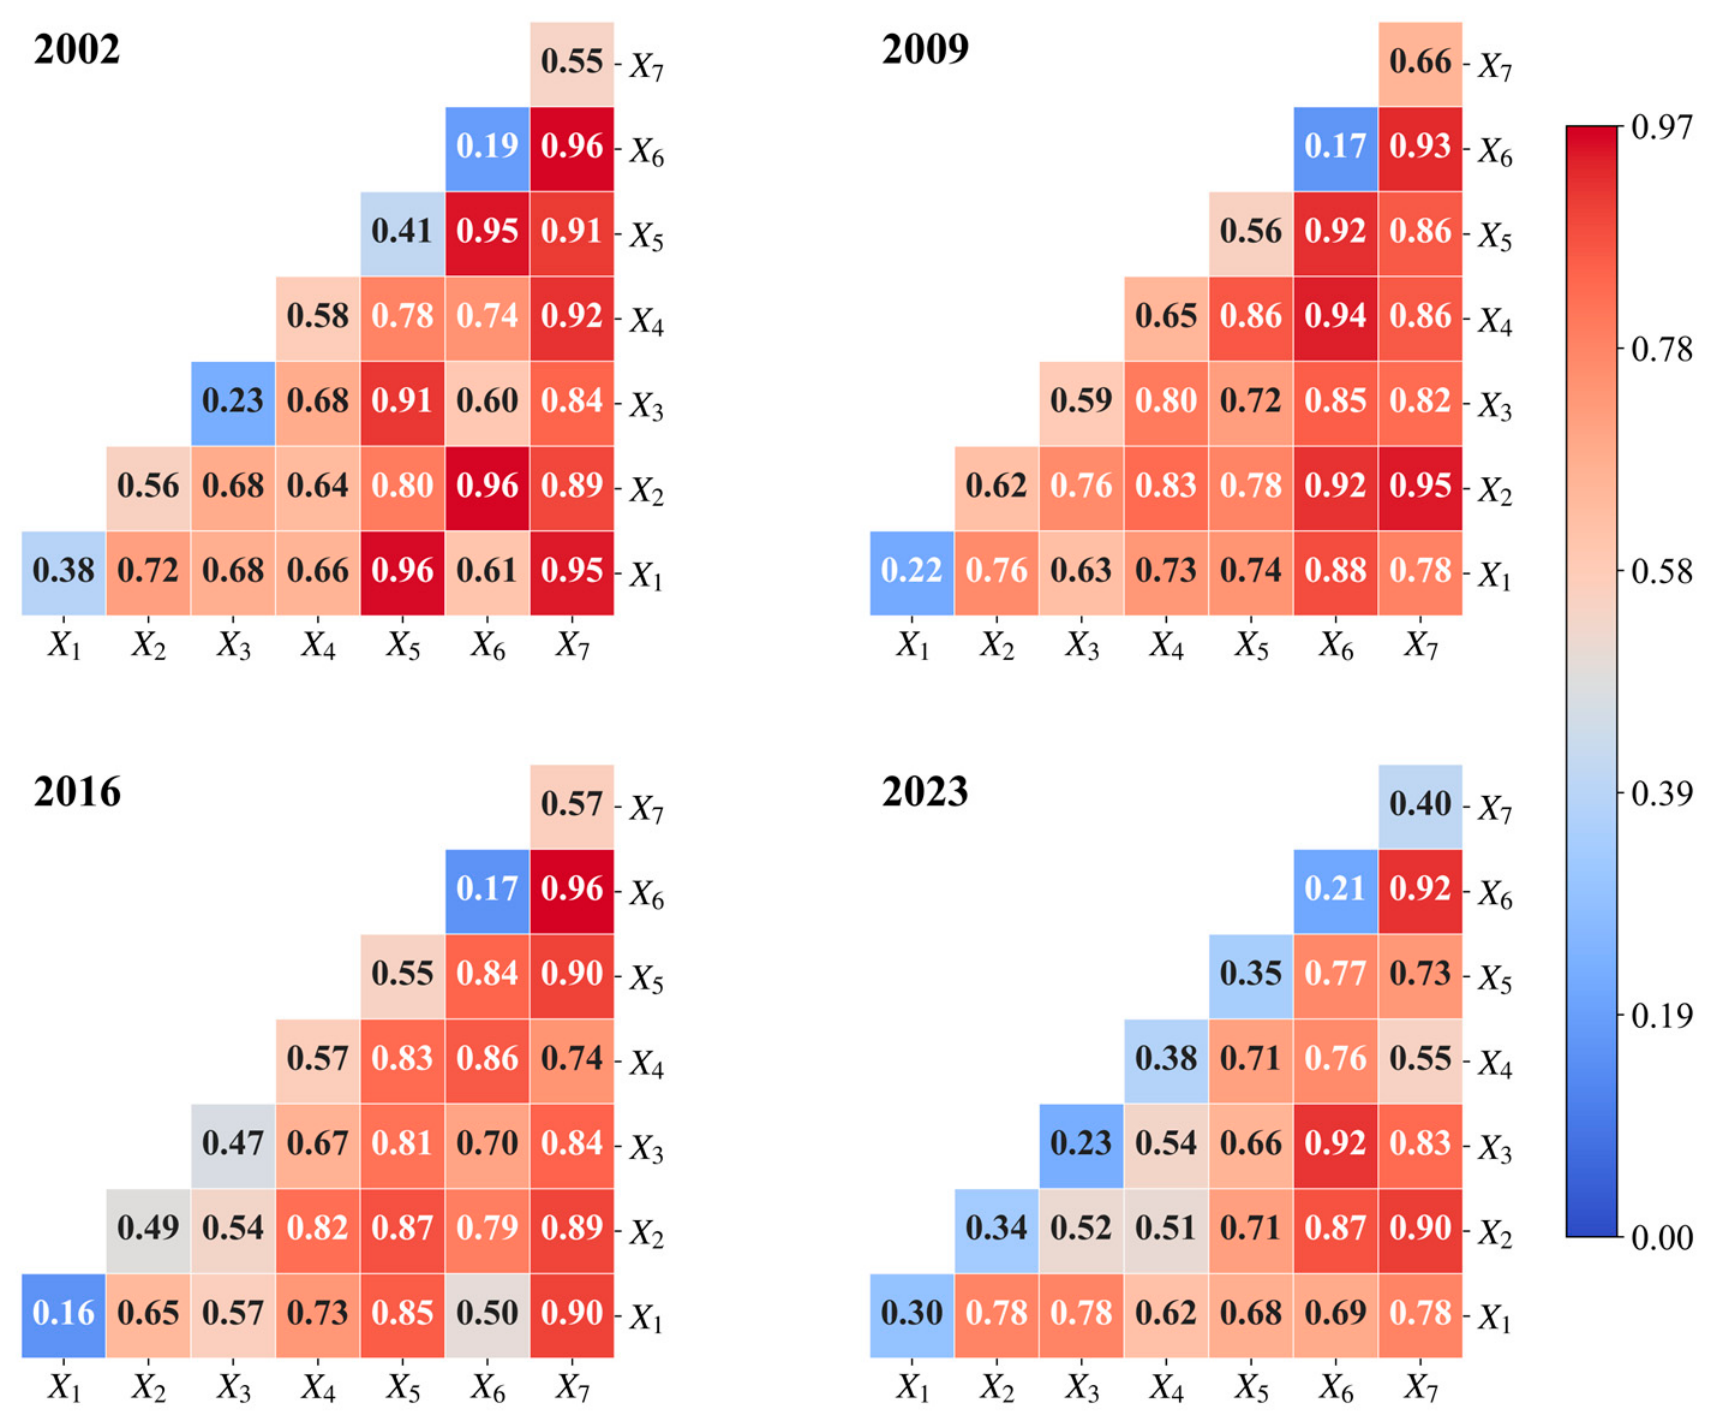
Interaction detection analysis reveals that ULUE in CCCs is driven by pairwise interaction effects, which show pronounced spatial heterogeneity (Figure 11). The interaction between X7 and other factors is the strongest, followed by the interaction between X6 and other factors from 2002 to 2023. No nonlinear-weakening or independent relationships were observed. Furthermore, the marginal contribution of these interactions consistently exceeded that of any single factor, confirming that interactive effects dominate ULUE dynamics beyond individual drivers. In 2002, interactions were primarily uni-variable weakened, though some bi-variable enhancement occurred. Interaction levels remained high. For instance, X7∩X6 and X7∩X5 both reached 0.96, indicating a synergistic effect. This suggests that early-stage ULUE was highly sensitive to coupled changes in government regulation, spatial structure, and industrial structure. In 2009, a significant nonlinear enhancement pattern became dominant. X7 interacted strongly with X2 (0.95) and X6 (0.93). X6 also showed relatively notable interactions with X4, X5 and X2. These patterns indicate that government regulation and spatial structure acted as hubs, amplifying the effects of technological innovation, investment scale, and urbanization level. In 2016, the nonlinear enhancement pattern continued. X7∩X6 (0.96), X7∩X5 (0.90), X7∩X1 (0.90), and X7∩X2 (0.89) were closely related. This reflects a shift from factor-driven expansion to system-coupled optimization, driven by the superimposition of government regulation with other factors. In 2023, both nonlinear and nonlinear-enhancement and bi-variate enhancement coexisted. Prominent interactions included X7∩X6 (0.92), X7∩X2 (0.90), and X6∩X3 (0.92). This indicates that under an increasingly rational spatial structure, the synergy between regulation and technology has become the decisive driver of high-quality ULUE growth.
Figure 11.
Interaction detector results on ULUE changes.
However, we note a brief reflection here. From an ecosystem service planning perspective, it remains unclear whether the observed synergies truly enhance service values or simply reflect regulatory interventions that neglect trade-offs. Adaptive governance recognizes these strong interactions as path-dependent and contextually embedded, whereas static planning methods fail to capture the iterative learning and negotiation that such complexity demands.
5. Discussion
5.1. Comprehensive Analysis of the Super-SBM and GML Index Models
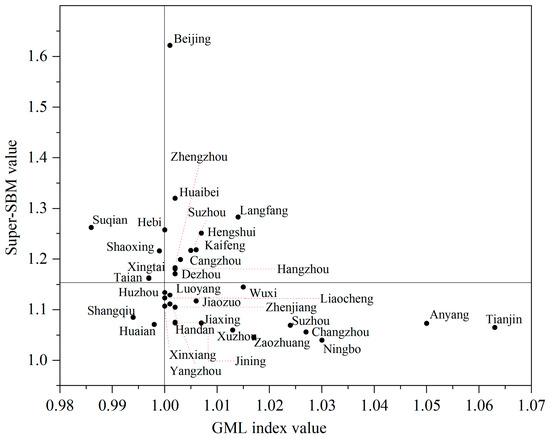
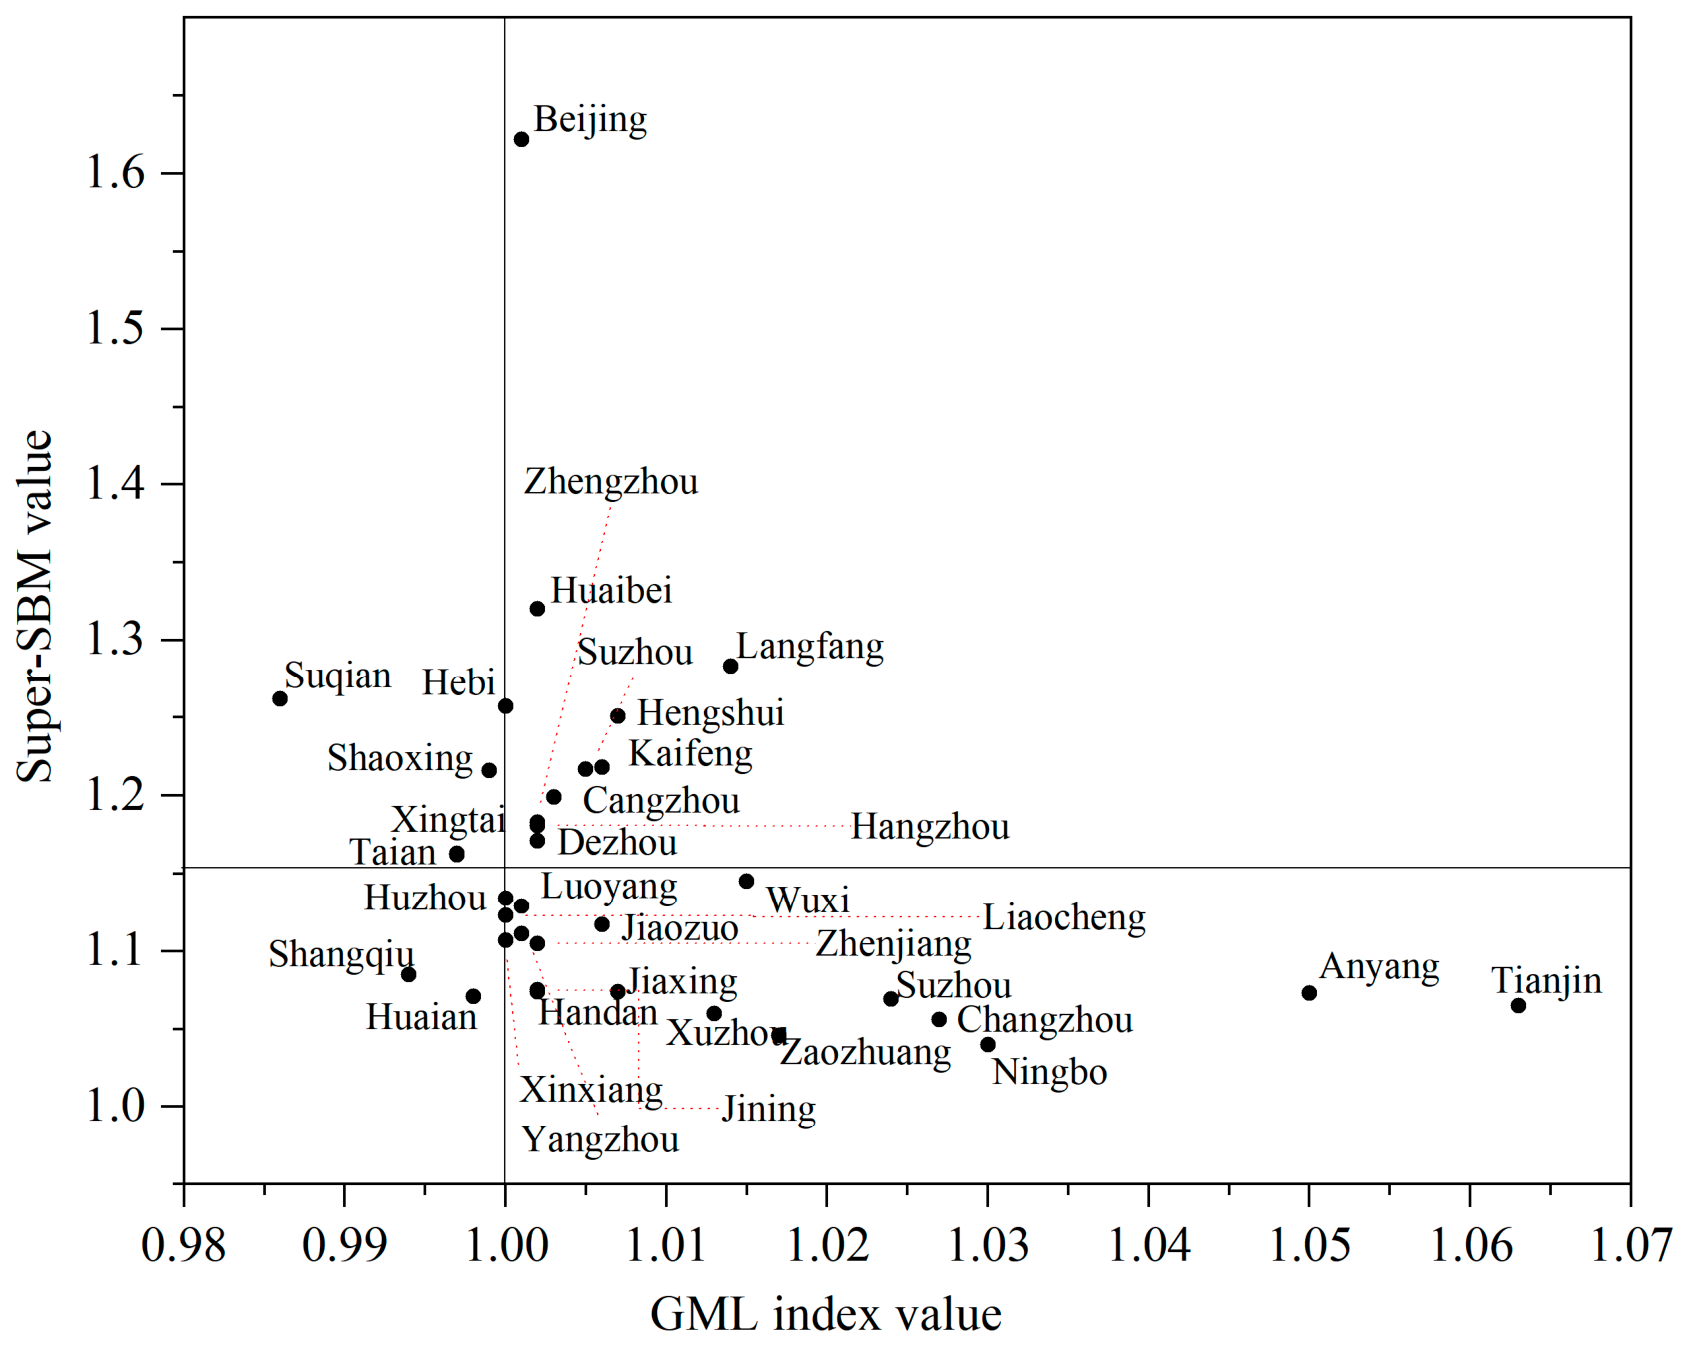
Combining the super-SBM and GML index models reveals their complementarity and uncovers the dynamic behind ULUE evaluation. A four-quadrant analysis is proposed to guide government improvement interventions. Super-SBM values (vertical axis) and GML index values (horizontal axis) form a two-dimensional matrix. The threshold for the vertical axis is the mean super-SBM value, while the horizontal axis threshold is GML = 1. Based on these thresholds, the 35 canal cities are divided into four groups: the first quadrant—high–high matching type (HH, super-SBM > mean and high GML > 1); the second quadrant—high–low mismatch type (HL, super-SBM > mean and GML < 1); the third quadrant—low–low matching type (LL, super-SBM < mean and GML < 1); and the fourth quadrant—low–high mismatch type (LH, super-SBM < mean and high GML > 1). Figure 12 shows a comprehensive analysis of ULUE changes, offering strategic insights for future land use decisions.
Figure 12.
Matrix scatter plot of super-SBM and GML index.
The first quadrant represents the high-efficiency high-growth matching type. It contains 10 cities, whose drivers show significant differentiation. Among them, developed cities such as Beijing, Suzhou, Zhengzhou, and Hangzhou facilitate high-quality spatial evolution through high-end industries, technological innovation, and environmental governance. This is primarily due to their effective allocation of production factors, including energy, technology, and capital. Moreover, they achieve an optimal allocation that balances the maximization of desirable outputs with the minimization of undesirable outputs in the urban development process. In cities such as Langfang, Hengshui, Cangzhou, Kaifeng, and Dezhou, the pace of land use development aligns with economic growth. Land use is intensive and orderly, avoiding large-scale sprawl. Ecological pressure remains reasonable, thereby building high efficiency. Driven by growth momentum from regional cooperation and industrial development, the GML rises steadily. Studies confirm that network structures facilitate the cross-regional flow of production factors. This drives spatial differentiation and efficient functional allocation, which is consistent with findings in the Atlantic region [32]. Specifically, Beijing and Hangzhou have demonstrated high levels of ULUE through land control and the concentration of high-end and high-tech industries. Zhengzhou optimized land allocation through “standard land” policies, advanced technological transformation and maximized the hub value of “railway–canal” intermodal transportation. Kaifeng activated its industrial vitality by digitizing its canal culture. Therefore, the digital transformation of culture serves as a critical driver for improving ULUE.
The second quadrant refers to the high-efficiency, low-growth mismatching type, comprising the cities of Suqian, Shaoxing, Xingtai, Hebi, and Taian. This spatial heterogeneity is mainly attributed to the mismatch between current intensive and efficient land use and long-term growth momentum. Urban land scale and industrial layout are highly compatible with regional carrying capacities, endowing cities with strong competitiveness and considerable development potential. However, industrial path dependence, short-term orientation in land use, and spatial mismatches prevent the advantages of land use efficiency from being translated into sustained growth momentum. Specifically, Shaoxing’s textile sector requires targeted interventions. Key initiatives include accelerating innovation, cultivating top-tier talent, and enhancing the commercialization of scientific achievements, thereby optimizing the spatial structure of urban land use [6].
The third quadrant is the low-efficiency, low-growth matching type. It includes Huzhou, Shangqiu, and Huai’an, which exhibit low efficiency values and GML indices. They are primarily constrained by factor shortages, fragile industrial structure, and weak resource endowment transformation. Furthermore, the lack of an efficient land-water use system restricts agglomeration economy [59]. Therefore, it is imperative to optimize resource allocation, drive industrial restructuring, coordinate urban–rural land utilization, and revitalize underutilized land resources.
The fourth quadrant denotes the low-efficiency, high-growth mismatching type, including the remaining 17 cities. These cities exhibit low efficiency but high GML growth rates. Ningbo and Wuxi have a high share of industrial land and inefficient use [2]. Yet, they leverage advanced industrial restructuring and technological innovation to drive robust growth. Thus, it is essential to redevelop inefficient industrial land and optimize land structure. Prioritizing green industries and tapping intensive space potential are key. Furthermore, strengthening spatial planning and revitalizing underutilized land are necessary to improve the matching between intensive and economical land use. Underdeveloped cities rely on local resources but suffer from low efficiency due to capital and technology constraints. Therefore, targeted intensive land campaigns are needed to transform this potential into sustained, high-quality development.
5.2. The Underlying Mechanism of Urban Land Use Efficiency
Based on the aforementioned influencing factors and the four-quadrant analysis, this study identifies two differentiated generation patterns and further explores their underlying potential mechanisms.
(1) High-quality, sustainable development model driven by technological innovation
Based on the deep coupling of flow space theory with the other three theories, this represents an efficient development model that integrates governmental regulation, technological innovation, and spatial structure. The improvement of ULUE is reshaped by relying on flow space carriers such as digital technologies and ecological corridors, thereby achieving bidirectional empowerment between ULUE and high-quality urban development. Specifically, technical innovation breaks through technical bottlenecks in land use, driving the transition of land use patterns in canal cities toward refinement and efficiency. The cross-regional production factors within the flow space are accelerated, and the allocation of land and technical factors is further optimized; under innovation incentive policies, barriers to inter-regional factor flow are removed, providing robust institutional support for the empowerment of technological innovation and the efficient functioning of the flow space. By optimizing the spatial structure, the positive effects of spatial externalities and agglomeration economies are amplified, thereby promoting the spatial spillover of factors and the upgrading of agglomeration models.
(2) Economic growth model driven by resource dependence
This model represents an inefficient development that integrates government regulation, technological innovation, and spatial structure under the dominance of physical space. Economic growth is driven by increased inputs and urban space expansion. Consequently, inefficient factor flows are attributed to the combined influence of insufficient technological innovation, lack of policy guidance, and mismatched spatial structure. Insufficient technological innovation and the absence of technical support for refined land use are regarded as the primary reasons for the failure to convert resources into benefits. Rigid allocation of production factors is attributed to the lack of policy supervision, absence of scientific and forward-looking land use planning, unrestrained and extensive land use, and lack of incentive mechanisms. The absence of spillover effects from spatial externalities and the elementary form of agglomeration economy fail to drive ULUE improvement, which is attributed to the unreasonable spatial structure, disorderly expansion of urban cities, and low degree of industrial agglomeration.
This study confirms that government regulation is the dominant factor driving sustainable land use efficiency, explaining over 50% of spatial heterogeneity. This finding is in line with the research of Moran et al. [34]. Therefore, policy orientation drives efficiency differences among cities. Furthermore, technological innovation improves land utilization, supporting the sustainable development concept [6] of the “Smart Ecological City Corridor”. Through technological iteration and green collaboration, cities can optimize the sustainable land use model, providing a feasible path for efficiency gains. Additionally, urban spatial structure has a profound impact on efficiency, which is consistent with Masini et al. [32]. Scientific planning and control can effectively curb the disorderly expansion of cities and stabilize the level of intensive land utilization. However, this study has limitations. It merely clarifies correlations among factors and fails to dynamically analyze long-term evolution patterns. Therefore, integrated governance for sustainable development should be adopted [60].
5.3. Policy Suggestions
(1) Precise policy implementation is key to improving ULUE. Since government regulation is the dominant factor, targeted policies must be drawn from the four-quadrants analysis to enable refined spatial governance. In the first quadrant, the spatial spillover effect of high-quality development should be amplified through cross-regional technological collaboration and capital flow. With government regulation, market incentives and dynamic monitoring, land policies can better guide the spatial flow of factors and achieve the Pareto improvement of regional urban land use. In the second quadrant, innovative approaches should break through development bottlenecks. Building on existing intensive land use advantages, it is essential to popularize green technologies and accelerate the green industrial layout. To address weak growth momentum, it is vital to optimize land supply modes and match land resources with emerging industries to cultivate new growth drivers. In the third quadrant, prioritizing the optimization of local factor allocation and supporting infrastructure will improve urban land agglomeration and reverse extensive land use. In the fourth quadrant, establishing a refined supervision system based on land output benefits will revitalize inefficient industrial land and promote sustainable land use.
(2) Urban planning policies are critical for ULUE improvement and the enhancement of ecological sustainability. The government should promote integrated territorial spatial planning by combining land use, industry layout, and spatial planning with ecological conservation priorities according to local conditions. This will systematically improve land use efficiency. Regions with different development foundations need differentiated planning strategies to realize coordinated development. Furthermore, urban renewal should focus on activating stock and idle land and integrating ecological restoration while building a sound mechanism for eco-friendly coordinated land use. The findings offer practical references for canal cities’ urban renewal and spatial planning, and ecological enhancement.
(3) Technological innovation is the core driver for enhancing quality and efficiency. Based on the technology-driven mechanism summarized in this study, investment in technology research and application must be increased to elevate the green development level of land use. Additionally, inter-city technical exchanges and cooperation will be strengthened to drive industrial upgrading and optimize land use structure. Finally, introducing and cultivating professional talents will provide essential support for improving ULUE.
5.4. Limitations and Future Work
First, this study attempts to analyze sustainable land use efficiency, which encompasses a wide range of connotations that are essential for long-term urban sustainability. In the canal-city context, however, constructing a specific index system aligned with sustainability principles remains an unresolved challenge. Data availability limited the inclusion of several indicators that directly capture the canal’s ecological and cultural functions, such as water quality, per capita area of intangible cultural heritage protected areas, and cultural tourism revenue. Big data derived from multisource heterogeneous data under policy intervention should be considered, and it can further reveal the dynamic interactions between land use and ecosystems in future studies. This could generate more meaningful indices and a more robust evaluation framework, which will enhance the universality of the research. Second, data limitations constrained the analysis of spatial optimization. Future research should therefore introduce more spatial econometric models to comprehensively capture spatial spillover effects on regional sustainability. Spatiotemporal data, such as nighttime light, can also be collected. Geographically and temporally weighted regression can then be applied to construct canal-specific indicators and trace dynamic urban-environment interactions. Large language models can further be used to collect and analyze policy documents to reveal how policies shape ULUE and drive urban sustainability transitions. Third, the research scale should be further refined. Although this study focused on 35 prefecture-level cities, future studies should conduct ULUE research at the county level. Thus, in future work, research on the influencing factors of ULUE will be conducted from several sustainability-focused perspectives, such as production factor misallocation and industrial spatial reorganization. Such an approach would enable the formulation of more specific and tailored policy recommendations to foster the sustainable development of canal cities.
6. Conclusions
Enhancing ULUE is crucial for improving sustainable urban development and environmental protection. From 2002 to 2023, ULUE in 35 canal cities was calculated using the super-SBM and GML index models. KDE revealed its dynamic evolution, and the OPGD model identified the dynamic evolution and interactive driving factors. Combining flow space, factor allocation, and spatial externality theories with efficiency-growth matching relationships is essential to explore the underlying mechanism of ULUE under China’s land system. The key conclusions of this study are as follows:
(1) ULUE exhibited a distinctive “V”-shaped trend, accompanied by significant spatial disequilibrium characteristics. In the CCCs, the GML index showed a fluctuating upward trend, which was relatively consistent with PTC and STC, indicating that TC played an extremely important role. Significant differences existed between the northern and southern areas, with the ULUE level in Beijing being the highest. (2) ULUE presented a spatial distribution of bipolar or multipolar differentiation. Regional disparities exhibited concentration and dispersion trends, with clustering dominated by a high-value type. Significant differences were observed in the evolution of ULUE between the northern and southern areas. (3) Government regulation (X7) is the dominant factor influencing ULUE, with the highest Q-value, explaining over 50% of the explanatory power. The interaction among various factors became increasingly stronger from 2002 to 2023, surpassing the individual effects produced by different factors. No nonlinear-weakening interactions or independent relationships were observed between any pair of factors over time. Specifically, the interaction between government regulation and other factors is strongest, followed by the interaction between spatial structure and other factors from 2002 to 2023. By clarifying the matching relationships between efficiency and growth in the four-quadrant analysis and integrating flow space theory, this study profoundly revealed the underlying mechanism of ULUE, namely that the high-quality development model driven by technological innovation and the economic growth model driven by resource dependence were profoundly revealed. The findings provide novel empirical value and theoretical insights. Grounded in CCCs, these insights are closely relevant to debates on the canal in China, connecting to land use pathways toward climate neutrality, the spatial justice implications of efficiency-driven sustainable development, and the multilevel governance of urban land.
Supplementary Materials
The following supporting information can be downloaded at: https://www.mdpi.com/article/10.3390/su18126325/s1, Table S1: list of the 35 China’s Canal Cities.
Author Contributions
Conceptualization, Y.L. and L.L.; Methodology, Y.L. and Y.S.; Investigation, Y.L., Y.S., C.L. and L.L.; Resources, Y.L., Y.S., C.L. and L.L.; Data Curation, Y.L. and C.L.; Writing—Original Draft, Y.L. and Y.S.; Writing—Review and Editing, Y.L., Y.S., C.L. and L.L.; Visualization, Y.L.; Supervision, L.L.; Funding Acquisition, Y.L. and Y.S. All authors have read and agreed to the published version of the manuscript.
Funding
This research was funded by Social Science Federation of Fujian Province (grant number FJ2024B103), Natural Science Foundation of Fujian Province (grant number 2026J0011471), Huaqiao University (grant number 16SKBS215).
Institutional Review Board Statement
Not applicable.
Informed Consent Statement
Not applicable.
Data Availability Statement
The original contributions presented in this study are included in the article/Supplementary Materials. Further inquiries can be directed to the corresponding author.
Acknowledgments
We thank Y.L. for their valuable comments and suggestions, which significantly enhanced the quality of this paper. During the preparation of this manuscript, the authors used the Gen DeepSeek AI tool (https://chat.deepseek.com/) to refine the explanation of certain mechanisms and to improve the English language, including in the Methods section. The authors have carefully reviewed, revised, and verified all AI-assisted content and take full responsibility for the accuracy and integrity of the published work.
Conflicts of Interest
The authors declare no conflicts of interest.
References
- Yang, A.; Chen, X.; Hu, J.; Huang, K.; Wang, D.; Zhai, Q. A comprehensive evaluation framework for global canal cities. Cities 2026, 170, 106666. [Google Scholar] [CrossRef] [Scilit]
- Alsavada, M.O.; Karimi, K. The spatio-functional role of navigable urban canals in the city: Cases from London and Amsterdam. Urban Plan. 2023, 8, 438–454. [Google Scholar] [CrossRef] [Scilit]
- Sneh, A.; Weissbrod, T.; Perath, I. Evidence for an Ancient Egyptian Frontier Canal: The remnants of an artificial waterway discovered in the northeastern Nile Delta may have formed part of the barrier called “ Shur of Egypt” in ancient texts. Am. Sci. 1975, 63, 542–548. [Google Scholar]
- Obieta, J.A. The International Status of the Suez Canal; Springer: Dordrecht, The Netherlands, 1960. [Google Scholar]
- Lutmar, C.; Rubinovitz, Z. (Eds.) The Suez Canal: Past Lessons and Future Challenge; Palgrave Macmillan: Cham, Switzerland, 2023. [Google Scholar]
- Biscaya, S.; Elkadi, H. A smart ecological urban corridor for the Manchester Ship Canal. Cities 2021, 110, 103042. [Google Scholar] [CrossRef] [Scilit]
- Hoskins, H.L. The Suez canal as an international waterway. Am. J. Int. Law 1943, 37, 373–385. [Google Scholar] [CrossRef] [Scilit]
- Jiang, X.; Chen, X.; Zhang, Q.H.; Li, Y.T.; Wang, M.R.; Li, Y.J.; Xiong, X.; Wu, X.N.; Zhong, Y.J.; Lu, Y. Spatial heterogeneity of cultural ecosystem services in grand canal rural heritage sites: A community gradient framework using participatory mapping. Ecol. Indic. 2025, 178, 113978. [Google Scholar] [CrossRef] [Scilit]
- Ma, L.D.; Xu, W.X.; Zhang, W.Y.; Ma, Y.G. Effect and mechanism of environmental regulation improving the urban land use eco-efficiency: Evidence from China. Ecol. Indic. 2024, 159, 111602. [Google Scholar] [CrossRef] [Scilit]
- Nautiyal, A.; Gunsola, A.; Bhatia, S.Y. Impact of Major Road Network on Landscape and Growth Pattern in Tehri Region: A Geospatial Technique. Land Degrad. Dev. 2025, 36, 4928–4946. [Google Scholar] [CrossRef] [Scilit]
- Yang, W.L.; Pan, J.H. How do trade-offs between ecological construction and urbanization affect regional carbon balance? A case study from China’s Yellow River Basin. Catena 2024, 247, 108534. [Google Scholar] [CrossRef] [Scilit]
- Lambin, E.F.; Meyfroidt, P. Global land use change, economic globalization, and the looming land scarcity. Proc. Natl. Acad. Sci. USA 2011, 108, 3465–3472. [Google Scholar] [CrossRef] [Scilit] [PubMed]
- Rorigues, A.B.; Araujo, D.C.D.S.; Faras, V.E.M.D.; Cabral, J.J.D.S.P. Predictive modelling of land use land cover dynamics for a coastal urban city in Brazil. J. Environ. Manag. 2025, 391, 126586. [Google Scholar] [CrossRef] [Scilit] [PubMed]
- Schiavina, M.; Melchiorri, M.; Freire, S.; Florio, P.; Ehrlich, D.; Tommasi, P.; Pesaresi, M.; Kemper, T. Land use efficiency of functional urban areas: Global pattern and evolution of development trajectories. Habitat Int. 2022, 123, 102543. [Google Scholar] [CrossRef] [Scilit] [PubMed]
- Arnous, M.O.; Mansour, B.M.H. Utilizing multi-temporal thermal data to assess environmental land degradation impacts: Example from Suez Canal region, Egypt. Environ. Sci. Pollut. Res. 2023, 30, 2145–2163. [Google Scholar] [CrossRef] [Scilit] [PubMed]
- Pradesha, A.; Siddig, K.; Pauw, K.; Thurlow, J. Achieving transformational sustainable land Intensification: Integrated general equilibrium and portfolio analysis for Senegal. J. Clean. Prod. 2025, 519, 145929. [Google Scholar] [CrossRef] [Scilit]
- Sun, Y.F.; Ma, A.B.; Su, H.R.; Su, S.L.; Chen, F.; Wang, W.; Weng, M. Does the establishment of development zones really improve industrial land use efficiency? implications for China’s high-quality development policy. Land Use Policy 2020, 90, 104265. [Google Scholar] [CrossRef] [Scilit]
- Anas, A. Taste heterogeneity and urban spatial structure: The logit model and monocentric theory reconciled. J. Urban Econ. 1990, 28, 318–335. [Google Scholar] [CrossRef] [Scilit]
- Read, S. Space syntax and the Dutch city. Environ. Plan. B Plan. Des. 1999, 26, 251–264. [Google Scholar] [CrossRef] [Scilit]
- Li, M.W.; Cai, Z.Y.; Jin, L.S. Urban green land use efficiency of resource-based cities in China: Multidimensional measurements, spatial-temporal changes, and driving factors. Sustain. Cities Soc. 2024, 104, 105299. [Google Scholar] [CrossRef] [Scilit]
- Geng, Y.W.; Li, X.S.; Chen, J.Q. Integration of land use resilience and efficiency in China: Analysis of spatial patterns, differential impacts on SDGs, and adaptive management strategies. Appl. Geogr. 2025, 175, 103490. [Google Scholar] [CrossRef] [Scilit]
- Koroso, N.H.; Zevenbergen, J.A. Urban land management under rapid urbanization: Exploring the link between urban land policies and urban land use efficiency in Ethiopia. Cities 2024, 153, 105269. [Google Scholar] [CrossRef] [Scilit]
- Guo, X.; Chen, Y.; Jia, Z.Y.; Li, Y.Q.; Zhang, L.X.; Qiao, Z.; Hao, Y. Spatial and temporal inequity of urban land use efficiency in China: A perspective of dynamic expansion. Environ. Impact Assess. Rev. 2024, 104, 107357. [Google Scholar] [CrossRef] [Scilit]
- Estoque, R.C.; Ooba, M.; Togawa, T.; Hijioka, Y.; Murayama, Y. Monitoring global land-use efficiency in the context of the UN 2030 agenda for sustainable development. Habitat Int. 2021, 115, 102403. [Google Scholar] [CrossRef] [Scilit]
- Xue, D.; Yue, L.; Ahmad, F.; Draz, M.U.; Chandio, A.A.; Ahmad, M.; Amin, W. Empirical investigation of urban land use efficiency and influencing factors of the Yellow River basin Chinese cities. Land Use Policy 2022, 117, 106117. [Google Scholar] [CrossRef] [Scilit]
- Pili, S.; Grigoriadis, E.; Carlucci, M.; Clemente, M.; Salvati, L. Towards sustainable growth? A multi-criteria assessment of (changing) urban forms. Ecol. Indic. 2017, 76, 71–80. [Google Scholar] [CrossRef] [Scilit]
- Huang, J.; Han, W.J.; Zhang, Z.F.; Ning, S.S.; Zhang, X.L. The decoupling relationship between land use efficiency and carbon emissions in China: An analysis using the socio-ecological systems (SES) framework. Land Use Policy 2024, 138, 107055. [Google Scholar] [CrossRef] [Scilit]
- Zhou, Y.X.; Lu, Y. Spatiotemporal evolution and determinants of urban land use efficiency under green development orientation: Insights from 284 cities and eight economic zones in China, 2005–2019. Appl. Geogr. 2023, 161, 103117. [Google Scholar] [CrossRef] [Scilit]
- He, T.T.; Song, H.P. A novel approach to assess the urban land-use efficiency of 767 resource-based cities in China. Ecol. Indic. 2023, 151, 110298. [Google Scholar] [CrossRef] [Scilit]
- Liu, S.C.; Xiao, W.; Li, L.L.; Ye, Y.M.; Song, X.L. Urban land use efficiency and improvement potential in China: A stochastic frontier analysis. Land Use Policy 2020, 99, 105046. [Google Scholar] [CrossRef] [Scilit]
- Cao, X.S.; Liu, W.Y.; Li, T.; Liao, W. Analysis of spatial pattern evolution and influencing factors of regional land use efficiency in china based on ESDA-GWR. Sci. Rep. 2019, 9, 520. [Google Scholar] [CrossRef] [Scilit] [PubMed]
- Masini, E.; Tomao, A.; Barbati, A.; Corona, P.; Serra, P.; Salvati, L. Urban growth, land-use efficiency and local socioeconomic context: A comparative analysis of 417 metropolitan regions in Europe. Sci. Rep. 2019, 63, 322–337. [Google Scholar] [CrossRef] [Scilit] [PubMed]
- Alberto, G. Unlocking patterns in urban land use efficiency: A global analysis using XGBoost and Bayesian networks. Land Use Policy 2026, 160, 107838. [Google Scholar] [CrossRef] [Scilit]
- Morán Uriel, J.; Camerin, F.; Córdoba Hernández, R. Urban Horizons in China: Challenges and Opportunities for Community Intervention in a Country Marked by the Heihe-Tengchong Line Diversity as Catalyst: Economic Growth and Urban Resilience in Global Cityscapes. In Urban Sustainability; Siew, G., Allam, Z., Cheshmehzangi, A., Eds.; Springer: Singapore, 2024; pp. 105–125. [Google Scholar] [CrossRef] [Scilit]
- Cao, Y.X.; Huang, X.; Weng, Q.H. A multi-scale weakly supervised learning method with adaptive online noise correction for high-resolution change detection of built-up areas. Remote Sens. Environ. 2023, 297, 113779. [Google Scholar] [CrossRef] [Scilit]
- Wu, C.Y.; Huang, X.J.; Chen, B. Telecoupling mechanism of urban land expansion based on transportation accessibility: A case study of transitional Yangtze River economic Belt, China. Land Use Policy 2020, 96, 104687. [Google Scholar] [CrossRef] [Scilit]
- Auziņš, A.; Geipele, I.; Stāmure, I. Measuring land-use efficiency in land management. Adv. Mater. Res. 2013, 804, 205–210. [Google Scholar] [CrossRef] [Scilit]
- Fu, J.; Ding, R.; Zhu, Y.Q.; Du, L.Y.; Shen, S.W.; Peng, L.N.; Zou, J.; Hong, Y.X.; Liang, J.; Wang, K.X.; et al. Analysis of the spatial-temporal evolution of green and low carbon utilization efficiency of agricultural land in China and its influencing factors under the goal of carbon neutralization. Environ. Res. 2023, 237, 116881. [Google Scholar] [CrossRef] [Scilit] [PubMed]
- Hou, X.H.; Yin, Y.Q.; Zhou, X.; Zhao, M.J.; Yao, L.; Zhang, D.J.; Wang, X.D.; Xia, C.Y. Does economic agglomeration affect the sustainable intensification of cultivated land use? Evidence from China. Ecol. Indic. 2023, 154, 110808. [Google Scholar] [CrossRef] [Scilit]
- Koroso, N.H. Urban land policy and urban land use efficiency: An analysis based on remote sensing and institutional credibility thesis. Land Use Policy 2023, 132, 106827. [Google Scholar] [CrossRef] [Scilit]
- Charnes, A.; Cooper, W.W.; Rhodes, E. Measuring the efficiency of decision-making units. Eur. J. Oper. Res. 1978, 2, 429–444. [Google Scholar] [CrossRef] [Scilit]
- Tone, K. A slacks-based measure of efficiency in data envelopment analysis. Eur. J. Oper. Res. 2001, 130, 498–509. [Google Scholar] [CrossRef] [Scilit]
- Tone, K. A slacks-based measure of super-efficiency in data envelopment analysis. Eur. J. Oper. Res. 2002, 143, 32–41. [Google Scholar] [CrossRef] [Scilit]
- Tone, K. Dealing with undesirable outputs in DEA: A slacks-based measure approach. In GRIPS Research Report Series; GRIPS: Tokyo, Japan, 2003. [Google Scholar]
- Oh, D.-H. A Global Malmquist-Luenberger productivity index. J. Prod. Anal. 2010, 34, 183–197. [Google Scholar] [CrossRef] [Scilit]
- Amsalu, K.A. Sustainability and efficiency analysis of 42 countries: Super SBM-DEA model and the GML productivity index with undesirable outputs. Habitat Int. 2025, 177, 1137676. [Google Scholar] [CrossRef] [Scilit]
- Wu, X.; Zhong, S.Y.; Chen, G.; Wu, C.H.; Han, J.Y. Influence of land use intensity on urban carbon efficiency under a carbon neutrality target: Evidence from the Yangtze River Delta urban agglomeration, China. Environ. Impact Assess. Rev. 2025, 110, 107689. [Google Scholar] [CrossRef] [Scilit]
- Fare, R.; Grosskopf, S.; Lovell, C.A. Production Frontiers; Cambridge University Press: Cambridge, UK, 1994. [Google Scholar]
- Fare, R.; Grosskopf, S.; Norris, M.; Zhang, Z.Y. Productivity growth, technical progress, and efficiency change in industrialized countries. Am. Econ. Rev. 1994, 84, 66–83. [Google Scholar]
- Silverman, B.W. Density Estimation for Statistics and Data Analysis; Chapman and Hall: London, UK; New York, NY, USA, 1986. [Google Scholar]
- Song, Y.Z.; Wang, J.F.; Ge, Y.; Xu, C.D. An optimal parameters-based geographical detector model enhances geographic characteristics of explanatory variables for spatial heterogeneity analysis: Cases with different types of spatial data. GISci. Remote Sens. 2020, 57, 593–610. [Google Scholar] [CrossRef] [Scilit]
- Wang, J.F.; Li, X.H.; Christakos, G.; Liao, Y.L.; Zhang, T.; Gu, X.; Zheng, X.Y. Geographical detectors-based health risk assessment and its application in the neural tube defects study of the Heshun Region, China. Int. J. Geogr. Inf. Sci. 2010, 24, 107–127. [Google Scholar] [CrossRef] [Scilit]
- Zhang, Q.; Sun, Z.X.; Huang, W. Does land perform well for corn planting? an empirical study on land use efficiency in China. Land Use Policy 2018, 74, 273–280. [Google Scholar] [CrossRef] [Scilit]
- Li, C.; Cai, G.; Sun, Z. Urban Land-Use Efficiency Analysis by Integrating LCRPGR and Additional Indicators. Sustainability 2021, 13, 13518. [Google Scholar] [CrossRef] [Scilit]
- Wang, Y.J.; Chen, F.Y.; Wei, F.; Yang, M.H.; Gu, X.; Sun, Q.Q. Spatial and temporal characteristics and evolutionary prediction of urban health development efficiency in China: Based on super-efficiency SBM model and spatial Markov chain model. Ecol. Indic. 2023, 147, 109985. [Google Scholar] [CrossRef] [Scilit]
- Yu, J.Q.; Zhou, K.L.; Yang, S.L. Land use efficiency and influencing factors of urban agglomerations in China. Land Use Policy 2019, 88, 104143. [Google Scholar] [CrossRef] [Scilit]
- Chen, Q.; Zheng, L.; Wang, Y.; Wu, D.; Li, J.F. A comparative study on urban land use eco-efficiency of Yangtze and Yellow rivers in China: From the perspective of spatiotemporal heterogeneity, spatial transition and driving factors. Ecol. Indic. 2023, 151, 110331. [Google Scholar] [CrossRef] [Scilit]
- Su, X.Y.; Fan, Y.M.; Wen, C.H. Systematic coupling and multistage interactive response of the urban land use efficiency and ecological environment quality. J. Environ. Manag. 2024, 365, 121584. [Google Scholar] [CrossRef] [Scilit] [PubMed]
- Pagano, A.M.; Light, M.K.; Sanchez, O.V.; Ungo, R.; Tapiero, E. Impact of the Panama Canal expansion on the Panamanian economy. Marit. Policy Manag. 2012, 39, 705–722. [Google Scholar] [CrossRef] [Scilit]
- Bergman, J.N.; Beaudoin, C.; Mistry, I.; Turcotte, A.; Vis, C.; Minelga, V.; Neigel, K.; Lin, H.Y.; Bennett, J.R.; Young, N.; et al. Historical, contemporary, and future perspectives on a coupled social–ecological system in a changing world: Canada’s historic Rideau Canal. Environ. Rev. 2022, 30, 72–87. [Google Scholar] [CrossRef] [Scilit]

Disclaimer/Publisher’s Note: The statements, opinions and data contained in all publications are solely those of the individual author(s) and contributor(s) and not of MDPI and/or the editor(s). MDPI and/or the editor(s) disclaim responsibility for any injury to people or property resulting from any ideas, methods, instructions or products referred to in the content. |
© 2026 by the authors. Licensee MDPI, Basel, Switzerland. This article is an open access article distributed under the terms and conditions of the Creative Commons Attribution (CC BY) license.