


Abstract
At a time when China confronts the dual challenges of intensifying international competition and urgent industrial transformation, enhancing enterprises’ new quality productivity (NQP) has become a critical pathway to strengthening market competitiveness. This study constructs a comprehensive micro-level NQP index system for enterprises, encompassing three core dimensions: revolutionary breakthroughs in science and technology, deep transformation and upgrading of industrial systems, and innovative allocation of production factors. Using panel data from listed enterprises in China’s three major eastern urban agglomerations (Beijing–Tianjin–Hebei, Yangtze River Delta, and Guangdong–Hong Kong–Macao Greater Bay Area), we systematically examine the spatiotemporal evolution patterns and market expansion effects of enterprise NQP. The results reveal that while enterprises’ NQP has shown a generally upward trend, significant regional disparities and pronounced polarization persist across the three urban agglomerations. Development is notably path-dependent and spatially correlated, being easily influenced by neighboring cities. More importantly, empirical evidence from benchmark regression and spatial Durbin models indicates that enhancing NQP significantly boosts enterprises’ market potential, with substantial positive spatial spillover effects. This study contributes to the literature by developing a novel micro-level measurement framework for new quality productivity and providing robust evidence that NQP serves as a powerful driver for expanding market potential in an era of technological and industrial transformation.
1. Introduction
China is currently at a critical historical juncture in realizing the great rejuvenation of the Chinese nation, facing dual challenges of increasingly fierce international competition and mounting pressure for domestic industrial transformation and upgrading. On the one hand, the global industrial and supply chains are undergoing accelerated restructuring, with major developed countries intensifying technological blockades and industrial competition against China, placing greater pressure on the international competitiveness of Chinese products and services. On the other hand, insufficient effective domestic demand and the low-end locking of traditional industries remain prominent issues, constraining the endogenous growth momentum of the economy. Against this complex backdrop, the Chinese government has proposed accelerating the development of new quality productivity, with scientific and technological innovation as the guiding force, to promote high-quality development. This strategic initiative represents both a proactive response to external environmental changes and an internal requirement for expanding domestic demand, smoothing the domestic economic circulation, and constructing a new development paradigm.
New quality productivity refers to an advanced productive force led by technological innovation, supported by strategic emerging industries and future industries, and characterized by leaps in laborers, means of labor, objects of labor, and their optimal combinations, thereby achieving a qualitative breakthrough in overall productivity. Its essence lies in driving systemic and fundamental socioeconomic transformation through revolutionary technological breakthroughs, deep industrial transformation and upgrading, and innovative allocation of production factors. As the most direct and active micro-level carriers of new quality productivity, enterprises play a pivotal role in technological innovation and industrial upgrading. The enhancement of enterprises’ new quality productivity not only determines the market competitiveness of individual firms but also directly affects regional and even national economic resilience and development potential. Therefore, examining new quality productivity from a micro-level enterprise perspective—particularly its measurement, spatiotemporal evolution, and economic effects—holds significant theoretical value and practical urgency.
However, existing research on new quality productivity remains predominantly focused on the macro level, relying primarily on provincial or city-level macroeconomic data for measurement, with limited attention paid to enterprises as the core agents of innovation. This macro-oriented approach has resulted in insufficient understanding of the specific manifestations, regional disparities, and underlying mechanisms of new quality productivity at the micro level. Critical questions remain underexplored: How should new quality productivity at the enterprise level be scientifically measured? What are the spatiotemporal evolution characteristics and patterns of enterprise new quality productivity across different regions? And can its enhancement truly translate into improved market competitiveness? This study seeks to address these important gaps by conducting a systematic investigation from a micro-level enterprise perspective.
This study selects China’s three major eastern urban agglomerations—the Beijing–Tianjin–Hebei region, the Yangtze River Delta, and the Guangdong–Hong Kong–Macao Greater Bay Area—as the research context, owing to their high representativeness and typicality. These urban agglomerations are the most economically developed, technologically innovative, and globally integrated regions in China. They concentrate a large proportion of the country’s high-tech enterprises and listed companies, serving as the core engines of China’s participation in global technological and industrial competition. Compared with the central and western regions, the three major urban agglomerations enjoy significant advantages in talent, capital, technological innovation, and market scale, while simultaneously facing greater pressure from rising factor costs and the need for high-end industrial transformation. This combination of strengths and challenges makes them an ideal setting for observing and analyzing the development of enterprise new quality productivity. Moreover, the close economic linkages and spatial interactions both within and among these three urban agglomerations provide a natural laboratory for examining the spatial spillover effects of new quality productivity.
To address the research questions, this study first constructs a comprehensive enterprise-level new quality productivity evaluation system comprising three primary dimensions, seven secondary dimensions, and twenty-seven tertiary indicators, aiming to systematically capture enterprises’ performance in technological innovation, industrial upgrading, and innovative factor allocation. Based on this framework, the study employs kernel density estimation, the Dagum Gini coefficient, Moran’s I index, and spatial Markov chain methods to analyze the spatiotemporal evolution patterns and regional disparities of enterprise new quality productivity within the three urban agglomerations. Furthermore, benchmark regression and spatial Durbin models are applied to empirically examine the impact of enterprise new quality productivity on market potential, with particular attention to its spatial spillover effects.
This study focuses on two core research questions: First, how should new quality productivity at the enterprise level be scientifically measured, and what are the characteristics, disparities, and evolutionary patterns of its spatiotemporal development in the three major eastern urban agglomerations? Second, can the enhancement of enterprise new quality productivity effectively strengthen regional market potential, and does this effect exhibit significant positive spatial spillovers? By systematically addressing these questions, this study extends the research on new quality productivity from the macro to the micro level, enriching the theoretical foundation of productivity theory at the firm level. Practically, it provides micro-level empirical evidence for governments to formulate differentiated industrial policies and for enterprises to identify innovation directions, while also offering valuable insights for promoting coordinated regional development and building a unified national market.
Compared with the existing literature, the marginal contributions of this study are threefold. First, it develops a more refined and multi-dimensional evaluation system for enterprise new quality productivity, addressing the limitations of previous macro-level studies in micro-level characterization. Second, it systematically uncovers the spatiotemporal evolution characteristics and spatial dependence patterns of enterprise new quality productivity, deepening the understanding of regional innovation coordination mechanisms. Third, it empirically verifies both the direct and spatial spillover effects of enterprise new quality productivity on market potential, providing new empirical support for constructing a unified national market and facilitating smooth domestic economic circulation. Overall, through a micro-level perspective, this study aims to offer novel theoretical insights and policy implications for accelerating the formation of new quality productivity and achieving high-quality development in the new era.
2. Literature Review and Hypothesis Development
2.1. Conceptual Connotations and Theoretical Integration of New Quality Productivity
New quality productivity (NQP) represents a major theoretical innovation proposed by China in the context of the new era, serving as an inheritance, enrichment, and development of Marxist theory of productive forces. In Das Kapital, Marx profoundly expounded the fundamental principle that productive forces determine relations of production and that changes in productive forces drive social progress. Emerging within this historical materialist framework, new quality productivity emphasizes scientific and technological innovation as the guiding force, achieving a qualitative leap in productive forces through revolutionary technological breakthroughs, innovative allocation of production factors, and deep industrial transformation and upgrading [1,2]. Compared with traditional productive forces, NQP places greater emphasis on qualitative improvement rather than mere quantitative expansion. Its core characteristics are manifested in the significant enhancement of total factor productivity, the optimization and upgrading of industrial structures, and the pursuit of green and sustainable development in harmony with nature.
The connotations of new quality productivity can be understood through three core dimensions: first, revolutionary breakthroughs in science and technology, which constitute the fundamental driving force behind NQP; second, deep transformation and upgrading of the industrial system, which serve as the primary carrier of NQP; and third, innovative allocation of production factors, which represent the key guarantee for the efficient operation of NQP. These three dimensions are mutually reinforcing and collectively form a comprehensive theoretical framework for New Quality Productivity [1,3].
To enhance the international dialogical capacity and universality of the NQP theory, this study integrates it with established Western economic theories. First, new quality productivity exhibits strong internal consistency with the theory of Total Factor Productivity (TFP) in Western economic growth theory. Solow introduced TFP as the unexplained “Solow residual” in the neoclassical growth model after accounting for capital and labor inputs [4]. Subsequent endogenous growth theories further emphasized that knowledge accumulation, technological progress, and human capital are the core drivers of sustained TFP growth [5,6]. Building upon this foundation, NQP further highlights the revolutionary and systemic nature of technological innovation.
Second, new quality productivity aligns closely with Western green economy theory. Green economy theory advocates that economic growth must break away from the traditional high-consumption, high-pollution development model and shift toward a resource-saving, environmentally friendly, and ecologically sustainable path [7,8]. Henderson proposed the “Green New Deal,” emphasizing the achievement of synergistic economic and environmental development through green technological innovation and green industry cultivation [8]. This theory is highly consistent with the “green upgrading” dimension of NQP. In constructing the enterprise NQP indicator system, this study specifically includes “enterprise green upgrading” as a key secondary indicator, covering aspects such as whether the enterprise is heavily polluting, green innovation technology, green innovation quality, pollution levels, and ESG ratings. This integration not only enriches the theoretical connotations of NQP but also provides a more robust theoretical foundation that is more accessible to international academic audiences.
At the micro level, enterprises are the most critical entities in the generation and realization of new quality productivity. Marx’s discussions on “collective force” and “new forces arising from the fusion of many forces” provide a philosophical foundation for studying NQP from the enterprise perspective [4]. Dosi’s technological paradigm theory and Lundvall et al.’s national innovation systems theory further assert that enterprises are core carriers of technological innovation and key nodes in innovation networks [9,10]. Therefore, examining new quality productivity from a micro-level enterprise perspective constitutes an important supplement to and deepening of macro-level theories.
2.2. Literature Review and Hypothesis Proposal
The evolution of productivity measurement methods reflects the shift in economic research from a focus on quantitative growth to qualitative improvement. Early studies primarily examined single-factor indicators such as labor productivity [5]. By the mid-to-late 20th century, total factor productivity (TFP) had become the dominant measurement tool [11,12]. However, traditional TFP measures struggle to capture the qualitative leaps in technological innovation, the connotations of green transformation, and the innovative allocation of production factors. In recent years, scholars have begun developing more comprehensive and systematic productivity evaluation systems, such as incorporating environmental factors, innovation outputs, and knowledge capital into measurement frameworks [13,14,15]. The emergence of new quality productivity marks a transition in productivity measurement from “quantitative” to “qualitative” and from “single-dimensional” to “multi-dimensional systemic” approaches. The enterprise NQP indicator system constructed in this study responds to this evolutionary trend by encompassing three primary dimensions—revolutionary technological breakthroughs, deep industrial transformation and upgrading, and innovative allocation of production factors—aiming to accurately characterize the qualitative state of enterprise productivity.
Regarding empirical research on enterprise-level innovation and regional development, the existing literature has produced substantial findings. Gerguri and Ramadani argued that enterprise innovation is a key driver of regional economic growth [16]. Hausman and Johnston found that product and service innovation by enterprises significantly enhances regional market competitiveness and consumer welfare [17]. Pohulak-Żołędowska highlighted the important contribution of small and medium-sized enterprises’ innovation activities to regional employment and economic growth [18]. In the Chinese context, Zhang et al. confirmed that enterprise R&D investment has a significant positive impact on urban innovation output [19]. Li et al. found that enterprise digital transformation effectively promotes high-quality regional economic development, while Wang et al. demonstrated that enterprise green innovation significantly enhances regional green total factor productivity [20,21]. These studies provide an important foundation for the present research. However, most of the existing literature focuses on direct effects and pays relatively limited attention to how micro-level enterprise innovation systematically influences regional market potential.
With respect to the spatial spillover effects of innovation and productivity, scholars have reached a broad consensus. Knowledge spillover theory posits that innovation activities exhibit significant spatial externalities [22,23,24]. Rodríguez-Pose and Crescenzi noted that technological innovation can generate positive spillovers to neighboring regions through channels such as labor mobility, trade linkages, and industrial associations [25]. Castellano et al. further confirmed that the cross-regional mobility of high-skilled talent is an important mechanism for productivity spatial spillovers [26]. In the Chinese context, Wu et al., using spatial Durbin models, found that enterprise patent output has a significant positive spillover effect on the total factor productivity of neighboring cities [27]. Wang et al. showed that the intensity of inter-regional industrial linkages strengthens the spatial spillover effects of innovation [28]. These studies collectively provide solid theoretical and empirical support for examining the spatial spillover effects of enterprise new quality productivity in this research.
Building upon the above theoretical analysis and literature review, this study further explores the mechanisms through which enterprise new quality productivity influences market potential. Enterprise NQP, as a comprehensive embodiment of technological innovation, factor optimization, and industrial upgrading within firms, can directly affect both the supply and demand sides of the local market. From the supply side, enterprises can significantly improve production efficiency, reduce unit production costs, and enhance product quality and differentiation through revolutionary technological breakthroughs and intelligent production methods. From the demand side, such improvements in supply capacity can better satisfy consumers’ increasingly diversified and high-quality demands, thereby stimulating and releasing local market potential. Therefore, this study proposes the following hypothesis:
H1.
The enhancement of enterprise new quality productivity has a significant positive impact on local market potential.
In this study, market potential is operationalized as the actual market performance of enterprises, primarily measured through observable indicators such as growth rate of main business revenue, market share expansion, consumer demand satisfaction, and the release level of regional consumption potential. Furthermore, the influence of enterprise new quality productivity is not confined to the local area but may generate spillover effects on neighboring regions through spatial transmission mechanisms. Such spatial spillovers primarily occur through three channels: technological spillovers, whereby new technologies and knowledge diffuse to surrounding areas via patent licensing, technical cooperation, and personnel exchange, thereby promoting technological progress in neighboring enterprises; talent spillovers, whereby the flow of high-skilled talent enhances human capital levels in surrounding regions; and industrial chain spillovers, whereby the development of upstream and downstream industries fosters cross-regional industrial synergy, thereby expanding market demand in neighboring areas. Therefore, this study proposes the following hypothesis:
H2.
The enhancement of enterprise new quality productivity has a significant positive spatial spillover effect on the market potential of neighboring regions.
3. Construction of the Enterprise New Quality Productivity Index System and Research Design
3.1. Construction of the Index System
Based on existing research and combining the enterprise new quality productivity index system constructed by Song Jia and others, this study constructs an enterprise new quality productivity index system from three perspectives: revolutionary scientific and technological breakthroughs, deep industrial transformation and upgrading, and innovative allocation of production factors [29]. The system includes 7 secondary indicators and 27 tertiary indicators. Specifically, revolutionary scientific and technological breakthroughs cover enterprise innovation levels and employee innovation levels; deep industrial transformation and upgrading encompass enterprise AI upgrading, enterprise green upgrading, and enterprise digital upgrading; and innovative allocation of production factors focuses on innovative and traditional production factor allocation. The overall index system is shown in Table 1. Apart from some indicators referencing Song Jia et al.’s measurement methods (marked with “*”) [29], the specific division and measurement methods of other indicators are as follows.
Table 1.
New quality productivity in enterprises.
Under the category of revolutionary scientific and technological breakthroughs, enterprise innovation levels are measured using enterprise green technology innovation and innovation input levels. Enterprise green technology innovation is measured by the natural logarithm of the sum of green invention patent applications and green utility model applications plus one. Technological innovation levels are measured by the natural logarithm of the total number of invention patents, utility models, and design patents applications plus one, with weights of 3:2:1.
Under deep industrial transformation and upgrading, enterprise AI upgrading includes enterprise AI levels, intelligent investment levels, and the number of AI patents. AI levels are measured using Python 3.11 word frequency extraction based on the text content of listed annual reports for statistical analysis [30]. Intelligent investment levels are calculated by dividing the book value of machinery by the total number of employees [31]. The number of AI patents is measured by summing up the number of AI patents retrieved from the China National Intellectual Property Administration. Enterprise green upgrading is represented by whether the enterprise is a heavy polluter, green transformation of the enterprise, and pollution emission levels. Whether an enterprise is a heavy polluter is represented by a dummy variable based on Wang Yipan et al.’s approach [21]. Green transformation of the enterprise is measured by word frequency extraction [32,33]. Pollution emission levels are calculated following Mao Jie et al.’s methodology [34]. Enterprise digital upgrading includes enterprise digital economy patents, data element utilization levels, and whether it is a high-tech enterprise. Digital economy patents are matched based on the main classification numbers of patents and the “2021 Statistical Classification of Digital Economy and Its Core Industries” from the China National Intellectual Property Administration. Data element utilization levels are measured by word frequency extraction [27]. Whether it is a high-tech enterprise is represented by a dummy variable based on the qualification identification data of listed companies from CSMAR.
Innovative allocation of production factors is divided into two secondary indicators. Innovative production factor allocation includes enterprise total factor productivity, enterprise green total factor productivity, and enterprise innovation efficiency. Enterprise total factor productivity is calculated based on the method of Guangjun Shen and Jingxian Zou. [35]. Enterprise green total factor productivity is measured using the non-radial SBM-ML index [36]. Enterprise innovation efficiency is calculated by dividing the technological innovation level by R&D expenditure plus one and taking the natural logarithm. Traditional production factor allocation includes enterprise resource allocation efficiency and corporate governance levels. Enterprise resource allocation efficiency is calculated by dividing operating revenue by average total assets. Corporate governance levels are derived using principal component analysis [37].
3.2. Data Sources and Processing
The data period covered in this study spans from 2012 to 2022. To ensure the scientific rigor and reliability of the research, the following procedures were applied to the indicator data:
- For enterprise data:
- (1)
- Excluded samples of abnormal trading listed companies such as PT, ST, and *ST enterprises.
- (2)
- Excluded samples of enterprises with negative book value of owners’ equity.
- (3)
- Excluded samples from the financial and real estate industries.
- (4)
- Excluded samples with missing relevant variables.
- Text analysis and natural language processing techniques were used to measure enterprise AI levels, green transformation, and data element utilization levels. This involves extracting and analyzing text information from annual reports.
- The main sources of research data include the “China City Statistical Yearbook,” the National Bureau of Statistics website, and the CSMAR database.
- For missing data, linear interpolation and median imputation methods were used. For Zhongshan and Dongguan cities, where enterprise NQP data were missing, local GDP’s proportion of the urban agglomeration was used as a weight for imputation.
3.3. Combination Weighting TOPSIS Method for Measuring Enterprise New Quality Productivity
The combination weighting TOPSIS method serves as a key approach in the measurement of enterprise-level new quality productivity (NQP). Compared to traditional single weighting methods, this approach integrates subjective and objective weights through a game-theoretic equilibrium process, effectively reducing discrepancies between different weighting schemes and thereby enhancing the scientific validity and reliability of the final weights. Considering the multi-attribute and multi-indicator characteristics of enterprise NQP, this study adopts the TOPSIS method for comprehensive evaluation and integrated measurement [38]. The detailed calculation process is illustrated in Figure 1.
Figure 1.
Combination weighting TOPSIS method flowchart.
The details of the indicator calculation process are as follows:
1. FAHP calculates subjective weights: The Fuzzy Analytic Hierarchy Process (FAHP) is used to assign weights to enterprise new quality productivity indicators, combining the uncertainty handling of fuzzy evaluation with the consistency of AHP. The study plans to distribute questionnaires to seven experts (all of whom hold a doctoral degree or an associate professor or higher title). After excluding two questionnaires that did not pass the consistency test, the arithmetic mean of the five valid questionnaires will be calculated to construct a fuzzy judgment matrix. The specific process is as follows [39]:
(1) Establish a fuzzy complementary matrix of new quality productivity indicators for enterprises. First, compare n tertiary indicators ai and aj pairwise, using a scale of 0 The membership degree of fuzzy relationships ranging from 1 to 0.9 is obtained as aij, forming a fuzzy judgment matrix:
A = (aij) n × m
Let A be a fuzzy complementary judgment matrix; aij represents the fuzzy importance of the i-th indicator relative to the j-th indicator; n is the total number of tertiary indicators; m is the number of matrix columns; and m takes the same value as n. It satisfies 0 ≤ aij ≤ 1 and aij + aji = 1.
(2) Calculate the subjective weight vector γ.
where is the subjective weight of the i-th indicator; is the sum of all fuzzy evaluation values in the i-th row; n is the number of indicators.
(3) Calculate the feature matrix W*. Let W* = (W1, W2, …,Wn)T be the weight vector of the fuzzy judgment matrix A, where , γi ≥ 0 (i = 1, 2, …, n).
where W* is the eigenweight vector of the fuzzy judgment matrix; Wi is the eigenweight of the i-th indicator; T denotes the matrix transpose, and this is the eigenmatrix of the judgment matrix A.
(4) Calculate compatibility index CR. If A = (aij)n×n and = (ij)n×n are both fuzzy judgment matrices, then:
In this formula, represents the compatibility index of matrix A; aij is an element of the fuzzy judgment matrix A, and ij is the corresponding element of the characteristic matrix ; n is the order of the matrix.
(5) Consistency check. Calculate the compatibility index I (A, W*) between the fuzzy judgment matrix A and the feature matrix W. If I ≤ α (α = 0.1), the consistency test is passed.
2. Entropy weight method for calculating objective weights:
Information entropy is an indicator that measures the orderliness of data, and its value is inversely proportional to the amount of information. In indicator measurement, the higher the degree of dispersion of indicator data, the lower its information entropy, and the corresponding amount of information and influence should be greater, so the weight should also be higher, On the contrary, the weight should also be reduced.
The process is as follows [38]:
(1) Extreme value processing method applies dimensionless processing to data:
Positive indicators:
Negative indicator:
where, refers to the original value of the i-th sample and the j-th index; represents the standardized value of positive indicators; indicates the standardized value of negative indicators; corresponds to the maximum value of the j-th indicator; and corresponds to the minimum value of the j-th indicator. For the effectiveness of subsequent data processing, it is necessary to translate and standardize the data.
where refers to the standardized value after translation; stands for standardized value; L is the translation amplitude. In order to reduce the error of the original data, the value in this paper is 0.0001.
(2) Quantify all indicators equally and calculate the proportion of the sample to theindicator, ():
represents the proportion of the i-th sample in the j-th index; refers to the sum of all sample translation values of the j-th indicator.
(3) Calculation of the entropy value of the indicator (:
In the above formula, ej corresponds to the information entropy of the j-th index; Ln refers to natural logarithm; n is the number of samples.
(4) Calculation of the coefficient of difference for the j indicator:
refers to the difference coefficient of index j.
(5) Normalize the coefficient of difference and calculate the objective weight of the indicator, ηj (j = 1, 2, …, m).
In this formula, is the objective weight of entropy weight method for the j-th index; the total number of corresponding indicators.
3. Optimized Combination calculates combinatorial weighting:
In order to make the weights of various indicators more accurate, the weights obtained by combining FAHP and entropy weighting method are adjusted and optimized using the Optimized Combination weighting strategy to form a comprehensive weight. This method can reduce the bias between subjective and objective weights, seek consensus and compromise between different weights, achieve Nash equilibrium, and improve weight accuracy [38].
(1) Construct a set of basic weight vector sets Wq = {W1, W2, …, Wn}, , where each Wp represents a set of weight determination methods. The total number of design indicators is n, and the total number of methods is p. This study sets p to 2. By using the linear combination coefficient α = {α 1, α 2}, two linear combinations of weight vectors can be obtained:
Among them, w1 is the subjective (FAHP) weight vector set of design indicators; w2 is the objective (entropy method) weight vector set for design indicators. α 1 and α 2 are the coefficients of the Analytic Hierarchy Process and Entropy Method, respectively.
(2) Optimize two linear combination coefficients with the goal of minimizing dispersion to obtain the most satisfactory weight in Wb, and establish a function as follows:
where ∣⋅∣ 2 represents the L2 norm (Euclidean norm) of the vector, that is, the square root of the square sum of the elements of the vector; is the set of comprehensive weight vectors.
(3) Equivalent transformation of the above equation into a system of linear equations with optimal first-order derivative conditions based on matrix differentiation properties:
In the above formula, and are the outer product operations of the weight vectors and , respectively, forming the coefficient matrix of the linear equation group. On the right side of the equation is the constant term matrix. The optimized combination coefficients α1 and α2 are calculated.
(4) Normalize the following equations:
(5) Finally, the weight of the enterprise’s new quality productivity indicator W is:
In the above formula, , refers to the combination coefficient after normalization.
4. TOPSIS method for measuring the level of new quality productivity in enterprises:
This article chooses the TOPSIS method, which approximates the ideal solution ranking method, to comprehensively evaluate the new quality productivity of enterprises [39]:
(1) Establish a weighted normalized decision matrix Y, which is obtained from the normalized decision matrix D, D = (Xij) m × n, where Xij is obtained by the entropy weight method in the first step, the Hadamard product of D, and the indicator weight matrix G to obtain the weighted normalized decision matrix Y, where yij = Wi × Xij. Then,
where is the weighted normalized decision matrix; D is the normalized decision matrix, D = (Xij) m × n, where Xij is the i-th sample and the j-th index value (i.e., ) after standardization by the entropy weight method; G is the index weight matrix, which is composed of the comprehensive weight vector w repeated m times and transposed; is the i-th sample and j-th index value after weighted normalization; M is the number of samples; N is the number of indicators.
(2) Calculate positive and negative ideal solutions. Assuming that the ideal solution and negative ideal solution are y+ and y−, respectively, let:
where, and are positive ideal solutions and negative ideal solutions respectively; is the indicator set of positive indicators (benefit indicators), that is, the larger the indicator value, the better; is the indicator set of negative indicators (cost indicators), that is, the smaller the indicator value, the better.
(3) The formula for calculating the relative distance between positive and negative ideal solutions is:
In this formula, corresponds to the distance from the positive ideal solution; - represents the distance to the negative ideal solution.
(4) Calculate the relative closeness between each indicator value and the ideal solution, and sort them according to the size of the Si value. The larger the value, the closer it is to the ideal solution, and the closer the enterprise’s new quality productivity is to the optimal level
where is the relative closeness of the i-th sample (enterprise), and the value range is [0, 1]; The closer the value is to 1, the closer the NQP level of the enterprise is to the optimal level.
3.4. Research Methods
3.4.1. Kernel Density Estimation
Kernel density estimation (KDE) is a robust non-parametric technique that is well suited for analyzing data with irregular distributions. By constructing a smooth density curve, it effectively represents the distribution of random variables and serves primarily in estimating probability density functions. This study uses the Gaussian kernel function to analyze how the productivity distribution of new enterprises changes over time in the three main eastern urban agglomerations. The specific estimation approach follows the methodology outlined in Gramacki and Gramacki [40].
3.4.2. Dagum Gini Coefficient and Its Decomposition
The Dagum Gini coefficient is a widely used metric for assessing inequality, with particular emphasis on capturing intra-group disparities, inter-group differences, and the effect of regional overlaps. Compared with traditional inequality measures, it provides a more comprehensive explanation of regional disparities by addressing areas those methods typically overlook. This coefficient can be decomposed into three components: intra-regional inequality , inter-regional disparity , and trans-variation or super-variance density , satisfying the relationship: G = + + . Detailed mathematical formulations can be found in Wang et al. [41].
3.4.3. Spatial Correlation Test
This study analyzes the spatiotemporal patterns of new enterprise productivity and uses the Global Moran’s I index to measure overall spatial autocorrelation. The detailed computational formula and methodology are referenced from He et al. [42].
3.4.4. Spatial Markov Chain Estimation
Markov chains are widely used to analyze the dynamic evolution of variables over time, characterized by the “memoryless” property—i.e., the probability of transitioning to a future state depends solely on the current state. In this study, a probability transition matrix spanning d years is constructed using MATLAB 2023b to capture the state transitions of enterprise productivity. However, traditional Markov chains ignore spatial influences from neighboring regions. To address this, a spatial Markov chain model is applied, using spatial lag calculated as the weighted average of nearby values with a spatial weight matrix. For detailed formulas and model specifications, refer to Liao et al. [43].
4. Analysis of New Enterprise Productivity and Its Spatiotemporal Evolution
4.1. Spatiotemporal Evolution of New Enterprise Productivity in the Three Major Urban Agglomerations in the East
This paper takes listed companies from 2021 to 2022 as samples, resulting in 27,638 sample data points after the processing described in the previous section. These were further refined by selecting companies with good foundational productivity development located within the three major urban agglomerations in the eastern region, resulting in 16,606 sample data points. These were matched to their respective cities based on their office addresses, thus determining the productivity level of enterprises in each city. The average new enterprise productivity levels for the three major urban agglomerations are shown in Table 2.
Table 2.
New enterprise productivity of the three major urban agglomerations in the East.
Firstly, the annual average for the three major urban agglomerations in the eastern region during the sample period was 20.934. The annual averages for the Beijing–Tianjin–Hebei, Yangtze River Delta, and Pearl River Delta regions were 19.709, 20.934, and 21.122, respectively, with the Pearl River Delta slightly exceeding the overall average. The reasons for this include its position at the forefront of China’s economic reforms, special policies, and proximity to Hong Kong and Macao, which have facilitated rapid economic development. This has attracted a large number of high-quality talent, enhancing regional innovation levels and promoting the optimization and upgrading of industrial structures, thus transitioning the economy from traditional models to a circular economy [44]. Secondly, from a temporal perspective, the new enterprise productivity in the three major urban agglomerations has generally shown an upward trend, though there were stagnations in 2014, 2020, and 2022. The stagnation in 2014 could be attributed to listed companies adopting a more rational attitude toward research and development, entering a phase of adjustment to find the most efficient R&D models [45]. Additionally, increased investment in environmental protection to control undesirable outputs like pollution, due to heightened attention to environmental quality, may have contributed to a decline in production efficiency [46]. The changes in 2020 and 2022 are likely related to major public health events.
In addition, to study the spatiotemporal evolution of new quality productivity among enterprises in different urban agglomerations, we selected data on new quality productivity from the three major urban agglomerations for the years 2012, 2017, and 2022. We utilized ArcGIS 10.5 to create the spatiotemporal evolution maps, and each city was classified into seven categories using the natural breakpoint method. To ensure comparability among the same city clusters, the natural breakpoints in 2022 were used as the baseline in the Figure 2, Figure 3 and Figure 4. A comparison reveals the following: firstly, the development of new quality productivity of enterprises exhibits a high degree of agglomeration, with the three major city clusters showing imbalanced development spreading outward from the core cities, with the highest and most dense development levels in the core cities within the city clusters, exerting a radiation effect on neighboring cities; secondly, during this period, the development gap in new quality productivity of enterprises between peripheral cities and core cities further widens, and regional imbalances continue to grow, with the Pearl River Delta city cluster showing relatively balanced development; finally, coastal cities have greater potential in the development of new quality productivity compared to inland cities. The rapid development of new quality productivity of enterprises in core cities is mainly attributed to the presence of comprehensive research facilities, resources from higher education institutions, and innovation incubation platforms in these cities, promoting technological innovation and industrial upgrading [47]. Moreover, core cities have a certain suction effect on surrounding cities, making them able to concentrate a large amount of capital, combined with a superior investment environment and efficient financial markets, providing ample sources of funding for emerging industries. Additionally, the well-developed infrastructure in core cities, such as efficient transportation networks and advanced information and communication systems, creates the necessary physical foundation for the growth of new quality productivity. Therefore, enterprises in core cities within city clusters can develop rapidly and lead significantly ahead of other cities. The development of new quality productivity of enterprises in coastal cities may be attributed to their proximity to ports, facilitating trade and international exchanges, and helping to introduce foreign advanced technologies, funds, and management experiences [48].
Figure 2.
Time and space evolution map of new quality productivity of enterprises in the Beijing-Tianjin-Hebei urban agglomeration for the years 2012, 2017, and 2022.
Figure 3.
Time and space evolution map of new quality productivity of enterprises in the Yangtze River Delta urban agglomeration for the years 2012, 2017, and 2022.
Figure 4.
Time and apace evolution map of new quality productivity of enterprises in the Pearl River Delta urban agglomeration for the years 2012, 2017, and 2022.
4.2. Results of Kernel Density Estimation
In the overall analysis of the spatiotemporal evolution of enterprise new quality productivity, this study employed MATLAB 2023b software to plot a kernel density estimation graph based on the Gaussian kernel function (the values of new quality productivity were scaled down to 1% of their original values for improved visualization in the three-dimensional plot). This graph illustrates the dynamic distribution characteristics of enterprise new quality productivity across China’s three major eastern urban agglomerations from 2011 to 2022 (see Figure 5).
Figure 5.
Three-dimensional kernel density map of the three major urban agglomerations in the Eastern region.
The results reveal several important features. From the perspective of polarization trends, the overall distribution across the three urban agglomerations is predominantly unimodal, with minor side peaks that have gradually flattened since 2017. This indicates that significant multipolar differentiation has not yet emerged in enterprise new quality productivity. This pattern can largely be attributed to the implementation of major national regional strategies, such as the coordinated development of the Beijing–Tianjin–Hebei region, the integrated development of the Yangtze River Delta, and the construction of the Guangdong–Hong Kong–Macao Greater Bay Area. These policies emphasize coordinated development within urban agglomerations, thereby preventing excessive competition and resource fragmentation among multiple independent growth poles. From a policy perspective, this suggests that the current development of new quality productivity remains in a “single-core-driven” stage led by core cities, and a multi-centered competitive development pattern has not yet formed.
In terms of distributional position, the main peak of the kernel density curve exhibits a clear rightward shift over time, indicating a gradual improvement in the overall level of new quality productivity across the three urban agglomerations. This rightward movement is primarily driven by the cumulative effects of China’s sustained innovation-driven development strategy, increased R&D investment, and industrial upgrading policies, as well as the rapid growth of strategic emerging industries such as the digital economy and new energy. At a deeper level, the rightward shift of the main peak reflects that China’s enterprise new quality productivity is still in a steady cultivation phase, with its overall level remaining relatively modest and a considerable gap existing before achieving strong international competitiveness.
Regarding the shape of the distribution, the main peak has become lower and wider, suggesting that absolute disparities in new quality productivity among the three urban agglomerations are expanding. This phenomenon is primarily the result of agglomeration economies and path-dependent mechanisms: core cities, benefiting from abundant innovation resources (including universities, research institutes, and industrial funds) and preferential policies, have formed strong self-reinforcing advantages. In contrast, peripheral cities lag behind due to weaker industrial foundations, talent outflow, and relatively underdeveloped infrastructure, making it difficult for them to effectively absorb spillovers from core cities. This trend serves as a warning that, without timely intervention, the development of new quality productivity may further exacerbate regional imbalances and even hinder the realization of national common prosperity goals.
Furthermore, all distribution curves display a pronounced long rightward tail, indicating substantial heterogeneity in new quality productivity across cities, with a small number of leading cities significantly outperforming the majority. This long-tail phenomenon is a typical manifestation of the Matthew effect within regional innovation systems: cities with better initial conditions are able to attract more high-end factors, forming a “winner-takes-all” cycle, while lagging cities face the risk of factor depletion. From a policy perspective, the long right tail highlights that the current development of new quality productivity remains heavily dependent on a few core cities. It is therefore imperative to implement regional coordination mechanisms, industrial gradient transfers, and cross-regional flows of innovation factors to break this entrenched pattern of advantage accumulation and enable more cities to enter high-productivity development trajectories.
Overall, the above kernel density characteristics indicate that although national policies have effectively raised the average level of enterprise new quality productivity, spatial imbalances remain prominent and show signs of further widening. This implies that future policy formulation must place greater emphasis on balancing “efficiency” and “equity” by building a more inclusive regional innovation system, thereby promoting the balanced development of new quality productivity across broader areas and at deeper levels.
To further examine the kernel density distribution of enterprise new quality productivity within each urban agglomeration and to ensure comparability across different groups, two-dimensional kernel density graphs were plotted for the years 2012, 2015, 2019, and 2022 for the Beijing–Tianjin–Hebei, Yangtze River Delta, and Pearl River Delta urban agglomerations, respectively (see Figure 6, Figure 7 and Figure 8).
Figure 6.
Kernel density map of Beijing–Tianjin–Hebei urban agglomeration.
Figure 7.
Kernel density Map of the Yangtze River Delta urban agglomeration.
Figure 8.
Kernel density map of the Pearl River Delta urban agglomeration.
The graphs reveal distinct evolutionary patterns across the three urban agglomerations. First, the Beijing–Tianjin–Hebei region exhibits a clear trend toward multipolar distribution, while the Yangtze River Delta and Pearl River Delta initially displayed bipolar characteristics that gradually evolved toward unipolarity over time. This divergence can be largely attributed to differences in regional development strategies and industrial structures: the Beijing–Tianjin–Hebei region benefits from the dual-core driving force of Beijing and Tianjin, supported by national policies promoting coordinated development, which has fostered the emergence of multiple growth centers. In contrast, the Yangtze River Delta and Pearl River Delta have increasingly concentrated their innovation resources in core cities such as Shanghai and Guangzhou due to stronger agglomeration effects and path dependence. From a policy perspective, the relatively balanced development observed in the Pearl River Delta suggests that more effective regional coordination mechanisms can help mitigate excessive polarization.
Second, the right tails of the kernel density curves for all three urban agglomerations have continued to lengthen, particularly one of the side peaks in the Beijing–Tianjin–Hebei region. This lengthening tail indicates growing heterogeneity and the presence of a small number of high-performing cities that significantly outperform others within the same agglomeration. Such a pattern is consistent with the Matthew effect in regional innovation systems, where cities with initial advantages in talent, capital, and policy support tend to accumulate further resources, thereby widening intra-regional disparities.
Finally, a general trend of decreasing peak height and slightly increasing width is observed across the three urban agglomerations. This change implies that absolute disparities in enterprise new quality productivity are expanding within each cluster. The underlying reason lies in the cumulative nature of innovation resources and industrial upgrading: core cities continue to strengthen their leading positions through superior infrastructure and innovation ecosystems, while peripheral cities struggle to catch up due to weaker foundational conditions and limited spillover absorption capacity. This widening dispersion serves as an important warning that, without timely policy intervention, the development of new quality productivity may further exacerbate intra-regional imbalances, ultimately hindering the goal of coordinated and high-quality development across urban agglomerations.
4.3. Dagum Gini Coefficient Analysis
As shown in Table 3, the Dagum Gini coefficient for new enterprise productivity increased slightly from 0.672 in 2012 to 0.686 in 2022. This minor increase over the study period, totaling a growth of only 2.08%, indicates that although regional disparities in new enterprise productivity exist among the three major eastern city clusters, the degree of expansion is controlled. Moreover, the intra-regional disparity in new enterprise productivity within the period ranged from 0.245 to 0.255, which is greater than the disparity between different city clusters (0.059 to 0.090). When considering volatility, the fluctuation in differences between city clusters is greater than the fluctuation within city clusters.
Table 3.
Dagum Gini coefficient table.
Additionally, the slight decline in the hyperbolic density indicates that the crossover overlap among samples still significantly impacts the overall disparities in new enterprise productivity. Hyperbolic density is a major factor contributing to the overall disparities in new enterprise productivity among the three major eastern city clusters in China, with a contribution rate ranging from 49.696% to 54.366%, averaging at 51.84%. This suggests that there are overlapping levels of new enterprise productivity among different city clusters, and some cities have similar levels of development, revealing a significant disparity and low convergence in the development levels among cities. A high hyperbolic density indicates that the classification of city clusters significantly impacts the overall disparities. However, basing the analysis solely on city clusters might omit the city differences caused by non-grouped factors [49]. Therefore, using the Dagum Gini coefficient for a comprehensive analysis of city development level disparities allows for a more thorough identification of contributions from within and outside the city clusters.
From 2012 to 2022, it can be seen from Table 4 that the regional differences were relatively stable, with a contribution rate of approximately 37%. Meanwhile, the contribution rate of inter-group differences gradually increased significantly, reaching 13.152%. The contribution rate in 2019 was 15.50%, indicating that regional differences were still an important component of overall differences.
Table 4.
Dagum Gini coefficient decomposition table.
4.4. Spatial Correlation Analysis
The global Geary’s C index and global Moran’s I index of firms’ new quality productivity were calculated (see Table 5). From 2012 to 2022, the new quality productivity of firms in the three major urban agglomerations showed significant positive spatial correlation, indicating a clustering trend within these regions. Specifically, both the Geary’s C index and the Moran’s I index reached a significance level of 1%. Additionally, the fluctuations of these two indices over the eleven-year period revealed non-random distribution characteristics. In particular, the Moran’s I index showed fluctuations in 2014 and 2020 but gradually increased to 0.394 by 2022, indicating a trend of increasing spatial correlation of new quality productivity among firms amidst these fluctuations.
Table 5.
Geary’s C index and Moran’s I index of new quality productivity of enterprises.
At the same time, this paper analyzes the spatial clustering pattern of firms’ new quality productivity in various cities using the Local Moran’s I index. Figure 9 reveals that most cities within the three major urban agglomerations in the east are concentrated in the third quadrant, exhibiting a predominance of low-low clustering spatially. According to Table 6, the number of cities in this category increased from 28 cities (58.33%) in 2012 to 33 cities (68.75%) in 2022. Meanwhile, the number of cities in the first quadrant remained relatively stable, with core cities such as Beijing, Shanghai, and Shenzhen consistently showing high-high clustering patterns, increasing only to 10 cities (20.83%) by 2022. This reflects the “siphon effect” of central cities, leading to regional disparities that are a common issue needing urgent resolution in the three major urban agglomerations [49].
Figure 9.
Partial Moran scatter plot from 2012 to 2022.
Table 6.
Local Moran’s I scatter graph spatial clustering table.
4.5. Results of the Spatial Markov Chain Analysis
When studying the dynamics of new quality productivity among firms in urban agglomerations, this research uses the Markov transition probability matrix as an analytical tool (see Table 7). The data indicate that the probability of provinces maintaining the same level of new quality productivity is generally higher than the probability of transitioning to a different level, with diagonal elements being greater than other elements. Specifically, the probabilities of staying at the original level after one year are: low level 90.90%, medium–low level 85.12%, medium–high level 85.71%, and high level 96.64%. This indicates a high level of stability across economic development levels, showing a “club convergence” effect. Additionally, cities at low and high levels are more likely to maintain their status quo, while cities at intermediate levels are more prone to level transitions. Transitions between levels typically occur between adjacent levels, indicating that the development of new quality productivity is continuous rather than abrupt. The probabilities of moving up one level are: low level 9.09%, medium–low level 7.4%, and medium–high level 8.4%. This suggests that the development of new quality productivity is a process with strong inertia. Meanwhile, the probabilities of moving down one level for medium–low, medium–high, and high levels are 7.4%, 5.9%, and 3.4% respectively, indicating a low risk of regression, which decreases as new quality productivity increases. Therefore, cities need to enhance their support for the development of new quality productivity to achieve higher levels of development.
Table 7.
Probability matrix of new productivity transfer of enterprises in three major urban Agglomerations from 2012 to 2022.
In addition, the significant positive Moran’s index in previous studies indicated the need to consider spatial factors, and a spatial Markov transition probability matrix was established (see Table 8). Firstly, the table shows that under different levels of new productivity among enterprises in neighboring cities, the probability of transfer in the development of new productivity among enterprises in this city is also different. Secondly, analyzing the impact of neighboring productivity levels on regional productivity changes; it was found that the main diagonal elements are still greater than other elements, and the solidification ability is stronger in neighboring low-level cities, while the sustainability is stronger in neighboring high-level cities. On the contrary, when the new productivity of neighboring city enterprises is at a medium-low or medium-high level, there is a certain probability of transferring to adjacent levels. Therefore, when developing new quality productivity in urban enterprises, we should be wary of the phenomenon of “low-level traps” and “high-level monopolies”.
Table 8.
Probability matrix of spatial transfer of new productive forces among enterprises in the three major urban agglomerations from 2012 to 2022.
4.6. Discussion
The empirical findings presented in this section offer several important insights into the development patterns and underlying mechanisms of enterprise new quality productivity (NQP) in China’s three major eastern urban agglomerations.
First, the relatively more balanced development observed in the Pearl River Delta compared to the Beijing–Tianjin–Hebei region can be attributed to both institutional and geographical factors. Institutionally, the Pearl River Delta has long benefited from a market-oriented economic system with a high proportion of private enterprises and greater openness to foreign investment, which has fostered a more flexible and competitive industrial ecosystem. Geographically, its proximity to Hong Kong and Macao has facilitated continuous inflows of advanced technologies, management practices, and international capital. In contrast, the Beijing–Tianjin–Hebei region, while possessing strong innovation resources concentrated in Beijing, faces challenges due to excessive administrative centralization and resource concentration, leading to a more pronounced core-periphery imbalance. This comparison highlights that institutional flexibility and openness may play a more decisive role than sheer resource endowment in achieving balanced regional development of new quality productivity [50].
Second, the spatial Markov chain analysis reveals the existence of both a “low-level trap” and a “high-level monopoly” phenomenon. The low-level trap indicates that cities with low NQP tend to remain in a disadvantaged state over time, largely due to path dependence, talent and capital outflow, and weak industrial foundations that limit their ability to absorb spillovers from core cities. Conversely, the high-level monopoly reflects that high-NQP cities are more likely to maintain or strengthen their leading positions through strong agglomeration effects and cumulative advantage. From a theoretical perspective, these findings challenge the traditional neoclassical convergence hypothesis and lend strong support to new economic geography theory, which emphasizes increasing returns to scale, agglomeration economies, and self-reinforcing spatial inequalities. They also suggest that without effective policy intervention, the development of new quality productivity may reinforce rather than alleviate regional disparities.
Third, the discovery of significant positive spatial spillover effects of enterprise NQP aligns with the core predictions of new economic geography and knowledge spillover theory, which argue that innovation activities tend to diffuse through geographic proximity, labor mobility, and industrial linkages [51]. However, our findings also present certain challenges to existing theories. In the Chinese context, spatial spillovers appear to be heavily influenced by institutional factors such as administrative boundaries and policy interventions, which may either amplify or constrain the natural diffusion process. This implies that traditional Western-centric spatial theories need to be contextualized when applied to emerging economies with strong government involvement.
Additionally, the overall results underscore the dual nature of China’s new quality productivity strategy. On the one hand, national policies have successfully driven the average level of NQP upward, as evidenced by the rightward shift in kernel density distributions. On the other hand, the widening disparities and persistent core-periphery patterns indicate that the current growth model remains highly concentrated, potentially undermining the goal of common prosperity. These findings also highlight the importance of micro-level enterprise dynamics in shaping macro-level regional development, suggesting that future research should further explore firm-level mechanisms that mediate spatial spillover effects.
In summary, this study not only enriches the understanding of the spatiotemporal characteristics of new quality productivity at the enterprise level but also provides important theoretical and policy implications for promoting more inclusive and coordinated high-quality development in China.
5. Analysis of the Impact of New Quality Productivity and Market Potential on Enterprises
5.1. Variable Explanation and Data Explanation
5.1.1. Core Explanatory Variable
This study employs the newly developed enterprise new quality productivity index (NQPE), constructed from the aforementioned indicator system, as the primary explanatory variable. By matching the geographic location of each enterprise’s office to its corresponding city, the local level of enterprise new quality productivity is assessed. Given the substantial variation in values across cities, a logarithmic transformation is applied to better capture and compare the local enterprise new quality productivity.
5.1.2. Core Explained Variable
Market Potential (MPot) reflects the overall market size that a city may obtain or the impact of demand factors (including market, income, etc.) distributed in space on the city’s economy. This article refers to the construction method of scholars such as Han Feng et al. and represents market potential as [52]:
where, is the total income of the city, and represents the distance between cities; is the distance between city and city ; is the distance decay coefficient; is the total number of cities; is the city index. In particular, while most of the literature uses regional GDP, to align with the traditional Harris Market Potential, this article approximates local final demand with the total retail sales of consumer goods in the city’s urban area (in 10,000 yuan).
5.1.3. Control Variables
The control variables selected in this article include:
1. Financial Development Level (Fin): Measured by the natural logarithm of the year-end balance of deposits and loans of financial institutions. Financial development is a critical external condition affecting enterprises’ innovation investment and market expansion. A higher level of financial development can provide enterprises with sufficient funding support, thereby promoting technological innovation and the release of market potential. Therefore, it is necessary to control for this variable.
2. Informationization Level (Int): Measured by the natural logarithm of the ratio of Internet users per 10,000 people to the permanent resident population. This indicator reflects the level of regional digital infrastructure development and can significantly influence enterprises’ digital transformation and data element utilization efficiency, which in turn affect the development of new quality productivity and the expansion of market potential. Hence, it is included as a control variable.
3. Regional Transportation Infrastructure (road): Measured by the natural logarithm of graded highway mileage. Well-developed transportation infrastructure can reduce enterprises’ logistics costs, promote inter-regional factor mobility and market integration, and exert a significant influence on the spatial spillover effects of enterprise new quality productivity and the enhancement of market potential. Thus, it is controlled for in this study.
4. Infrastructure Level (Inf): Measured by the natural logarithm of the number of books per hundred people in public libraries. This indicator reflects the foundational conditions of regional public services and human capital cultivation. It can indirectly influence enterprises’ innovation capabilities and market competitiveness by improving labor quality. Therefore, it is included as a control variable.
5.1.4. Regression Model Selection and Design
The study takes the market potential of city clusters as the explained variable and establishes a baseline regression model with local enterprise new quality productivity as the explanatory variable to test its effect on local market potential:
where represents the market potential level of city i in the city cluster at time t; is used to measure the enterprise new quality productivity level of the same city at time t; covers the variables that need to be controlled, including the level of financial development, informationization level, regional transportation infrastructure, and infrastructure level; is a constant term; and are the coefficients of enterprise new quality productivity and control variables on market potential; and are fixed effects used to control regional and time differences; and is the random error term.
To further explore the spatial effects of enterprise new quality productivity on market potential in the three major city clusters in the eastern region, it is necessary to introduce a spatial econometric model. A spatial Durbin model is specifically constructed as follows:
In this model, W is defined as the economic distance spatial weight matrix. , , and represent the spatial lag terms of the dependent variable, the independent variable, and the control variables, respectively, while ρ represents the spillover effect of the dependent variable (market potential) in the spatial analysis. θ1 and θ2 represent the coefficients of the spatial lag term of the independent variable and the coefficient vector of the spatial lag term of the control variables, respectively. refers to specific spatial fixed effects covering the unique influence of that space. reflects specific effects in the time dimension. Finally, represents the random error term in the model.
5.2. Benchmark Regression
First, the VIF test was conducted on the model, and the VIF values of each variable did not exceed 10, indicating that there was no multicollinearity issue among the variables. Subsequently, a double fixed-effects regression was performed on the baseline model established earlier. The results of the baseline regression are shown in Table 9. In Table 9, column (1) shows the results of the regression of only the core explanatory variables and core explained variables, while column (2) adds individual fixed effects and time fixed effects to column (1). Column (3) shows the results of the regression after adding control variables, and column (4) adds double fixed effects on this basis. The regression coefficients of the new quality productivity in all four regression results are significantly positive at the 1% level, indicating that the results are robust and showing that the new quality productivity of enterprises in various regions inevitably generates new market demand. On the one hand, this is achieved by continuously iterating traditional products to expand the market scope, and on the other hand, it is done by producing new products to meet new demands [53]. This is specifically manifested as a further increase in market potential, thereby confirming hypothesis H1.
Table 9.
Benchmark regression results.
5.3. Robustness and Endogeneity Tests
In order to further verify the reliability of the regression results presented earlier, this study will conduct a series of robustness and endogeneity tests. Firstly, the fissurization process will be applied, where all variables will undergo a 1–99% two-tailed fissurization to eliminate the impact of extremes on the results. Secondly, the exclusion of direct-controlled municipalities will be conducted. Economic imbalances among regions may also lead to inconsistent effects of new quality productivity empowerment. Therefore, Beijing, Shanghai, and Tianjin—the three directly-controlled municipalities—will be excluded, and the regression will be conducted again. The regression results are shown in Table 10 under columns (1) and (2). It can be observed that under both robustness testing methods, the new quality productivity of enterprises is significantly positive at the 1% and 5% levels, indicating a significant promotional effect of enterprise new quality productivity on market potential, further confirming the research conclusions of this study.
Table 10.
Robustness and endogeneity testing.
Due to the presence of several potential factors affecting market potential, there may still be issues related to endogeneity. Therefore, this study further employs the Two-Stage Least Squares Instrumental Variables (2SLS-IV) and Generalized Method of Moments (GMM) models for re-estimation. Firstly, in the selection of instrumental variables, the lagged period of the core explanatory variable is selected as the instrumental variable for the current enterprise new quality productivity. Market potential is mainly influenced by the current new quality productivity, and the impact of the lagged period new quality productivity on current market potential is limited. However, the current and lagged levels of new quality productivity are correlated, thus meeting the criteria for instrumental variable selection. The results of Models 4 and 5 in Table 10 show that the regression coefficient of L.NPro is significantly positive at the 1% level, indicating a positive correlation between the lagged period new quality productivity of enterprises and current new quality productivity. Additionally, the F-statistic value of the weak instrumental variables test is greater than the critical value of 16.38, significantly rejecting the null hypothesis of “weak instrumental variables” and confirming the effectiveness of the selected instrumental variables. The significance of the regression coefficient of NPro is also positive, consistent with the baseline regression results. Therefore, after controlling for potential endogeneity issues using the instrumental variable method, the regression results of this study remain robust. Secondly, regarding the Generalized Method of Moments (GMM), Blundell and Bond proposed that the system GMM estimation technique can effectively alleviate endogeneity bias in the model, considering that market potential may be influenced by historical levels [54]. Therefore, this study re-estimated using the system GMM method, as shown in Model 5. The results indicate that according to the test results, the instrumental variables are effective. Additionally, new quality productivity is significantly positively correlated, suggesting that the assumption still holds true after the system GMM re-estimation, ensuring the robustness of the earlier conclusions. To address potential endogeneity issues arising from reverse causality and omitted variables between enterprise new quality productivity and market potential, this study employs an instrumental variable (IV) approach. The instrumental variable is constructed as the interaction term between the natural logarithm of the spherical distance and the lagged term of the natural logarithm of enterprise new quality productivity.
This instrument is theoretically appropriate for the following reasons: spherical distance is exogenous and does not directly influence local market potential, while the interaction with the lagged Npro term effectively captures the dynamic spatial spillover channels through which geographic proximity affects productivity development over time. The first-stage regression results (column 1, Table 11) show that the Kleibergen–Paap rk LM statistic is 121.263 (p < 0.01), strongly rejecting the null hypothesis of under-identification. Moreover, the Kleibergen–Paap rk Wald F statistic is 141.245, which is substantially higher than the Stock–Yogo critical value of 16.38, confirming that the instrument is both relevant and strong, thus satisfying the requirements for valid instrumental variables. The second-stage regression results are reported in column (2). The coefficient of enterprise new quality productivity (Npro) is 0.202 and statistically significant at the 1% level. This result is consistent with the baseline regression findings, indicating that after addressing endogeneity concerns, the enhancement of enterprise new quality productivity still exerts a significant positive causal effect on local market potential. This provides robust empirical support for Hypothesis H1.
Table 11.
Instrumental Variable (IV) Tests.
5.4. Spatial Econometric Analysis
5.4.1. Spatial Correlation Test Results
In order to investigate the spatial correlation between new quality productivity and market potential, this paper uses the reciprocal of the logarithm of per capita GDP of cities as the economic distance between regions to construct a spatial weight matrix. Using the constructed economic distance spatial weight matrix, a spatial correlation test is performed on the logarithmic values of new quality productivity and market potential. The global Moran’s I index is used for the test, and the results of the test are shown in Table 12. As analyzed in the table, the data indicate that the Moran’s I index of enterprise new quality productivity and market potential are both significantly positive, indicating the presence of spatial autocorrelation between new quality productivity and market potential.
Table 12.
Moran’s I.
5.4.2. Spatial Model Selection Test
Before conducting spatial effect analysis, it is necessary to determine a reasonable spatial econometric model. Therefore, tests such as LR, Hausman, and Wald tests were conducted, and the results are shown in Table 13 [55]. The table shows that all tests are passed, and the spatial Durbin model does not reduce to SEM or SAR. Comparing different fixed effects, the two-way fixed effects model is found most suitable, supporting the use of the spatial Durbin model with both time and individual effects for spatial analysis.
Table 13.
Spatial regression model validation.
5.4.3. Results of Spatial Regression Analysis
In order to further validate the spatial spillover effect of new quality productivity, this paper adopted spatial econometric methods to further discuss the relationship between new quality productivity and market potential. In the spatial econometric analysis, this study constructs an economic distance-based spatial weight matrix, followed by row standardization. Although this approach differs from the conventional method that relies solely on geographic distance, it is theoretically justified and practically relevant. First, from a theoretical standpoint, the literature on new economic geography and regional economics emphasizes that spatial spillover effects depend not only on geographic proximity but also on the similarity and complementarity of economic activities. By using the inverse of the difference in logged per capita GDP as the measure of economic distance, this study effectively captures stronger economic linkages and factor mobility between cities with similar levels of economic development, which aligns closely with the core concept of “economic proximity.” Second, in the context of China’s regional development, geographic proximity alone often fails to accurately reflect the actual intensity of economic interactions between cities. Cities with comparable economic development levels tend to exhibit greater similarities in industrial structure, technological capabilities, and policy environments, thereby facilitating technology diffusion, talent flows, and industrial chain collaboration. Therefore, constructing the spatial weight matrix based on the inverse of the logarithmic difference in per capita GDP enables a more realistic representation of the economic mechanisms underlying the spatial spillovers of new quality productivity, rather than relying merely on geographic closeness. The regression results are presented in Table 14.
Table 14.
Spatial econometric regression results.
Firstly, the regression results show that its main effects are consistent with the benchmark regression results. Secondly, the Wx term in column (2) indicates a positive spatial spillover effect of new quality productivity of local enterprises. Finally, to verify this spatial effect of enterprise new quality productivity, this paper further constructed a spatial Durbin model to decompose the impact of new quality productivity on market potential into direct effects, indirect effects, and total effects. The results show that the direct effect, indirect effect, and total effect of new quality productivity on market potential are all significantly positive. This indicates that the development of new quality productivity of local enterprises exhibits a significantly positive spatial spillover effect, promoting the development of new quality productivity in neighboring areas. Moreover, it not only fosters the development of market potential in the local area but also contributes to enhancing the market potential of adjacent areas. In other words, the development of local enterprise new quality productivity can have a radiating effect on the improvement of market potential in neighboring cities. Ultimately, hypothesis H2 is confirmed.
Exploring the reasons behind this, firstly, it might be influenced by the flow of talents, technology, and other innovative resources [31]. Secondly, new quality productivity relies on modern information networks, with digitized knowledge and information as key production elements, possessing characteristics of penetrability, integration, and collaboration. These characteristics enable new quality productivity to break geographical boundaries and have cross-regional impact in terms of technological innovation, knowledge diffusion, industrial agglomeration, industrial chain collaboration, and infrastructure development [25]. Additionally, when the level of new quality productivity of local enterprises increases, it can promote the cross-regional diffusion and development of industries and strengthen interaction and connection between industries in different regions, thereby promoting the construction of modern industrial systems in surrounding areas [15].
In order to ensure the robustness of the research conclusion, this study further tested the robustness of the inverse distance square matrix and economic geography matrix. The regression results show that the signs, magnitudes, and significance levels of the main explanatory variables remain highly consistent with those obtained from the baseline model (economic distance matrix). The core conclusions are not materially altered, indicating that the primary findings of this study are robust. The specific regression structure is shown in Table 15 and Table 16.
Table 15.
Robustness test of spatial Durbin model 1.
Table 16.
Robustness test of spatial Durbin model 2.
6. Conclusions and Policy Recommendations
This study constructs a comprehensive evaluation system for enterprise new quality productivity (NQP) using 27 tertiary indicators across three core dimensions: revolutionary technological breakthroughs, deep industrial transformation and upgrading, and innovative allocation of production factors. Employing the game theory-based TOPSIS method, the study measures the NQP levels of listed enterprises in China’s three major eastern urban agglomerations from 2012 to 2022. The empirical results reveal several key findings. First, enterprise NQP in these regions has exhibited a slow but steady upward trend, indicating initial progress in policy implementation. Second, significant regional disparities persist, with pronounced polarization between core and peripheral cities, particularly evident in the Beijing–Tianjin–Hebei region. Third, spatial analysis using kernel density estimation, the Dagum Gini coefficient, Moran’s I index, and spatial Markov chains demonstrates strong spatial agglomeration and path-dependent development characteristics, suggesting that enterprise NQP is significantly influenced by neighboring cities. Fourth, improvements in enterprise NQP not only enhance local market potential but also generate positive spatial spillover effects on neighboring areas, supporting the proposed hypotheses. These findings underscore the importance of nurturing new quality productive forces as a strategic pathway to unlocking domestic economic potential and addressing the dual challenges of international competition and industrial transformation.
Based on the above empirical evidence, the following policy recommendations are proposed:
First, governments at both central and local levels should prioritize the development of innovation-driven ecosystems. This includes strengthening top-level design to optimize the “technology–industry–finance” nexus, increasing support for basic research and key “bottleneck” technologies, and establishing more effective mechanisms for the transformation of scientific and technological achievements. Particular attention should be paid to reducing regional disparities by implementing targeted innovation resource transfer mechanisms that favor peripheral cities within urban agglomerations.
Second, enterprises should be encouraged to play a more proactive role in building innovation networks. Leading firms should increase R&D investment, foster cross-regional collaboration, and actively participate in the construction of industrial technology innovation consortia. By breaking down regional barriers and strengthening supply chain linkages, enterprises can better leverage the spillover effects of new quality productivity to expand market potential.
Third, educational and research institutions should deepen industry–university–research collaboration and accelerate the cultivation of high-quality talent aligned with the needs of new quality productive forces. This involves reforming talent evaluation systems, promoting interdisciplinary education, and establishing joint training platforms to provide sustained intellectual support for enterprise innovation and industrial upgrading.
This study has several limitations that should be acknowledged. First, due to data availability, the analysis is limited to listed enterprises in the three eastern urban agglomerations from 2012 to 2022, which may restrict the generalizability of the findings to non-listed firms, other regions, or longer time periods. Second, although various robustness checks were conducted, the potential endogeneity issues inherent in the relationship between new quality productivity and market potential warrant further causal identification in future studies. Third, the measurement of new quality productivity, while comprehensive, still relies on proxy indicators, and more refined metrics could be developed as data availability improves. Future research could extend the analysis to central and western regions, explore the micro-mechanisms underlying spatial spillovers, or adopt quasi-experimental methods to better establish causality.
Author Contributions
Methodology, S.Y. and Y.C. (Yi Chai); Software, J.S.; Validation, Y.C. (Yi Chai); Investigation, X.W.; Resources, S.Y.; Data curation, J.S.; Writing—review and editing, J.S., S.Y. and Y.C. (Yiniu Cui); Supervision, X.W. and Y.C. (Yiniu Cui); Project administration, J.S. All authors have read and agreed to the published version of the manuscript.
Funding
This research was funded by the National Natural Science Foundation of China under grant number 72402152 and by the Yunnan Provincial Department of Transport Science and Technology Innovation and Demonstration Project under grant number 2024-39.
Institutional Review Board Statement
Not applicable.
Informed Consent Statement
Not applicable.
Data Availability Statement
The main sources of research data in this article include the “China City Statistical Yearbook,” the National Bureau of Statistics website (https://www.stats.gov.cn/), websites of statistical bureaus of various provinces (regions, cities), data and statistical bulletins published by the government, the Annual reports of relevant listed companies (http://www.cninfo.com.cn/new/index), and the CSMAR database (https://www.stats.gov.cn/). The data presented in this study are available upon request from the corresponding authors.
Conflicts of Interest
The authors declare no conflicts of interest.
References
- Jia, R.; Wang, J.; Dou, H. Promoting high-quality regional development through new productive forces. Reform 2024, 3, 38–47. [Google Scholar]
- Zhou, W.; Xu, L. On new quality productive forces: Connotation, characteristics and key points. Reform 2023, 10, 1–13. [Google Scholar]
- Wu, J.; Xia, Q.; Li, Z. Green innovation and enterprise green total factor productivity at a micro level: A perspective of technical distance. J. Clean. Prod. 2022, 344, 131070. [Google Scholar] [CrossRef] [Scilit]
- Marx, K. Capital Volume 1; Lulu Press: Durham, NC, USA, 2018; p. 1867. [Google Scholar]
- Solow, R.M. Technical change and the aggregate production function. Rev. Econ. Stat. 1957, 39, 312–320. [Google Scholar] [CrossRef] [Scilit]
- Romer, P.M. Increasing returns and long-run growth. J. Political Econ. 1986, 94, 1002–1037. [Google Scholar] [CrossRef] [Scilit]
- Cato, M.S. Green Economics: An Introduction to Theory, Policy and Practice; Earthscan/Routledge: Abingdon, UK, 2012; Volume 1, pp. 1–200. [Google Scholar]
- Henderson, H. Ethical Markets: Growing the Green Economy; Chelsea Green Publishing: White River Junction, VT, USA, 2007; Volume 1, pp. 1–180. [Google Scholar]
- Dosi, G. Sources, procedures, and microeconomic effects of innovation. J. Econ. Lit. 1988, 26, 1120–1171. [Google Scholar]
- Lundvall, B.Å.; Johnson, B.; Andersen, E.S.; Dalum, B. National systems of production, innovation and competence building. Res. Policy 2002, 31, 213–231. [Google Scholar] [CrossRef] [Scilit]
- Färe, R.; Grosskopf, S.; Norris, M.; Zhang, Z. Productivity growth, technical progress, and efficiency change in industrialized countries. Am. Econ. Rev. 1994, 84, 66–83. [Google Scholar]
- Levinsohn, J.; Petrin, A. Estimating production functions using inputs to control for unobservables. Rev. Econ. Stud. 2003, 70, 317–341. [Google Scholar] [CrossRef] [Scilit]
- Chen, S.; Golley, J. ‘Green’ productivity growth in China’s industrial economy. Energy Econ. 2014, 44, 89–98. [Google Scholar] [CrossRef] [Scilit]
- Brandt, L.; Van Biesebroeck, J.; Wang, L.; Zhang, Y. WTO accession and performance of Chinese manufacturing firms. Am. Econ. Rev. 2017, 107, 2784–2820. [Google Scholar] [CrossRef] [Scilit]
- Yan, Y.; Li, K.; Wang, X. Urban networks in the Yangtze River Delta from the perspective of transaction linkages in manufacturing industries: Characteristics, determinants, and strategies for intercity integration development. Systems 2023, 11, 401. [Google Scholar] [CrossRef] [Scilit]
- Gerguri, S.; Ramadani, V. The impact of innovation into the economic growth. Int. J. Econ. Bus. Res. 2010, 2, 1–13. [Google Scholar]
- Hausman, A.; Johnston, W.J. The role of innovation in driving the economy: Lessons from the global financial crisis. J. Bus. Res. 2014, 67, 2720–2726. [Google Scholar] [CrossRef] [Scilit]
- Pohulak-Żołędowska, E. Innovation in contemporary economies. Oeconomia Copernic. 2016, 7, 451–466. [Google Scholar] [CrossRef] [Scilit]
- Zhang, Y.; Khan, U.; Lee, S.; Salik, M. The influence of management innovation and technological innovation on organization performance: A mediating role of sustainability. Sustainability 2019, 11, 495. [Google Scholar] [CrossRef] [Scilit]
- Li, R.; Rao, J.; Wan, L. The digital economy, enterprise digital transformation, and enterprise innovation. Manag. Decis. Econ. 2022, 43, 2875–2886. [Google Scholar] [CrossRef] [Scilit]
- Wang, Y.; He, Y. Environmental regulations, relocation of heavy polluting enterprises and collaborative governance effect: Evidence based on the establishment of subsidiaries in different places. Econ. Sci. 2021, 5, 130–145. [Google Scholar]
- Audretsch, D.B.; Feldman, M.P. R&D spillovers and the geography of innovation and production. Am. Econ. Rev. 1996, 86, 630–640. [Google Scholar]
- Breschi, S.; Lissoni, F. Knowledge spillovers and local innovation systems: A critical survey. Ind. Corp. Change 2001, 10, 975–1005. [Google Scholar] [CrossRef] [Scilit]
- Jaffe, A.B.; Trajtenberg, M.; Henderson, R. Geographic localization of knowledge spillovers as evidenced by patent citations. Q. J. Econ. 1993, 108, 577–598. [Google Scholar] [CrossRef] [Scilit]
- Rodríguez-Pose, A.; Crescenzi, R. Research and development, spillovers, innovation systems, and the genesis of regional growth in Europe. Reg. Stud. 2008, 42, 51–67. [Google Scholar] [CrossRef] [Scilit]
- Castellano, R.; Musella, G.; Punzo, G. How do agglomeration externalities and workforce skills drive innovation? Empirical evidence from Italy. J. Knowl. Econ. 2024, 15, 6737–6760. [Google Scholar] [CrossRef] [Scilit]
- Wu, F.; Hu, H.; Lin, H.; Ren, X. Digital transformation of enterprises and capital market performance: Empirical evidence from stock liquidity. Manag. World 2021, 7, 130–144. [Google Scholar]
- He, J.; Nie, L.; Jin, R. The impact of coupling digital industrialization and industrial digitization on green and low carbon development: Evidence from China. Front. Environ. Econ. 2026, 2, 1763905. [Google Scholar] [CrossRef] [Scilit]
- Song, J.; Zhang, J.; Pan, Y. Research on the impact of ESG development on new quality productivity of enterprises: Empirical evidence from Chinese A-share listed companies. Contemp. Econ. Manag. 2024, 6, 1–11. [Google Scholar]
- Yao, J.; Zhang, K.; Guo, L.; Feng, X. How can artificial intelligence improve enterprise production efficiency? From the perspective of labor skill structure adjustment. Manag. World 2024, 2, 101–122. [Google Scholar]
- Song, H.; Hou, J.; Zhang, Y. Catalytic capacity of technological innovation: Multidimensional definition and measurement from the perspective of knowledge spillover. Technol. Soc. 2022, 68, 101898. [Google Scholar] [CrossRef] [Scilit]
- Zhou, K.; Wang, R.; Tao, Y.; Zheng, Y. The green transformation of enterprises and the risk of stock price collapse. Manag. Sci. 2022, 6, 56–69. [Google Scholar]
- Wang, Z.; Cao, Y.; Lin, S. The impact of environmental regulation on corporate green technology innovation: Features and heterogeneity. Stud. Sci. Sci. 2021, 39, 1506–1515. [Google Scholar]
- Mao, J.; Guo, Y.; Cao, J.; Xu, J. Financing platform debt and environmental pollution control. Manag. World 2022, 10, 96–118. [Google Scholar]
- Shen, G.; Zou, J. Total Factor Productivity in China’s Manufacturing Sector in the Aftermath of the Global Financial Crisis. China World Econ. 2023, 31, 1–25. [Google Scholar] [CrossRef] [Scilit]
- Zhang, L.; Li, S. The impact of digital innovation cooperation on Green Total Factor Productivity of Chinese High-Energy-Consuming Enterprises. Sustainability 2026, 18, 1715. [Google Scholar] [CrossRef] [Scilit]
- Lin, S.; Ge, Y. Economic policy relevance, corporate governance, and investment efficiency. Mod. Econ. Explor. 2021, 3, 63–76. [Google Scholar]
- Ju, W.; Wu, J.; Kang, Q.; Jiang, J.; Xing, Z. Fire risk assessment of subway stations based on combination weighting of Optimized Combination and TOPSIS method. Sustainability 2022, 14, 7275. [Google Scholar] [CrossRef] [Scilit]
- Noor, A.M.; Fauadi, M.M.; Jafar, F.A.; Nordin, M.H.; Yahaya, S.H.; Ramlan, S.; Aziz, M.S.A. Fuzzy Analytic Hierarchy Process (FAHP) integrations for decision making purposes: A review. J. Adv. Manuf. Technol. 2017, 11, 139–154. [Google Scholar]
- Gramacki, A. Nonparametric Kernel Density Estimation and Its Computational Aspects; Springer: Cham, Switzerland, 2018. [Google Scholar]
- Yang, H.; Qi, T.; Wang, Y.; Hong, T. Spatio-temporal dynamics and driving factors of coupling coordination in China’s innovation–platform–commercialization system. Systems 2026, 14, 525. [Google Scholar] [CrossRef] [Scilit]
- He, S.; Fang, B.; Xie, X. Temporal and spatial evolution and driving mechanism of urban ecological welfare performance from the perspective of high-quality development: A case study of Jiangsu Province, China. Land 2022, 11, 1607. [Google Scholar] [CrossRef] [Scilit]
- Liao, Z.; Liang, S.; Wang, X. Spatio-temporal evolution and driving factors of green innovation efficiency in the Chinese urban tourism industry based on spatial Markov chain. Sci. Rep. 2024, 14, 10671. [Google Scholar] [CrossRef] [Scilit] [PubMed]
- Cheshmehzangi, A.; Tang, T. Pearl River Delta city cluster: From dual-core structure economic development strategies to regional economic plans. China’s City Clust. Dev. Race Carbon Neutrality 2022, 1, 63–75. [Google Scholar]
- Wei, P. The Bias Between Changes in Total Factor Productivity and Technological Changes in China. Master’s Thesis, Hunan Normal University, Changsha, China, 2018. [Google Scholar]
- Guo, J. The Moderating Effect of Independent Technology Directors on the Relationship Between R&D Investment Intensity and Corporate Value. Master’s Thesis, Jilin University of Finance and Economics, Changchun, China, 2018. [Google Scholar]
- Fang, C.; Yu, D. Urban agglomeration: An evolving concept of an emerging phenomenon. Landsc. Urban Plan. 2017, 162, 126–136. [Google Scholar] [CrossRef] [Scilit]
- Fu, X. Foreign direct investment, absorptive capacity and regional innovation capabilities: Evidence from China. Oxf. Dev. Stud. 2008, 36, 89–110. [Google Scholar] [CrossRef] [Scilit]
- Dong, X.; Zhang, C.; Liu, X. Development measurement of urban agglomerations in China: Based on 19 major urban agglomerations. Reg. Econ. Rev. 2024, 2, 100–110. [Google Scholar]
- Glaeser, E.L.; Kallal, H.D.; Scheinkman, J.A.; Shleifer, A. Growth in cities. J. Political Econ. 1992, 100, 1126–1152. [Google Scholar] [CrossRef] [Scilit]
- Krugman, P. Increasing returns and economic geography. J. Political Econ. 1991, 99, 483–499. [Google Scholar] [CrossRef] [Scilit]
- Harris, C.D. The market as a factor in the localization of industry in the United States. Ann. Assoc. Am. Geogr. 1954, 44, 315–348. [Google Scholar]
- Saviotti, P.P.; Pyka, A. The co-evolution of innovation, demand and growth. Econ. Innov. New Technol. 2013, 22, 461–482. [Google Scholar] [CrossRef] [Scilit]
- Blundell, R.; Bond, S. Initial conditions and moment restrictions in dynamic panel data models. J. Econom. 1998, 87, 115–143. [Google Scholar] [CrossRef] [Scilit]
- Elhorst, J.P. Spatial Econometrics: From Cross-Sectional Data to Spatial Panels; Springer: Berlin/Heidelberg, Germany, 2014. [Google Scholar]
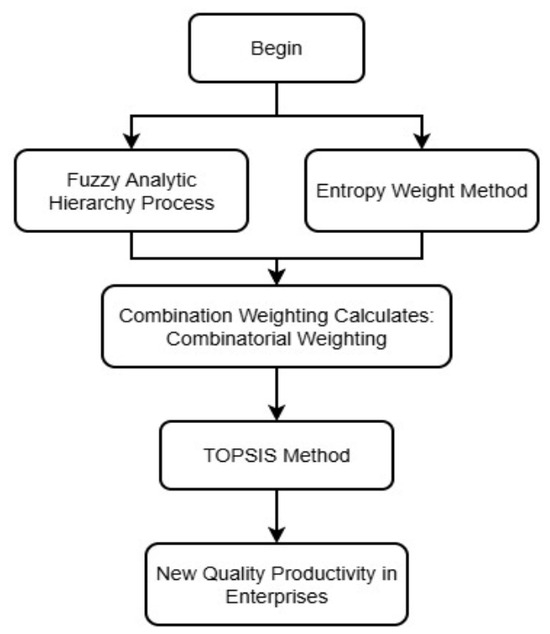
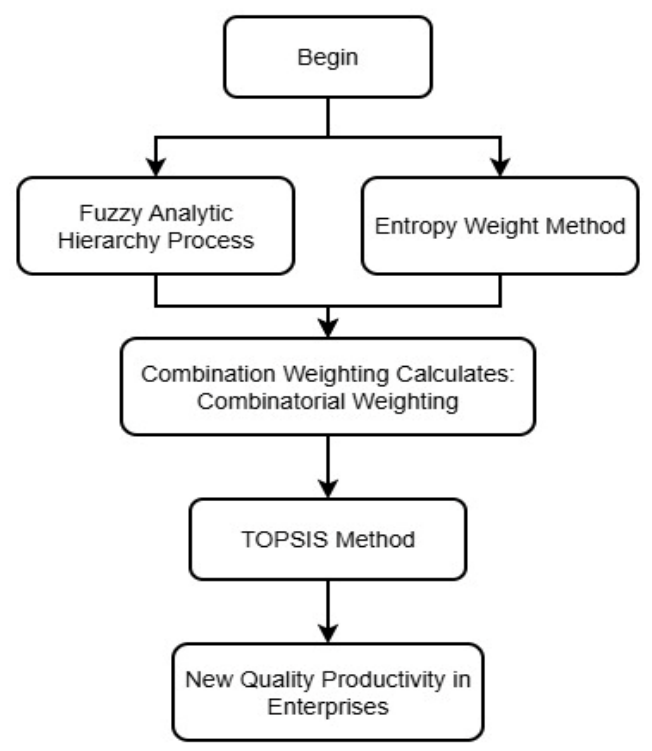
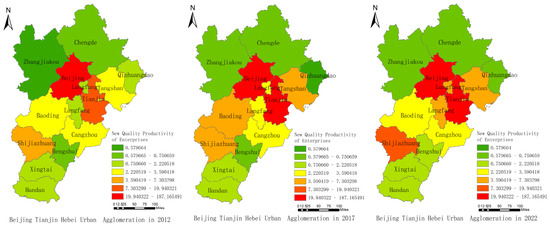
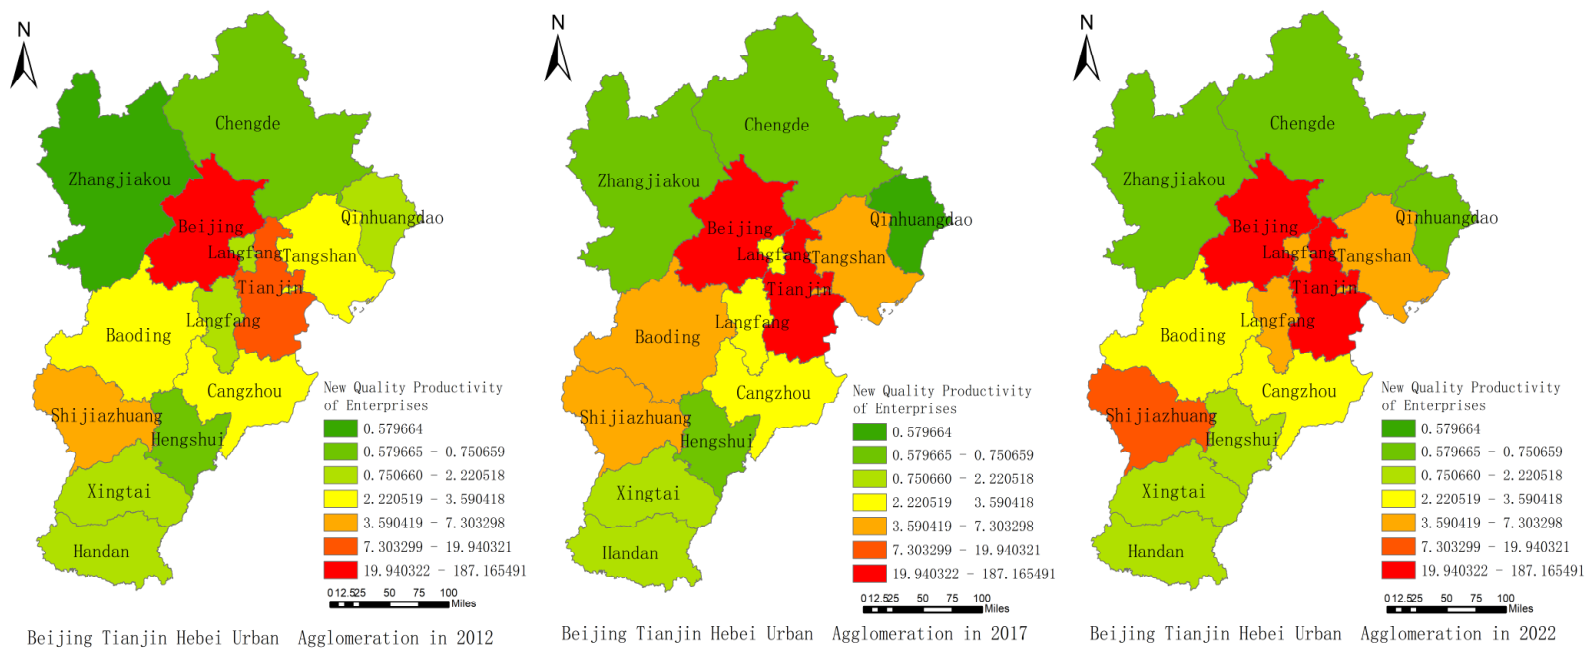
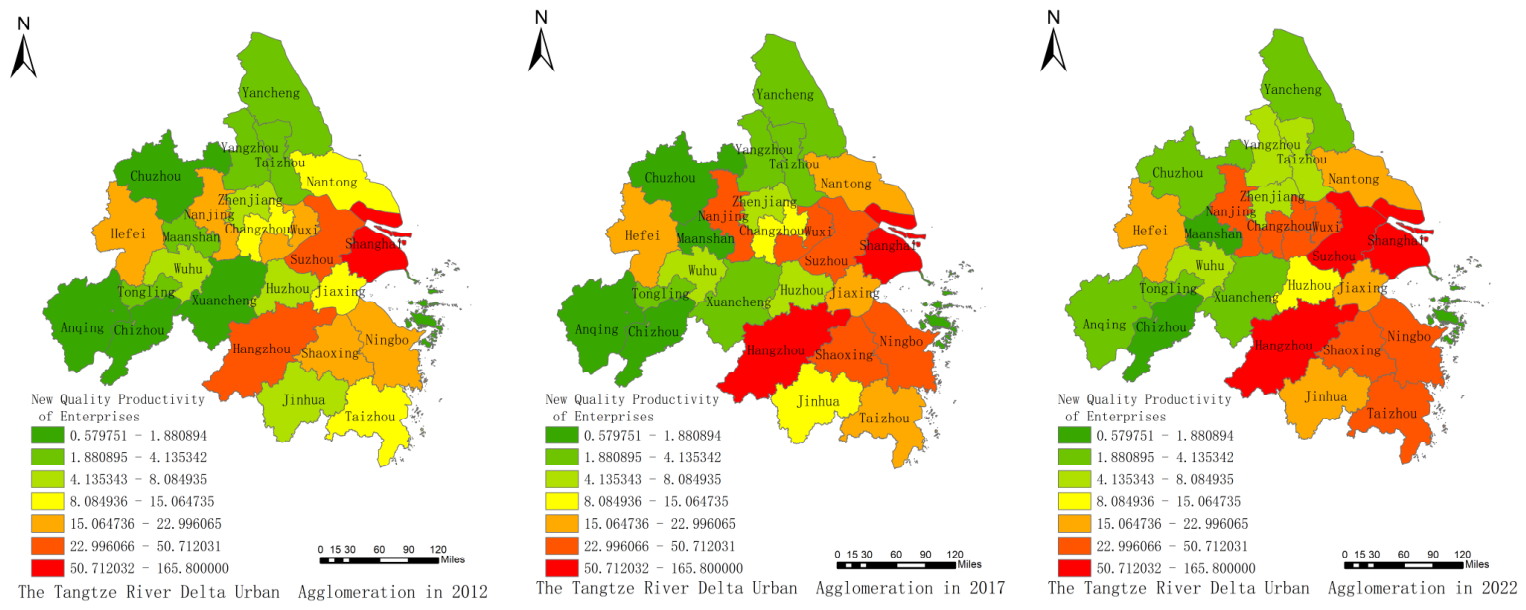
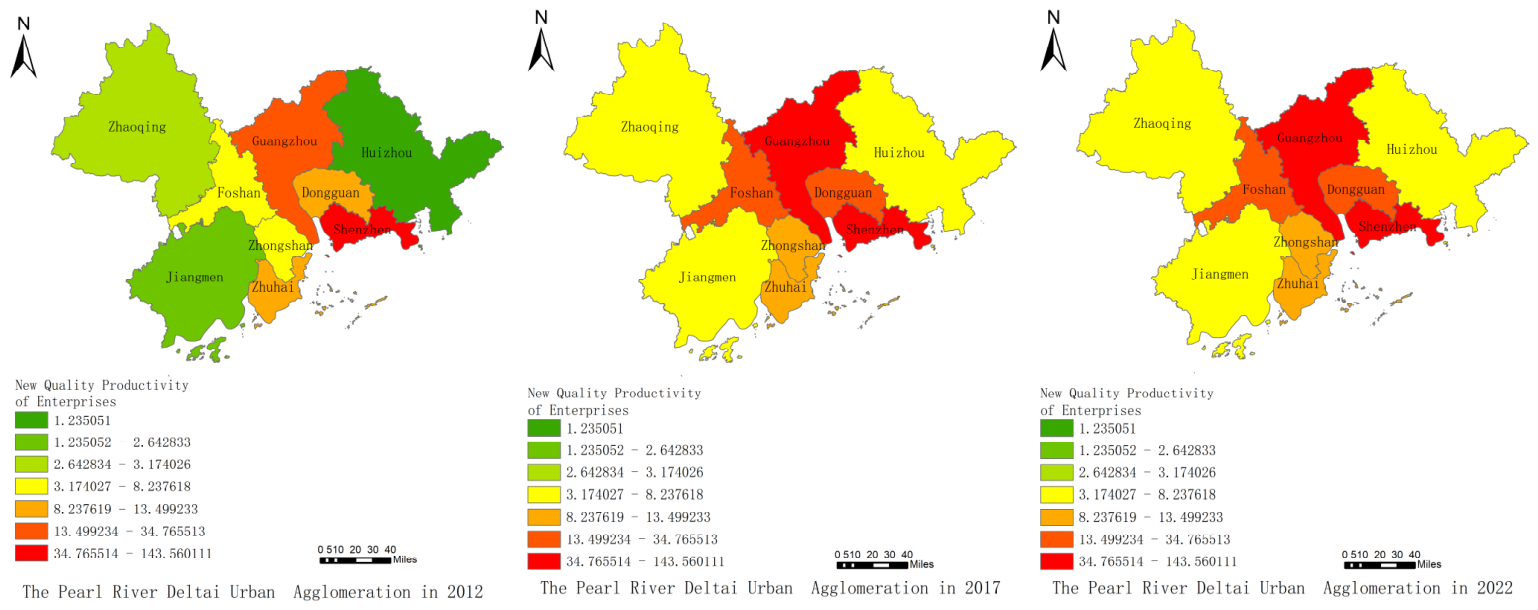
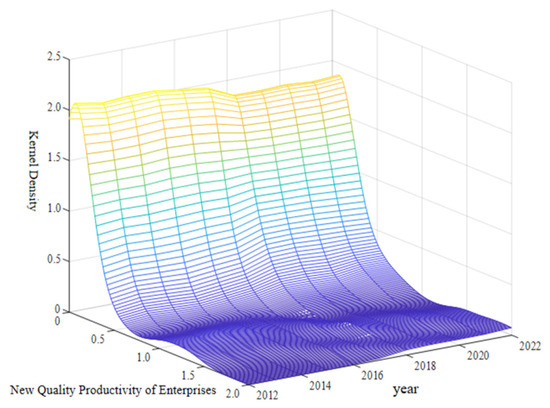
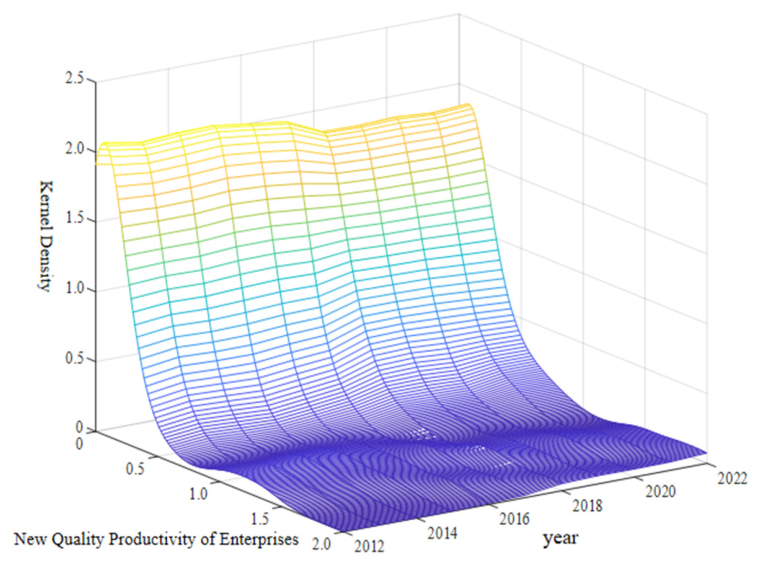
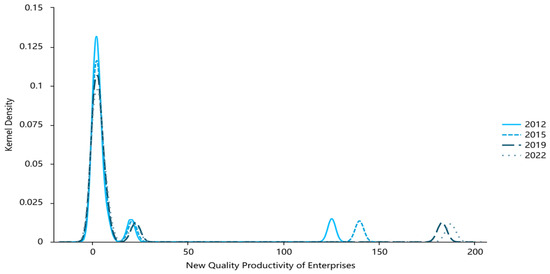
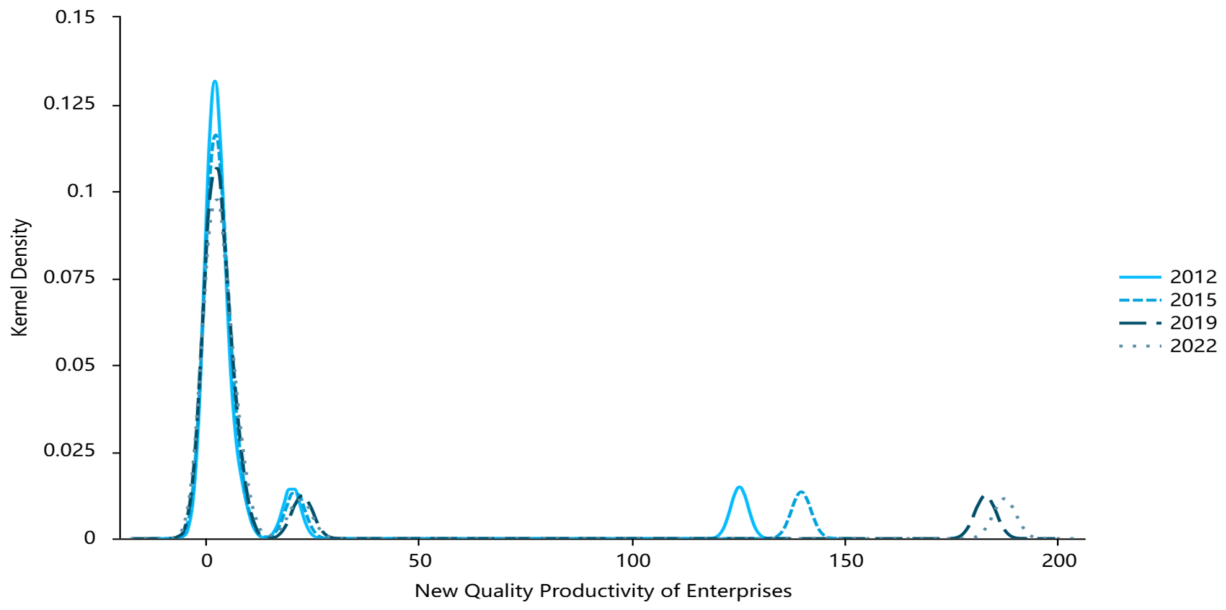
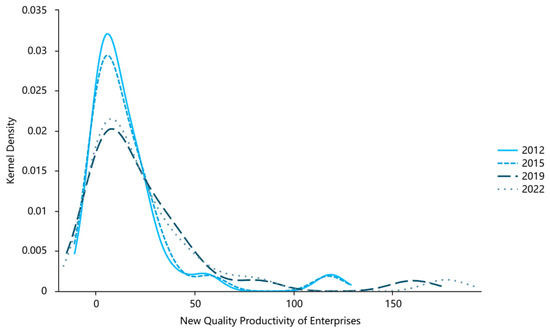
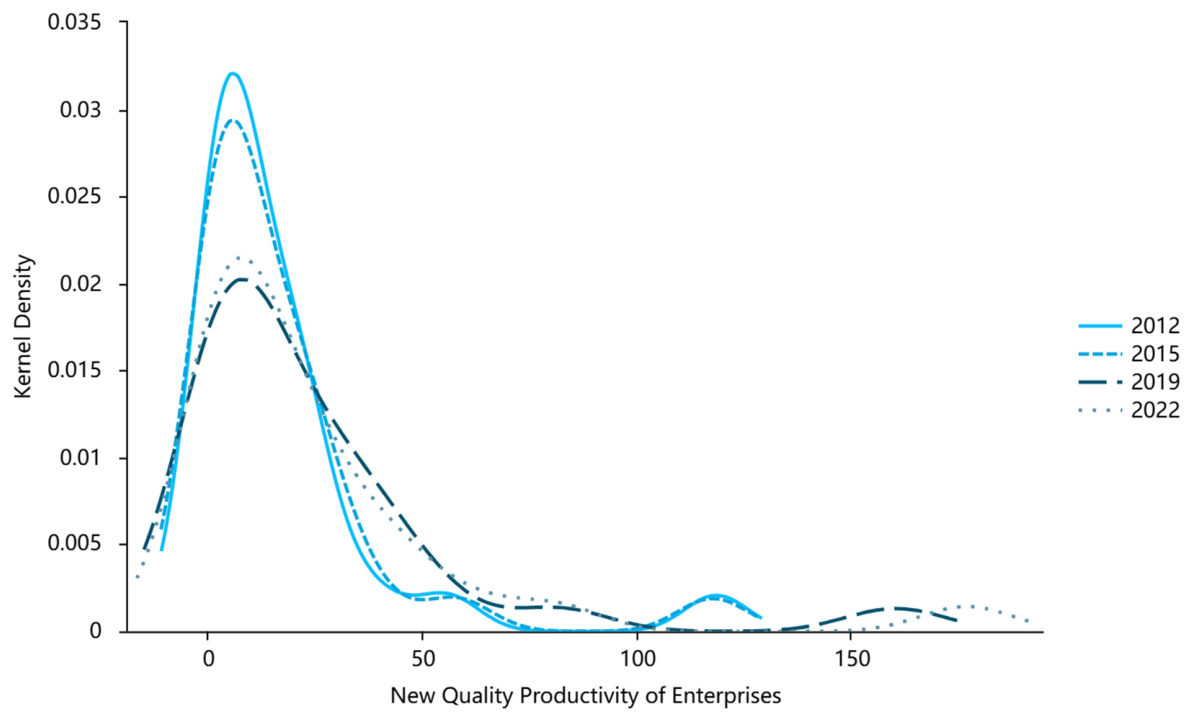
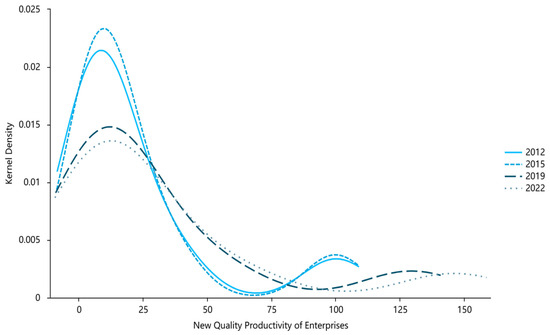
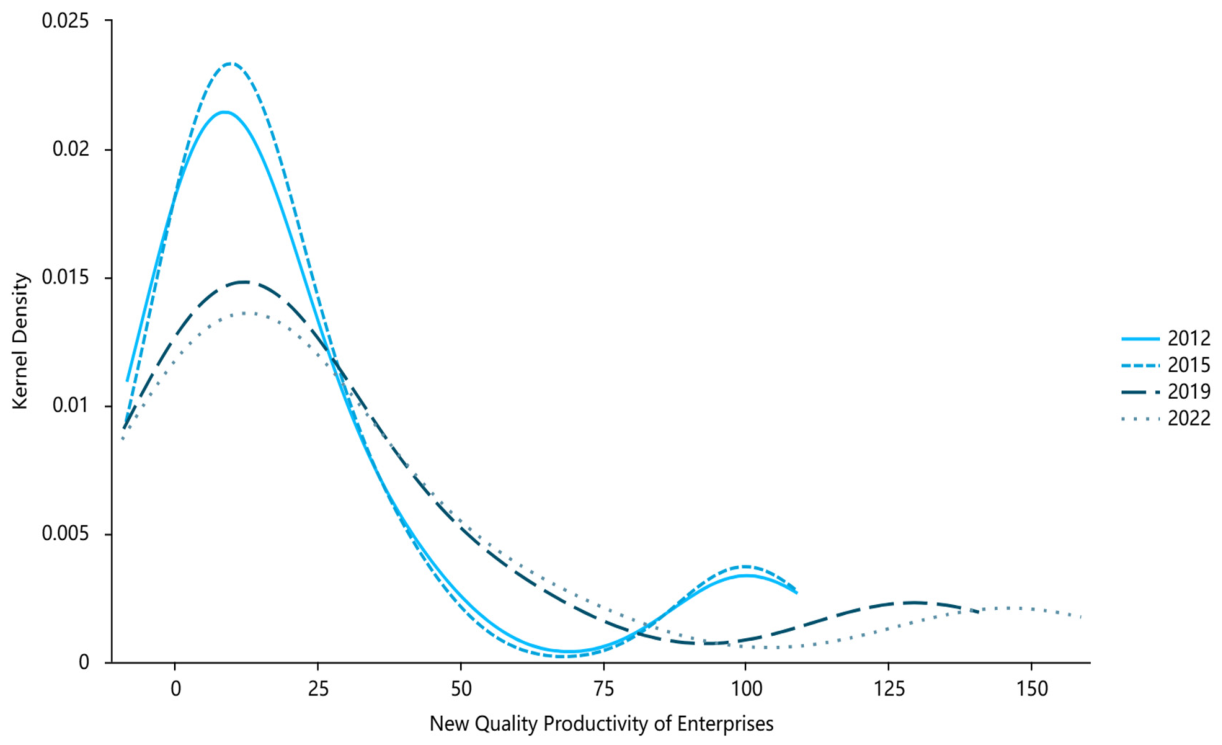
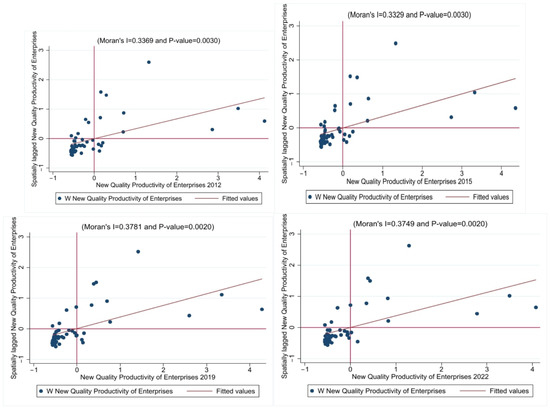
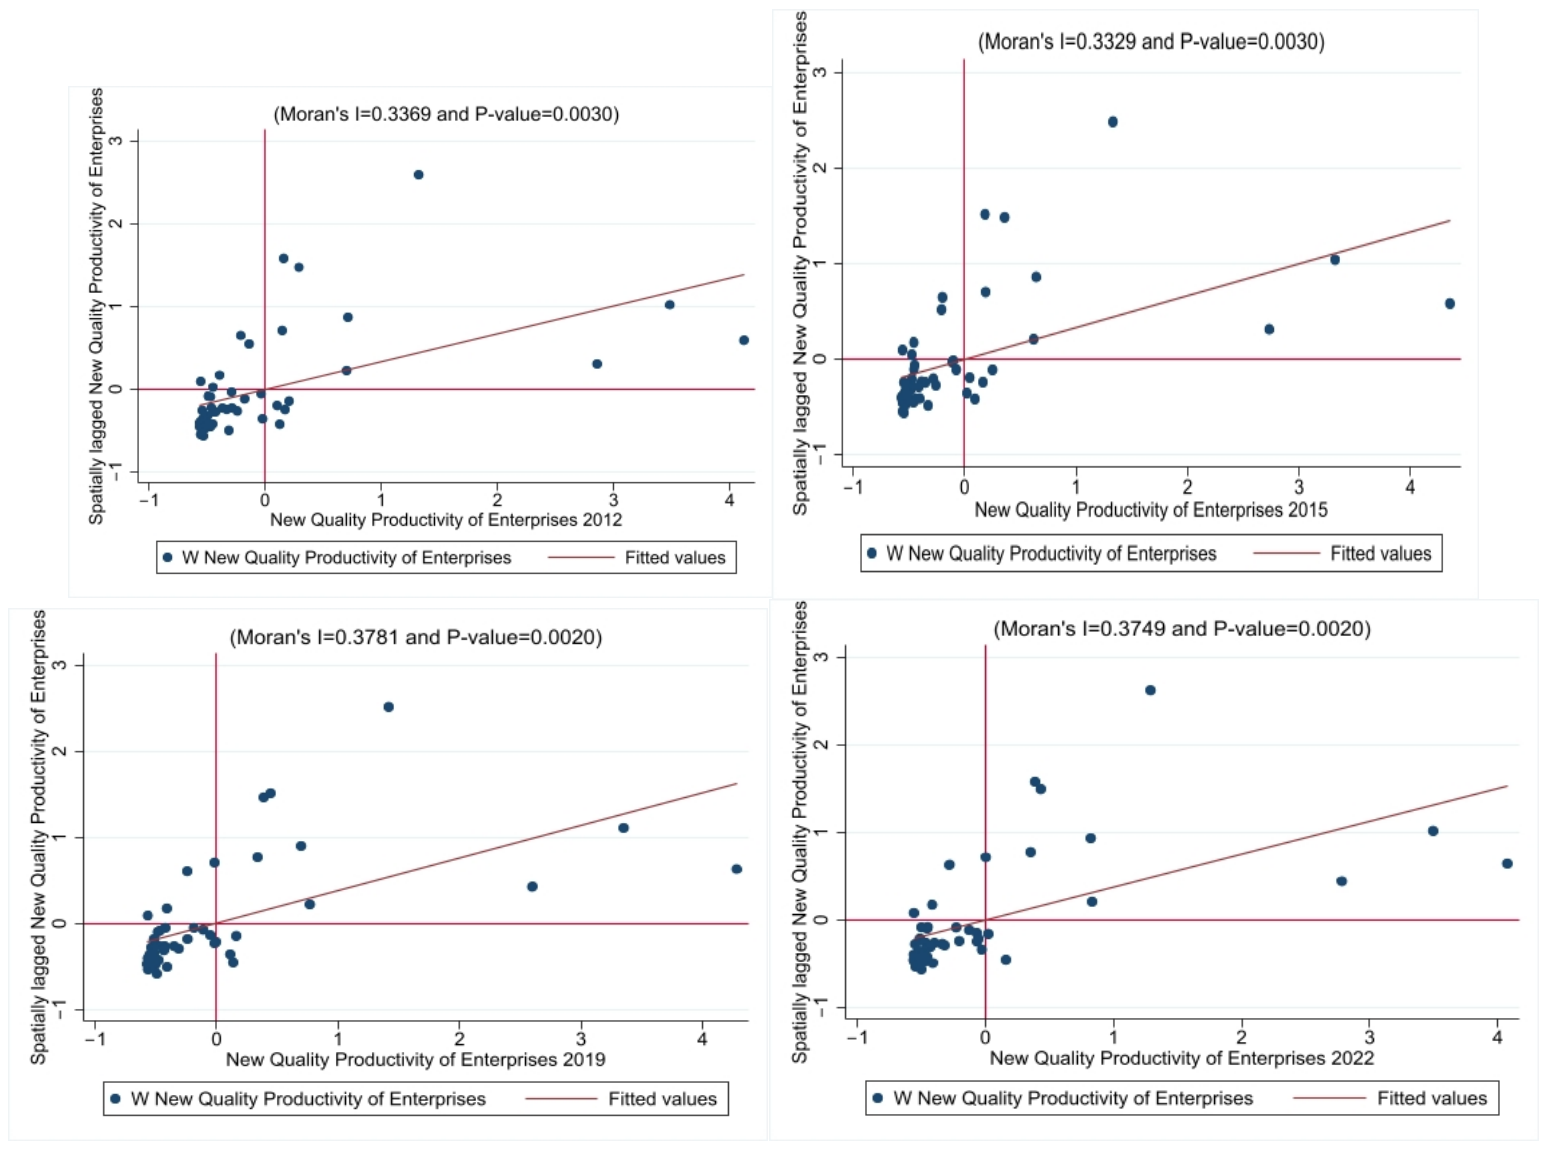

Disclaimer/Publisher’s Note: The statements, opinions and data contained in all publications are solely those of the individual author(s) and contributor(s) and not of MDPI and/or the editor(s). MDPI and/or the editor(s) disclaim responsibility for any injury to people or property resulting from any ideas, methods, instructions or products referred to in the content. |
© 2026 by the authors. Licensee MDPI, Basel, Switzerland. This article is an open access article distributed under the terms and conditions of the Creative Commons Attribution (CC BY) license.