


Abstract
The Rocky Desertification area has high sensitivity and poor anti-interference ability in the ecosystem. It is challenging to achieve sustainable development in a rocky desertification area. Given this issue, the System Dynamics model, the Future Land Use Simulation (FlUS) model, the Integrated Valuation and Trade-offs of ESs (InVEST) model, and the Structural Equation Model (SEM) were integrated in this study to analyze future ecosystem service change in Wenshan Prefecture under SSP1-1.9, SSP2-4.5, and SSP5-8.5 scenarios. The following results are obtained. (1) The area of cultivated land, construction land, forest land, and grassland increased in SSP1-1.9; the area of forest land and grassland decreased in SSP2-4.5 scenario and SSP5-8.5 scenario. (2) The water supply (WS), carbon sequestration (CS), and soil conservation power (SDR) under the three different scenarios were improved compared with 2020. Among them, habitat quality (HQ) demonstrated a slight increase trend under the SSP1-1.9 scenario but decreased under the other two scenarios. (3) WS, CS, and HQ exhibited a tradeoff relationship in the three scenarios compared with 2020. (4) In the SSP1-1.9 and SSP2-4.5 scenarios, the synergistic relationships among CS, HQ, SDR, and WS were particularly detected in the northern, southern, and central parts of the study area. Additionally, climate change and vegetation-dominated ecological environment are the main driving mechanisms affecting ES changes. This paper summarizes the spatial differences in the change trend and synergistic tradeoff and lays a crucial scientific foundation for the ecological protection of karst landform areas.
1. Introduction
Ecosystem services, serving as a bridge between ecosystems and human society, represent the direct and indirect benefits acquired by humans from ecosystems [1,2]. They have become a focal point across numerous fields, including ecology and environmental economics [3]. Rapid global economic development and rapid changes in the external environment have brought about growing pressure on ecosystems. Simultaneously, increasing cultural, recreational, and natural demands have triggered the supply-demand imbalance of ecosystem services worldwide, severely impacting global ecological security. On these accounts, researchers worldwide have conducted research from various perspectives, comprising the association between climate change and carbon storage [4], the impact of urbanization on ecosystem services [5], and the supply-demand dynamics of modern agriculture and ecosystem services [6]. China has institutionalized its Ecological Civilisation as a transformative governance paradigm, employing varying policy instruments in concert to advance environmental modernization [7].
Research on global environmental change has concerned land use change. Some studies reveal the direct effect of land use change on the ecosystem services value [8], primarily manifested in assessments of regional ecosystem health [9], studies on the spatiotemporal evolution of ecosystem service values [10], and investigations into the drivers of ecosystem service changes [11]. Typically, land use change research involves two perspectives: the historical spatiotemporal evolution of land use and the prediction of future land use patterns. Historical studies generally examine the influence of factors of climate [12], population [13], and policy on land use change. Future land use simulations emphasize the association between anticipated land use shifts and ecosystem service indicators, as well as the potential drivers affecting future ecosystem services [14,15]. Confronted with limited data and insufficient analysis capability, traditional predicting methods can hardly identify and evaluate these actual changes in ecosystem services. Recent advancements have integrated various models and data to demonstrate their result. For instance, Wei et al. [16]. adopted the Support Vector Machine (SVM) algorithm, combined with ArcGIS to develop comprehensive mineral prospectivity mapping (MPM) utilizing multi-source geological, geophysical data in the Kalatag mining district.
Global climate models are vital tools for climate simulation and forecasting global environmental changes. The Sixth Coupled Model Intercomparison Project (CMIP6) aggregates climate models (GCMs) from numerous global research institutions and then employs their test results to project climate change trends under different radiative forcing scenarios [17]. These climate change projections, combined with various future land-use change prediction models, are widely applied in forecasting future land-use transformations. Researchers have adopted models such as CA [18], GeoSOS [19], CLUE-S model [20], FLUS model [21], and PLUS model [22] to analyze the spatiotemporal dynamics of land use change [23], simulate land use under multiple scenarios [24], assess carbon emissions/removals from projected land use changes [25], and evaluate ecosystem service alterations stemming from land use shifts under varying scenarios [26].
While models assist in understanding and forecasting the impacts of land use changes in different regions on ecosystem services, related research remains challenging. Single-model predictions in traditional studies struggle to comprehensively forecast land use changes in karst landscapes, whose fragility and unique characteristics necessitate systematic consideration of land transformation processes. Given this issue, a System Dynamics model is introduced in this study to construct a tripartite SD-FLUS-InVEST integrated prediction framework. The incorporation of SD comprehensively accounts for the multivariable and nonlinear challenges inherent in land use change processes, contributing to the enhanced accuracy and rationality of future land use projections. Furthermore, given the complex karst topography, most ecosystem service research currently focuses on national [27], nature reserve [28], administrative region [29], or urban [30] scales. Existing studies seldom highlight future ecosystem services in ecologically fragile karst areas [31].
Wenshan Prefecture, located in southeastern Yunnan Province, exhibits distinct karst topography features, such as exposed rock formations, peak clusters, and sinkholes. Karst landforms cover 43% of Wenshan Prefecture, with rock desertification influencing 47.8% of the karst area. These decertified zones suffer from scarce soil resources and limited water availability. All eight counties and cities within the municipality at the core of Yunnan’s rock desertification zone experience severe soil erosion and fragile ecosystems. The unique ecological context of Wenshan Prefecture makes it designated a national key ecological function area, holding significant strategic ecological importance. Furthermore, the synthetic effect of climate change and human activities considerably threatens Wenshan Prefecture’s sustainable development. With the purpose of addressing these challenges, the dynamic changes in future ecosystem services within Wenshan Prefecture should be further explored, which can crucially safeguard the high-quality development of karst ecosystems. Therefore, this study combines the SD and FLUS models for the simulation and prediction of Wenshan Prefecture’s land use change patterns by 2035. The simulation is conducted under three scenario datasets, namely, SSPS and RCPS scenarios (SSP1-1.9, SSP2-4.5, and SSP5-8.5). The InVEST model is employed to analyze ecosystem services under above scenarios. Additionally, synergistic/trade-off analysis and spatiotemporal distribution patterns are conducted on Wenshan Prefecture’s ecosystem services. Furthermore, the driving mechanisms influencing ecosystem service changes in Wenshan Prefecture are analyzed by constructing a structural equation model (SEM), providing references for sustainable development and rational land use planning in Wenshan Prefecture, Yunnan Province.
2. Materials and Methods
2.1. Study Area
Wenshan Prefecture is located in the southeastern part of Yunnan Province, China (103°43′0″~104°27′59″ E, 23°05′32″~23°42′59″ N) (Figure 1), covering a total land area of about 31,456 km2, primarily administering 3 subdistrict offices and 7 townships each. The terrain is complex, predominantly mountainous, and semi-mountainous, covering 90% of the total land area [32]. The average elevation is about 1573 m, accompanied by an elevation difference of 2373 m. The average annual temperature and precipitation is 19 °C and 773 mm, respectively, demonstrating abundant thermal resources and plentiful rainfall. It features a mid-subtropical monsoon climate within the westerly wind belt. The entire territory lies within the Honghe River basin and the Lujiang River system. Karst topography covers 53.4% of the prefecture’s area, constituting the predominant landform type.
Figure 1.
Geographical location map of the project. (a) the location of Yunnan Province within China; (b) the location of Wenshan Prefecture within Yunnan Province; (c–e) the land cover maps of the study area for the years 2000, 2010, and 2020.
As of 2024, the region’s total population stands at approximately 3.37 million, exhibiting a declining trend in recent years. Wenshan Prefecture’s GDP reached US $21.904 billion in 2024. With continuous economic development, human activities on the land surface have significantly intensified. Concurrently, accelerated urbanization has brought about expanding construction land and farmland while lessening forest and grassland areas. This trend is provoking ecological degradation in Wenshan Prefecture, subjected to emerging environmental issues such as rock desertification and soil erosion [33]. The decline in regional ecosystem service functions, as well as the conflicts between supply and regulatory services, are constraining local ecology, economy, and society from achieving coordinated development in Wenshan Prefecture [34].
2.2. Data Sources
This study selected the 2010–2020 land use data with a spatial resolution of 30 m, covering six land use categories (cropland, forest land, grassland, water bodies, building land, and unused land). Slope and aspect information were derived from the digital elevation model (DEM) data after ArcGIS10.8.1 software processing. The climate and environmental data comprised average annual temperature and precipitation. Socio-economic statistics largely consist of population density and GDP density. Various infrastructure elements, such as county roads, railroads, highways, water bodies, national and provincial ways, were calculated in Euclidean distance within ArcGIS software. The global climate model dataset was created by China’s Delta spatial downscaling program. All raster data were resampled to a spatial resolution of 30 m. The dataset utilized in this investigation is comprehensively detailed in Table 1.
Table 1.
The dataset employed in this research.
2.3. Land Use Change Simulation and Prediction Utilizing SD-FLUS Modeling
The SD-FLUS model excels in simulating land use changes. The system dynamics [42] model predicts land use demand and alternations under many scenarios under demographic, socio-economic, and environmental factors specific to Wenshan Prefecture. There are multiple drivers of land-use change, both human activities and environmental factors. Consequently, the FLUS framework modeled the land use distribution pattern. The underlying logic of the model is to derive suitability probabilities for varying land use types by analyzing the various factors driving land use change. By combining the probability of land suitability with the interactions between metacells and incorporating factors of conversion costs and land use demand, iterative calculations are performed to ascertain the spatial land use distribution that most effectively satisfies the demand.
2.3.1. System Dynamics Modeling
System dynamics [42] models are grounded in cybernetics, systems theory, and information theory, used to analyze the composition, operation, and flexible action of feedback mechanisms [43]. This approach was pioneered by Professor Jay W. Forrester in the 1950s [44]. A land system dynamics approach can effectively elucidate the complex interconnections and feedback mechanisms between land use change and various driving forces [45]. The resolution of large-scale, multifaceted, and non-linear problems of various complexity was achieved by integrating both qualitative and quantitative methodologies [46]. Predicting future changes in land usage is the main goal of building the SD model. Socioeconomic, demographic, climatic, and land use subsystems are all included in the model.
2.3.2. Multiple Scenario Settings
The CMIP6 climate scenario data introduces new scenarios combining Shared Socioeconomic Pathways (SSPs) and Representative Concentration Pathways (RCPs), with a focus on factors driving global climate change under different socio-economic development patterns [47]. Each scenario includes a variety of volatile liquids, airborne particles, greenhouse gas (GHG) volumes and releases, and land utilization and cover change over time, which can influence a nation’s development strategy. These scenarios consist of SSP1-1.9 (SSP1 combined with RCP1.9), SSP1-2.6 (SSP1 combined with RCP2.6), SSP2-4.5 (SSP2 combined with RCP4.5), SSP3-7.0 (SSP3 combined with RCP7.0), SSP4-3.4 (SSP4 combined with RCP3.4), SSP4-6.0 (SSP4 combined with RCP6.0), and SSP5-8.5 (SSP5 combined with RCP8.5).
The SSP1-1.9 scenario, which depicts sustainable socioeconomic growth under a low radiative forcing pathway, is one of the common and representative scenarios considered in this study. This scenario is defined by low radiative forcing emissions, low susceptibility, and few mitigating issues, emphasizing the future expansion of global forest cover and the ensuing significant land-use shifts. It crucially helps to achieve sustainability and enhance prosperity while fostering the development of a comprehensive and sustainable development pathway. Moreover, this scenario serves as an ideal benchmark for ecological conservation, enabling the simulation of a future where global collaborative efforts prioritize environmental protection and sustainable development. This is imperative for regions like Wenshan Prefecture, designated as a national key ecological function zone. Specifically, this scenario allows for the assessment of maximum ecosystem service restoration potential under robust environmental policies, providing scientific reference and research prospects for regional ecological restoration objectives.
In a realistic model, the second scenario, SSP2-4.5, corresponds to a median level of socioeconomic development and radiative forcing. In CMIP6, the SSP2-4.5 scenario is frequently employed. Additionally, the scenario’s projected zoning and spray pathways are modest. Thus, it exemplifies a world following a balanced trajectory of socio-economic, societal, and technical advancement, featuring moderate greenhouse gas emissions. It reflects a persistent equilibrium between socioeconomic development and resource-environmental pressures. The potential stresses and risks facing Wenshan Prefecture’s ecosystems under a “business-as-usual” development pattern are revealed by simulating land use and ecosystem service changes under this scenario. This provides direct early warning for formulating medium-to-long-term adaptive management strategies and facilitates the comparison of outcomes against other scenarios.
SSP5-8.5, the third scenario, represents a future that must be averted by all possible means. Its defining characteristics include elevated radiative forcing routes and fast global economic expansion caused by fossil fuel extraction and energy-intensive lifestyles. This scenario serves as a high-risk warning scenario. This pathway may not fully align with China’s national low-carbon development strategy. Nevertheless, it likely represents the worst ecological consequences that could arise in certain rapidly developing regions of China, including Yunnan Province, where Wenshan Prefecture is located, when pursuing economic growth without considering ecological conservation. Simulating this scenario helps visualize the extreme impacts of high-intensity human activities (rapid urbanization and agricultural expansion, etc.) on fragile karst ecosystems. It starkly reveals the acute conflict between development and conservation, as well as the critical importance of avoiding such development paths and upholding ecological red lines.
These three scenarios cover a broad range of radiative forcing intensities, from high to low, and therefore exhibit a strong representativeness. The simulation assessment aims at probing into future changes in Wenshan Prefecture’s ESS, forming a complete gradient from “optimal ecological protection” to “reference development” to “high-risk warning.” Hence, a comprehensive evaluation can be performed on the vulnerability and response of karst ecosystem services in Wenshan Prefecture under varying future development scenarios. The findings lay a scientific foundation for formulating differentiated, forward-looking spatial planning and ecological policies.
2.3.3. The FLUS Model
The FLUS model was created in the Vension® PLE 7.3.5 version software, allowing for precise detection of nonlinear interactions between several drivers from various land use categories. It depends on the notion of meta-cellular automata [47]. Models are primarily adopted for simulating prospective land-use scenarios and changes in land utilization driven by human activities and environmental factors [48].
- (1)
- Calculation of suitability probability utilizing an artificial neural network
The model essentially employs the BP-ANN algorithm to compute suitability probabilities. This structure is composed of a first layer, a hidden layer, and a result layer. The input layer includes zoning data from the initial year along with relevant motivating factors. Following empirical knowledge, the number of concealed layers is determined to be 12. The output layer generates an appropriate likelihood map pertaining to every raster terrain type [49]. The procedure for computation is expressed as:
where w(j,k) symbolizes the adaptive weight connecting the invisible layer to the final layer; sigmoid denotes the activation perform from the overlooked layer to the result layer; p(p,k,t) signifies the accuracy risk of the k-th land class on grid P at time t; net j(p,t) denotes the feedback received by neuron j from grid cell p at time t within the hidden layer.
- (2)
- Adaptive inertial competition mechanisms for roulette wheel selection
The conversion probability of subsequent land types is impacted by community weights, lethargy parameters, conversion costs, and inter-land land rivalry. The neighborhood impacts consist of both the extent and the weights of neighboring cells [50]. The fundamental equation is:
where denotes the aggregate count of graphic components of land type k inside the nearby frame of N × N following t − 1 iterations; is the percentage of land-use type k; N embodies the surrounding device, chosen as 3 according to several comparison trials and current data.
Each land-use type’s inertia coefficient is dynamically modified to address the discrepancy between the allocation of land-use types and macro-level demand, expressed as:
where indicates the velocity ratio of land use type k at moment t; signifies the discrepancy among the allotted raster count and the goal of requirements for land use type k at the moment t − 1. The property group that currently occupies the raster cell is adopted to define the inertia coefficient; the inertial index for land use type k equals to 1 if an existing land use type is not type k, and the likelihood of merging land use type k for that raster cell remains unchanged. Then, the overall transition probability of the raster P with land use type k at moment t can be yielded through the above step :
where , , and denote the necessary odds, the proximity operation, and reactive stability value, respectively; indicates the expense associated with the conversion through land application type c to land use type k.
- (3)
- Prediction of variable factors using the FLUS model
This research selected 11 key factors influencing land use/land cover change upon the 2015–2020 land use datasets (Figure 2). Physical and socioeconomic characteristics (including elevation, gradient, temperature, rainfall, soil type, proximity to rivers, population size, GDP, and distances to county, provincial, and national roadways, railroads, freeways, and bodies of water) are examples of these elements. The FLUS model used these variables to estimate the certainty of changes in every different land use category while simulating land use changes for 2020 taking the 2015 land use data as the reference point. Subsequently, the predicted and actual land use data for 2020 were compared to assess the precision of the FLUS model. After the simulation accuracies were obtained, the FLUS model further incorporated these accuracies, derived from the SD model, for the land-use demand prediction in the Wenshan Prefecture area for 2030 [50].
Figure 2.
Spatial distribution of the primary influencing factors of land use: natural factors (a–d), socio-economic factors (e,f), distance factors (g–k).
2.3.4. Accuracy Verification
This paper adopts the Kappa coefficient for the accuracy evaluation of simulation predictions. The fundamental principle is to determine the ratio of correctly classified predictions to the actual number of correctly classified outcomes using a confusion matrix. A higher ratio indicates greater classification accuracy, signifying more precise simulation results.
The Kappa and FOM coefficients are employed to assess model accuracy and are calculated as follows:
where p0 is the actual simulation accuracy; pc is the expected accuracy in the randomized state, and a higher simulation outcome is indicated by a kappa value of 0.6 “Kappa” 0.8; C embodies an area where conversion actually occurs but the simulation is incapable of reflecting such change; D signifies an area that supports conversion of real and simulated data; E indicates a location where conversion actually takes place, however the actual situation and the conversion calculation will differ; F refers to an area where the simulation reveals no real change. FOM coefficients of 0.1 to 0.2 indicate high simulation accuracy and better results for the FLUS model.
2.4. Ecosystem Services Valuation
Ecosystem services serve as the core support for maintaining Earth’s ecological balance and advancing sustainable human development, laying a foundation for human material survival [51]. Drawing upon current cutting-edge research [31,52], this study selects water yield (WY), carbon sequestration (CS), soil deposition rate (SDR), and habitat quality (HQ) as core ecosystem service indicators, given the critical environmental challenges and vital ecosystem functions facing karst desertification regions. The rationale for these indicators is described as follows:
Owing to severe surface water seepage and acute engineered water shortages, a sustainable water supply has become a critical constraint on socioeconomic development and ecological integrity in karst regions. Thus, it is urgent to assess dynamic changes in WS with respect to regional water resource management.
Although karst ecosystems serve as globally significant carbon sinks, rock desertification processes cause remarkable depletion of vegetation and soil carbon pools. Quantifying CS aids in evaluating the region’s contribution to climate change mitigation and its own ecosystem stability while functioning as a key indicator for measuring ecological restoration outcomes (such as afforestation programs).
Soil erosion represents the most direct manifestation and driving force of rock desertification. Soil loss compromises the foundational integrity of ecosystems, making restoration exceptionally challenging. Consequently, SDR becomes an irreplaceable core indicator for diagnosing desertification severity and assessing the effectiveness of soil conservation measures.
Ecosystems in rock desertification areas feature high sensitivity and vulnerability, where habitat degradation directly triggers biodiversity loss. Comprehensive assessment of changes in HQ effectively captures pressures from human activities (land-use expansion) on ecosystem structural and functional integrity, thereby serving as a vital proxy indicator for biodiversity conservation.
These four services are interrelated, collectively characterizing the key ecological processes of “water-soil-air-life” in rock desertification regions. For instance, soil erosion (decreased SDR) degrades vegetation habitats (reduced HQ), bringing about the weakened carbon sequestration capacity (lowered CS) and influencing water conservation (WS changes). Hence, a systematic assessment of their synergistic and trade-off relationships provides critical insight into the integrated carrying capacity of karst ecosystems and supports the formulation of systematic conservation strategies.
Wenshan Prefecture holds significant ecological importance as a nationally designated key ecological functional area in China because of the characteristics of karst regions, including fragile ecosystems, exposed bedrock, thin soil layers, and poor water retention capacity. It performs vital ecosystem services involving soil and water conservation, water source protection, carbon sequestration and oxygen release, and biodiversity preservation. Four primary ecosystem service indicators were selected: WY, CS, SR, and HQ [53,54]. The specific calculation methods are:
(1) Water yield (WY).
The Water Yield module of the InVEST model was adopted for the estimation of the WY associated with ecosystem service [55,56,57], expressed as:
where refers to the amount of water that is contained by the land use type y on the x raster cell; signifies mean annual actual evapotranspiration on x raster cells for class y land use type; represents average annual rainfall on x raster cells.
where denotes potential evapotranspiration of the x raster cell; W is the ratio of the amount of water available on the x raster cell to the amount of annual precipitation, a non-physical parameter, dimensionless; indicates plant evapotranspiration coefficients on x raster cells for land use type y; embodies x raster cell reference evapotranspiration to reference evapotranspiration from local vegetation.
(2) Carbon Sequestration (CS).
The Carbon Sequestration module was adopted to calculate the provision of CS services. The 2000–2020 total energy consumption in Wenshan Prefecture, Yunnan Province was multiplied by the carbon emission factor to calculate total energy-related carbon emissions. This value was subsequently divided by the resident population of Wenshan Prefecture during the study period and further multiplied by population density raster data to formulate a regional dispersion map of CS needs, expressed as:
where denotes the entire carbon sequestration; represents above-ground biogenic carbon; indicates below-ground natural carbon; signifies soil dissolved carbon; embodies decaying organic carbon, all of the above in (t/hm2).
(3) Soil delivery ratio (SDR).
The soil delivery ratio is a critical component of ESS functions. In the karst region, soil delivery reflects both the strength of ESS functions and the rocky desertification degree. In our study, the soil delivery service function was formed through the Soil Erosion section of the InVEST model, calculated as:
where T stands for average annual soil retention; R represents the elements related to rainfall erosion; E indicates soil erodibility; K refers to slope length; B denotes plant cover and management; Ps embodies soil conservation measures.
(4) Habitat quality (HQ).
The Habitat Quality Index (HQI) is frequently applied to analyze HQ. The Habitat Quality module calculates this index by analyzing regional land use types and their associated threats to biodiversity. The four main components involved in calculating the HQI are (1) the proportional effect of every danger aspect, (2) the relative vulnerability of each land use type to particular attack factors, (3) the gap in land use types and menace places, and (4) the extent of land protection.
where denotes HQI for raster cell x in land use y; stands for habitat appropriateness for habitat type y, varying from 0 to 1; k is 50%-saturation constant, generally 1/2 of the highest level of habitat decline; z represents configuring uniform, set to 2.5; , R, br, and yr refer to ecological destruction gauge, the quantity of threat factors, the magnitude of hazard factor r, and the abundance of pixels for threat factors, respectively; reflects distance separating sites and points of threats and their impacts; embodies factors mitigating the impact of threats on habitat quality stemming from public policy (i.e., level of legal protection, 0 for areas protected by law, 1 for the rest); signifies the reactivity of the sort of habitat y to danger factor r; stands for the straight-line distance between grid x and grid y; indicates the greatest threat away from threatening origin r.
Parameter Correction and Validation
(1) WY.
In the InVEST model, the primary parameter of the Water yield module is Z. The Z parameter is a constant ranging from 0.1 to 30, representing precipitation characteristics within a given region. This value approaches 0.1 in drier areas while exceeding 5 in wetter regions. The Z parameter is highly sensitive to regional water yield and is suitable as a calibration adjustment parameter for the model. In this study, 2020 total water resources data from Wenshan Prefecture, Yunnan Province, were selected as validation data to assess the model’s predicted water yield. The Z parameter was incrementally adjusted from 0.1 to 30 based on 2020 evapotranspiration, precipitation, and other data. As illustrated in Figure 3, the simulated predicted water yield corresponding to each Z value was output, followed by curve fitting of this data. The fitted equation reflects that the model’s simulated water yield for Wenshan Prefecture equals the actual 2020 water yield when Z is approximately 0.802. Therefore, Z = 0.802 was adopted in this study.
Figure 3.
Z-Value Verification for Water Yield Module.
(2) CS.
Other environmental factors of precipitation and temperature during calculations also affect the carbon stocks. Directly using model-derived data may bring about estimation biases in carbon stocks, impacting the accuracy of ecosystem service valuation. Hence, environmental factors (precipitation and temperature, etc.) are typically employed to adjust carbon density, thereby enhancing the model’s applicability and predictive precision. Correction methods primarily include adjustments based on empirical formulas and comparisons with measured data. By modifying carbon density in this manner, it can more precisely align with the target area’s climatic conditions and land use characteristics.
where MAP denotes monthly average precipitation in millimeters; MAT represents monthly average temperature in degrees Celsius; CBP and CBT indicate estimated vegetation carbon density by precipitation and temperature, respectively; CSP signifies estimated soil carbon density by precipitation.
where KBP and KBT represent the precipitation factor and temperature factor correction coefficients for vegetation carbon density, respectively; KB denotes the composite correction coefficient for above-ground and below-ground vegetation carbon density; KS refers to the correction coefficient for soil carbon density; C′ and C″ embody carbon density values for Yunnan Province and China, respectively.
Additionally, regional and national carbon density data from Yunnan Province were selected as references to more accurately explain the carbon stocks in the study area and ensure the precision of carbon density values for each land use type. Primarily drawing upon Yunnan’s Third National Land Survey carbon sink data, adjustments were made to derive the aboveground carbon density (C_above), belowground carbon density (C_below), soil carbon density (C_soil), and dead organic carbon density (C_dead) for land use type (Table 2).
Table 2.
Revised Carbon Density Table for the Study Area.
(3) SDR.
The SDR module involves five parameters. Among them, the cumulative flow threshold, maximum sediment transport ratio, and maximum slope length parameters all adopt the model’s recommended values. After multiple simulation tests on the model, the calibration parameter K and the ICO value exerted little impact on changes in soil erosion conditions in Wenshan Prefecture, while the K value reacted sensitively to soil erosion conditions. Therefore, the K value was selected as the model calibration parameter. Through correspondence with relevant statistical departments like the Wenshan Water Resources Bureau, 2020 sediment transport data were obtained for Wenshan’s water systems in this study. With this data as the baseline and other parameters being constant, the K value was incrementally adjusted by ±50% from its default value of 2. Afterward, corresponding simulated predictions for 2020 soil erosion data in Wenshan were derived and fitted (Figure 4). The fitting results ascertain a high and significant correlation between the k parameter and the predicted sediment transport volume. When the calibrated k parameter value was set to 1.148, the model’s predicted 2020 soil erosion data for Wenshan Prefecture aligned with the actual sediment transport volume of 1.79 × 10⁹ t. Hence, k = 1.148 was selected for calculations.
Figure 4.
Validation of K-value Parameters for the SDR Module.
2.5. Ecosystem Service Trade-Offs/Synergies
Bivariate global spatial autocorrelation analysis compared the correlations among varying ecosystem services under three scenarios for 2020 and 2030. First, the global Moran’s I index was calculated for the confirmation of the overall correlation among ecosystem services, with their specific spatial distribution characteristics examined by computing the local Moran’s I index [58]:
where I denotes the global Moran’s I index; Ii represents the local Moran’s I index; N refers to the number of spatial units; i and j indicate different spatial units; p and q signify different ecosystem service types; and embody the values of ecosystem services p and q in spatial unit i; stands for the spatial weight matrix for i and j; Sp and Sq describe the variances of ecosystem services p and q, respectively.
The calculated value of the global Moran’s I index is −1 to 1, with a positive and negative value denoting a synergistic relationship and a trade-off relationship, respectively; a value of 0 implies that neither trade-off nor synergistic relationships are significant. Table 3 lists the specific interpretation criteria. If the results of the global spatial autocorrelation for two variables specify a non-random distribution, the local Moran’s I index can be further calculated by using the clustering and outlier analysis tool. Within the spatial layer, it is allowed to identify 5 types of aggregation patterns: High-High, High-Low, Low-Low, Low-High, and Non-Significant. Among them, areas exhibiting high-high and low-low pattern represent the regions where the two ecosystem services synergize [59]. Conversely, areas demonstrating high-low and low-high pattern represent the regions where the two ecosystem services trade off. These results were generated in ArcMap 10.8.1 software.
Table 3.
Criteria for Determining Hotspot and Coldspot Types in Global Spatial Autocorrelation.
2.6. Structural Equation Model (SEM)
An SEM was built to analyze the potential mechanisms affecting ESS changes in Wenshan Prefecture. SEM is a method of statistical analysis of multivariate data, analyzing the relationship between multivariate data by utilizing the covariance matrix of variables [60].
To determine the optimal model fit, the study selected five indicators for the evaluation of model fit: Comparative Fit Index (CFI), Goodness of Fit Index (GFI), Incremental Fit Index (IFI), Root Mean Square Error of Approximation (RMSEA), and Standardized Residual Mean Root (SRMR). Models are considered well-fitted when CFI (>0.90), IFI (>0.90), and GFI (>0.90) approach 1, while RMSEA (<0.08) and SRMR (<0.05) approach 0 [61].
In Figure 5, a Partial Least Squares Path Model (PLS-PM) was established for quantifying the influence of latent variables (including Climate, Terrain, Land, Ecology, and Human activities) on the spatial distribution of ecosystem services in Wenshan Prefecture. It was completed by R4.3.3 software, demonstrating validity with a Goodness-of-Fit(GOF) coefficient exceeding 0.3 [62].
Figure 5.
Conceptualized model of drivers of changes in ESs in Wenshan Prefecture. (Note: pink arrows indicates the latent variable is influenced by the manifest variable; blue arrows indicates the target of the effect).
2.7. Experimental Process
In the 1990s, American ecologists Berkes and Folke articulated the concept of the Coupled Social-Ecological System (SES) in their book Linking Social and Ecological Systems. This theory clarifies that social and ecological systems do not interact unidirectionally but co-evolve through “coupling relationships”. For instance, human land use alters ecosystem services, while changes in ecosystem services, in turn, influence human economic decisions and lifestyles.
The aforementioned approach combines System Dynamics modeling with Future Land Use Simulation (FLUS), InVest, and SEM. Leveraging FLUS’s spatial capabilities, it simulates the spatial distribution of quantitative outputs from SD models. Moreover, the adoption of direct modeling methods (utilizing linear and nonlinear interactions) ensures the quantitative demonstration of time-varying dynamic evolution of land use in the SD model, as noted in prior studies [63,64,65]. The FLUS model excels at simulating spatial land use changes under the combined impact of both human activities and natural processes and can deeply explore the potential future land use scenarios [66,67]. The InVEST model incorporates threat sources and sensitivity into habitat suitability assessments, enabling the evaluation of ecosystem service responses by considering post-land-use-change data. The SEM reveals the influence mechanisms and intensity of key drivers in ecosystem service changes within Wenshan Prefecture.
To sum up, grounded in SES theory, this analysis examines how socioeconomic factors, including population growth, industrial development, and livelihoods, drive land use changes like land expansion construction and farmland and forest land conversion. These shifts, in turn, influence the spatio-temporal evolution of ecosystem services like CS and WC. Figure 6 illustrates the research framework.
Figure 6.
Research framework (Note: Subfigure 1 illustrates the application of the SD model. Subfigure 2 illustrates the application of the FLUS model. Subfigure 3 illustrates the application of the Invest model combined with the FLUS model to calculate ESs. Subfigure 4 illustrates the calculation of ES drivers).
3. Results
3.1. Land Use Modeling
3.1.1. Land Use Demand SD Model Validation
The comparison results between the 2020 simulation results and the actual observational data validated the SD model accuracy (Table 4). Previous studies suggest that the simulation error is less than 5%, demonstrating the model’s high accuracy in predicting land structure changes.
Table 4.
Land use demand SD model validation.
Integration of the 2020 land-use data into the SD model enabled future land-use projections under multiple climate scenarios (Table 5). These forecasts specify substantial changes in land-use requirements by 2030 across the three distinct climatic scenarios. The projections reflect that the SSP5-8.5 scenario results in the largest expansion of cropland and construction land, with smaller increases under the other two scenarios. Furthermore, forested land area exhibits an increasing trend under each scenario, the largest forested land area appears in the SSP1-1.9. Conversely, grassland area expands under the SSP1-1.9 scenario but decreases under the other two scenarios. Besides, the areas of water body and unused land decrease across the range of projections under the different scenarios.
Table 5.
SD model-projected land use data under varying scenarios for 2030.
3.1.2. Simulation of Land Use Distribution in 2030 Under Different Scenarios
The anticipated land use pattern in Wenshan Prefecture under various scenarios is depicted in Figure 7. The FLUS model was implemented to forecast the land usage in Wenshan Prefecture for 2020, taking the 2015 land use data as an anchor data. The FOM and Kappa coefficients were adopted to verify the correctness of the modeling. After calculation, the simulation achieved a Kappa coefficient of 0.69 (indicating good simulation quality, as 0.6 < Kappa ≤ 0.8) and an FOM coefficient of 0.13 (falling within the standard range of 0.1 to 0.2). In other words, the FLUS model offers a trustworthy simulation for Wenshan Prefecture and could be deployed to forecast land use change under various 2030 scenarios. Furthermore, a harmonious balance between population growth and economic development was envisioned under the SSP1-1.9 scenario, which stands for sustainable socio-economic development. It emphasized the protection and restoration of ecologically significant land types.
Figure 7.
Land use distribution pattern in the city of Lower Hill in 2030 under three different scenarios. Note: (a–c) represent land use projections for three scenarios in 2030, respectively. Among these, (a)1, (a)2, (b)1, (b)2, (c)1, and (c)2 denote enlarged sections within the same-colored frames for each scenario.
This contributed to the implementation of a protection scheme for existing woods and grasslands, as well as an increase in the area under cultivation. The construction land area was also expanding, particularly near the city center. With a moderate level of land resource demand and land-use intensity, the SSP2-4.5 scenario reflects the implementation of a balanced socio-economic development path. By 2030, an upward trend was projected in the areas of forested land, grassland, and construction land, and a slight decrease was expected in the area of watersheds, so as to support ongoing economic and social development and a growing population. Rapid social and economic development, combined with increased human activity, brought about obviously increasing amount of construction land under the SSP5-8.5 scenario. The extent of cultivated land grew in the above scenario, but the number of woods and grasslands significantly decreased.
The SSP5-8.5 scenario featured substantially increasing amount of land surrounding urban centers, a quick development of building land, and a large decline in the extent of ecological land types of woodland, grassland, and water bodies versus the other two scenarios. Particularly, the artificial transformation of karst landscapes was prominent in the southwestern region of Wenshan Prefecture. Additionally, there were conflicts and inconsistencies between land use and human activity in this scenario, which exhibited a radial expansion trend.
3.2. Analysis of Changes in ESs Under Different Scenarios
3.2.1. Changes in ESs Under Different Scenarios
(1) WS.
As depicted in Figure 8a–c, the WS exhibits a stable spatial distribution across the three scenarios. The average WS value in 2020 was used as a reference to analyze the adjustment in WS in the Wenshan Prefecture area in 2030 under the SSPs-RCPs scenarios (Table 6). The zonal distribution of WS under the three scenarios reveals a tendency of ascending values in the south and collapsing values in the north, with greater values concentrated in the southern portion of the research region. The highest WS in the SSP1-1.9 scenario was 1535 mm, presenting a standard deviation of 313 mm. This indicates a 66.49% increase over 2020.
Figure 8.
Patterns of spatial distribution of ESs in the following mountain cities in 2030 under three different scenarios (Note: (a–l) represent patterns of spatial distribution of WS, CS, SDR and HQ for three scenarios in 2030, respectively).
Table 6.
WS data under different scenarios.
The highest WS in the SSP2-4.5 scenario was 2267 mm, which represents a 203.19% increase relative to 2020, regarding an average value of 570 mm. The SSP5-8.5 scenario demonstrates a maximum WS of 1568 mm and a mean of 376 mm, reflecting a 100% increase compared to 2020. Overall, WS significantly increased under all three scenarios compared to 2020, and the SSP2-4.5 scenario exhibited the most substantial increase in both mean and maximum values. The highest WS per unit area was primarily concentrated in the southern part of the study area.
(2) CS.
Figure 8d–f presents a stable pattern in the distribution of CS across the lower mountain karst region under the three scenarios, i.e., “higher concentration in the east and lower concentration in the west.” The projections exhibit (Table 7) a slight increase in CS for the SSP1-1.9 and SSP2-4.5 scenarios for 2030 versus 2020, with the highest CS in the SSP1-1.9 scenario. Nonetheless, the SSP5-8.5 scenario has a slightly reduced CS. With the purpose of exploring the impacts of future SSPs-RCPs scenarios on CS in Wenshan Prefecture, the carbon emission changes under three 2030 scenarios were analyzed with the 2020 level as the baseline. CS capacity of the entire Wenshan Prefecture area grew slightly under the SSP1-1.9 scenario and the SSP2-4.5 scenario but declined under the SSP5-8.5 scenario.
Table 7.
CS data for different scenarios.
(3) SDR.
Figure 8g–i illustrates the contiguous distribution patterns of the SDR in the Wenshan Prefecture area under the three scenarios. The findings reveal a rather stable state, with lower SDR values in the middle and northern areas of Wenshan Prefecture, but elevated values in the eastern and southern areas. In 2030, SDR under the same scenarios exhibits a significant increase compared to 2020. The highest SDR value was observed under the SSP2-4.5 scenario, followed by SSP5-8.5 and SSP1-1.9.
(4) HQ.
Figure 8j–l presents the location pattern of HQ in the lower Wenshan Prefecture area throughout the three scenarios. The findings specify that Wenshan Prefecture’s eastern region has a concentration of high HQ values, whilst the city’s western and central regions have lower HQ values. Compared to 2020, the HQ reveals a slight improvement in 2030 under the SSP1-1.9 scenario, while it undergoes a slight decline under the other two scenarios. The highest HQ of 0.6725 was observed in the SSP1-1.9 scenario, followed by the SSP2-4.5 and SSP5-8.5 scenarios, with HQ values of 0.6664 and 0.6363, respectively.
3.2.2. Analysis of Trade-Offs/Synergies Between ESs Under Different Scenarios
The association between ESs was examined, as illustrated in Figure 9. Specifically, six sets of correlations were identified among the four ESs in Wenshan City. Notably, two sets of significant correlations were observed across the three different scenarios of 2020, all of which exhibited negative correlations. WS and CS, as well as SDR and HQ, all demonstrated trade-offs, with the highest correlation coefficient reaching −0.99. Conversely, three sets of significant positive correlations were identified, reflecting synergistic relationships. CS, SDR, and HQ were positively correlated in the 2020, SSP1-1.9, and SSP5-8.5 scenarios, with the highest correlation coefficient of 0.96.
Figure 9.
(a): Correlation coefficients of ecosystem service trade-off synergies in the Wenshan Karst region in 2020; (b–d): Correlation coefficients of ecosystem service trade-offs in the Wenshan Karst region under three scenarios (Note: The size of the circle represents the magnitude of the coefficient, green indicates synergistic relationships, yellow indicates trade-offs, *** p < 0.05, ** p < 0.1).
Concerning correlation strength, five pairs exhibited a high correlation, four pairs presented a moderate correlation, and two pairs displayed a weak correlation. Particularly, CS and HQ maintained a clear positive correlation in 2020 and across the three different scenarios, with an extremely high correlation coefficient of 0.96; SDR and HQ displayed a somewhat positive association in the SSP1-1.9 and SSP5-8.5 scenarios, with a maximum correlation coefficient of 0.82; CS demonstrated a poor correlation with both SDR and HQ in the SSP2-4.5 scenario, with the lowest correlation coefficient of −0.043.
Table 8 reflects the distinct spatial and temporal heterogeneity of ESs under the three separate future scenarios in 2020 and 2030. In 2020, trade-off relationships dominated the study area, with certain ESs exhibiting negative correlations, particularly between WS, CS, SDR, and HQ. These trade-offs demonstrated the complicated association between land use changes and the provision of ESs, with notable regional variances due to land use types and socioeconomic activity. The trade-offs between CS–WS, HQ–WS, and WS -SDR occupied 42.39%, 40.71%, and 38.54% of the total observed relationships, respectively. The primary loci of trade-offs were regions with high shares of construction, cropland, and unused land, attributed to the city’s population size and economic expansion.
Table 8.
Percentage of bivariate trade-off synergistic image elements for ESs under different scenarios.
As depicted in Figure 10, a decrease in HQ, SDR, and CS potential stems from the switch of farmed and forested land to construction land, which elevates the sources of environmental concerns. In the SSP1-1.9 and SSP2-4.5 scenarios, CS, HQ, SDR, and WS were primarily governed by synergistic relationships between these ESs. This was especially apparent in the northern, southern, and vital portions of the study area, where both scenarios prioritized ecological conservation, highlighting the protection and restoration of ecologically significant land types. This brought about the low land use intensity, high habitat quality, and increased vegetation cover, thereby triggering a corresponding rise in carbon sequestration capacity and rainfall interception, accordingly benefiting soil conservation.
Figure 10.
Spatial patterns of ESs trade-offs and synergies under three scenarios for 2020 and 2030 (Note: High-High, Low-Low represent bivariate synergies, and High-Low, Low-High denote bivariate trade-offs).
In the SSP5-8.5 scenario, the trade-off ratios for HQ-WS, CS-WS, and WS-SDR were 36.54%, 34.73%, and 21.94%, respectively. These trade-offs were mostly observed in places where building and vacant land predominated, especially in the study area’s center. In other words, ESs in Wenshan Prefecture experienced significant trade-offs with the development of the economy. Spatially, areas with a higher proportion of construction land exhibited low synergy between the two types of services, while areas dominated by forested land had a higher degree of synergy. The interactions and delivery of ESs were considerably impacted by the various land use patterns.
3.3. Analysis of Drivers of ESs Changes in Wenshan Prefecture
As revealed in Figure 11, an SEM was established by integrating data on topography, climate, land use change, human activities, and socio-economic factors to better understand the driving mechanisms behind the changes in ESs in Wenshan Prefecture. The model was employed as a quantitative tool for assess these factors’ effects on urban ESs changes. Table 9 lists the factors affecting the four main ESs in Wenshan Prefecture (WS, CS, SDR, and HQ). The vegetation-dominated ecosystem negatively influenced water supply with an impact coefficient of −0.79, while positively influencing CS, SDR, and HQ with impact coefficients of 0.83, 0.63, and 0.67, respectively. Climate change exerted a negative effect on CS, SDR, and HQ, but a positive effect on WS. Notably, the karst terrain was extremely vulnerable to climate change because of its low resilience and ability to act as a buffer against environmental disruptions [68,69]. The key goodness-of-fit indices for constructing the four major ecosystem services by the PLS-PM model all exceeded 0.3 (GOF > 0.3), demonstrating the validity of the model.
Figure 11.
SEM of drivers of changes in ESs in Wenshan Prefecture, (a–d) represent the factors affecting the four main ESs. (Note: light blue and pink arrows indicates the latent variable is influenced by the manifest variable; navy blue and orange arrows indicates the target of the effect).
Table 9.
Impact coefficients of drivers of ESs in Wenshan Prefecture.
4. Discussion
4.1. Differential Analysis of the Impacts of Land-Use Change on Multiple ESs
The SD-FLUS model was employed in this work to create scenario-based projections and analyze the historical and geographical trends of land use in Wenshan Prefecture. Across the three scenarios, the extent of construction land exhibited significant expansion, whereas ecological spaces of forests and grasslands experienced contraction. Concurrently, the configuration of productive land, including cultivated land, underwent corresponding adjustments.
Overall, the study area has its spatial pattern subjected to significant transformation, profoundly impacting the supply capacity and dynamic changes in Wenshan’s urban ecosystem services. Land use change crucially drives ecosystem service dynamics [70]. Across all three scenarios, water supply services demonstrate a spatial pattern of “increasing in the south and decreasing in the north”, closely associated with the southern part of the study area dominated by forest land and with an ultra-low proportion of construction land. By 2030, Wenshan Prefecture will be projected to expand its construction land attributed to socioeconomic development and increased population density, resulting in higher water demand. This could induce adverse effects such as water scarcity.
The supply-demand imbalance in Wenshan Prefecture should be alleviated by the rational planning of the socioeconomic development pattern and the optimization of the land use structure. Diverse mitigation measures should be adopted. In the southern part of the study area, where construction land exhibits high population density, the increased water demand from urbanization and industrialization can be mitigated by enhancing water conservation awareness, elevating water use efficiency, limiting population growth, and bettering water resource allocation to alleviate water shortages in urban industrial zones.
Furthermore, farmland requires substantial irrigation for grain cultivation, exacerbating water scarcity. Thus, it is essential to develop water-efficient ecological agriculture, adjust crop structures, and enhance vegetation diversity to increase water retention capacity. Hydrogeological conditions and surface water distribution patterns must be investigated, given the complex and unique geological features of karst regions. Strengthening water conservancy infrastructure is crucial to overcoming water shortages in karst areas [71].
Under all three scenarios, high-value zones for CS and SDR are concentrated in the eastern part of Wenshan City. This is primarily because, different from the western part which is driven by construction land and farmland, the eastern region features extensive distribution of tree forests and shrub forests, which are more conducive to carbon sink accumulation and soil conservation. Forests constitute the largest carbon reservoir in ecosystems and capture atmospheric carbon dioxide through vegetation and soil to significantly reduce greenhouse gas concentrations [72].
Forest vegetation cover exhibits a positive correlation with carbon sequestration capacity, with higher coverage indicating greater carbon storage potential. In the foreseeable future, economic development and intensified land development will increasingly compromise ecological stability, bringing about the degradation of grasslands and woodlands, consequently diminishing carbon sequestration capacity in the study area. Therefore, adjusting policies concerning socioeconomic development, optimizing land use structures, and enhancing land use efficiency pose major challenges to local governments. Notably, rapid economic growth will lead to a sustained decline in carbon sinks and gradual ecological deterioration [73]. Thus, pressure on increasing demand for carbon sequestration services can be alleviated by triggering a shift in economic development from “high growth” to “high quality”. Furthermore, accelerated climate change will negatively impact vegetation growth. Increasing the utilization of solar and wind energy resources for energy conversion while declining fossil fuel use can weaken climate change impacts while preventing grasslands and woodlands from being more deeply degraded.
Moreover, forested land is the land use type with the greatest carbon sequestration impact within terrestrial ecosystems. Local governments can expand forested areas through afforestation and returning farmland to forests. These practices can be implemented to preserve forest ecosystem health and vitality, elevate forest land quality, and reinforce the forest ecosystem’s carbon sequestration capacity.
Additionally, soil conservation services are crucial for soil formation, stable vegetation growth, and water conservation. With shrub plantations being introduced, the well-developed robust root systems remarkably contribute to the increased soil porosity and enhanced soil mineral particle stability [74], accordingly improving the air and water retention capacities in soil, which is vital in arid environments. Therefore, increasing vegetation coverage mitigates ecological issues of soil erosion, declining soil fertility, and agricultural water pollution. Against the backdrop of ecological restoration and conservation in karst regions, the following optimized soil conservation management measures are proposed. First, the government should strengthen the function of ecosystems in soil and water conservation, accelerate the restoration of degraded vegetation, implement grazing bans and rest periods for grasslands, and enforce grass-livestock balance systems, thereby strengthening the capability of forest and grassland vegetation for soil and water conservation.
Soil erosion control under forests should be reinforced by implementing regeneration, selective cutting, tending, and replanting measures to optimize forest structure, enhance ecosystem stability, and boost ecological functions like soil and water conservation. Second, comprehensive management of rock desertification should be scientifically advanced. Besides, rock desertification control should be integrated with rural industrial restructuring, regional economic development, and community prosperity. Moreover, the government should vigorously develop specialty crops, forest fruits, medicinal plants, and other industries. Forest and grassland vegetation in karst regions should be more effectively protected and restored to increase coverage and ecological quality [75], which carried extensive research on the development of ESs in Southeast Yunnan’s Karst region. The correlation and spatial-temporal distribution patterns of ESs in Wenshan Prefecture during the past and in the future were also examined in this study.
Under all three scenarios, HQ remains relatively high in the SSP1-1.9 scenario since local governments prioritize ecological conservation in this scenario. Habitat quality is closely linked to human activities, particularly productive activities, which significantly impact ecological balance [52]. SSP1-1.9 exhibits the smallest increase in construction land area and the lowest degree of spatial restructuring versus other scenarios. Overall, various land use types collectively influence the regional habitat quality, and a key factor is the scale of construction land. This study reveals that regional habitat quality declines as the construction land scale expands under scenarios of high-intensity human activity, consistent with Zhou Bao’s [22] conclusions from research on ecosystem services in the karst regions of southeastern Yunnan. In future socioeconomic development, strict control over population growth and urban expansion is essential, with large-scale development and construction strictly prohibited. Rational management of production activities is vital for protecting ecological spaces. This can be achieved by (1) rationally delineating the urban development boundaries and the ecological red lines to define the “three-life space” (ecological, productive, and living); (2) implementing nature-based solutions in urbanized areas; (3) adopting agroforestry measures in agricultural regions to enhance vegetation diversity; (4) adhering to the principle of “reclamation during development” in construction land utilization. These measures will effectively mitigate human disturbance to natural habitats, thereby improving habitat quality in karst regions.
In our study, SEM was employed to analyze the drivers influencing ESs in Wenshan Prefecture. According to our research, WS and HQ are adversely impacted by land use change. The considerable human activity and its expansion are expected to trigger a rise in building land, whereas areas such as grassland and forests will likely diminish. This negatively impacts WS and HQ. In parallel, the ecological environment exerts a positive influence on CS, SDR, and HQ, while exerting a negative impact on WS.
Wenshan Prefecture, featuring high altitude and favorable water and thermal conditions, provides an environment conducive to vegetation growth [53]. The dominant vegetation type in the area is woodland, and regions with abundant vegetation growth exhibit higher evapotranspiration rates, leading to a lower water supply. Nonetheless, vegetative carbon sequestration and the soil delivery ratio are stronger in areas with dense vegetation, and habitat quality is correspondingly higher compared to sparsely vegetated areas.
4.2. Prospects and Inadequacy
4.2.1. Inadequacy
This study recognizes the following limitations in examining the dynamics of ecosystem service functions and the associated trade-offs and synergies in the karst region of Wenshan Prefecture:
- (1)
- Cultural ESs require greater attention. Wenshan Prefecture, situated in the karst region of southwest China, boasts stunning natural landscapes and a rich array of cultural and tourism resources. These attributes, which effectively support regional ecological functions and human well-being, remain underexplored in this study. In recent years, China has been concerned with cultural self-confidence, contributing to increased recognition and appreciation of traditional ethnic cultures.
However, current research on ESs in karst regions is limited to the assessment models of provisioning, supporting, and regulating services, whereas cultural services remain underexplored despite their growing importance [76,77]. Although various methodologies and a well-established theoretical framework exist, there is little research on assessment models for cultural ESs. In the context of rapid economic development, future research could prioritize advancing the theoretical understanding of cultural ESs, refining comprehensive evaluation systems, enhancing the role of cultural services, and exploring their synergistic and trade-off relationships with other ecosystem functions.
- (2)
- The selection of study sites is overly homogeneous. This study took the karst regions of Yunnan as an example, with the majority of studies similarly concentrated in Guizhou and Yunnan provinces. In contrast, the study of ESs in the karst regions of the Guangxi Zhuang Autonomous Region has received comparatively less attention in research. The karst landscape of Guangxi features peak clusters and depressions, accompanied by complex geomorphological features and significant human-land conflicts. Future research could concentrate on the karst regions of the Guangxi Zhuang Autonomous Region, allowing for a comprehensive categorization of the entire southwest China karst landscape. This could facilitate the study of spatiotemporal changes in ESS functions and their trade-offs or synergies, providing insights into regional variability and dynamics.
- (3)
- The application of SEM to investigate the driving mechanisms of the intricate linkages and evolution of ESs under future scenarios was hindered by time limits on some of the data used here. Additionally, future land use changes will involve uncertainties and complexities, and the three scenarios adopted in our study cannot encompass all potential changes that may occur. These scenarios should be further expanded and refined for a more comprehensive analysis. Numerous studies have adopted the InVEST model to evaluate ESs in karst terrain. Nevertheless, certain data required for model parameterization can be hardly obtained, attributed to the lack of localized data on the natural geographic characteristics of different types of karst landscapes.
Therefore, most researchers refer to previous studies and relevant information. Nonetheless, while the simulation results can partially explain the study area’s ecological characteristics, they are incapable of representing well the true state of its ecosystem service functions. Consequently, the exactness of the evaluation outcomes needs enhancement. It is allowed to intensify the accuracy and dependability of the results in the future by further refining assessment techniques and scales through the use of geographical and temporal heterogeneity analysis at several scales. This enlightens the investigation of more scientific and effective ecosystem management and decision-making.
4.2.2. Prospective
China initiated efforts to address rocky desertification management in 2008 and formally launched the “Twelfth Five-Year Plan” project in 2010 to perform the comprehensive management and restoration of rocky desertification in karst regions. Since the implementation of the “Thirteenth Five-Year Plan” in 2016, these efforts have been further intensified, with a focus on improving management practices to restore and improve the ecological environment. With the critical objective of enhancing human well-being and promoting ecological sustainability, an increasing number of researchers interpret the trade-offs and synergies among ESs, along with respective fundamental driving mechanisms [78,79,80]. The synergistic co-development of multiple ESs seeks to establish the optimal model for socio-economic development or to optimize trade-offs among ESs, thereby achieving maximum integrated benefits under land-use change.
To enhance ESs in rocky desertification areas, this study offers the following outlook. Currently, ecological restoration projects in China and the region primarily focus on afforestation, converting farmland into forests, and comprehensive management of rocky desertification. While these measures benefit ESs to some extent, challenges of trade-offs and synergies persist. Numerous factors influence these dynamics, frequently presenting “non-linear” relationships [81]. Focusing on these challenges in ESs in karst regions, while accounting for both temporal and spatial dimensions, is essential for prioritizing environmental sustainability.
Therefore, controlling the proliferation of built-up land will essentially help to expand the scale of ecological land use in future land-use management planning. The formulation of ecological restoration strategies will be guided by planting suitable tree species based on the unique characteristics of karst landscapes, coupled with monitoring the trade-offs and synergistic evolutionary interactions among various ESs. This approach aims to enhance and improve ESs in areas significantly impacted by human activities.
5. Conclusions
- (1)
- Three scenarios were established to forecast changes in Wenshan Prefecture’s land usage by 2030. The SSP1-1.9 scenario presented increasing areas of grassland and forest land, and growing amount of development land. The SSP2-4.5 and SSP5-8.5 scenarios exhibited decreasing area of forest land and grassland and a larger size of construction land.
- (2)
- FLUS and InVEST models were developed for the prediction of WS, CS, SDR, and HQ in the karst area of Wenshan Prefecture in 2030 under above three scenarios. WS and SDR were expected to significantly grow in 2030 compared to 2020 under all three scenarios.
- (3)
- In 2020, in the SSP1-1.9, and SSP5-8.5 scenarios, WS and CS, SDR, and HQ exhibited trade-offs, with the highest correlation coefficient of −0.99; CS, SDR, and HQ demonstrated a synergistic relationship, with the highest correlation coefficient of 0.96.
- (4)
- In the SSP1-1.9 and SSP2-4.5 scenarios, the synergistic relationship between CS, HQ, SDR, and WS was predominantly observed, particularly in the northern, southern, and central parts of Wenshan Prefecture. In the SSP5-8.5 scenario, the relationships between HQ and WS, CS and WS, as well as WS and SDR were characterized by trade-off relationships. They were typically located in the primary location of the study area, where land use is driven by construction land.
- (5)
- The primary driving mechanisms influencing changes in ESs in Wenshan Prefecture involve topography, vegetation-dominated ecosystems, and high values of influence coefficients.
Author Contributions
Y.Z. took charge of Conceptualization; Formal analysis; Funding acquisition; Investigation; Methodology; Project administration; Resources; Supervision; Writing—review & editing. Y.T. and Y.L. were responsible for Data curation; Investigation; Methodology; Roles/Writing—original draft. S.Z., J.C. and M.H. were responsible for Formal analysis; Funding acquisition; Methodology; Writing—review & editing. D.C., Z.D. and Y.G. were responsible for Investigation; Methodology; Writing—review & editing. All authors have read and agreed to the published version of the manuscript.
Funding
Science Research Fund of Yunnan Provincial Department of Education “Research Strategy for Biodiversity Conservation in Xishuangbanna Prefecture Under the ‘Wilderness Wisdom’ Framework” (Grant NO. 2023Y0754), Yunnan Provincial Department of Education Science Research Fund Project “Research on Landscape Art of Non mainstream Ethnic Minorities in Yunnan from a Multicultural Perspective” (Grant NO. 2019J019), Yunnan Provincial Academic Degrees Committee and Yunnan Provincial Department of Education “2021 Yunnan Provincial Professional Degree Graduate Case Library Construction Project ‘Ethnic Landscape (Traditional Village Protection Planning) Teaching Case Library’” (Yunshi [2021] No. 18).
Institutional Review Board Statement
Not applicable.
Informed Consent Statement
Not applicable.
Data Availability Statement
The raw data supporting the conclusions of this article will be made available by the authors on request.
Conflicts of Interest
The authors declare no conflicts of interest.
References
- Kubiszewski, I.; Costanza, R.; Anderson, S.; Sutton, P. The future value of ecosystem services: Global scenarios and national implications. In Environmental Assessments; Edward Elgar Publishing: Gloucester, UK, 2020; pp. 81–108. [Google Scholar]
- Gong, J.; Liu, D.; Zhang, J.; Xie, Y.; Cao, E.; Li, H. Tradeoffs/synergies of multiple ecosystem services based on land use simulation in a mountain-basin area, western China. Ecol. Indic. 2019, 99, 283–293. [Google Scholar] [CrossRef] [Scilit]
- Jiang, W.; Wu, T.; Fu, B. The value of ecosystem services in China: A systematic review for twenty years. Ecosyst. Serv. 2021, 52, 101365. [Google Scholar] [CrossRef] [Scilit]
- Jiao, K.; Liu, Z.; Wang, W.; Yu, K.; Mcgrath, M.J.; Xu, W. Carbon cycle responses to climate change across China’s terrestrial ecosystem: Sensitivity and driving process. Sci. Total Environ. 2024, 915, 170053. [Google Scholar] [CrossRef] [Scilit] [PubMed]
- Kreuter, U.P.; Harris, H.G.; Matlock, M.D.; Lacey, R.E. Change in ecosystem service values in the San Antonio area, Texas. Ecol. Econ. 2001, 39, 333–346. [Google Scholar] [CrossRef] [Scilit]
- Zhang, W.; Ricketts, T.H.; Kremen, C.; Carney, K.; Swinton, S.M. Ecosystem services and dis-services to agriculture. Ecol. Econ. 2007, 64, 253–260. [Google Scholar] [CrossRef] [Scilit]
- Zhou, C.; Zhang, W.; Richardson-Barlow, C. Navigating ecological civilisation: Polycentric environmental governance and policy regulatory framework in China. Energy Res. Soc. Sci. 2025, 128, 104347. [Google Scholar] [CrossRef] [Scilit]
- Gomes, E.; Inácio, M.; Bogdzevič, K.; Kalinauskas, M.; Karnauskaitė, D.; Pereira, P. Future land-use changes and its impacts on terrestrial ecosystem services: A review. Sci. Total Environ. 2021, 781, 146716. [Google Scholar] [CrossRef] [Scilit]
- El-Hamid, H.T.A.; Nour-Eldin, H.; Rebouh, N.Y.; El-Zeiny, A.M. Past and future changes of land use/land cover and the potential impact on ecosystem services value of Damietta Governorate, Egypt. Land 2022, 11, 2169. [Google Scholar] [CrossRef] [Scilit]
- DeLoyde, C.N.; Mabee, W. Ecosystem service values as an ecological indicator for land management decisions: A case study in southern Ontario, Canada. Ecol. Indic. 2023, 151, 110344. [Google Scholar] [CrossRef] [Scilit]
- Huang, Y.; Zhang, S.; Zhang, J.; Fan, F.; Zheng, H. Exploration of ecosystem asset-economy coupling coordination and its endogenous and exogenous drivers in mountainous regions. J. Clean. Prod. 2025, 486, 144460. [Google Scholar] [CrossRef] [Scilit]
- Vose, R.S.; Karl, T.R.; Easterling, D.R.; Williams, C.N.; Menne, M.J. Impact of land-use change on climate. Nature 2004, 427, 213–214. [Google Scholar] [CrossRef] [Scilit] [PubMed]
- Lambin, E.F.; Geist, H.J.; Lepers, E. Dynamics of land-use and land-cover change in tropical regions. Annu. Rev. Environ. Resour. 2003, 28, 205–241. [Google Scholar] [CrossRef] [Scilit]
- Lou, Z.; Zhao, X.; Chen, C.; Peng, S. Rural revitalisation: Spatio-temporal evolution and multi-scenario prediction of ecosystem service values of second homes in Moudao, China. Land Use Policy 2025, 150, 107467. [Google Scholar] [CrossRef] [Scilit]
- Schirpke, U.; Tscholl, S.; Tasser, E. Spatio-temporal changes in ecosystem service values: Effects of land-use changes from past to future (1860–2100). J. Environ. Manag. 2020, 272, 111068. [Google Scholar] [CrossRef] [Scilit]
- Zhu, M.; Zhou, Z.; Wu, X.; Wan, J.; Wang, J.; Zheng, J.; Liu, R.; Li, F. Prediction and spillover effects of forest expansion and management to increase carbon sinks in karst mountainous areas: A case study in Guizhou, China. Land Use Policy 2025, 151, 107491. [Google Scholar] [CrossRef] [Scilit]
- Tebaldi, C.; Debeire, K.; Eyring, V.; Fischer, E.; Fyfe, J.; Friedlingstein, P.; Knutti, R.; Lowe, J.; O’Neill, B.; Sanderson, B. Climate model projections from the scenario model intercomparison project (ScenarioMIP) of CMIP6. Earth Syst. Dyn. 2021, 12, 253–293. [Google Scholar] [CrossRef] [Scilit]
- Huang, Z.; Li, X.; Du, H.; Mao, F.; Han, N.; Fan, W.; Xu, Y.; Luo, X. Simulating future LUCC by coupling climate change and human effects based on multi-phase remote sensing data. Remote Sens. 2022, 14, 1698. [Google Scholar] [CrossRef] [Scilit]
- Degerli, B.; Çetin, M. Using the remote sensing method to simulate the land change in the year 2030. Turk. J. Agric.-Food Sci. Technol. 2022, 10, 2453–2466. [Google Scholar] [CrossRef] [Scilit]
- Feng, H.; Lei, X.; Yu, G.; Changchun, Z. Spatio-temporal evolution and trend prediction of urban ecosystem service value based on CLUE-S and GM (1, 1) compound model. Environ. Monit. Assess. 2023, 195, 1282. [Google Scholar] [CrossRef] [Scilit]
- Wang, W.; Jiao, L.; Dong, T.; Xu, Z.; Xu, G. Simulating urban dynamics by coupling top-down and bottom-up strategies. Int. J. Geogr. Inf. Sci. 2019, 33, 2259–2283. [Google Scholar] [CrossRef] [Scilit]
- Tang, J.; Song, P.; Hu, X.; Chen, C.; Wei, B.; Zhao, S. Coupled effects of land use and climate change on water supply in SSP–RCP scenarios: A case study of the Ganjiang river Basin, China. Ecol. Indic. 2023, 154, 110745. [Google Scholar] [CrossRef] [Scilit]
- Liu, J.; Hu, Y.; Feng, Z.; Xiao, C. A review of land use and land cover in mainland southeast Asia over three decades (1990–2023). Land 2025, 14, 828. [Google Scholar] [CrossRef] [Scilit]
- Zhang, M.; Chen, E.; Zhang, C.; Liu, C.; Li, J. Multi-scenario simulation of land use change and ecosystem service value based on the markov–FLUS model in Ezhou city, China. Sustainability 2024, 16, 6237. [Google Scholar] [CrossRef] [Scilit]
- Brovkin, V.; Boysen, L.; Arora, V.K.; Boisier, J.; Cadule, P.; Chini, L.; Claussen, M.; Friedlingstein, P.; Gayler, V.; Van Den Hurk, B. Effect of anthropogenic land-use and land-cover changes on climate and land carbon storage in CMIP5 projections for the twenty-first century. J. Clim. 2013, 26, 6859–6881. [Google Scholar] [CrossRef] [Scilit]
- Hasan, S.S.; Zhen, L.; Miah, M.G.; Ahamed, T.; Samie, A. Impact of land use change on ecosystem services: A review. Environ. Dev. 2020, 34, 100527. [Google Scholar] [CrossRef] [Scilit]
- Kim, S.-W.; Jung, Y.-Y. Application of the InVEST model to quantify the water yield of North Korean forests. Forests 2020, 11, 804. [Google Scholar] [CrossRef] [Scilit]
- Babbar, D.; Areendran, G.; Sahana, M.; Sarma, K.; Raj, K.; Sivadas, A. Assessment and prediction of carbon sequestration using Markov chain and InVEST model in Sariska Tiger Reserve, India. J. Clean. Prod. 2021, 278, 123333. [Google Scholar] [CrossRef] [Scilit]
- Piyathilake, I.; Udayakumara, E.; Ranaweera, L.V.; Gunatilake, S. Modeling predictive assessment of carbon storage using InVEST model in Uva province, Sri Lanka. Model. Earth Syst. Environ. 2022, 8, 2213–2223. [Google Scholar] [CrossRef] [Scilit]
- Sun, X.-X.; Xue, J.-H.; Dong, L.-N. Spatiotemporal change and prediction of carbon storage in Nanjing ecosystem based on PLUS model and InVEST model. J. Ecol. Rural Environ. 2023, 39, 41–51. [Google Scholar]
- Bao, Z.; Guoping, C.; Junsan, Z.; Ying, Y.; Zuguo, Y. Spatiotemporal Evolution and Trade-offs and Synergies of Ecosystem Services in the Karst Region of Southeast Yunnan. Water Resour. Hydropower Eng. 2024, 1–22. [Google Scholar] [CrossRef]
- Feng, Y.; Zhao, X.; Gu, Z.; Song, H.; Zhou, S. Discussion on Land Use Function Zoning in Karst Mountainous Areas of Yunnan Province Discussion on Land Use Function Zoning in Karst Mountainous Areas of Yunnan Province. Environ. Sci. Surv. 2022, 41, 74–81. [Google Scholar] [CrossRef]
- Tan, K.; Yan, Z.; Zhao, Z.; Pu, J.; Li, S.; Miao, P.; Zhao, X. Evaluation of Resource and Environmental Carrying Capacity of Wenshan City in Karst Area Based on Fuzzy Model. Res. Soil Water Conserv. 2021, 28, 218–227. [Google Scholar]
- Wang, Q.; Zhao, X.; Pu, J.; Shi, X. Impact of land use changes in Karst mountain area on ecological vulnerability. Mt. Res. 2022, 2, 289–302. [Google Scholar]
- Xu, Y.; Zhao, S.; Duan, J. Studies on the land use classification scheme for territory spatial planning. Geogr. Res. Geogr. Res. 2019, 38, 2388–2401. [Google Scholar]
- Peng, S.; Ding, Y.; Liu, W.; Li, Z. 1 km monthly temperature and precipitation dataset for China from 1901 to 2017. Earth Syst. Sci. Data 2019, 11, 1931–1946. [Google Scholar] [CrossRef] [Scilit]
- Xu, X. China’s population spatial distribution kilometer grid dataset. In Data Registration and Publishing System of the Resource and Environmental Science Data Center of the Chinese Academy of Sciences; CAS: Beijing, China, 2017. [Google Scholar]
- Xu, X. Spatial Distribution of GDP in China with Kilometer Grid Dataset. Resour. Environ. Sci. Data Regist. Publ. Syst. 2017. Available online: http://www.resdc.cn/ (accessed on 3 August 2024). [CrossRef]
- Peng, S. 1 km Multi-Scenario and Multi-Model Monthly Precipitation Data for China in 2021–2100; National Tibetan Plateau/Third Pole Environment Data Center: Beijing, China, 2022. [Google Scholar] [CrossRef]
- Peng, S. 1 km Multi-Scenario and Multi-Model Monthly Temperature Data for China in 2021–2100; National Tibetan Plateau/Third Pole Environment Data Center: Beijing, China, 2022. [Google Scholar] [CrossRef]
- Liang, X.X.; Hui, L.J. CIMP6 Global Future Climate Scenarios Month-by-Month Dataset. 2023. Available online: http://www.resdc.cn/ (accessed on 30 July 2024). [CrossRef]
- Tucker, C.; Newcomb, W.; Los, S.; Prince, S. Mean and inter-year variation of growing-season normalized difference vegetation index for the Sahel 1981–1989. Int. J. Remote Sens. 1991, 12, 1133–1135. [Google Scholar] [CrossRef] [Scilit]
- Fan, W.Q. System Dynamics; Shanghai University of Finance and Economics Press: Shanghai, China, 2009. [Google Scholar]
- Forrester, J.W. Principles of Systems; Wright-Allen Press: Cambridge, MA, USA, 1968. [Google Scholar]
- Suryani, E.; Chou, S.-Y.; Hartono, R.; Chen, C.-H. Demand scenario analysis and planned capacity expansion: A system dynamics framework. Simul. Model. Pract. Theory 2010, 18, 732–751. [Google Scholar] [CrossRef] [Scilit]
- He, X.; Mai, X.; Shen, G. Delineation of urban growth boundaries with SD and CLUE-s models under multi-scenarios in chengdu metropolitan area. Sustainability 2019, 11, 5919. [Google Scholar] [CrossRef] [Scilit]
- Berhanu, D.; Alamirew, T.; Bewket, W.; Tarkegn, T.G.; Zeleke, G.; Haileslassie, A.; O’Donnell, G.; Walsh, C.L.; Gebrehiwot, S. Evaluation of CMIP6 models in simulating seasonal extreme precipitation over Ethiopia. Weather Clim. Extrem. 2025, 47, 100752. [Google Scholar] [CrossRef] [Scilit]
- Lai, J.; Qi, S.; Chen, J.; Guo, J.; Wu, H.; Chen, Y. Exploring the spatiotemporal variation of carbon storage on Hainan Island and its driving factors: Insights from InVEST, FLUS models, and machine learning. Ecol. Indic. 2025, 172, 113236. [Google Scholar] [CrossRef] [Scilit]
- Liu, X.; Liang, X.; Li, X.; Xu, X.; Ou, J.; Chen, Y.; Li, S.; Wang, S.; Pei, F. A future land use simulation model (FLUS) for simulating multiple land use scenarios by coupling human and natural effects. Landsc. Urban Plan. 2017, 168, 94–116. [Google Scholar] [CrossRef] [Scilit]
- Yaowei, Q.; Yu, Y.; Jiaqi, D.; Zhenyu, Z.; Shuangjiang, L.; Jiansheng, C.; Jieying, X. Scenario-driven modeling of mountain ecosystems: Land use-carbon dynamics simulation based on the coupled SD-FLUS-InVEST framework. Ecol. Model. 2025, 510, 111293. [Google Scholar] [CrossRef] [Scilit]
- Sannigrahi, S.; Chakraborti, S.; Joshi, P.K.; Keesstra, S.; Sen, S.; Paul, S.K.; Kreuter, U.; Sutton, P.C.; Jha, S.; Dang, K.B. Ecosystem service value assessment of a natural reserve region for strengthening protection and conservation. J. Environ. Manag. 2019, 244, 208–227. [Google Scholar] [CrossRef] [Scilit]
- Canedoli, C.; Ficetola, G.F.; Corengia, D.; Tognini, P.; Ferrario, A.; Padoa-Schioppa, E. Integrating landscape ecology and the assessment of ecosystem services in the study of karst areas. Landsc. Ecol. 2022, 37, 347–365. [Google Scholar] [CrossRef] [Scilit]
- Jin, Y.; Li, Y.; Shen, W.; Zhu, H. Study on the Interaction Effects of Landscape Pattern on the Synergistic Trade-Offs of Ecosystem Services Based on Multi-Model Fusion: A Case Study of Chengdu-Chongqing Economic Circle. Land 2024, 13, 1982. [Google Scholar] [CrossRef] [Scilit]
- Zhang, K.; Fang, B.; Zhang, Z.; Liu, T.; Liu, K. Exploring future ecosystem service changes and key contributing factors from a “past-future-action” perspective: A case study of the Yellow River Basin. Sci. Total Environ. 2024, 926, 171630. [Google Scholar] [CrossRef] [Scilit]
- Kai, W.; Jinyi, G.; Nan, Z. Evaluation on water source conservation capacity of West Liaohe River Basin based on InVEST model. In Proceedings of the 2019 International Conference on Smart Grid and Electrical Automation (ICSGEA), Xiangtan, China, 10–11 August 2019; pp. 443–447. [Google Scholar]
- Li, J.; Chen, X.; Kurban, A.; Van de Voorde, T.; De Maeyer, P.; Zhang, C. Coupled SSPs-RCPs scenarios to project the future dynamic variations of water-soil-carbon-biodiversity services in Central Asia. Ecol. Indic. 2021, 129, 107936. [Google Scholar] [CrossRef] [Scilit]
- Sharp, R.; Douglass, J.; Wolny, S.; Arkema, K.; Bernhardt, J.; Bierbower, W.; Chaumont, N.; Denu, D.; Fisher, D.; Glowinski, K. InVEST 3.8. 7. User’s Guide. In The Natural Capital Project; Stanford University: Stanford, CA, USA, 2020. Available online: https://naturalcapitalproject.stanford.edu/software/invest (accessed on 17 September 2024).
- Anselin, L. Local indicators of spatial association—LISA. Geogr. Anal. 1995, 27, 93–115. [Google Scholar] [CrossRef] [Scilit]
- Liu, Y.; Wan, C.; Xu, G.; Chen, L.; Yang, C. Exploring the relationship and influencing factors of cultivated land multifunction in China from the perspective of trade-off/synergy. Ecol. Indic. 2023, 149, 110171. [Google Scholar] [CrossRef] [Scilit]
- Jin, T.; Zhang, P.; Zhou, N.; Li, S. Unveiling the spatiotemporal heterogeneity and driving mechanisms of carbon storage changes in response to land use/land cover changes under different future scenarios: Insights from the GMOP-SEM model. J. Clean. Prod. 2025, 487, 144622. [Google Scholar] [CrossRef] [Scilit]
- Gu, Z.; Zhang, Z.; Yang, J.; Wang, L. Quantifying the influences of driving factors on vegetation EVI changes using structural equation model: A case study in Anhui province, China. Remote Sens. 2022, 14, 4203. [Google Scholar] [CrossRef] [Scilit]
- Ji, C.; Zhang, Y.; Nejstgaard, J.C.; Ogashawara, I. Assessment of the sediment load in the pearl river estuary based on land use and land cover changes. CATENA 2025, 250, 108726. [Google Scholar] [CrossRef] [Scilit]
- Xu, X.; Du, Z.; Zhang, H. Integrating the system dynamic and cellular automata models to predict land use and land cover change. Int. J. Appl. Earth Obs. Geoinf. 2016, 52, 568–579. [Google Scholar] [CrossRef] [Scilit]
- Tan, J.; Li, A.; Lei, G.; Xie, X. A SD-MaxEnt-CA model for simulating the landscape dynamic of natural ecosystem by considering socio-economic and natural impacts. Ecol. Model. 2019, 410, 108783. [Google Scholar] [CrossRef] [Scilit]
- Zhang, J.; Wang, J.; Chen, Y.; Huang, S.; Liang, B. Spatiotemporal variation and prediction of NPP in Beijing-Tianjin-Hebei region by coupling PLUS and CASA models. Ecol. Inform. 2024, 81, 102620. [Google Scholar] [CrossRef] [Scilit]
- Liang, X.; Liu, X.; Li, X.; Chen, Y.; Tian, H.; Yao, Y. Delineating multi-scenario urban growth boundaries with a CA-based FLUS model and morphological method. Landsc. Urban Plan. 2018, 177, 47–63. [Google Scholar] [CrossRef] [Scilit]
- Qiao, X.; Li, Z.; Lin, J.; Wang, H.; Zheng, S.; Yang, S. Assessing current and future soil erosion under changing land use based on InVEST and FLUS models in the Yihe River Basin, North China. Int. Soil Water Conserv. Res. 2024, 12, 298–312. [Google Scholar] [CrossRef] [Scilit]
- Pan, S.; Liang, J.; Chen, W.; Li, J.; Liu, Z. Gray forecast of ecosystem services value and its driving forces in Karst Areas of China: A case study in Guizhou Province, China. Int. J. Environ. Res. Public Health 2021, 18, 12404. [Google Scholar] [CrossRef] [Scilit]
- Li, L.; Xu, E. Scenario analysis and relative importance indicators for combined impact of climate and land-use change on annual ecosystem services in the Karst mountainous region. Ecol. Indic. 2023, 147, 109991. [Google Scholar] [CrossRef] [Scilit]
- Yu, P.; Zhang, S.; Yung, E.H.; Chan, E.H.; Luan, B.; Chen, Y. On the urban compactness to ecosystem services in a rapidly urbanising metropolitan area: Highlighting scale effects and spatial non–stationary. Environ. Impact Assess. Rev. 2023, 98, 106975. [Google Scholar] [CrossRef] [Scilit]
- Liu, Y.; Luo, T.; Liu, Z.; Kong, X.; Li, J.; Tan, R. A comparative analysis of urban and rural construction land use change and driving forces: Implications for urban–rural coordination development in Wuhan, Central China. Habitat Int. 2015, 47, 113–125. [Google Scholar] [CrossRef] [Scilit]
- Ming, Z.J.; Shen, Y.F. Dictionary of Soil Science; Science Publishing House: Beijing, China, 2013. [Google Scholar]
- Rao, E.; Xiao, Y.; Ouyang, Z.; Zheng, H. Spatial characteristics of soil conservation service and its impact factors in Hainan Island. Acta Ecol. Sin. 2013, 33, 746–755. [Google Scholar] [CrossRef] [Scilit]
- Zhang, E.; Meng, C.; Qu, J.; Zhu, Z.; Niu, J.; Wang, L.; Song, N.; Yin, Z. Dual effects of Caragana korshinskii introduction on herbaceous vegetation in Chinese desert areas: Short-term degradation and long-term recovery. Plant Soil 2025, 1–19. [Google Scholar] [CrossRef] [Scilit]
- Chen, T.; Wang, Y.; Zeng, X.; Wang, Q. Characteristics and the constraint relationship between ecosystem services and vegetation coverage in the Southwest China. Acta Ecol. Sin. 2023, 43, 2253–2270. [Google Scholar] [CrossRef] [Scilit]
- Bi, X.; Yang, Z.; Wang, C.; Su, H.; Zhang, M. Coupling and co-evolution of biological and cultural diversity in the karst area of southwest China: A case study of Pogang Nature Reserve in Guizhou. Biodivers. Sci. 2020, 28, 1036. [Google Scholar] [CrossRef] [Scilit]
- Miao, P.; Zhao, Z.; Zhao, X.; Pu, J.; Li, S.; Wang, Q.; Tan, K. Study on trade-off and cooperation of ecosystem service space in rocky desertification area of Yunnan Province. Res. Soil Water Conserv. 2021, 28, 366–374. [Google Scholar]
- Lang, Y.; Song, W. Trade-off analysis of ecosystem services in a mountainous karst area, China. Water 2018, 10, 300. [Google Scholar] [CrossRef] [Scilit]
- Han, H.; Yin, C.; Zhang, C.; Gao, H.; Bai, Y. Response of trade-offs and synergies between ecosystem services and land use change in the Karst area. Trop. Ecol. 2019, 60, 230–237. [Google Scholar] [CrossRef] [Scilit]
- Wang, Y.; Dai, E. Spatial-temporal changes in ecosystem services and the trade-off relationship in mountain regions: A case study of Hengduan Mountain region in Southwest China. J. Clean. Prod. 2020, 264, 121573. [Google Scholar] [CrossRef] [Scilit]
- Deng, C.; Zhu, D.; Nie, X.; Liu, C.; Li, Z.; Liu, J.; Zhang, G.; Xiao, L.; Zhang, Y. Progress of research regarding the trade-offs of ecosystem services. Chin. J. Eco-Agric. 2020, 28, 1509–1522. [Google Scholar]
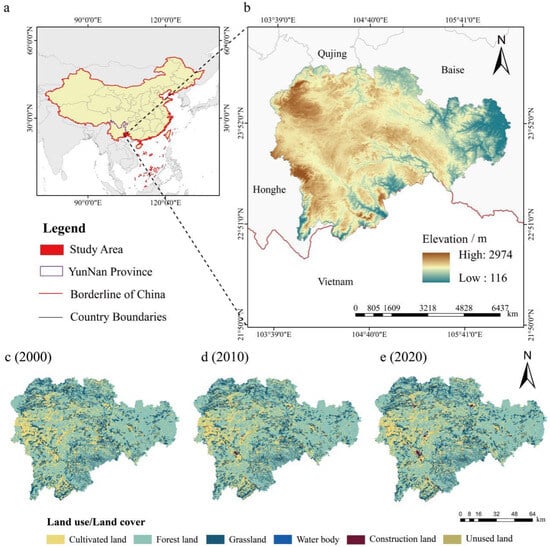
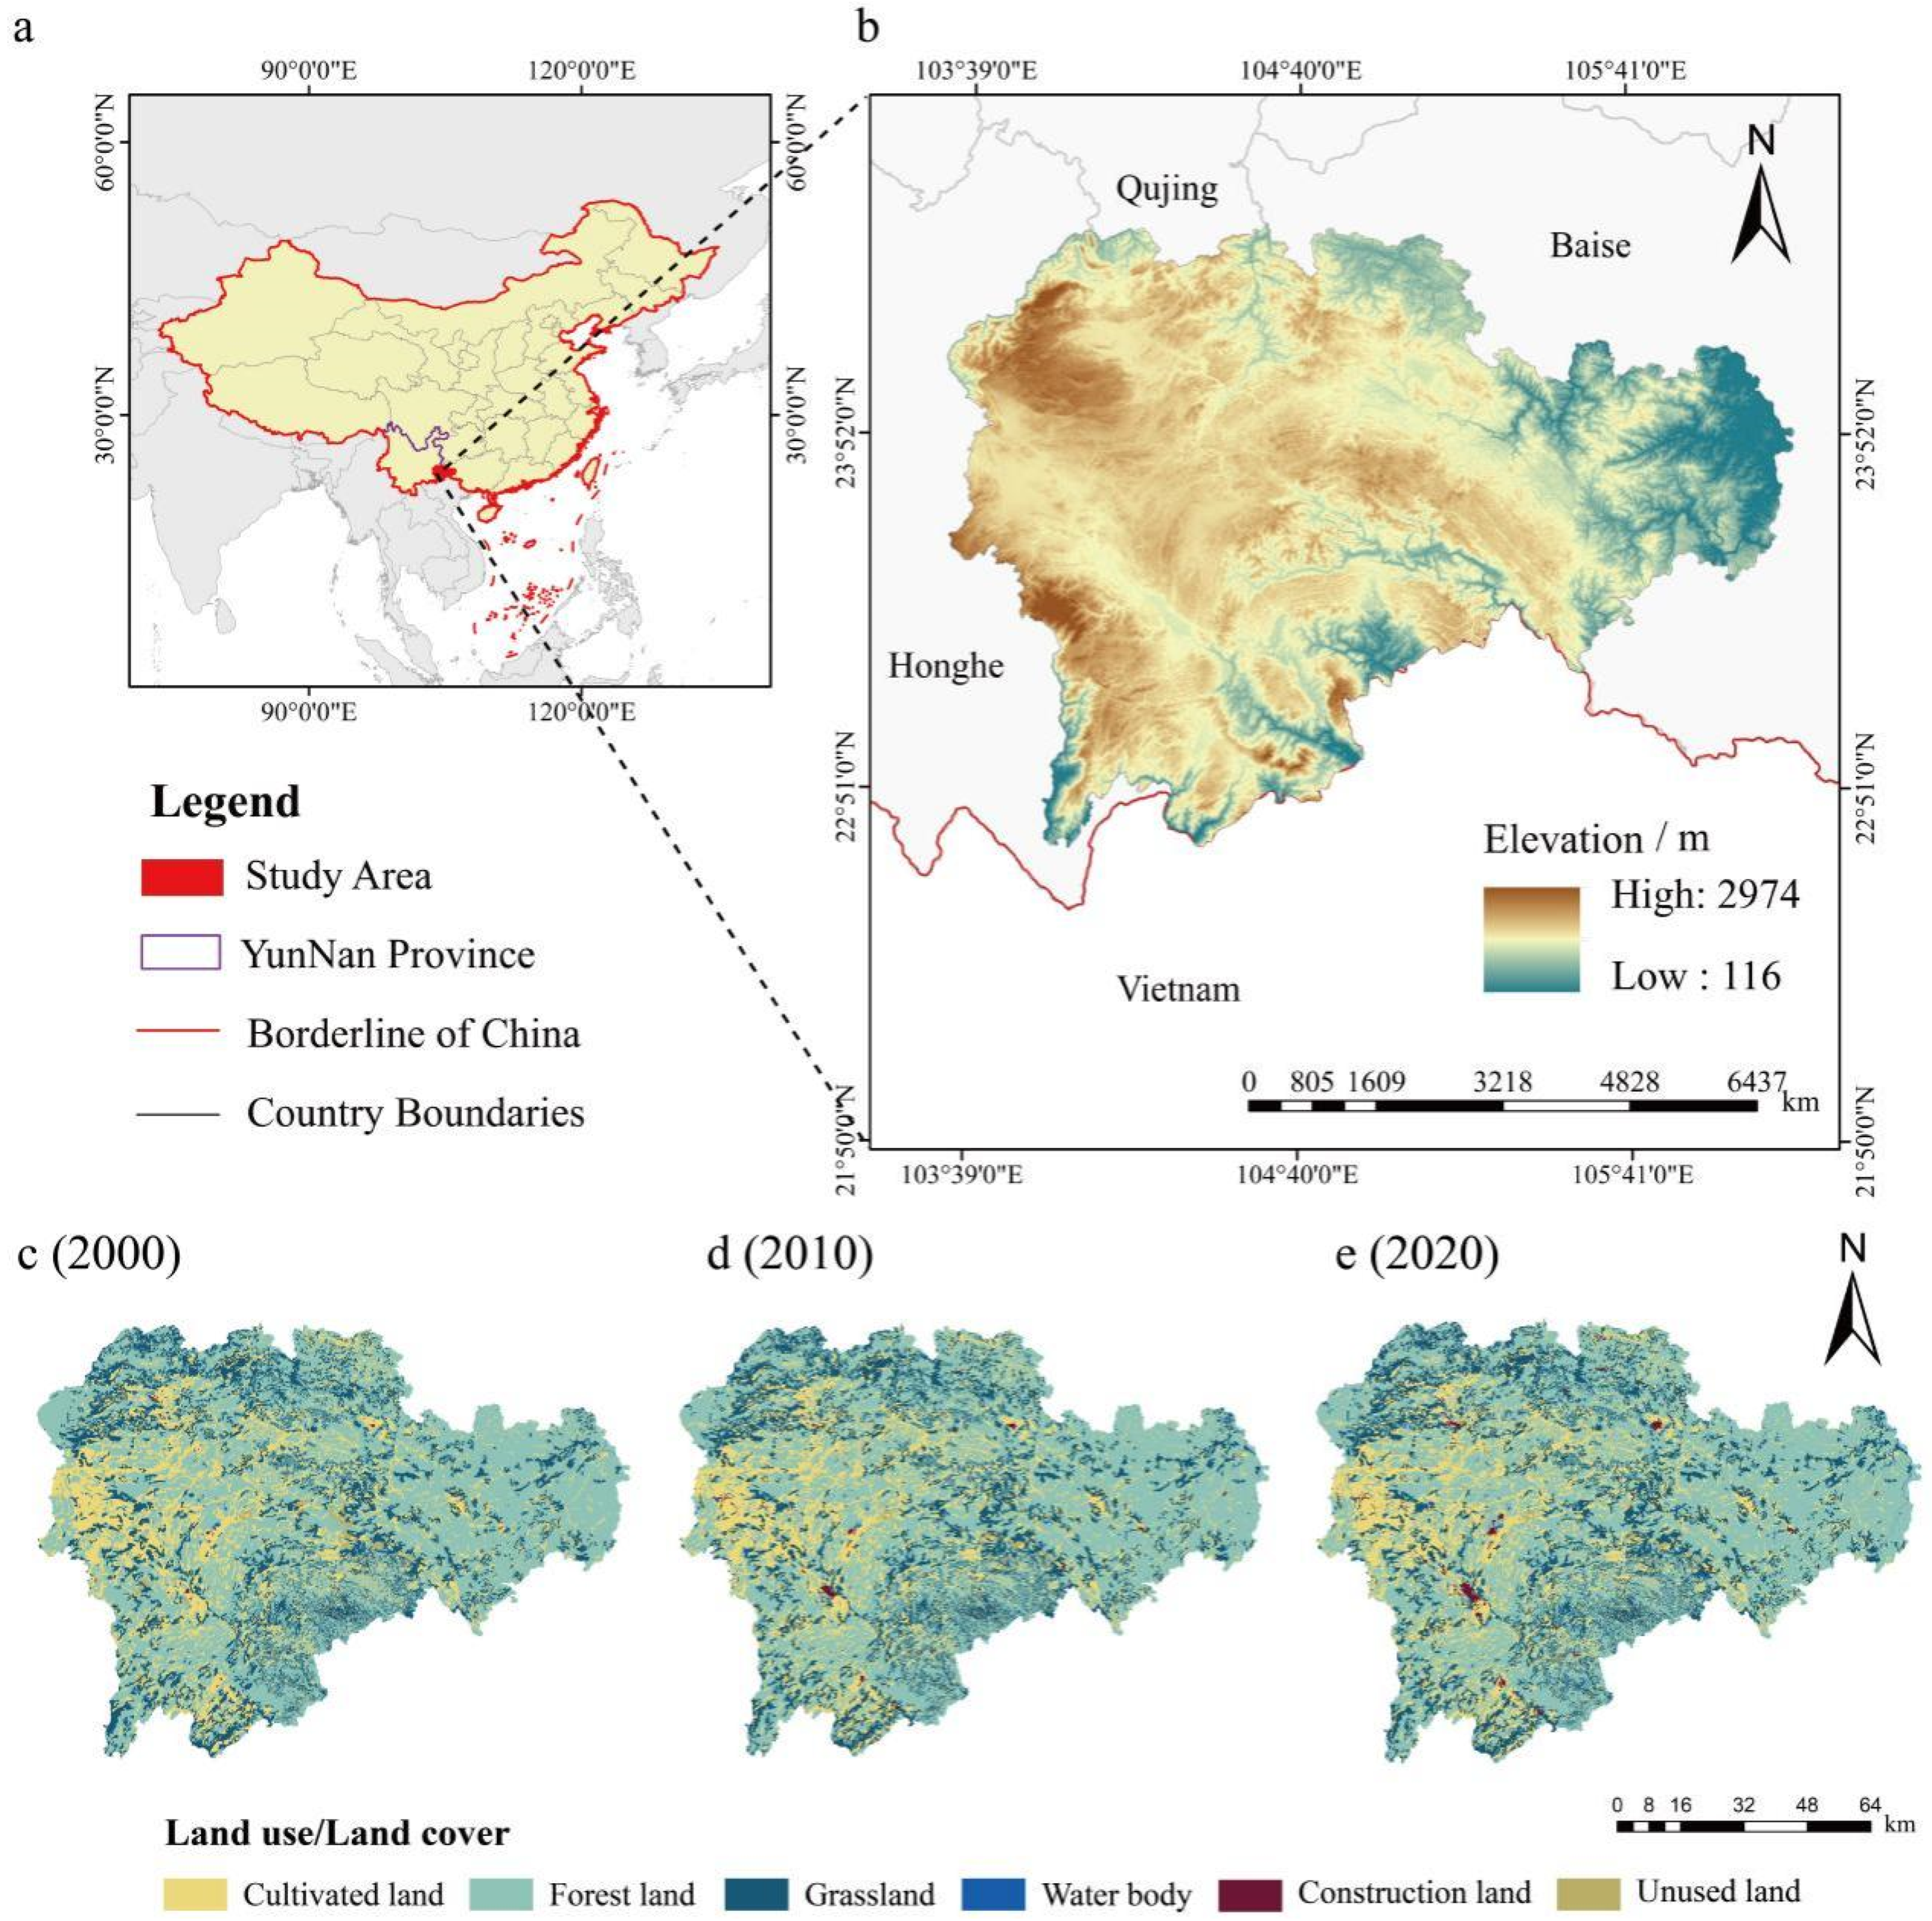
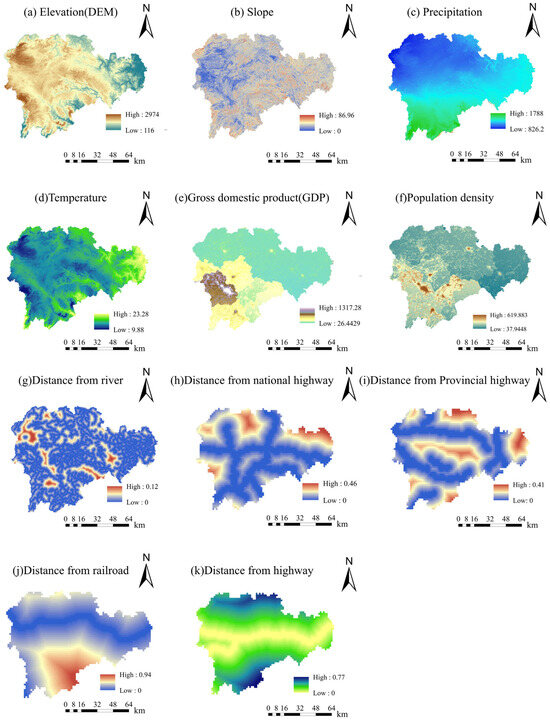
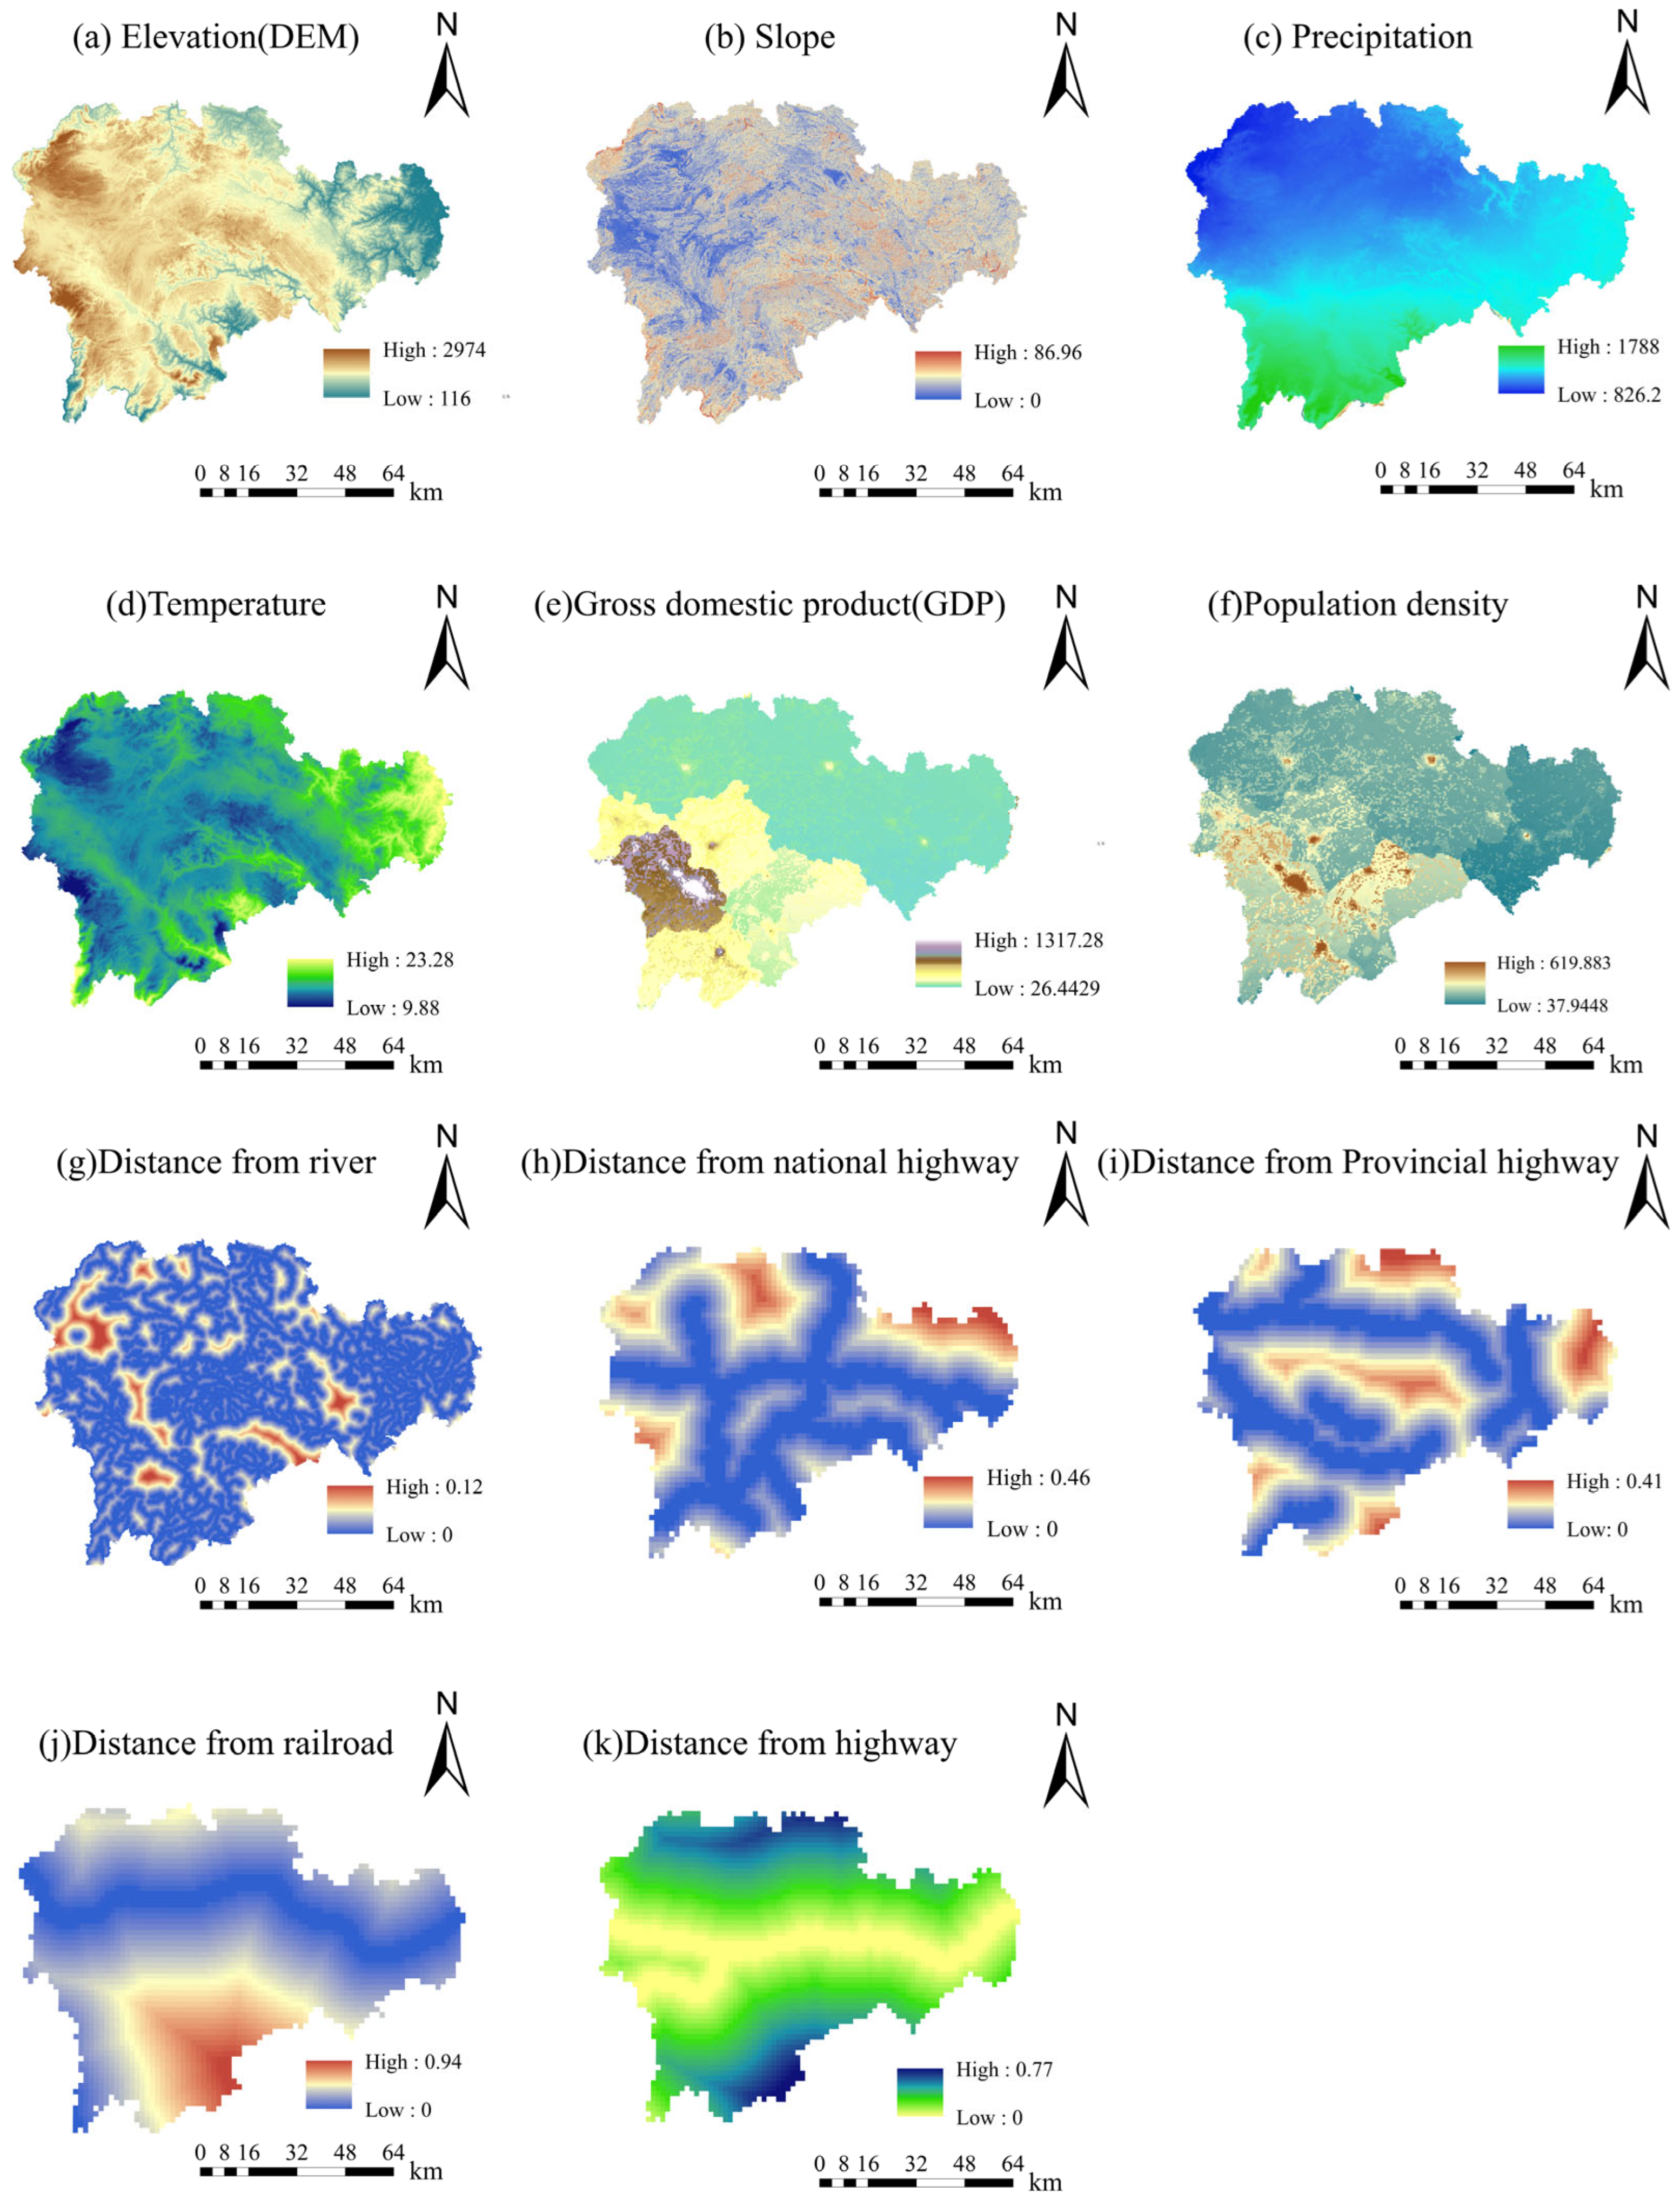
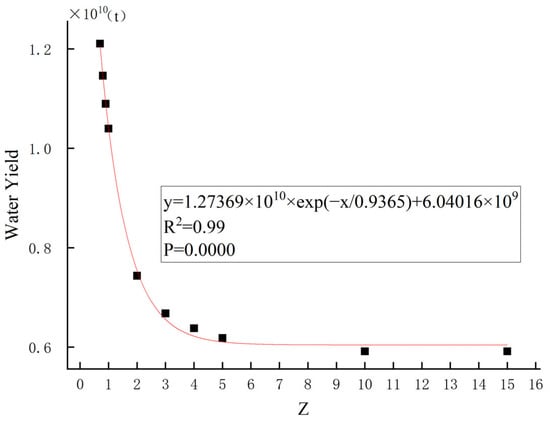
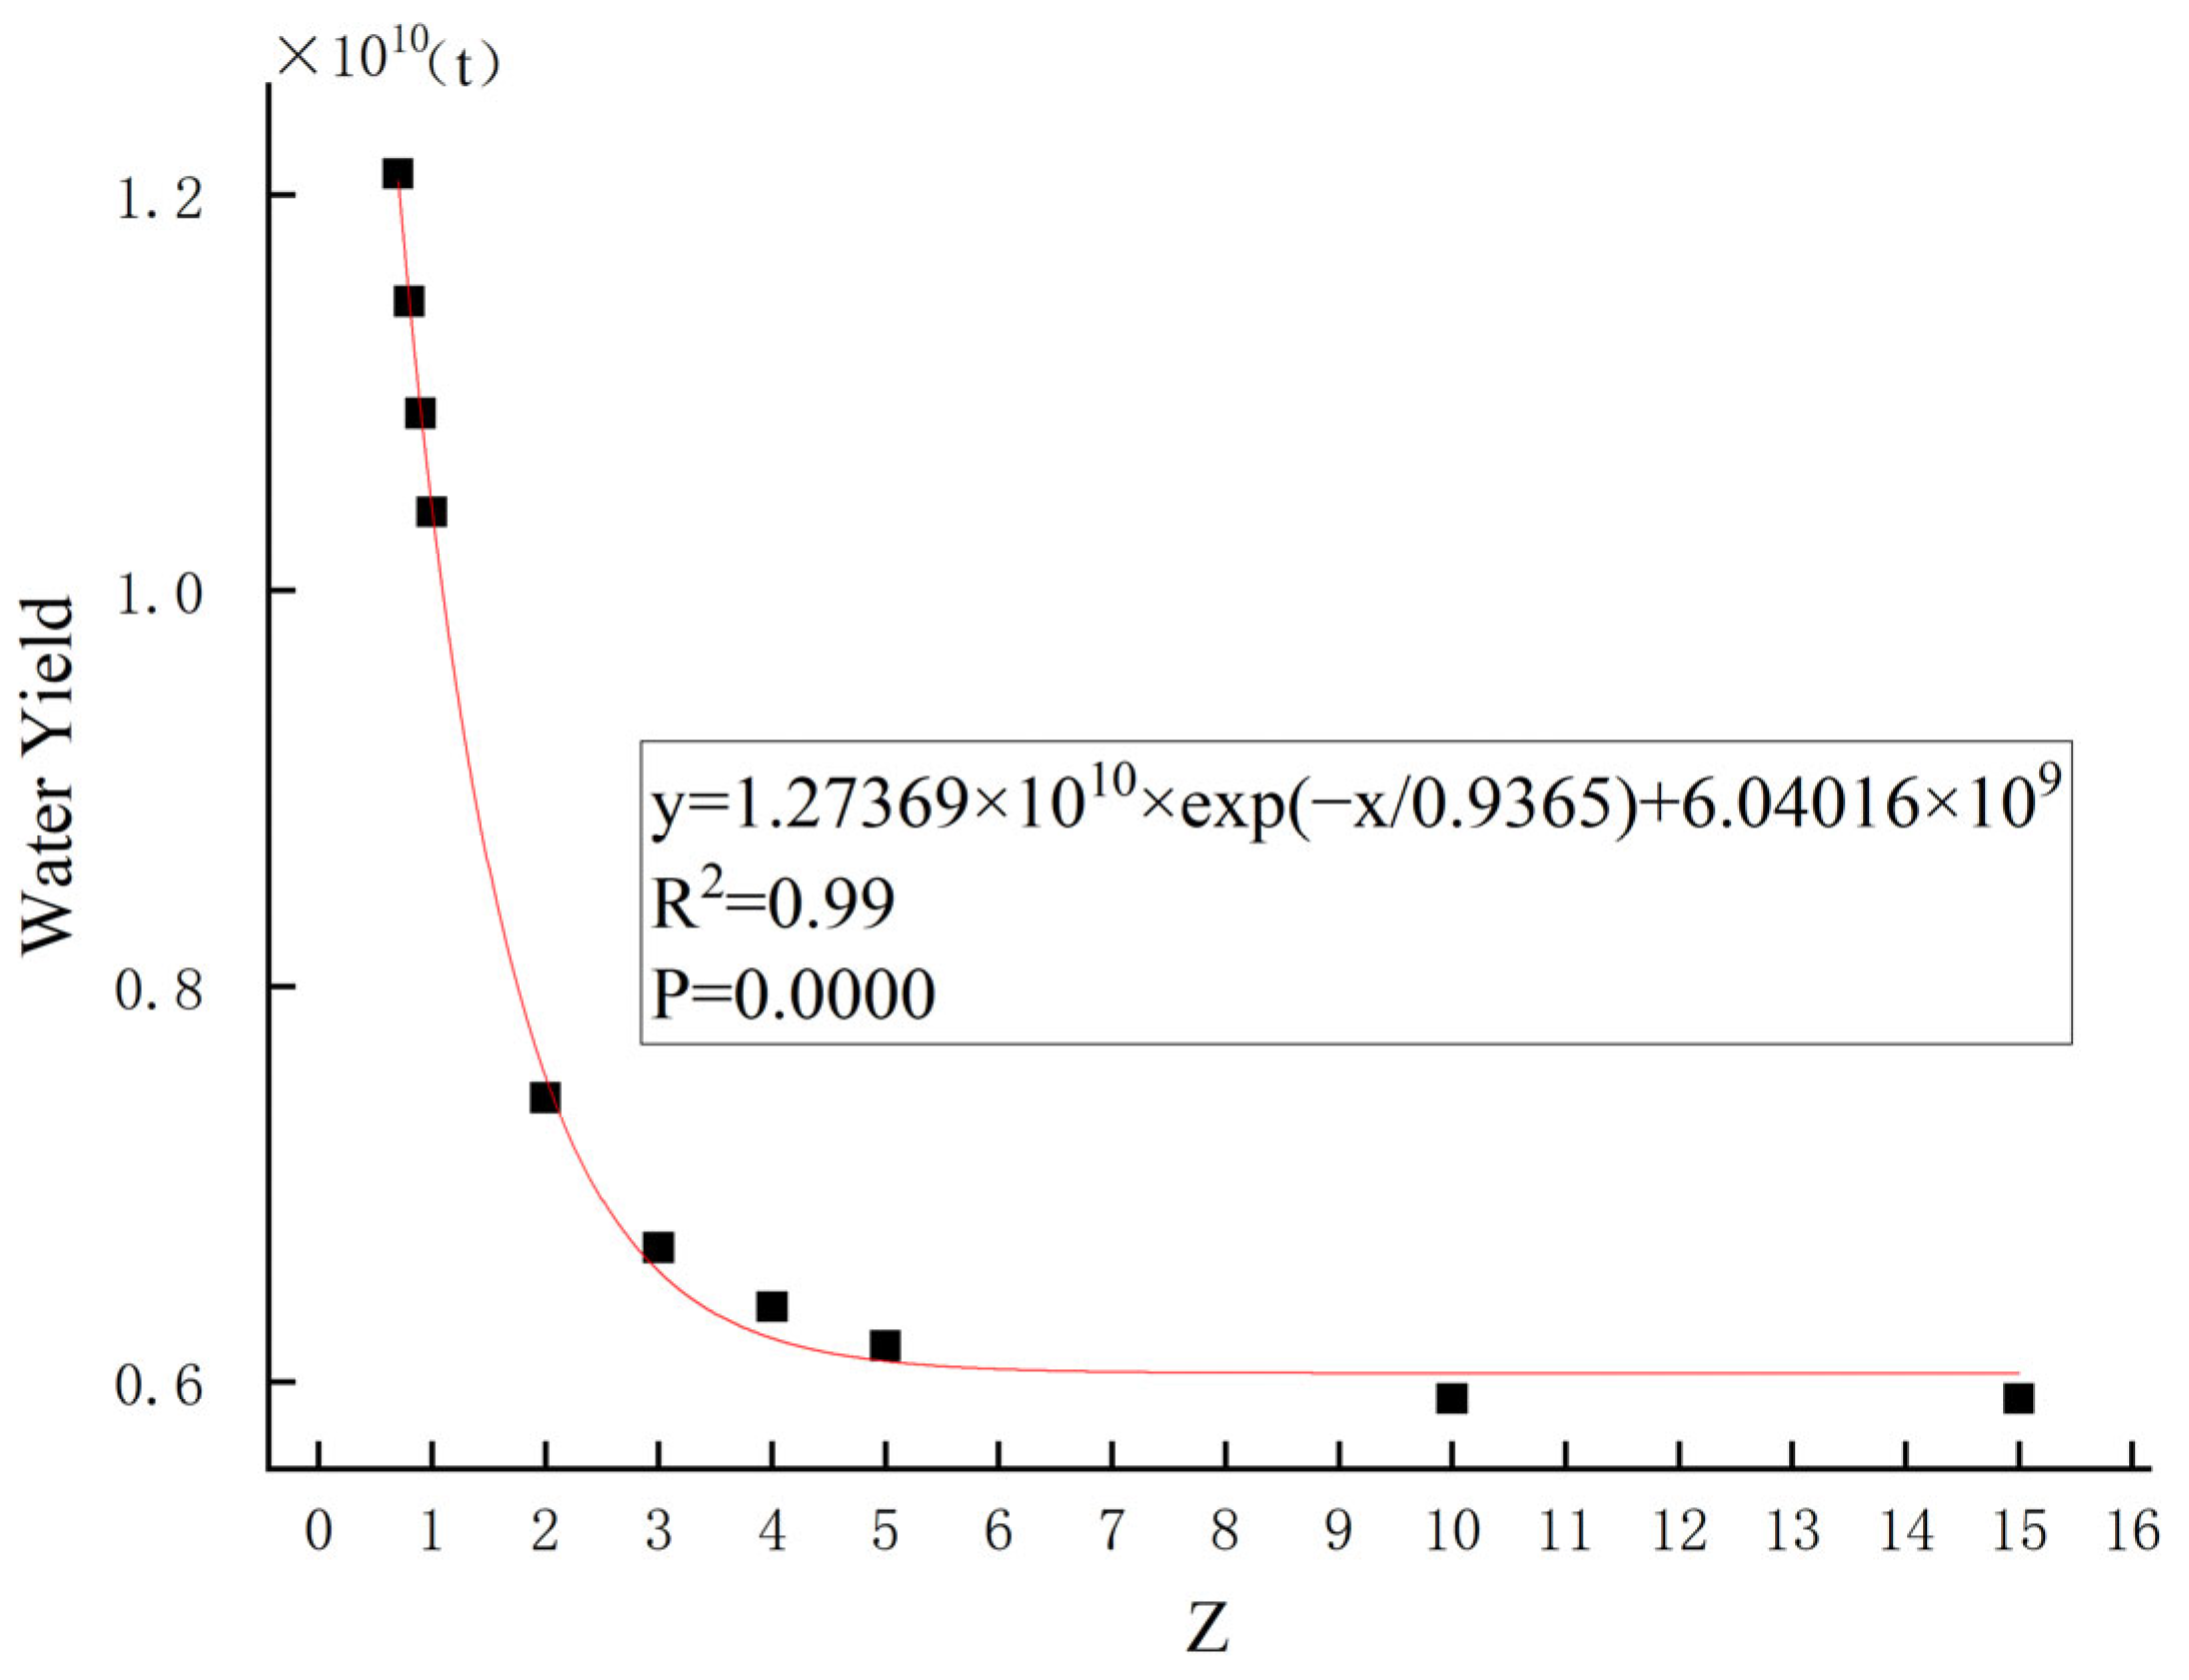
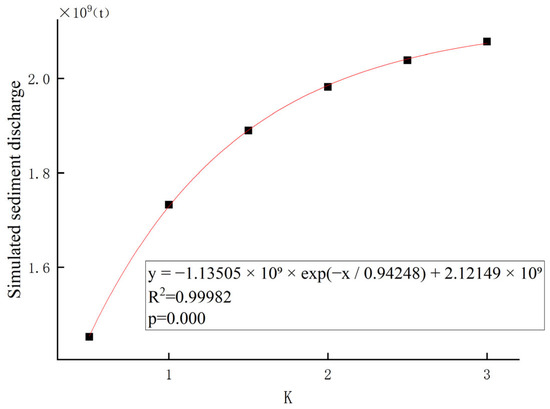
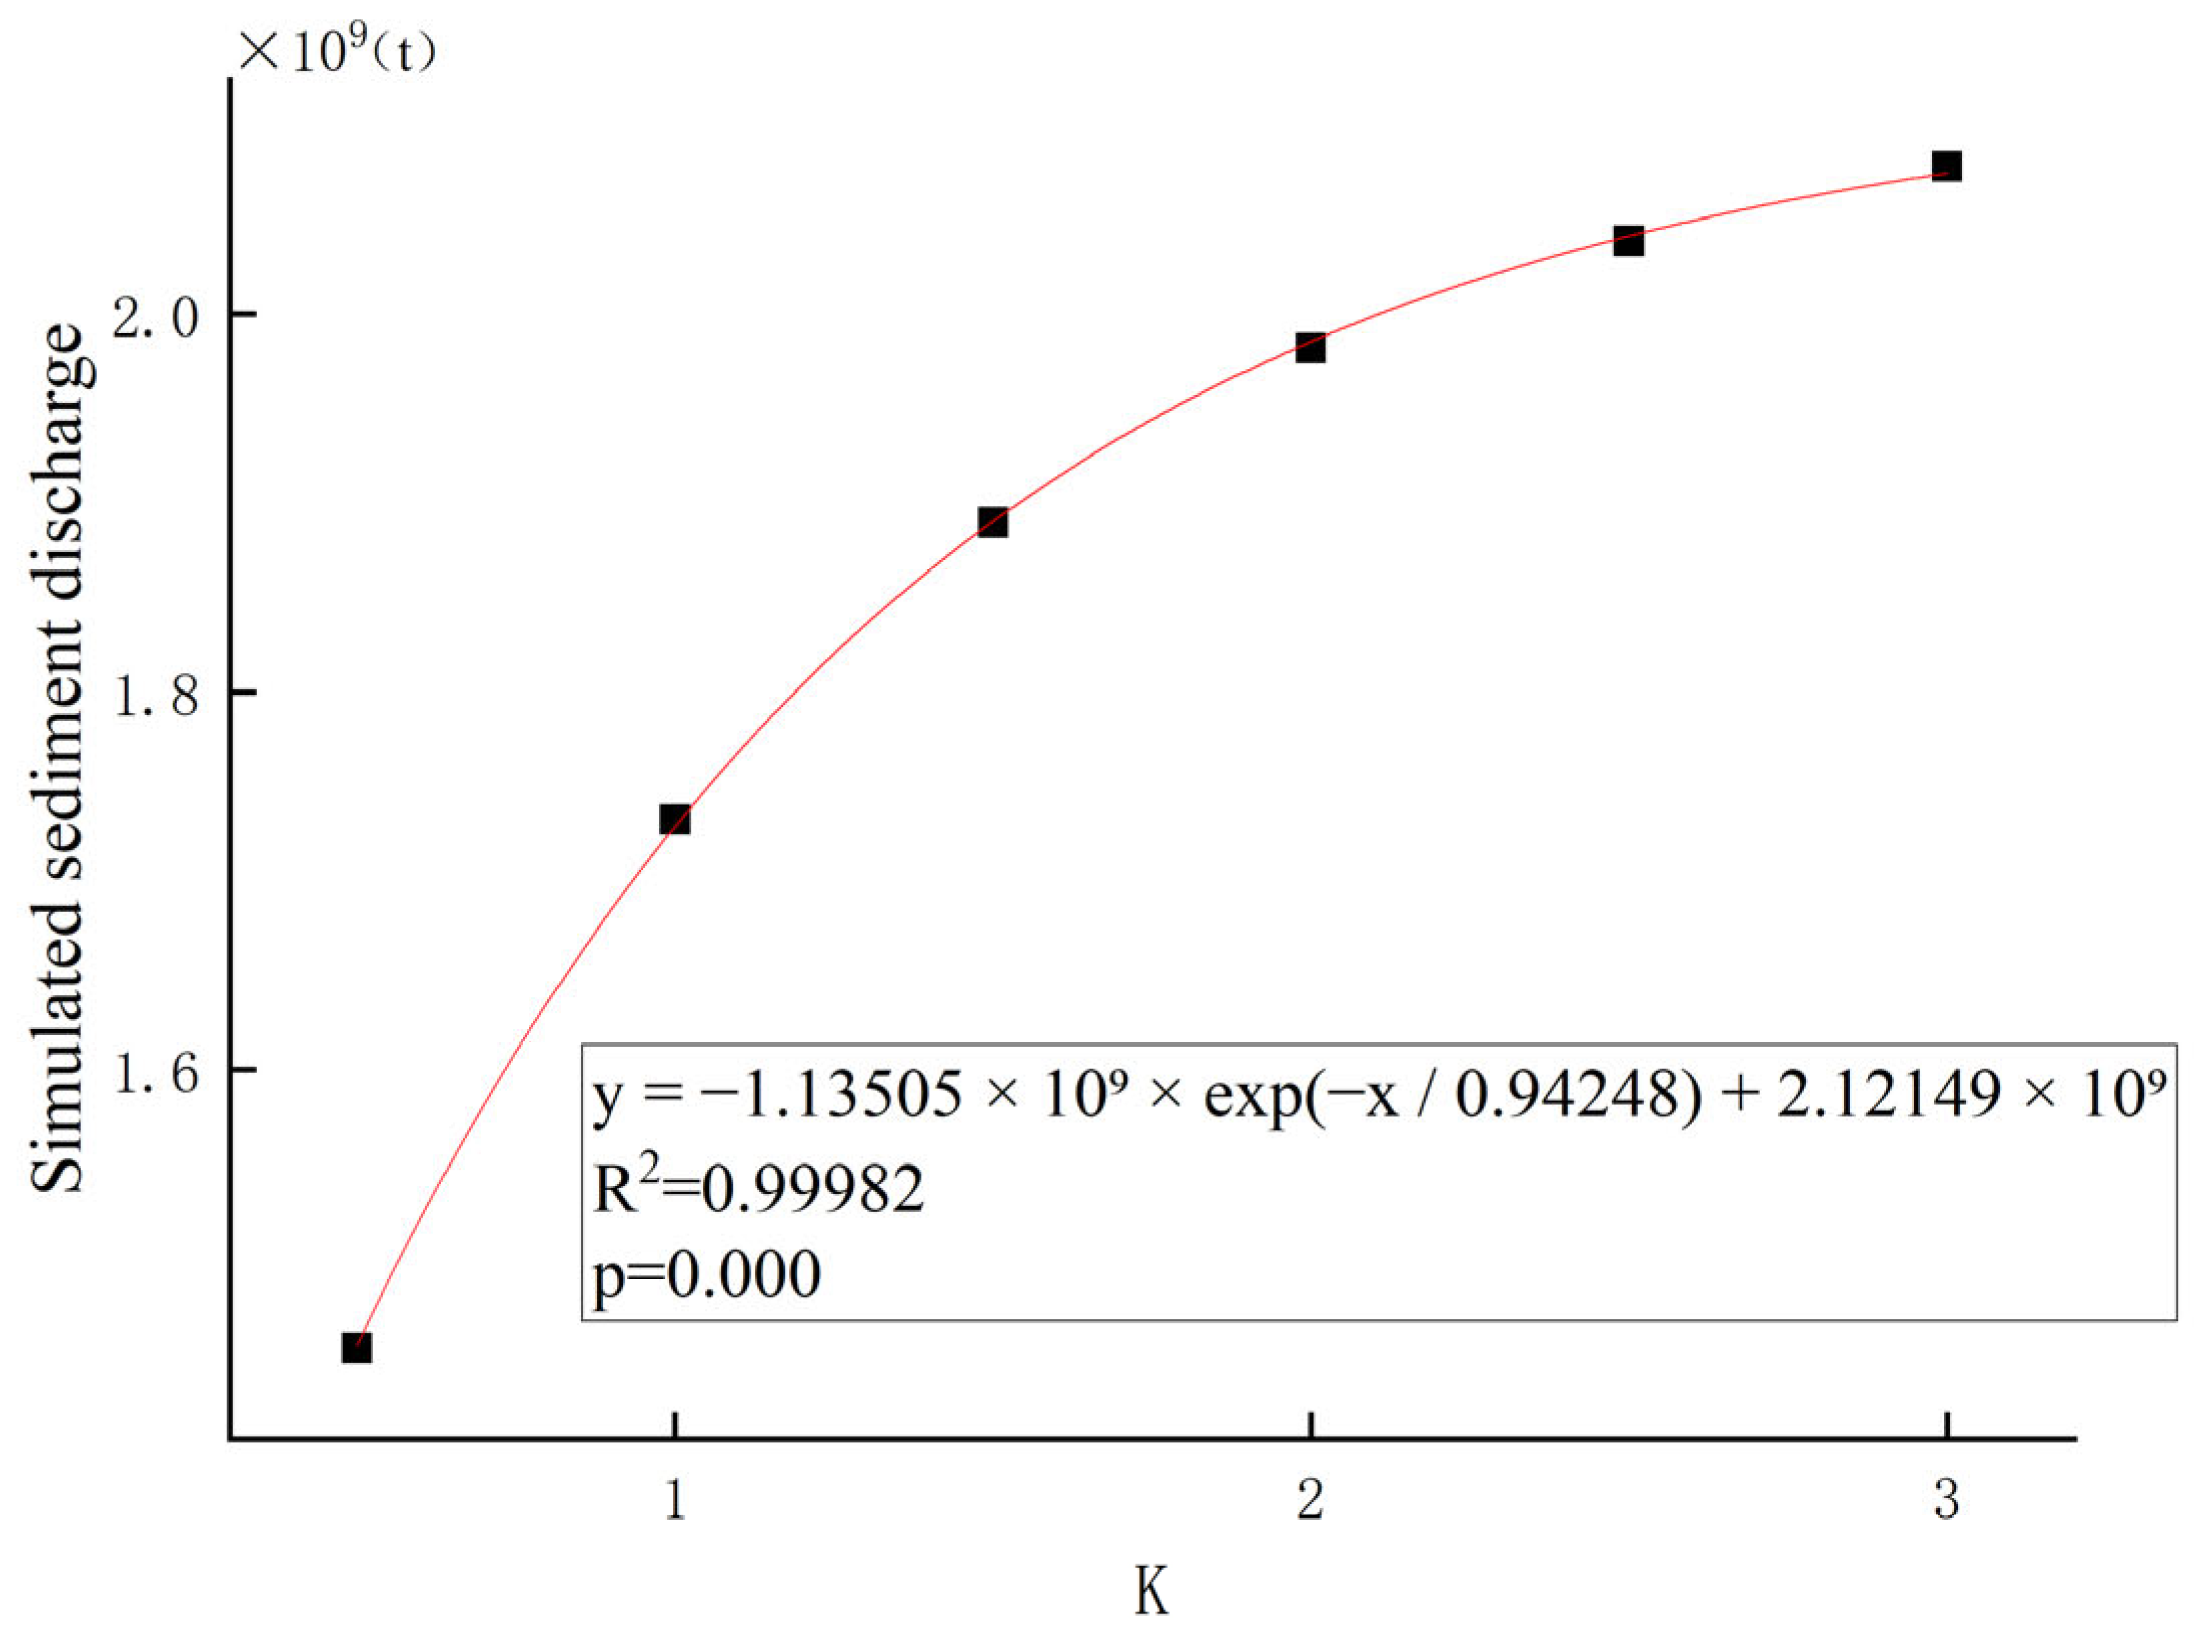
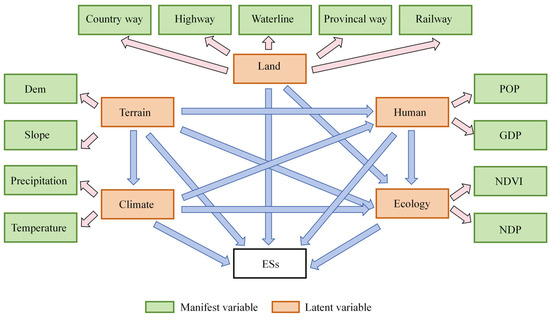
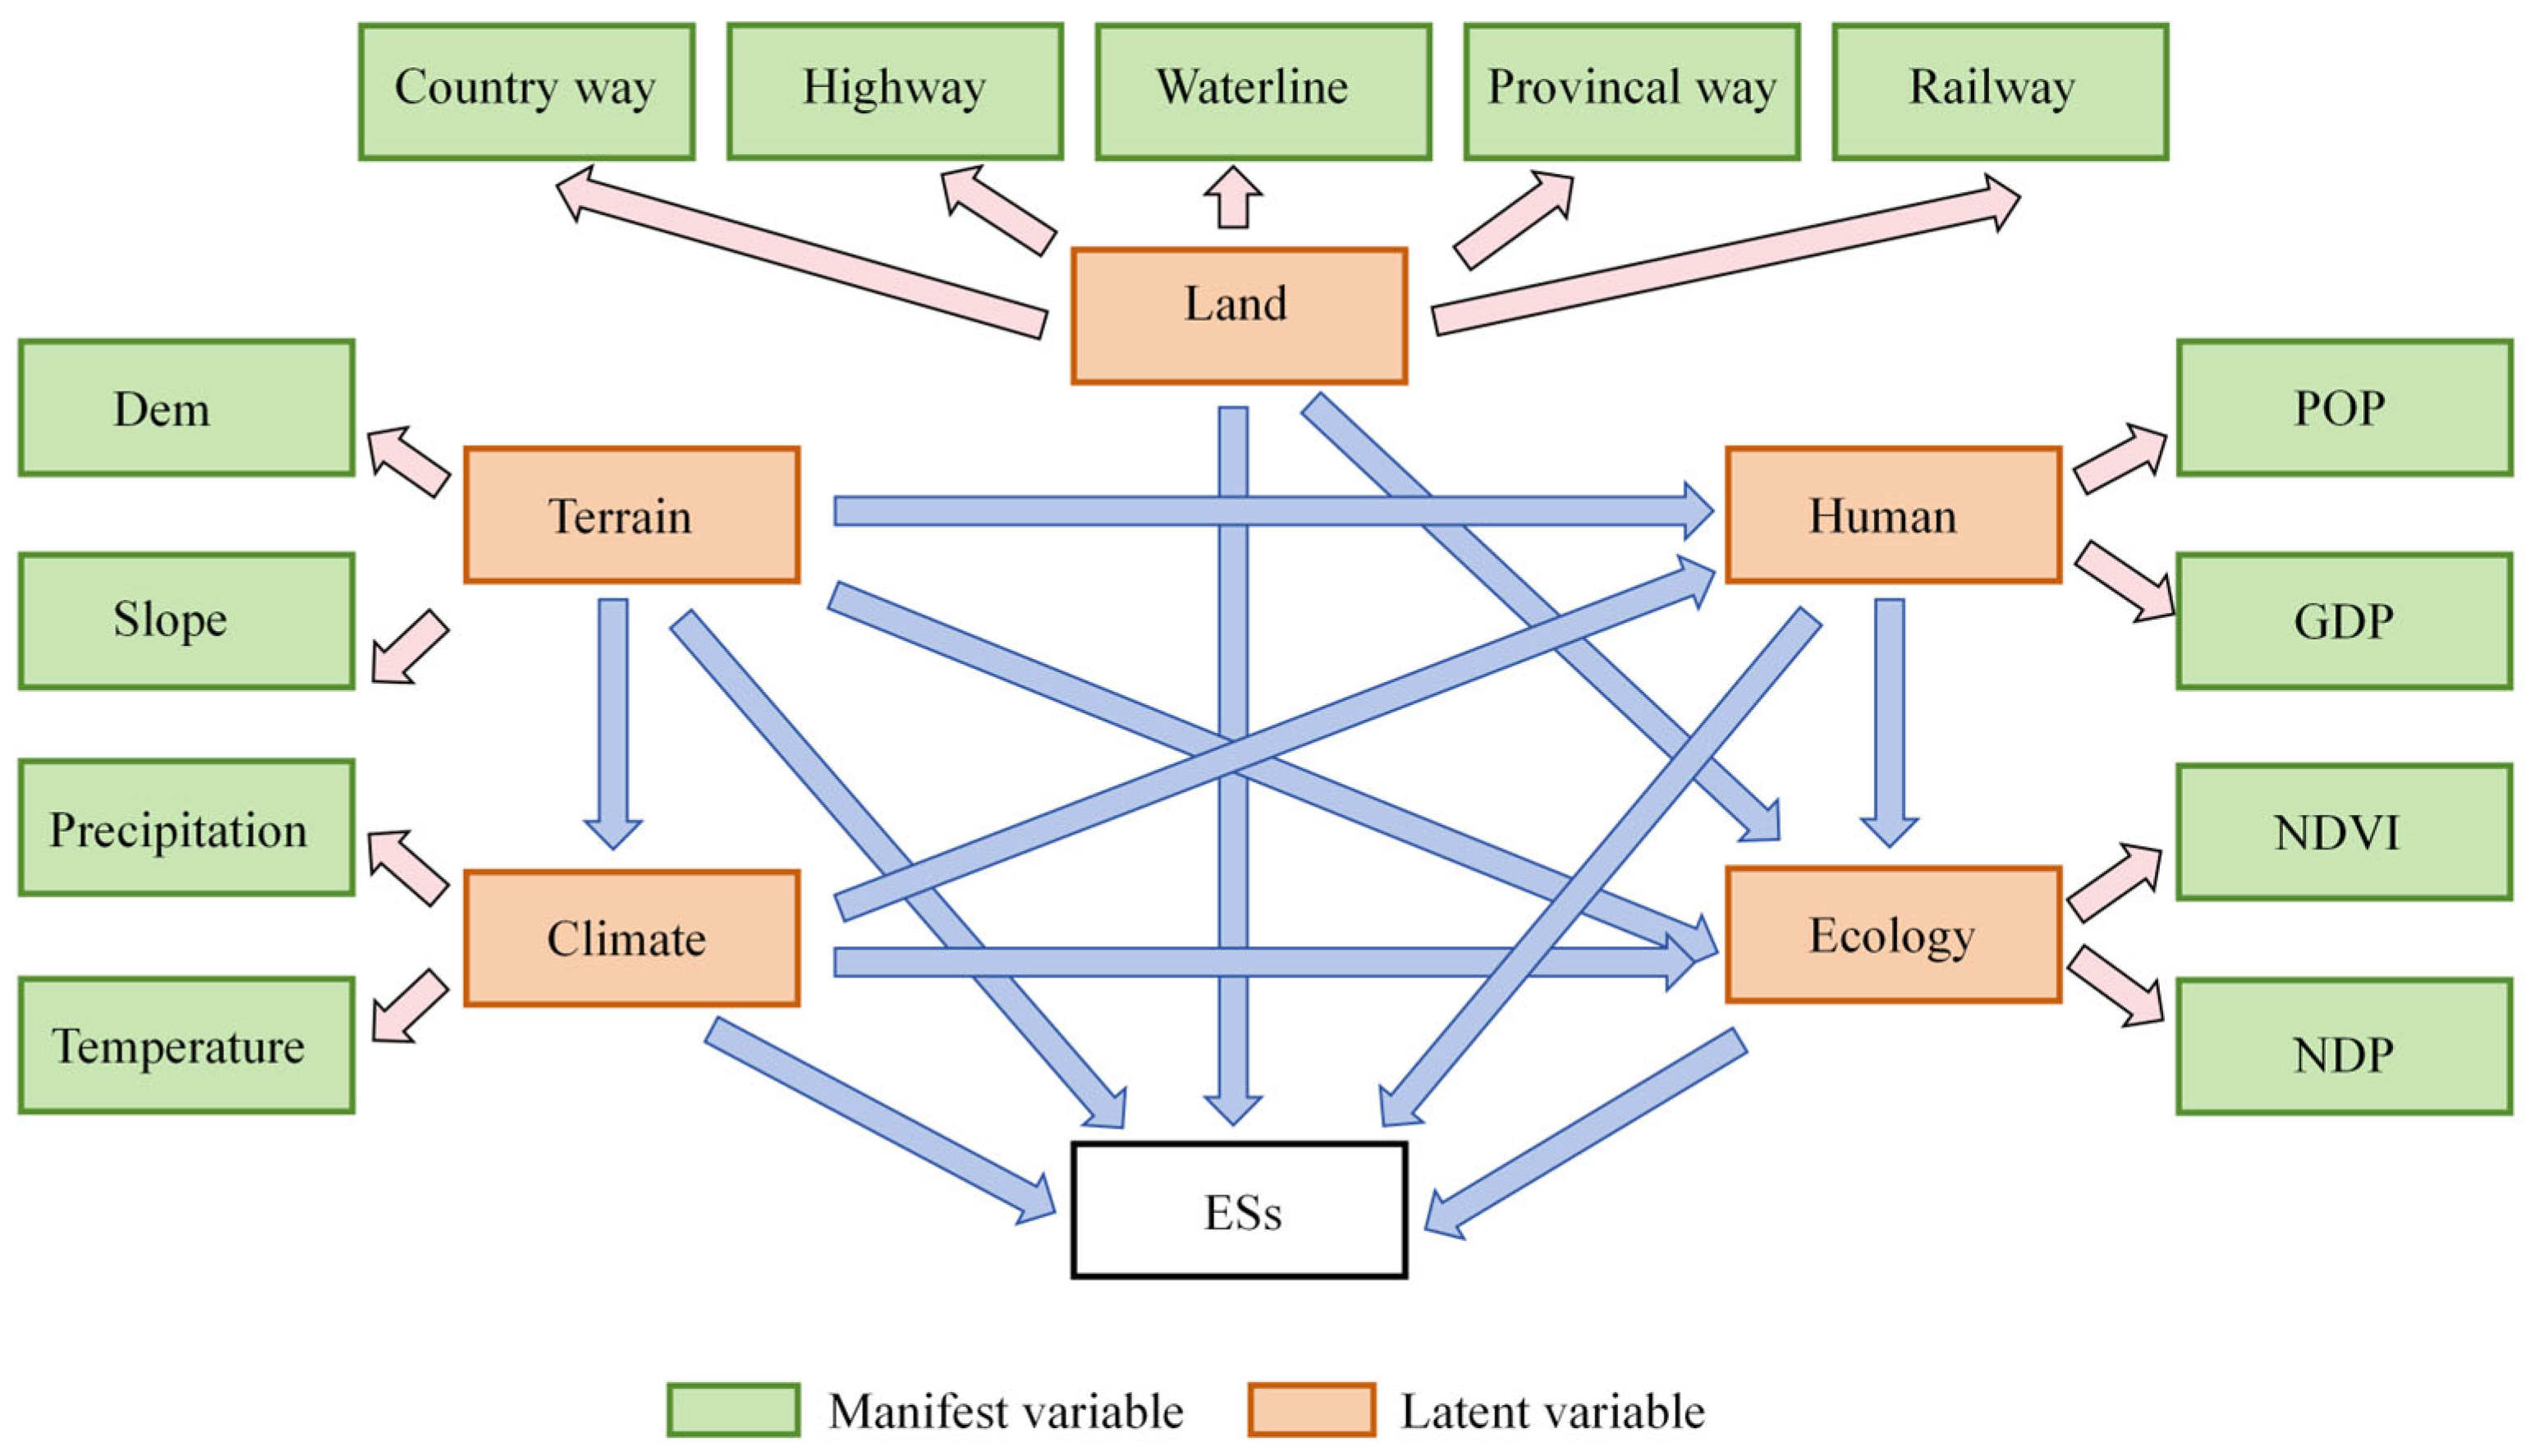
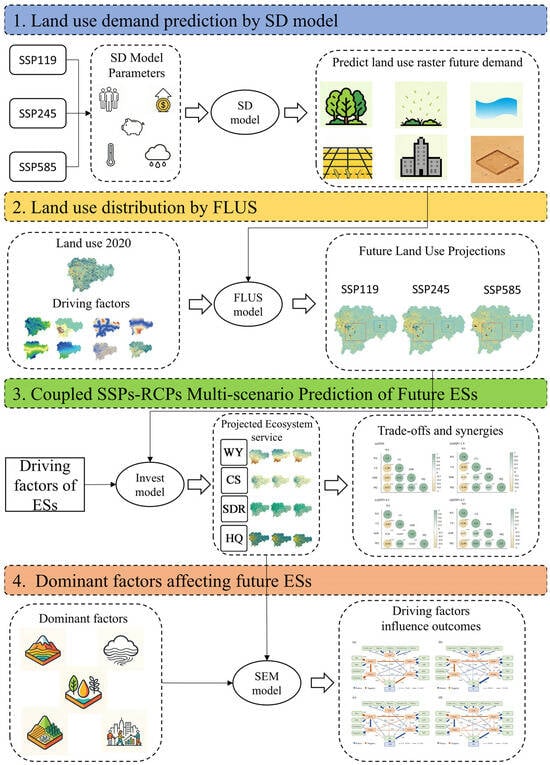
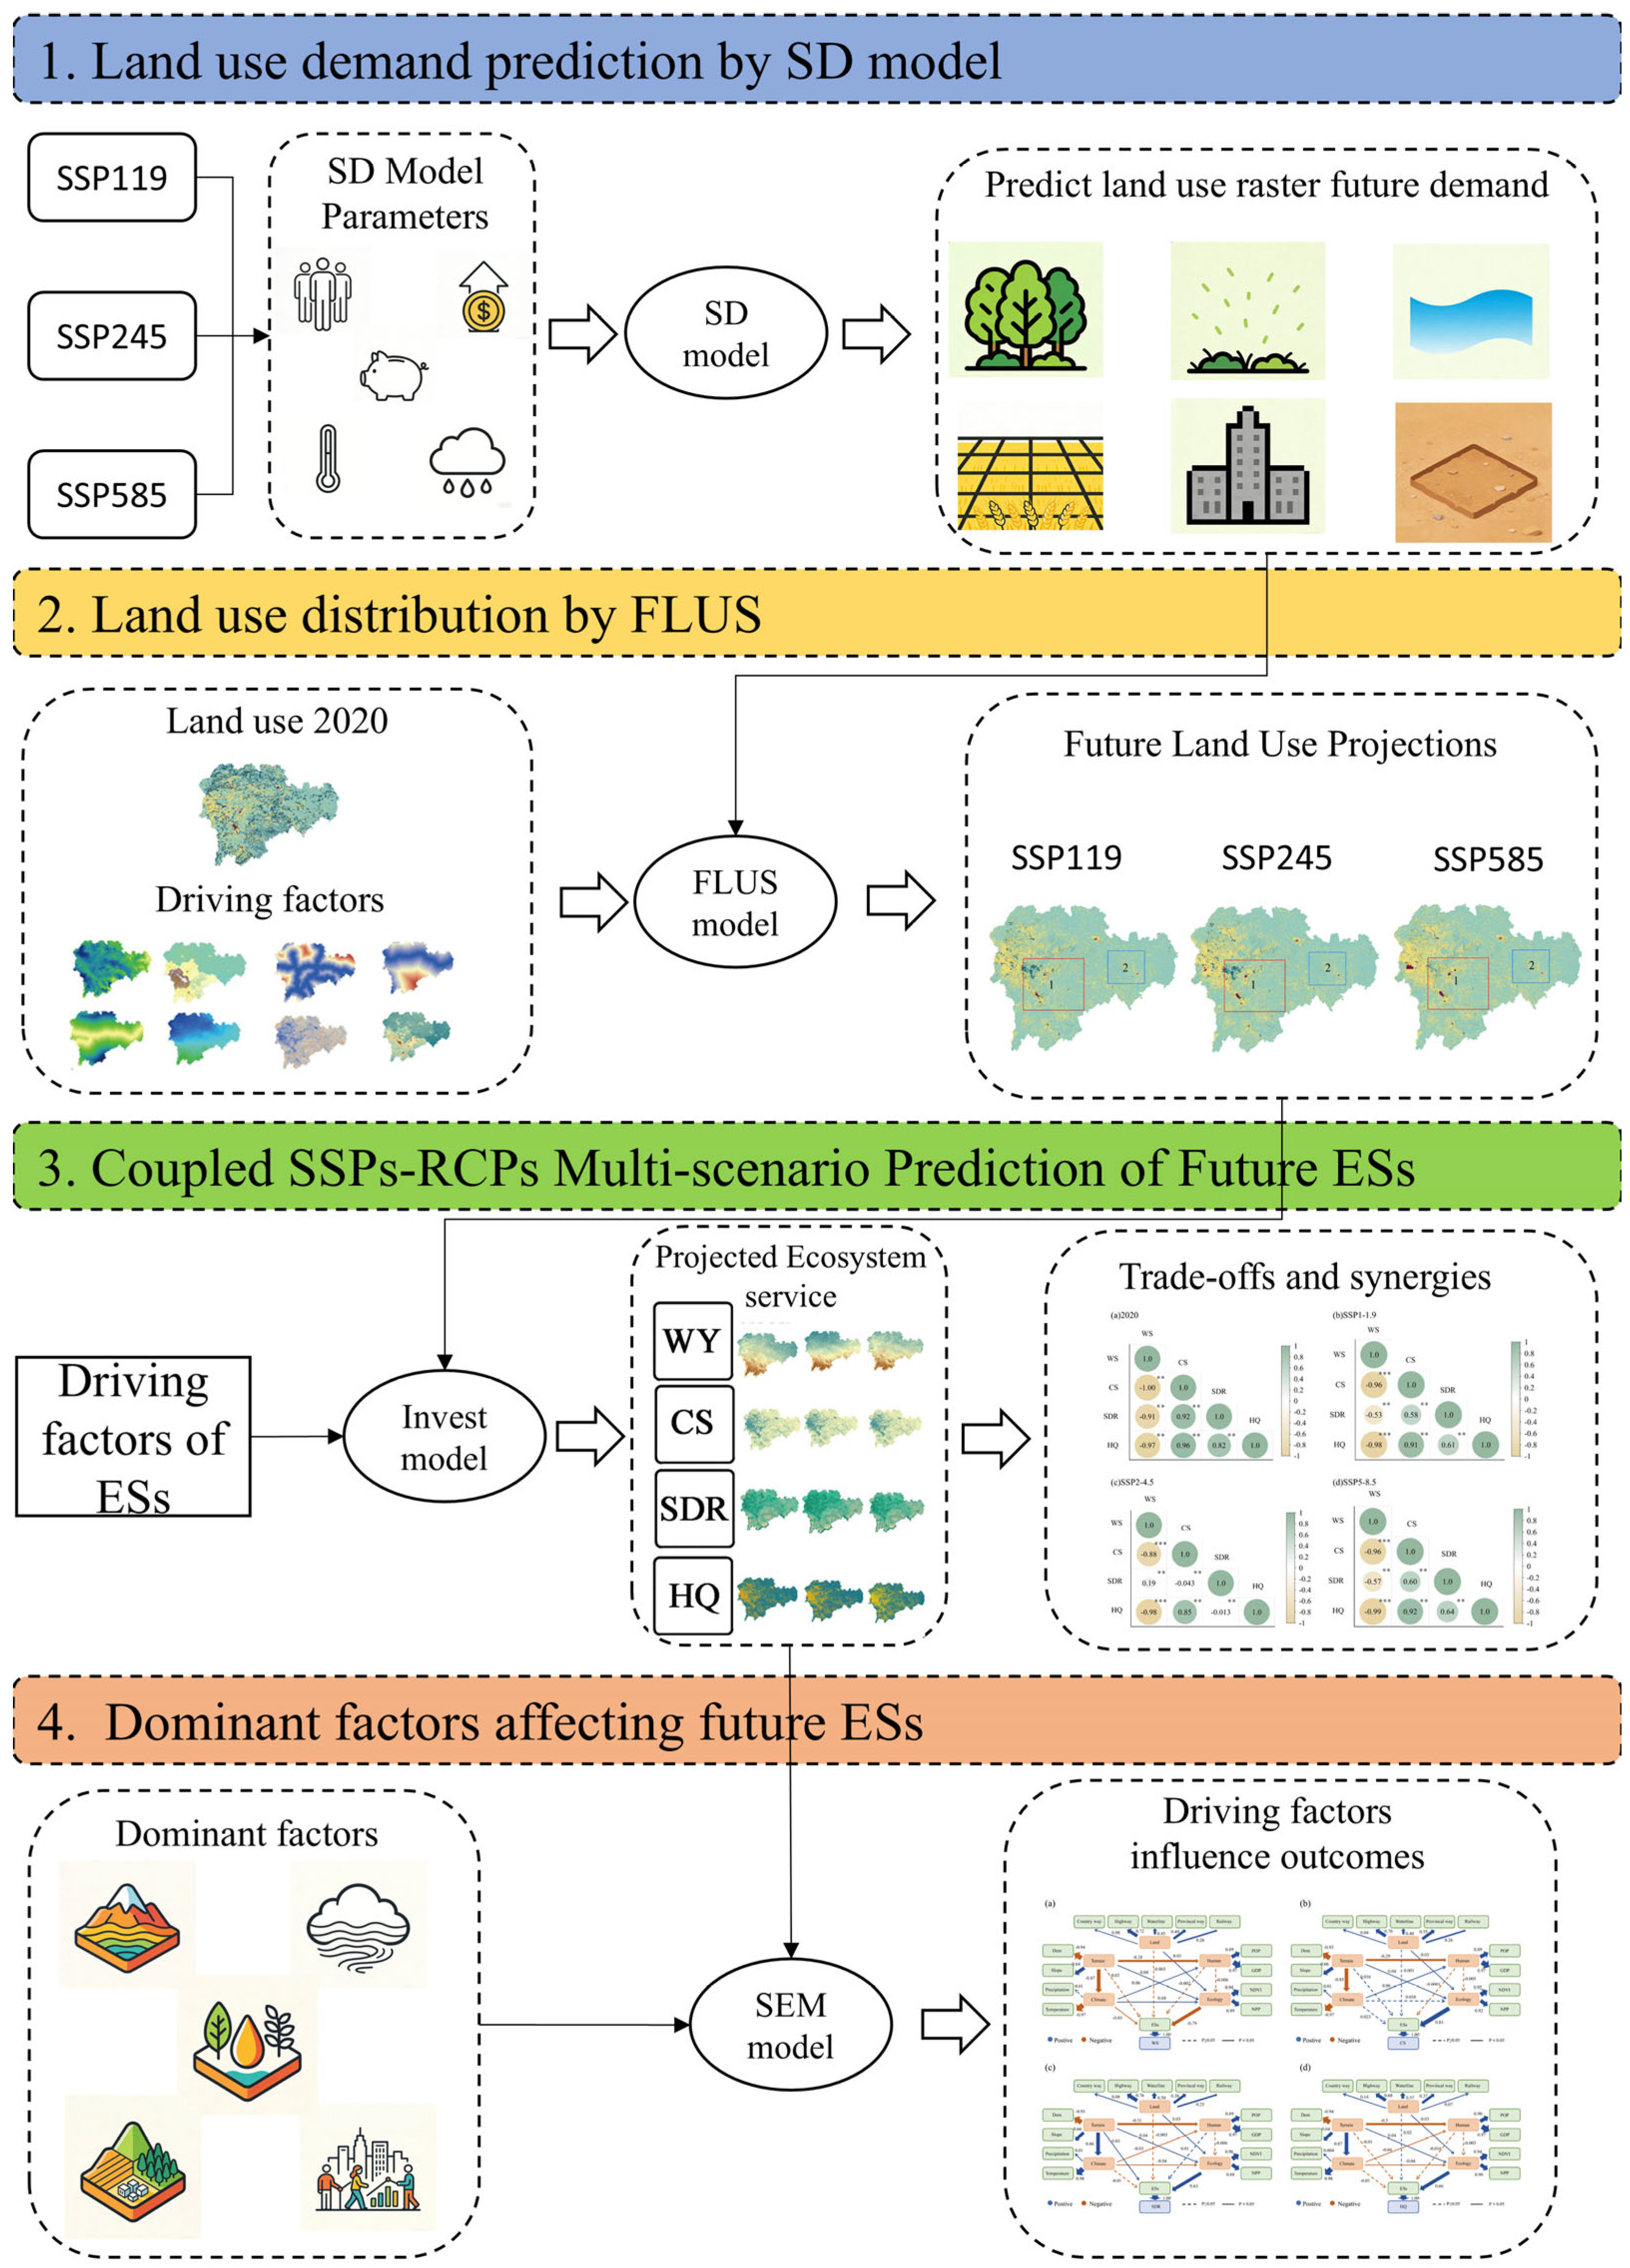
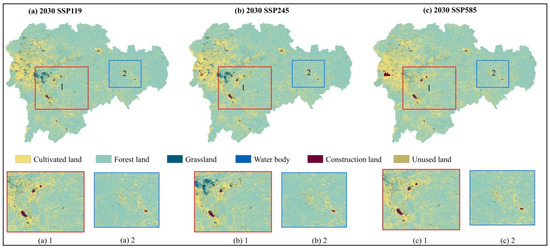
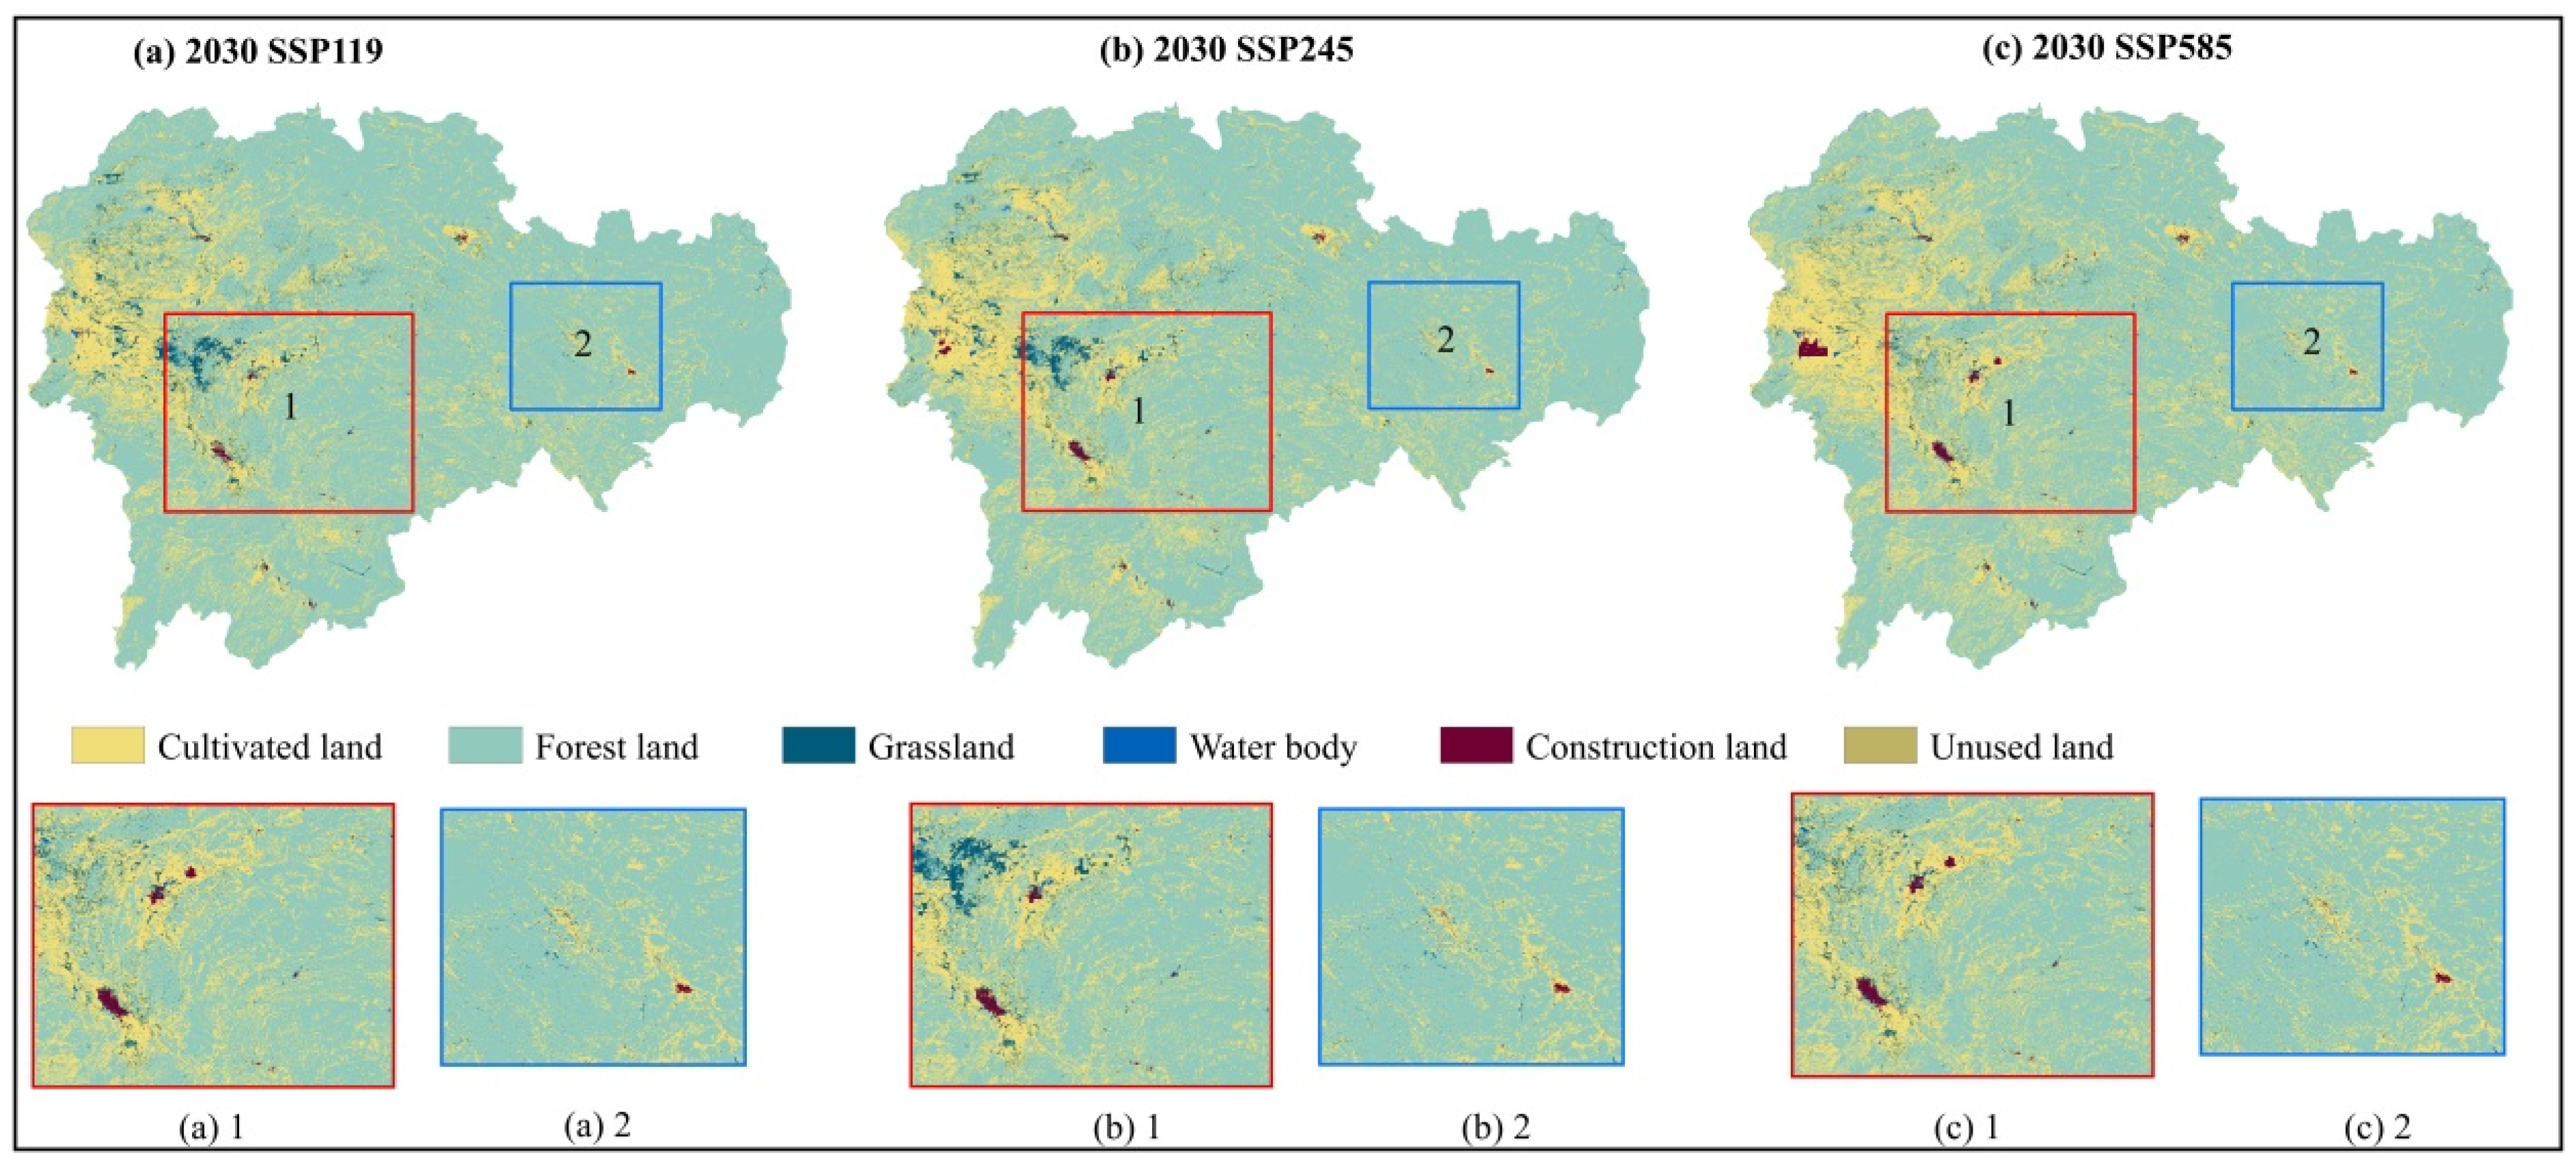
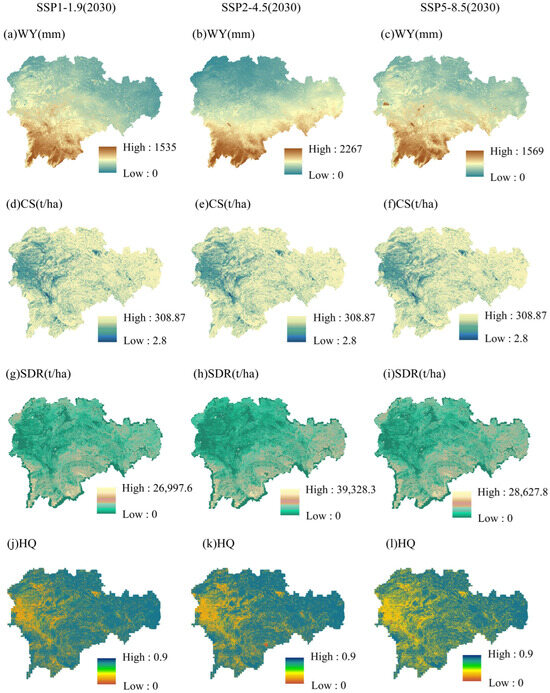
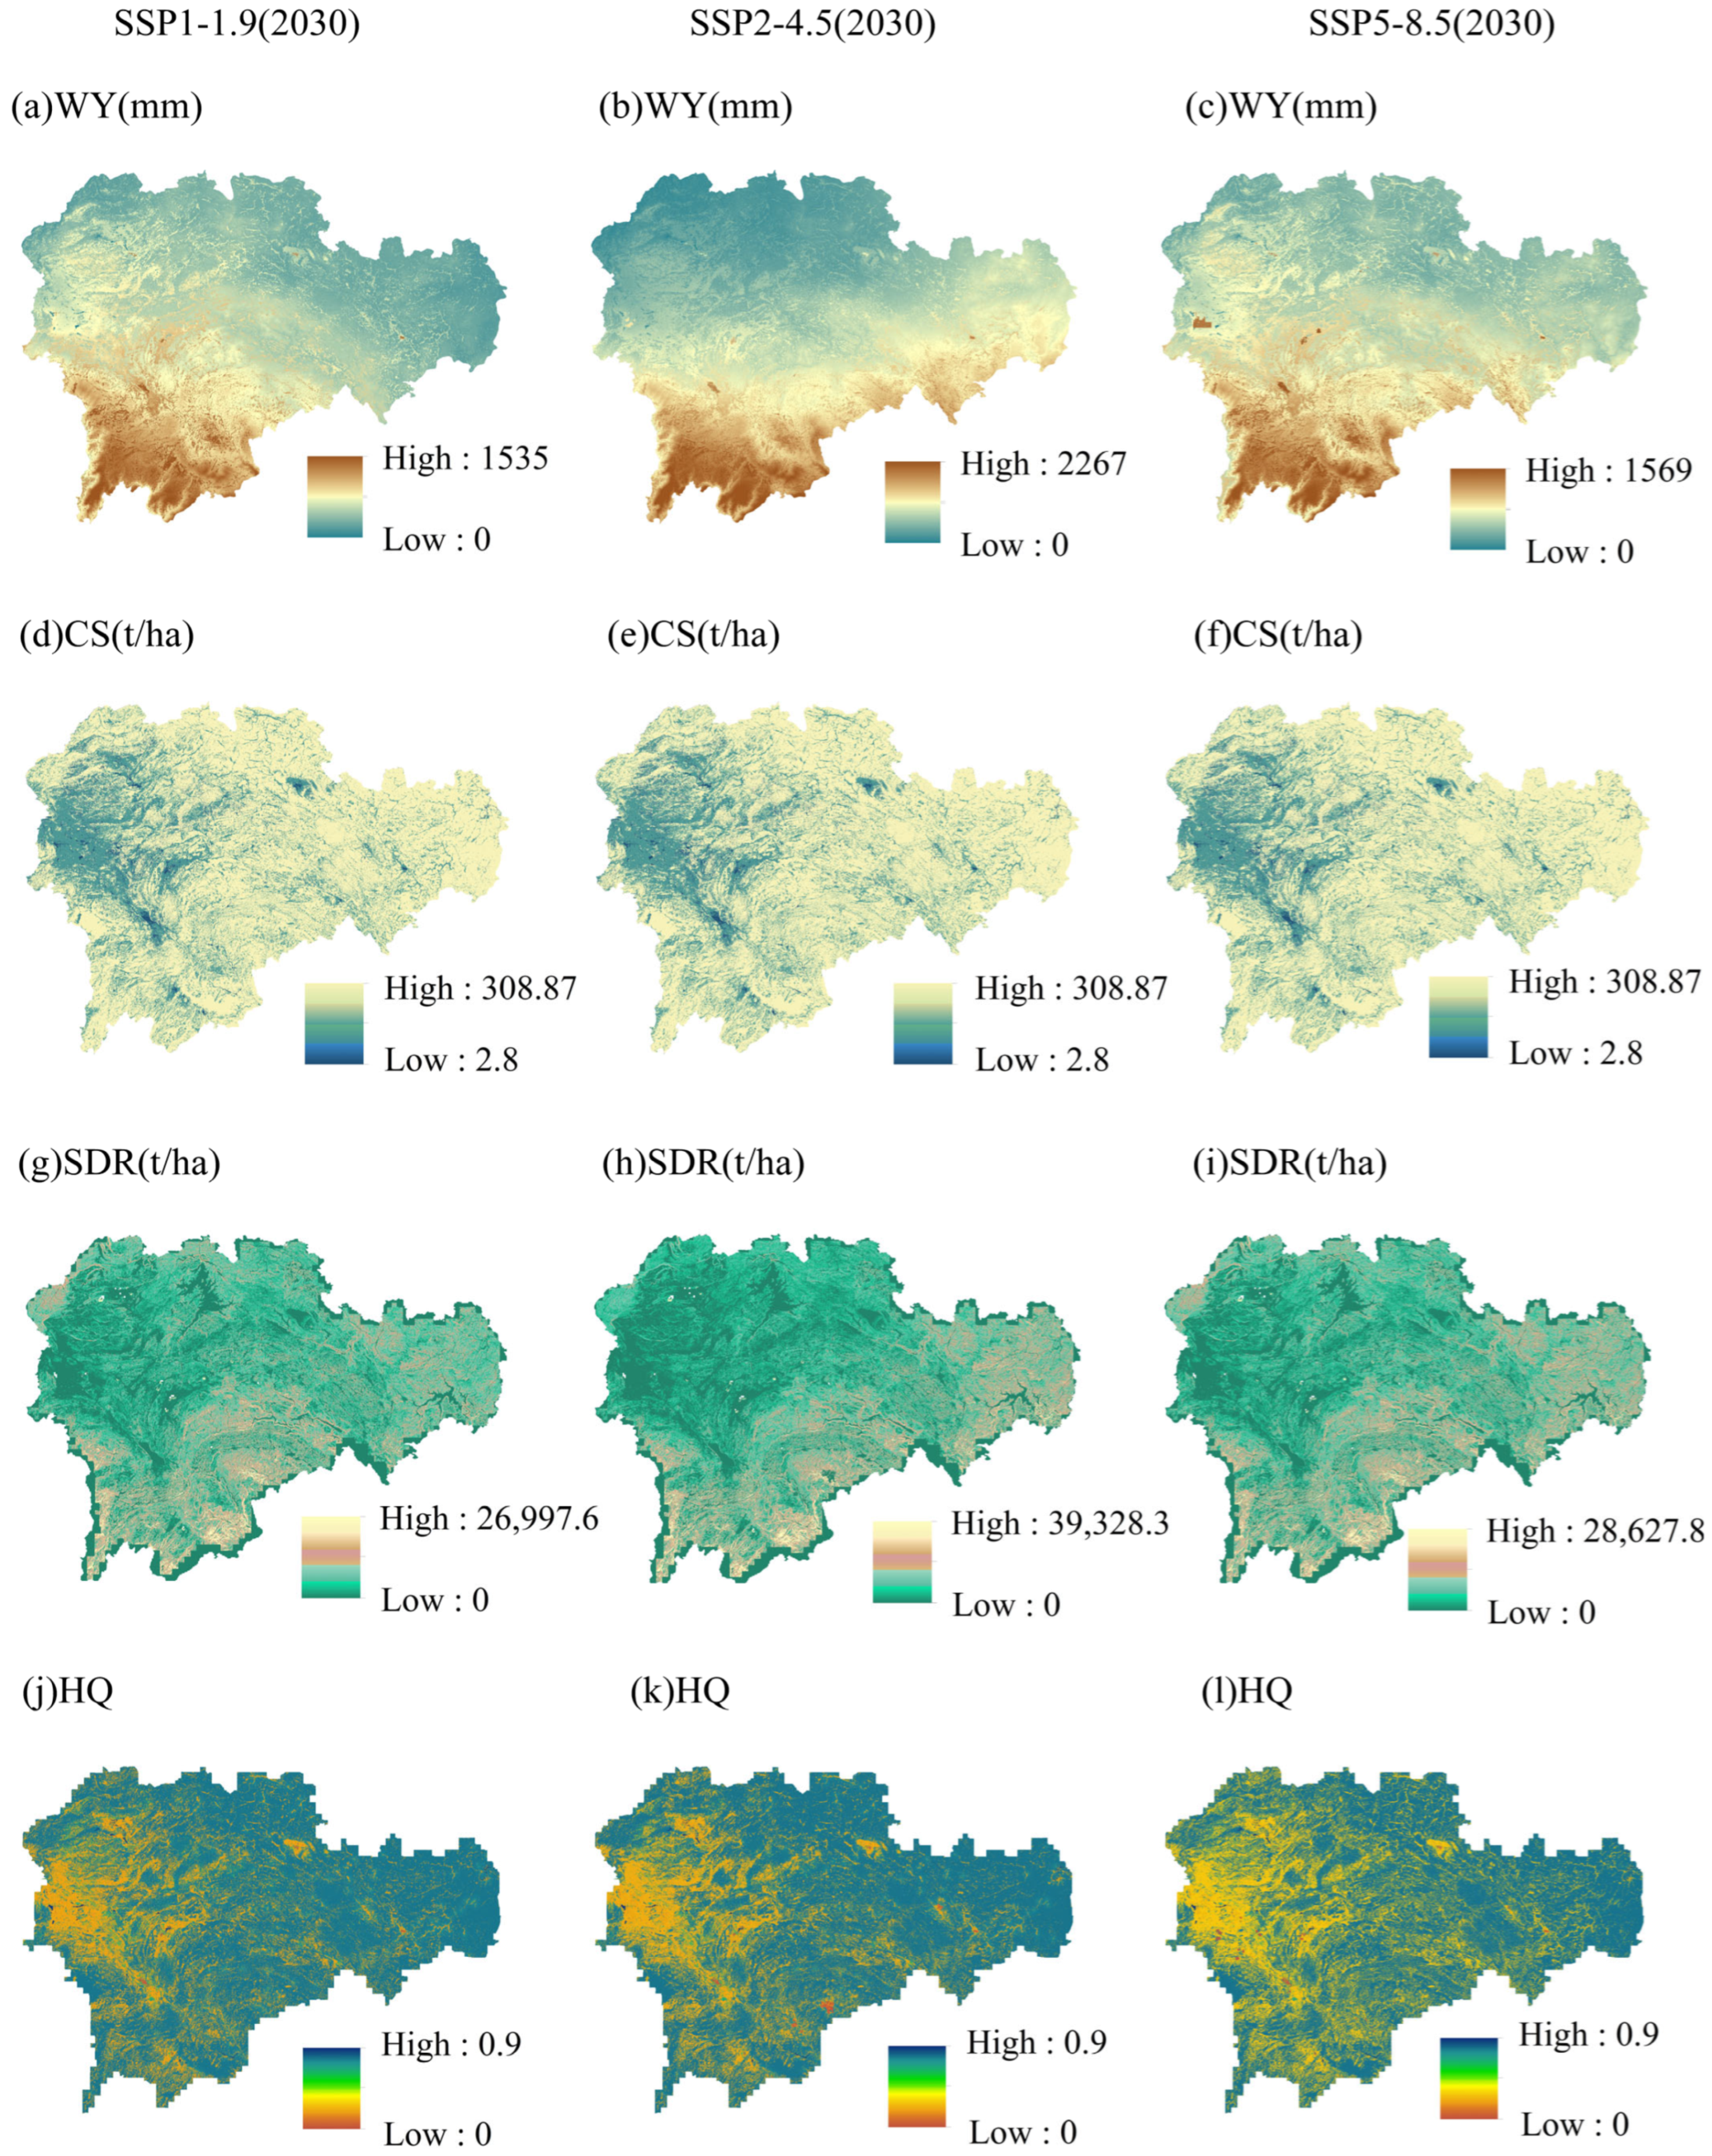
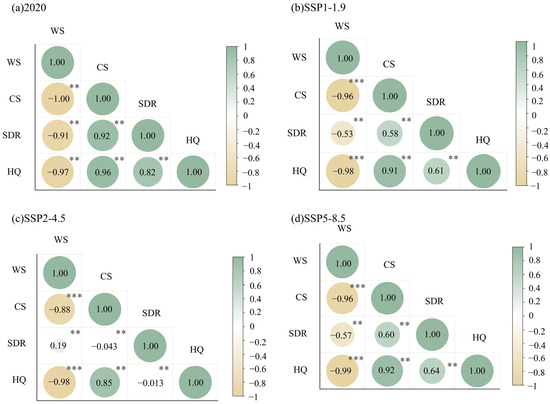
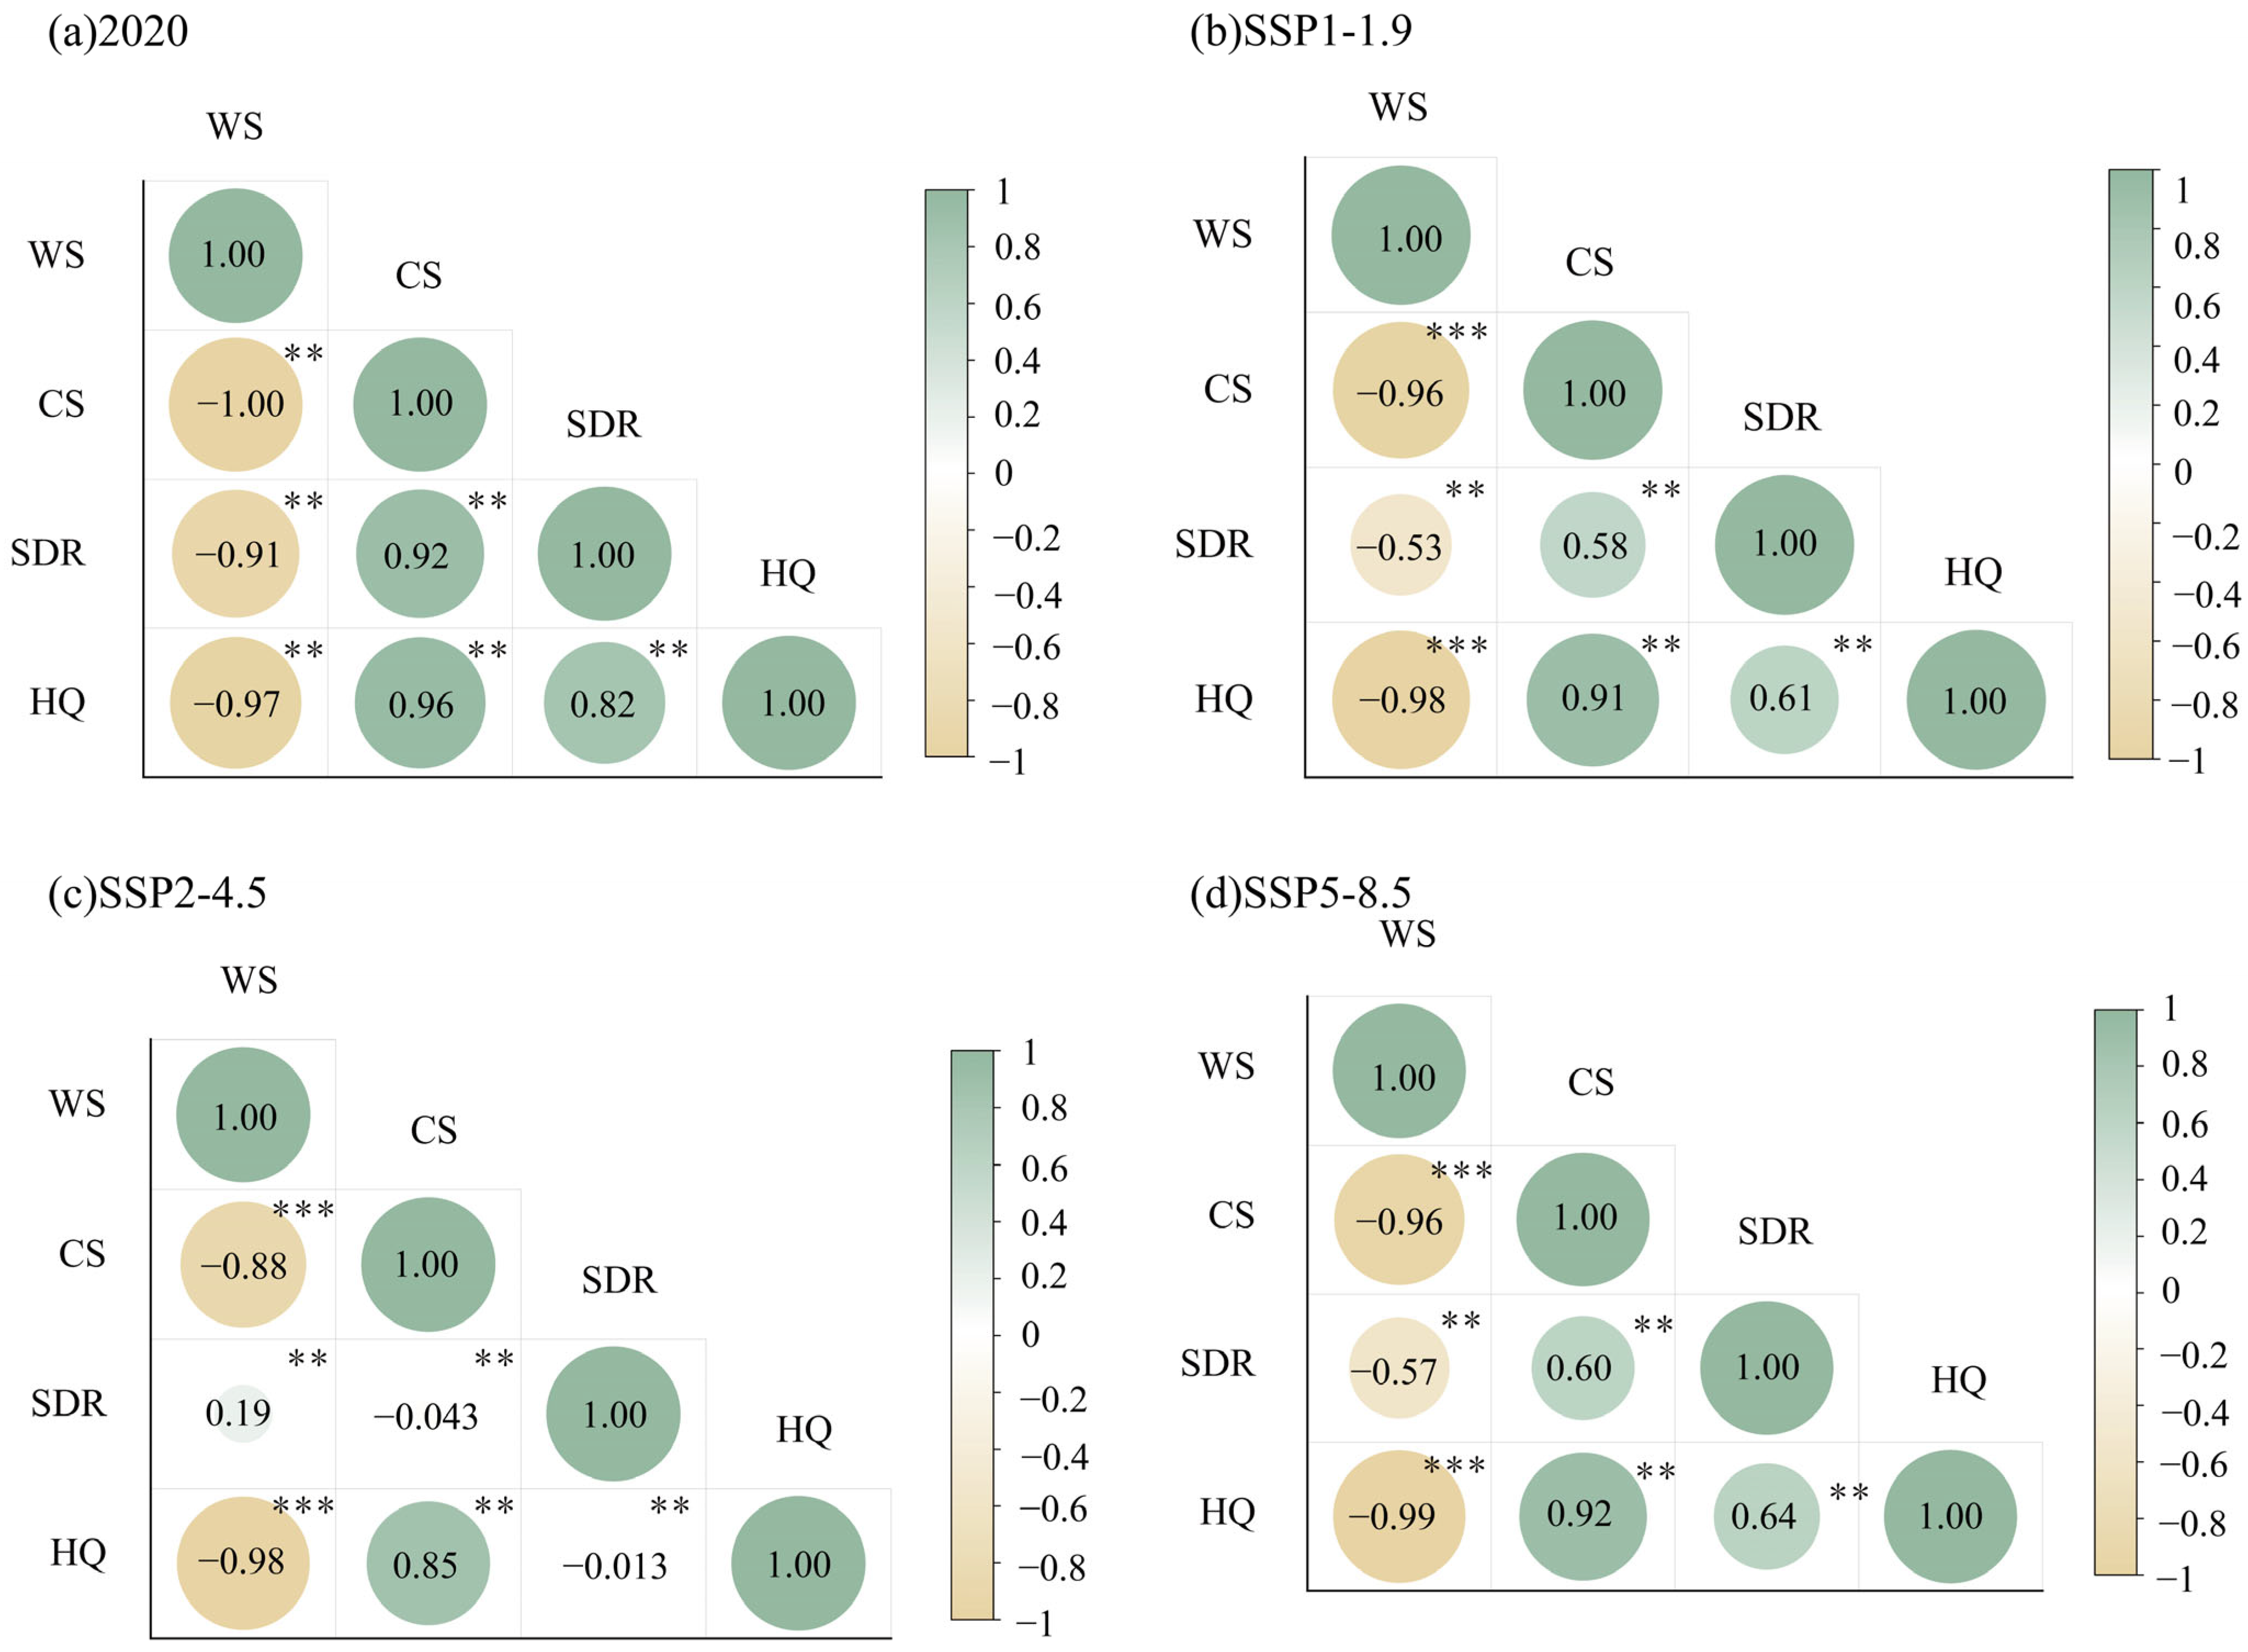
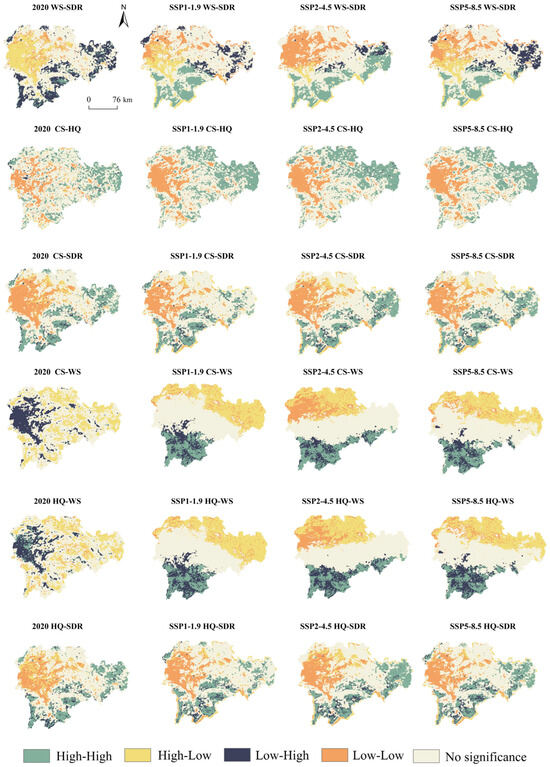
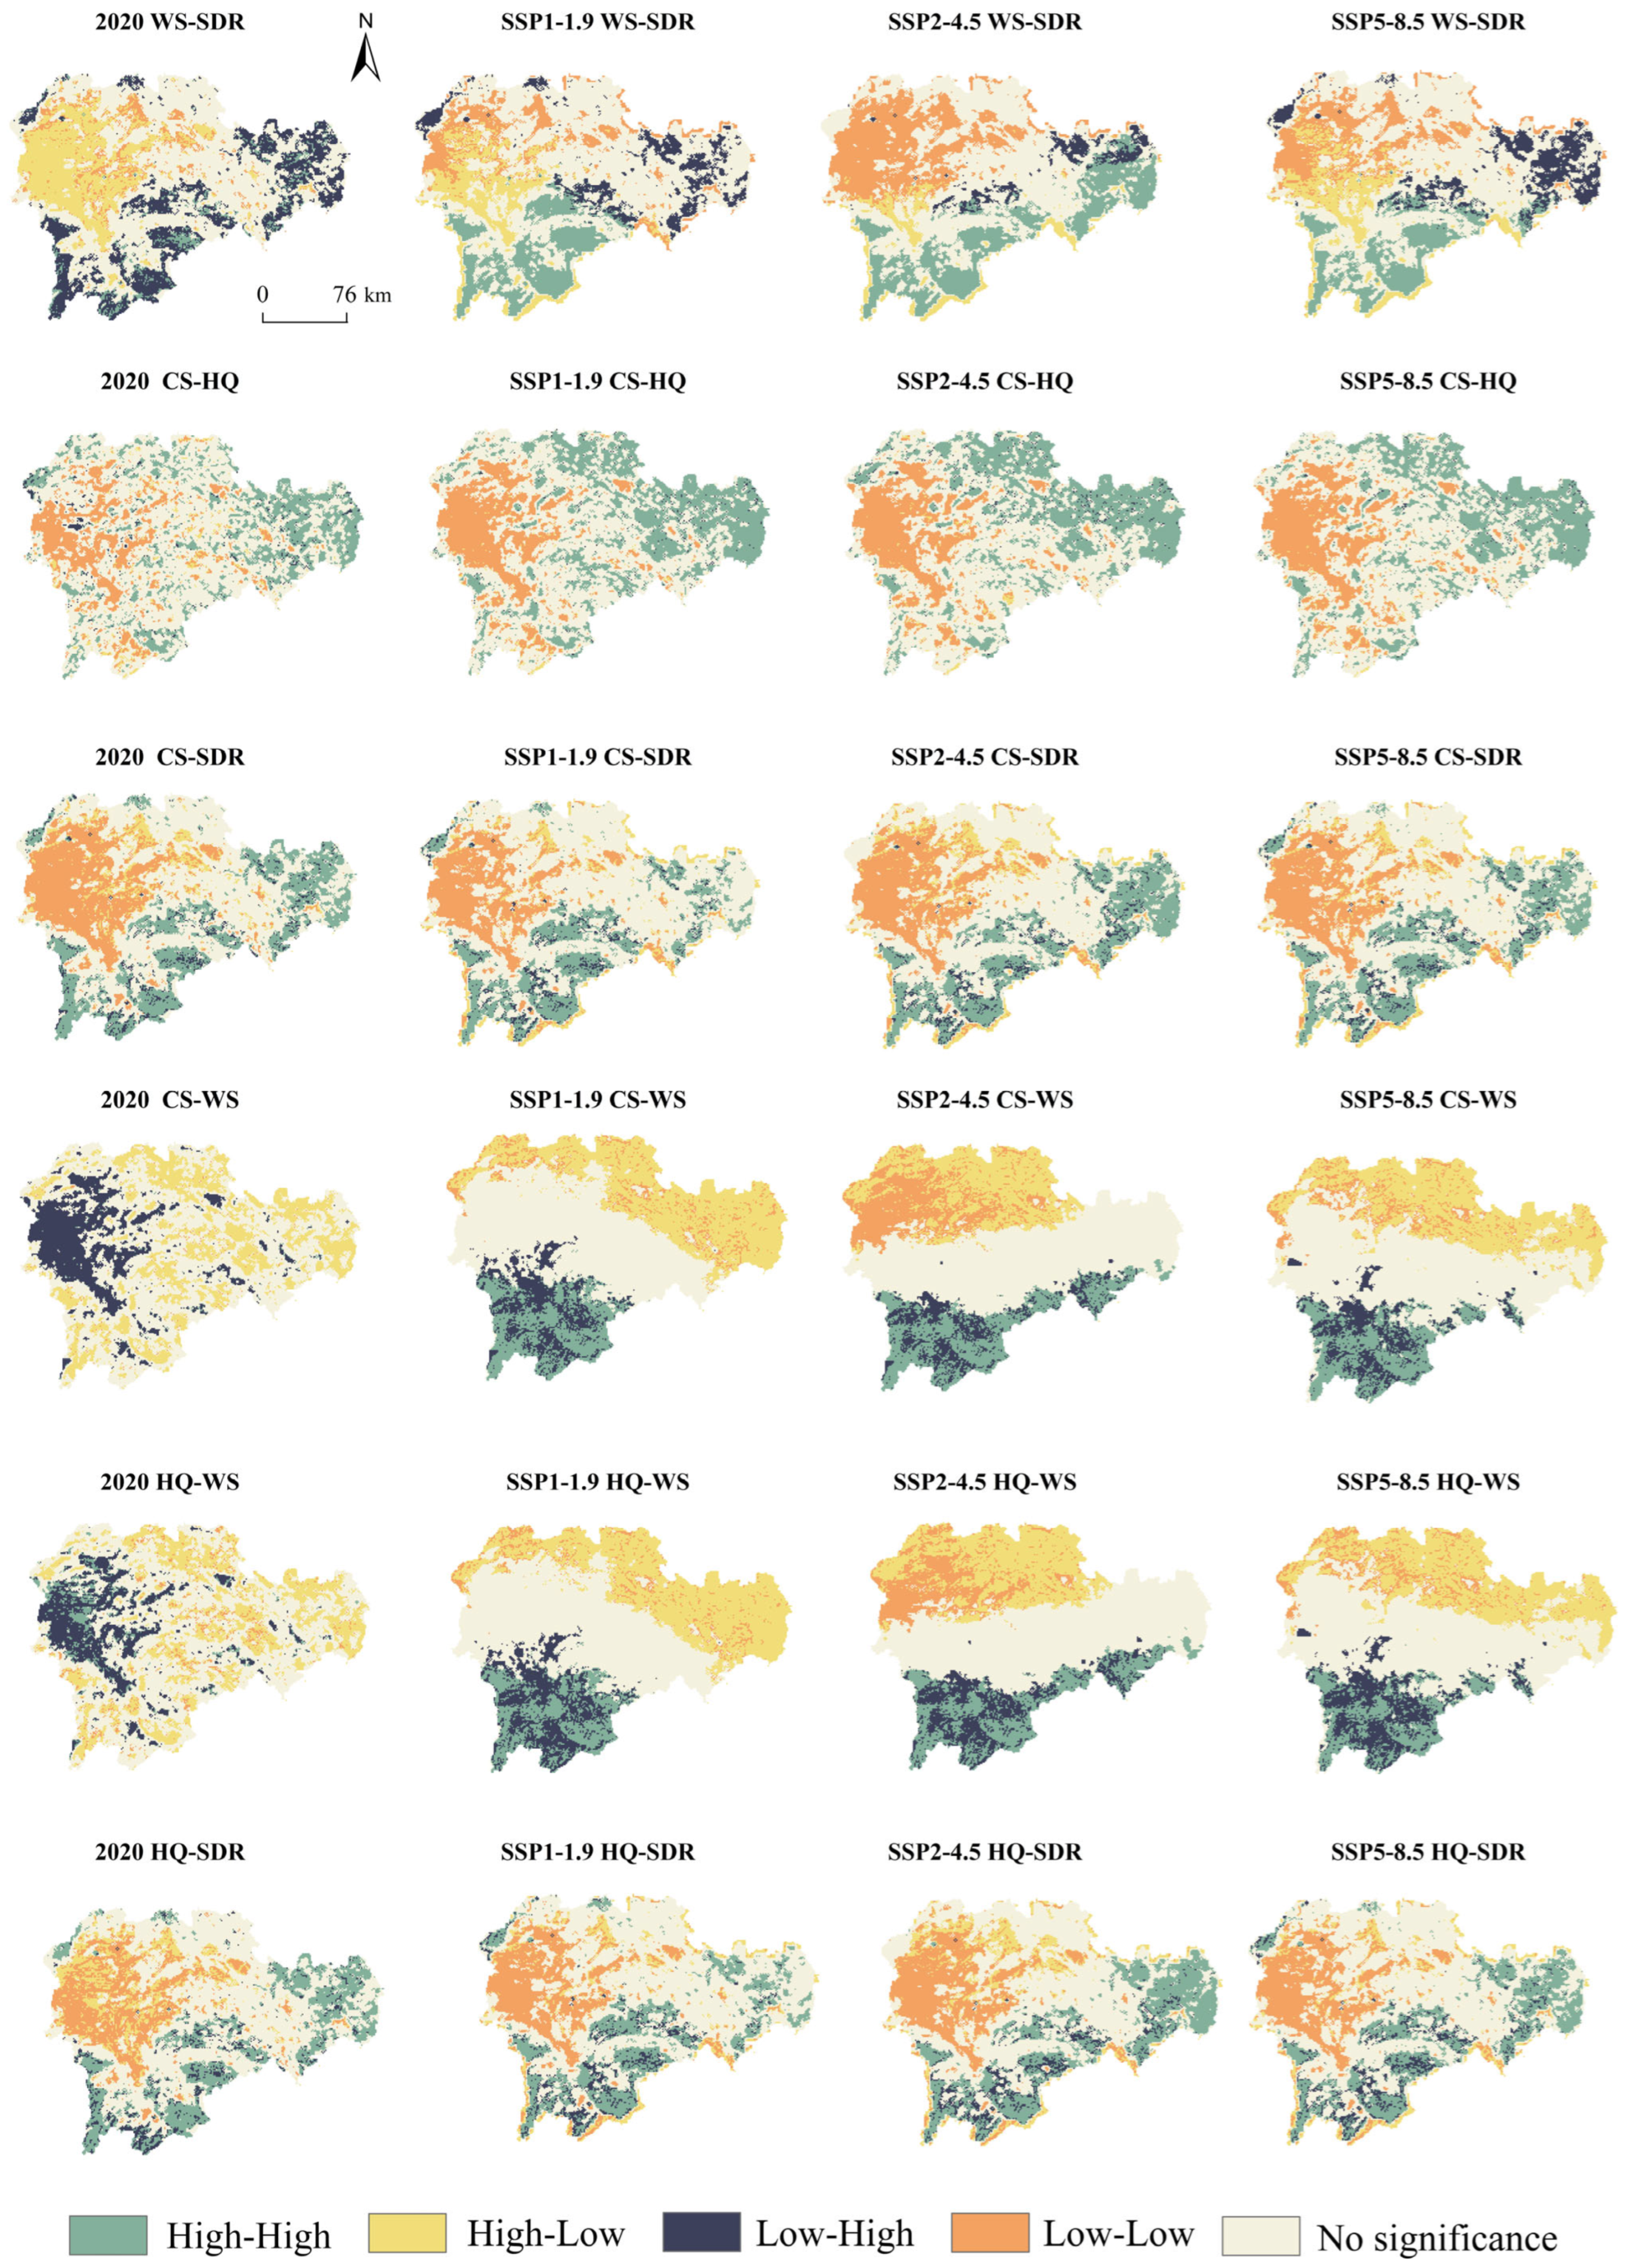
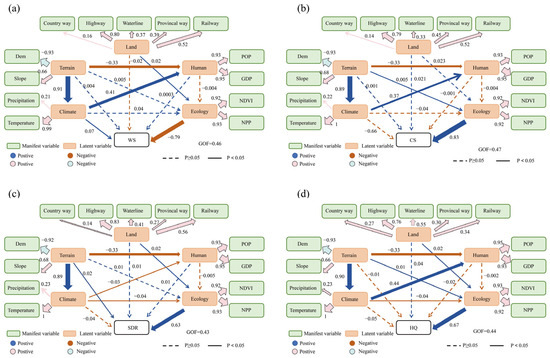
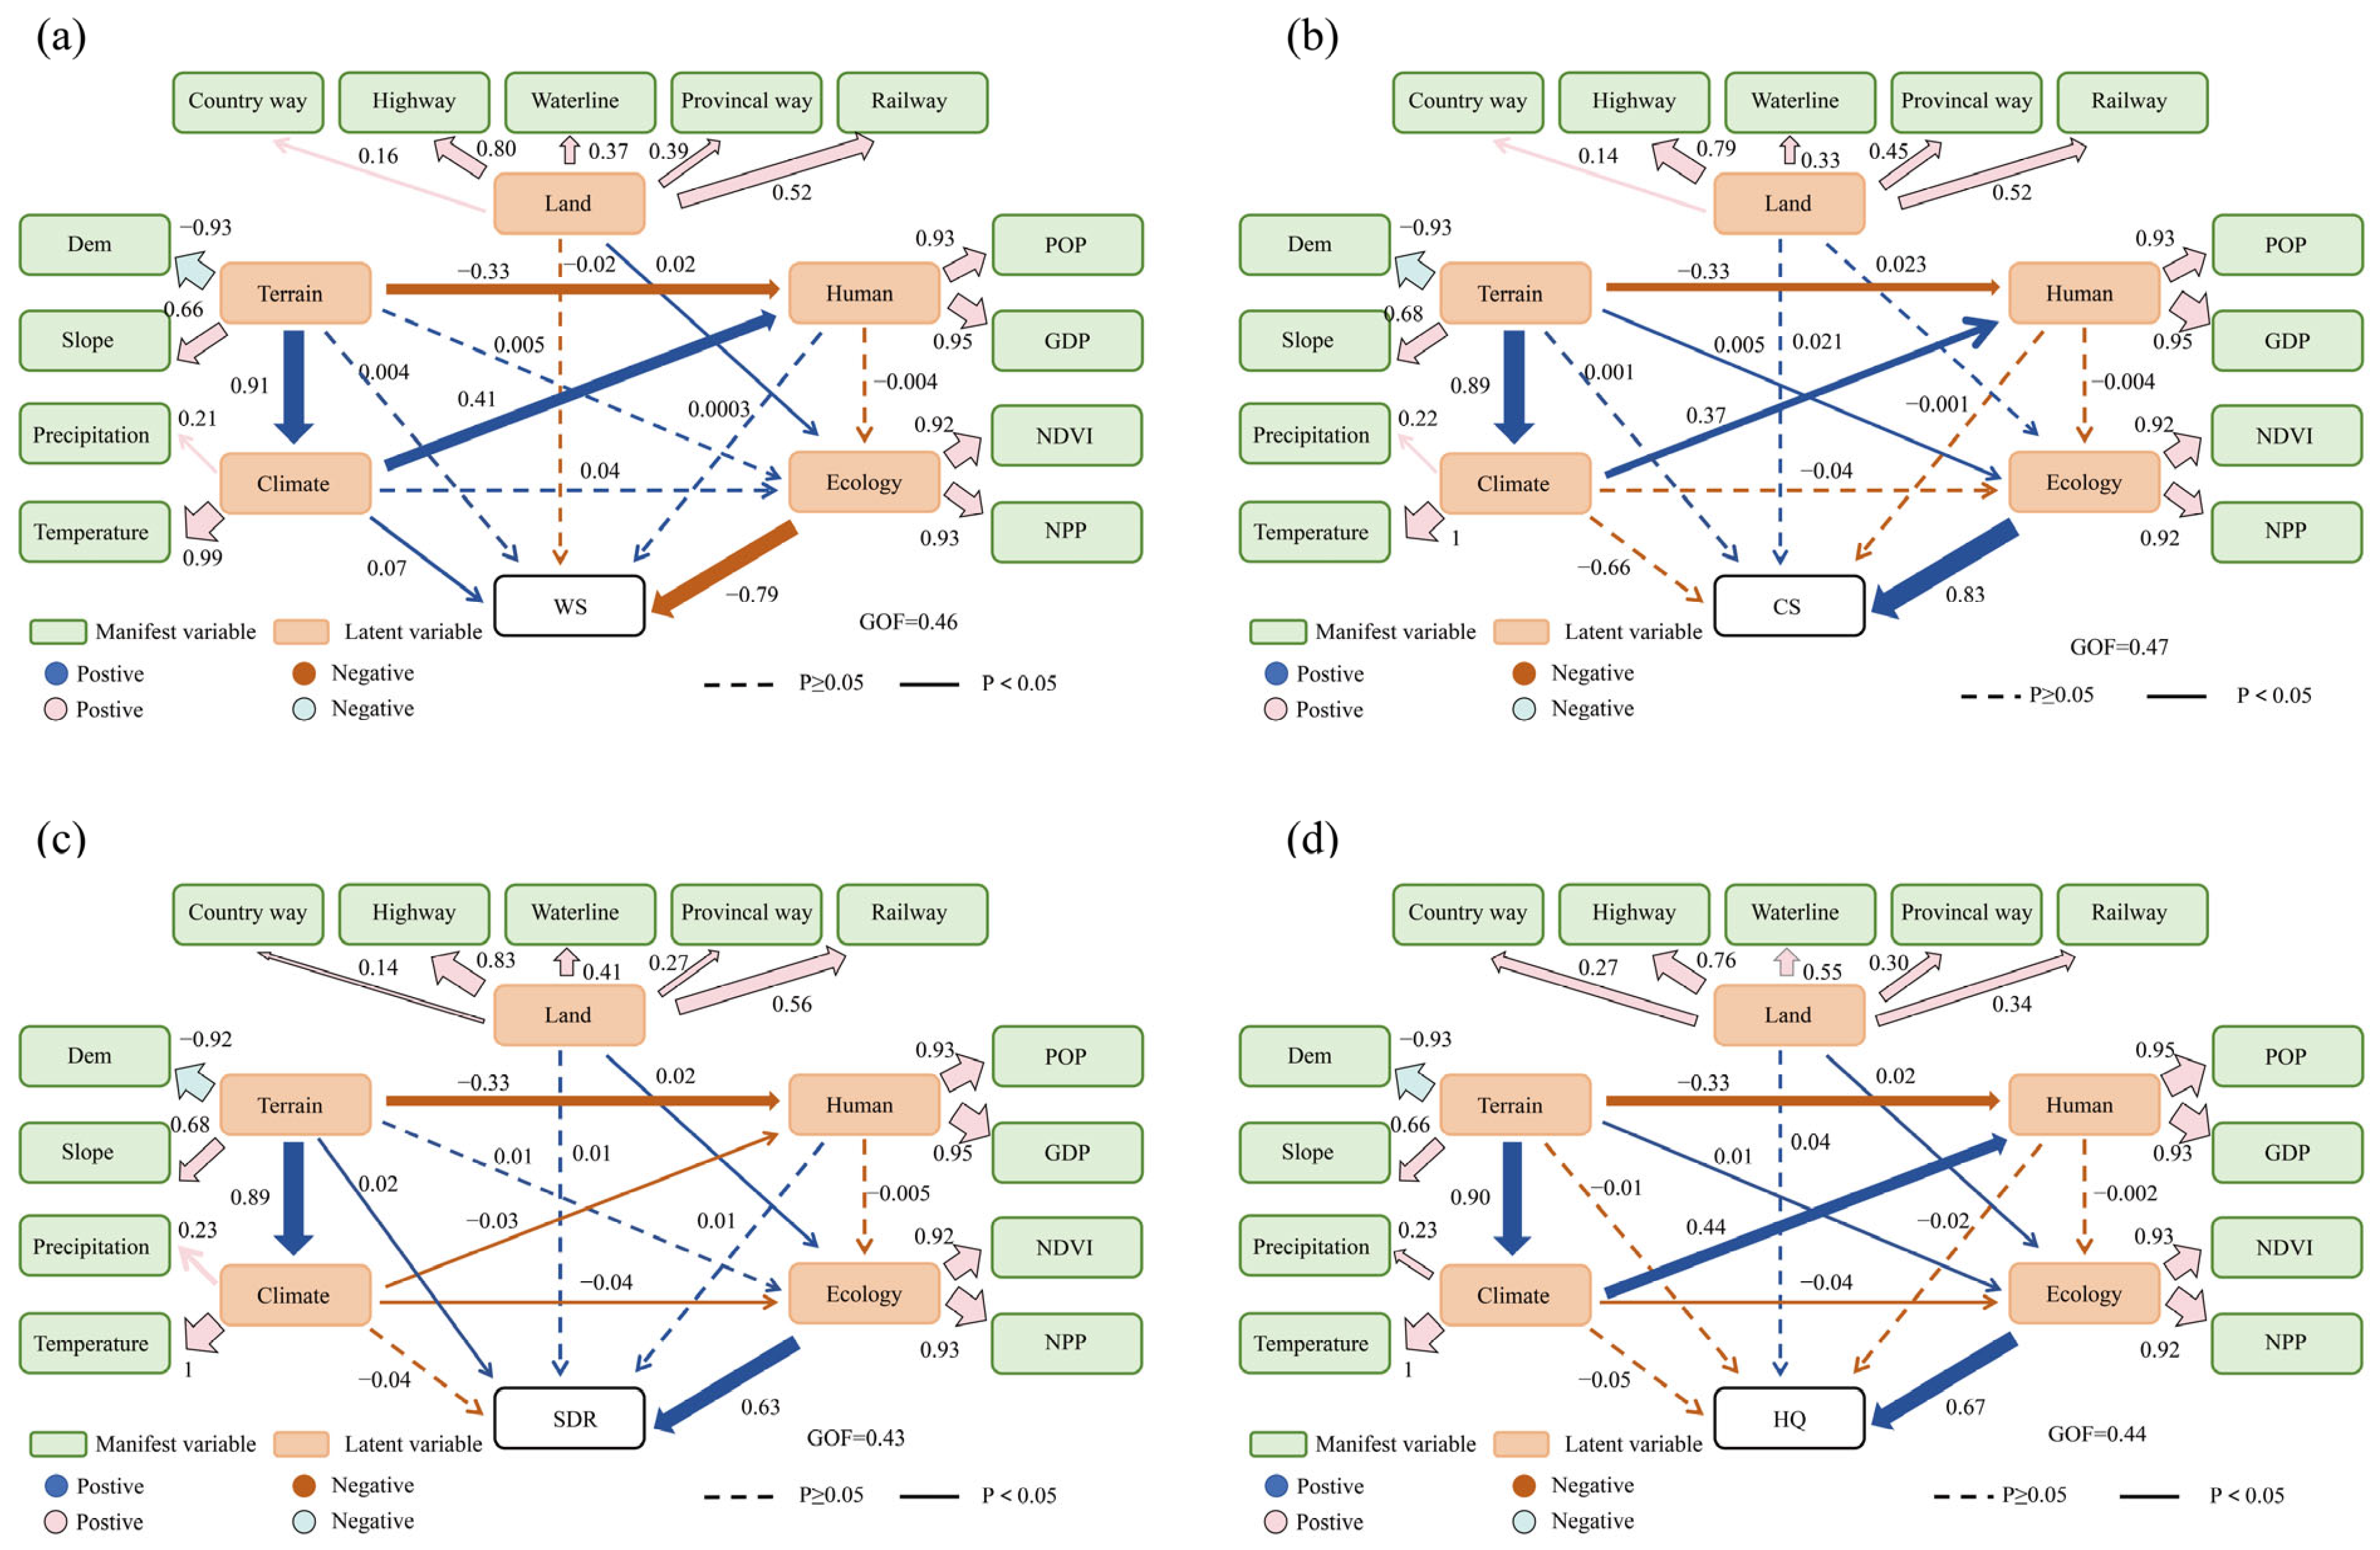

Disclaimer/Publisher’s Note: The statements, opinions and data contained in all publications are solely those of the individual author(s) and contributor(s) and not of MDPI and/or the editor(s). MDPI and/or the editor(s) disclaim responsibility for any injury to people or property resulting from any ideas, methods, instructions or products referred to in the content. |
© 2026 by the authors. Licensee MDPI, Basel, Switzerland. This article is an open access article distributed under the terms and conditions of the Creative Commons Attribution (CC BY) license.