


Abstract
Rice (Oryza sativa L.) production in the Philippines remains highly vulnerable to recurrent outbreaks of the Rice Black Bug (RBB; Scotinophara coarctata F.) and White Stemborer (WSB; Scirpophaga innotata W.), two of the most destructive pests in Southeast Asian rice ecosystems. Classical economic threshold levels (ETLs) are difficult to estimate in smallholder settings due to the lack of cost–loss data, often leading to either delayed or excessive pesticide application. To address this, the present study developed an adaptive outbreak-forecasting framework that integrates the Number–Size (N–S) fractal model with machine learning (ML) classifiers to define and predict pest regime transitions. Seven years (2018–2024) of light-trap surveillance data from the Philippine Rice Research Institute–Midsayap Experimental Station were combined with daily climate variables from the NASA POWER database, including air temperature, humidity, precipitation, wind, soil moisture, and lunar phase. The N–S fractal model identified natural breakpoints in the log–log cumulative frequency of pest counts, yielding early-warning and severe-outbreak thresholds of 134 and 250 individuals for WSB and 575 and 11,383 individuals for RBB, respectively. Eight ML algorithms such as Logistic Regression, Decision Tree, Random Forest, Support Vector Machine, Balanced Bagging, LightGBM, XGBoost, and CatBoost were trained on variance-inflation-filtered climatic and temporal predictors. Among these, CatBoost achieved the highest predictive performance for WSB at the 94.3rd percentile (accuracy = 0.932, F1 = 0.545, ROC–AUC = 0.957), while Logistic Regression performed best for RBB at the 75.1st percentile (F1 = 0.520, ROC–AUC = 0.716). SHAP (SHapley Additive exPlanations) analysis revealed that outbreak probability increases under warm nighttime temperatures, high surface soil moisture, moderate humidity, and calm wind conditions, with lunar phase exerting additional modulation of nocturnal pest activity. The integrated fractal–ML approach thus provides a statistically defensible and ecologically interpretable basis for adaptive pest surveillance. It offers an early-warning system that supports data-driven integrated pest management (IPM), reduces unnecessary pesticide use, and strengthens climate resilience in Philippine rice ecosystems.
1. Introduction
Rice (Oryza sativa L.) is a cornerstone of global food security, supplying about 20% of human dietary energy [1], and serves as both a staple food and a major income source for Filipino farming households [2]. In rice-dependent provinces such as North Cotabato, stable yields are vital for national food security and the resilience of rural livelihoods. However, production stability is persistently threatened by recurrent insect-pest outbreaks that cause both direct yield losses and indirect costs from control inputs, replanting, and foregone harvests.
Classical pest management defines the economic threshold level (ETL) as the pest density at which intervention prevents losses from reaching the economic injury level, but estimating ETLs requires detailed yield loss and cost data often unavailable in smallholder settings. To address this limitation, this study employs the Number–Size (N–S) fractal model to derive population-based outbreak thresholds as ecological and operational equivalents of ETLs, enabling earlier detection and data-driven management planning for key rice pests in the region. The Rice Black Bug (RBB; Scotinophara coarctata F.) and White Stemborer (WSB; Scirpophaga innotata W.) are among the most economically damaging pests of Philippine rice and are consistently ranked by farmers in North Cotabato and other regions as priority threats [3,4,5,6,7]. Their recurring presence generates both biological and economic uncertainty, undermining farmers’ ability to plan cropping strategies and investments.
The RBB has been a persistent threat since major outbreaks in the early 1980s, causing widespread damage across multiple provinces [3]. Nymphs and adults feed by sucking sap from leaf sheaths and tiller bases, resulting in stunted growth, reduced tillering, and deadhearts that may reach ≥20% during seedling to early-tillering stages. The ETL is reached when ≥20% of hills show visible damage or an average of ≥10 nymphs or adults per hill is observed [8,9,10]. As crops mature, feeding intensifies, producing ≥30% deadhearts or ≥20% damage at flowering to maturity stages, leading to severe yield losses and, at epidemic levels, “bug burn” characterized by yellowing and drying of leaves [11]. The RBB’s persistence is linked to its adaptation to flooded ecosystems, allowing survival across cropping cycles and under submergence. Its aggregation behavior, forming dense clusters at the plant base or on levees during humid nights, facilitates local population buildup, while synchronous mass flights during full-moon nights [12] enable long-distance dispersal and sudden large-scale outbreaks that are difficult to anticipate [3]. Economically, outbreaks cause yield losses of 20–30%, with repeated insecticide applications and replanting increasing production costs [13].
The WSB, an episodic yet equally destructive pest, is among the most damaging rice herbivores in Asia [14]. Cream-colored moths lay egg masses covered with golden hairs on the undersides of leaves, and larvae bore into stems, destroying growing points. Damage symptoms appear as “deadhearts’’ during the vegetative phase and “whiteheads’’ during the reproductive phase [12,14,15,16,17]. The ETL for WSB is generally defined as >30% deadhearts in vegetative or >20% whiteheads in reproductive phase, with one egg mass per m2 signaling the need for intervention [18,19]. Severe infestations cause 10–50% yield loss, depending on crop stage, variety, and management practices [20]. Adults are nocturnal and exhibit distinct flight and aggregation behaviors; females prefer dense, humid canopies for oviposition, forming localized “hotspots.’’ Their flight activity, closely tied to lunar cycles [12], leads to wave-like dispersal during full-moon periods and cumulative infestations across adjacent fields [18,21,22]. This gradual spread contrasts with the explosive synchrony of RBB, underscoring the need for pest-specific monitoring and forecasting.
Historically, outbreak detection and management in Philippine rice ecosystems have relied on fixed thresholds. For instance, more than 10 RBB nymphs or adults per hill or one stemborer egg mass per m2 as action points. Stage-specific deadheart thresholds of 30% for vegetative, and 20% from reproductive to ripening phases, have also been used. Multi-site trials have shown that such thresholds yield high decision accuracy for stemborer control (96–99%), even with modest insecticide efficacy [3]. However, conventional thresholds are often arbitrary, site-specific, and poorly suited to the skewed, heavy-tailed distributions typical of pest populations [23]. They can overpredict outbreaks in low-pest years, causing unnecessary pesticide use, or miss rare, high-impact surges. Moreover, they ignore the contrasting dispersal dynamics of pests such as WSB’s gradual buildup versus RBB’s explosive synchrony.
The N–S fractal model overcomes these limitations by statistically detecting natural breakpoints in the log–log cumulative frequency of pest counts, allowing adaptive classification of background, elevated, and severe regimes [24,25]. Unlike fixed or percentile-based cut-offs, this approach derives thresholds directly from empirical data, making it inherently adaptive to the ecological characteristics and asymmetrical distributions of each pest. Such adaptability is critical in rice agroecosystems where long periods of low pest activity are punctuated by rare but extreme outbreaks driven by nonlinear interactions among climate, crop phenology, and management.
Building on this foundation, recent advances demonstrate the growing role of ML in rice pest and disease forecasting. The work of Nettleton et al. [26] showed that ML models perform competitively with process-based systems in predicting rice blast, while Gopalakrishnan et al. [27] developed a hybrid framework integrating time-series pest counts and weather variables for disease incidence forecasting. Similarly, Zhao et al. [28] combined multisite disease, management, and meteorological data for improved regional prediction. Yet most ML studies still focus on image-based detection rather than outbreak forecasting [29]. In pest studies, Skawsang et al. [30] used artificial neural networks and random forests to forecast Brown Planthopper populations, and Singh et al. [31] proposed a dynamic-ensemble ML model for Yellow Stem Borer infestations. No previous research, however, has simultaneously modeled WSB and RBB outbreaks under diverse climatic conditions. This study bridges that gap by integrating fractal-based thresholding with ML-driven forecasting, combining climatic and edaphic predictors to enhance both ecological interpretability and operational decision-support value.
Methodologically, the study couples seven years (2018–2024) of pest surveillance at the PhilRice Midsayap Experimental Station with climate variables from the NASA POWER database. Environmental parameters such as air temperature, relative humidity, precipitation, wind, soil moisture, and lunar phases, known to influence insect activity [12,21], were screened using variance inflation factor (VIF) analysis to eliminate collinearity [32,33]. The resulting independent predictors were used to train eight ML algorithms, including logistic regression, decision trees, and gradient-boosting ensembles, for forecasting outbreak regimes defined by the fractal thresholds. Model performance was benchmarked using accuracy, precision, recall, F1 score, and ROC–AUC metrics to identify classifiers that best balanced sensitivity and specificity in early-warning detection.
Beyond methodological advances, the study contributes to sustainable agricultural economies by promoting risk-differentiated pest management. Accurate outbreak forecasting optimizes pesticide use, reducing costs and environmental externalities while stabilizing yields, farmer income, and climate resilience [34,35,36]. Such predictive capability supports integrated pest management (IPM) principles and aligns with broader goals of sustainable agriculture and livelihood security [37]. Within the emerging bioeconomy framework [38], where agriculture supplies both food and renewable biomass [39], ensuring stable rice production remains central to food-system sustainability and ecological balance [40,41].
In this context, the present study specifically aims to: (i) define outbreak thresholds for RBB and WSB using the N–S fractal model; (ii) integrate multi-year pest and climate data for outbreak prediction; (iii) evaluate multiple ML classifiers under skewed outbreak regimes; and (iv) discuss the ecological, economic, and operational implications of fractal-informed forecasting for sustainable rice systems in the Philippines.
2. Materials and Methods
This study integrated a multi-year pest surveillance and climate datasets to establish a modeling framework for forecasting outbreaks of the RBB and WSB in Midsayap, Philippines. Pest abundance was systematically monitored using deployed standardized light traps [12], thereby generating one of the longest continuous datasets for these two pests in the region. To capture the environmental context that shaped pest population dynamics, corresponding daily climate data were obtained from the NASA Prediction of Worldwide Energy Resources (POWER) Project’s Daily v2.5.22 version on 2025/07/20, which encompassed critical variables such as air temperature, relative humidity, precipitation, wind speed, soil moisture.
Given the highly skewed and heavy-tailed nature of pest population distributions, outbreak thresholds were derived using the N–S fractal model, which identified natural breakpoints in the log–log cumulative frequency distribution. This approach objectively distinguished background levels, elevated activity, and severe outbreak regimes, offering an advantage over traditional fixed or percentile cut-offs by aligning thresholds with the empirical statistical structure of the data. For each pest, the N–S model generated tiered outbreak labels (1 = outbreak, 0 = non-outbreak) that corresponded to early-warning and severe outbreak scenarios. These binary indicators, together with a combined outbreak signal that flagged days when either RBB or WSB exceeded its fractal threshold, served as the target variables for model development. The merged pest–climate dataset was used to train and evaluate eight ML algorithms spanning tree-based, linear, and ensemble methods. Model performance was rigorously assessed using accuracy, precision, recall, F1 score, and ROC–AUC, thereby quantifying trade-offs between sensitivity and specificity across outbreak regimes. Finally, SHAP analysis was employed to interpret model outputs and quantify the ecological contribution of each predictor.
2.1. Study Area
The study was conducted using pest monitoring data from Lot A of the Philippine Rice Research Institute-Midsayap Experimental Station (PhilRice-MES), located in Midsayap, North Cotabato, Philippines (7.179276° N, 124.497075° E). The area was classified under a tropical climate, characterized by a bimodal rainfall pattern and two rice cropping seasons annually. Irrigated lowland rice dominated the landscape, and pest occurrence was influenced by high inter-annual variability in rainfall, relative humidity, and temperature.
2.2. Pest Monitoring Data Collection
Daily counts of RBB and WSB adults were systematically recorded from January 2018 to December 2024 through the use of standardized light traps installed at the PhilRice Midsayap Experimental Station. A single fixed-location light trap [12] was positioned in Lot A at a height of 1.5 meters above the rice canopy to ensure consistency in insect capture relative to crop growth and pest flight activity. Further, the trap was operated every night from dusk until dawn [20,42], providing uninterrupted coverage of nocturnal pest activity across multiple cropping seasons. Additionally, a 20-30 watt bulb was positioned 100 cm aboveground over a basin (50 cm wide, 59 cm deep) filled with water and detergent powder [18] with minor modification. Moreover, insects captured in the trap were retrieved each morning, after which trained staff carefully sorted and identified the specimens according to PhilRice’s established entomological protocols, ensuring taxonomic accuracy and data reliability. The results of each sampling event were documented as the number of individuals captured per trap-night, creating a continuous and standardized time series of RBB and WSB abundance over the seven-year monitoring period.
2.3. Climate and Lunar Data Acquisition
Daily climate data for the pest monitoring period were sourced from the NASA POWER database, covering key near-surface meteorological variables such as air temperature, relative humidity, precipitation, wind speed and direction, and topsoil moisture, all known to affect pest growth, reproduction, and dispersal [43,44,45]. Lunar phase data were also incorporated to capture the influence of moonlight on nocturnal pest flight behaviors, particularly in RBB and WSB populations [12,13,18]. These datasets were merged by date to form a synchronized daily time series for model development [46,47,48].
The climate and soil parameters with their respective units were summarized in Table 1. Following World Meteorological Organization (WMO) standards, temperature, humidity, and wind sensors are positioned about 2 m above ground to represent near-surface atmospheric conditions while minimizing site-specific bias [49,50]. This reference height aligns with global forecast conventions where 2 m temperature and 10 m wind speed are standard predictive variables [51]. NASA POWER adopts these conventions, ensuring consistency with WMO protocols and compatibility with agrometeorological and pest forecasting applications [52,53].
Table 1.
Description of climate and soil parameters.
2.4. Data Processing
Raw pest count data were first cleaned to ensure numerical consistency by removing formatting characters (e.g., commas) and converting all values to numeric format. Records containing minimal missing values in pest counts or essential climate variables were excluded from further analysis. Data integrity checks were performed to identify and remove biologically implausible values. Temporal features, specifically month and day-of-year, were extracted from the date field to capture seasonal variations in pest abundance. Lagged versions of climate variables were considered during exploratory analysis to account for delayed pest responses to environmental changes; however, only non-lagged variables were retained for the baseline models to maintain model simplicity and interpretability.
2.4.1. Multicollinearity Assessment
Variance Inflation Factor (VIF) analysis was conducted to reduce redundant information and improve model stability [54] on the initial set of climate and astronomical predictors. VIF quantifies the degree of multicollinearity by measuring how much the variance of a regression coefficient is inflated by correlations among predictors, with values greater ≥10 commonly considered indicative of problematic collinearity [32,55]. For compatibility with the VIF calculation, the categorical variable Moon_Category was converted into dummy variables, after which VIF scores were computed using the variance_inflation_factor function from the statsmodels (v0.14.5) package. Variables with the highest VIF as shown in Table 2 exceeding the threshold were iteratively removed, with scores recalculated at each step until all predictors had VIF values ≤ 10. This procedure yielded the final feature set (Year, Day, T2M_MIN, T2M_MAX, RH2M, PRECTOTCORR, WS2M_MAX, WS2M_MIN, WD2M, GWETTOP, Moon_Category, and Week_Number) which was subsequently used for model training. Applying VIF filtering prior to model development minimized inflated standard errors, enhanced interpretability, and reduced the risk of unstable decision boundaries [56] in both traditional ML and deep learning classifiers.
Table 2.
Rules of thumb for diagnosing multicollinearity.
2.4.2. Outbreak Threshold Definition
Given the highly skewed distributions of pest counts, outbreak thresholds were determined using the N-S Fractal Model rather than fixed numerical values or arbitrary percentile cut-offs [25]. This method identifies natural breakpoints in the log–log cumulative distribution of counts, allowing thresholds to be derived objectively from the statistical structure of the data [24]. For each pest, the N–S Fractal Model separated the observations into three regimes such as background, elevated activity, and severe outbreak, based on slope changes in the cumulative frequency curve. For each regime, binary outbreak labels were assigned (1 = observation meets or exceeds the threshold, 0 = otherwise). This fractal-based approach ensures that outbreak levels are optimally calibrated to the skewed nature of pest populations, providing a consistent and data-driven framework for outbreak detection across both pests.
The Number–Size (N–S) fractal model was applied to identify natural outbreak thresholds from weekly pest population data of the RBB and WSB. This model, originally developed for detecting geochemical anomalies [24,25], was adapted to agricultural pest surveillance to describe how pest counts are distributed from normal to outbreak levels. The cumulative number of observations exceeding a given pest density was plotted in logarithmic form, producing a curve that reveals distinct slope changes representing population shifts.
Breakpoints were estimated through segmented regression by minimizing the total residual sum of squares (RSS) among all two-break combinations along the log–log cumulative curve. Model adequacy was verified using for each segment and an F-test comparison between the single- and three-segment models. A bootstrap resampling procedure (100–200 iterations) generated 95% confidence intervals to quantify uncertainty, revealing ≤5% variation in threshold estimates. These steps ensured that the selected inflection points represent stable and statistically significant slope transitions.
An automated data-processing routine written in Python scanned these log–log plots and determined the two most meaningful “bend points” that best separated the distribution into three zones. The first bend corresponds to the transition from background population to early build-up, which was defined as the early-warning threshold. The second marks the onset of extreme population clustering, interpreted as the severe-outbreak threshold. Minor fluctuations caused by sampling noise were ignored. This approach provides a transparent, data-driven way to classify pest activity levels without relying on arbitrary percentile cut-offs. It allows agricultural decision-support systems to generate timely alerts for farmers and extension workers based on natural population behavior rather than fixed numerical rules.
2.5. Machine Learning Model Development and Configuration
Similar to approaches in the medical field where ML models are benchmarked for patient risk prediction [57], our study compares multiple classifiers to determine which algorithms best capture the nonlinear outbreak dynamics of rice pests under skewed ecological distributions. Eight classification algorithms were evaluated to predict outbreak occurrence at thresholds derived from the N-S Fractal Model for both WSB and RBB such as Logistic Regression, Decision Tree, Random Forest, Light Gradient Boosting Machine (LightGBM), eXtreme Gradient Boosting (XGBoost), CatBoost, Support Vector Machine (SVM), and Balanced Bagging Classifier. Predictor variables consisted of the VIF-filtered set of climate, astronomical, and temporal features, while the target variable corresponded to the binary outbreak labels assigned according to the fractal-based threshold definitions. The dataset was split into training (80%) and testing (20%) subsets using stratified sampling to preserve outbreak/non-outbreak proportions.
To address class imbalance, particularly at higher outbreak thresholds, class weights were set to “balanced” for applicable algorithms, and the scale_pos_weight parameter was computed for boosting models based on the training set class distribution. Pre-processing was performed using a ColumnTransformer of the scikit-learn (v1.7.2) library, which standardized all numeric features and one-hot encoded the Moon_Category variable, ensuring consistent feature scaling across algorithms. Moreover, model hyper-parameters were fixed based on literature-informed defaults and exploratory trials rather than exhaustive search. For boosting models, parameters such as the number of estimators, learning rate, maximum tree depth, and sub-sampling ratios were set to values that balanced predictive performance with computational efficiency. For SVM and Logistic Regression, kernel choice, regularization strength, and solver settings were adjusted to ensure convergence and stability.
2.6. Evaluation Metrics
Model performance for WSB and RBB outbreak classification was evaluated using accuracy, precision, recall, F1 score, and ROC–AUC. Accuracy quantified the overall proportion of correct predictions, while precision measured the proportion of predicted outbreak cases that were actual outbreaks. Recall indicated the proportion of true outbreak cases correctly identified, and the F1 score, calculated as the harmonic mean of precision and recall, provided a balanced assessment of detection capability. ROC-AUC measured the model’s ability to discriminate between outbreak and non-outbreak classes across varying decision thresholds. These metrics were computed for each outbreak severity level as defined by the N-S fractal thresholds, which separate the data into background, elevated activity, and severe outbreak regimes. This approach enabled a more ecologically grounded comparison of model performance across outbreak intensities while maintaining consistency with the natural scaling behavior of pest populations.
2.7. Model Interpretability Using SHAP
To improve transparency and ecological interpretability, post hoc explainability analysis was conducted using SHAP (SHapley Additive exPlanations). SHAP assigns an additive importance value to each feature for every prediction [58], quantifying how individual climatic or environmental variables influence model output [59]. In this study, SHAP was applied to the top-performing classifiers for each pest species. The analysis was performed on the standardized test set to identify which variables most strongly contributed to outbreak probability and whether these relationships aligned with known pest–climate interactions.
Feature contributions were visualized using SHAP summary and beeswarm plots, which display both the magnitude and direction (positive or negative influence) of each predictor’s impact on the model’s decision. This approach allowed ecological interpretation of the models by linking dominant predictors to established biological responses of the target pests.
2.8. Statistical and Computational Environment
All analyses were conducted in an offline Jupyter Notebook environment (v7.2.1) running Python (v3.11) on a system with Windows 11 operating system, 16 GB RAM, and an Intel Core i7 processor. Data handling and pre-processing were performed using the pandas (v2.2.2) and numpy (v2.0.2) libraries, while model development and evaluation employed scikit-learn (v1.7.2). The gradient boosting models were implemented using XGBoost (v3.1.1), LightGBM (v4.5.0), and CatBoost (v1.2.5). Synthetic Minority Oversampling Technique (SMOTE) was applied through the imbalanced-learn package (v0.14.0). Data visualization was performed using matplotlib (v3.9.2) and seaborn (v0.13.2). The offline Jupyter environment ensured full computational reproducibility independent of internet access.
3. Results
The performance of eight classification algorithms is evaluated for predicting outbreak occurrence of RBB and WSB using outbreak thresholds derived from the N–S fractal model. For each pest, binary outbreak labels are generated based on two fractal breakpoints that correspond to elevated and severe outbreak regimes, thereby accounting for the highly skewed nature of the observed distributions (see Figure 1 and Figure 2). Analyses are conducted using both the raw feature set and a ColumnTransformer-preprocessed feature set, where climate, astronomical, and temporal predictors are standardized and the categorical Moon phase variable is one-hot encoded. Model performance is assessed using accuracy, precision, recall, F1 score, and ROC–AUC, thereby ensuring that both predictive reliability and discriminative ability are captured. To illustrate the underlying data properties, the skewed pest count distributions are visualized alongside their fractal-derived thresholds, highlighting the divergence between routine population fluctuations and outbreak-level surges.
Figure 1.
Distribution and N–S fractal thresholds for RBB. The left panel shows the highly skewed distribution of RBB counts with thresholds (early warning at the 75.1st percentile and severe outbreak at the 94.8th percentile), while the right panel shows the N–S fractal cumulative distribution fit. Shaded regions correspond to background, elevated, and severe regimes.
Figure 2.
Fractal-based threshold characterization for White Stemborer (WSB). The left panel depicts the empirical distribution of WSB counts, highlighting the early warning (94.3rd percentile) and severe outbreak (98.9th percentile) thresholds derived from percentile analysis. The right panel shows the fitted N–S fractal cumulative distribution, delineating the transition across background, elevated, and severe outbreak regimes.
3.1. Pest Count Distributions and Outbreak Threshold Justification
The application of the N–S fractal model enables the identification of statistically grounded outbreak thresholds that reflect the highly skewed distributions of RBB and WSB populations. Both pests exhibit strongly right-skewed, heavy-tailed distributions. Most weekly observations are concentrated at low to moderate counts, while only a few weeks produce extreme surges that stretch the distribution far to the right.
The segmented-regression procedure (Section 2.4.2) identified two statistically significant breakpoints for both RBB and WSB, meeting the model validation criteria. As shown in Table 3, the three-segment N–S model achieved markedly lower residual error and higher values (>0.93) than the single-segment fit, while F-test results (RBB: , ; WSB: , ) confirmed that the added breakpoints significantly improved model performance. Bootstrap resampling (100–200 iterations) produced narrow 95% confidence intervals (), verifying the stability of the estimated thresholds. The background regime, because it was just representing normal population levels, was excluded from further analyses, while the elevated and severe regimes (corresponding to early-warning and outbreak phases) were retained for modeling. These two stages mark the transition from background activity to damaging population surges, aligning statistical thresholds with ecologically and economically meaningful management decisions.
Table 3.
Statistical validation of N–S fractal thresholds for RBB and WSB. The three-segment N–S model produced significantly better fits compared to a single linear model, as supported by F-tests and high values. Bootstrapping (100–200 resamples) confirmed the stability of the estimated thresholds.
For RBB, as shown in Figure 1, the model distinguishes an early warning threshold at approximately 575 individuals (75.1st percentile) and a severe outbreak threshold at around 11,383 individuals (94.8th percentile), indicating that while the majority of catches occur at background levels, rare but very large outbreaks define the tail of the distribution. In contrast, WSB, as shown in Figure 2, displays much lower absolute thresholds, with early warning emerging at 134 individuals (94.3rd percentile) and severe outbreak at 250 individuals (98.9th percentile), underscoring its dynamics as a less abundant but episodically explosive pest. These results demonstrate how the N–S fractal model accommodates skewed, heavy-tailed population structures, providing a tiered framework (background, elevated, and severe) that enhances the precision of early warning and intervention. By aligning outbreak thresholds with the empirical properties of each pest’s distribution, this approach ensures that management actions remain both responsive and proportional to actual outbreak risks.
3.2. Climate and Lunar Predictor Screening and Distribution Analysis
To ensure robust model performance and reduce the risk of unstable coefficient estimates, multicollinearity among climate and moon-phase predictors was assessed using the Variance Inflation Factor (VIF). Predictors with VIF values exceeding the threshold of 10 were iteratively removed, starting from the highest, until all remaining variables had . This procedure retained 13 predictors, with the highest VIF recorded for RH2M (9.84), followed by T2M_MAX (8.68) and Moon_Category (5.24) (Table 4). All other variables showed low to moderate collinearity, indicating acceptable independence for model inclusion.
Table 4.
Final Variance Inflation Factor (VIF) values for retained predictors after iterative reduction, with corresponding descriptions and units. All values are below the threshold of 10, indicating acceptable multicollinearity levels.
Following VIF-based reduction, the retained variables’ distributions were visualized using violin–boxplot overlays (Figure 3). The plots show that temperature (T2M_MIN, T2M_MAX) and humidity (RH2M) exhibited relatively narrow distributions, while precipitation (PRECTOTCORR) was highly right-skewed, reflecting occasional extreme rainfall events typical of the wet season. Wind-related variables (WS2M_MAX, WS2M_MIN, WD2M) displayed moderate variability, and surface soil moisture (GWETTOP) remained consistently high across observations.
Figure 3.
Violin–boxplot overlays of retained climate and moon-phase predictors after VIF-based reduction. The distributions highlight the variability and skewness across variables, with precipitation showing extreme right-skewness, and moon phases spread across the full cycle.
The lunar phase variable (Moon_Category), numerically represented from 0 to 7 corresponding to 0 = (New Moon), 1 = (Waxing Crescent), 2 = (First Quarter), 3 = (Waxing Gibbous), 4 = (Full Moon), 5 = (Waning Gibbous), 6 = (Last Quarter), and 7 = (Waning Crescent), was one-shot-encoded prior to modeling and exhibited occurrences across all eight phases, with slightly higher frequencies in categories 2–4 (First Quarter to Full Moon). This combined statistical screening and exploratory visualization ensured that predictors used for outbreak modeling were both statistically robust (low multicollinearity) and ecologically interpretable, reflecting the temporal variability and seasonal dynamics of the study site’s agro-climatic environment.
3.3. Model Performance on Baseline vs. Transformed Features
The performance of classification algorithms was evaluated at the N–S fractal thresholds for WSB (P94.3 = 134; P98.9 = 250) and RBB (P75.1 = 579; P94.8 = 11,401), with detailed results presented in Table 5 and Table 6.
Table 5.
Model performance at the N–S fractal thresholds for WSB (P94.3 = 134; P98.9 = 250).
Table 6.
Model performance at the N–S fractal thresholds for RBB (P75.1 = 579; P94.8 = 11,401).
For WSB at the 94.3rd percentile, CatBoost achieved the best balance of predictive metrics, with an accuracy of 0.932, precision of 0.429, recall of 0.750, F1 score of 0.545, and ROC–AUC of 0.957. Balanced Bagging also performed competitively, attaining perfect recall (1.000) though at lower precision (0.333), indicating a tendency to overpredict outbreak events. Other ensemble models such as XGBoost and LightGBM produced moderate recall values (0.500) but with reduced F1 scores. Logistic Regression and SVM underperformed, with the latter failing to capture positive cases entirely. After applying the ColumnTransformer, improvements were observed in linear models (e.g., Logistic Regression recall = 1.000), though ensemble methods remained dominant overall.
At the 98.9th percentile, which corresponds to the severe outbreak regime under the N–S fractal framework, most classifiers collapsed to near-zero recall and F1 scores despite maintaining high overall accuracy values (>0.97). For example, CatBoost, XGBoost, LightGBM, and Decision Tree all predicted the majority class exclusively, resulting in zero sensitivity to severe outbreaks. The exception was SVM (baseline), which achieved perfect recall (1.000) but negligible precision (0.014), producing an unstable F1 score (0.027). Transformed features did not yield substantial improvements, highlighting the difficulty of modeling extremely rare WSB outbreaks. This decline in sensitivity does not necessarily indicate algorithmic overfitting but instead reflects the inherent scarcity of data at the extreme tail of the outbreak distribution, making the 98.9th percentile threshold more useful as a sentinel marker of risk rather than a practical cutoff for predictive deployment.
For RBB at the 75.1st percentile, XGBoost achieved the highest accuracy (0.770) and ROC–AUC (0.683), while Balanced Bagging and Logistic Regression showed competitive performance with recall values of 0.500 and 0.444, respectively. After transformation, Logistic Regression improved markedly, attaining recall of 0.722, F1 score of 0.520, and ROC–AUC of 0.716, making it the best-performing model under this threshold. These results indicate that feature scaling and encoding particularly benefited linear classifiers for RBB.
At the 94.8th percentile, CatBoost and LightGBM both achieved the strongest performance, with accuracy values of 0.973, precision of 1.000, recall of 0.500, F1 scores of 0.667, and ROC–AUC values of 0.911 and 0.825, respectively. XGBoost followed with an accuracy of 0.959 and ROC–AUC of 0.789, although recall was limited (0.250). Other classifiers, including Random Forest and Logistic Regression, exhibited high overall accuracy but negligible recall. With transformed features, CatBoost retained the best performance (accuracy = 0.986, precision = 1.000, recall = 0.750, F1 = 0.857, ROC–AUC = 0.892), confirming its robustness under high-intensity RBB outbreaks. Similar to WSB, however, the sharp decline in recall at the 94.8th percentile reflects the rarity of severe events in the dataset, suggesting that while the N–S threshold captures epidemiologically meaningful extremes, predictive reliability is stronger at the earlier breakpoint (75.1st percentile).
The evaluation revealed that transformed models consistently outperformed or matched baseline models across thresholds for both WSB and RBB. Transformation, through standardization of numeric features and one-hot encoding of categorical inputs, ensures that variables measured in different units contribute proportionally to model training, thereby avoiding dominance of high-magnitude predictors. This process also correctly represents categorical variables, such as moon phase, without imposing artificial ordinal relationships. Furthermore, the transformed pipelines integrated class weighting, which proved particularly advantageous at extreme thresholds where positive samples were rare. While baseline models tended to collapse under such imbalance, transformed models maintained relatively higher discriminatory power, as reflected in their ROC–AUC values. Importantly, the transformed approach also enhances model reproducibility and portability, since preprocessing steps are embedded within the pipeline, ensuring consistent application to new incoming data.
3.4. Model-Specific Classification Performance Across Insect Pest and Severity Thresholds
The confusion matrices in Figure 4 provide a comparative visualization of model performance at the N–S fractal thresholds for WSB and RBB. Each row corresponds to a defined outbreak severity threshold, while columns contrast the priority classifier against two alternative options.
Figure 4.
Confusion matrices of priority and alternative models at the N–S fractal thresholds for WSB and RBB, illustrating classifier performance under early-warning and severe outbreak conditions. Color intensity corresponds to the number of correctly or incorrectly classified samples, where darker green indicates higher accuracy and lighter shades indicate lower prediction counts.
For WSB at the 94.3rd percentile (early-warning threshold = 134 individuals), CatBoost was identified as the priority model, achieving a strong balance between true negatives (66) and true positives (3). Its alternatives, Support Vector Machine and Balanced Bagging, attained similar sensitivity but at the cost of higher false positives, reflecting their tendency to overpredict outbreaks. At the severe threshold (98.9th percentile = 250 individuals), Random Forest was prioritized, perfectly classifying the majority class but missing all but one outbreak case. CatBoost and SVM offered alternative perspectives, each recovering one outbreak but also introducing misclassifications. This result underscores the difficulty of learning from extremely rare severe outbreak events, consistent with the metric collapse observed in Table 5.
For RBB, at the 75.1st percentile (early-warning threshold = 579 individuals), Logistic Regression emerged as the priority model, detecting 13 true positives while misclassifying 5 negatives as outbreaks. Compared with its alternatives (SVM and Balanced Bagging), Logistic Regression achieved a better recall–precision balance, confirming the benefits of feature transformation on linear models. At the severe outbreak threshold (94.8th percentile = 11,401 individuals), CatBoost was the most effective, correctly identifying 3 outbreaks with minimal false alarms. LightGBM and SVM performed comparably but produced slightly more false positives, illustrating the trade-off between sensitivity and specificity in high-intensity scenarios.
Further, the confusion matrices reinforce that early-warning thresholds (94.3rd for WSB; 75.1st for RBB) yield the most operationally reliable models, since outbreak cases are sufficiently represented for the classifiers to balance recall and precision. By contrast, the severe thresholds (98.9th for WSB; 94.8th for RBB) serve primarily as sentinel cutoffs, where outbreak events are so rare that models either overfit to the majority class or sacrifice precision to capture the minority class. These patterns affirm the complementary value of adopting two-tiered thresholds, early-warning for practical monitoring and severe thresholds for risk signaling in extreme outbreak conditions.
3.5. SHAP-Based Feature Explainability
Figure 5 presents the SHAP summary plots for theWSB models at two percentile thresholds. For the CatBoost model at the 94.3rd percentile, the most influential variables were Year, GWETTOP (surface soil water content), and Week_Number, followed by WD2M, WS2M_MAX, and RH2M. These features displayed broad SHAP dispersions (approximately −6 to +4), indicating diverse sample-specific contributions to outbreak probability. Positive SHAP values were associated with later years, higher soil moisture, and later cropping weeks, suggesting that WSB activity intensifies under moist, late-season conditions. The Random Forest model at the 98.9th percentile revealed a consistent but narrower hierarchy (−0.2 to +0.1). Year, Week_Number, and GWETTOP again dominated the ranking, with RH2M, T2M_MIN, and WD2M showing moderate importance. Although the magnitude of SHAP effects was smaller, the same environmental drivers prevailed, implying stable variable importance across thresholds and algorithms.
Figure 5.
SHAP summary plots for White Stemborer (WSB) models at the 94.3rd (CatBoost) and 98.9th (Random Forest) percentiles. Key predictors include Week_Number, GWETTOP (surface soil moisture), T2M_MIN (minimum air temperature), RH2M (relative humidity), PRECTOTCORR (rainfall), and wind variables (WD2M, WS2M_MAX). The models also captured a subtle lunar phase signal, with higher outbreak probabilities under darker nights (New Moon), consistent with nocturnal oviposition behavior.
Figure 6 shows the SHAP results for the RBB models. In the Logistic Regression model (75.1st percentile), early-warning outbreaks were primarily driven by Week_Number, WS2M_MAX, and selected Moon_Category encodings, while T2M_MAX, T2M_MIN, and WS2M_MIN contributed secondary effects. The SHAP distributions were symmetric and centered, consistent with the linear behavior of the logistic model. For the CatBoost model (94.8th percentile), feature interactions became more pronounced: Week_Number, T2M_MIN, WS2M_MIN, WD2M, and PRECTOTCORR exerted the strongest influences, followed by GWETTOP and RH2M. The broader SHAP range (−4 to +3) indicates that severe RBB outbreaks were shaped by stronger and more nonlinear climatic responses than the early-warning regime. Overall, both pests’ models consistently ranked seasonal timing, microclimate, and wind parameters as the dominant outbreak determinants.
Figure 6.
SHAP summary plots for Rice Black Bug (RBB) models at the 75.1st (Logistic Regression) and 94.8th (CatBoost) percentiles. Dominant predictors include Week_Number, T2M_MIN (minimum air temperature), WS2M_MAX (maximum wind speed), WD2M (wind direction), PRECTOTCORR (precipitation), and GWETTOP (surface soil moisture). Lunar phase (Moon_Category_4, Full Moon) exhibited a notable positive contribution, indicating higher trap captures during illuminated nights, consistent with RBB’s attraction to light and increased surface activity under bright moonlight.
4. Discussion
The implications of these findings extend beyond model benchmarking. It aligns with recent work in ecological remote sensing, where ensemble algorithms such as CatBoost and Random Forest consistently outperformed traditional models in predicting forest aboveground biomass [60]. A similar pattern is also evident in healthcare applications, such as the study of Omar et al. [57], where Gradient Boosted Trees and Random Forest achieved superior performance in predicting acute kidney injury after cardiac surgery, while Logistic Regression provided a balanced trade-off between sensitivity and specificity [61]. Similarly, Velarde et al. [62] demonstrated that tree boosting methods such as XGBoost and its variants are highly effective under imbalanced datasets, maintaining superior F1 scores even as class imbalance increases, though they noted that naive sampling strategies often reduce detection accuracy. Their results further highlighted the importance of careful hyperparameter tuning and retraining over time to preserve performance stability under shifting data distributions. Taken together, these cross-domain comparisons highlight the robustness of ensemble methods for handling complex, nonlinear, and imbalanced data, while also reaffirming the continued value of simpler models like Logistic Regression in early-warning scenarios where interpretability and balanced performance are critical.
4.1. Utility of the N–S Fractal Model for Outbreak Thresholds
The application of the N-S fractal model provided a statistically robust approach to defining outbreak thresholds under the highly skewed pest count distributions observed for both WSB and RBB [63]. Unlike fixed cut-off values that may arbitrarily split data, the N–S approach identifies slope changes in the complementary cumulative distribution function (CCDF) of log-transformed pest counts, thereby revealing natural breakpoints in population structure. These breakpoints delineate three epidemiologically meaningful regimes such as background, elevated activity (early warning), and severe outbreak. Such data-driven thresholds ensure that rare but epidemiologically significant outbreaks are not masked by routine fluctuations [64].
For WSB (Figure 2), the fractal analysis detected an early warning threshold at 134 individuals (94.3rd percentile) and a severe outbreak threshold at 250 individuals (98.9th percentile). This indicates that WSB populations remain relatively low during most observation periods but can exhibit sudden, sharp escalations into outbreak levels even with relatively modest absolute counts. The narrow range between elevated and severe regimes reflects the insect’s episodic and explosive nature, consistent with its life history traits, which include synchronized moth emergence and rapid larval infestations in rice fields [12].
In contrast, RBB displayed a much broader distribution tail (Figure 1). The early warning threshold emerged at 575 individuals (75.1st percentile), while the severe outbreak threshold was at 11,383 individuals (94.8th percentile). This wide gap between early and severe thresholds highlights RBB’s capacity to persist at moderate densities for extended periods before escalating into massive outbreaks. The heavier tail in RBB counts underscores its role as a chronic pest capable of building populations across multiple cropping cycles, particularly under favorable conditions such as prolonged flooding and high humidity [13,65].
The contrasting threshold dynamics between WSB and RBB emphasize that species-specific outbreak ecology is embedded in their population distributions. WSB’s thresholds are compressed and highly sensitive to small increases in adult captures, making early detection crucial for intervention. Since the most damaging stage is the larval phase, where stem-boring activity produces deadhearts and whiteheads, intervention should follow once adults rise above early-warning levels, as larval populations typically increase in the following weeks. Operational guidelines set the ETL for WSB at >30% deadhearts during the vegetative phase, >20% whiteheads during the reproductive to maturity stages, or the presence of one egg mass per m2, each of which indicates the need for control [9,12,66]. By comparison, RBB requires sustained monitoring since elevated activity may persist below severe thresholds for longer durations as this pest is nocturnal and its mass flights are strongly influenced by moon phases, with synchronous dispersal during full moons often triggering sudden and widespread infestations [3,13]. Economic thresholds for RBB are reached when ≥20% of hills show damage or when ≥10 nymphs or adults per hill are observed during tillering, while severe outbreaks are marked by bugburn symptoms that can result in near-total yield loss [9,10,11].
Importantly, both cases illustrate the advantage of the N–S fractal method. It yields thresholds that are both statistically defensible and ecologically interpretable, aligning with prior applications of fractal and percentile-based approaches in heavy-tailed ecological and epidemiological datasets [67,68,69]. Furthermore, these findings validate the fractal framework as an effective tool for translating raw light trap counts into operational outbreak indicators. In practical terms, the early-warning thresholds (134 for WSB, 575 for RBB) provide actionable triggers for field surveillance and targeted interventions, while the severe thresholds (250 for WSB, 11,383 for RBB) function as sentinel markers, signaling extreme but rare outbreak risks that demand urgent response.
4.2. Ecological Interpretation of SHAP-Derived Model Behavior
The SHAP patterns reveal clear, mechanistic links between climatic variability, seasonal timing, and pest outbreak risk. For the Rice Black Bug (RBB), Week_Number consistently showed the largest positive SHAP values across both percentile regimes, highlighting the dominant influence of seasonal progression on pest dynamics. Later cropping weeks (yellow points on the right side of the SHAP axis) corresponded to higher outbreak probabilities, reflecting the typical population buildup of RBB after panicle initiation and heading stages. This aligns with field observations that adult RBB abundance peaks during late-season rice growth when canopy density, humidity, and grain availability are highest [70].
In the early-warning regime (Logistic Regression, P75.1), Week_Number, WS2M_MAX, and selected Moon_Category variables dominated model influence, indicating that temporal and meteorological factors jointly regulate early population surges. Moderate wind speeds promote short-range dispersal and aggregation, whereas strong gusts can disperse adults away from host stands, producing the balanced SHAP distribution near zero [71,72]. Moreover, the lunar phase variable (Moon_Category) was numerically represented and was one-shot-encoded prior to modeling. The dataset exhibited occurrences across all eight phases, with slightly higher frequencies in categories 2–4 (First Quarter to Full Moon). Notably, Moon_Category_4 (Full Moon) generated distinctly positive SHAP values, indicating a stronger contribution to RBB outbreak probability. This suggests that, in contrast to many nocturnal species, RBB activity in this dataset was higher during full moon periods. Such behavior could be attributed to increased ambient brightness that facilitates visual aggregation and mate-finding on rice stages, or to lower relative humidity and precipitation typically coinciding with clearer moonlit nights [21]. These results imply that RBB flight and aggregation are less light-averse and may be more tightly coupled to the drier, calmer microclimates associated with full moon periods.
In the severe regime (CatBoost, P94.8), nonlinear responses were dominated by T2M_MIN, WS2M_MIN, and WD2M, indicating that warm, humid nights with gentle winds foster aggregation and outbreak events, while turbulent or cooler conditions inhibit activity. The positive SHAP contributions of GWETTOP (surface soil moisture) and PRECTOTCORR (precipitation) confirm that moist, intermittently flooded conditions enhance survival near levees and the base of rice plants, consistent with RBB’s habit of sheltering in humid zones during the day [73,74]. Relative humidity (RH2M) and rainfall effects were asymmetric—moderate humidity and light rain support longevity, whereas prolonged wet or windy episodes suppress flight [44]. Overall, the RBB SHAP signatures indicate that outbreak likelihood peaks during late-season warm, calm, and relatively dry nights, with the Full Moon phase emerging as an additional ecological amplifier of activity.
For the WSB, both percentile models emphasized Week_Number, GWETTOP, T2M_MIN, RH2M, PRECTOTCORR, and selected lunar categories as key predictors. Higher Week_Number values again corresponded to later cropping stages when eggs and larvae encounter optimal temperature and moisture regimes. Warm nights and elevated humidity reduce egg desiccation and improve hatch success [44,75], while waterlogged or saturated soils facilitate larval entry into rice tillers and minimize mortality during the post-hatch crawl [73,74]. The SHAP distributions for GWETTOP and T2M_MIN were positively skewed, showing that higher soil moisture and nighttime temperature consistently shift predictions toward higher outbreak risk.
Rainfall (PRECTOTCORR) also exhibited a clear asymmetric pattern in the SHAP plots. Moderate rainfall events contributed positively to outbreak probability, whereas extreme or prolonged rain depressed model predictions. This suggests that intermittent precipitation maintains a favorable surface microclimate for oviposition and larval establishment by sustaining shallow water layers without inundating stems, while excessive rainfall may submerge tillers, dislodge eggs, or drown early instars. Similar rainfall-dependent recruitment responses of stem borers have been observed in tropical Asia, where rainfall timing rather than total accumulation determines survival across developmental stages [44,73].
Wind-related variables (WD2M and WS2M_MAX) exhibited dual ecological roles. First is that persistent, aligned wind directions act as dispersal corridors that enhance the immigration of gravid moths, while second, extreme wind speeds disrupt sustained flight and oviposition, reflected by the negative SHAP tails [71,72]. The differences between the two percentile thresholds (CatBoost at 94.3 and Random Forest at 98.9) indicate that as the threshold tightens toward the “severe” regime, models rely increasingly on macro-scale cues such as Week_Number, Year, and WD2M. These shifts correspond to ecological conditions favoring synchronized, landscape-level dispersal events—warm, humid, and moderately calm nights that promote mass oviposition and larval establishment across fields [70].
In contrast to RBB, the lunar phase variables (Moon_Category) contributed weakly to WSB prediction, though one phase—Moon_Category_0 (New Moon)—showed a slight but consistent positive SHAP displacement. This implies that darker nights marginally increased the predicted likelihood of WSB activity, whereas all other phases remained near zero contribution. Ecologically, this weak patten is reasonable. Newly emerged WSB adults tend to fly and oviposit under low-light, humid, and thermally stable conditions near the canopy base, where visual cues are limited and predation risk is reduced [21]. In contrast, brighter phases such as Full Moon (Moon_Category_4) may slightly suppress flight due to increased exposure and reduced orientation to host cues. Overall, while moonlight exerts only a minor influence compared with edaphic and climatic drivers, the models captured a small but biologically coherent enhancement of WSB risk during darker lunar phases.
4.3. Performance of Models at Early-Warning Thresholds
The results demonstrate that model performance varied considerably depending on the outbreak regime defined by the N–S fractal thresholds. At early-warning thresholds, classifiers benefited from a relatively balanced distribution of outbreak and non-outbreak cases, which supported higher F1 scores and more consistent recall. For WSB, both CatBoost and Balanced Bagging achieved high recall (0.750 and 1.000, respectively), with CatBoost providing superior F1 scores and ROC–AUC values, while Balanced Bagging excelled in sensitivity, making it effective for minimizing missed detections. For RBB, Logistic Regression with transformed features emerged as the most effective early-warning model, achieving recall of 0.722 and an F1 score of 0.520, demonstrating the continued utility of simpler and interpretable models when outbreak signals are still moderate. By contrast, the severe-outbreak thresholds reflected the highly skewed, heavy-tailed nature of pest populations. Here, most classifiers collapsed toward majority-class predictions, achieving high overall accuracy but very low recall. CatBoost stood out under this regime, particularly for RBB, where its gradient-boosting architecture enabled it to maintain perfect precision and high AUC despite the scarcity of positive cases. Moreover, these findings illustrate how heavy-tailed ecological and epidemiological datasets such as pest outbreak counts benefit from fractal or percentile-based thresholding to identify meaningful breakpoints. Similar statistical challenges have been documented across ecological systems, from the cost dynamics of invasive species [76] to the forecasting of vector-borne disease epidemics [77], where rare but high-impact events define overall system risk.
The classifiers performed differently because they model nonlinear climate–pest interactions and imbalanced outbreak data in distinct ways. Ensemble methods such as CatBoost and Random Forest can learn complex feature interactions and reweight rare outbreak samples more effectively, resulting in greater sensitivity to extreme events. In contrast, linear or kernel-based models such as SVM and Logistic Regression are less flexible under these ecological data conditions, where variables interact nonlinearly and classes are highly skewed. Consequently, each algorithm captured different aspects of the outbreak signal, leading to diverse accuracy and recall results, consistent with findings that ensemble learning provides superior adaptability for imbalanced datasets compared to linear models [78,79].
Our results also align with ML applications across diverse high-stakes domains. In ecological remote sensing, ensemble methods such as CatBoost and Random Forest outperformed traditional models in predicting forest aboveground biomass [60]. In agriculture, CatBoost has been successfully applied to ecological suitability mapping, where an SSA-optimized CatBoost classifier produced the most accurate classification of blueberry cultivation areas, surpassing Logistic Regression, SVM, and Random Forest [80]. In education, hybrid CatBoost models optimized with metaheuristic algorithms demonstrated superior accuracy in predicting student academic performance compared to conventional methods [81], while a comparative study on student retention at an institution showed that XGBoost delivered the highest predictive performance, followed closely by Gradient Boosting and ANN, with Logistic Regression and Naïve Bayes offering higher recall but excessive false positives [82]. In healthcare, Gradient Boosted Trees and Random Forest were the best-performing models for predicting acute kidney injury after cardiac surgery, with Logistic Regression offering a balanced sensitivity, specificity trade-off [57]. Similarly, in COVID-19 risk prediction for diabetic patients, CatBoost achieved the highest overall accuracy, precision, recall, and F1 score, outperforming Logistic Regression and XGBoost [83]. In gastrointestinal bleeding risk assessment, CatBoost and XGBoost achieved significantly higher predictive accuracy (AUC 0.77–0.84) than conventional clinical scoring systems such as GBS and Rockall [84]. Finally, Velarde et al. [62] confirmed that tree boosting methods remain robust under severe class imbalance, outperforming baseline precision–recall expectations and demonstrating resilience to temporal variation when appropriately retrained. Fruthermore, this convergence across agriculture, forestry, education, and medicine highlights two key insights. First, tree-based ensembles such as CatBoost, Gradient Boosted Trees, and Random Forest consistently excel when learning complex, nonlinear relationships from imbalanced datasets. Second, simpler models like Logistic Regression retain value in early-warning scenarios where interpretability and balanced performance are critical. For integrated pest management (IPM), this suggests a tiered strategy such as Logistic Regression or bagging methods can support routine surveillance and early detection, while boosting ensembles such as CatBoost provide high-confidence classification of severe outbreaks that demand urgent, resource-intensive intervention.
4.4. Fractal and Not Other Thresholding Frameworks
Beyond its empirical performance, the N-S fractal model provides a theoretical foundation that bridges ecological scaling and outbreak dynamics. Fractal (scale-invariant) methods, although idealized, have long described how biological and ecological systems exhibit self-similar organization across spatial and temporal scales [85]. In outbreak ecology, Soukhovolsky et al. [86] demonstrated that insect-damage boundaries possess fractal dimensions (D = 1.4-1.5), showing that pest spread often follows geometric scaling rather than random dispersion. Similarly, Zhang et al. [87] reported that fractal scale-free networks exhibit nonzero epidemic thresholds, a critical point below which outbreaks cannot sustain, indicating that self-similar structures naturally encode regime boundaries. These insights support the conceptual basis of the N-S fractal model, which interprets outbreak thresholds as emergent from the intrinsic scaling geometry of pest populations.
For instance, in WSB, the narrow fractal gap between the early-warning (134 counts; P94.3) and severe threshold (250 counts; P98.9) signifies rapid geometric escalation, consistent with the moth’s synchronized nocturnal emergence and short-range dispersal behavior. This pattern reflects a “burst-like” scale regime, where small increases in adult captures mark an impending outbreak. In contrast, RBB displayed a much broader scaling interval (575 to 11,383 counts), representing a long-memory accumulation process before outbreak. This slower buildup, often tied to lunar-driven mass flights and submergence-tolerant ecology, exemplifies a heavy-tailed scaling regime. The N–S fractal framework naturally accommodates both types, distinguishing episodic versus accumulative outbreak patterns.
By contrast, Extreme Value Theory (EVT) offers rigorous statistical treatment of tail extremes [88], making it powerful for identifying rare, high-impact events. However, EVT’s sensitivity to tail-fitting, block size, and threshold selection often limits its ecological interpretability, particularly under heavy-tailed pest data. Change Point Detection (CPD) methods, meanwhile, directly seek statistical regime shifts in time series like the shifts in mean and variance, and have broad usage in ecological and environmental time-series literature. Dierckx et al. [89] developed change point analysis specifically for extreme values such as asking whether the tail behavior changes over time, and more generally, the recent framework of Pélissié et al. [90] classified time series trajectories as “no change, linear, nonlinear, abrupt,” allowing more nuanced detection of structural shifts.
Putting this together, a fractal thresholding approach has the advantage of linking outbreak thresholds to intrinsic multiscale geometry of the phenomenon, which empirical outbreak spatial patterns and theoretical network models suggest may carry real fractal structure [86,87]. Meanwhile, EVT gives rigorous probabilistic thresholds for rare extremes but may fail to locate the boundary between “normal but high” and “outbreak” regimes in a biologically meaningful way. CPD can locate structural breaks in time, but may struggle in data with continuous, gradual transitions or heavy tails. Thus, when the pest outbreaks display spatial or temporal scaling behavior and outbreak structure has self-similarity, the N-S fractal method can be more attuned to detecting change points in regime levels, not just abrupt shifts or tail outliers.
4.5. Challenges at Severe Outbreak Thresholds
Our results show that at severe thresholds (98.9th for WSB; 94.8th for RBB), classifier performance declined sharply, nearly all models defaulted to majority-class predictions, leading to high accuracy (>0.95) but near-zero recall. This mirrors a well-known limitation in ML when applied to rare event prediction. As Shyalika et al. [91] review, imbalanced data skews training such that minority classes where the very events of highest practical importance, are poorly represented, leading to models that generalize well on common cases but collapse under extremes. This is precisely what we observed where CatBoost, which excelled at early-warning thresholds, could only recognize the clearest severe outbreaks but failed to capture subtler ones.
Yet, our findings partially diverge from theoretical expectations. Mossel and Ohannessian [92] argued that it is impossible to estimate the probability of rare or unseen events without additional structural assumptions. Their work suggests that severe outbreaks, being sparse and heavy-tailed, should be fundamentally unpredictable with standard supervised learning. However, in our study, CatBoost still achieved perfect precision at the RBB severe threshold, implying that ML can, at least, reliably capture the most extreme signals even if recall remains poor. This indicates that while the probability of unseen events cannot be perfectly learned, strong classifiers can still flag well-defined outbreak signatures embedded in climate–pest interactions.
A second layer of complexity arises from the drivers of ecological extremes. Zscheischler and Seneviratne [93] showed that compound extremes such as simultaneous heat and drought, are often more damaging than univariate extremes, and that co-occurrence increases their frequency and unpredictability. This resonates with our violin plots of climate predictors and moon-phase distributions, which showed clustering patterns coinciding with pest surges. Severe pest outbreaks, therefore, cannot be reduced to a single factor such as the rainfall spike or temperature anomaly, but instead emerge from compound, interacting stressors such as humidity, wind direction, soil moisture, and lunar cycles. In this respect, our results align with ecological theory where outbreaks represent the “compound-event” problem in agroecology.
However, there is some contradiction when comparing across domains. Teshome et al. [94], reviewing forestry responses to combined biotic and abiotic stresses, emphasized that interaction effects make attribution and prediction inherently uncertain. Our models, while limited, still found stable thresholds through the N–S fractal method that separated background, elevated, and severe regimes. This suggests that in contrast to forestry or epidemiological datasets where multiple unobserved drivers may interact, our pest surveillance system provided sufficient temporal resolution and environmental covariates to identify interpretable breakpoints, even if predictive accuracy deteriorated at extremes. Further, the work of Velarde et al. [62] complements our observations by showing that tree boosting methods remain robust under moderate imbalance but deteriorate under extreme imbalance. Our results confirm that CatBoost excelled at early-warning (moderate imbalance), but collapsed in recall under severe thresholds (extreme imbalance). Where our study adds nuance is in demonstrating that precision can remain high even as recall deteriorates, a practical trade-off in pest management, where false alarms are costly but missing an extreme outbreak is catastrophic.
Further, despite the observed decline in recall at the severe-outbreak thresholds (P98.9 for WSB; P94.8 for RBB), this outcome is an inherent characteristic of rare-event ecology rather than a model failure. The heavy-tailed nature of pest distributions means that only 1 to 2 percent of cases reach extreme magnitudes, limiting the number of positive samples available for training. Consequently, classifiers tend to favor majority-class stability over sensitivity at the distribution tails. The proposed framework therefore operates as a progressive, multi-threshold system, where the early-warning regime provides actionable forecasts for surveillance and management, and the severe regime functions as a sentinel layer for detecting high-risk conditions. This design maintains operational relevance by enabling proactive intervention opportunities, even when precise prediction of rare events remains statistically constrained.
4.6. Value of Feature Transformation
Across both pests and thresholds, transformed models consistently outperformed or matched baseline performance. Standardization of numeric features and one-hot encoding of categorical variables (e.g., moon phase) ensured that predictors contributed proportionally to model training, reducing dominance by high-magnitude climate variables and avoiding artificial ordinality in categorical features. These transformations effectively regularized the feature space, improving learning stability across diverse classifiers. Gains were most notable in linear models such as Logistic Regression, where recall increased substantially under transformed pipelines (e.g., RBB at P75.1), demonstrating improved sensitivity to minority classes. In addition, embedded class-weight adjustments mitigated imbalance by penalizing misclassification of outbreak cases, an essential mechanism at higher thresholds where outbreaks are underrepresented. These improvements corroborate prior evidence that preprocessing and balanced learning pipelines enhance ecological prediction tasks where skew and imbalance are structural features of the data [62,95]. Importantly, while ensemble methods (CatBoost, LightGBM) remained robust, their relative gains under transformation were more modest, reflecting their inherent ability to handle unscaled and categorical data. This suggests that transformation primarily benefits simpler or linear models, while still stabilizing ensemble approaches.
4.7. Operational Implications for Pest Management
The complementary performance of early-warning and severe thresholds underscores the value of a two-tiered surveillance strategy. Early-warning thresholds (e.g., WSB P94.3, RBB P75.1) showed higher recall and F1 values, making them suitable for proactive decision-making by farmers and extension workers. These thresholds enable interventions before populations reach damaging levels, aligning with integrated pest management (IPM) principles of timely action [9,18]. This approach resonates with the ETL framework, where management is initiated only when pest densities threaten to cause yield losses that exceed the cost of control. For instance, ETLs for WSB are set at >30% deadhearts in the vegetative phase or >20% whiteheads in reproductive phase, while for RBB, ETLs are typically ≥20% damaged hills or ≥10 bugs/hill at tillering [9,66,96]. Result of the present study suggest that fractal-based early-warning thresholds offer a statistically defensible complement to ETLs, bridging between raw light-trap counts and field-observable damage indicators.
In contrast, severe thresholds (WSB P98.9, RBB P94.8) function more as sentinel markers. While their predictive precision is high, recall is low, meaning they are better suited for identifying rare but catastrophic outbreaks. This dichotomy parallels practices in plant pathology and public health, where “alert” thresholds guide preventive measures and “alarm” thresholds trigger emergency responses [97]. For PhilRice Midsayap, this implies differentiated responsibilities. Early-warning thresholds could support farmer advisories, training, and localized interventions, while severe thresholds may warrant regional escalation, mobilizing additional monitoring teams, coordinating with DA-RFO and LGUs, or initiating targeted research into outbreak triggers such as lunar phasing, rainfall anomalies, or planting synchrony.
From a policy perspective, adopting fractal-based thresholds provides ecological justification for risk stratification in pest management. It reduces the risk of premature or unnecessary pesticide applications [98], one of the recurring challenges in Philippine rice ecosystems [3] while safeguarding against the catastrophic yield losses that result when action is delayed. By institutionalizing a two-tiered system, PhilRice Midsayap can operationalize thresholds as both advisory and sentinel tools: (i) advisory thresholds integrated into PalayCheck farmer field schools and extension programs, and (ii) sentinel thresholds embedded in regional surveillance networks to trigger contingency planning. This tiered strategy ensures that interventions are timely, proportional, and resource-efficient, advancing the principles of IPM while strengthening farmer resilience against both chronic and episodic pest pressures.
4.8. Limitations, Challenges, and Future Work
While the use of N–S fractal thresholds and ML classifiers provided valuable insights into outbreak prediction, several limitations must be acknowledged. First, the rarity of extreme outbreak events (e.g., P98.9 for WSB and P94.8 for RBB) constrained the availability of positive cases, which limited the capacity of models to generalize beyond the training data. This data sparsity problem is a common issue in ecological and epidemiological extremes, where the statistical tails of distributions are poorly populated [99,100]. As a result, most models defaulted to majority-class predictions, achieving high accuracy but failing to capture true outbreaks.
Second, although applying standard feature transformation, such as scaling and one-hot encoding, improved sensitivity for linear models, this strategy does not address important aspects such as temporal autocorrelation or nonstationary in pest–climate time series. Traditional ML pipelines often overlook the fact that ecological relationships evolve over time and can exhibit scale-specific patterns. Hence, to better capture these dynamics, future research should explore advanced feature engineering methods. For instance, lagged climate predictors provide a straightforward way to incorporate delayed pest responses to environmental changes. Recent work has shown that adaptive lag schemes can significantly improve predictive performance for complex environmental time series [101].
For nonstationary and scale-dependent behavior, wavelet decomposition offers a powerful approach. Ecological studies have leveraged continuous wavelet transforms to uncover transient associations such as shifting links between climatic oscillations and disease incidence that traditional methods fail to detect [102]. More recently, wavelet-based decomposition combined with ML has been shown to enhance agricultural pest outbreak prediction [103]. In addition, hybrid time-series approaches that combine classical statistical methods with deep learning, such as ARIMA–LSTM architectures, have proven effective in agricultural forecasting tasks. These models capture both linear trends and nonlinear dynamics, delivering higher accuracy than either approach alone [104]. Further, integrating these methods such as lagged features, wavelet-based decomposition, and hybrid modeling, would provide a richer foundation for pest forecasting models, capturing delayed effects, scale-specific patterns, and evolving dynamics more effectively than current preprocessing pipelines.
Third, the present models were evaluated under controlled cross-validation schemes, which may not fully capture the spatial processes driving pest dynamics across heterogeneous rice landscapes. While our framework integrates climate variability and temporal seasonality, it does not account for spatial connectivity between fields, which influences how outbreaks emerge, persist, and spread. Wildemeersch et al. [105] demonstrated that pest outbreak cycles are shaped by both small-scale host–pest interactions and larger-scale landscape connectivity, with outbreak behavior being most sensitive to changes in local pest pressure. Their findings suggest that incorporating spatial heterogeneity and habitat connectivity into forecasting models is crucial to better reflect field-level variability and outbreak spread. Building on this perspective, future research could integrate spatially explicit monitoring networks or landscape-level covariates into ML pipelines, thereby enhancing the ecological realism and portability of outbreak forecasts across regions and production systems.
Furthermore, this study utilized a single-site dataset from PhilRice Midsayap, which provides the longest continuous pest–climate record currently available in Mindanao. While this ensured data consistency and temporal completeness, it also limits the spatial generalizability of the derived fractal thresholds and trained models. The absence of detailed agronomic and management-level covariates such as fertilization schedules, irrigation practices, varietal resistance, pesticide use, and soil nutrient profiles, further constrains the ecological completeness of the model, as these factors were not consistently documented during the monitoring period and were therefore excluded to preserve dataset integrity. Addressing these gaps will require integrating multi-site datasets from other PhilRice monitoring stations representing diverse agro-ecological zones, along with IoT-enabled field sensors, soil probes, and farmer-reported management logs to support multi-factor modeling that links climatic, agronomic, and edaphic processes. Future research should also explore the integration of spatio-temporal monitoring networks and remote-sensing data, as well as the application of extreme value theory (EVT) and Bayesian hierarchical models to improve the characterization of rare, high-severity outbreaks. Finally, coupling predictive algorithms with decision-support frameworks for integrated pest management (IPM) would enhance the operational utility of models, ensuring that early-warning signals translate into timely and actionable farmer interventions.
5. Conclusions
This study demonstrated the effectiveness of integrating the N–S fractal model with ML classifiers for forecasting outbreaks of the RBB and WSB, two major pests that severely threaten rice productivity in the Philippines. By analyzing seven years of continuous light-trap data and corresponding NASA POWER climate variables, the study established statistically grounded outbreak thresholds that captured the natural scaling behavior of pest populations. The fractal model objectively delineated early-warning and severe-outbreak regimes, replacing arbitrary ETL values with data-driven breakpoints that more accurately reflect real population dynamics. Ensemble methods, particularly CatBoost, excelled in capturing complex, nonlinear pest–climate interactions, while Logistic Regression offered high interpretability and balanced recall for early-warning predictions. SHAP-based explainability confirmed that warm nighttime temperatures, high soil moisture, moderate humidity, calm winds, and seasonal timing were the dominant predictors of outbreak risk. Findings align with known ecological mechanisms linking nocturnal pest activity to warm, humid, and stable microclimates during late cropping stages and favorable lunar phases.
The two-tiered threshold design presents significant operational and policy value for integrated pest management (IPM). Early-warning thresholds (WSB at the 94.3rd percentile; RBB at the 75.1st percentile) provide actionable guidance for field surveillance and preventive control, while severe-outbreak thresholds (WSB at the 98.9th percentile; RBB at the 94.8th percentile) serve as sentinel indicators for regional alerts and coordinated management responses. This framework supports sustainable agricultural decision-making by optimizing pesticide use, reducing production costs, and minimizing environmental risks, thereby contributing to food security and climate resilience in smallholder rice systems. Although model performance declined under extreme class imbalance, this reflects the rarity of severe events rather than methodological weakness. Future research should expand to multi-site validation across PhilRice stations, integrate IoT-based field sensors and farmer-reported data, and explore hybrid time-series or wavelet-based ML architectures to better capture delayed and nonstationary pest–climate interactions. Overall, the integration of fractal scaling theory, ML prediction, and SHAP-based interpretability provides a scientifically rigorous and operationally practical framework for intelligent pest forecasting in tropical rice ecosystems, offering a scalable, data-driven model for sustainable pest management across Southeast Asia.
Author Contributions
Conceptualization, G.D.B., S.E.A., C.G.F. and R.D.D.; Methodology, G.D.B., S.E.A., C.G.F. and R.D.D.; Software, R.D.D.; Validation, G.D.B., S.E.A., C.G.F. and R.D.D.; Formal analysis, R.D.D.; Investigation, G.D.B., S.E.A. and R.D.D.; Resources, C.G.F. and R.D.D.; Data curation, S.E.A., C.G.F. and R.D.D.; Writing—original draft, G.D.B. and R.D.D.; Writing—review & editing, G.D.B. and R.D.D.; Visualization, R.D.D.; Supervision, G.D.B., S.E.A. and R.D.D.; Project administration, G.D.B. and R.D.D.; Funding acquisition, S.E.A. All authors have read and agreed to the published version of the manuscript.
Funding
This research was funded by [Department of Agricuture—Philippine Rice Research Institute (DA-PhilRice)] grant number [TAS-300-000].
Institutional Review Board Statement
No Applicable.
Informed Consent Statement
No Applicable.
Data Availability Statement
The raw data supporting the conclusions of this article will be made available by the authors on request.
Acknowledgments
The authors gratefully acknowledge the Department of Agriculture—Philippine Rice Research Institute (DA–PhilRice), particularly the Midsayap Experimental Station, for providing pest monitoring data and facilitating field operations. Appreciation is also extended to the NASA POWER data portal team for providing high-quality climate datasets essential to the modeling process, to the developers of the open-source moon-data repository (https://github.com/isaacbernat/moon-data) accessed on 1 August 2025, for making lunar phase data available, and to the field technicians and research assistants whose dedication ensured consistent data collection.
Conflicts of Interest
The authors declare no conflicts of interest.
Abbreviations
The following abbreviations are used in this manuscript:
| RBB | Rice Black Bug (Scotinophara coarctata F.) |
| WSB | White Stemborer (Scirpophaga innotata W.) |
| IPM | Integrated Pest Management |
| N–S | Number–Size (Fractal Model) |
| VIF | Variance Inflation Factor |
| ML | Machine Learning |
| SVM | Support Vector Machine |
| ROC–AUC | Receiver Operating Characteristic—Area Under the Curve |
| F1 | Harmonic mean of Precision and Recall |
| T2M | Mean daily air temperature at 2 m height |
| T2M_MAX | Maximum daily air temperature |
| T2M_MIN | Minimum daily air temperature |
| RH2M | Mean daily relative humidity at 2 m height |
| PRECTOTCORR | Corrected total daily precipitation |
| WS2M | Mean daily wind speed at 2 m height |
| WS2M_MAX | Maximum daily wind speed at 2 m height |
| WS2M_MIN | Minimum daily wind speed at 2 m height |
| WD2M | Mean daily wind direction at 2 m height |
| GWETTOP | Soil moisture in the top 10 cm layer |
| CCDF | Complementary Cumulative Distribution Function |
References
- Fukagawa, N.K.; Ziska, L.H. Rice: Importance for global nutrition. J. Nutr. Sci. Vitaminol. 2019, 65, S2–S3. [Google Scholar] [CrossRef] [Scilit]
- Agricultural Indicators System: Food Consumption and Nutrition, 2019; Technical Report; Philippine Statistics Authority: Quezon City, Philippines, 2020.
- Litsinger, J.A.; Bandong, J.P.; Canapi, B.L.; Cruz, C.G.D.; Pantua, P.C.; Alviola, A.L.; Batay-An, E.H. Evaluation of action thresholds for chronic rice insect pests in the Philippines. IV. Stemborers. Int. J. Pest Manag. 2006, 52, 195–207. [Google Scholar] [CrossRef] [Scilit]
- Sepe, M.C.; Demayo, C.G. Quantitative Description of Head Shape Dimorphism in the Rice Black Bug Scotinophara sp. using Landmark-based Geometric Morphometric Analysis. J. Appl. Sci. Agric. 2014, 9, 263–270. [Google Scholar]
- Balleras, G.D.; Doverte, M.S.; Endonela, L.E. Alarming presence of three rice stem borer species in irrigated lowland rice agroecosystem in Midsayap, North Cotabato, Philippines. Zenodo (CERN Eur. Organ. Nucl. Res.) 2016, 9, 105–109. [Google Scholar] [CrossRef]
- Cabasan, M.T.N.; Tabora, J.A.G.; Cabatac, N.N.; Jumao-As, C.M.; Soberano, J.O.; Turba, J.V.; Dagamac, N.H.A.; Barlaan, E. Economic and ecological perspectives of farmers on rice insect pest management. Glob. J. Environ. Sci. Manag. 2019, 5, 31–42. [Google Scholar] [CrossRef] [Scilit]
- Sonico, M.G. Insect diversity in an organic rice farm in Brgy. Langkong, M’lang, North Cotabato, Philippines. Southeast. Philipp. J. Res. Dev. 2022, 27, 45–56. [Google Scholar] [CrossRef] [Scilit]
- Arida, G.S.; Tiongco, E.R. Field Guide on Sampling Insect Pests, Damaged and Diseased Plants, and Beneficial Organisms in the Rice Field: Devices and Techniques. Philippine Rice Research Institute (DA–PhilRice): Maligaya, Science City of Muñoz, Nueva Ecija, Philippines. 2021. Available online: https://www.pinoyrice.com/download/field-guide-on-sampling-insect-pests-2021/ (accessed on 4 August 2025).
- Department of Agriculture—Philippine Rice Research Institute (DA–PhilRice). PalayCheck System for Irrigated Lowland Rice (Transplanted/Direct Wet-Seeded): 2022 Revised Edition; DA–PhilRice: Maligaya, Science City of Muñoz, Nueva Ecija, Philippines, 2022; Available online: https://www.pinoyrice.com/download/palaycheck-system-for-irrigated-lowland-rice-transplanted-direct-wet-seeded-2022-revised-edition/ (accessed on 4 August 2025).
- Anandhi, P.; Elamathi, S.; Subrahmanian, K.; Sassikumar, K.; Elanchezhyan, K.; Venugopal, S. Ecological Engineering methods for the management of Rice Black Bug, Scotinophara lurida Burmeister (Pentatomidae: Hemiptera): An emerging pest in rice. Agric. Mech. Asia Afr. Lat. Am. (AMA) 2023, 54. [Google Scholar]
- Leena, G.; Anandhi, P.; Ambethgar, V.; Elamathi, S.; Subrahmaniyan, K.; Ganapati, P.S.; Venugopal, S. Rice black bug (Scotinophara sp.) status and ecological pest management practices in rice. J. Plant Dis. Prot. 2024, 131, 1819–1836. [Google Scholar] [CrossRef] [Scilit]
- Pathak, M.D.; Khan, Z.R. Insect Pests of Rice; International Rice Research Institute (IRRI): Los Baños, Laguna, Philippines, 1994; ISBN 971-22-0028-0. Available online: https://books.irri.org/9712200280_content.pdf (accessed on 4 August 2025).
- CABI International. Scotinophara coarctata (black rice bug). PlantwisePlus Knowledge Bank 2022, Species Pages. [Google Scholar] [CrossRef] [Scilit]
- Horgan, F.G. Revisiting research and methods in stemborer–rice interactions for integration into future breeding programs. CABI Reviews 2023, 39. [Google Scholar] [CrossRef] [Scilit]
- Ingram, W.E. The Lepidopterous Stalk Borers associated with Gramineae in Uganda. Bull. Entomol. Res. 1958, 49, 367–383. [Google Scholar] [CrossRef] [Scilit]
- Otake, A. An Analytical Study on the Injury to Rice Plants by the Rice Stem Borer, Chilo suppressalis WALKER (Lepidoptera: Pyralidae) in Its First Generation. Appl. Entomol. Zool. 1967, 2, 173–186. [Google Scholar] [CrossRef] [Scilit]
- Gomez, K.A.; Bernardo, R.C. Estimation of stem borer damage in rice fields. J. Econ. Entomol. 1974, 67, 509–513. [Google Scholar] [CrossRef] [Scilit]
- Heinrichs, E.A. Biology and Management of Rice Insects; International Rice Research Institute (IRRI): Los Baños, Laguna, Philippines, 1994; ISBN 81-224-0581-2. Available online: https://jameslitsinger.wordpress.com/wp-content/uploads/2014/12/biology-mgmt-of-rice-insects.pdf (accessed on 3 June 2025).
- Nickel, J.L. Biological Control of Rice Stem Borers: A Feasibility Study; International Rice Research Institute (IRRI): Los Baños, Laguna, Philippines, 1964. [Google Scholar] [CrossRef]
- Litsinger, J.A.; Alviola, A.L.; Cruz, C.G.D.; Canapi, B.L.; Batay-An, E.H., III; Barrion, A.T. Biology and pest status of the white rice stemborer Scirpophaga innotata (Walker) (Lepidoptera:Pyralidae) in southern Mindanao. Univ. Knowl. Digit. Repos. 2004, 18, 1–15. [Google Scholar]
- Gebresilassie, A.; Yared, S.; Aklilu, E.; Kirstein, O.; Moncaz, A.; Tekie, H.; Balkew, M.; Warburg, A.; Hailu, A.; Gebre-Michael, T. The influence of moonlight and lunar periodicity on the efficacy of CDC light trap in sampling Phlebotomus (Larroussius) rientalis Parrot, 1936 and other Phlebotomus sandflies (Diptera: Psychodidae) in Ethiopia. Parasites Vectors 2015, 8, 106. [Google Scholar] [CrossRef] [Scilit] [PubMed]
- Simpao, F.T.; Mendoza, K.M.; Basug, O.M.; Gelmo, G.S.; Villotes, R.P.; Andripa, K.D.; Aceres, L.V.; Eguia, R.E. IOT-based insect pests management system for rice fields. IOP Conf. Ser. Earth Environ. Sci. 2025, 1441, 012017. [Google Scholar] [CrossRef] [Scilit]
- Sarma, A.K.; Damgaard, C.F.; Saikia, M.; Neog, P. Rapid assessment and management of outbreak of Rice Swarming Caterpillar by drone: A BIG need of the hour. Front. Sustain. Food Syst. 2024, 8, 1361012. [Google Scholar] [CrossRef] [Scilit]
- Hashemi, M.; Afzal, P. Identification of geochemical anomalies by using of number–size (N–S) fractal model in Bardaskan area, NE Iran. Arab. J. Geosci. 2012, 6, 4785–4794. [Google Scholar] [CrossRef] [Scilit]
- Rahimi, H.; Asghari, O.; Hajizadeh, F. Selection of optimal thresholds for estimation and simulation based on indicator values of highly skewed distributions of ORE data. Nat. Resour. Res. 2018, 27, 437–453. [Google Scholar] [CrossRef] [Scilit]
- Nettleton, D.F.; Katsantonis, D.; Kalaitzidis, A.; Sarafijanovic-Djukic, N.; Puigdollers, P.; Confalonieri, R. Predicting rice blast disease: Machine learning versus process-based models. BMC Bioinform. 2019, 20, 514. [Google Scholar] [CrossRef] [Scilit]
- Gopalakrishnan, M.A.; Chellappan, G.; Patil, S.G.; Rathod, S.; Ayyanar, K.; Ramasamy, J.; Karuppasamy, S.N.; Swaminathan, M. Climate-Based prediction of rice blast disease using count time series and machine learning approaches. AgriEngineering 2024, 6, 4353–4371. [Google Scholar] [CrossRef] [Scilit]
- Zhao, G.; Zhao, Q.; Webber, H.; Johnen, A.; Rossi, V.; Nogueira, A.F., Jr. Integrating machine learning and change detection for enhanced crop disease forecasting in rice farming: A multi-regional study. Eur. J. Agron. 2024, 160, 127317. [Google Scholar] [CrossRef] [Scilit]
- Riswantini, D.; Nugraheni, E. Machine learning in handling disease outbreaks: A comprehensive review. Bull. Electr. Eng. Inform. 2022, 11, 2160–2168. [Google Scholar] [CrossRef] [Scilit]
- Skawsang, S.; Nagai, M.; Tripathi, N.K.; Soni, P. Predicting Rice Pest Population Occurrence with Satellite-Derived Crop Phenology, Ground Meteorological Observation, and Machine Learning: A Case Study for the Central Plain of Thailand. Appl. Sci. 2019, 9, 4846. [Google Scholar] [CrossRef] [Scilit]
- Singh, A.K.; Yeasin, M.; Paul, R.K.; Paul, A.K.; Sarkar, A. Dynamic ensemble-based machine learning models for predicting pest populations. Front. Appl. Math. Stat. 2024, 10, 1435517. [Google Scholar] [CrossRef] [Scilit]
- Dormann, C.F.; Elith, J.; Bacher, S.; Buchmann, C.; Carl, G.; Carré, G.; Marquéz, J.R.G.; Gruber, B.; Lafourcade, B.; Leitão, P.J.; et al. Collinearity: A review of methods to deal with it and a simulation study evaluating their performance. Ecography 2012, 36, 27–46. [Google Scholar] [CrossRef] [Scilit]
- Kubota, Y.; Shiono, T.; Kusumoto, B. Role of climate and geohistorical factors in driving plant richness patterns and endemicity on the east Asian continental islands. Ecography 2014, 38, 639–648. [Google Scholar] [CrossRef] [Scilit]
- Kumar, S.; Meena, R.S.; Sheoran, S.; Jangir, C.K.; Jhariya, M.K.; Banerjee, A.; Raj, A. Remote Sensing for Agriculture and Resource Management. In Conservation and Utilization of Natural Resources for Sustainable Development; Elsevier Inc.: Amsterdam, The Netherlands, 2022; pp. 91–135. [Google Scholar] [CrossRef] [Scilit]
- Mba, P.C.; Njoku, J.N.; Uyeh, D.D. Enhancing resilience in specialty crop production in a changing climate through smart systems adoption. Smart Agric. Technol. 2025, 11, 100897. [Google Scholar] [CrossRef] [Scilit]
- Grigorieva, E.; Livenets, A.; Stelmakh, E. Adaptation of Agriculture to climate Change: A scoping review. Climate 2023, 11, 202. [Google Scholar] [CrossRef] [Scilit]
- Zhou, W.; Arcot, Y.; Medina, R.F.; Bernal, J.; Cisneros-Zevallos, L.; Akbulut, M.E.S. Integrated Pest Management: An update on the Sustainability Approach to crop protection. ACS Omega 2024, 9, 41130–41147. [Google Scholar] [CrossRef] [Scilit]
- Ahenkora, K. A framework of the bioeconomy as a competitive strategy for sustainable development. Sustain. Environ. 2025, 11, 2487729. [Google Scholar] [CrossRef] [Scilit]
- Perišić, M.; Barceló, E.; Dimic-Misic, K.; Imani, M.; Brkić, V.S. The Role of Bioeconomy in the Future Energy Scenario: A State-of-the-Art Review. Sustainability 2022, 14, 560. [Google Scholar] [CrossRef] [Scilit]
- Van Aalst, M.; Koomen, E.; Tran, D.; Hoang, H.; Nguyen, H.; De Groot, H. The economic sustainability of rice farming and its influence on farmer decision-making in the upper Mekong delta, Vietnam. Agric. Water Manag. 2022, 276, 108018. [Google Scholar] [CrossRef] [Scilit]
- Tong, Y.D. Rice intensive cropping and balanced cropping in the Mekong Delta, Vietnam—Economic and ecological considerations. Ecol. Econ. 2016, 132, 205–212. [Google Scholar] [CrossRef] [Scilit]
- Kumar, A.; Ram, L.; Singh, R.; Singh, B. Biology and behavior of white stem borer (Scirpophaga fusciflua) on rice (Oryza sativa) in India. Indian J. Agric. Sci. 2018, 88, 1937–1940. [Google Scholar] [CrossRef] [Scilit]
- Zhang, Q.; Men, X.; Hui, C.; Ge, F.; Ouyang, F. Wheat yield losses from pests and pathogens in China. Agric. Ecosyst. Environ. 2021, 326, 107821. [Google Scholar] [CrossRef] [Scilit]
- Subedi, B.; Poudel, A.; Aryal, S. The impact of climate change on insect pest biology and ecology: Implications for pest management strategies, crop production, and food security. J. Agric. Food Res. 2023, 14, 100733. [Google Scholar] [CrossRef] [Scilit]
- Roy, T.K.; Kabir, M.M.M.; Akter, S.; Nayeem, A.; Alam, Z.; Hasan, M.R.; Bari, M.N.; Sannal, A. Seasonal variations of insect abundance: Correlating growth stage-specific metrics with weather patterns in Rangpur Region, Bangladesh. Heliyon 2024, 10, e38121. [Google Scholar] [CrossRef] [Scilit] [PubMed]
- Tamura, Y.; Osawa, T.; Tabuchi, K.; Yamasaki, K.; Niiyama, T.; Sudo, S.; Ishigooka, Y.; Yoshioka, A.; Takada, M.B. Estimating plant–insect interactions under climate change with limited data. Sci. Rep. 2022, 12, 10554. [Google Scholar] [CrossRef] [Scilit]
- Barker, B.S.; Coop, L. Phenological Mapping of Invasive Insects: Decision support for surveillance and management. Insects 2023, 15, 6. [Google Scholar] [CrossRef] [Scilit]
- Delena, R.D.; Tangkeko, M.S.; Sieras, J.C. From climate to crop: Unveiling the impact of agro-climate dataset on rice yield in Cotabato Province. Data Brief 2023, 51, 109754. [Google Scholar] [CrossRef] [Scilit] [PubMed]
- Oke, T.R. Urban Observations. In Guide to Meteorological Instruments and Methods of Observation, 7th ed.; World Meteorological Organization (WMO): Geneva, Switzerland, 2008. [Google Scholar]
- World Meteorological Organization (WMO). Guide to Meteorological Instruments and Methods of Observation (WMO-No. 8); Annex 1.B, Siting Classifications for Surface Observing Stations on Land (ISO/WMO Standard 19289:2014(E)); World Meteorological Organization: Geneva, Switzerland, 2014; Available online: https://www.eoas.ubc.ca/courses/atsc303/Instruments/wmo_guides/CIMO_Guide_2014-Met_Site_Classification.pdf (accessed on 3 July 2025).
- Ben Bouallègue, Z.; Cooper, F.; Chantry, M.; Düben, P.; Bechtold, P.; Sandu, I. Statistical modeling of 2-m temperature and 10-m wind speed errors using machine learning. Mon. Weather. Rev. 2023, 151, 897–911. [Google Scholar] [CrossRef] [Scilit]
- NASA. POWER: Data Methodology—Meteorology; NASA Langley Research Center: Hampton, VA, USA, 2024. Available online: https://power.larc.nasa.gov/docs/methodology/meteorology/ (accessed on 4 August 2025).
- Stull, R. Near-Surface Observations. In The Weather Observer’s Handbook; Cambridge University Press: Cambridge, UK, 2024; pp. 102–139. [Google Scholar] [CrossRef] [Scilit]
- Booth, G.D.; Niccolucci, M.J.; Schuster, E.G. Identifying Proxy Sets in Multiple Linear Regression: An Aid to Better Coefficient Interpretation; Research Paper INT-470; U.S. Department of Agriculture, Forest Service, Intermountain Research Station: Ogden, UT, USA, 1994. [Google Scholar]
- Choubin, B.; Khalighi-Sigaroodi, S.; Malekian, A.; Kişi, Ö. Multiple linear regression, multi-layer perceptron network and adaptive neuro-fuzzy inference system for forecasting precipitation based on large-scale climate signals. Hydrol. Sci. J. 2014, 61, 1001–1009. [Google Scholar] [CrossRef] [Scilit]
- Zaki, A.; Métwalli, A.; Aly, M.H.; Badawi, W.K. 5G and Beyond: Channel Classification Enhancement Using VIF-Driven Preprocessing and Machine Learning. Electronics 2023, 12, 3496. [Google Scholar] [CrossRef] [Scilit]
- Omar, E.D.; Mat, H.; Karim, A.Z.A.; Sanaudi, R.; Ibrahim, F.; Omar, M.A.; Ismail, M.Z.H.; Jayaraj, V.; Goh, B.L. Comparative analysis of logistic regression, gradient boosted trees, SVM, and random forest algorithms for prediction of acute kidney injury requiring dialysis after cardiac surgery. Int. J. Nephrol. Renov. Dis. 2024, 17, 197–204. [Google Scholar] [CrossRef] [Scilit]
- Lin, B.; Bai, R. Machine learning approaches for explaining determinants of the debt financing in heavy-polluting enterprises. Financ. Res. Lett. 2021, 44, 102094. [Google Scholar] [CrossRef] [Scilit]
- Hu, Y.; Shen, Y.; Li, Y.; Wang, Y.; Wang, Y.; Qiu, W.; Jia, H.; Cheng, K. Predictive optimization of educational buildings’ environmental performance under future climate scenarios using Catboost and SHAP. Sol. Energy 2025, 300, 113746. [Google Scholar] [CrossRef] [Scilit]
- Zhang, Y.; Ma, J.; Liang, S.; Li, X.; Li, M. An Evaluation of Eight Machine Learning Regression Algorithms for Forest Aboveground Biomass Estimation from Multiple Satellite Data Products. Remote Sens. 2020, 12, 4015. [Google Scholar] [CrossRef] [Scilit]
- Elkahwagy, D.M.A.S.; Kiriacos, C.J.; Mansour, M. Logistic regression and other statistical tools in diagnostic biomarker studies. Clin. Transl. Oncol. 2024, 26, 2172–2180. [Google Scholar] [CrossRef] [Scilit]
- Velarde, G.; Weichert, M.; Deshmunkh, A.; Deshmane, S.; Sudhir, A.; Sharma, K.; Joshi, V. Tree Boosting Methods for Balanced and Imbalanced Classification and their Robustness Over Time in Risk Assessment. Intell. Syst. Appl. 2024, 22, 200354. [Google Scholar] [CrossRef] [Scilit]
- Saein, L.D.; Rasa, I.; Omran, N.R.; Moarefvand, P.; Afzal, P.; Sadeghi, B. Application of Number-Size (N-S) Fractal Model to Quantify of the Vertical Distributions of Cu and Mo in Nowchun Porphyry Deposit (Kerman, Se Iran)/Zastosowanie modelu fraktalnego n-s (liczba-rozmiar) do ilościowego określenia pionowego rozkładu Cu i Mo w złożu porfirowym (Kerman, Iran). Arch. Min. Sci. 2013, 58, 89–105. [Google Scholar] [CrossRef] [Scilit]
- Lung, S.C.C.; Yeh, J.C.J.; Hwang, J.S. Selecting Thresholds of Heat-Warning Systems with Substantial Enhancement of Essential Population Health Outcomes for Facilitating Implementation. Int. J. Environ. Res. Public Health 2021, 18, 9506. [Google Scholar] [CrossRef] [Scilit] [PubMed]
- CABI International; General Directorate of Agriculture (GDA). Black bugs on rice. PlantwisePlus Knowl. Bank 2018. [CrossRef] [Scilit]
- Pinoy Rice Knowledge Bank. Rice Stem Borers in the Philippines; Technical Report; Philippine Rice Research Institute (PhilRice): Science City of Muñoz, Nueva Ecija, Philippines, 2023; Available online: https://www.pinoyrice.com/article/rice-stem-borers-in-the-philippines/ (accessed on 26 August 2025).
- Texier, G.; Farouh, M.; Pellegrin, L.; Jackson, M.L.; Meynard, J.B.; Deparis, X.; Chaudet, H. Outbreak definition by change point analysis: A tool for public health decision? BMC Med. Inform. Decis. Mak. 2016, 16, 33. [Google Scholar] [CrossRef] [Scilit] [PubMed]
- Cheng, Y.T.; Lung, S.C.C.; Hwang, J.S. New approach to identifying proper thresholds for a heat warning system using health risk increments. Environ. Res. 2018, 170, 282–292. [Google Scholar] [CrossRef] [Scilit]
- Gul, A.; Mohsin, M.; Adil, M.; Ali, M. A modified truncated distribution for modeling the heavy tail, engineering and environmental sciences data. PLoS ONE 2021, 16, e0249001. [Google Scholar] [CrossRef] [Scilit]
- Ali, M.P.; Bari, M.N.; Haque, S.S.; Kabir, M.M.M.; Nowrin, F.; Choudhury, T.R.; Mankin, R.W.; Ahmed, N. Response of a rice insect pest, Scirpophaga incertulas (Lepidoptera: Pyralidae) in warmer world. BMC Zool. 2020, 5, 6. [Google Scholar] [CrossRef] [Scilit]
- Li, G.; Wu, K.; Gould, F.; Wang, J.; Miao, J.; Gao, X.; Guo, Y. Increasing tolerance to Cry1Ac cotton from cotton bollworm, Helicoverpa armigera, was confirmed in Bt cotton farming area of China. Ecol. Entomol. 2007, 32, 366–375. [Google Scholar] [CrossRef] [Scilit]
- McManus, M.L. Weather, behaviour and insect dispersal. Memoirs of the Entomological Society of Canada 1988, 120, 71–94. [Google Scholar] [CrossRef] [Scilit]
- Dai, C.; Zhong, Y.; Yu, J.; Cheng, Y.; Hou, M. Behavioral and physiological adaptation to soil moisture in the overwintering larvae of the rice stem borer in the subtropics. Agriculture 2023, 13, 2177. [Google Scholar] [CrossRef] [Scilit]
- Royer, J.E.; Tan, K.H.; Mayer, D.G. Comparative trap catches of male bactrocera, dacus, and Zeugodacus fruit flies (Diptera: Tephritidae) with four floral phenylbutanoid lures (Anisyl acetone, Cue-Lure, raspberry ketone, and zingerone) in Queensland, Australia. Environ. Entomol. 2020, 49, 815–822. [Google Scholar] [CrossRef] [Scilit]
- Leather, S.R. The effect of temperature on oviposition, fecundity and egg hatch in the pine beauty moth, Panolis flammea (Lepidoptera: Noctuidae). Bull. Entomol. Res. 1994, 84, 515–520. [Google Scholar] [CrossRef] [Scilit]
- Diagne, C.; Leroy, B.; Vaissière, A.C.; Gozlan, R.E.; Roiz, D.; Jarić, I.; Salles, J.M.; Bradshaw, C.J.A.; Courchamp, F. High and rising economic costs of biological invasions worldwide. Nature 2021, 592, 571–576. [Google Scholar] [CrossRef] [Scilit]
- Baecher, J.A.; Akshay, V.A.; Guralnick, R.P.; Bauer, A.M.; Tavares, Y.N.; Sánchez, Y.; Thorson, J.T.; Campbell, L.P. Toward ecological forecasting of West Nile virus in Florida: Insights from two decades of sentinel chicken surveillance. Sci. Total Environ. 2025, 1000, 180308. [Google Scholar] [CrossRef] [Scilit] [PubMed]
- Chen, W.; Yang, K.; Yu, Z.; Shi, Y.; Chen, C.L.P. A survey on imbalanced learning: Latest research, applications and future directions. Artif. Intell. Rev. 2024, 57, 137. [Google Scholar] [CrossRef] [Scilit]
- Dube, L.; Verster, T. Enhancing classification performance in imbalanced datasets: A comparative analysis of machine learning models. Data Sci. Financ. Econ. 2023, 3, 354–379. [Google Scholar] [CrossRef] [Scilit]
- Chang, W.; Wang, X.; Yang, J.; Qin, T. An improved CatBoost-Based classification model for ecological suitability of blueberries. Sensors 2023, 23, 1811. [Google Scholar] [CrossRef] [Scilit]
- Hao, D.; Xiaoqi, Y.; Taoyu, Q. Hybrid machine learning models based on CATBoost classifier for assessing students’ academic performance. Int. J. Adv. Comput. Sci. Appl. 2024, 15, 94. [Google Scholar] [CrossRef] [Scilit]
- Delena, R.; Dia, N.; Sacayan, R.; Sieras, J.; Khalid, S.; Macatotong, A.H.; Gulam, S. Predicting Student Retention: A comparative study of machine learning approach utilizing sociodemographic and academic factors. Syst. Soft Comput. 2025, 7, 200352. [Google Scholar] [CrossRef] [Scilit]
- Aggarwal, A.; Chakradar, M.; Bhatia, M.S.; Kumar, M.; Stephan, T.; Gupta, S.K.; Alsamhi, S.H.; Al-Dois, H. COVID-19 risk prediction for diabetic patients using fuzzy inference system and machine learning approaches. J. Healthc. Eng. 2022, 2022, 1–10. [Google Scholar] [CrossRef] [Scilit]
- Boros, E.; Pintér, J.; Molontay, R.; Prószéky, K.G.; Vörhendi, N.; Simon, O.A.; Teutsch, B.; Pálinkás, D.; Frim, L.; Tari, E.; et al. New machine-learning models outperform conventional risk assessment tools in Gastrointestinal bleeding. Sci. Rep. 2025, 15, 6371. [Google Scholar] [CrossRef] [Scilit]
- Halley, J.M.; Hartley, S.; Kallimanis, A.S.; Kunin, W.E.; Lennon, J.J.; Sgardelis, S.P. Uses and abuses of fractal methodology in ecology. Ecol. Lett. 2004, 7, 254–271. [Google Scholar] [CrossRef] [Scilit]
- Soukhovolsky, V.; Kovalev, A.; Tarasova, O.; Ivanova, Y. Forest insect outbreak dynamics: Fractal properties, viscous fingers, and holographic principle. Forests 2023, 14, 2459. [Google Scholar] [CrossRef] [Scilit]
- Zhang, Z.; Zhou, S.; Zou, T.; Chen, G. Fractal scale-free networks resistant to disease spread. J. Stat. Mech. Theory Exp. 2008, 2008, P09008. [Google Scholar] [CrossRef] [Scilit]
- Guillou, A.; Kratz, M.; Le Strat, Y. An extreme value theory approach for the early detection of time clusters: A simulation-based assessment and an illustration to the surveillance of Salmonella. Stat. Med. 2014, 33, 5015–5027. [Google Scholar] [CrossRef] [Scilit] [PubMed]
- Dierckx, G.; Teugels, J.L. Change point analysis of extreme values. Environmetrics 2010, 21, 661–686. [Google Scholar] [CrossRef] [Scilit]
- Pélissié, M.; Devictor, V.; Dakos, V. A systematic approach for detecting abrupt shifts in ecological timeseries. Biol. Conserv. 2024, 290, 110429. [Google Scholar] [CrossRef] [Scilit]
- Shyalika, C.; Wickramarachchi, R.; Sheth, A.P. A comprehensive survey on rare event prediction. ACM Comput. Surv. 2025, 57, 70. [Google Scholar] [CrossRef] [Scilit]
- Mossel, E.; Ohannessian, M.I. On the Impossibility of Learning the Missing Mass. Entropy 2019, 21, 28. [Google Scholar] [CrossRef] [Scilit]
- Zscheischler, J.; Seneviratne, S.I. Dependence of drivers affects risks associated with compound events. Sci. Adv. 2017, 3, e1700263. [Google Scholar] [CrossRef] [Scilit]
- Teshome, D.T.; Zharare, G.E.; Naidoo, S. The threat of the combined effect of biotic and abiotic stress factors in forestry under a changing climate. Front. Plant Sci. 2020, 11, 601009. [Google Scholar] [CrossRef] [Scilit] [PubMed]
- Narendran, A.; Inuguri, A.H.; Ravindra, A.R.; Saga, H.; CS, V.; Raj, R.; B, K. Computational approaches for classifying antimicrobial peptides: A comparative analysis of BERT, Word2VEC, One-Hot encoding, and physicochemical analysis. Procedia Comput. Sci. 2025, 258, 3019–3030. [Google Scholar] [CrossRef] [Scilit]
- Hang, D.T.; Hao, B.T.M.; Luong, D.T.; Khanh, N.H. Rice stem borer . PlantwisePlus Knowl. Bank 2013. [Google Scholar] [CrossRef] [Scilit]
- Madden, L.V.; Hughes, G.; Van den Bosch, F. The Study of Plant Disease Epidemics; The American Phytopathological Society (APS Press): St. Paul, MN, USA, 2007. [Google Scholar] [CrossRef] [Scilit]
- Bottrell, D.G.; Schoenly, K.G. Resurrecting the ghost of green revolutions past: The brown planthopper as a recurring threat to high-yielding rice production in tropical Asia. J. Asia-Pac. Entomol. 2011, 15, 122–140. [Google Scholar] [CrossRef] [Scilit]
- Denny, M.W.; Hunt, L.J.H.; Miller, L.P.; Harley, C.D.G. On the prediction of extreme ecological events. Ecol. Monogr. 2009, 79, 397–421. [Google Scholar] [CrossRef] [Scilit]
- Towe, R.; Tawn, J.; Eastoe, E.; Lamb, R. Modelling the clustering of extreme events for Short-Term Risk assessment. J. Agric. Biol. Environ. Stat. 2019, 25, 32–53. [Google Scholar] [CrossRef] [Scilit]
- Tam, B.C.M.; Tang, S.K.; Cardoso, A. Multi-level lag scheme significantly improves training efficiency in deep learning: A case study in air quality alert service over sub-tropical area. J. Big Data 2025, 12, 3. [Google Scholar] [CrossRef] [Scilit]
- Cazelles, B.; Chavez, M.; Berteaux, D.; Ménard, F.; Vik, J.O.; Jenouvrier, S.; Stenseth, N.C. Wavelet analysis of ecological time series. Oecologia 2008, 156, 287–304. [Google Scholar] [CrossRef] [Scilit]
- Paul, R.K.; Vennila, S.; Yeasin, M.; Yadav, S.K.; Nisar, S.; Paul, A.K.; Gupta, A.; Malathi, S.; Jyosthna, M.K.; Kavitha, Z.; et al. Wavelet decomposition and machine learning technique for predicting occurrence of spiders in pigeon pea. Agronomy 2022, 12, 1429. [Google Scholar] [CrossRef] [Scilit]
- Wang, M.; Li, T. Pest and disease prediction and management for sugarcane using a hybrid autoregressive Integrated Moving Average—A long Short-Term memory model. Agriculture 2025, 15, 500. [Google Scholar] [CrossRef] [Scilit]
- Wildemeersch, M.; Franklin, O.; Seidl, R.; Rogelj, J.; Moorthy, I.; Thurner, S. Modelling the multi-scaled nature of pest outbreaks. Ecol. Model. 2019, 409, 108745. [Google Scholar] [CrossRef] [Scilit]
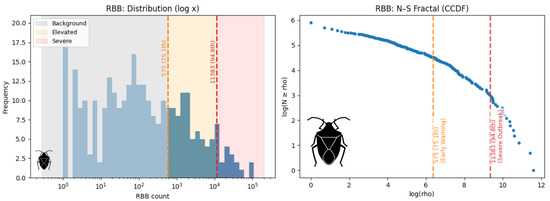
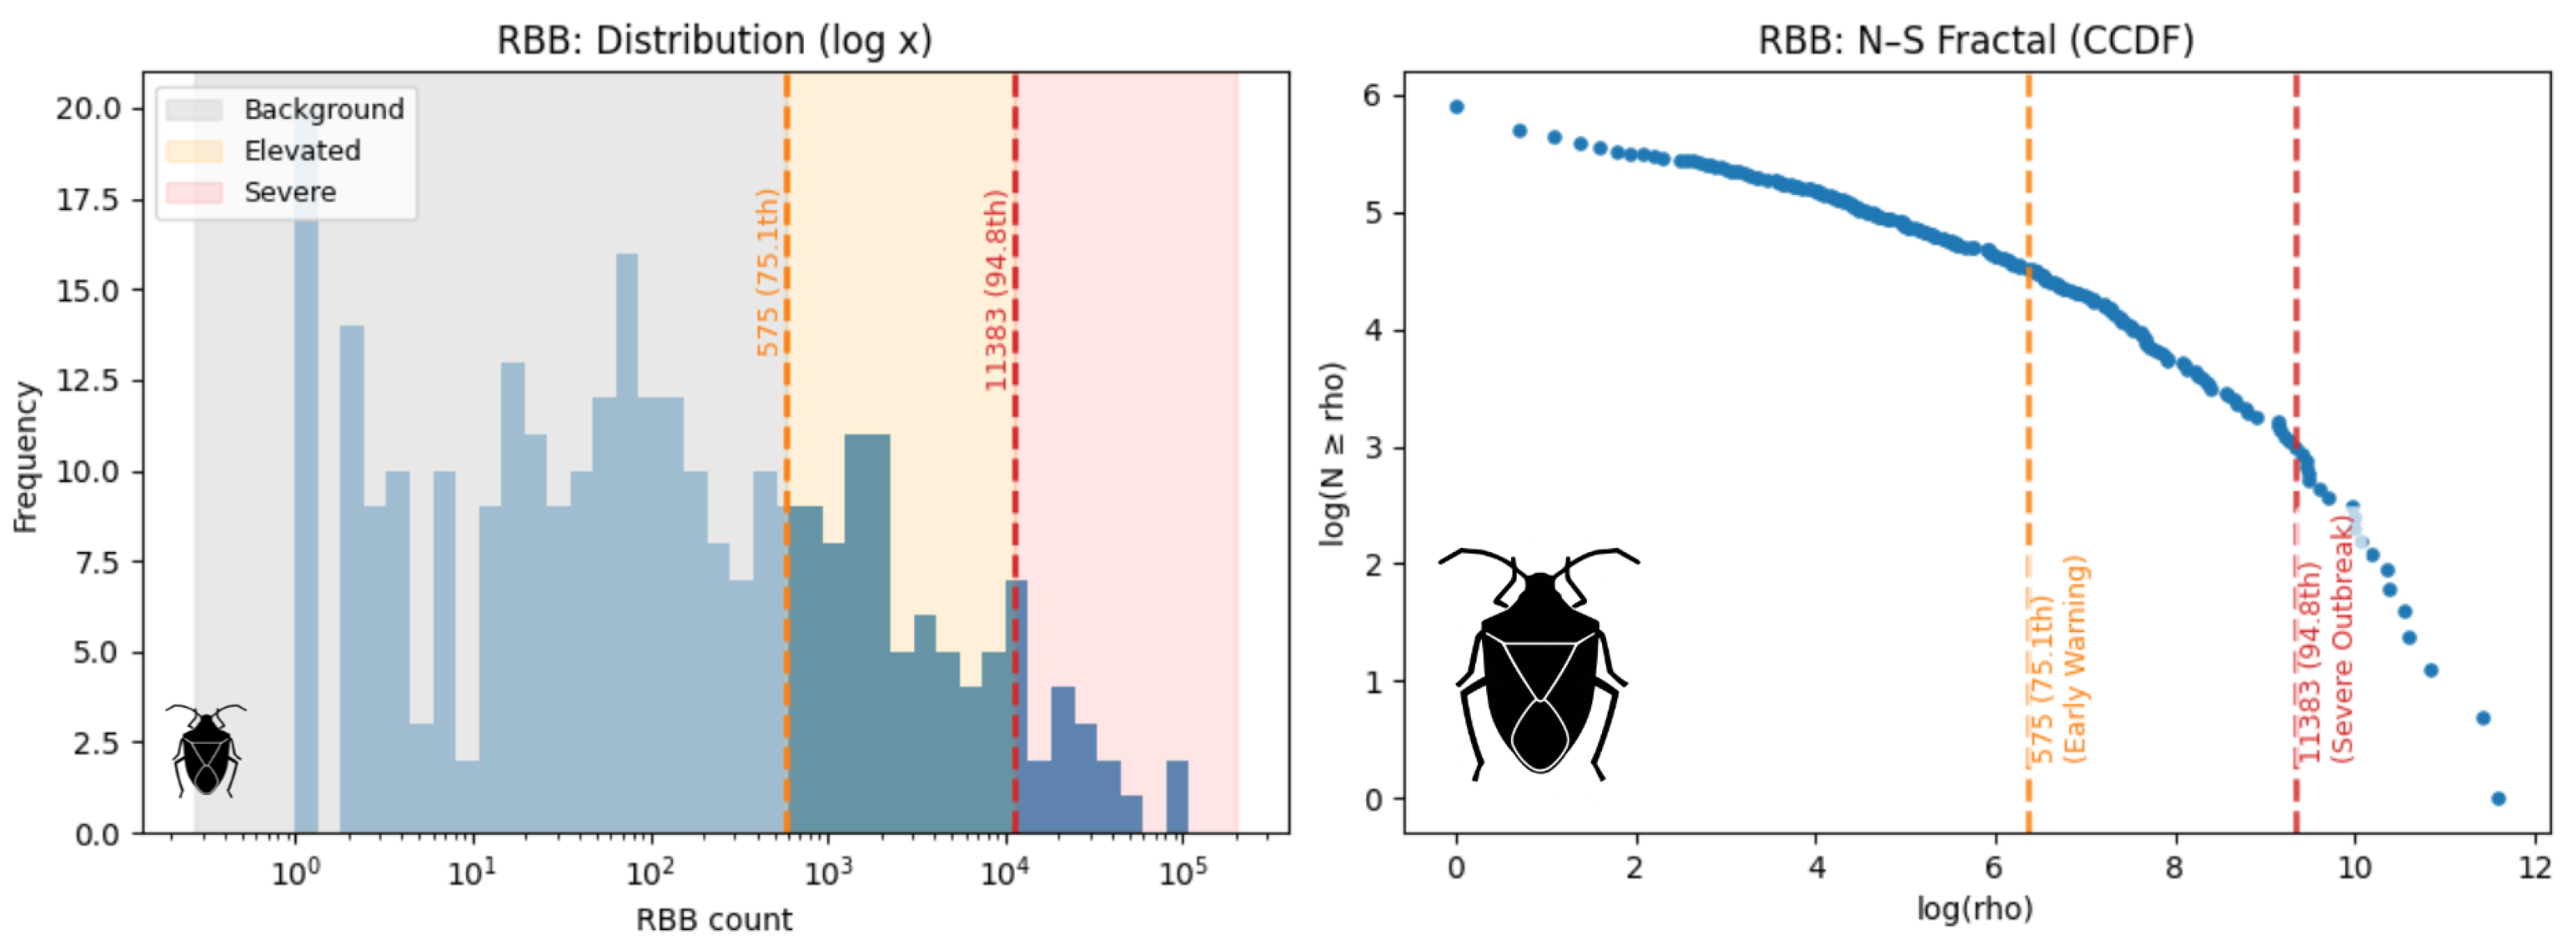
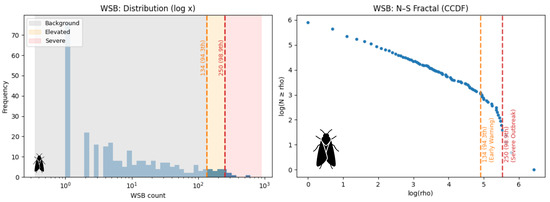
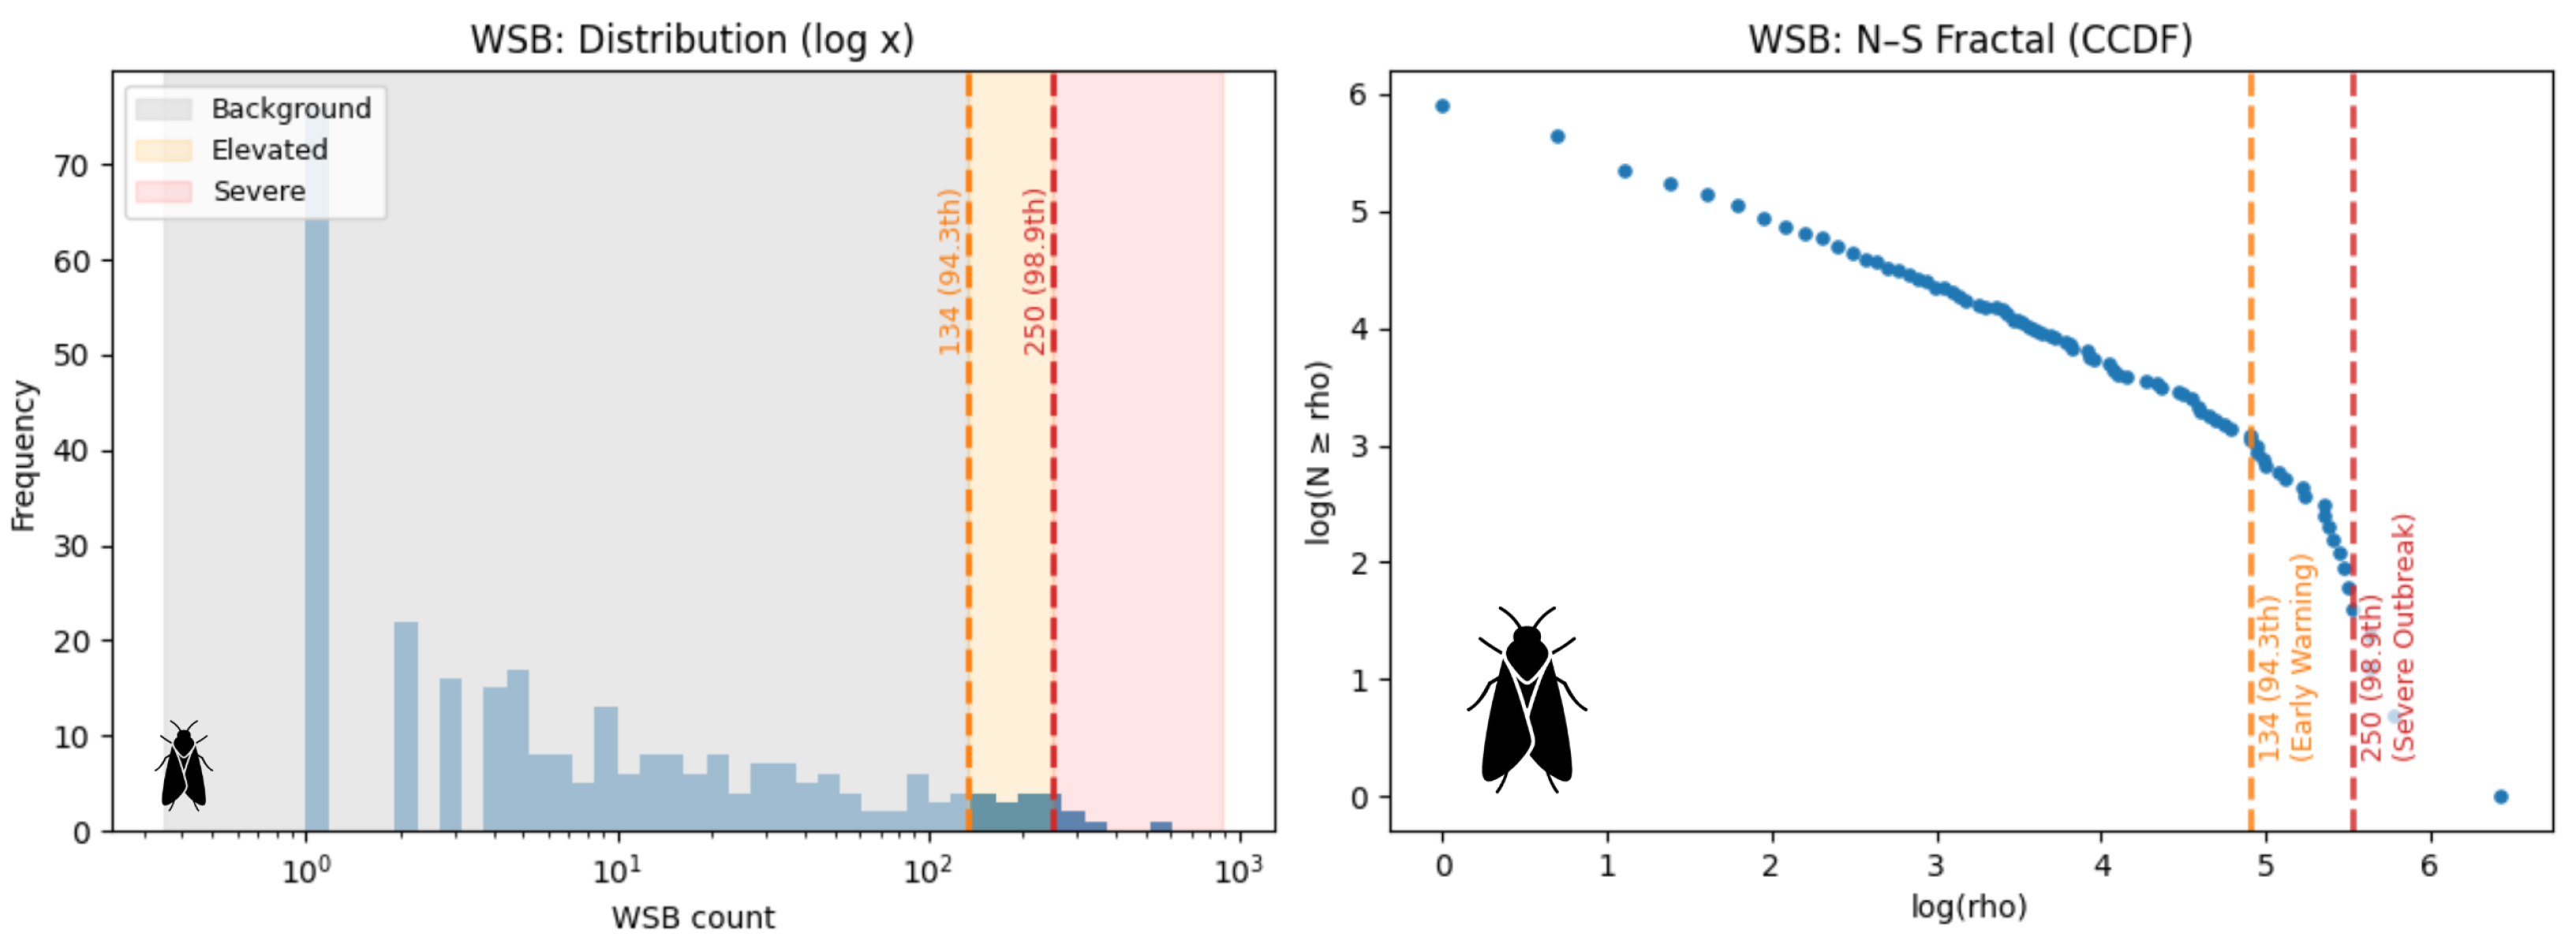
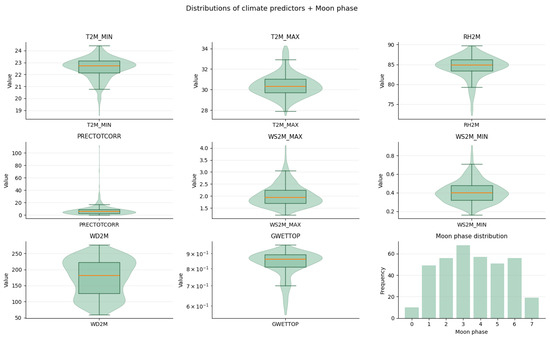
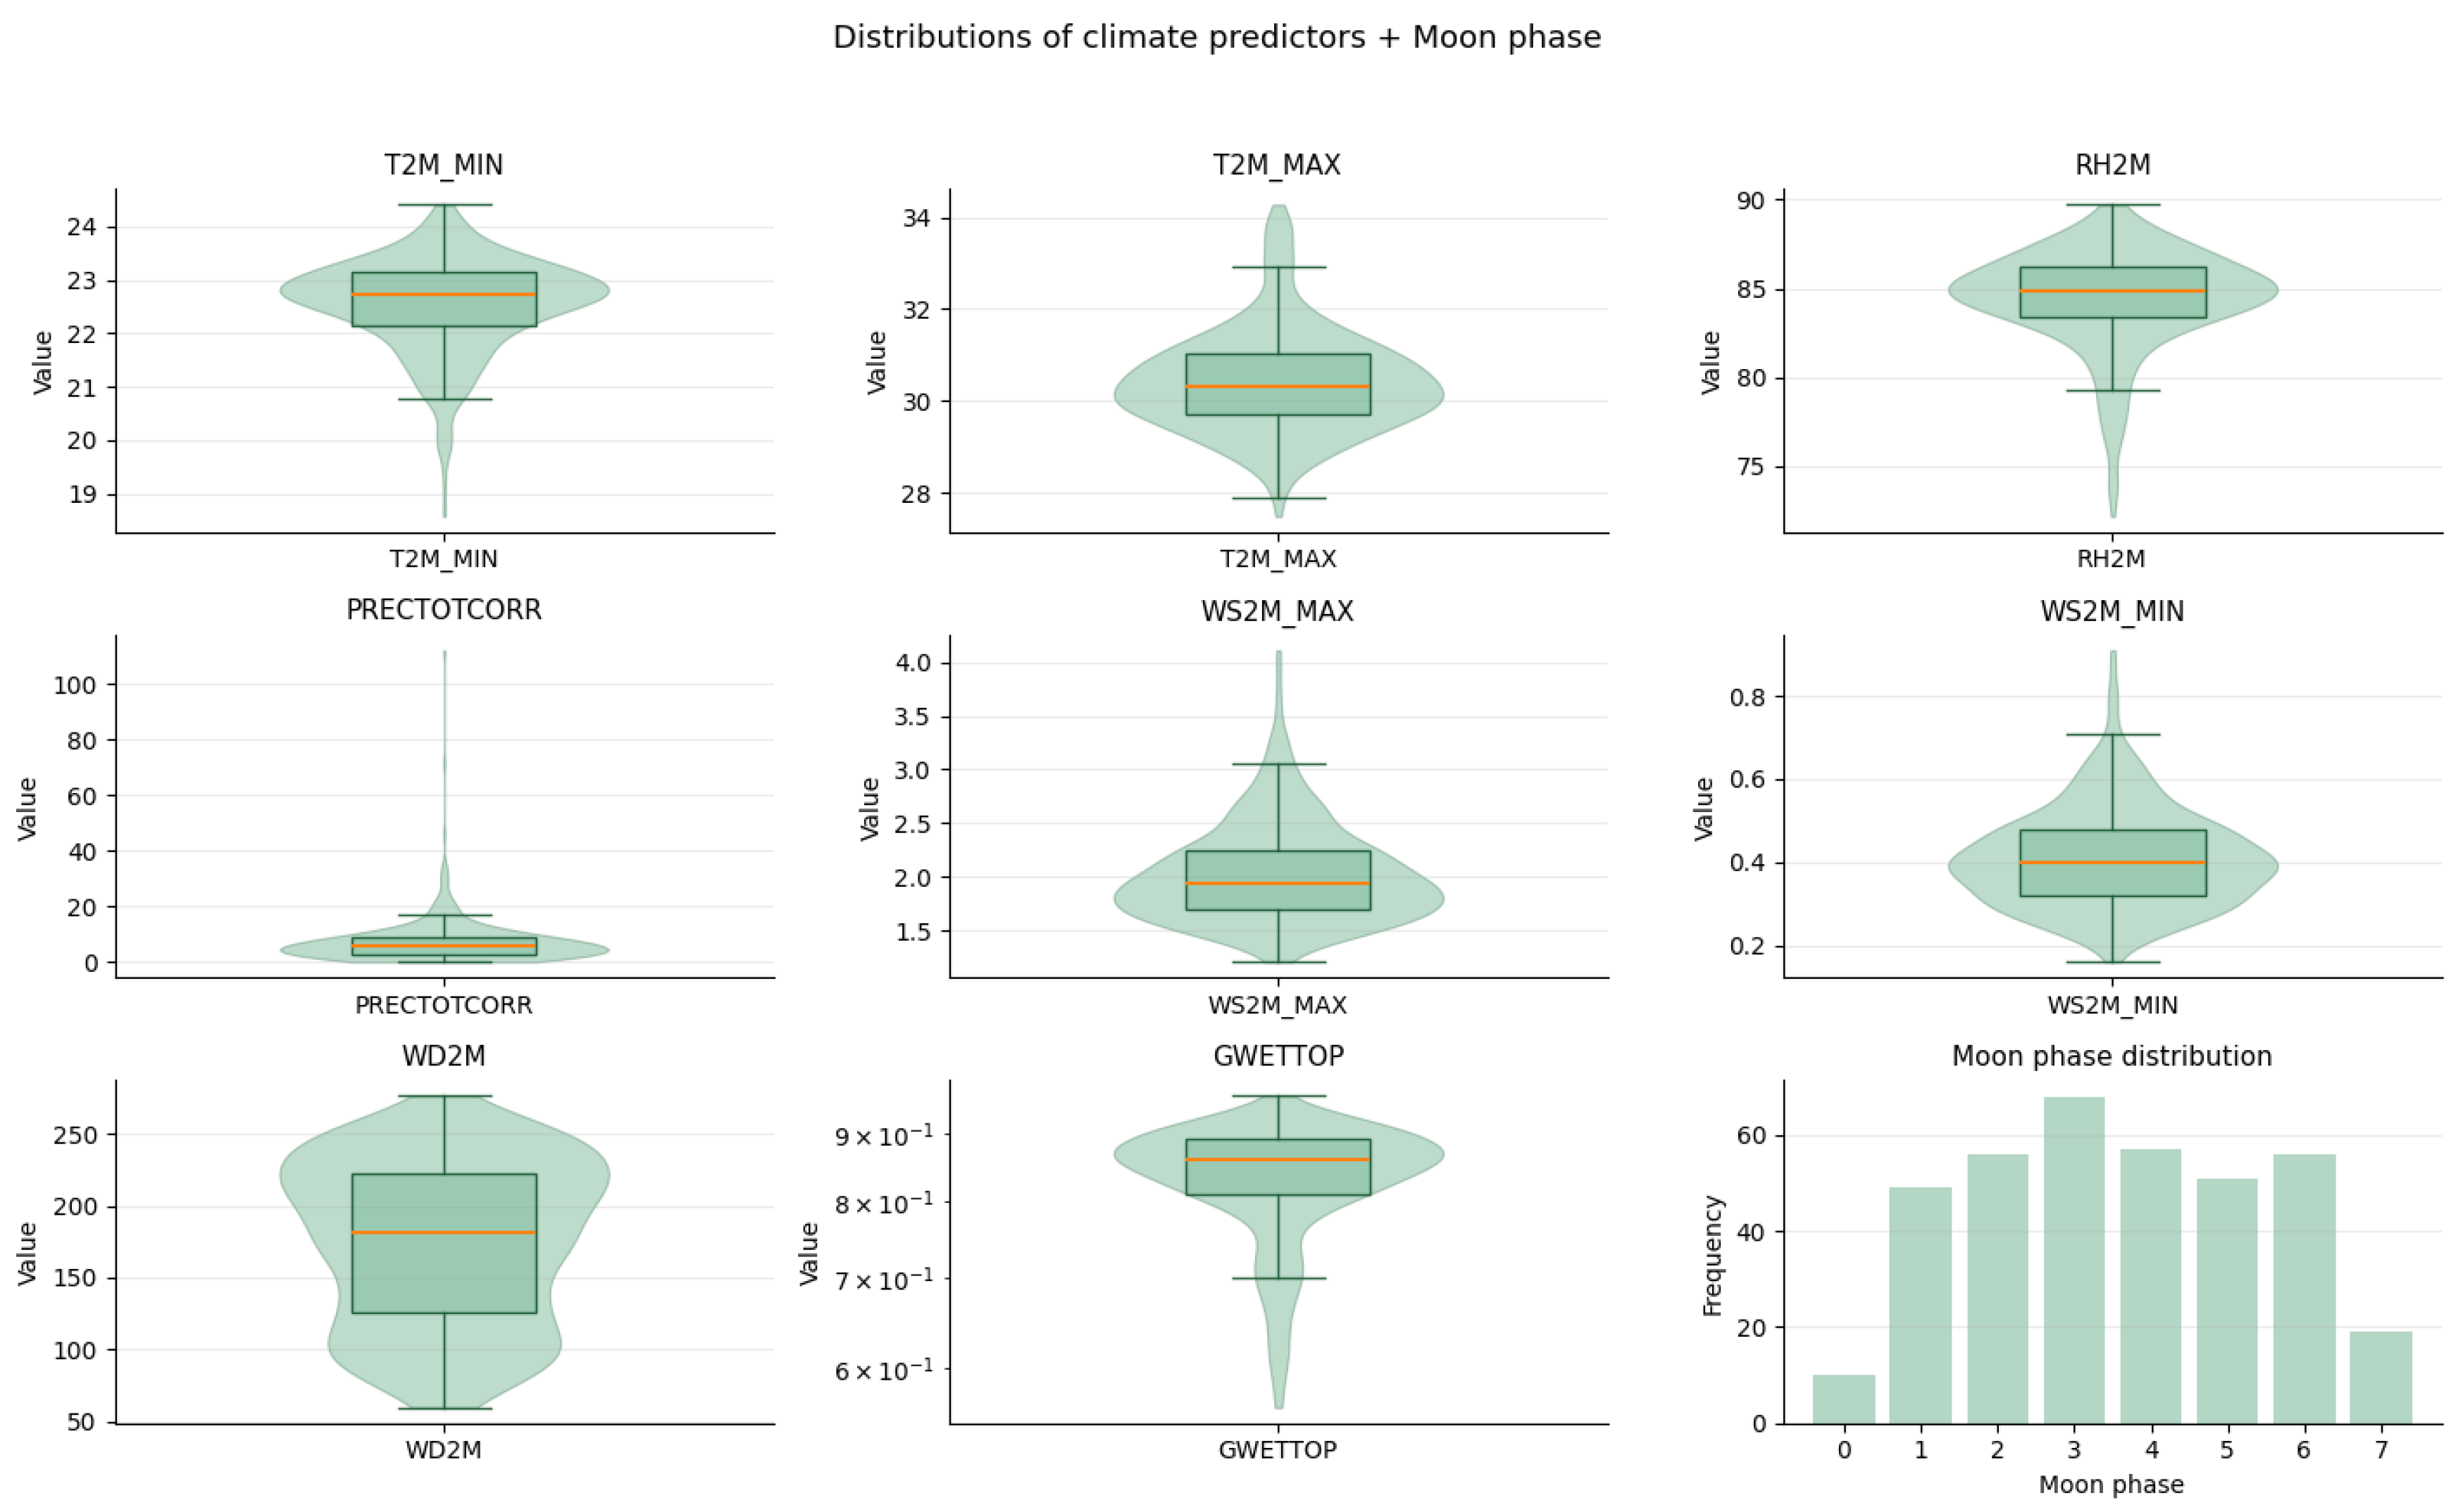
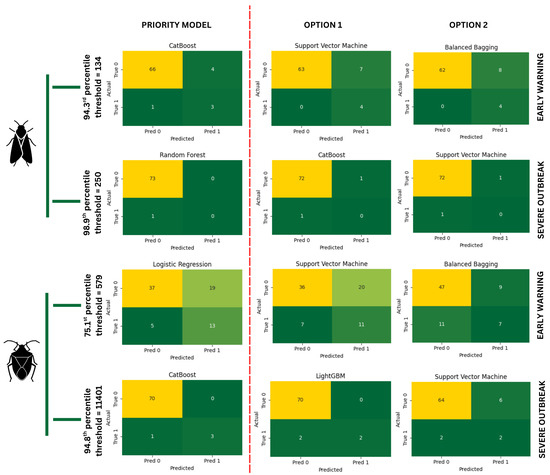
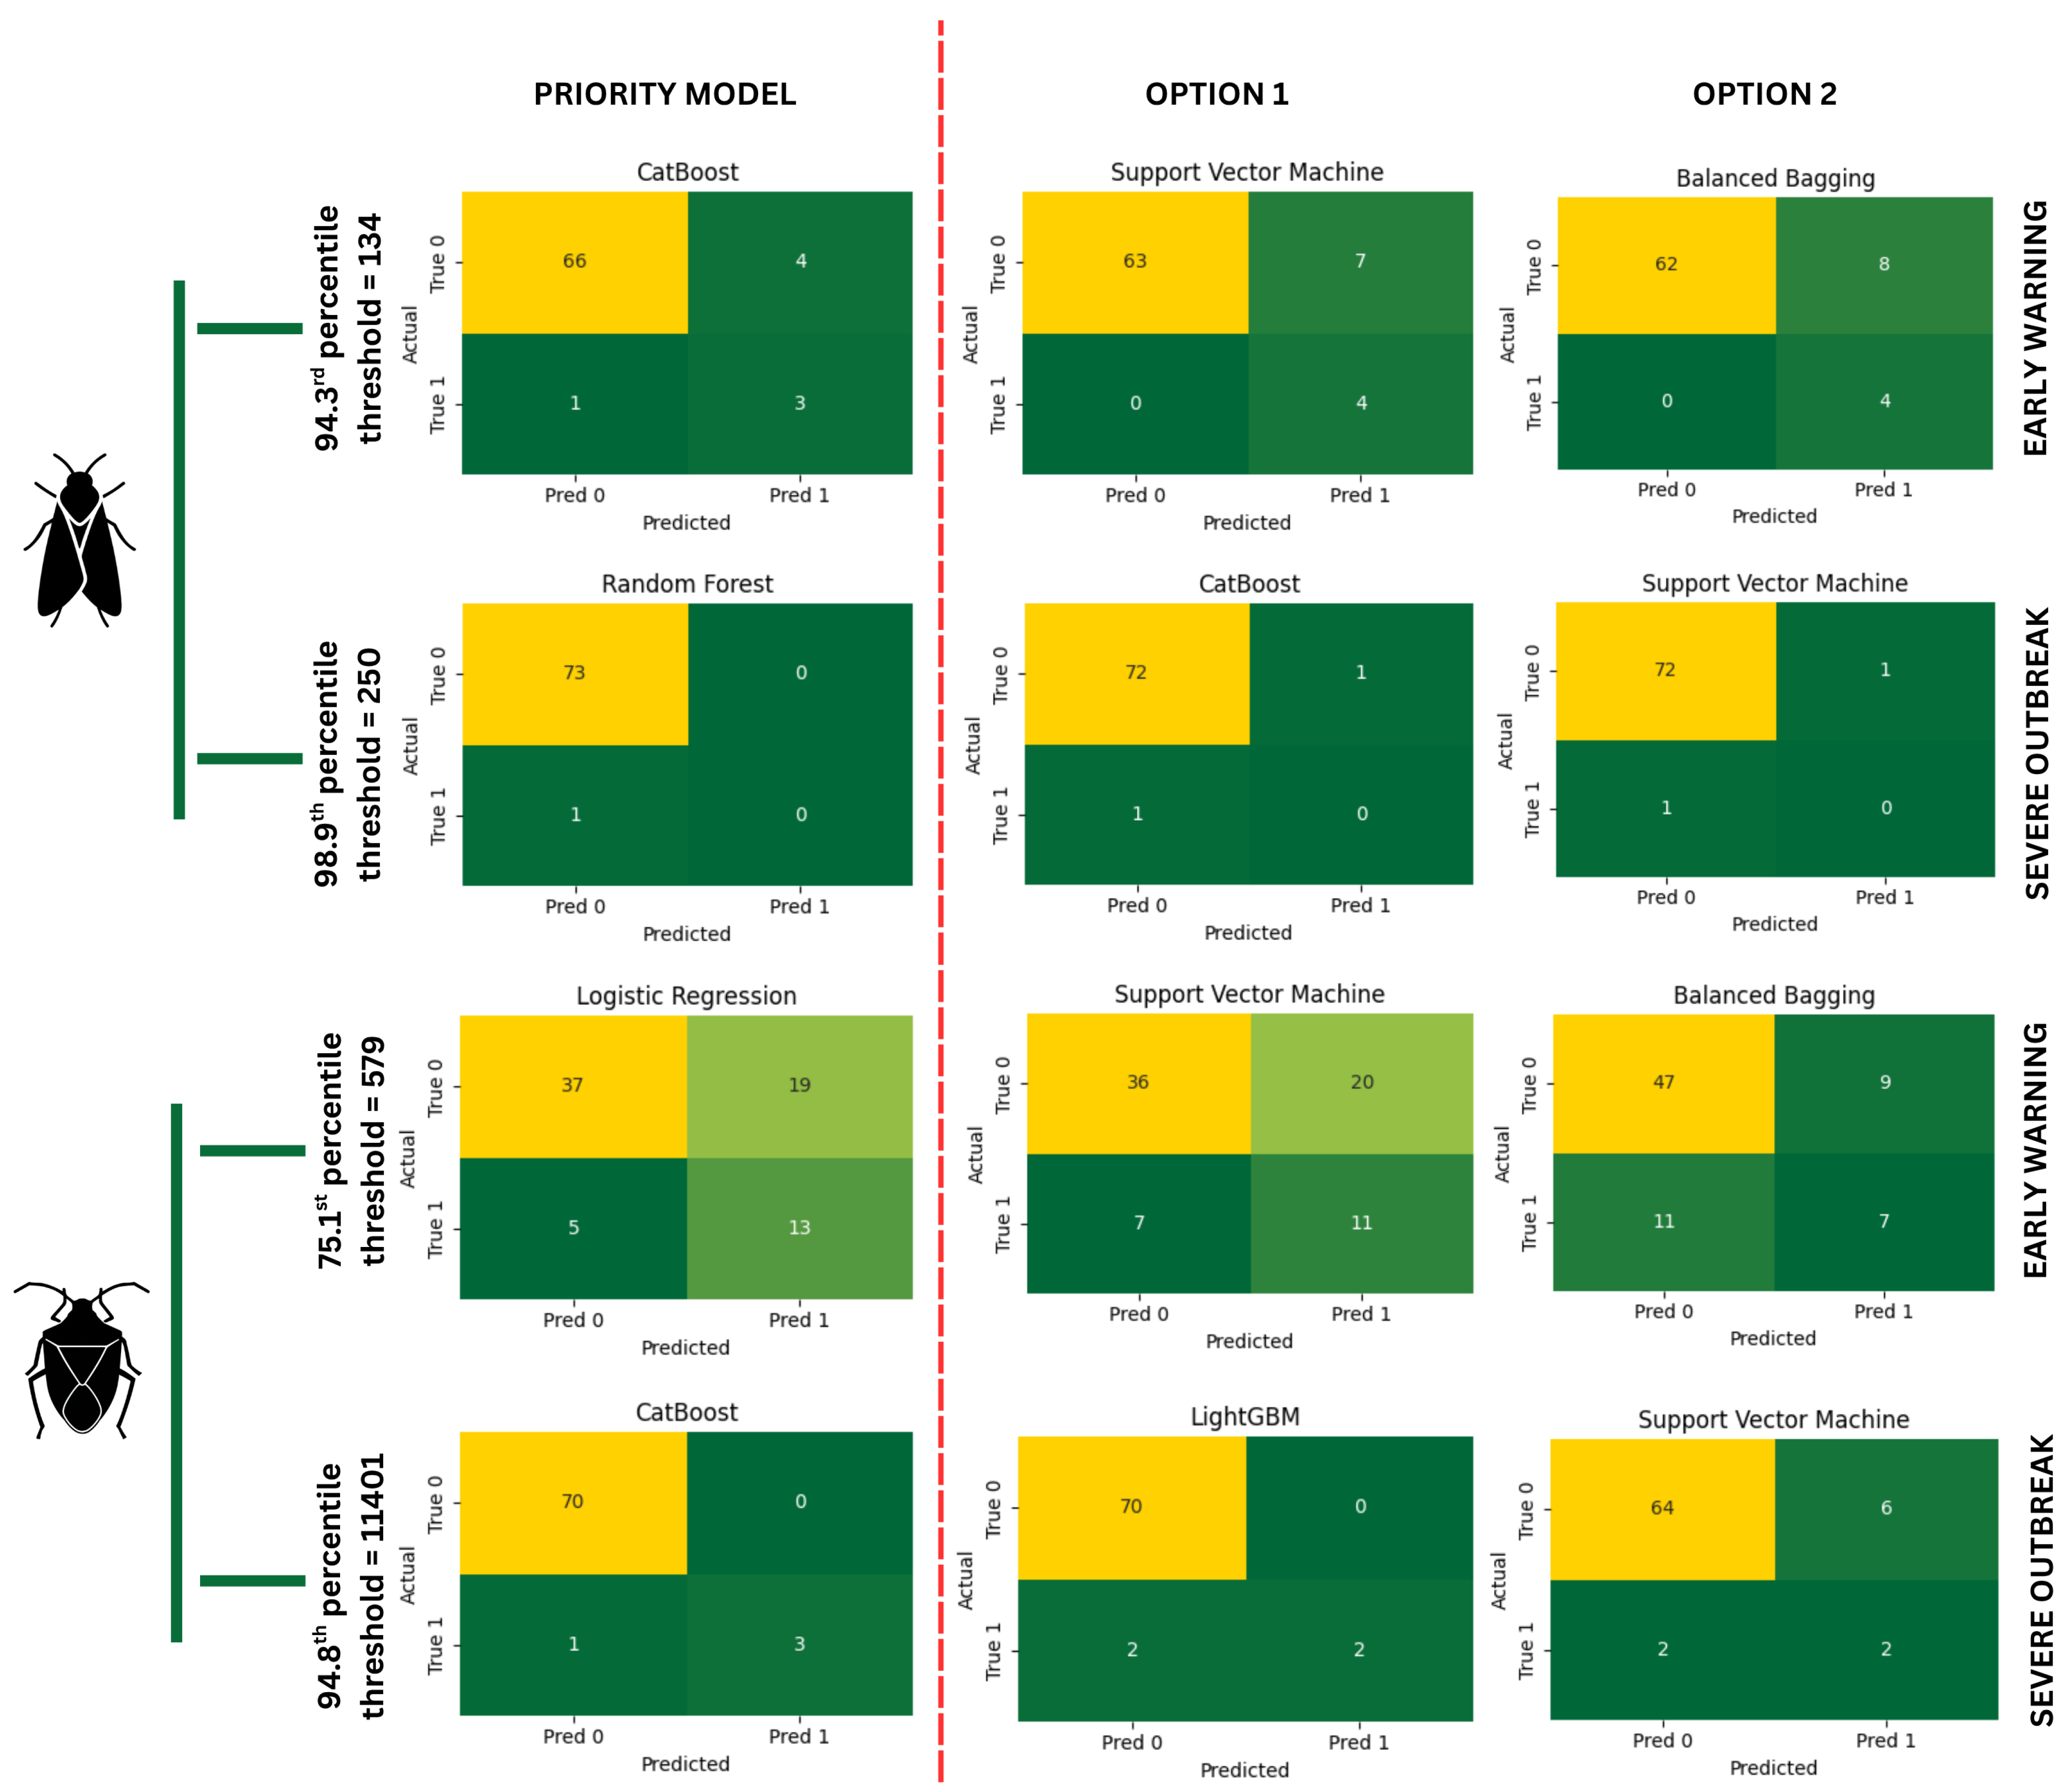
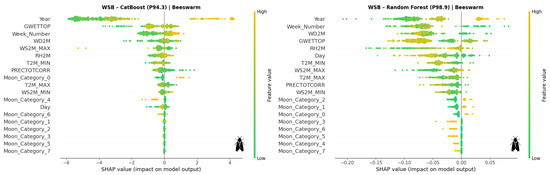
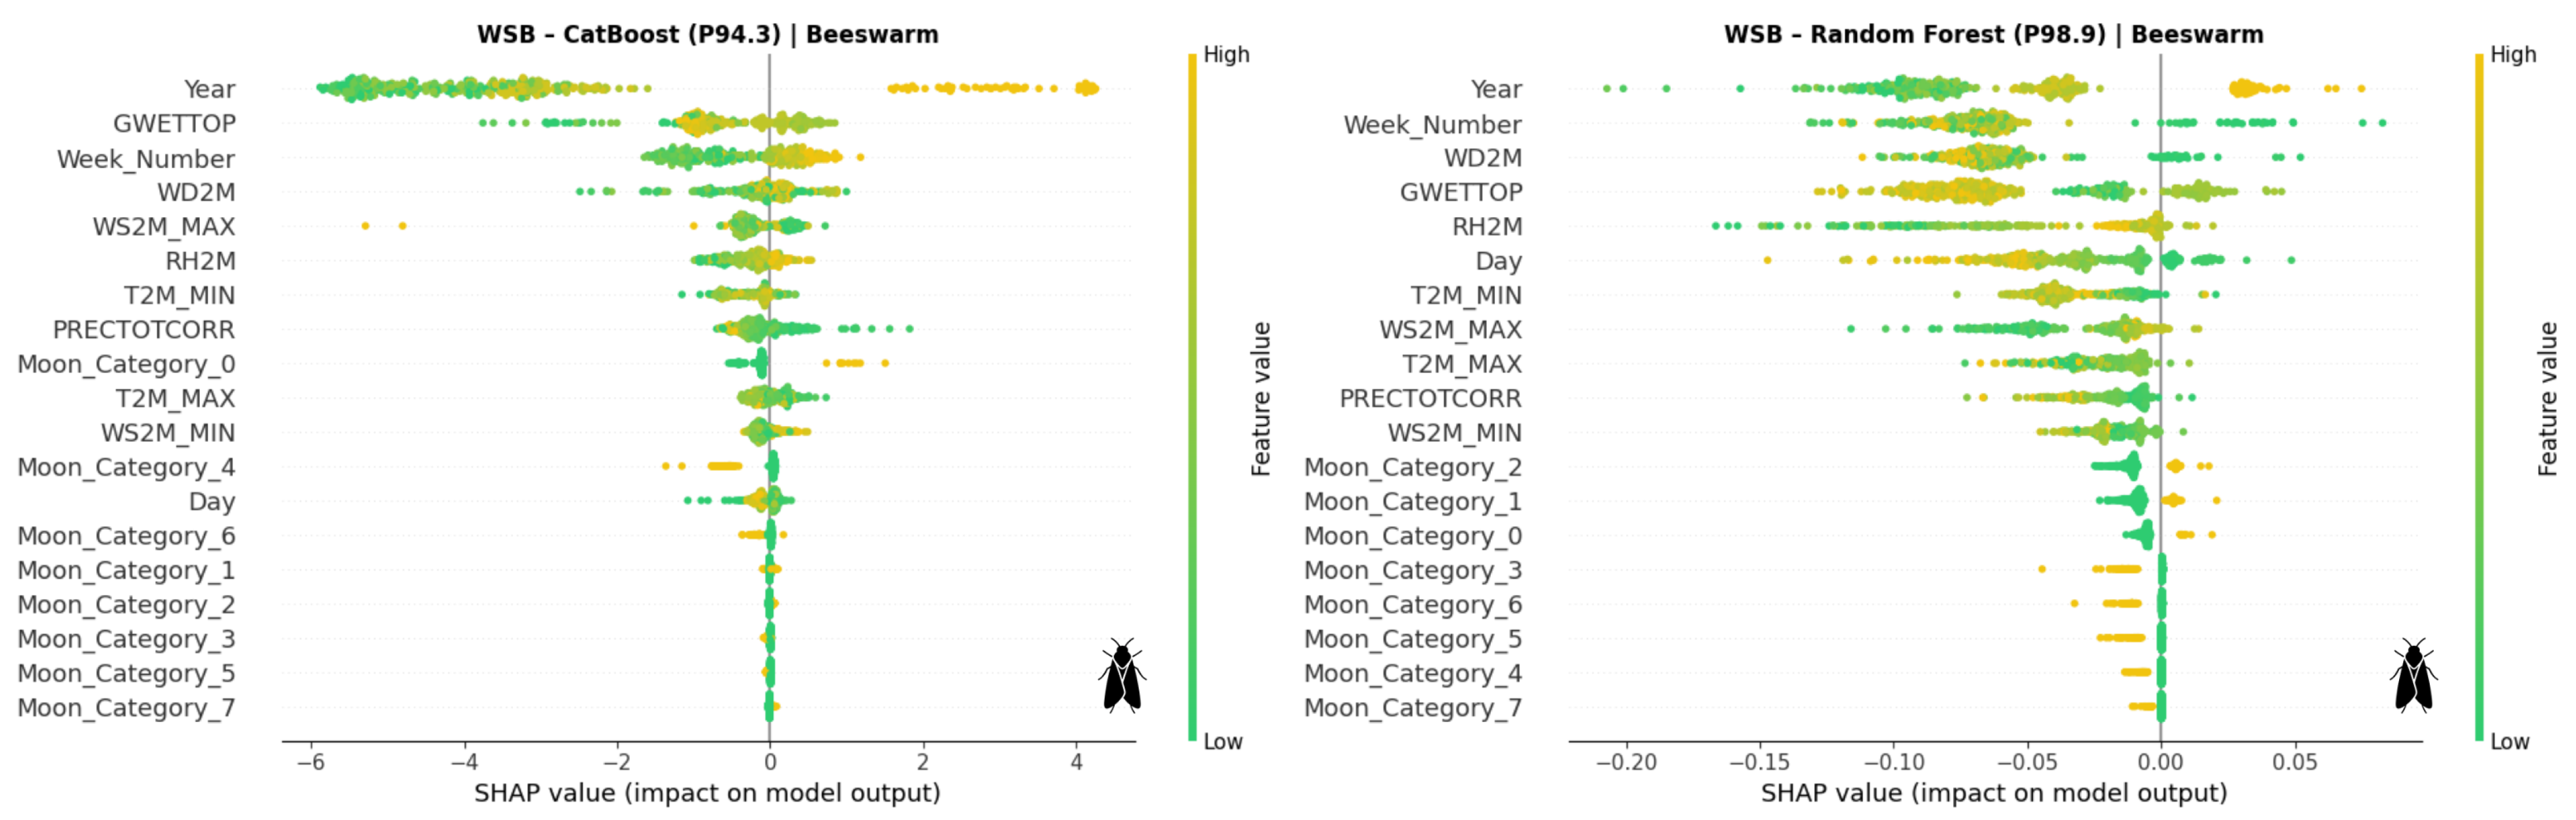
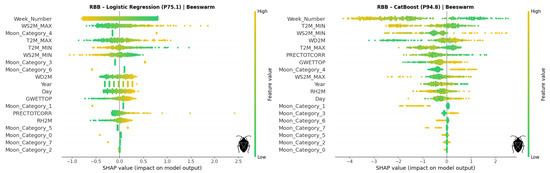
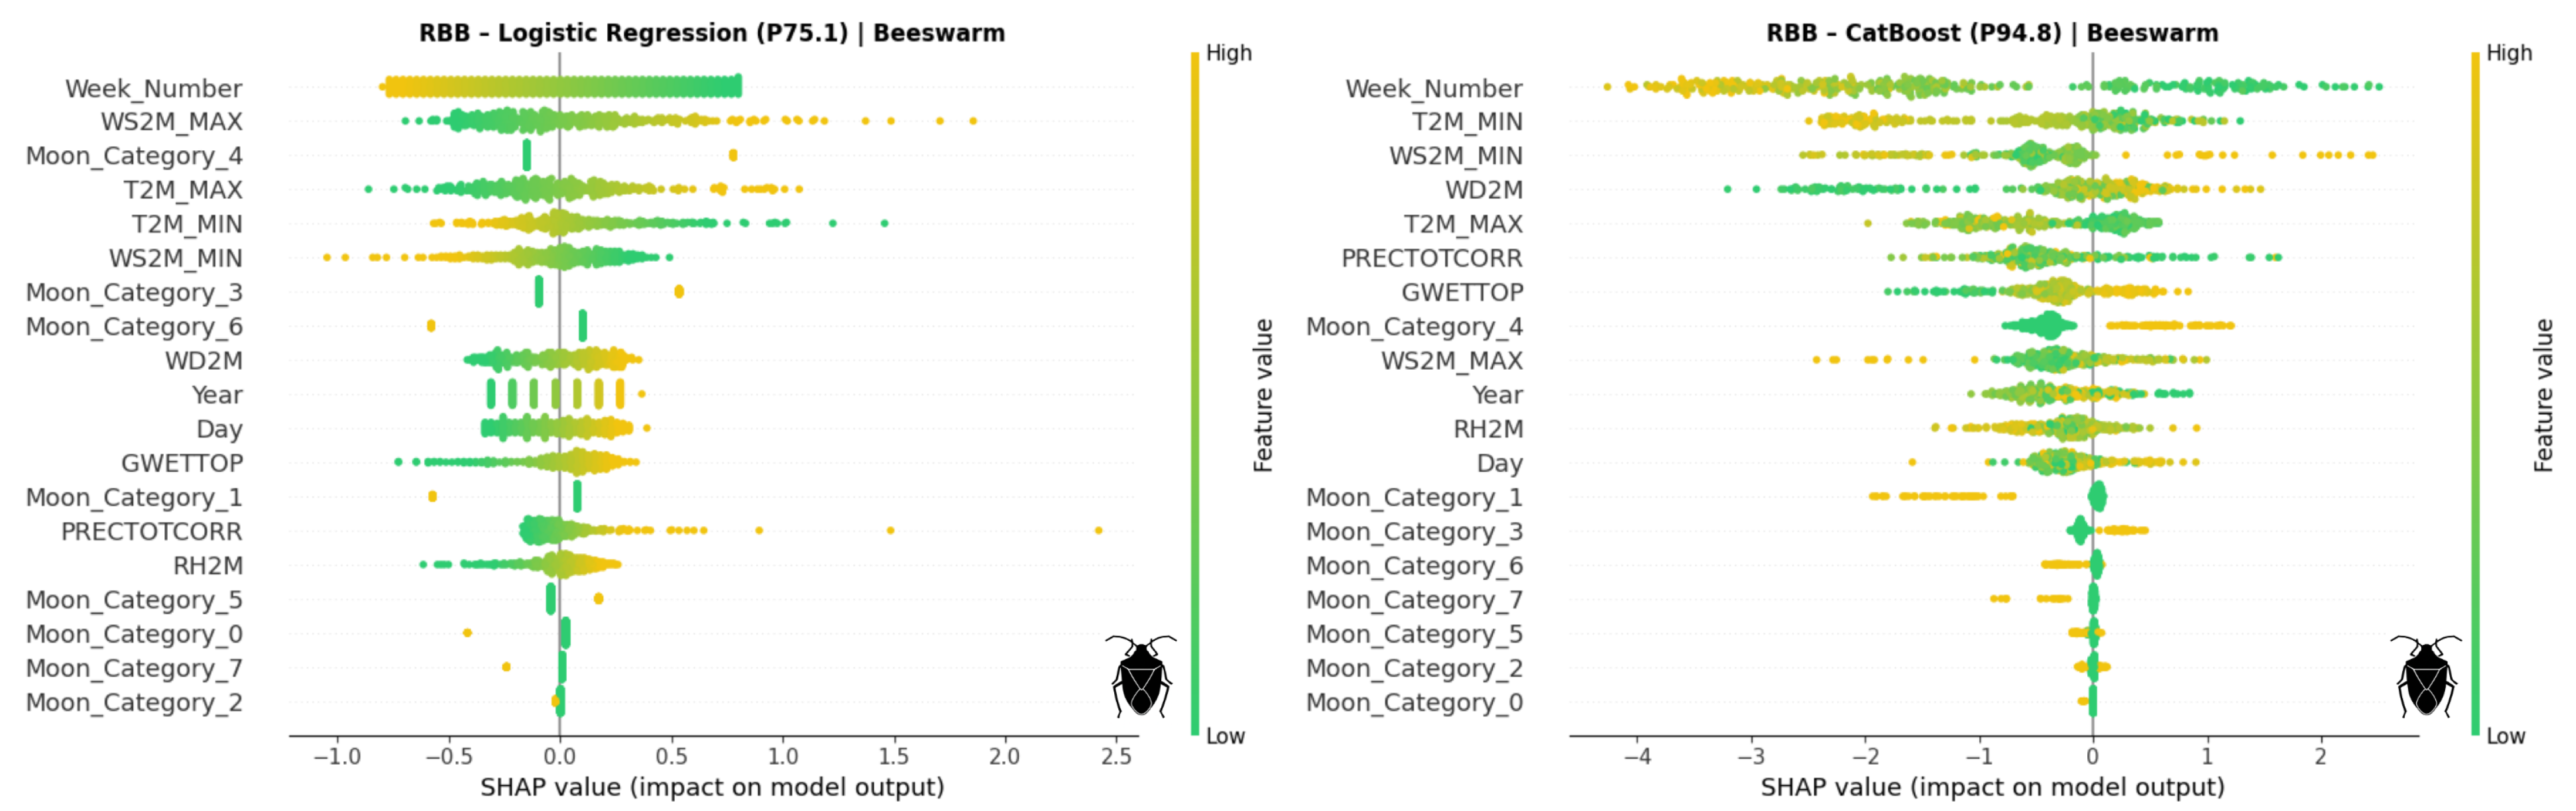

Disclaimer/Publisher’s Note: The statements, opinions and data contained in all publications are solely those of the individual author(s) and contributor(s) and not of MDPI and/or the editor(s). MDPI and/or the editor(s) disclaim responsibility for any injury to people or property resulting from any ideas, methods, instructions or products referred to in the content. |
© 2025 by the authors. Licensee MDPI, Basel, Switzerland. This article is an open access article distributed under the terms and conditions of the Creative Commons Attribution (CC BY) license.