


Abstract
Pumped storage power stations (PSPSs) are crucial regulators for accelerating the global energy structure transformation and developing a renewable energy-dominated power system. The sediment entering the reservoirs leads to capacity loss, while the fine-grained sediment carried by water during pumping and power generation can cause cavitation in penstocks and abrasion of turbine blades, which may lead to frequent shutdowns for overhaul. Taking a pumped storage power station as an example, whose lower reservoir is on a sediment-laden river, this study simulates the sediment concentration and its particle size through turbines under different sediment regulation measures. The unit abrasion rate and overhaul cycle are further predicted. The results indicate that the sediment concentration through turbines (SCT) and the suspended sediment transport rate entering the lower reservoir are positively correlated. The higher the SCT, the coarser the sediment particle size through turbines. For the lower reservoir with delta or conical sedimentation patterns, lowering the water level and shutting down pumping during sediment peak processes can free up the effective storage capacity, reduce the SCT by approximately 26%, and extend the overhaul cycle to 1.5 times. The study also systematically introduces a practical and feasible method for predicting SCT and turbine blade abrasion, servicing for the sustainability of PSPSs.
1. Introduction
Pumped storage power stations (PSPSs) are becoming more and more important in the power system as a result of the “dual carbon” goals, which aim to speed up the transformation of the global energy structure and progressively move toward a new power system that is dominated by renewable energy. During off-peak periods (e.g., nighttime), PSPSs utilize surplus, low-cost electricity from the grid—particularly curtailed wind and solar power—to pump water from lower reservoirs to upper reservoirs, converting electrical energy into gravitational potential energy for storage. During peak demand periods (e.g., daytime), water is released to generate electricity, converting the stored potential energy into electrical energy for the grid supply [1]. Characterized by their rapid start-stop, flexible regulation, large energy storage capacity, and significant environmental benefits, PSPS are known as the largest “regulator” in the power system [2]. They can effectively improve the power quality, solve peak-shaving or water abandonment issues [3,4], enhance the safety of cross-regional power transmission, ensure grid safety, and meet power system regulation needs [5,6,7,8].
There is usually a significant head difference between the upper and lower reservoirs of a PSPS, which causes a high-velocity flow through turbines. Unit wear and equipment deterioration result from the cavitation and abrasion in penstocks and turbine blades caused by the bidirectional exchange of sediment between the upper and lower reservoirs [9]. Equipment abrasion caused by sediment is the most concentrated and prominent manifestation of sediment hazards. Hard mineral particles carried by high-velocity water continuously impact, cut, and scour the key flow-passing surfaces such as the runners, the guide vanes, the impellers of the pump-turbine, and the inner walls of penstocks, resulting in multiple chain hazards [10]. The increased surface roughness of the blades results in a considerable decrease in hydraulic efficiency, which is immediately reflected in reduced power output and increased power consumption during pumping [11]. In terms of material performance, the protective coating is peeled off, and the material is worn over the long term, even with localized perforations, leading to a decrease in component strength and seriously threatening the safe operation of the unit [12]. From an economic perspective, abrasion forces the unit to shut down frequently for maintenance, repair, or replacement of the damaged components, resulting in huge maintenance costs, a significant reduction in the interval between unit overhauls, and a shortened overall service life [13]. In addition, fine-grained sediment may cause component blockage, affecting heat dissipation and lubrication efficiency and inducing overheating failures [14]. The roughening of the flow-passing surface caused by abrasion further intensifies cavitation, forming a synergistic “abrasion-cavitation” damage mechanism. Its comprehensive damage effect is far greater than that of a single action mode, becoming a core challenge to unit reliability [15].
Studies have shown that the wear rate of pump-turbine flow-passing components has a positive correlation with sediment concentration [16,17,18,19,20,21]. Therefore, accurate estimation of sediment concentration through turbines is a prerequisite for evaluating unit abrasion. Currently, there has been some research on the factors affecting sediment transport through turbines and the corresponding estimation methods in PSPSs [22,23,24,25,26,27]. Liu et al. [25] explored the combined impacts of discharge, inflow sediment concentration, and head difference on sediment concentration through turbines (SCT) in a PSPS and derived an empirical prediction formula based on multivariate statistical analysis. Monitoring of a Swiss PSPS by Müller et al. [28] revealed seasonal sediment concentration patterns in its upper and lower reservoirs, with concentrations lowest in winter, rising during spring snowmelt, and remaining elevated through summer. Wei et al. [29] developed a numerical model to simulate total non-uniform sediment transport in PSPSs. The model incorporates three critical sedimentation pathways: upper reservoir deposition, lower reservoir deposition, and sediment through turbines. Through engineering case studies, further investigations have been carried out on the variation patterns in reservoir deposition, SCT, and the corresponding particle size distribution [26,29]. Additionally, hydropower projects in Latin America commonly face significant sedimentation issues. Studies on projects in Peru and Ecuador have highlighted the reservoir sedimentation and severe turbine abrasion caused by high sediment concentration [30,31]. Similarly, in India, where a massive expansion of PSPSs is planned, particularly in the Indus Basin, sediment management is a critical design concern [32]. Research suggests that seasonal pumped storage, with its reduced sedimentation and smaller socio-environmental footprint, presents a valuable complementary solution [33].
It is evident that the factors influencing SCT remain incompletely understood. In addition, how to choose sediment regulation strategies and the estimation of their effectiveness in reducing unit abrasion require further examination. This study, therefore, uses a representative case for analysis: a pumped storage power station with its lower reservoir situated on a sediment-laden river.
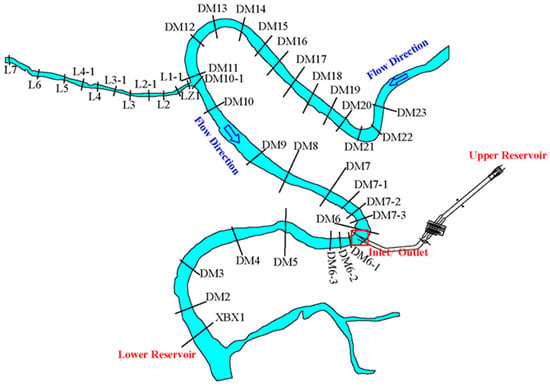
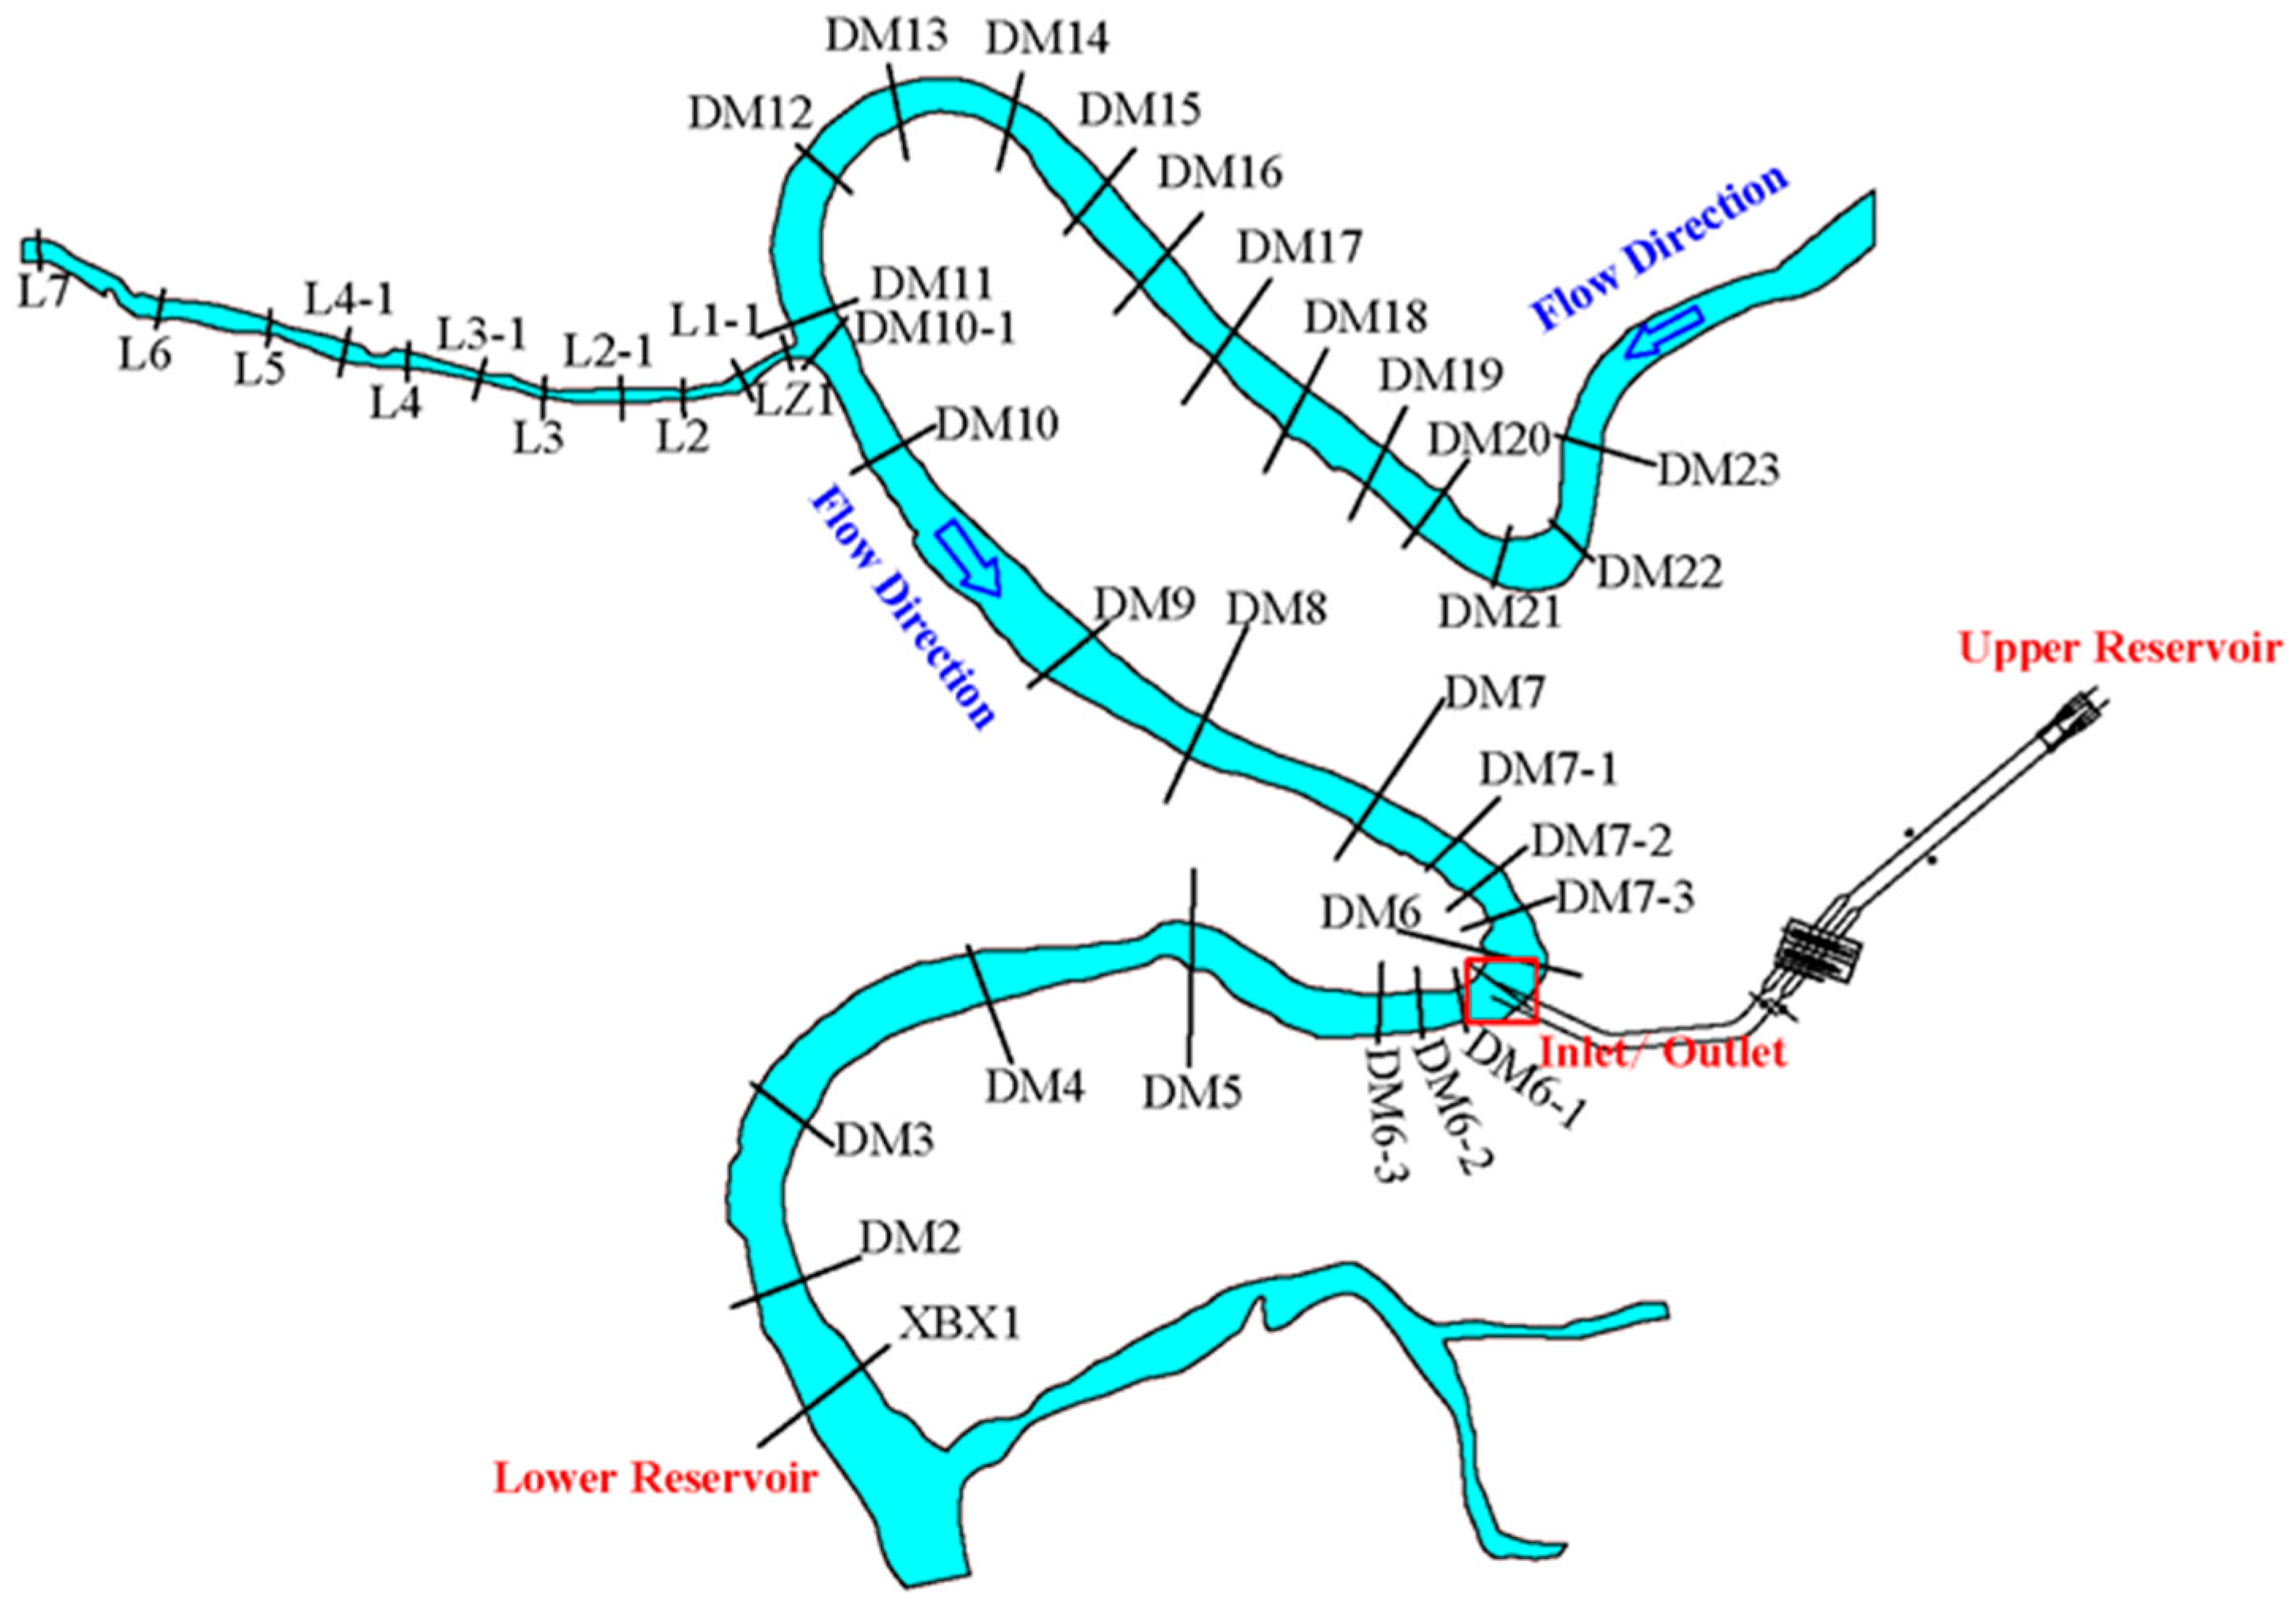
The lower reservoir was formed by damming the Main River, while the upper reservoir is located near the Quanyuan Gully’s source on the Main River’s left bank (Figure 1). With an installed capacity of 900 MW, the PSPS operates on a daily dispatch cycle and has an average discharge flow of 435 m3/s for pumping and 609 m3/s for power generation. It pumps water for 7 h and discharges water for power generation for 5 h within a day, with a total interval of 12 h between pumping and generating. The normal storage level and corresponding capacity are 545.0 m and 12.77 million m3 for the upper reservoir and 355.5 m and 26.70 million m3 for the lower reservoir, whereas their dead water levels and corresponding capacities are 508.0 m with 0.56 million m3 and 350.5 m with 8.85 million m3, respectively. Additionally, the thalweg elevation at the dam site of the lower reservoir is 342.0 m.
Figure 1.
Schematic diagram of the PSPS. DM2, DM3, and so on denote typical cross-sections at different locations.
The upper and lower reservoirs have catchment areas of 1.01 km2 and 5851 km2, respectively. The hydrological conditions at the dam sites of the upper and lower reservoirs are significantly different. The multi-year average discharge is 0.013 m3/s at the upper reservoir, compared to 78.2 m3/s at the lower reservoir. Similarly, the average suspended sediment loads are 0.0186 × 10⁴ t and 107.6 × 10⁴ t, respectively. The suspended sediment load entering the lower reservoir is characterized by a median particle size (D50) of 0.044 mm, an average of 0.060 mm, and a maximum of 0.5 mm. The mineral composition of the suspended sediment entering the lower reservoir is characterized by the following mass percentages and Mohs hardness values: quartz (42.1%; hardness 7), plagioclase (10.5%; hardness 6), clay minerals (29.8%; hardness 1–3.5), dolomite (6.2%; hardness 3–4), calcite (4.4%; hardness 3), potassium feldspar (3.1%; hardness 6), and hornblende (3.9%; hardness 6). Minerals with a Mohs hardness > 5 constitute 59.6% of the total composition by mass. The upper and lower reservoirs have multi-year average bedload sediment transports of 0.0019 × 10⁴ t and 10.8 × 10⁴ t, respectively. The capacity-to-sediment-inflow ratio (RSTS), which is the lower reservoir’s storage capacity at normal water level divided by the multi-year average sediment inflow, is calculated to be 31 using a dry bulk sediment density of 1325 kg/m3. The inlet/outlet of the lower reservoir is 5.48 km away from the dam, accounting for approximately 1/3 of the main stream length of the lower reservoir.
Obviously, sedimentation is a significant problem in this PSPS, and its specific impact on turbine abrasion in pumped storage systems remains poorly quantified. Based on a one-dimensional mathematical model that considers the mutual feedback and coupling effect between sediment through turbines and reservoir scouring/sedimentation, this study simulates and analyzes the sediment concentration through turbines and its gradation under different sediment regulation strategies and further predicts the turbine abrasion and overhaul intervals. The study’s objectives are to (1) investigate sediment concentration and its gradation through turbines under different sediment regulation measures and (2) assess the effectiveness of different sediment regulation measures in reducing unit abrasion and extending overhaul cycles. The study aims to provide a theoretical basis for selecting sediment regulation measures by quantifying their efficacy in mitigating turbine abrasion.
2. Methods
2.1. Numerical Model Setup
2.1.1. Governing Equations of the Model
The pumping and generation cycles of PSPSs drive a continuous exchange of sediment between the upper and lower reservoirs. The numerical model in this study was built upon the one-dimensional sediment model for PSPSs developed by Wei et al. [29] that integrated the entire power plant equipment, penstocks, and both reservoirs. It carried out a linked simulation of the sediment in the upper and lower reservoirs, as well as the sediment through turbines, by establishing many virtual diversion and confluence nodes to simulate the intricate reciprocating flow pattern close to the inlet/outlet. The governing Equations and the calculation of SCT, detailed in the works of Liu et al. [26] and Wei et al. [29], are briefly described below.
- ①
- Governing Equations for flow
In which indicates the flow rate, is the shunt or confluence flow per unit channel length; represents the flow area (m2); is the water level; denotes the roughness coefficient; refers to the hydraulic radius of the crossing-section.
- ②
- Convection diffusion Equation of suspended mass and sediment transport Equation of unbalance of bedload
In which is the recovery saturation coefficient of suspended load; is the river width; , and are the suspended sediment concentration, suspended sediment transport capacity of flow, and sediment settling velocity of group th, respectively; and represent the actual and effective bedload transport rate of group th, respectively. is the recovery saturation coefficient of bed load; is the suspended sediment transport rate of group th per unit channel length, and is the actual bedload transport rate of group th per channel unit.
- ③
- Bed evolution Equations
In which and represent the change rate of bed area produced by suspended load of group th and bed load of group th, respectively. is the dry density of sediment.
- ④
- Bed material composition Equation
In which and represent the sediment proportion of group th in the mixed layer and the original river bed, respectively; refers to thickness of the mixed layer; is the mark of erosion and deposition, if pure deposition is calculated, = 0, otherwise = 1; is the original riverbed marker, = 1 when the boundary under the mixed layer reaches the original riverbed, otherwise = 0.
2.1.2. Calculation of SCT
The average SCT at pumping time is calculated by
In which is the total amount of sediment pumped into the upper reservoir under a pumping condition. If the lower reservoir is a river-type reservoir . If the lower reservoir is a basin-type reservoir, is the total incoming sediment minus the siltation, that is, the amount of sediment suspended in the water. is the total water pumped into the upper reservoir, ; here represents the total number of calculation periods under pumping conditions.
The average SCT at power generation time is calculated by
In which is the total amount of sediment flowing into the lower reservoir under a power generation condition, and it is calculated using the same method as , which depends on the shape of the upper reservoir , here represents the total number of calculation periods under power generation conditions.
2.1.3. Model Enhancements
Two key enhancements were introduced to the modeling framework of Wei et al. [29] to incorporate more realistic reservoir operational rules. Firstly, the model’s hydrological forcing has been significantly refined. It accepts high-temporal-resolution (hourly) inputs of water discharge and sediment concentration, moving beyond the previously used daily cyclo-stationary data. This advancement allows the model to faithfully reproduce the dynamics of flood hydrographs. Secondly, the operational rule for the lower reservoir has been fundamentally reconfigured. The model has abandoned the simplified representation of water level fluctuations driven solely by pumping and generation. Instead, it incorporates the additional function of flood control, enabling the simulation of water level during the flood season. This enhancement is critical for assessing the effectiveness of sediment regulation measures, which rely on lowering the water level to discharge sediment.
2.1.4. Calculation Parameters
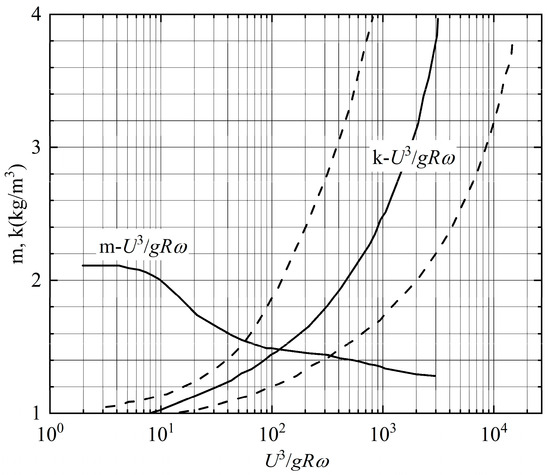
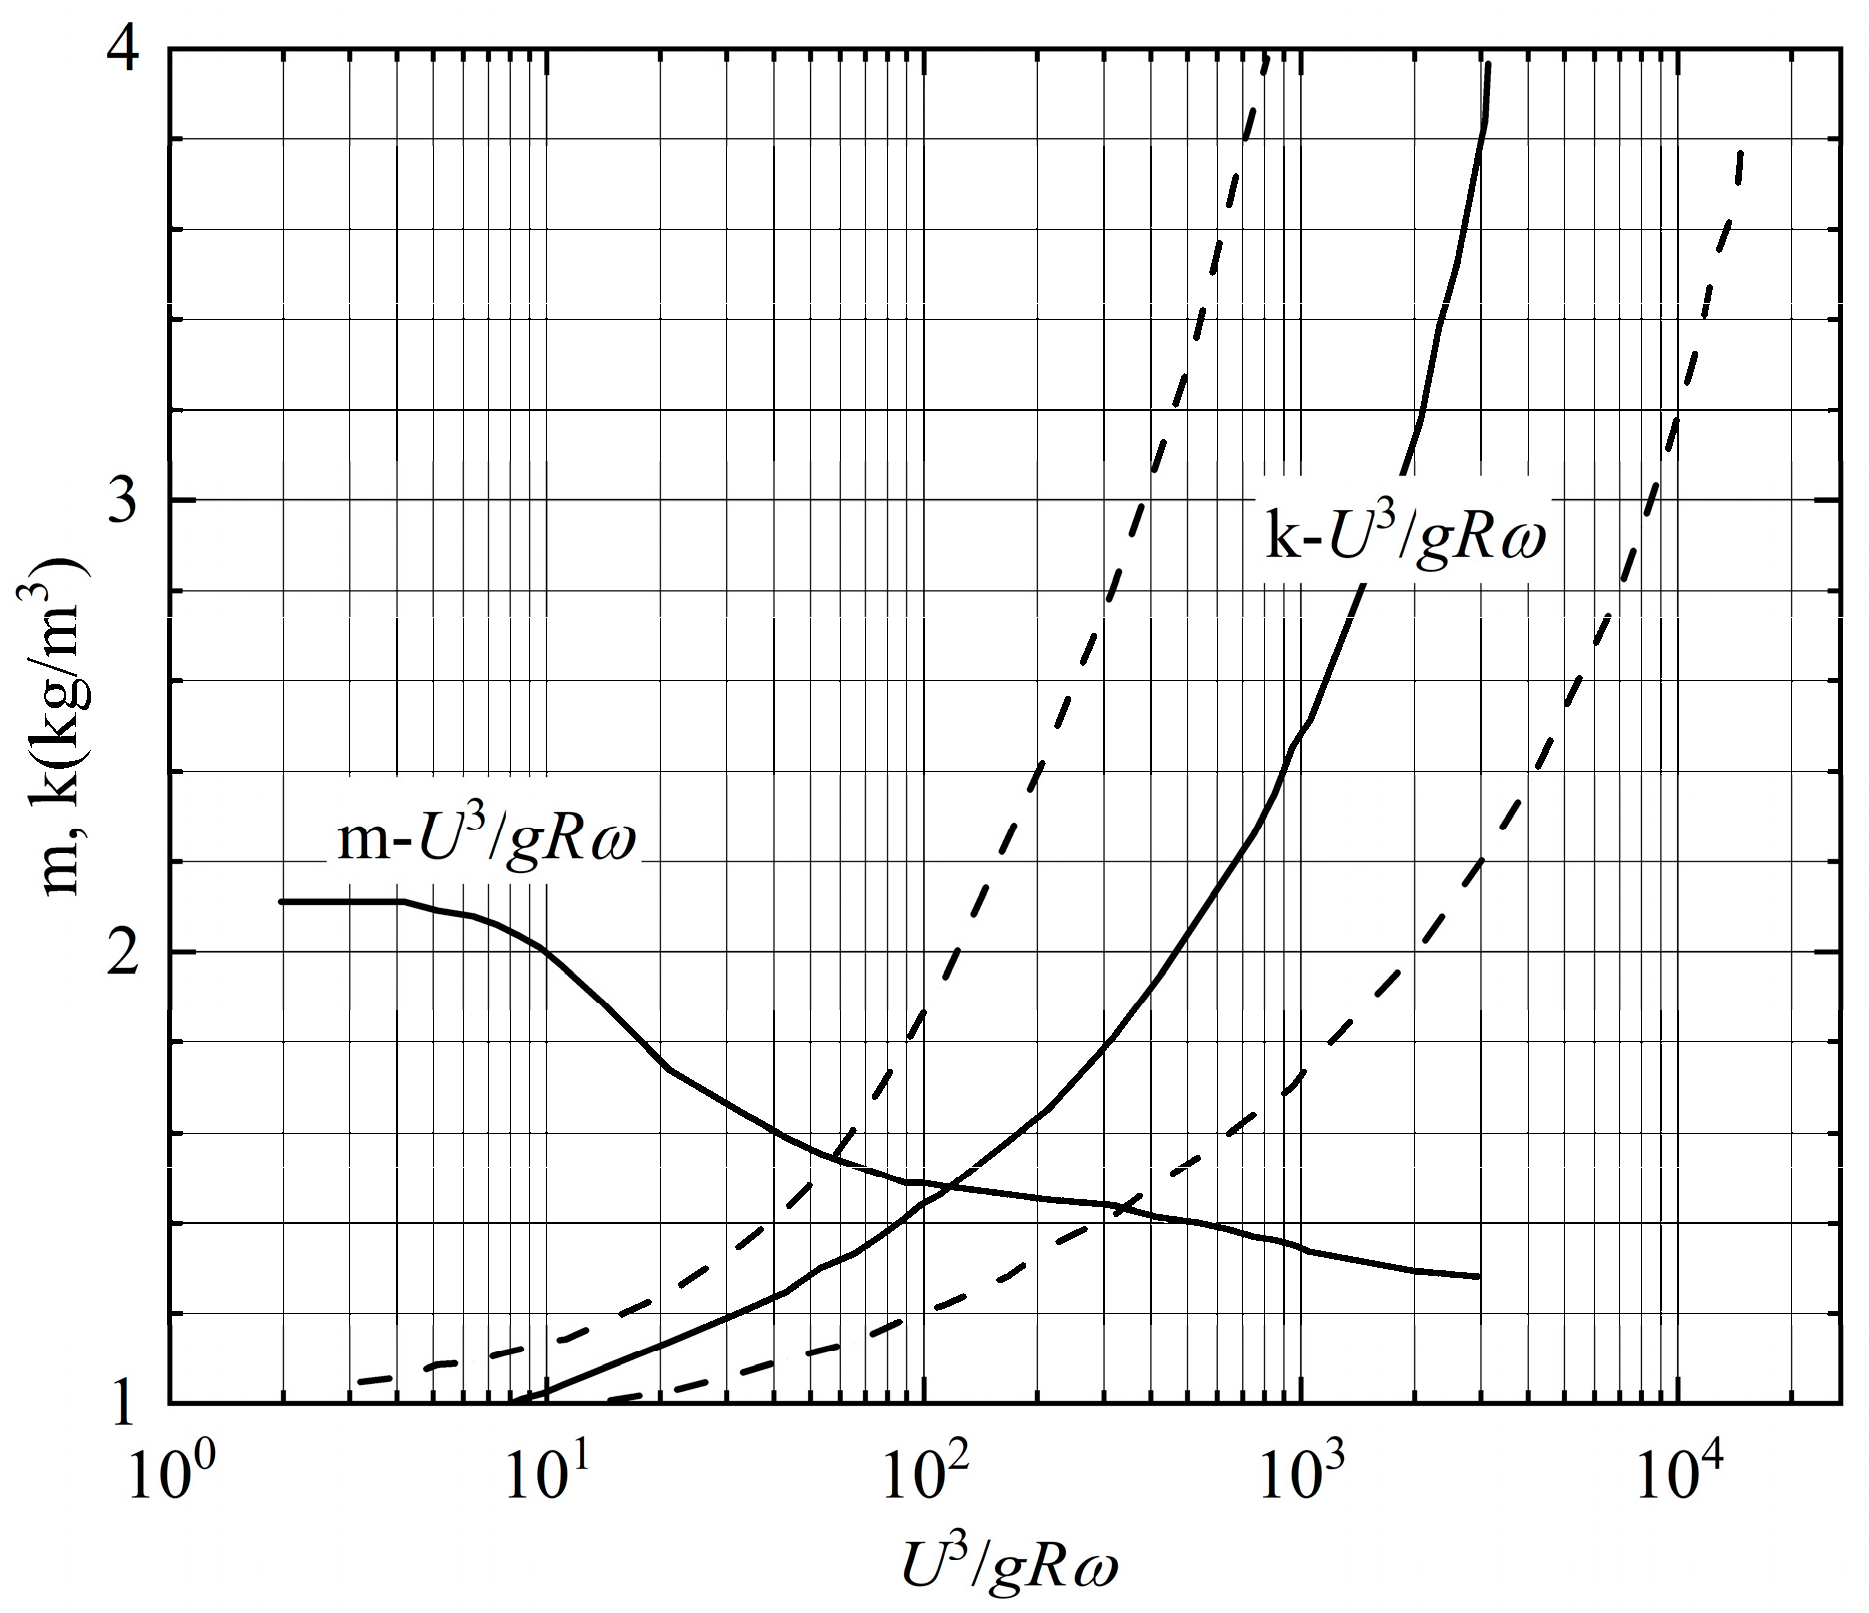
In the one-dimensional sediment mathematical model [29] for the PSPS, calculation parameters are as follows. The friction parameter of the natural river channel is determined to be 0.030 to 0.032 based on a comprehensive analysis of the reservoir area’s cross-sectional shapes, river morphology, and the arrangement of vegetation and bank protection projects on both banks. The determination of parameters k and m follows the chart established by Zhang [34] (Figure 2). According to the hydrodynamic characteristics of the river channel and with reference to the experience of similar projects, k is set to be 0.09 kg/m3, and m is set to be 1.0 in the calculation. The recovery saturation coefficient of suspended sediment is 1 during scouring and 0.25 during sedimentation. The recovery saturation coefficient of bedload in the unbalanced sediment bedload transport model is an empirical parameter related to the adjustment length of the unbalanced transport and is set to be 0.0002–0.002 depending on its location in the reservoir.
Figure 2.
Relationship between m, k, and (refined from Zhang [34]).
2.1.5. Model Validation
Validation against measured and physical model data from BaoQuan Pumped Storage Power Station (China) confirmed that the model can accurately simulate reservoir sedimentation and SCT. Since the overall validation process has been thoroughly detailed in the work of Wei et al. [29], it is not reiterated here. This section focuses on the validation of the roughness parameter. The measured water surface profile from 11 August 2010 was selected for this purpose, with an inlet discharge of 3130 m3/s. A comparison between the measured and calculated water levels at typical cross-sections is presented in Table 1. The results demonstrate good agreement between the calculated and observed values, with a maximum water level error not exceeding 0.02 m, indicating that the roughness parameter is reasonable and reliable.
Table 1.
Comparison of calculated and measured water level at typical cross-sections.
2.2. Sediment Regulation Measures
The RSTS of the lower reservoir is 31, indicating prominent sediment problems in the reservoir. In this section, the factors influencing sediment transport through the turbines are first investigated, followed by the proposal of corresponding mitigation measures based on the findings.
2.2.1. Influencing Factors of SCT
A pure PSPS comprises upper and lower reservoirs (typically of a riverine type), penstocks, and a powerhouse. The facility operates by converting energy between electrical and potential forms through alternating pumping and generating cycles. The upper reservoir is typically an artificial basin characterized by the absence of natural runoff and sediment input. During pumping operations, water drawn from the lower reservoir entrains sediment into the upper basin. A portion of this sediment settles out during subsequent stagnant phases, only to be remobilized and returned to the lower reservoir during electricity production.
To further analyze the deposition processes of sediment upstream of the inlet/outlet, the deposition percentage proposed by Han is introduced [35]. This metric helps quantify the extent of sedimentation and provides a theoretical framework for systematically examining the factors influencing sediment concentration through turbines.
Based on the fundamental Equation for one-dimensional non-equilibrium transport of suspended load (Equation (3)), an analysis of the spatial variation in the deposition percentage along the flow path is conducted.
Assuming that the spatial rate of change of the flow’s sediment transport capacity within the reservoir remains constant (i.e., , where m is a fixed value), the analytical solution to Equation (3) is given by Equation (10). Furthermore, if the cross-sections are equally spaced with a constant interval Δx, Equation (10) can be transformed into Equation (11).
Based on Equation (11), the sediment concentration at the inlet/outlet (i/o) can be expressed as Equation (12). The deposition percentage of graded suspended sediment at section i/o, which is given by Equation (13).
where is the deposition percentage of the k-th sediment fraction at the intake/outlet section, Lio is the distance from the reservoir tail to the inlet/outlet, and is the inflow sediment concentration of the k-th fraction.
As can be observed from Equation (13), the reservoir deposition rate is primarily influenced by the following factors: ① inflow discharge, ② water level in front of the dam, ③ sediment concentration entering the reservoir and particle size distribution, ④ location of the inlet/outlet and its distance from the reservoir tail.
The location of the inlet/outlet is affected by many engineering design factors, so it is more practical to adjust the inflow discharge and/or water depth for water intake and sediment prevention schemes.
2.2.2. Representative Water and Sediment Series
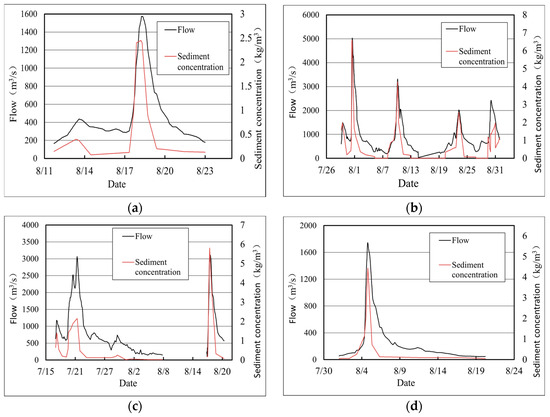
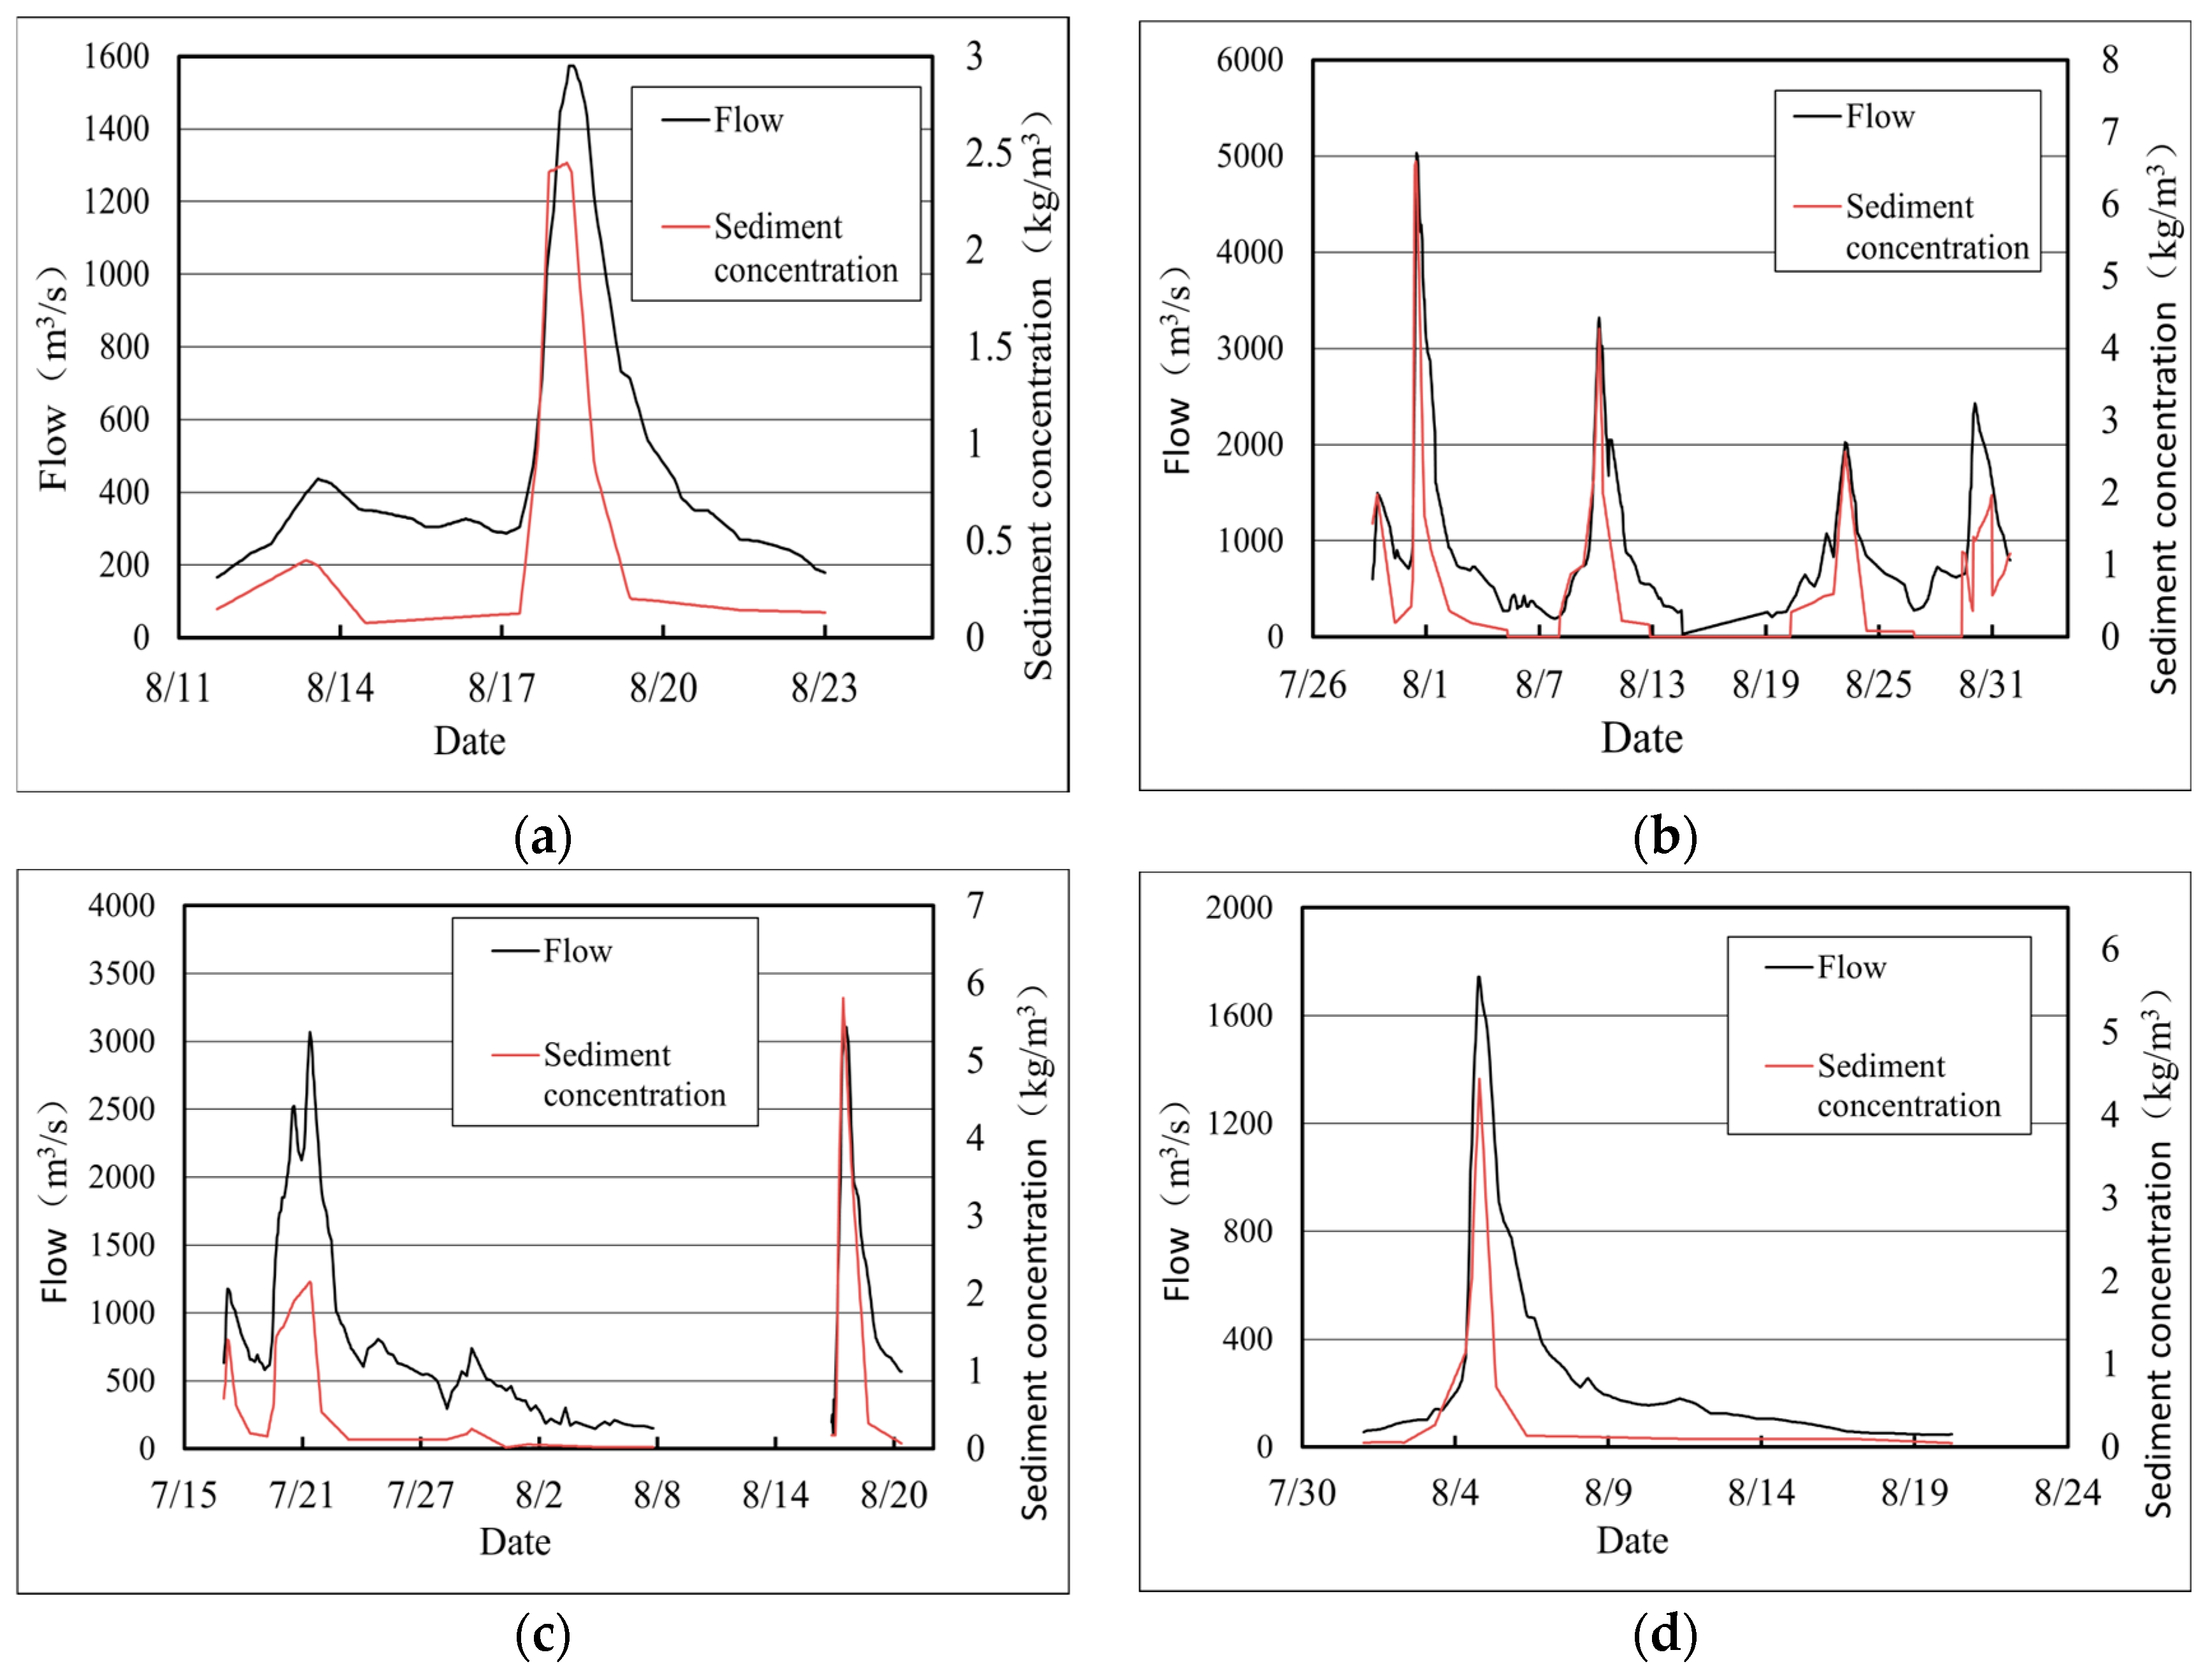
Daily data series (including hourly flood processes) from 2006 to 2016 (with missing data in 2008) are chosen as the representative water-sediment data for the lower reservoir, as shown in Table 2. It can be observed that the representative water and sediment series includes flood, normal, and dry years. The decadal average discharge is 82.63 m3/s, which is close to the multi-year average of 78.2 m3/s. The decadal average suspended sediment load is 84.18 × 10⁴ t, slightly lower than the multi-year average of 107.6 × 10⁴ t. Overall, this series demonstrates reasonably good representativeness. Among the above 10 representative series years, flood events reached the lower reservoir in 2007, 2010, 2013, and 2015. The corresponding hourly variations in flow and sediment conditions during these years are presented in Figure 3.
Table 2.
Annual average flow and suspended sediment of the lower reservoir.
Figure 3.
Hourly processes of water and sediment entering the reservoir in (a) 2007, (b) 2010, (c) 2013, and (d) 2015.
The average flow and sediment transport of the 10 years are scaled to multi-year average values. To simulate the fluctuation of SCT over the power station’s 100-year operation, a 100-year cycle computation is performed. The daily average SCT and annual average SCT during pumping and generating are calculated by dividing the total sediment amount passing through turbines per day and per year by the total water volume during pumping and generating, respectively. During the period of no pumping and no generating, coarser sediment particles may settle to the bottom of the upper reservoir. Generally, the sediment concentration through turbines during pumping is higher than that during generating.
2.2.3. Operation and Dispatching Schemes
Three operation and dispatching schemes are considered in this study.
Scheme 1 is the basic operation and dispatching scheme: ① Non-flood season: Operate according to the operation scheme, with a daily variation range of the lower reservoir water level of 355.5–352.9 m during pumping and generating; ② Main flood season (June–September): Operate routinely, with a daily variation range of the lower reservoir water level of 354.65–351.9 m during pumping and generating.
Scheme 2 considers lowering the lower reservoir’s water level to discharge sediment and free up storage capacity: ① Non-flood season: Operate according to Scheme 1; ② Main flood season: When the peak flow of a flood exceeds 1000 m3/s, start sediment discharge, draw down the water level in front of the dam to 350.5 m for operation as soon as possible after the flood peak, and start impounding when the inflow is less than 700 m3/s.
Scheme 3 considers lowering the water level to discharge sediment and shutting down the unit to avoid sediment during sediment peak processes: ① Non-flood season: Operate according to Scheme 1; ② Main flood season: Operate according to Scheme 2; ③ Shutdown for sediment avoidance: The preliminary-agreed condition is to shut down the unit when the inflow to the lower reservoir exceeds 2000 m3/s and resume operation when it drops below 2000 m3/s. A comparative analysis is conducted on the reduction in the multi-year average SCT and the SCT (including instantaneous values) in the flood season by shutdown for sediment avoidance.
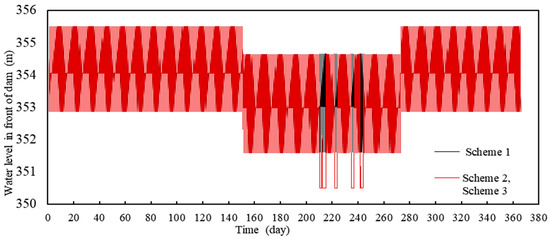
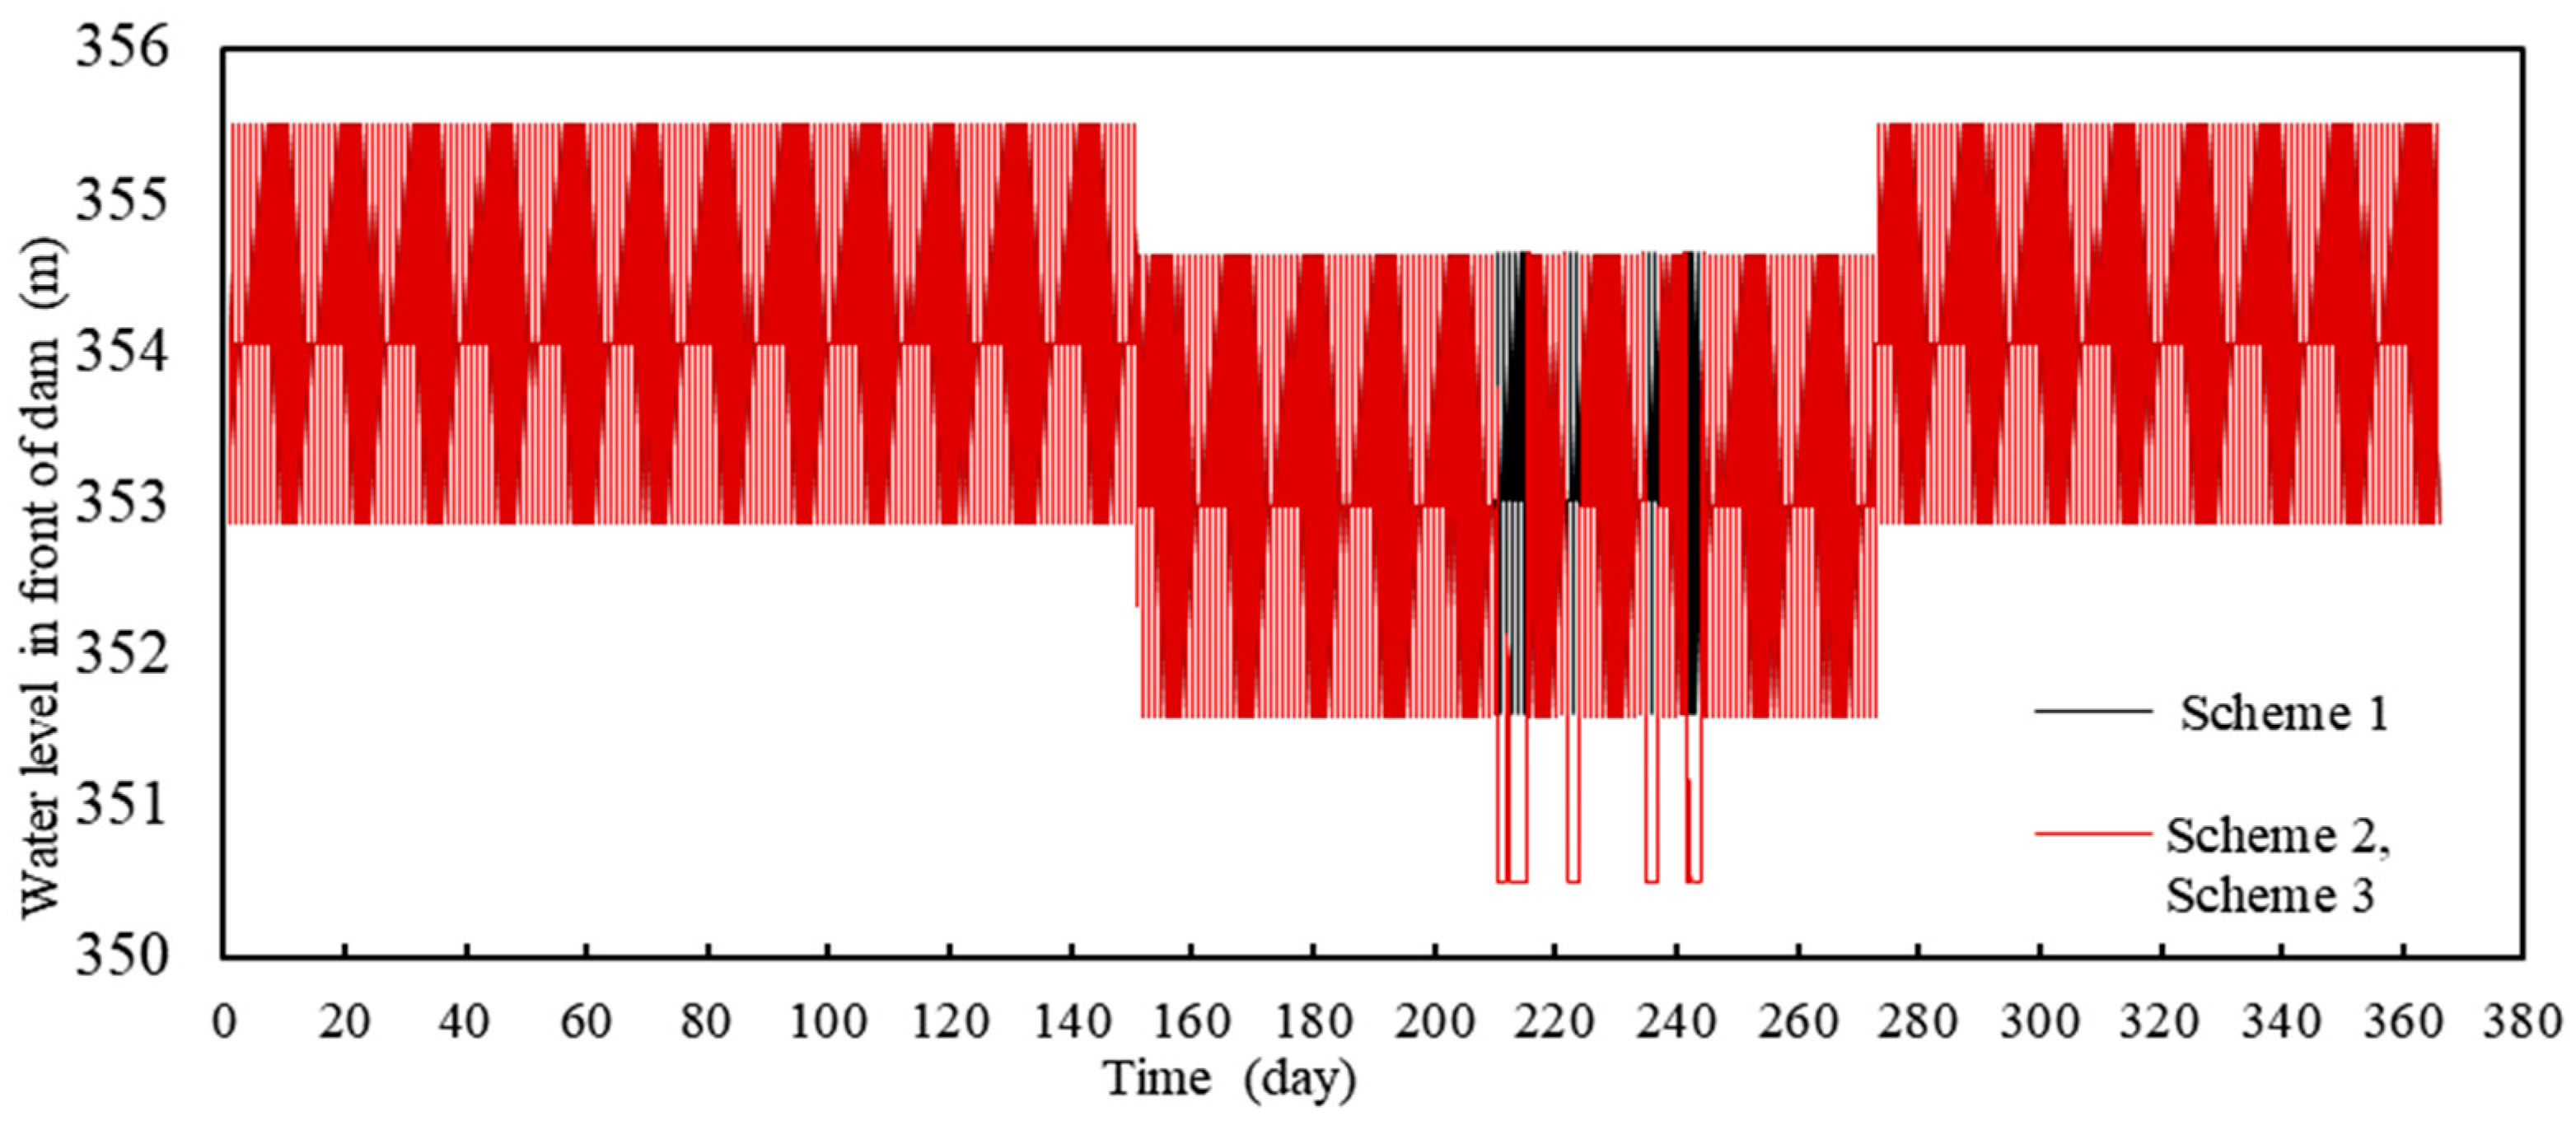
Taking the year 2010 as an example, the water levels at the dam site under Schemes 1, 2, and 3 are shown in Figure 4. During the non-flood season, the daily variation range of the water levels of the lower reservoir under each scheme is 355.5–352.9 m. During the flood season (June–September), the water level at the dam site under Schemes 2 and 3 is 354.65 m. At 8:00 on 31 July 2010, when the inflow discharge exceeds 1000 m3/s, the water level is lowered to 350.5 m as soon as possible. At 12:00 on 2 August 2010, when the inflow discharge is less than 700 m3/s, the reservoir starts to impound water. In the selected 10-year water-sediment series, during the periods of 9:00 on 31 July to 11:00 on 1 August 2010; 22:00 on 9 August to 20:00 on 10 August 2010; 5:00 to 7:00 on 23 August 2010; 23:00 on 29 August to 13:00 on 30 August 2010; 6:00 on 20 July to 21:00 on 21 July 2013; and 8:00 to 22:00 on 17 August 2013, when the inflow discharge exceeds 2000 m3/s, Scheme 3 adopts the measure of shutting down the unit to avoid sediment, with a total of 120 h of shutdown for sediment avoidance in 10 years.
Figure 4.
Comparison of the water level processes in front of the dam under Schemes 1, 2, and 3 (2010).
3. Results and Analysis
3.1. SCT Under Basic Operation and Dispatching
3.1.1. Annual Average Sediment Concentration and Particle Size Through Turbines
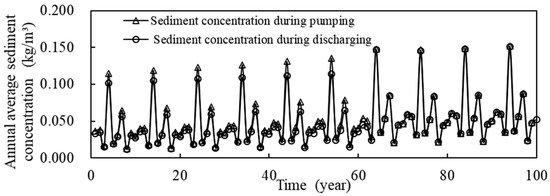
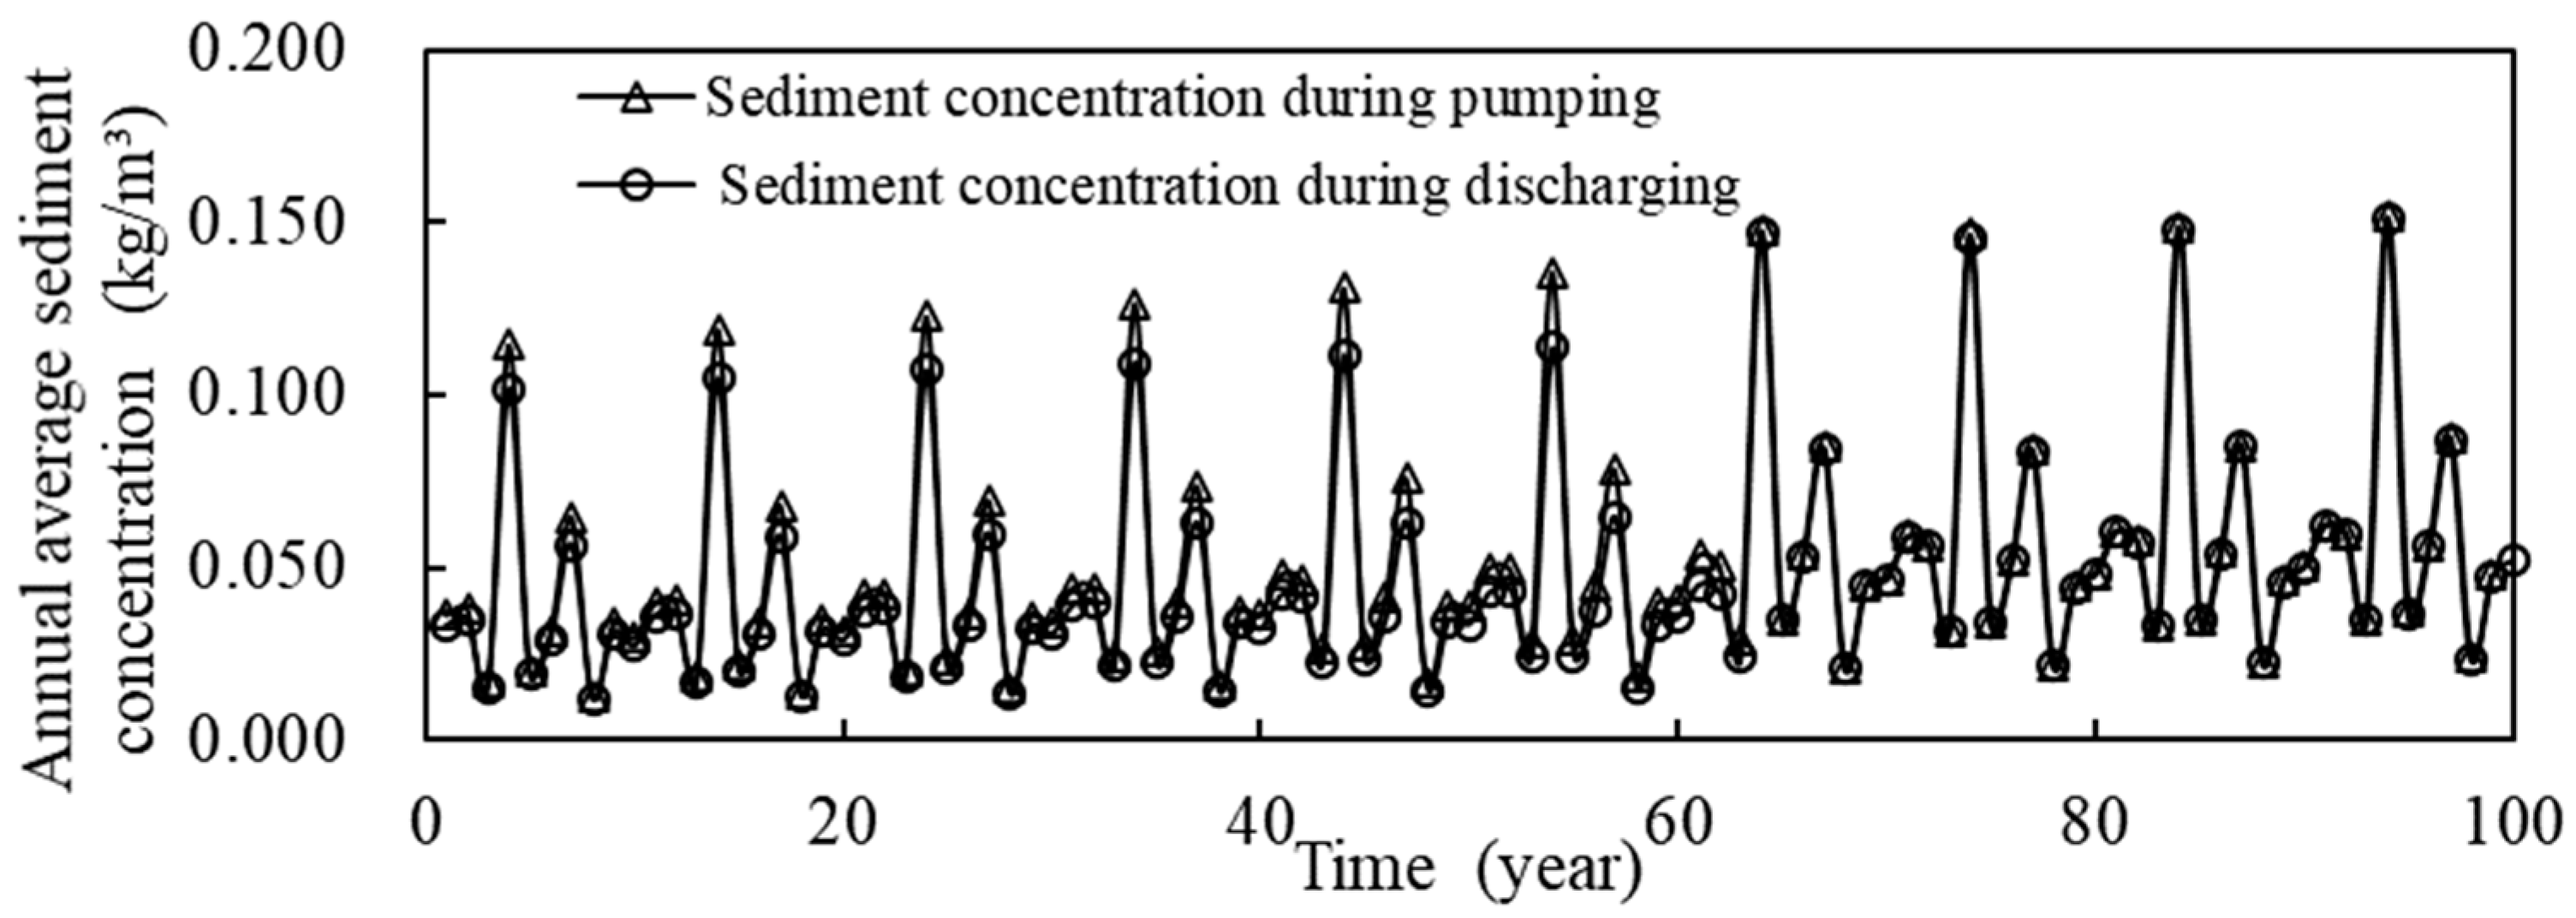
Taking Scheme 1 as an example, Figure 5 shows the annual average SCT during pumping and generating within 100 years of operation of the PSPS. The annual average SCT is between 0.013 and 0.152 kg/m3.
Figure 5.
Annual average sediment concentration through turbines under Scheme 1.
Table 3 presents a comparison between the gradation of suspended sediment entering the reservoir and that of the average SCT in different sedimentation years under Scheme 1. The suspended sediment entering the reservoir has a maximum particle size of 0.5 mm, with 57.8% of its particles finer than 0.05 mm. After entering the reservoir, the sediment whose particle size is larger than 0.05 mm settles along the way. A relatively large deposition thickness occurs at the inlet/outlet of the lower reservoir, located approximately 2/3 of the length of the lower reservoir’s main stream from the reservoir tail. However, due to the relatively large sedimentation thickness near the lower reservoir’s inlet/outlet, the previously deposited sediment is stirred up during pumping and hydraulic discharging. For the sediment through turbines, the median (D50) and average (Da) particle sizes range from 0.029–0.037 mm to 0.053–0.068 mm, respectively, while the maximum particle size is 0.25 mm.
Table 3.
Gradations of average sediment concentration through turbines in different years of siltation.
3.1.2. Relationship Between SCT and Sediment Inflow to the Reservoir
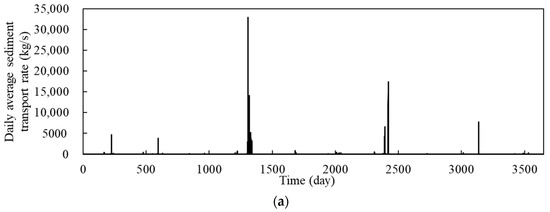
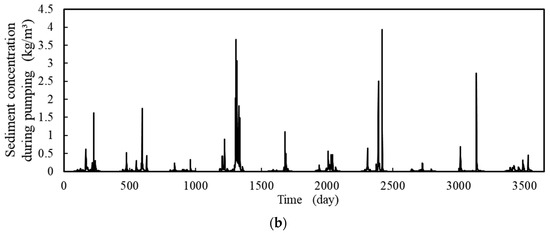
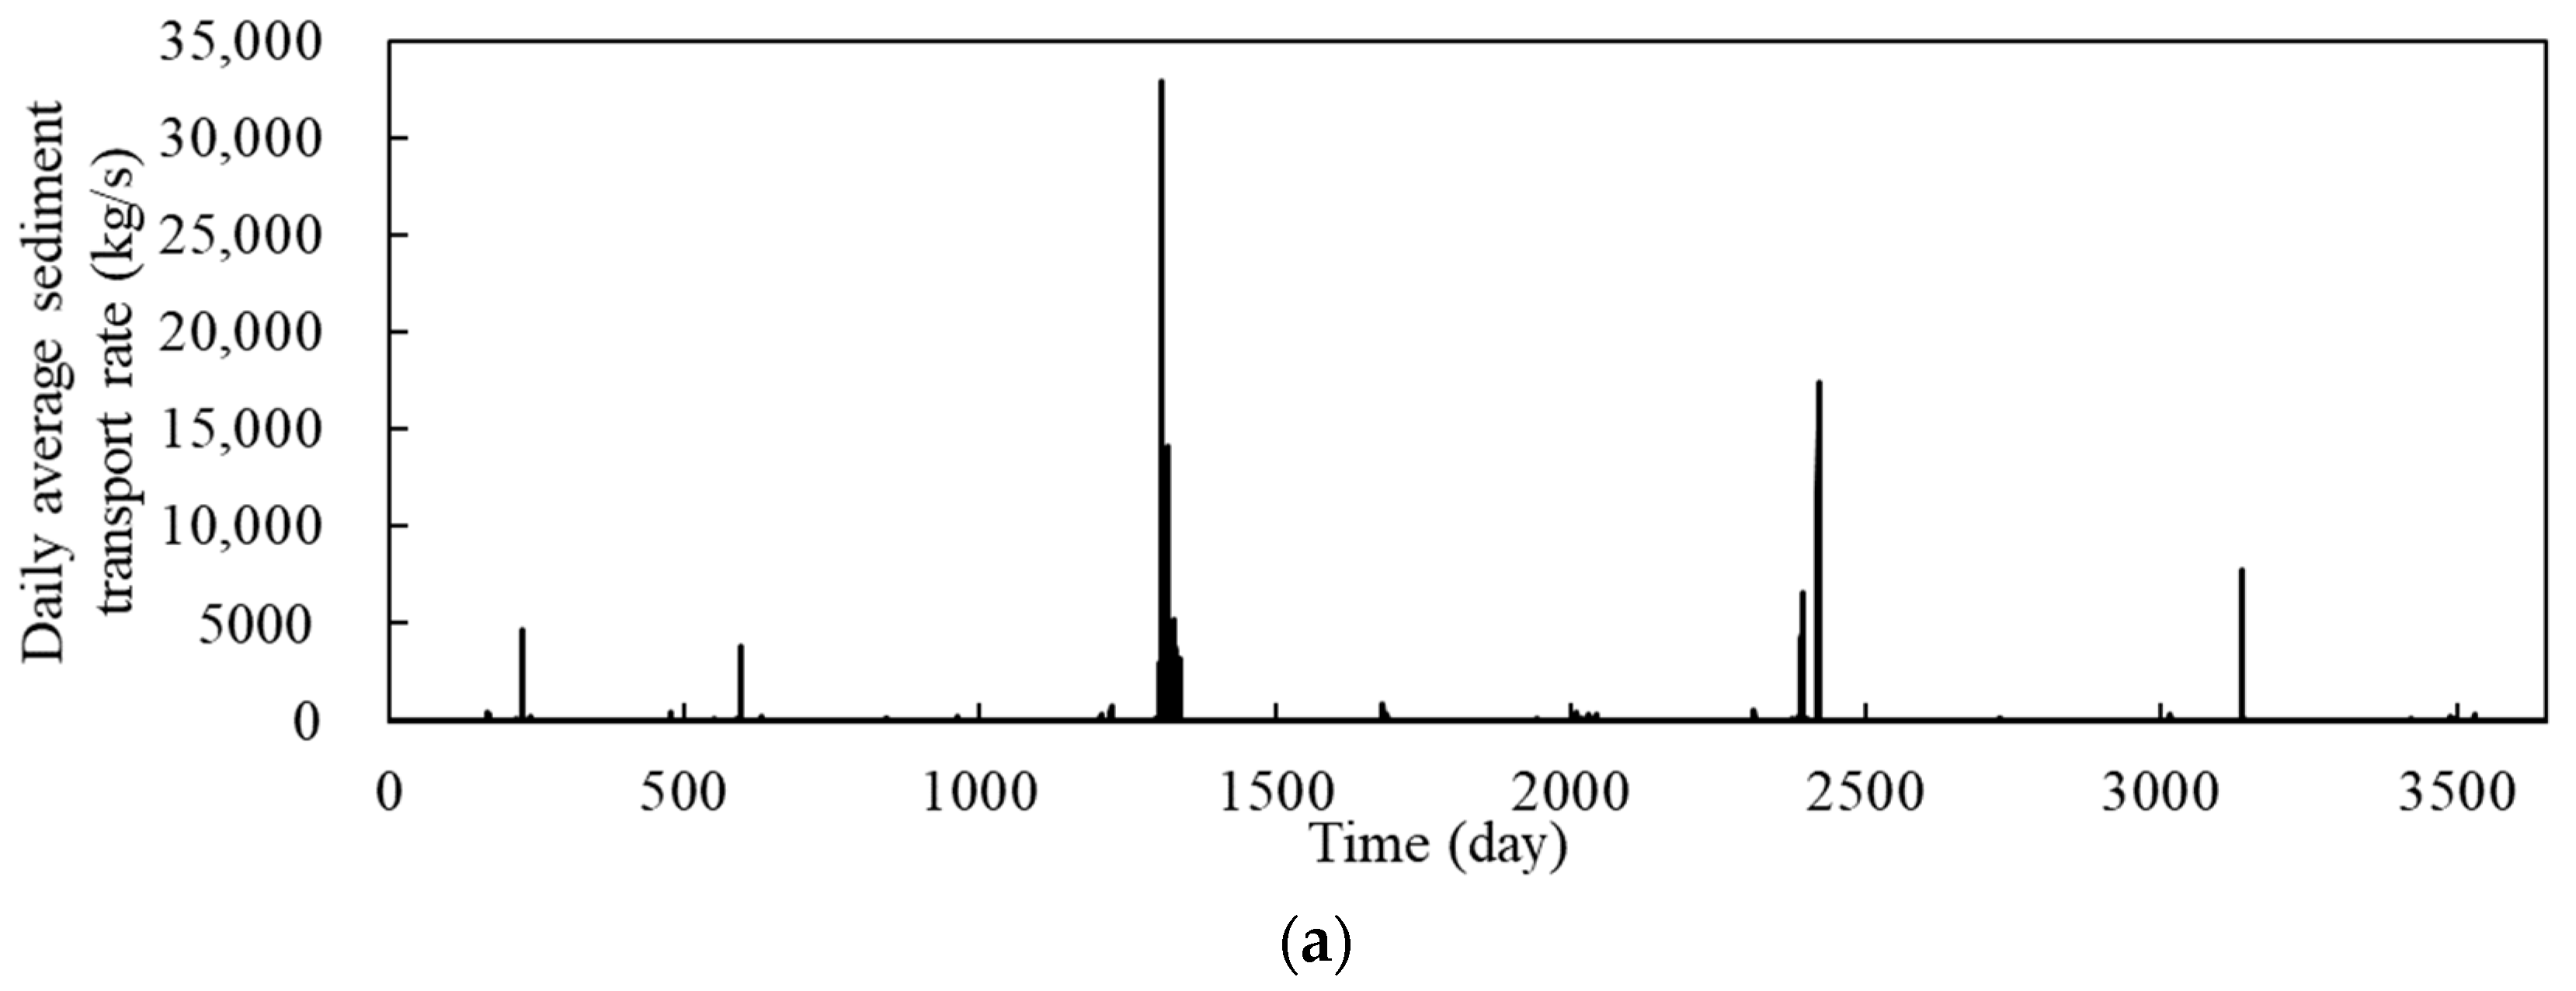
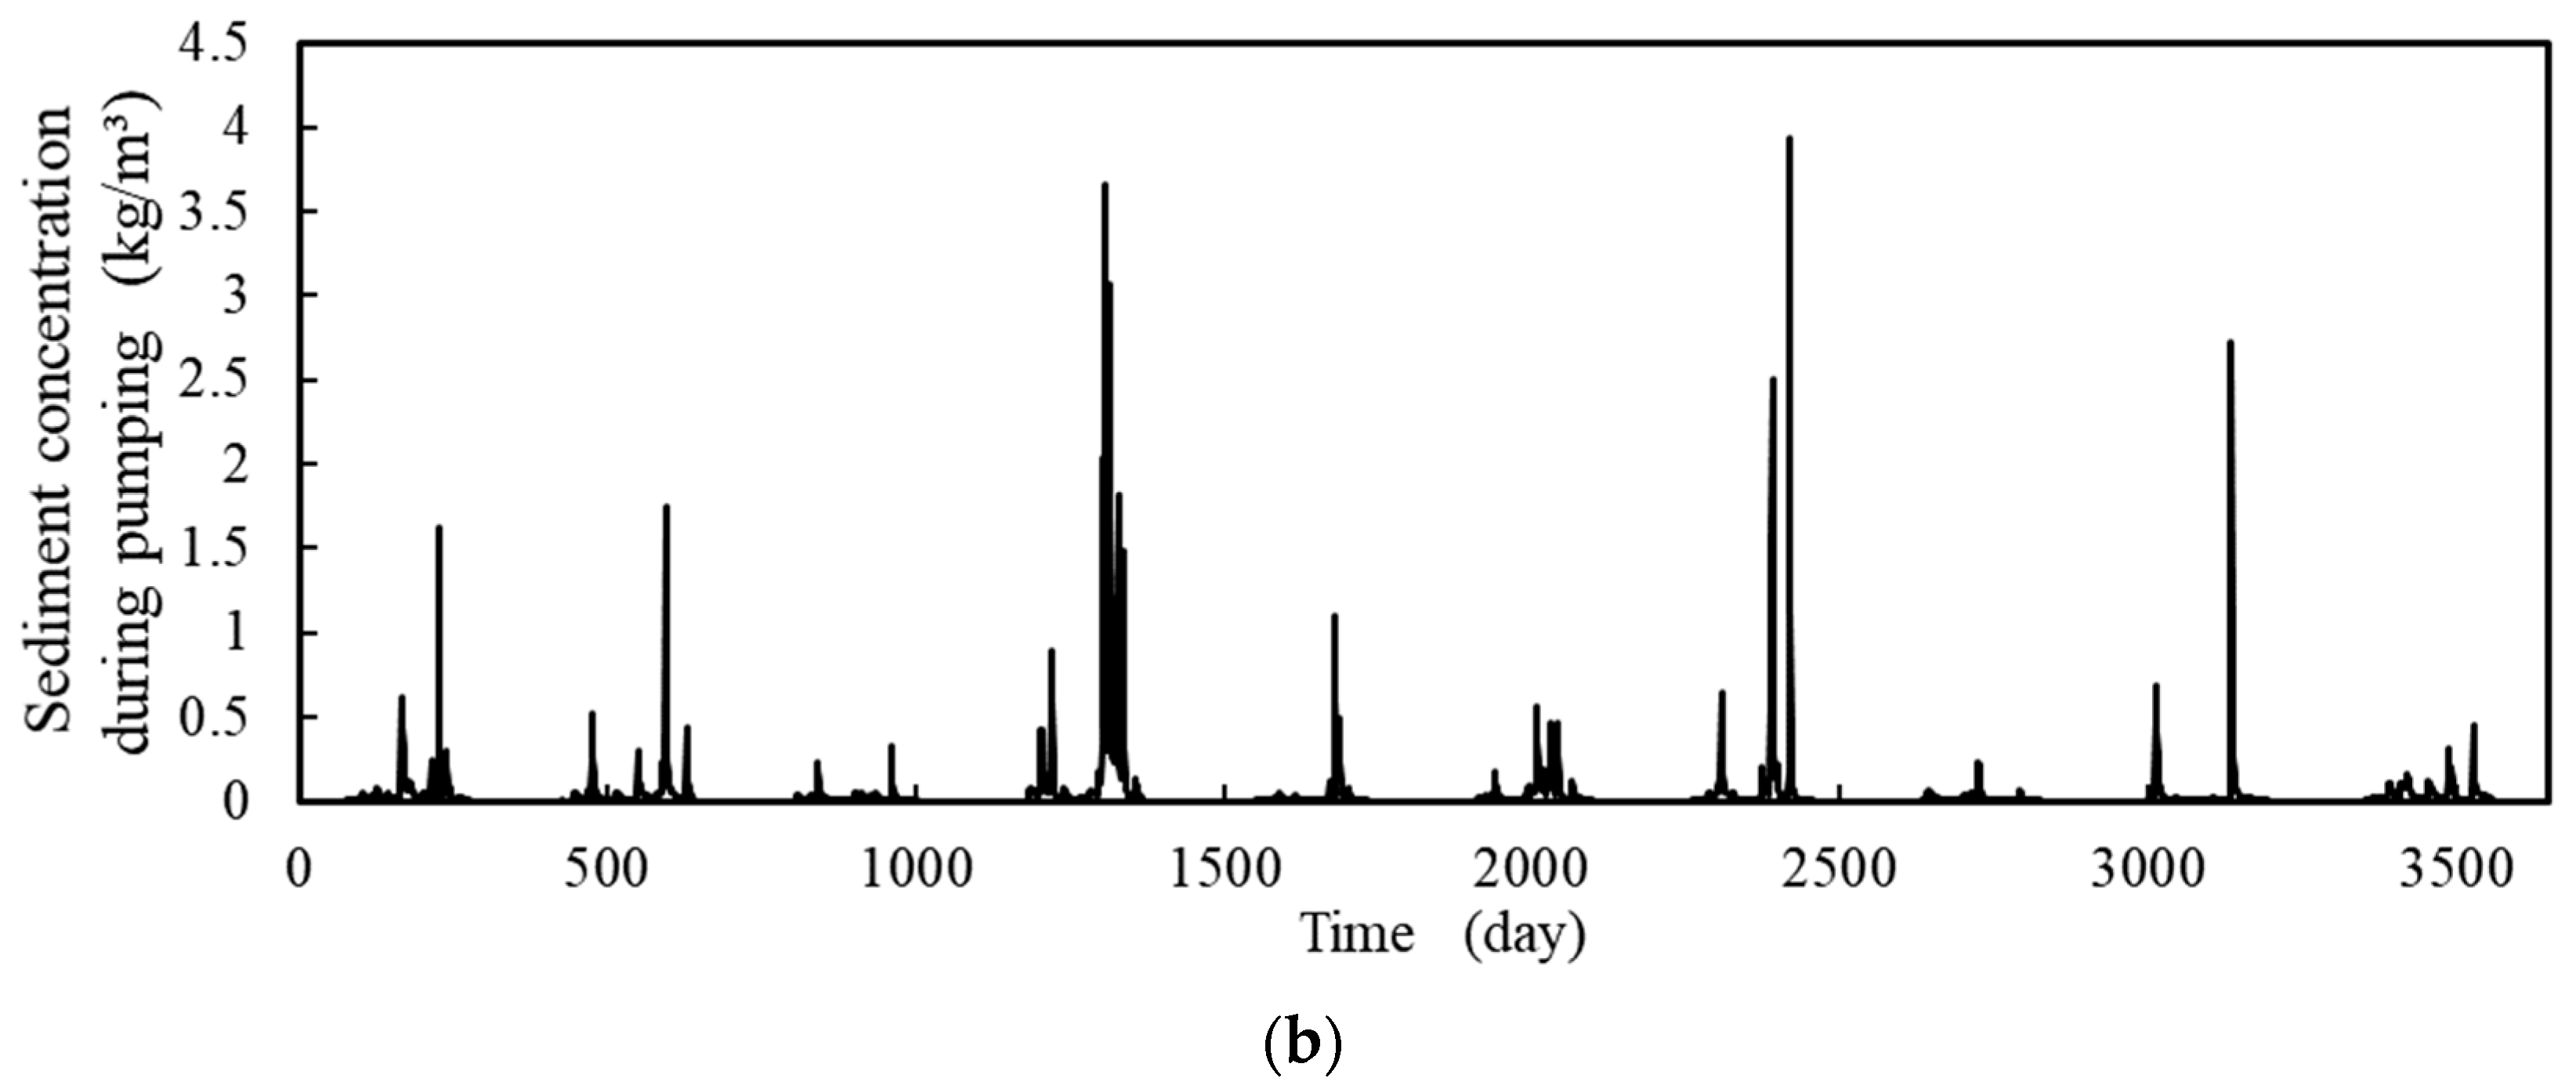
The upper reservoir’s catchment area is smaller. Therefore, water and sediment reach this reservoir in restricted quantities. The lower reservoir’s catchment area is greater, and its incoming water and sediment are the primary supplies of water and sediment for the power station, having a significant influence on SCT. Taking the first decade of operation as an example, Figure 6 shows the variation in the lower reservoir incoming sediment transport rate and SCT during pumping.
Figure 6.
(a) Daily average sediment transport rate entering the lower reservoir; (b) SCT during pumping.
The variation trend of the turbine sediment concentration is strongly correlated with the variation in the incoming suspended sediment transport rate. The greater the daily sediment transport rate into the lower reservoir, the higher the daily average SCT. The maximum daily average SCT during pumping is 4.0 kg/m3. The moment when the maximum SCT occurs corresponds to the peak of the incoming sediment transport rate, and a lag effect of SCT is observed following the sediment peak. That is, the sediment concentration remains above 0.05 kg/m3 for a duration of 10–30 days after the sediment peak.
3.1.3. Relationship Between the Process of Sediment Through Turbines and the Sedimentation Characteristics of the Lower Reservoir
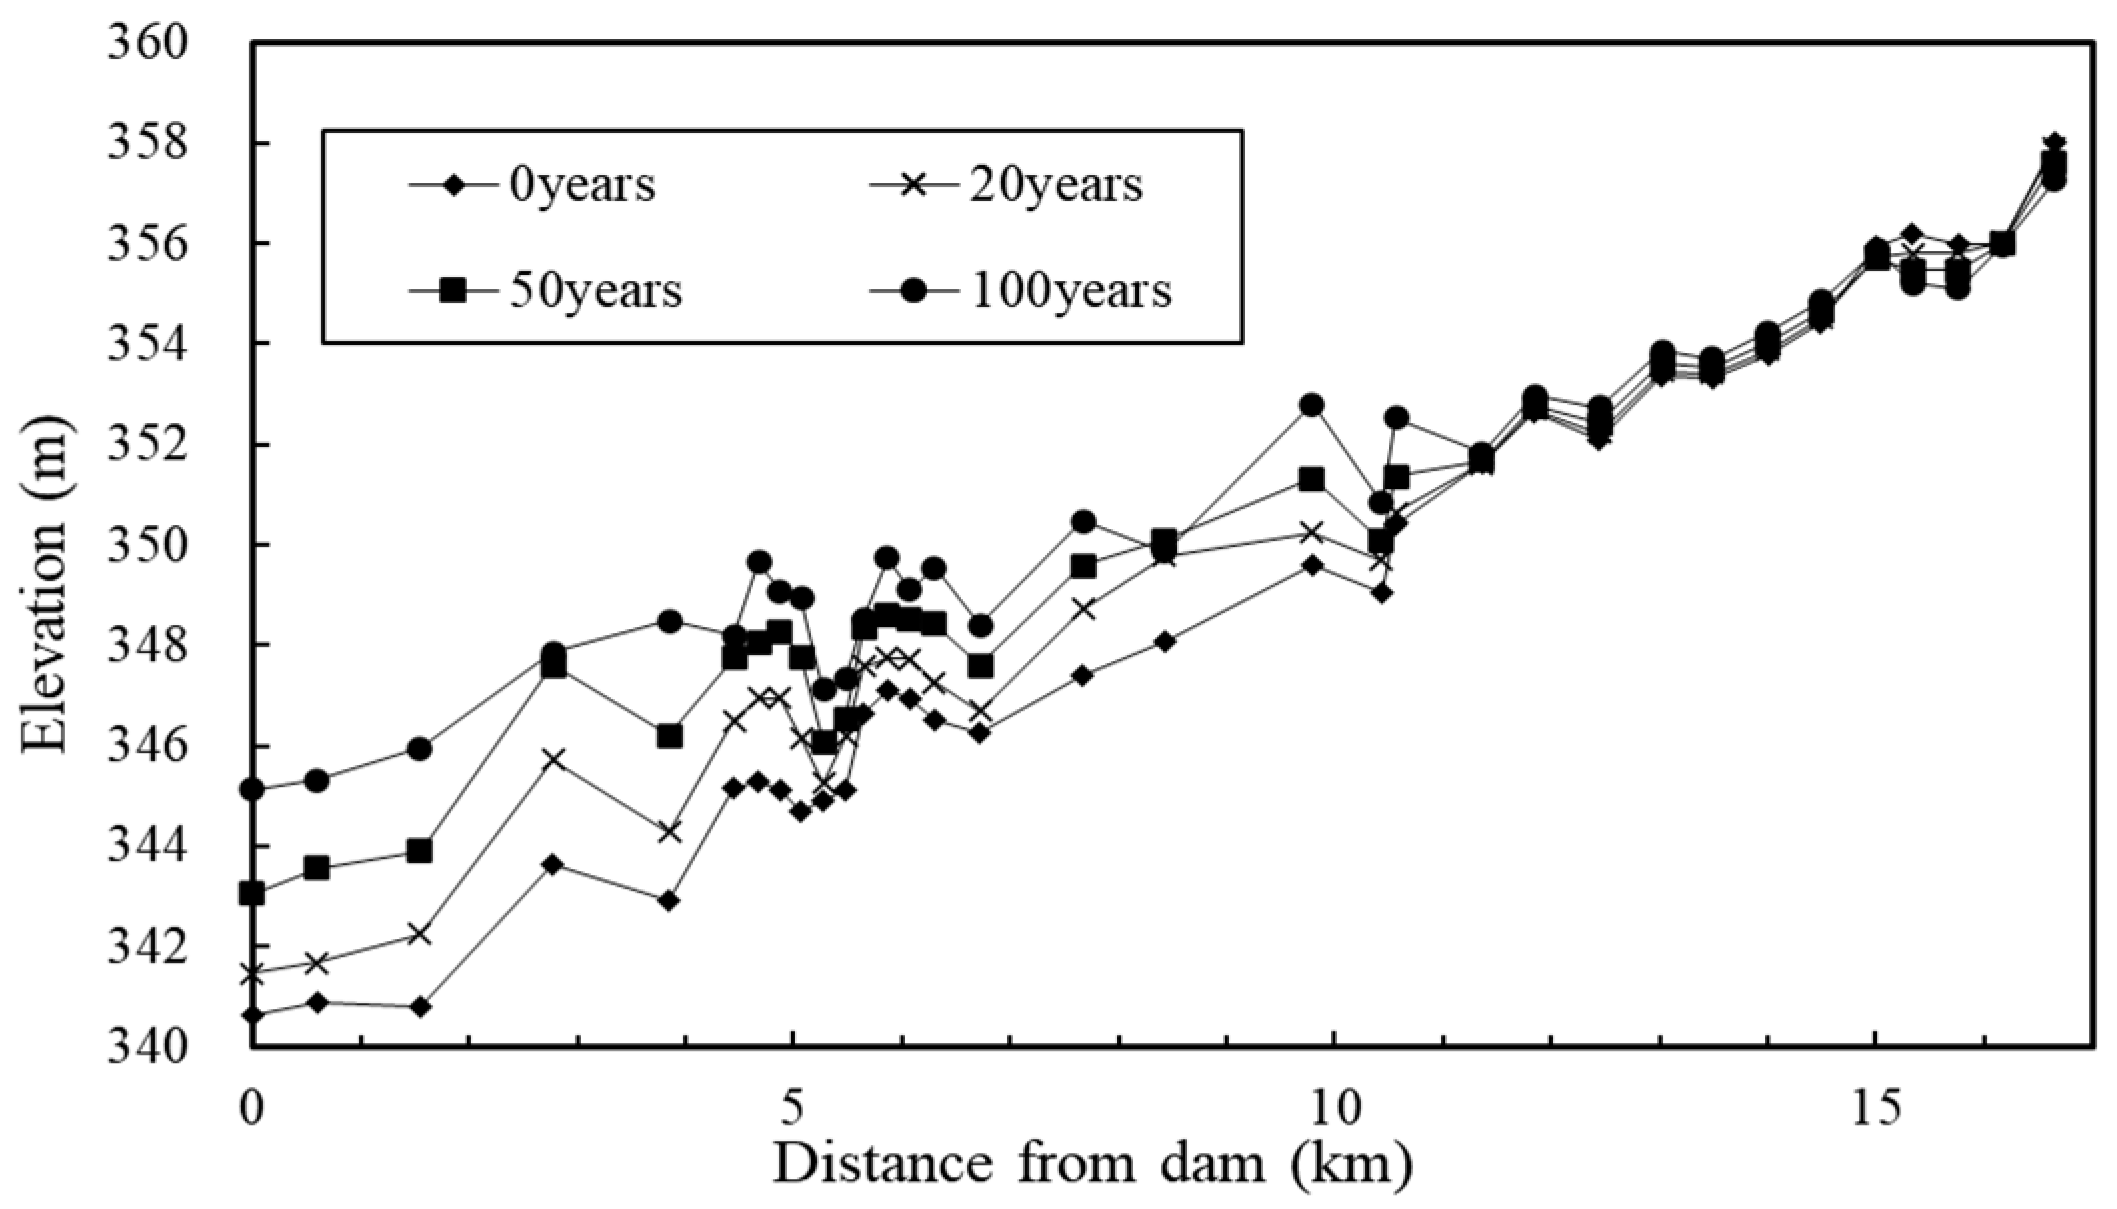
During the pumping and generating processes of the PSPS, the flow structure near the lower reservoir’s inlet/outlet is complex. The flow velocity and direction change continuously in response to pumping and generating operations, leading to more variable sediment movement. The longitudinal development of reservoir sedimentation is a direct manifestation of the along-the-way developing process of unbalanced sediment transport, which affects SCT and its gradation. Within the 100-year operational period of the power station, the longitudinal distribution of sedimentation in the lower reservoir is shown in Figure 7.
Figure 7.
Variation in the thalweg in the main stream of the lower reservoir during the 100-year operational period.
The sedimentation in the main stream of the lower reservoir basically takes the form of a delta and gradually advances towards the dam, and the delta advances to the dam front to form conical sedimentation after 50 years. The main sedimentation area is in the river channel within 11.36 km in front of the dam. The lower reservoir’s inlet/outlet is 5.48 km away from the dam, accounting for approximately 1/3 of the lower reservoir’s main stream length. After 100 years, the maximum sedimentation thickness near the lower reservoir’s inlet/outlet is 2.2–5.0 m, which results in a large loss of the flow cross-section.
The RSTS of 31 of the lower reservoir indicates a rather significant rate of storage capacity loss. After 20 years of operation, the lower reservoir has a storage capacity loss rate of 7.68%, and the sediment discharge ratio for the suspended sediment entering the reservoir is 78.54%. After a century of operation, the effective storage capacity loss rate is 27.78%, and the sediment discharge ratio is 88.17%.
3.2. Effect of Sediment Regulation Measures on Reducing SCT
According to Table 4, the sediment discharge ratio of the lower reservoir rises from 78.54–88.17% (Scheme 1) to 84.50–91.91% when the water level is lowered to discharge sediment during the flood season under Scheme 2, while the effective storage capacity loss rate falls to 4.51–18.37%. Scheme 3 shuts down the unit to avoid sediment when the flow exceeds 2000 m3/s, and the effective storage capacity loss rate of the lower reservoir slightly increases to 4.56–18.49% compared with Scheme 2.
Table 4.
Comparison of Calculation Results under Different Schemes.
During the first 20 years of operation, lowering the water level to discharge sediment in Scheme 2 during the flood season leads to a slight increase in the SCT during pumping. For example, the average SCT during pumping in the first 20 years under Scheme 1 is 0.041 kg/m3, while that of Scheme 2 is 0.042 kg/m3. This increase in the sediment concentration under Scheme 2 also results in a greater sedimentation amount in the upper reservoir, with 247,000 m3 of sedimentation in Scheme 1 compared to 278,000 m3 in Scheme 2. Due to the large sedimentation amount of the lower reservoir in Scheme 1, both the cross-sectional area and the water depth at the same water level decrease over 20 to 100 years of operation. This renders the river reach near the lower reservoir’s inlet and outlet more capable of carrying sediment.
Therefore, the SCT during pumping in Scheme 1 is higher than that in Scheme 2 during this period. In Scheme 3, where the unit is shut down to avoid sediment, the SCT decreases significantly, with a reduction efficiency of approximately 26%.
The number of hours during which the SCT during pumping exceeds 1, 1.5, 2, 3, 4, and 5 kg/m3 in the first decade is statistically analyzed, with the results shown in Table 5. In the first 10 years, the duration of exceedance of the critical sediment concentration under Scheme 2 is consistently longer than that under Scheme 1, due to the operation of lowering the water level to discharge sediment. Scheme 3 adopts the measure of shutting down the unit to avoid sediment when the flow exceeds 2000 m3/s, resulting in a total of 120 h of shutdown for sediment avoidance in the selected 10-year water-sediment series. Therefore, the SCT is greatly reduced, with no concentration greater than 3 kg/m3.
Table 5.
Hours when Turbine Sediment Concentration Exceeded Threshold in the First Decade (h).
3.3. Effect of Sediment Regulation Measures on Reducing Unit Abrasion
3.3.1. Effect of Sediment Passing Through Turbines and Its Particle Size on Cavitation in Pressure Pipelines
In high-velocity hydraulic structures, if the shape is unreasonable or there are uneven parts on the flow-passing surface, low-pressure zones will appear in the flow field. When the pressure is below the vaporization pressure of water, cavitation occurs [36,37]. In non-aerated water flow, the above vapor bubbles collapse rapidly, and the collapse pressure can reach thousands of atmospheres near the collapse center. Cavitation erosion occurs when bubbles collapse on the fixed boundary, causing impact normal forces on the material surface and fatigue damage. The cavitation characteristics of water flow are generally expressed by the dimensionless parameter “flow cavitation number” σ composed of pressure and velocity head [38,39,40]. The σ was defined as:
where h0 is average dynamic water pressure head (m) with a specified value of 0; ha is atmospheric pressure head (m), calculated as ha = 10.33–0.00113Y, in which Y is the elevation of the project site (Y = 342 m); hv is vaporization pressure head of water (m) taken as 0.248 assuming an ambient temperature of 20 °C, and v0 represents the average velocity through the pumping and generating penstocks (m/s).
In this study, as the power generation discharge flow is 609 m3/s and the diameter of the pumping and generating penstocks is 6 m, the “flow cavitation number” σ of the penstocks is approximately 0.41. The judgment standard for the flow cavitation number (σ) is as follows: σ > 1.7 requires no protective measures; 1.7 > σ > 0.3 requires strict control of surface unevenness; 0.3 > σ > 0.12 necessitates aeration facilities; and σ < 0.12 demands design modification. Considering the 0.25 mm maximum sediment size through turbines, the unevenness of the penstocks of this PSPS should be strictly controlled.
3.3.2. Analysis of Sediment Regulation Measures to Reduce Unit Abrasion and Extend Overhaul Cycle
Investigations on the actual sediment wear damage of turbines and pumps in multiple projects [41] reveal a strong correlation between the relative outlet velocity of turbines, the outlet linear velocity of pumps, and the wear damage. Consequently, the relative outlet velocity of turbines and the outlet linear velocity of pumps can serve as effective indicators of the wear damage degree of turbines and pumps, respectively. The working head of the pump-turbine in pump mode depends on the linear velocity at the runner outlet. The higher the head, the greater the linear velocity. Additionally, sediment-induced wear on the guide vanes exceeds that on the runner.
This implies that the high flow velocities induced by a high head acutely exacerbate wear. Furthermore, the wear rate is the core factor determining the turbine’s overhaul cycle (another factor being cavitation erosion). Among the numerous factors affecting turbine wear, the primary ones related to water and sediment conditions are the sediment concentration and the velocity through turbines. The wear rate follows a cubic relationship with flow velocity and is directly proportional to the sediment concentration. In summary, by increasing the flow velocity, a high head exacerbates wear exponentially, thereby directly governing the intervals between major overhauls [42,43].
Take the observation results of turbine wear at Yuzixi Hydropower Station as an example. Yuzixi Hydropower Station is on Yuzi Creek, a right-bank tributary of China’s Min River, and was constructed for power generation in 1972. The head of Yuzixi Hydropower Station is 255.0 m. During the flood season, the daily average SCT ranges from 0.15 to 0.19 kg/m3, peaking at 1.45 kg/m3. Unit No.2 required an overhaul after operating for just over one year (11,000–16,500 h) [44], with the top cover worn to a depth of 3–5 mm. The measured gradation of suspended sediment entering the reservoir and the content of hard minerals in each particle size group are shown in Table 6 [45]. The median (D50) and average particle sizes of the incoming suspended sediment are 0.090 mm and 0.17 mm, respectively, with 16.7% of the sediment being coarser than 0.25 mm. Hard minerals (Mohs hardness > 5) account for 59.5–86.1% of the total mineral composition.
Table 6.
Gradation of Suspended Sediment Entering the Reservoir and Hard Mineral Content of Each Particle Size Group at Yuzixi Hydropower Station.
In this study, the proportion of hard minerals with a Mohs hardness greater than 5 in the mineral components of the suspended sediment is 59.6% near the dam site of the lower reservoir of the PSPS studied, which is basically equivalent to the proportion of those in the suspended sediment entering the reservoir of Yuzixi Hydropower Station (59.5–86.1%). The water head difference between the upper and lower reservoirs of Yuzixi Hydropower Station is approximately 195 m. Based on the principle that the wear rate of sediment on the runner and flow-passing component is proportional to the sediment concentration [46,47,48,49] and to the cube of the sediment-laden flow velocity. By analogy with the parameters and the SCT of Yuzixi Hydropower Station, the overhaul time of the pump-turbine can be calculated.
- (1)
- Under the basic operation and dispatching conditions, the annual SCT and multi-year average SCT are 0.013–0.152 kg/m3 and 0.036–0.062 kg/m3, respectively. The multi-year average annual SCT during the flood season is approximately 0.080–0.152 kg/m3, and it is estimated that the pump-turbine needs to be overhauled after operating for approximately 34,100–51,150 h.
- (2)
- Under the strategy of lowering the reservoir level in the flood season, the SCT ranges from 0.012–0.143 kg/m3 (annual average) to 0.037–0.052 kg/m3 (multi-year average) for pumping and generating, respectively. The multi-year average annual SCT during the flood season is approximately 0.083–0.118 kg/m3, and it is estimated that the pump-turbine needs to be overhauled after operating for approximately 39,600–59,400 h.
- (3)
- Under the strategy of lowering the water level and shutting down the unit to avoid sediment during sediment peaks in the flood season, the SCT ranges from 0.011–0.10 kg/m3 (annual average) to 0.030–0.044 kg/m3 (multi-year average) for pumping and generating, respectively. The multi-year average annual SCT during the flood season is approximately 0.061–0.096 kg/m3. It is estimated that the pump-turbine needs to be overhauled after operating for approximately 50,600-75,900 h.
Minerals that possess a Mohs hardness exceeding 5 can generally be classified as dolomite or amphibole. Hard minerals (Mohs hardness > 5) constitute 59.6% of the suspended sediment, lower than that at Yuzixi First-Level Hydropower Station (59.5–86.1%). The head of Yuzixi Hydropower Station is 255 m. The water head difference between the upper and lower reservoirs of this PSPS is approximately 195 m. Therefore, the predicted abrasion and overhaul years are conservative based on Yuzixi First-Level Hydropower Station.
4. Discussion
4.1. Mechanisms Underlying the Performance of the Three Dispatch Schemes
The results show that Scheme 3 demonstrates the best comprehensive performance, followed by Scheme 2, with both outperforming Scheme 1. The underlying physical mechanisms can be explained as follows.
During the flood season, Scheme 2 (lowering water levels during the flood season) increases flow velocity on the cross-section. The sediment transport rate is positively correlated with flow velocity [50]. Consequently, Scheme 3 simultaneously increases SCT during the flood season, resulting in higher values compared to Scheme 1. In addition, this active sediment discharge strategy effectively reduces reservoir sedimentation, preserving more active storage capacity for subsequent operations. However, during the non-flood season, the smaller sediment deposition and larger active storage capacity under Scheme 2 lead to a relatively lower average cross-sectional flow velocity, thereby a lower SCT. In the long term, the increase in SCT caused by lowering water levels during the flood season is partially offset by the reduction achieved through the larger reservoir capacity during the non-flood season. Since the latter effect is more pronounced, Scheme 2 ultimately results in a lower average annual SCT compared to Scheme 1, demonstrating superior comprehensive benefits.
Based on Scheme 2, Scheme 3 further incorporates a sediment-avoidance shutdown strategy, which directly bypasses periods of peak sediment concentration, thereby achieving superior overall performance compared to Scheme 2.
4.2. Operational Feasibility Analysis of the Sediment Regulation Measures
4.2.1. Morphological Precondition in Reservoir Sedimentation
The siltation forms of reservoirs include delta, banded, and cone-shaped types. For delta or cone-shaped sediment deposits, the storage capacity can be freed up by lowering the water level at the dam site and avoiding sediment during sediment peaks by shutting down the unit [51]. The morphology of delta deposition can be identified using the following criteria [51]:
where H is the average water depth at the dam site, ∆H is the water level variation range, GS is the annual transport amounts of suspended sediment into the lower reservoir, and GW is the annual transport amounts of water into the lower reservoir.
The sedimentation for the lower reservoir in this study is delta-shaped, as .
Given the similarity in sedimentation morphology and formation mechanisms across rivers, the criteria can be extended to the assessment of other sediment-laden rivers. This study provides both a theoretical basis and a methodological framework for evaluating the effectiveness of lowering the water level to discharge sediment.
4.2.2. Impact on the Power Grid of Sediment Regulation Measures
In this study, the effectiveness of each measure was evaluated solely based on its ability to reduce the SCT, thereby mitigating turbine wear. Meanwhile, PSPSs play a key role in improving power grid stability and power supply reliability through their unique bidirectional operation mechanism of “pumping-generating”. During the low-load periods, the power stations pump water to store energy by consuming excess electric energy from the grid, effectively avoiding energy waste. During the peak-load periods, they generate electricity by discharging water, promptly filling the power supply gaps and significantly reducing the peak-valley difference of the grid. This flexible regulation capability effectively controls the frequency fluctuation of the power grid. For instance, the Swiss power grid has successfully controlled the frequency fluctuation range within ±0.2 Hz, while the power supply reliability in the North China and Central China grids has reached a high level of 99.71–99.89% [5]. In addition, the PSPS also has the characteristics of rapid response and can provide critical ancillary services such as frequency modulation, black start, and phase modulation. For example, when a fault occurs in the grid, the 350 MW capacity of the Grimsel 2 power station can be immediately deployed as an emergency backup power source, greatly enhancing the anti-disturbance capability and power supply reliability of the grid [28], and the power supply reliability of Sifnos Island in Greece has thus reached 94.76% [13].
The main functions of a pumped storage power station are peak shaving and valley filling, frequency and phase regulation, and black start capability. These functions cannot be achieved if the “shutdown for sediment avoidance” is carried out during the pumping stage. The probability of “function loss” is related to the occurrence of sand peaks and peak loads in the power system. Consequently, the operational trade-offs of shutdown for sediment avoidance require consideration of multiple factors, such as energy loss during shutdown for sediment avoidance, long-term economic impacts, etc.
Therefore, the feasibility of sediment regulation measures for PSPSs on sediment-laden rivers can be comprehensively demonstrated by further considering the impact of sediment on unit abrasion and the release of effective storage capacity, and the effects of shutdown for sediment avoidance on power grid stability, power supply reliability, and key functions such as frequency modulation, black start, and phase modulation.
4.3. Environmental and Socio-Economic Analysis of the Sustainability of PSPSs
As the share of renewables grows, PSPSs prove indispensable for enabling their large-scale integration. PSPSs effectively smooth the output volatility of intermittent sources like wind and solar by storing surplus electricity and supplementing shortfalls, markedly improving renewable utilization rates. In driving the energy transition, PSPSs directly increase the share of clean energy in the grid by providing flexible regulation. For instance, nuclear power capacity in the East China Grid now accounts for 6.07% of the total mix [5]. To ensure the sustainable operation of these vital PSPSs, mitigating sediment-induced turbine abrasion remains an essential technical prerequisite.
Economically, PSPSs significantly enhance grid operational efficiency and reduce overall costs through multiple pathways. These power stations effectively lower fuel consumption and operation-maintenance expenses [52]. A practical case from Sifnos Island, Greece, demonstrates that an optimized pumped storage system can achieve an average annual net profit of €789,000 with a payback period of only 5.9 years. Beyond direct economic benefits, PSPSs also help extend equipment service life by smoothing load fluctuations, avoiding mechanical wear caused by frequent start-ups and shutdowns of thermal power units. This effect has enabled the maintenance cycle of units at the Three Gorges Reservoir to be extended to 1–2 years [22].
The value of PSPSs extends beyond the power sector, manifesting also in synergistic effects with water resource management and ecological protection, among other fields. In terms of coordinated water-energy management, PSPSs can effectively regulate seasonal hydrological fluctuations. For example, in glacier-fed basins in Switzerland, a “pump in winter, release in summer” dispatch strategy has increased water resource utilization from 60% to 85%. Meanwhile, the Three Gorges Reservoir employs a “store clear, release muddy” mode to balance sediment flushing and power generation, increasing the sediment flushing ratio to 35% [22]. Furthermore, the water exchange of PSPSs contributes to improving the reservoir ecological environment. In regional energy autonomy, pumped storage technology provides independent power supply solutions for islands and remote areas, and seawater pumped storage can address both energy and freshwater demands simultaneously [4].
5. Conclusions
Taking a PSPS whose lower reservoir is on a sediment-laden river as an example, this study uses a one-dimensional sediment mathematical model that considers water and sediment exchange between the upper and lower reservoirs, and employs long-series sediment data to simulate the sediment concentration and its gradation through turbines. The influencing factors of the sediment concentration and its gradation through turbines are analyzed, and further analysis is conducted on the impact of sediment and particle size on cavitation in penstocks and turbine blade abrasion, with predictions made for the overhaul cycle. The main conclusions are as follows:
- (1)
- The SCT is closely related to the incoming suspended sediment transport rate. An increased sediment transport rate entering the lower reservoir results in a higher sediment concentration and larger sediment particle size through the turbines. The moment when the maximum daily average SCT occurs corresponds to the peak of the daily average sediment transport rate, and there is a lag effect in the SCT after the sediment peak.
- (2)
- In a lower reservoir with delta or cone-shaped sedimentation, lowering the water level to discharge sediment during inflow flood peaks can free up the effective storage capacity of the lower reservoir and reduce the SCT. Effective sediment avoidance scheduling during the inflow sediment peak, with a total of 120 h of shutdown every 10 years, can further reduce the SCT by approximately 26% and extend the overhaul cycle to 1.5 times.
- (3)
- The feasibility of sediment regulation measures for PSPSs on sediment-laden rivers can be comprehensively demonstrated by further considering the impact on power grid stability, power supply reliability, and key functions such as frequency modulation, black start capability, and phase modulation in the future.
- (4)
- The sediment regulation measures described in this study, namely reservoir drawdown for sediment release and unit shutdowns during peak sediment events, are applicable to other river basins. These measures effectively reduce SCT and mitigate unit abrasion. Future work will prioritize the comprehensive monitoring of sediment concentration and turbine abrasion at operational PSPSs to provide direct validation of the efficacy of the proposed measures.
Author Contributions
Conceptualization, X.Z.; methodology, X.Z. and Q.X.; validation, X.Z. and Q.X.; formal analysis, Q.X.; investigation, Q.X.; resources, X.Z.; data curation, Q.X.; writing—original draft preparation, X.Z. and Q.X.; writing—review and editing, X.Z.; visualization, Q.X.; supervision, X.Z.; project administration, X.Z.; funding acquisition, X.Z. All authors have read and agreed to the published version of the manuscript.
Funding
This research was partially funded by the National Natural Science Foundation of China [Grant No. 52437009].
Institutional Review Board Statement
Not applicable.
Informed Consent Statement
Not applicable.
Data Availability Statement
The data presented in this study are available on request from the authors. The data are not publicly available due to copyright protection.
Acknowledgments
The authors wish to thank the anonymous reviewers for their careful work and thoughtful suggestions, which substantially improved this study.
Conflicts of Interest
Author Qiumeng Xu was employed by the Central Southern China Electric Power Design Institute Co., Ltd. of China Power Engineering Consulting Group. The remaining authors declare that the research was conducted in the absence of any commercial or financial relationships that could be construed as a potential conflict of interest.
References
- Zhu, H.T.; Gao, X.P.; Liu, Y.Z.; Liu, S. Numerical and Experimental Assessment of the Water Discharge Segment in a Pumped-Storage Power Station. Energy 2023, 265, 126375. [Google Scholar] [CrossRef] [Scilit]
- Pan, J.L.; Liu, Q.; Pang, J.Y.; Zhang, F.F.; Tao, R.; Xiao, R.F.; Zhou, L.J.; Liu, W.C. Comparative Evaluation of Sand Erosion in Reversible Turbine at Pump Mode and Turbine Mode. J. Energy Storage 2024, 79, 110185. [Google Scholar] [CrossRef] [Scilit]
- Bermúdez, M.; Cea, L.; Puertas, J.; Rodriguez, N.; Baztan, J. Numerical Modeling of the Impact of a Pumped-Storage Hydroelectric Power Plant on the Reservoirs’ Thermal Stratification Structure: A Case Study in NW Spain. Environ. Model. Assess. 2018, 23, 71–85. [Google Scholar] [CrossRef] [Scilit]
- Hu, J.Y.; Wang, Q.B.; Meng, Z.Z.; Song, H.G.; Chen, B.W.; Shen, H. Numerical Study of the Internal Fluid Dynamics of Draft Tube in Seawater Pumped Storage Hydropower Plant. Sustainability 2023, 15, 8327. [Google Scholar] [CrossRef] [Scilit]
- Lu, Y.; Liu, X.; Zhang, Y.; Yang, Z.Q.; Wu, Y.N. Investment Efficiency Assessment Model for Pumped Storage Power Plants Considering Grid Operation Demand under Fuzzy Environment: A Case Study in China. Sustainability 2023, 15, 8724. [Google Scholar] [CrossRef] [Scilit]
- Zhao, J.F.; Oh, U.J.; Park, J.C.; Park, E.S.; Im, H.B.; Lee, K.Y.; Choi, J.S. A Review of World-wide Advanced Pumped Storage Hydropower Technologies. In Proceedings of the 11th IFAC Symposium on Control of Power and Energy Systems (CPES), Online, 21–23 June 2022. [Google Scholar]
- Xu, Y.F. Research on the Construction of Pumped Storage Power Stations Based on the Background of “Dual Carbon”. Electr. Power Equip. Manag. 2024, 2, 219–221. [Google Scholar]
- Han, D.; Zhao, Z.H.; Yan, B.Z.; Cui, Z.H.; Ren, Y. Status and Prospect of China’s Pumped Storage Development in 2021. Water Power 2022, 48, 1–4+104. [Google Scholar]
- Pang, J.Y.; Liu, H.Z.; Liu, X.B.; Yang, H.; Peng, Y.J.; Zeng, Y.Z. Study on Sediment Erosion of High Head Francis Turbine Runner in Minjiang River Basin. Renew. Energy 2022, 19, 849–858. [Google Scholar] [CrossRef] [Scilit]
- Noon, A.A.; Kim, K.H. Erosion Wear on Francis Turbine Components due to Sediment Flow. Wear 2017, 378–379, 126–135. [Google Scholar] [CrossRef] [Scilit]
- Gaji, R.; Doshi, A.; Bade, M.; Singh, P. Influence of Impeller Blade Rounding and Surface Roughness on the Internal Hydraulics and Performance of Pump as Turbine. Arch. Mech. Eng. 2023, 70, 219–245. [Google Scholar] [CrossRef] [Scilit]
- Peng, G.J.; Wang, Z.W.; Xiao, Y.X.; Luo, Y.Y. Abrasion predictions for Francis turbines based on liquid-solid two-phase fluid simulations. Eng. Fail. Anal. 2013, 33, 327–335. [Google Scholar]
- Zisos, A.; Sakki, G.K.; Efstratiadis, A. Mixing Renewable Energy with Pumped Hydropower Storage: Design Optimization under Uncertainty and Other Challenges. Sustainability 2023, 15, 13313. [Google Scholar] [CrossRef] [Scilit]
- Song, X.J.; Luo, Y.Y.; Wang, Z.W. Mechanism of the influence of sand on the energy dissipation inside the hydraulic turbine under sediment erosion condition. Energy 2024, 294, 130794. [Google Scholar] [CrossRef] [Scilit]
- Shan, Y.H.; Wang, H.; Liu, Z.H.; Xu, Y.H. Health Performance Interval Prediction of Pumped Storage Unit based on Multi-Objective Optimization. J. Huazhong Univ. Sci. Technol. Nat. Sci. 2023, 51, 151–156. [Google Scholar]
- Naidu, B.S.K. Addressing the problems of silt erosion at hydro plants. Int. J. Hydropower Dams. 1997, 4, 72–77. [Google Scholar]
- Krause, M.; Grein, H. Abrasion research and prevention. Int. J. Hydropower Dams. 1996, 4, 17–20. [Google Scholar]
- Rai, A.K.; Kumar, A.; Staubli, T. Effect of concentration and size of sediments on hydro-abrasive erosion of Pelton turbine. Renew. Energy 2020, 145, 893–902. [Google Scholar] [CrossRef] [Scilit]
- Padhy, M.K.; Saini, R.P. Effect of size and concentration of silt particles on erosion of Pelton turbine buckets. Energy 2009, 34, 1477–1483. [Google Scholar] [CrossRef] [Scilit]
- Gautam, S.; Neopane, H.P.; Acharya, N.; Chitrakar, S.; Thapa, B.S.; Zhu, B.S. Sediment erosion in low specific speed francis turbines: A case study on effects and causes. Wear 2020, 442–443, 203152. [Google Scholar] [CrossRef] [Scilit]
- Shrivastava, N.; Rai, A.K. Hydro-abrasive erosion in Pelton turbines: Comprehensive review and future outlook. Renew. Sustain. Energy Rev. 2025, 207, 114957. [Google Scholar] [CrossRef] [Scilit]
- Dong, B.J.; Zhu, L.L.; Ren, S.; Yuan, J.; Lv, C.N. Sediment Flushing Operation Mode During Sediment Peak Processes Aiming Towards the Sustainability of Three Gorges Reservoir. Sustainability 2025, 17, 6836. [Google Scholar] [CrossRef] [Scilit]
- Zhang, Y.; Wang, Y.H.; Zhang, S.L.; Zhang, Q.J. Influence of Imported Water and Sediment on the Sediment Concentration in a Pumped Storage Power Station. Pearl River 2018, 39, 45–49. [Google Scholar]
- Xi, W.Y.; Liu, X.; Zhao, H.J.; Zhang, Y.H. Study on the Prediction of Sediment Passing Through Turbine of Weifang Pumped-storage Power Station. Water Power 2021, 47, 14–17. [Google Scholar]
- Liu, L.; Dong, Z.; Wang, Z. Influencing Factors and Prediction of Turbine Sediment Concentration in Pure Pumped-Storage Power Stations on Sediment-Laden Rivers. Water 2025, 17, 1254. [Google Scholar] [CrossRef] [Scilit]
- Liu, C.; Yu, M.H.; He, X.; Wang, K.X.; Shao, Y.Y. Numerical Simulation and Sensitivity Analysis of Sediment Issues in Pumped Storage Power Stations: Sediment Conveyance of Turbine and Sedimentation of Reservoirs. Water 2023, 15, 3531. [Google Scholar] [CrossRef] [Scilit]
- Chen, J.; Liu, Q.Q.; Li, X.; Fu, X.C. Application of Mathematical Model on Deposition Study of Pumped-Storage Power Reservoir. Proc. Inst. Civ. Eng.-Water Manag. 2022, 175, 311–323. [Google Scholar] [CrossRef] [Scilit]
- Müller, M.; De Cesare, G.; Schleiss, A.J. Continuous Long-Term Observation of Suspended Sediment Transport between Two Pumped-Storage Reservoirs. J. Hydraul. Eng. 2014, 140, 05014003. [Google Scholar] [CrossRef] [Scilit]
- Wei, H.Y.; Xu, Q.M.; Yu, M.H. Numerical Simulation of Sediment Management for Pumped Storage Power Station. J. Hydroelect. Eng. 2015, 34, 91–97+117. [Google Scholar]
- Walter, K.; Gunkel, G.; Gamboa, N. An assessment of sediment reuse for sediment management of Gallito Ciego Reservoir, Peru. Lakes Reserv. Res. Manag. 2012, 17, 301–314. [Google Scholar] [CrossRef] [Scilit]
- Cruzatty, C.; Jimenez, D.; Valencia, E.; Zambrano, I.; Mora, C.; Luo, X.W.; Cando, E. A case study: Sediment erosion in Francis turbines operated at the San Francisco Hydropower plant in Ecuador. Energies 2021, 15, 8. [Google Scholar] [CrossRef] [Scilit]
- Pandey, V.; Sircar, A.; Yadav, K.; Bist, N. Pumped hydro storage for intermittent renewable energy: Present status and future potential in India. MRS Energy Sustain. 2023, 10, 189–206. [Google Scholar] [CrossRef] [Scilit]
- Hunt, J.D.; Falchetta, G.; Parkinson, S.; Vinca, A.; Zakeri, B.; Byer, E.; Jurasz, J.; Ouaranta, E.; Grenier, E.; Pereira, A., Jr.; et al. Hydropower and seasonal pumped hydropower storage in the Indus basin: Pros and cons. J. Energy Storage 2021, 41, 102916. [Google Scholar] [CrossRef] [Scilit]
- Zhang, R.J. River Dynamics; China Water Power Press: Beijing, China, 1998; pp. 182–186. [Google Scholar]
- Han, Q.W. Reservoir Sedimentation; Science Press: Beijing, China, 2003; pp. 141–160. [Google Scholar]
- Batchelor, G.K. An Introduction to Fluid Dynamics; Cambridge University Press: New York, NY, USA, 1967. [Google Scholar]
- Huang, B.; Wu, Q.; Wang, G.Y. Numerical investigation of cavitation flow in liquid hydrogen. Int. J. Hydrogen Energy 2014, 39, 1698–1709. [Google Scholar] [CrossRef] [Scilit]
- Sarc, A.; Stepisnik-Perdih, T.; Petkovsek, M.; Dular, M. The issue of cavitation number value in studies of water treatment by hydrodynamic cavitation. Ultrason. Sonochem. 2017, 34, 51–59. [Google Scholar] [CrossRef] [Scilit]
- Chen, Y.; Ding, W.Z.; Bian, R. Performance studies on cavitation resistance turbine flow sensor based on experient and CFD simulation. Flow. Meas. Instrum. 2021, 79, 101918. [Google Scholar] [CrossRef] [Scilit]
- Chen, W.Q.; Jiang, X. A linear theoretical model of cavitation flow past a multihydrofoil system with a finite number of foils. Appl. Math. Model. 2020, 77, 1691–1703. [Google Scholar] [CrossRef] [Scilit]
- Li, F.H. Measures to Mitigate Sediment-Induced Wear in Pump-Turbines. Water Power 1996, 7, 50–51. [Google Scholar]
- Rakibuzzaman, M.; Kim, H.H.; Kim, K.; Suh, S.H.; Kim, K.Y. Numerical Study of Sediment Erosion Analysis in Francis Turbine. Sustainability 2019, 11, 1423. [Google Scholar] [CrossRef] [Scilit]
- Thapa, B.S.; Thapa, B.; Dahlhaug, O.G. Empirical Modelling of Sediment Erosion in Francis Turbines. Energy 2012, 41, 386–391. [Google Scholar] [CrossRef] [Scilit]
- Li, Z.H.; Liu, E.Z. Research of anti-abrasion on hydraulic turbine flow-parts in silt-laden flow. In Proceedings of the International Conference on Future Computer Supported Education, Chongqing, China, 10–11 September 2011. [Google Scholar]
- Li, X.S. Sediment Control in the Headwater Diversion System of the Yuzixi First-Level Hydropower Station. Sichuan Water Power 1982, 2, 11–24+33. [Google Scholar]
- Thapa, S.B.; Dahlhaug, G.O.; Thapa, B. Sediment erosion in hydro turbines and its effect on the flow around guide vanes of Francis turbine. Renew. Sustain. Energy Rev. 2015, 49, 1100–1113. [Google Scholar] [CrossRef] [Scilit]
- Hauer, C.; Wagner, B.; Aigner, J.; Holzapfel, P.; Flöfl, P.; Liedermann, M.; Tritthart, M.; Sindelar, C.; Pulg, U.; Klösch, M. State of the art, shortcomings and future challenges for a sustainable sediment management in hydropower: A review. Renew. Sustain. Energy Rev. 2018, 98, 40–55. [Google Scholar] [CrossRef] [Scilit]
- Shrestha, U.; Chen, Z.; Park, H.S.; Choi, Y.D. Numerical studies on sediment erosion due to sediment characteristics in Francis hydro turbine. IOP Conf. Ser. Earth Environ. Sci. 2019, 240, 042001. [Google Scholar] [CrossRef] [Scilit]
- Wang, H.; Pang, J.; Liu, X.B.; Zhou, Z.Y.; Gang, Y.Y.; Lai, Z.M.; Wang, J.M.; Qin, B. Analysis on cause of erosion of guide vane of high-head Francis turbine in sandy river. Energy Sci. Eng. 2024, 12, 3704–3717. [Google Scholar] [CrossRef] [Scilit]
- Molinas, A.; Wu, B. Transport of sediment in large sand-bed rivers. J. Hydraul. Res. 2001, 39, 135–146. [Google Scholar] [CrossRef] [Scilit]
- Xie, J.H. River Bed Evolution and Regulation; Wuhan University Press: Wuhan, China, 2013; pp. 238–254. [Google Scholar]
- Abdelfattah, A.I.; Shaaban, M.F.; Osman, A.H.; Ali, A. Optimal Management of Seasonal Pumped Hydro Storage System for Peak Shaving. Sustainability 2023, 15, 11973. [Google Scholar] [CrossRef] [Scilit]

Disclaimer/Publisher’s Note: The statements, opinions and data contained in all publications are solely those of the individual author(s) and contributor(s) and not of MDPI and/or the editor(s). MDPI and/or the editor(s) disclaim responsibility for any injury to people or property resulting from any ideas, methods, instructions or products referred to in the content. |
© 2025 by the authors. Licensee MDPI, Basel, Switzerland. This article is an open access article distributed under the terms and conditions of the Creative Commons Attribution (CC BY) license (https://creativecommons.org/licenses/by/4.0/).