


Abstract
With the continuous expansion in China’s vehicle fleet, emissions of CO2 and air pollutants from the on-road transportation sector are widely projected to be rising, posing a challenge to realizing China’s targets of carbon peaking in 2030 and carbon neutrality in 2060, as well as the national target for air quality improvement. Therefore, vehicle electrification in the on-road transportation sector is urgently needed to reduce emissions of CO2 and air pollutants, as it serves as a key pathway to align transportation development with sustainability goals. While vehicle electrification is supposed to be the primary solution, there is a research gap in quantifying the provincial, environmental, and economic impacts of implementing such a policy in China. To bridge this gap, we projected the provincial-level ownership of different types of vehicles based on historical trends, assessed the emission reduction potential for CO2 and air pollutants using the LEAP model from 2021 to 2060, and predicted the provincial marginal abatement costs at different mitigation stages under various scenarios with different strategies of vehicle electrification and development patterns of electricity structure. Our results show that the implementation of vehicle electrification lowers the national carbon peak by 0.2–0.6 Gt yr−1 and advances its achievement by 1–3 years ahead of 2030. The marginal abatement cost ranges from $532 to $3466 per ton CO2 (tCO2−1) in 2025 and from −$180 to −$113 tCO2−1 in 2060 across scenarios. The provincial marginal abatement cost curves further indicate that China’s vehicle electrification should be prioritized in cost-effective regions (e.g., Shanghai and Guangdong), while concurrently advancing nationwide grid decarbonization to guarantee the supply of low-carbon electricity across the country. This optimized pathway ensures that transportation decarbonization aligns with both environmental and economic requirements, providing actionable support for China’s sustainable development strategy.
1. Introduction
The transportation industry plays an important role in greenhouse gas (GHG) emissions, contributing 23% of anthropogenic GHG emissions [1]. As for China, the world’s third-largest transportation GHG emitter, emissions from on-road transportation account for over 85% [2]. Moreover, internal-combustion-engine vehicles (ICEV) produce substantial quantities of air pollutants [3], which have been identified as the main driver of several air pollution events [4,5,6,7]. In order to mitigate climate change and air pollution, China has implemented a series of supporting policies [8,9,10] to promote the electrification transition of the fleet as a crucial measure to realize its carbon peaking and carbon neutrality targets [11].
Vehicle electrification refers to the process of substituting ICEV in the fleet with electric vehicles (EV), which are recognized as the leading solution for reducing emissions of CO2 [12] and air pollutants [13,14,15,16] in the on-road transportation sector. Although electric vehicles eliminate (for battery electric vehicles, BEV) or significantly decrease (for plug-in hybrid electric vehicles, PHEV) tailpipe emissions during the driving stage [17,18], there is great uncertainty in their life-cycle emission reduction potential compared to ICEV [19], which is influenced by the emission factors of charging electricity [20], driving behavior [21], vehicle type [14,22], and ambient temperature [23]. These factors vary markedly across different regions; therefore, previous studies underscore the regional disparities in the environmental effects of vehicle electrification by projecting the development of regional on-road transportation and analyzing the abatement potential of various vehicle electrification policies [24,25,26,27,28]. Yet, they lack a perspective on the inequality of the mitigation policy’s regional economic impacts.
Notably, the large-scale promotion of EV substitution is heavily reliant on effective incentive programs, including financial support, preferential road rights, charging infrastructure development, and vehicle scrappage programs. The pivotal role of these measures in breaking through barriers for EV penetration has been fully validated by practices throughout the world, and is thus critical to accelerating the transition towards vehicle electrification [29]. Given that the environmental mitigation potential of climate policies is significantly constrained by their economic feasibility [30], the assessment of the economic impact of vehicle electrification is equally imperative. Existing economic assessments typically employ cost–benefit analysis to quantify costs [31,32,33,34,35] (e.g., vehicle replacement, energy consumption, infrastructure development, government subsidies, and tax exemption) and benefits [36,37,38,39,40] (e.g., fuel savings, benefits from the avoided damage of climate change and air pollution) over the study period, or calculate marginal abatement costs for the electrification of different types of vehicles [41,42,43]. However, few studies manage to analyze the provincial marginal abatement costs in China, failing to provide policymakers with insights on the regional priority of implementing vehicle electrification.
In this study, we bridged the gap by integrating environmental and economic assessments of vehicle electrification at the provincial level under four mitigation scenarios, which were designed based on a joint consideration of vehicle electrification strategies [8,44] as well as the development patterns of China’s power generation structure [45,46,47]. We aim to evaluate the emission reduction potential of CO2 and air pollutants (NOx, PM2.5, SO2) and the marginal abatement costs of vehicle electrification in different provinces, and to offer evidence-based recommendations for the regional priority of mitigation policies. To perform this, we extrapolated the ownership and sales of 32 types of vehicles in 31 provinces from 2021 to 2060 based on historical fitting trends [2,26,48]. An energy consumption and emission assessment model based on the Low Emission Analysis Platform (LEAP) and statistical data, including average annual mileage, fuel economy, emission factors of fuel, and power grids and emission standards, was established to calculate the emission of CO2 and air pollutants during both the driving stage and the power generation stage. Moreover, we applied a cost–benefit analysis to quantify the effects of different actions in monetary terms and predicted the marginal abatement cost for each province. The results indicate that by prioritizing vehicle electrification primarily in cost-effective regions and investing in nationwide clean energy in the long term, China can enhance emission reductions from the on-road transportation sector through a self-sustaining vehicle electrification process.
2. Materials and Methods
2.1. Study Scope
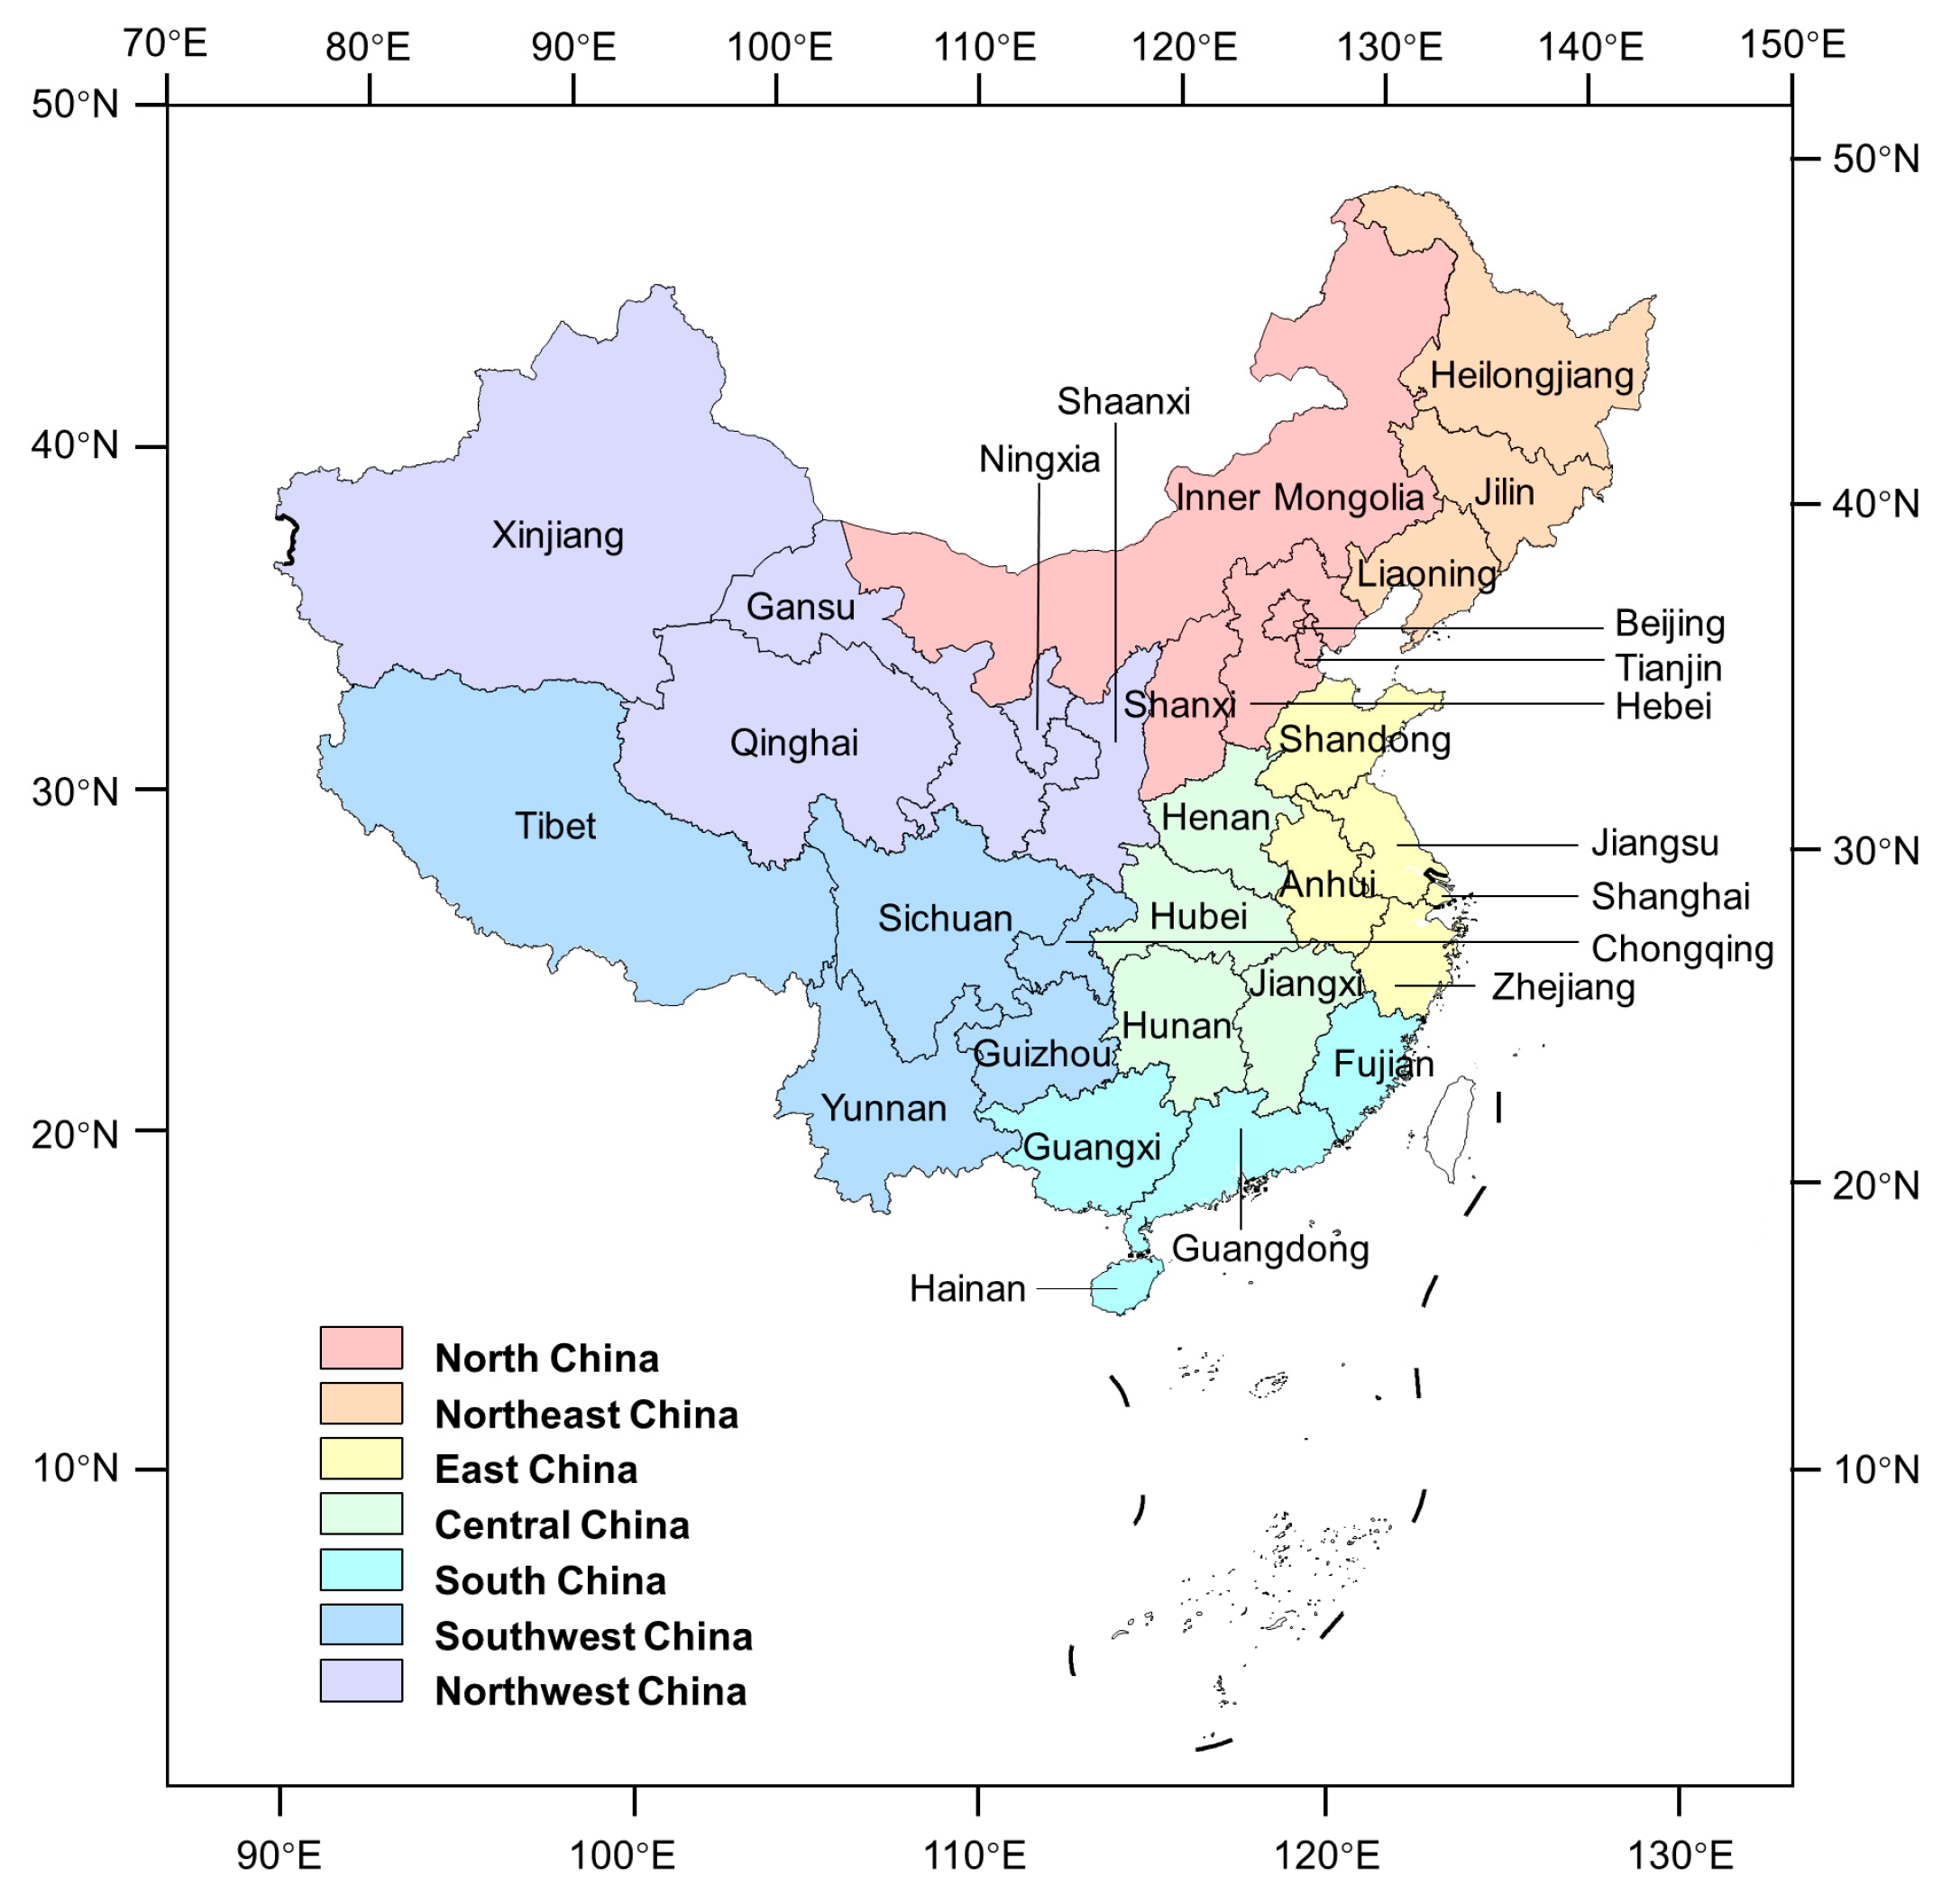
The geographic scope of this study covers 31 provinces in Mainland China, as shown in Figure 1. The on-road transportation vehicles involved in this study refer to civilian motor vehicles, including passenger vehicles (PV) of four sizes (large, medium, small, and mini) and cargo trucks (CT) of four sizes (heavy, medium, light, and mini), as defined in the Chinese standard GA 802-2019 [49].
Figure 1.
Study area.
2.2. Prediction of Provincial-Level Vehicle Ownership
2.2.1. Passenger Vehicles
In this study, the future ownership of PV in 30 provinces, except for Beijing, is projected using the Gompertz function, which relates average vehicle ownership (represented by the number of PV per 1000 people) to per capita gross domestic product (GDP) [2]. The Gompertz function describes an S-shaped curve and is widely used to project the saturation processes of durable goods [50], which can be expressed as:
where PVi,j is the ownership of PV in year i in province j; γ is the ultimate saturation level of the number of PV per 1000 people, which is set to be 425 in this study based on previous studies; PGDPi,j is the per capita GDP in year i in province j; α and β are curvature parameters and can be estimated by regression based on historical data; POPi,j is the population in year i in province j. The fitting results of each province are listed in Table S1.
For Beijing, as policies have been implemented to limit the growth of PV in Beijing since 2011 [51], we perform a linear fit instead, assuming the growth follows a linear trend over time.
2.2.2. Cargo Trucks
In this study, we apply the elasticity coefficient method considering income elasticity and fuel price elasticity to forecast the freight turnover of each province, and then calculate the ownership of CT based on the average load weight and the on-road transportation freight turnover proportion [26], which can be expressed as follows:
where Yi,j is the freight turnover in year i in province j; fpi is the fuel price index in year i; a, b, and c are the coefficients to be fitted or adjusted based on historical data and previous research; CTi,j is the ownership of CT in year i in province j; proadj is the proportion of road freight to total freight turnover in province j; m is the average annual mileage of CT; Wj is the average carriage weight of CT in province j.
Historical data are fitted on Equation (2) without considering the impact of fuel prices due to the lack of relevant studies on the effect of fuel prices on freight turnover in China, and the results are listed in Table S2. The values of proadj, m and Wj, for the base year are calculated using the data from the National Bureau of Statistics of China (NBSC) [48] and the Ministry of Transport of China [52], and are assumed to remain at the base-year level during 2021 to 2060, suggesting that adjustments of the freight structure and improvements in transport efficiency are not considered in this research.
With fluctuations in fossil fuel prices and the implementation of carbon pricing policies, domestic freight demand is likely to be increasingly influenced by fossil fuel prices in the future [26]. Therefore, referring to a relevant study [53], we make the following projections: (1) the fuel price will increase by 1.7% annually from the base year, doubling by 2060; (2) the fuel price elasticity coefficient will decrease linearly from −0.2 to −0.5 between 2020 and 2030, and then from −0.5 to −0.7 between 2030 and 2060. The results of the sensitivity test of the fuel–price increase rate and elasticity coefficient on China’s cargo turnover are provided in Figure S1 to further ensure the reliability of the method.
2.3. Energy Consumption and Emission Assessment Model Based on the LEAP
2.3.1. Scenario Settings
Table 1 shows the five scenarios designed in this study and their corresponding vehicle electrification strategies and development pathways of power generation structure.
Table 1.
Scenario description.
The core variable distinguishing each scenario is the time series of the electrification rate of motor vehicles, defined as the sales share of EV (including PHEV, BEV) in total vehicle sales. The base-year vehicle electrification rate is set at 5% in line with China’s actual data by the end of 2019. In the Business-as-usual (BAU) scenario, the vehicle electrification rate across all provinces remains at the base-year level from 2021 to 2060, and the EV fleet comprises 60% PHEV and 40% BEV. To reflect policy-driven electrification pathways, this study adopts targets from China’s New Energy Vehicle Industry Development Plan (2021–2035) [8] to set a policy-guided strategy for the process of vehicle electrification: the sales share of EV will grow at an annual rate of 2.5% from 5% in the base year, reaching 20% by 2025 and 100% by 2057. Notably, with the vigorous development of China’s EV industry, the actual vehicle electrification rate in China reached 31.5% by 2023, significantly outpacing the expectation in the national policy. To incorporate this observed data while accounting for the aggressive regional policy framework that mandates an accelerated vehicle electrification pace [44], we further set a rapid-growth strategy, assuming that the sales share of EV will grow at an annual rate of 8.5% from 5% in the base year, reaching 98.5% by 2030, and 100% by 2031, after which it remains constant. Additionally, for EV, two distinct proportions of BEV and PHEV in EV sales are set to differentiate EV fleet composition across scenarios, thereby facilitating discussions on the emission reduction potential and economic effects of different types of electric vehicles. For ICEV, the proportions of gasoline-powered ICEV and diesel-powered ICEV in PV and CT are calculated using data released in the China Mobile Source Environmental Management Annual Report [3] and are assumed to remain at the base-year level thereafter. The sales shares of PV and CT vehicles of each energy type in the different vehicle electrification strategies are listed in Table S3.
The development path of the power generation structure reflects the cleanliness of the power grid, and is described by the proportion of thermal power generation in total electricity generation. By vigorously developing solar photovoltaic and wind power generation capacity, carrying out energy efficiency and flexibility retrofits for thermal power plants and further increasing the application of carbon capture, utilization, and storage technology (CCUS), referring to the scenarios predicted by the International Energy Agency and the State Grid Energy Research Institute [47,54], we set the proportion of thermal power generation in total electricity generation to decrease from 67.9% [45] at a rate of 1% per year in the dual-carbon pathway. In the high-clean pathway, we assume that the scale of renewable energy development is further expanded, and, referring to the scenarios predicted by the Energy Research Institute of the National Development and Reform Commission [55], we set the proportion of thermal power generation to decrease by 1.4% annually. In these two pathways, the power grid emission factors of each province can be calculated as follows:
where EFEi,j,x refers to the emission factor of the power grid in year i in province j for emission substance x (x = 1, 2, 3, 4 refers to CO2, NOx, PM2.5, SO2, respectively); Ti refers to the proportion of thermal power to total power generation.
2.3.2. Energy Consumption and Emissions of CO2 and Air Pollutants
The provincial energy consumption (including electricity, gasoline, and diesel) and the emissions of CO2 and air pollutants (including NOx, PM2.5, SO2) from the on-road transportation sector are calculated by a bottom-up assessment model based on the LEAP model (version: 2020.1.0.112).
In this study, we focus on the process of fleet electrification transition; therefore, the development of new energy vehicles other than BEV and PHEV is not included. The energy end-use in the on-road transportation sector in this study consists of 32 types of vehicles classified by their structure (PV and CT), energy type (gasoline-powered ICEV, diesel-powered ICEV, BEV, and PHEV) and size (large/heavy, medium, small/light, mini). Based on the projection of provincial PV and CT ownership, the sales volume of PV and CT of different energy types is determined by the vehicle electrification strategy, which can be calculated as follows:
where S1,m,i,j and S2,m,i,j, respectively, represent the sales volume of PV and CT of energy type m (m = 1, 2, 3, 4, respectively, represent gasoline-powered ICEV, diesel-powered ICEV, BEV, and PHEV); δ1 and δ2 respectively represent the scrappage rate of existing PV and CT from the previous year, which are set to be 4% and 6% based on their average survival lifetime; ePV,m,i and eCT,m,i respectively represent the sales share of PV and CT of energy type m in year i, which are determined by the electrification strategy as well as the base-year proportion of each ICEV fuel type in PV and CT (calculated by the data revealed in China Mobile Source Environmental Management Annual Report [3]).
The ownership of vehicles of specific structure, energy type, and size is calculated as follows:
where Nk,m,n,i,j represents the ownership of vehicles of structure k (k = 1, 2, respectively, represent PV and CT), energy type m, and size n (n = 1, 2, 3, 4, respectively, represent large/heavy, medium, small/light, and mini) in year i in province j; Mk,n,j represents the ownership share of vehicles of structure k and size n relative to all vehicles of structure k in province j, which is calculated using the vehicle ownership data from 2019 [48] (Table S6).
The energy consumption and emissions can be calculated as follows:
where Energyp.i.j represents the consumption of energy p (p = 1, 2, 3 represent gasoline, diesel, electricity, respectively) in year i in province j; AVTk,n represents the annual average mileage of vehicles of structure k and size n, and in this study it is assumed to remain at the base-year level with reference to a previous study [56] (Table S7); Ik,m,n,p,i represents the consumption intensity of energy p for vehicles of structure k, energy type m, and size n in year i; Emissionx,i,j represent the emission of substance x in year i in province j; EFFp,i,x represents the emission factor of energy p for substance x in year i. The CO2 emission factors of different types of fuel are constant, calculated using the lower calorific value, carbon content per unit calorific value, and carbon oxidation rate [57]. The emission factors of air pollutants are determined by the proportion of ICEV that meets different levels of emission standards; therefore, we set the evolution of this proportion based on the base-year situation [3] and policy requirements in the future [58,59,60] (as shown in Table S4), and calculated the future emission factors based on the limits of each level of emission standard [61]. In this study, we adopt the following assumptions in the calculation of the energy consumption of PHEV: (1) 40% of the annual energy consumption of each PHEV is supplied by fossil fuels, and the remaining 60% is supplied by electricity; (2) considering the difference in electricity use efficiency between BEV and PHEV, the electricity consumption intensity of each PHEV is set to be 125% of that of each BEV with the same structure and size.
2.4. Calculation of Costs and Benefits
2.4.1. Device Replacement
Under different vehicle electrification scenarios, ICEV in the BAU scenario are replaced with BEV or PHEV, thus causing a certain amount of expense due to the price difference between ICEV and EV. In this study, we assume that each ICEV is replaced by one same-sized BEV or PHEV, which can be calculated as follows:
where Cost_devicei,j(TS) represents the cost of device replacement under the targeted vehicle electrification scenarios (including the PDa, PDb, PHb, and RHb scenario); Sk,m,i,j(TS) and Sk,m,i,j(BAU) represent the sales volume of vehicles of structure k and energy type m in year i in province j under the targeted vehicle electrification scenario and BAU scenario, respectively; ΔPricek,m,n represents the price difference between each BEV (when m = 3) or PHEV (when m = 4) and ICEV of structure k and size n; and d represents the discount rate. The unit price differences are calculated by the projected prices of EV and ICEV for passenger vehicles and cargo trucks from previous cost analysis studies [33,62]. With the development of the EV industry, the purchase cost of EV will gradually decrease, and by around 2030, the purchase price of EV will appear to be lower than that of ICEV for some types of passenger vehicle (Table S8).
2.4.2. Charging Piles
In order to meet the charging demand for EV, the construction and maintenance of vehicle charging facilities are indispensable. The number of charging piles required in each scenario is calculated based on the electricity consumption of EV and the charging capacity of charging piles, which is determined by their power ratings and charging time, which can be calculated as follows:
where CPi,j,q is the number of charging piles of type q (q = 1,2 represent fast charging piles and slow charging piles, respectively) in year i in province j under the targeted scenario; Energy3,i,j represents the electricity consumption in year i in province j under the targeted scenario; φq represents the proportion of electricity consumption of EV supplied by charging piles of type q; Pq represents the power rating of each charging pile of type q; uq represents the average usage rate of each charging pile of type q. We can then calculate the expense of charging facilities as follows:
where Expense_cpi,j represents the expense spent on the construction and maintenance of charging piles in year i in province j; mtq represents the maintenance expense of each charging pile of type q; csq represents the construction expense of each increased charging pile of type q, and when CPi,j,q is no bigger than CPi−1,j,q, no construction is required in year i. The cost of charging piles during the process of vehicle electrification is defined as the difference in expenses between the targeted scenario and the BAU scenario, which can be expressed as follows:
where Cost_cpi,j(TS) represents the cost of charging piles under the targeted vehicle electrification scenario in year i in province j. In this study, we assume that 90% of the charging piles are direct current (DC) fast charging piles and 10% are alternating current (AC) slow charging piles; their specific parameters and unit maintenance and construction expenses adopted in this study are referenced from a previous market study [63] (see in Table S9).
2.4.3. Fuel and Electricity
The cost of electricity is calculated by the difference in power consumption between the targeted mitigation scenario and the BAU scenario, as well as the unit price of power generation, which can be expressed as follows:
where Cost_electricityi,j(TS) represents the cost of electricity consumption in year i in province j under the targeted scenario; Energy3,i,j(TS) and Energy3,i,j(BAU), respectively, represent the electricity consumption in year i in province j under the targeted scenario and BAU scenario; epricei,j(TS) and epricei,j(BAU), respectively, represent the unit electricity price in year i in province j under the targeted scenario and BAU scenario. These prices are calculated based on the provincial residential electricity price (for voltages below 1 kV) in the base year [64] and the ancillary service price required under different development patterns of the power generation structure [65] without the consideration of discount rates.
Conversely, the decrease in fuel consumption of ICEV results in fuel savings benefits, which can be calculated as follows:
where Benefit_fueli,j(TS) represents the fuel savings benefit in year i in province j under the targeted scenario; Energyp,i,j(TS) and Energyp,i,j(BAU) represent the fuel consumption of energy type p (p = 1 for gasoline, p = 2 for diesel) in year i in province j under the targeted scenario and BAU scenario, respectively; fpricep represents the unit fuel price of fuel type p. The base-year fuel prices adopted in this study are CNY 8 per liter of gasoline and CNY 6.9 per liter of diesel.
2.4.4. Climate Mitigation
Reductions in CO2 emissions decrease the economic damage caused by climate change to human society. The benefits generated per unit of CO2 reduction are measured by the Social Cost of Carbon (SCC) and the emission reduction volume. Therefore, the benefits from climate mitigation can be quantified in monetary terms as follows:
where Benefit_climatei,j(TS) represents the benefit from CO2 mitigation in year i in province j under the targeted scenario; Emission1,i,j(TS) and Emission1,i,j(BAU) respectively represent the emission of CO2 from the on-road transportation sector in year i in province j under the targeted scenario and BAU scenario; SCC represents the Social Cost of Carbon, for which we adopt a value of USD 36 per ton CO2 according to Wang’s study [66].
2.4.5. Air Pollution Mitigation
Here, we adopt the Total Quantity Control Method to estimate changes in the concentration of air pollutants caused by emission changes in the region of each province [67]. The equation can be expressed as follows:
where dCx,i,j(TS) represents the change in the concentration of pollutant x (x = 2, 3, 4 for NOx, PM2.5, SO2) in year i in province j under the targeted scenario compared with the BAU scenario; Emissionx,i,j(TS) and Emissionx,i,j(BAU) respectively represent the emissions of pollutant x in year i in province j under the targeted scenario and BAU scenario; Sj represents the geographical area of the province j; Aj represents the total geographical regional quantity control coefficient of province j; εx represents the total quantity control coefficient of pollutant x. The values of Aj and εx are referenced from Lu’s study [67].
In this study, the health endpoint of the exposed population is defined as premature death caused by pollutants, without considering the public health impacts from other related diseases that do not reach the death endpoint. We adopt the exposure–response coefficient, which is defined as the increase in mortality rate caused by an increase in pollutant concentration, to calculate the number of avoided premature deaths and further, monetize the benefits from avoided premature deaths using the Value of Statistical Life (VSL), which can be expressed as follows:
where Benefit_pollutionx,i,j(TS) represents the benefit from air pollution mitigation of pollutant x in year i in province j under the targeted scenario; ERx represents the exposure–response coefficient of pollutant x, referenced from Wu’s study [68]; VSL2020,j represents the Value of Statistical Life per person in 2020 in province j, which is calculated based on Liu’s study [69]; and eVSL represents the income elasticity coefficient of VSL, and is set to be 0.25 according to Hoffmann’s study [70].
2.4.6. Calculation of Marginal Abatement Cost
The net cost of vehicle electrification can be calculated as follows:
where NetCosti,j(TS) represents the net cost in year i in province j under the targeted scenario. Thus, the marginal abatement cost of each province can be calculated as follows:
where MACi,j(TS) represents the marginal abatement cost in year i in province j under the targeted scenario.
2.5. Data Sources
In addition to the required data mentioned above, historical statistical data including provincial and national vehicle ownership, population, GDP, freight turnover, and geographical area are sourced from China Statistical Yearbook. The base-year provincial average CO2 emission factors of power grids adopted in this study are released by NBSC and the Ministry of Ecology and Environment of China. The accounting boundary for this set of emission factors refers to the emission intensity of all electricity consumption within the province, excluding the market-oriented transactions of non-fossil energy electricity [71].The provincial power grid’s average emission factors of NOx, PM2.5, and SO2 are calculated based on their total emissions in the power grid sector [45], which are listed in Table S5. The projected energy intensity for the average mileage of various types of vehicles are organized from the government projections of fuel economy and relevant studies [9,33,72]. The projected provincial population and GDP are referenced from the data under the SSP2 scenario in Jiang’s study [73]. In this study, the exchange rate is set at USD 1 = CNY 6.89, with all currency values representing their 2020 constant prices.
3. Results and Discussion
3.1. Provincial-Level Vehicle Ownership Projections in China
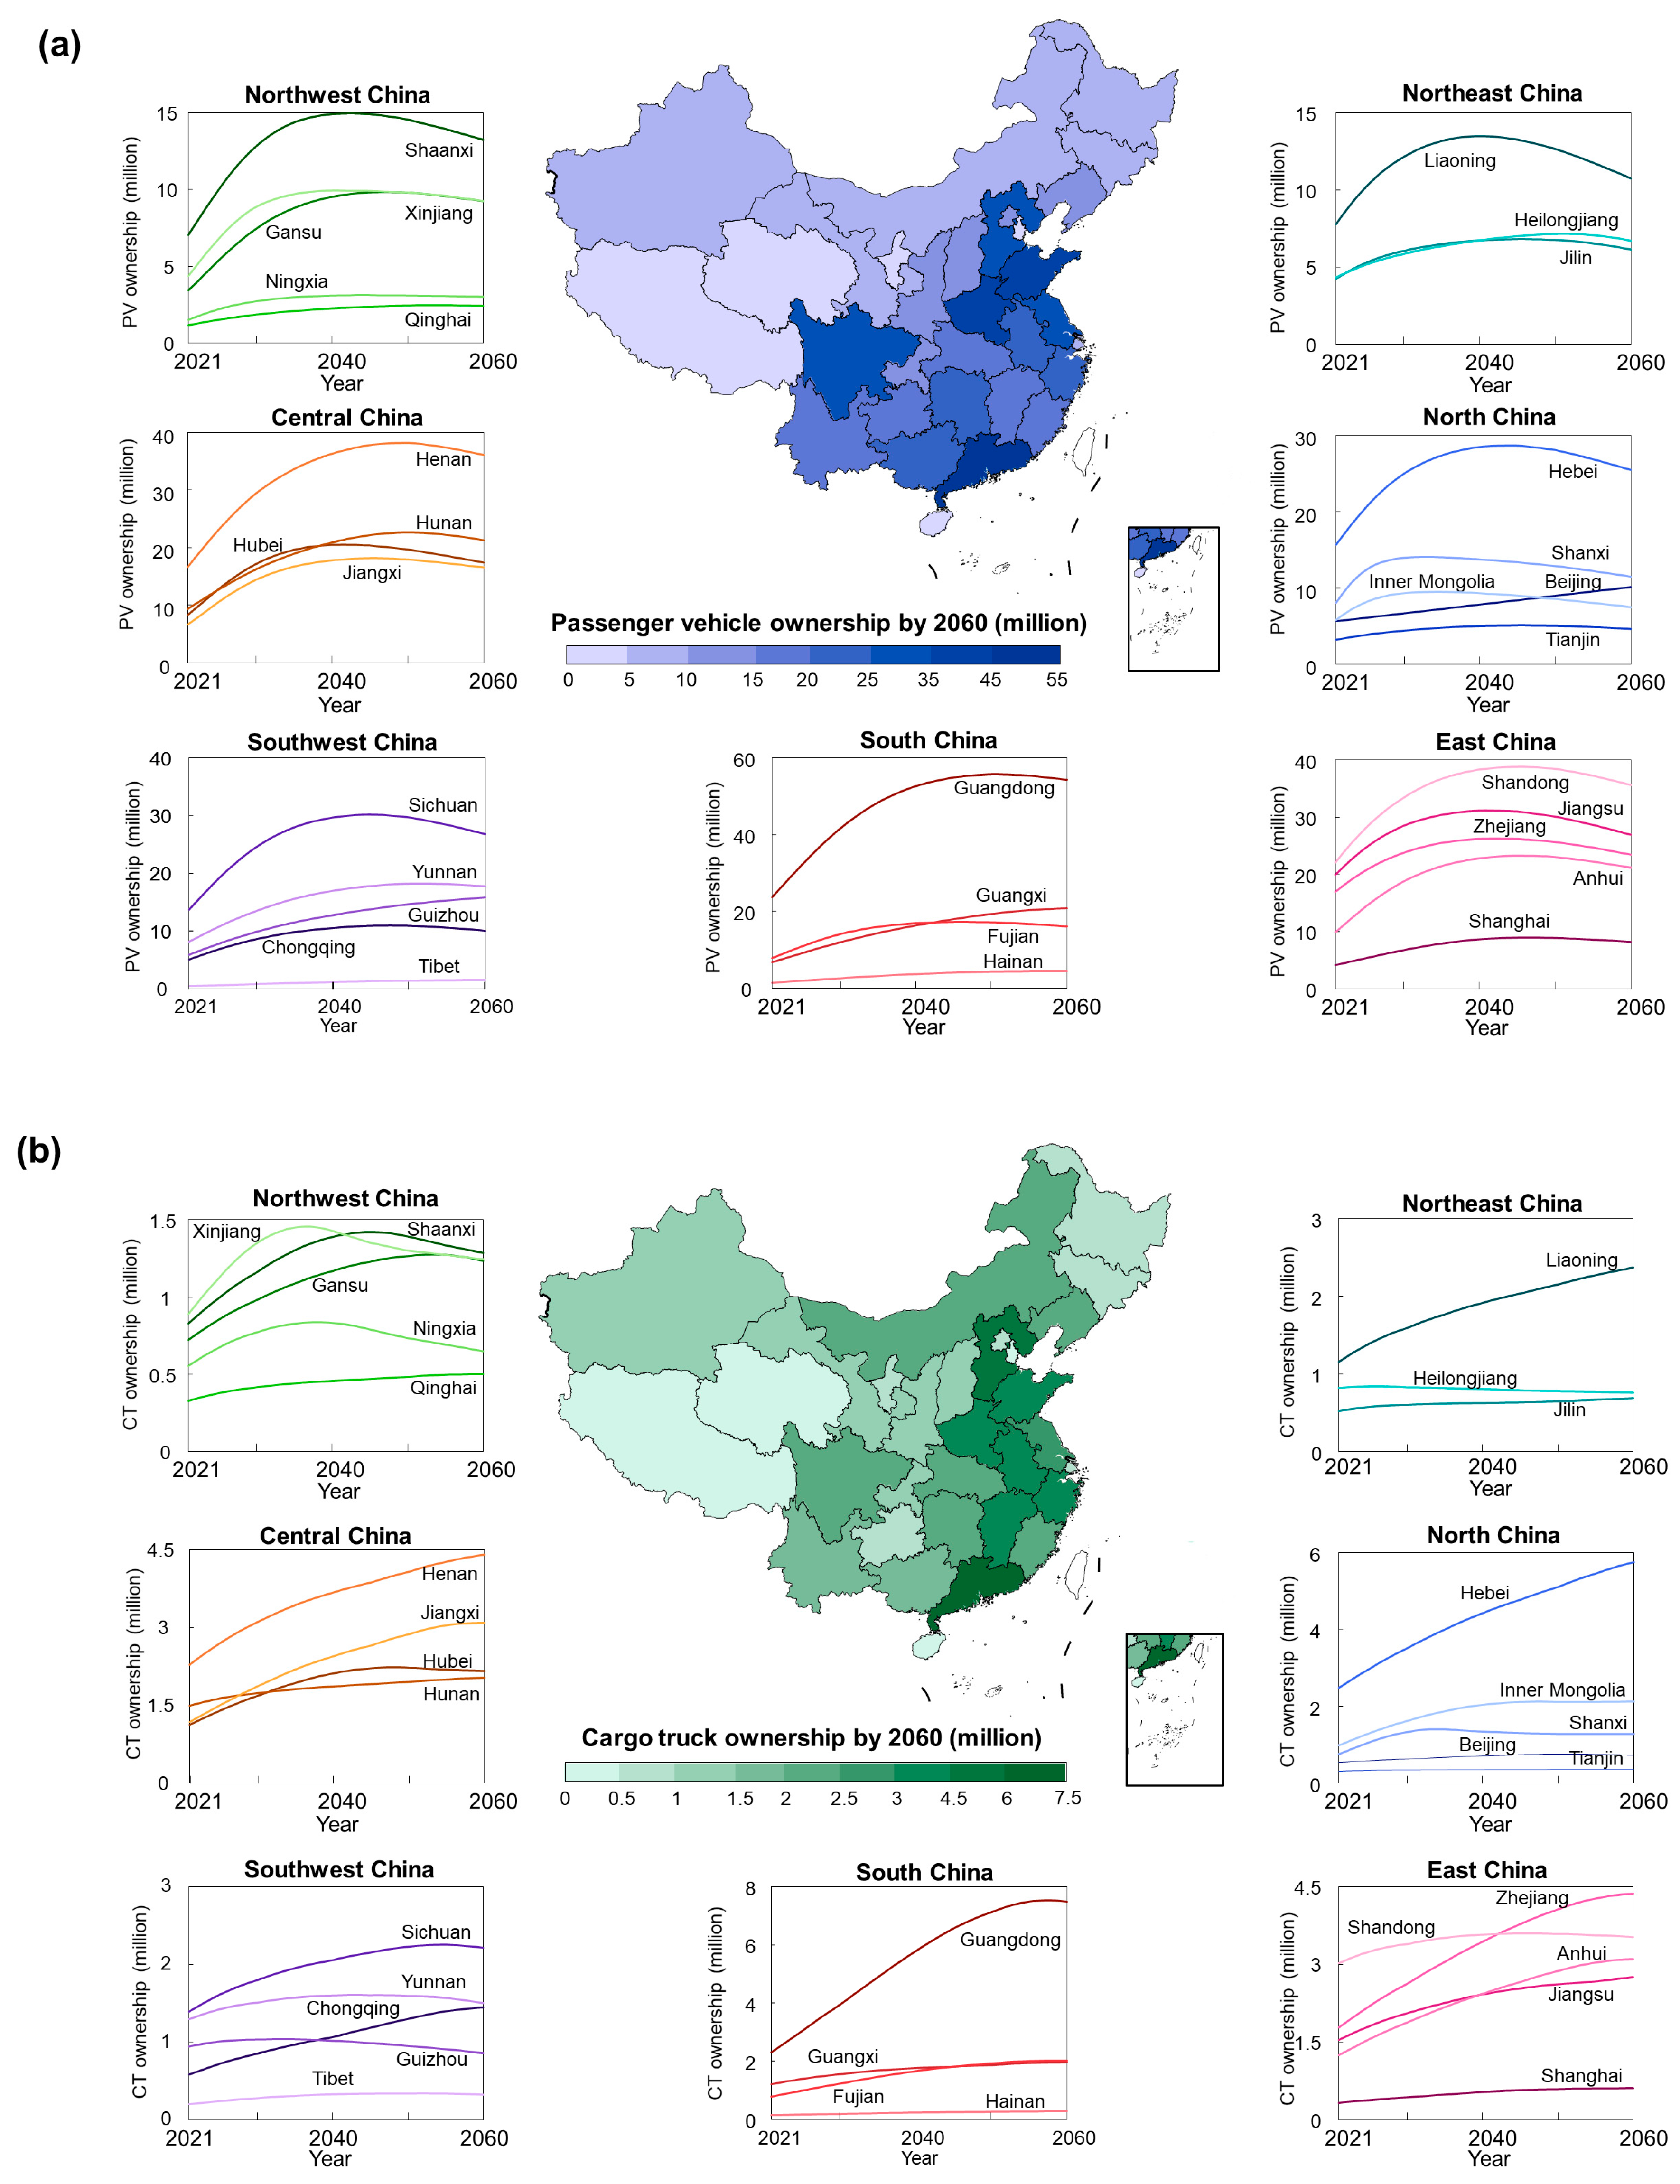
Based on the fitting results of historical data and the projected GDP and population data, the projections of PV and CT ownership demonstrate substantial expansion of China’s on-road transportation sector over the study period (Figure 2). According to our results, national civilian vehicle ownership is projected to reach 366.9 million in 2024, closely aligned with the actual figure of 352.7 million (NBSC, 2024) [48], and the variance primarily stems from a slight overestimation of CT ownership. By 2060, vehicle ownership throughout China far exceeds the base-year level, with PV ownership reaching 494.5 million and CT ownership reaching 63.1 million, representing increases of 107.8% and 95.8% relative to 2020, respectively. These projections are consistent with findings from previous studies [2,74]. Moreover, the divergent growth trajectories across provinces and vehicle structures reflect the provincial disparities in fleet expansion. With economic development, the level of PV ownership per 1000 people gradually approaches saturation, leading most provinces to exhibit an upward trend in PV ownership from 2021 to 2040. Beyond 2040, however, population decline is expected to slow the growth rate of PV ownership or even result in negative growth between 2040 and 2060. Data shown in Table 2 confirm this trajectory: the national growth rate of PV ownership is projected to be 6.42% in 2025 and decline to −0.81% by 2060, indicating an early-phase surge followed by a gradual decline. The growth of CT ownership is driven by rising freight demand amid economic development. Consequently, most provinces will experience continuous growth in CT ownership throughout the projection period, whereas provinces with low income elasticity coefficients such as Shanxi and Heilongjiang are expected to see a decline in CT ownership from a relatively early stage. These results provide a robust foundation for further assessment of on-road transportation emissions under different scenarios.
Figure 2.
The provincial ownership distribution of passenger vehicles (a) and cargo trucks (b) by 2060. Inserts depict the projected growth trends of passenger vehicle (a) and cargo truck (b) ownership from 2021 to 2060 in each province in different regions of China.
Table 2.
Annual growth rate of vehicle ownership in different regions of China.
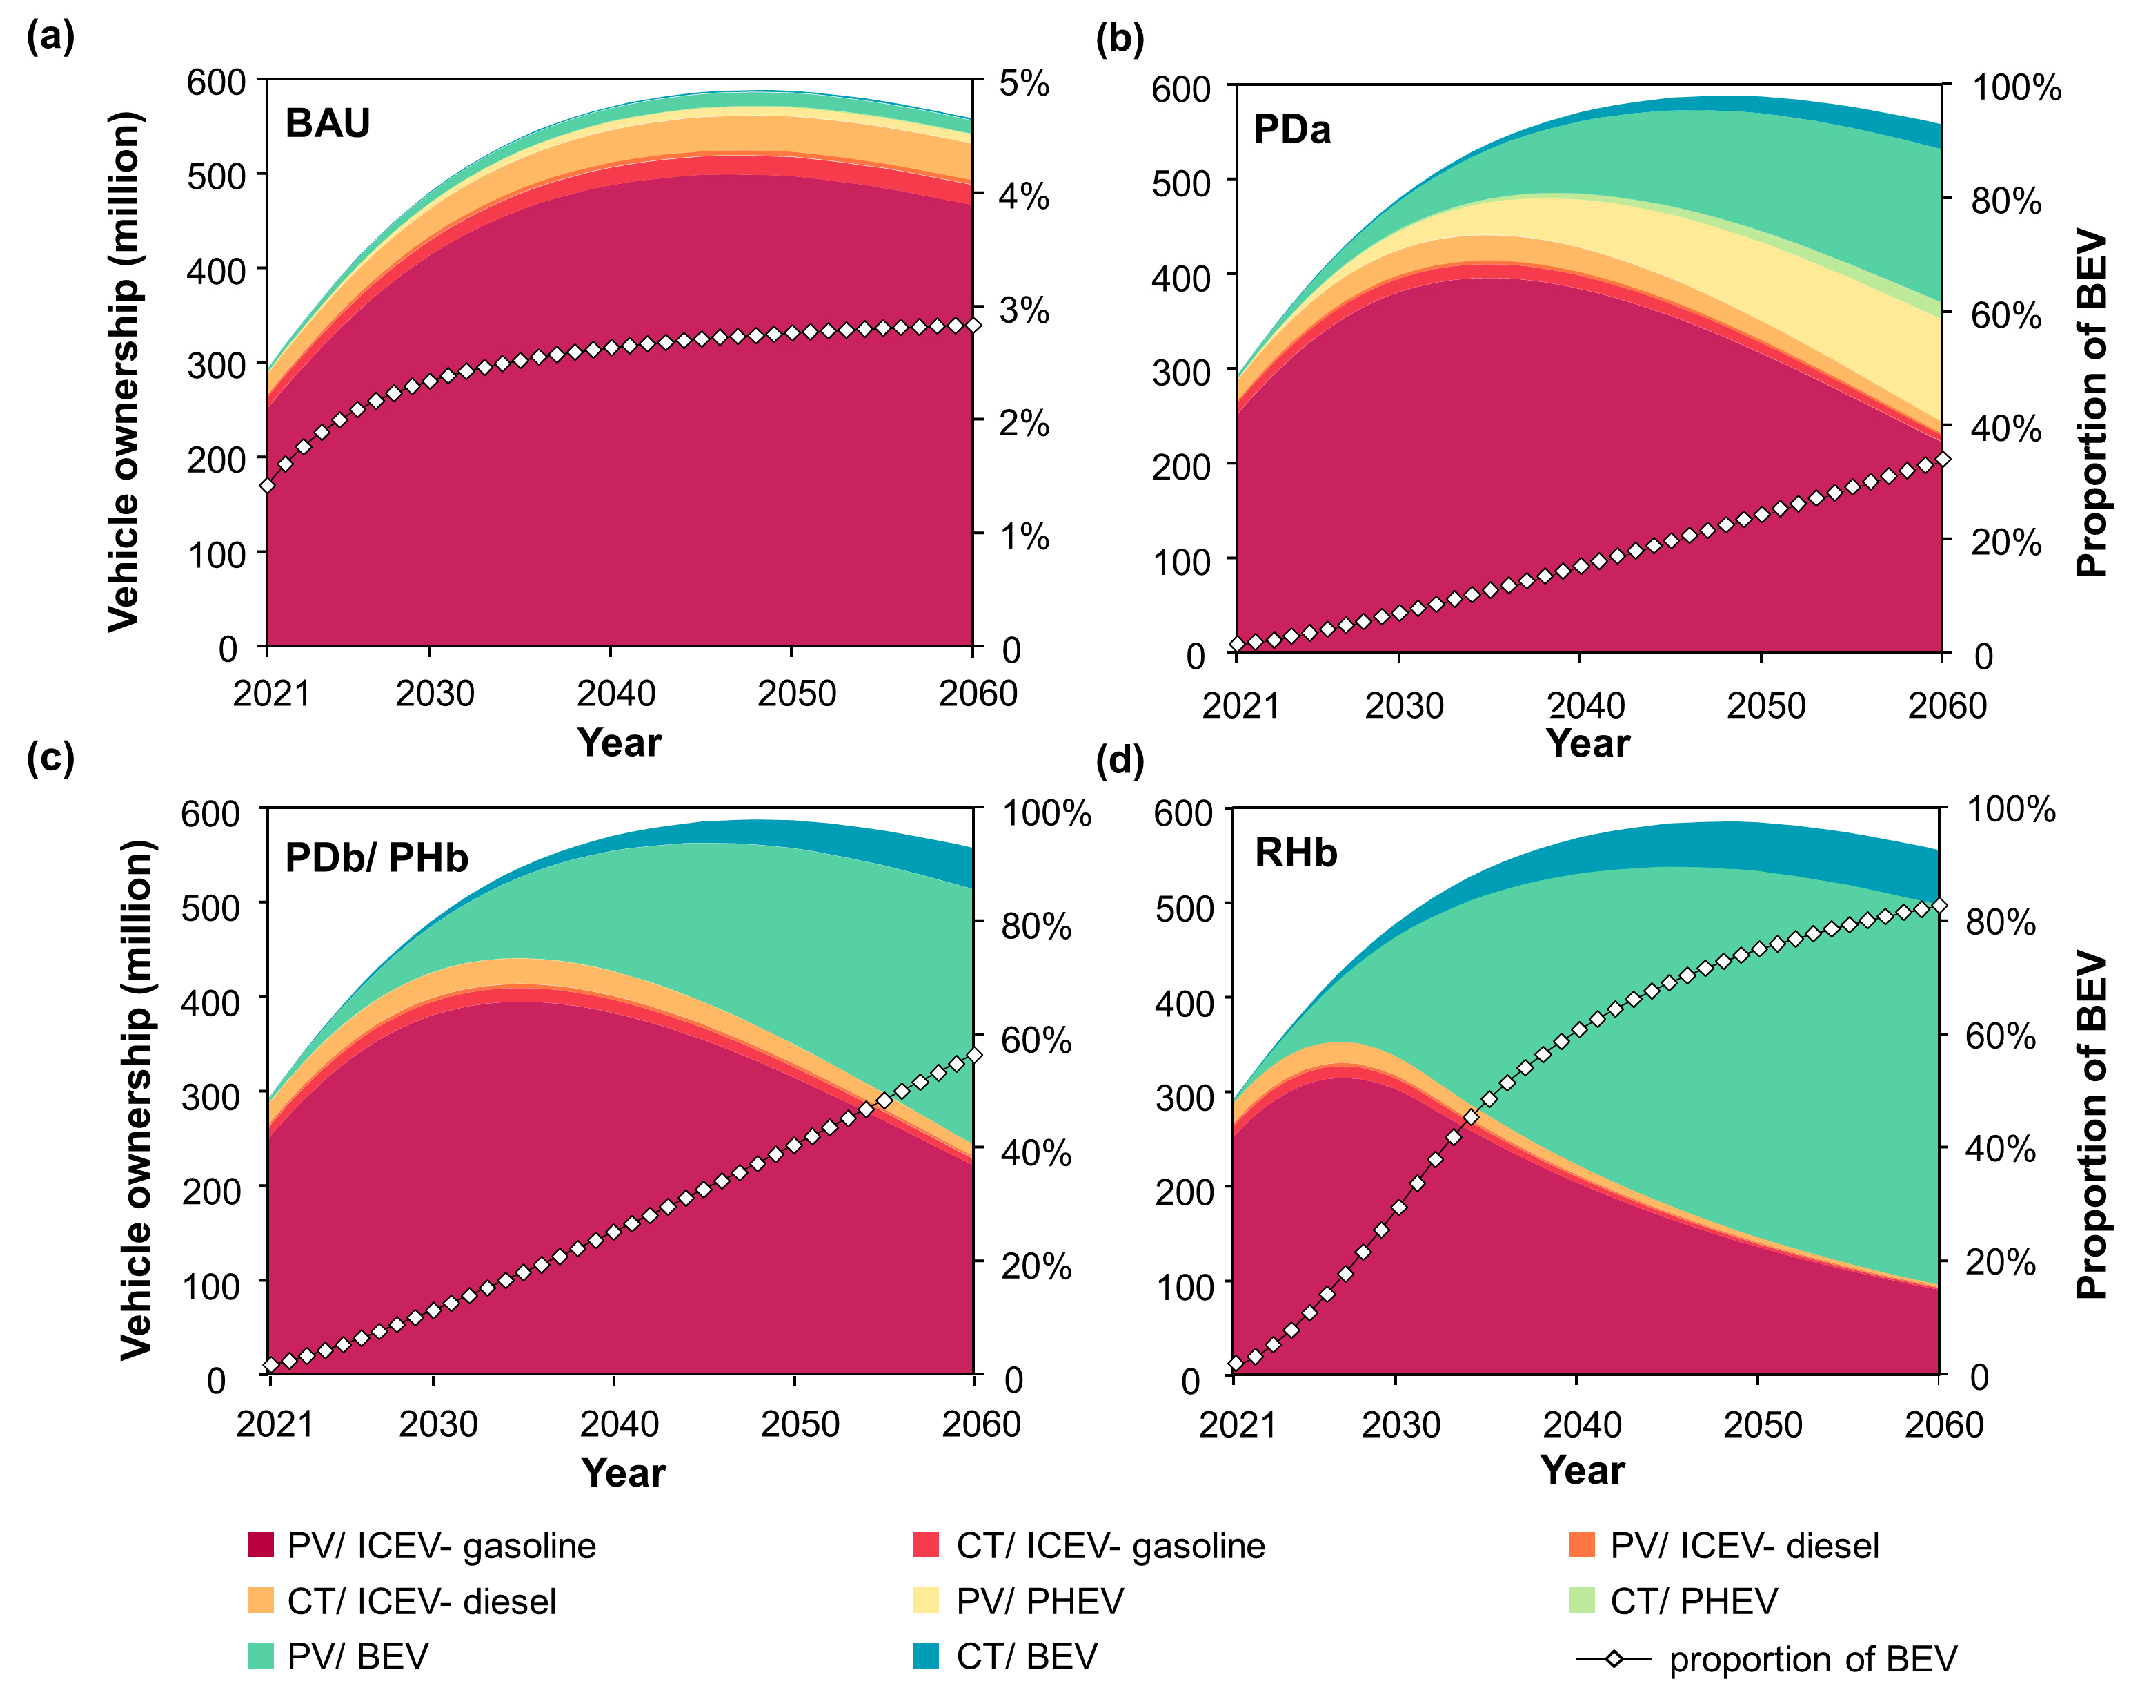
With the baseline electrification rate or vehicle electrification strategy set for different scenarios, the evolving patterns of fleet composition are determined and presented in Figure 3. Vehicle ownership is categorized into eight groups based on vehicle structure and energy type. Notably, China’s total vehicle ownership will continue its expanding trend until it reaches a peak of 588.3 million in 2048. Under the BAU scenario, China’s on-road transportation sector remains highly fossil-fuel-dependent, with passenger vehicles combusting gasoline (abbreviated as PV/ICEV-gasoline in Figure 3) and cargo trucks combusting diesel (abbreviated as CT/ICEV-diesel in Figure 3) accounting for the largest share of the total vehicle fleet throughout the study period. Following the implementation of different vehicle electrification strategies, the proportion of BEV in the total vehicle fleet increases significantly. By 2060, this proportion reaches 34.9%, 59.2%, and 81.8% under the PDa, PDb/PHb, and RHb scenarios, far exceeding the 2.9% projected under the BAU scenario, which indicates a growing reliance of the on-road transportation sector on power grids in the future.
Figure 3.
National vehicle ownership composition and proportion of BEV to all vehicles from 2021 to 2060 under the BAU (a), PDa (b), PDb/PHb (c), and RHb (d) scenarios.
3.2. CO2 Emission Reduction Potential Under Multiple Scenarios
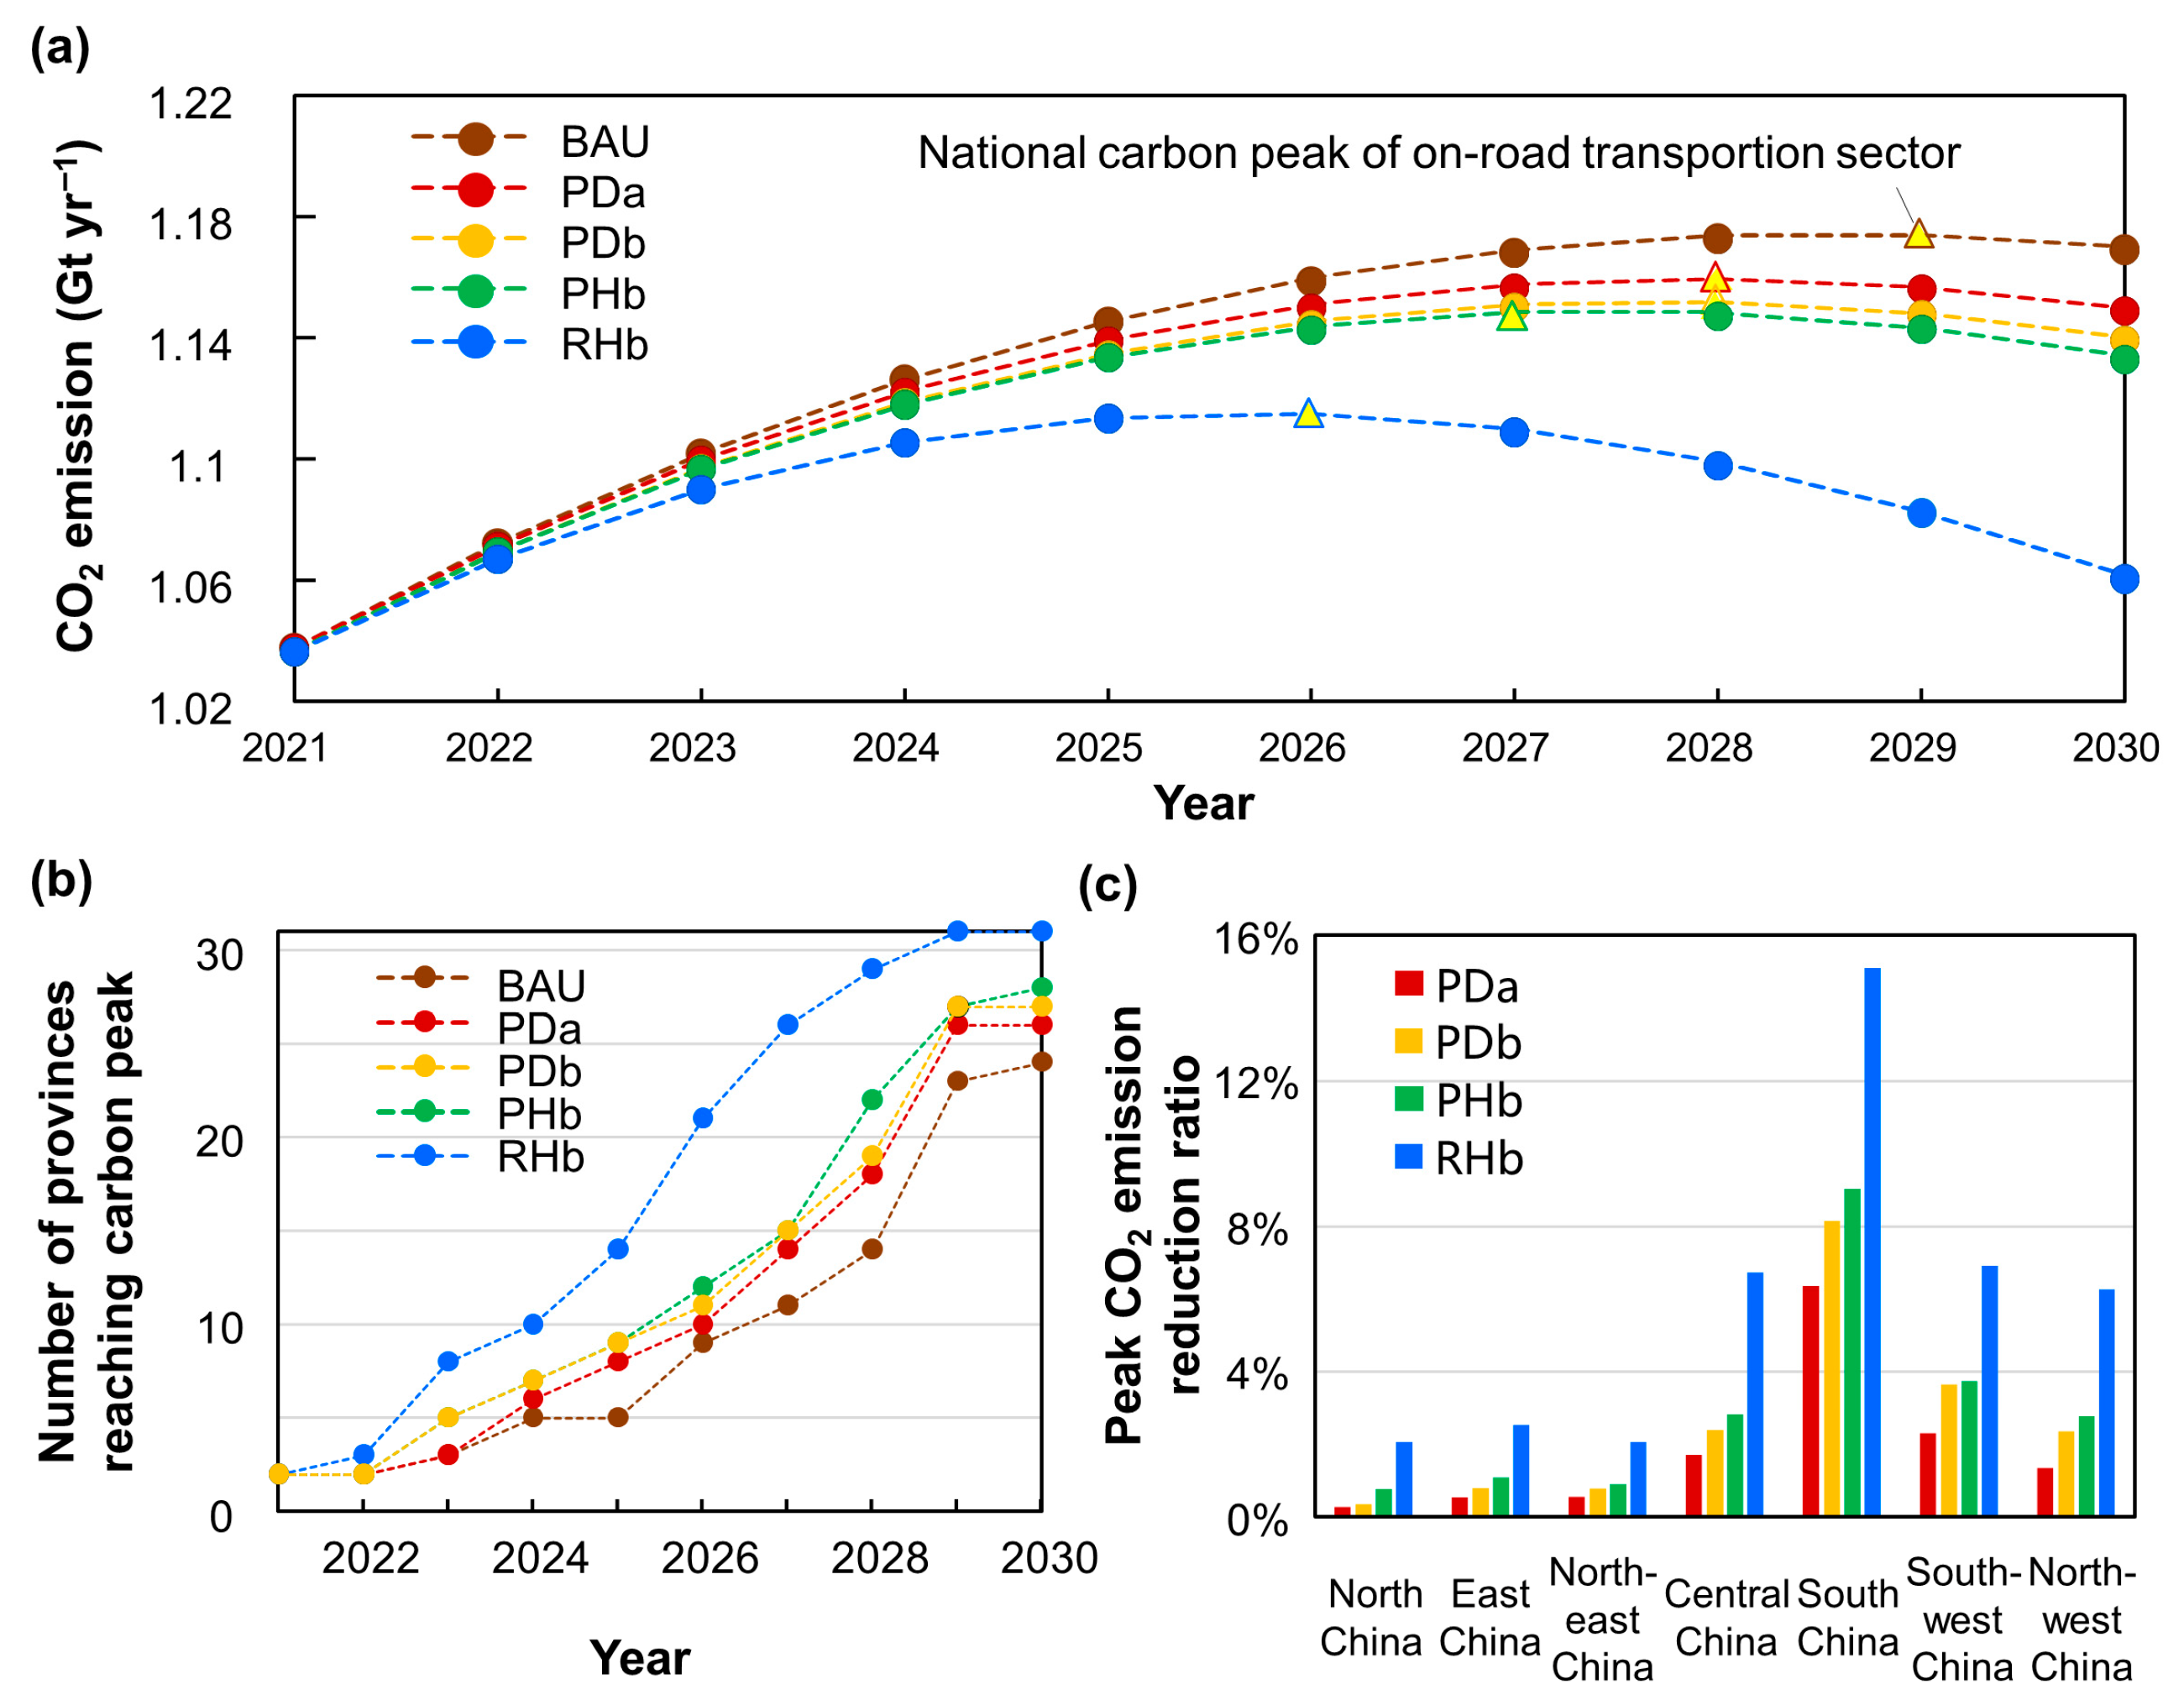
By calculating CO2 emissions during both the driving stage and power generation stage under each scenario using the LEAP model, vehicle electrification is found to accelerate the achievement of China’s carbon peaking target in the on-road transportation sector (Figure 4). When different vehicle electrification strategies are implemented, the national on-road transportation CO2 emission peak becomes both lower and earlier: compared to 1.18 Gt yr−1 under the BAU scenario, the peaks under the PDa, PDb, PHb, and RHb scenarios reach 1.16 Gt yr−1 (2028), 1.15 Gt yr−1 (2028), 1.14 Gt yr−1 (2027), and 1.12 Gt yr−1 (2026), respectively (Figure 4a). At the provincial level, vehicle electrification and a cleaner power generation structure enable more provinces in China to achieve their carbon peaking targets in the on-road transportation sector ahead of schedule, and with an accelerated electrification strategy, all 31 provinces can reach their emission peaks before 2030 (Figure 4b). The emission reduction ratio of peak CO2 emission is significantly enhanced by the accelerated vehicle electrification strategy under the RHb scenario, according to Figure 4c. Among all the regions in China, South China exhibits the highest sensitivity of peak CO2 emission reduction to vehicle electrification, primarily due to the rapid growth in vehicle ownership, especially in Guangdong province. Furthermore, the results of the sensitivity test calculated with the regional Operational Marginal (OM) and Build Marginal (BM) grid emission factors (Figure S2) show the upper and lower limits of emission reduction before 2030. This further underscores the impact of the cleanliness of electricity consumed by EV on emission reduction potential.
Figure 4.
Realization of carbon peaking target for China’s on-road transportation sector under the BAU, PDa, PDb, PHb, and RHb scenarios. (a) National CO2 emissions of the on-road transportation sector from 2021 to 2030 under different scenarios. (b) Number of provinces in which the on-road transportation sector reaches its carbon peak from 2021 to 2030 under different scenarios. (c) Peak CO2 emission reduction ratio of each region in China under different vehicle electrification scenarios compared to the BAU scenario.
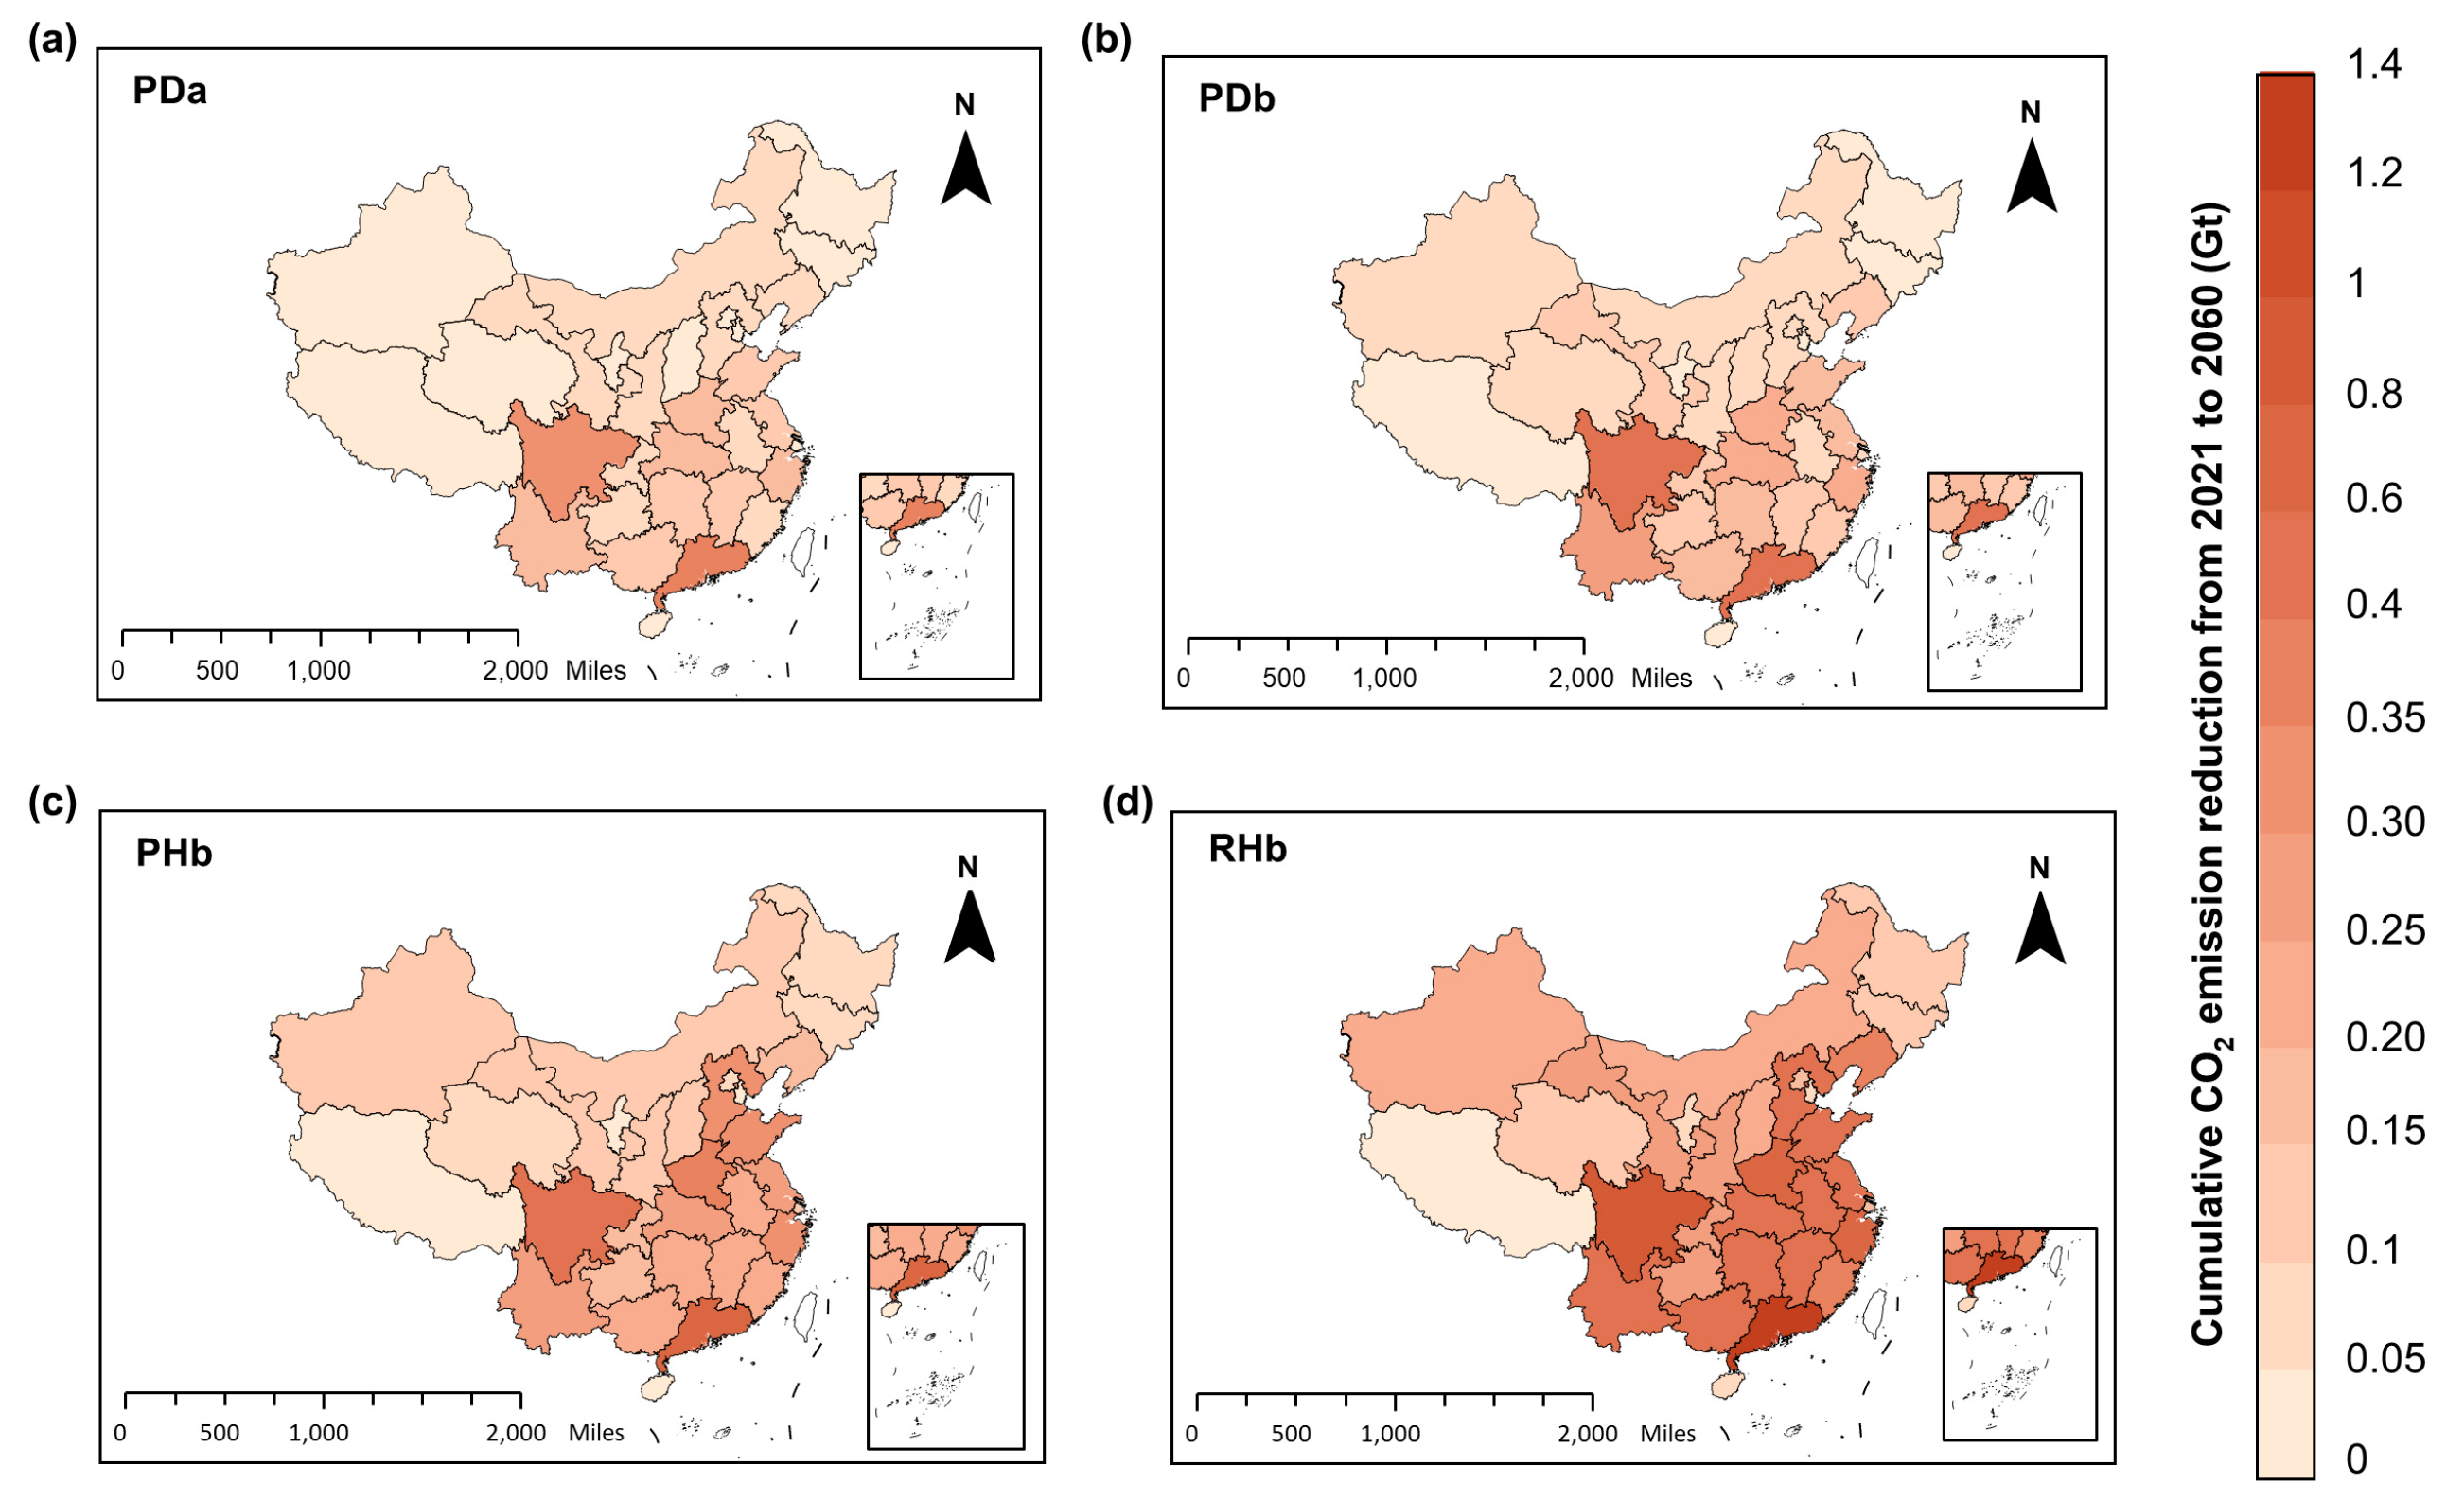
Beyond the carbon peaking target, the carbon neutrality target requires greater emission reductions before 2060. Table 3 presents the cumulative CO2 emission reductions in each region in China from 2021 to 2060 under different scenarios compared to the BAU scenario. At the national level, the cumulative CO2 emission reductions from the on-road transportation sector reach 3.0, 4.1, 6.1, and 11.7 Gt under the PDa, PDb, PHb, and RHb scenarios, accounting for 7.2%, 9.7%, 14.5%, and 27.7% of cumulative emissions under the BAU scenario, respectively. Regionally, under the PDa and PDb scenarios (where power generation development follows the less clean dual-carbon pathway), Southwest China achieves the highest cumulative CO2 emission reduction among all regions. This advantage is attributed to relatively low emission factors of the region’s power grids. In contrast, under the PHb and RHb scenarios (where power generation development follows the high-clean development pathway), regions with higher vehicle ownership density, including East China, South China, and Central China, exhibit greater emission reduction potential than Southwest China.
Table 3.
Cumulative CO2 emission reductions in each region in China under different scenarios from 2021 to 2060.
The provincial-level distribution of cumulative CO2 emission reductions from the on-road transportation sector over the study period (Figure 5) further corroborates the regional patterns of mitigation potential. Under the PDa and PDb scenarios, the variation in CO2 emission potential is distinct. Sichuan and Guangdong—where the vehicle ownership levels are high and emission factors of the power grids are low—exhibit much higher emission reduction potential of CO2. When the power generation structure shifts more rapidly towards clean energy, the same vehicle electrification strategy can lead to a significant increase in cumulative CO2 emission reductions in provinces with both high vehicle ownership levels and emission factors of power grids, such as Shanxi (101.2%), Hebei (272.7%), and Anhui (141.2%). Under the RHb scenario, where BEV rapidly replace most ICEV, the emission reduction potential will be further expanded by 75.1% (Hebei: 540.2 Mt) to 108.9% (Sichuan: 913.7 Mt) compared to the PHb scenario, underscoring the necessity of integrated strategies to support China’s carbon neutrality target in the on-road transportation sector. Notably, the impact of ambient temperature [75,76] or driving behaviors [77] on vehicle energy consumption intensity is not incorporated in this study due to the unavailability of provincially specific data. The provincial disparities in these factors could be systematically examined and integrated into future research.
Figure 5.
Provincial-level distribution of cumulative CO2 emission reductions in the on-road transportation sector from 2021 to 2060 under the PDa (a), PDb (b), PHb (c), and RHb (d) scenarios compared to the BAU scenario.
3.3. Cumulative Co-Reduction Potential of Air Pollutants and CO2
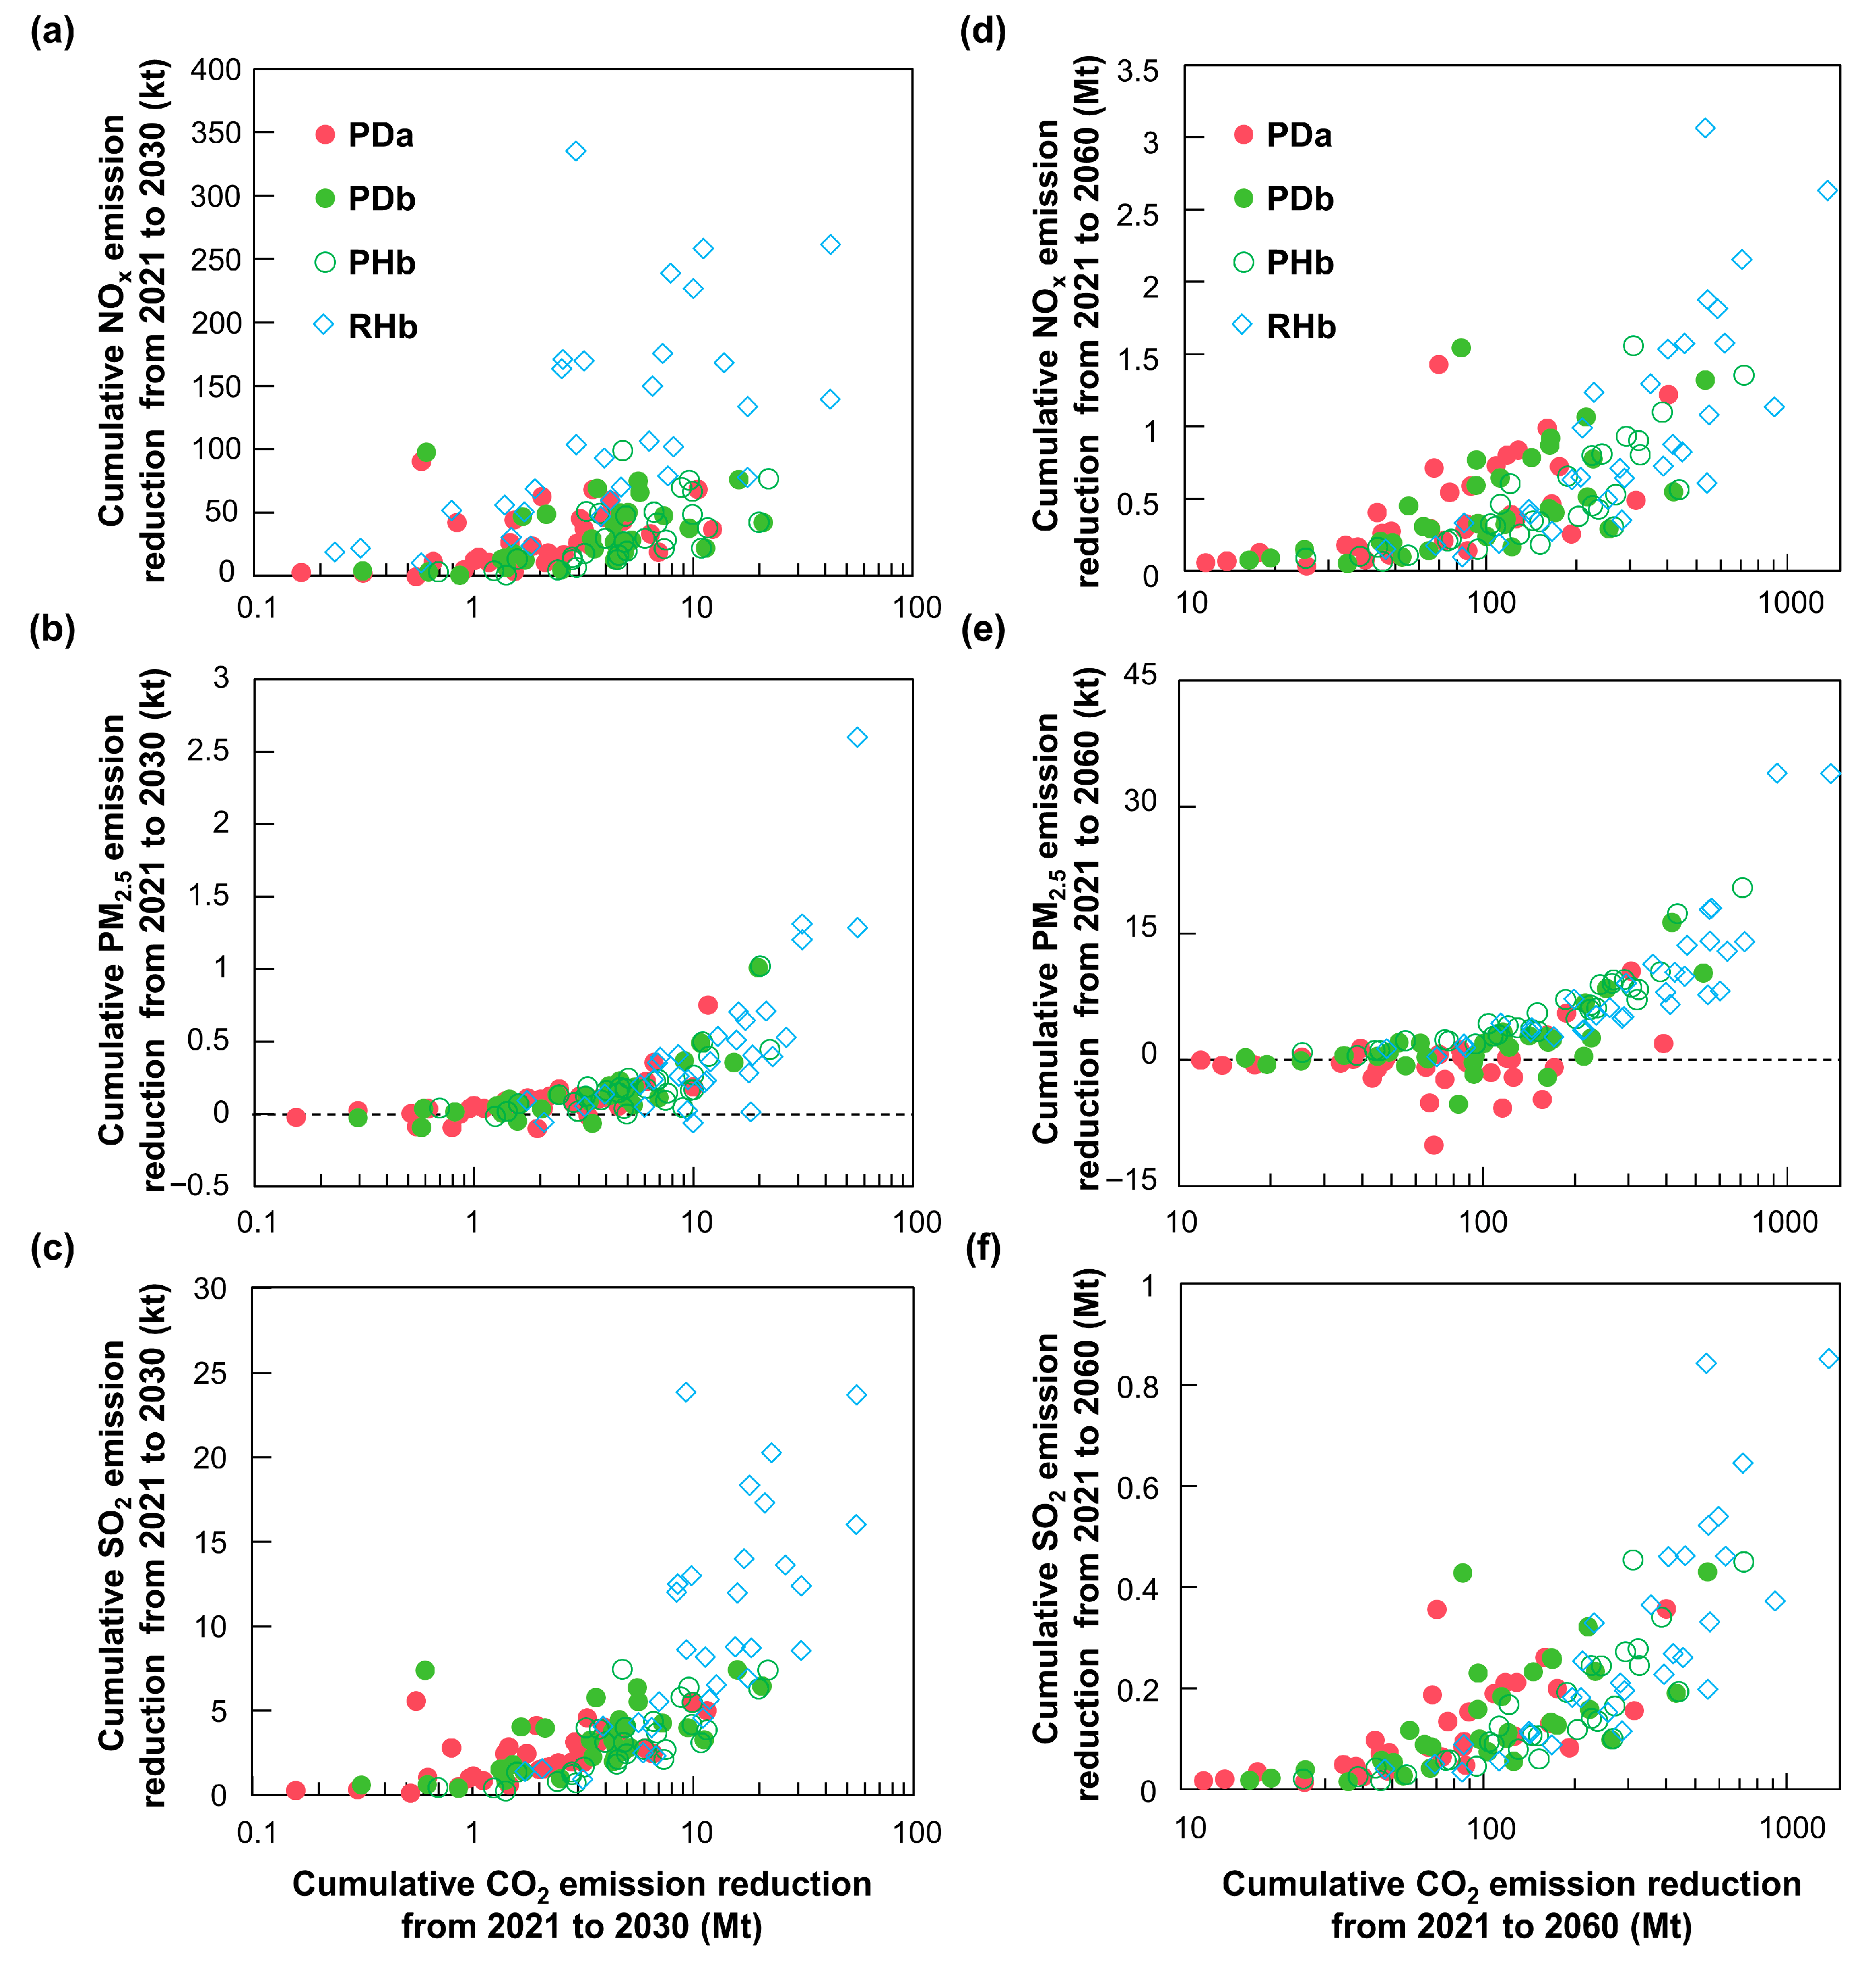
For all pollutants, the co-reduction potential of emissions is maximized under the RHb scenario, especially before 2030, due to the substantial increase in the fleet electrification proportion (Figure 6). However, the dominant driver of provincial emission reduction potential varies across different air pollutants. NOx (Figure 6a,d) and SO2 (Figure 6c,f) exhibit similar emission reduction patterns. The cleanliness of the power generation structure plays a minor role in their mitigation, as indicated by the slight difference in reduction effects between the PDb and PHb scenarios. At the provincial level, the diesel consumption intensity of vehicle fleets determines the reduction potential of NOx and SO2 in each province. For instance, Hebei, where the ownership of heavy cargo trucks is highest among all provinces, achieves the greatest reduction potential of NOx and SO2 under all scenarios, accounting for approximately 10% of national emission reductions. For PM2.5, some provinces under the PDa and PDb scenarios exhibit negative cumulative emission reductions from 2021 to 2030 (Figure 6b), with the situation worsening by 2060 (Figure 6c). This deterioration in PM2.5 pollution occurs because the emission reductions during the driving stage fail to offset the emission increases during the power generation stage. Therefore, provinces with both higher fleet power consumption intensity and higher emission factors of power grids, including Shandong, Anhui, and Hebei, are more likely to accumulate negative PM2.5 emission reductions under scenarios with a less-clean power generation structure. In contrast, provinces with cleaner regional power grids such as Sichuan, Yunnan, and Guizhou are able to accumulate a great sum of positive emission reductions in PM2.5 across all scenarios (Figure S4). It is implied that the reduction potential of NOx and SO2 can be further expanded by prioritizing the electrification of vehicle types with high diesel consumption intensity, while PM2.5 mitigation requires decarbonization upgrades to power grids and stricter PM2.5 control for power plants primarily.
Figure 6.
Cumulative co-reduction potential of air pollutants and CO2 in China’s on-road transportation sector: (a–c) Cumulative co-reduction potential of NOx, PM2.5, and SO2 with CO2 in China’s on-road transportation sector by 2030, respectively. (d–f) Cumulative co-reduction potential of NOx, PM2.5, and SO2 with CO2 in China’s on-road transportation sector by 2060, respectively.
3.4. Cost–Benefit Analysis of Vehicle Electrification
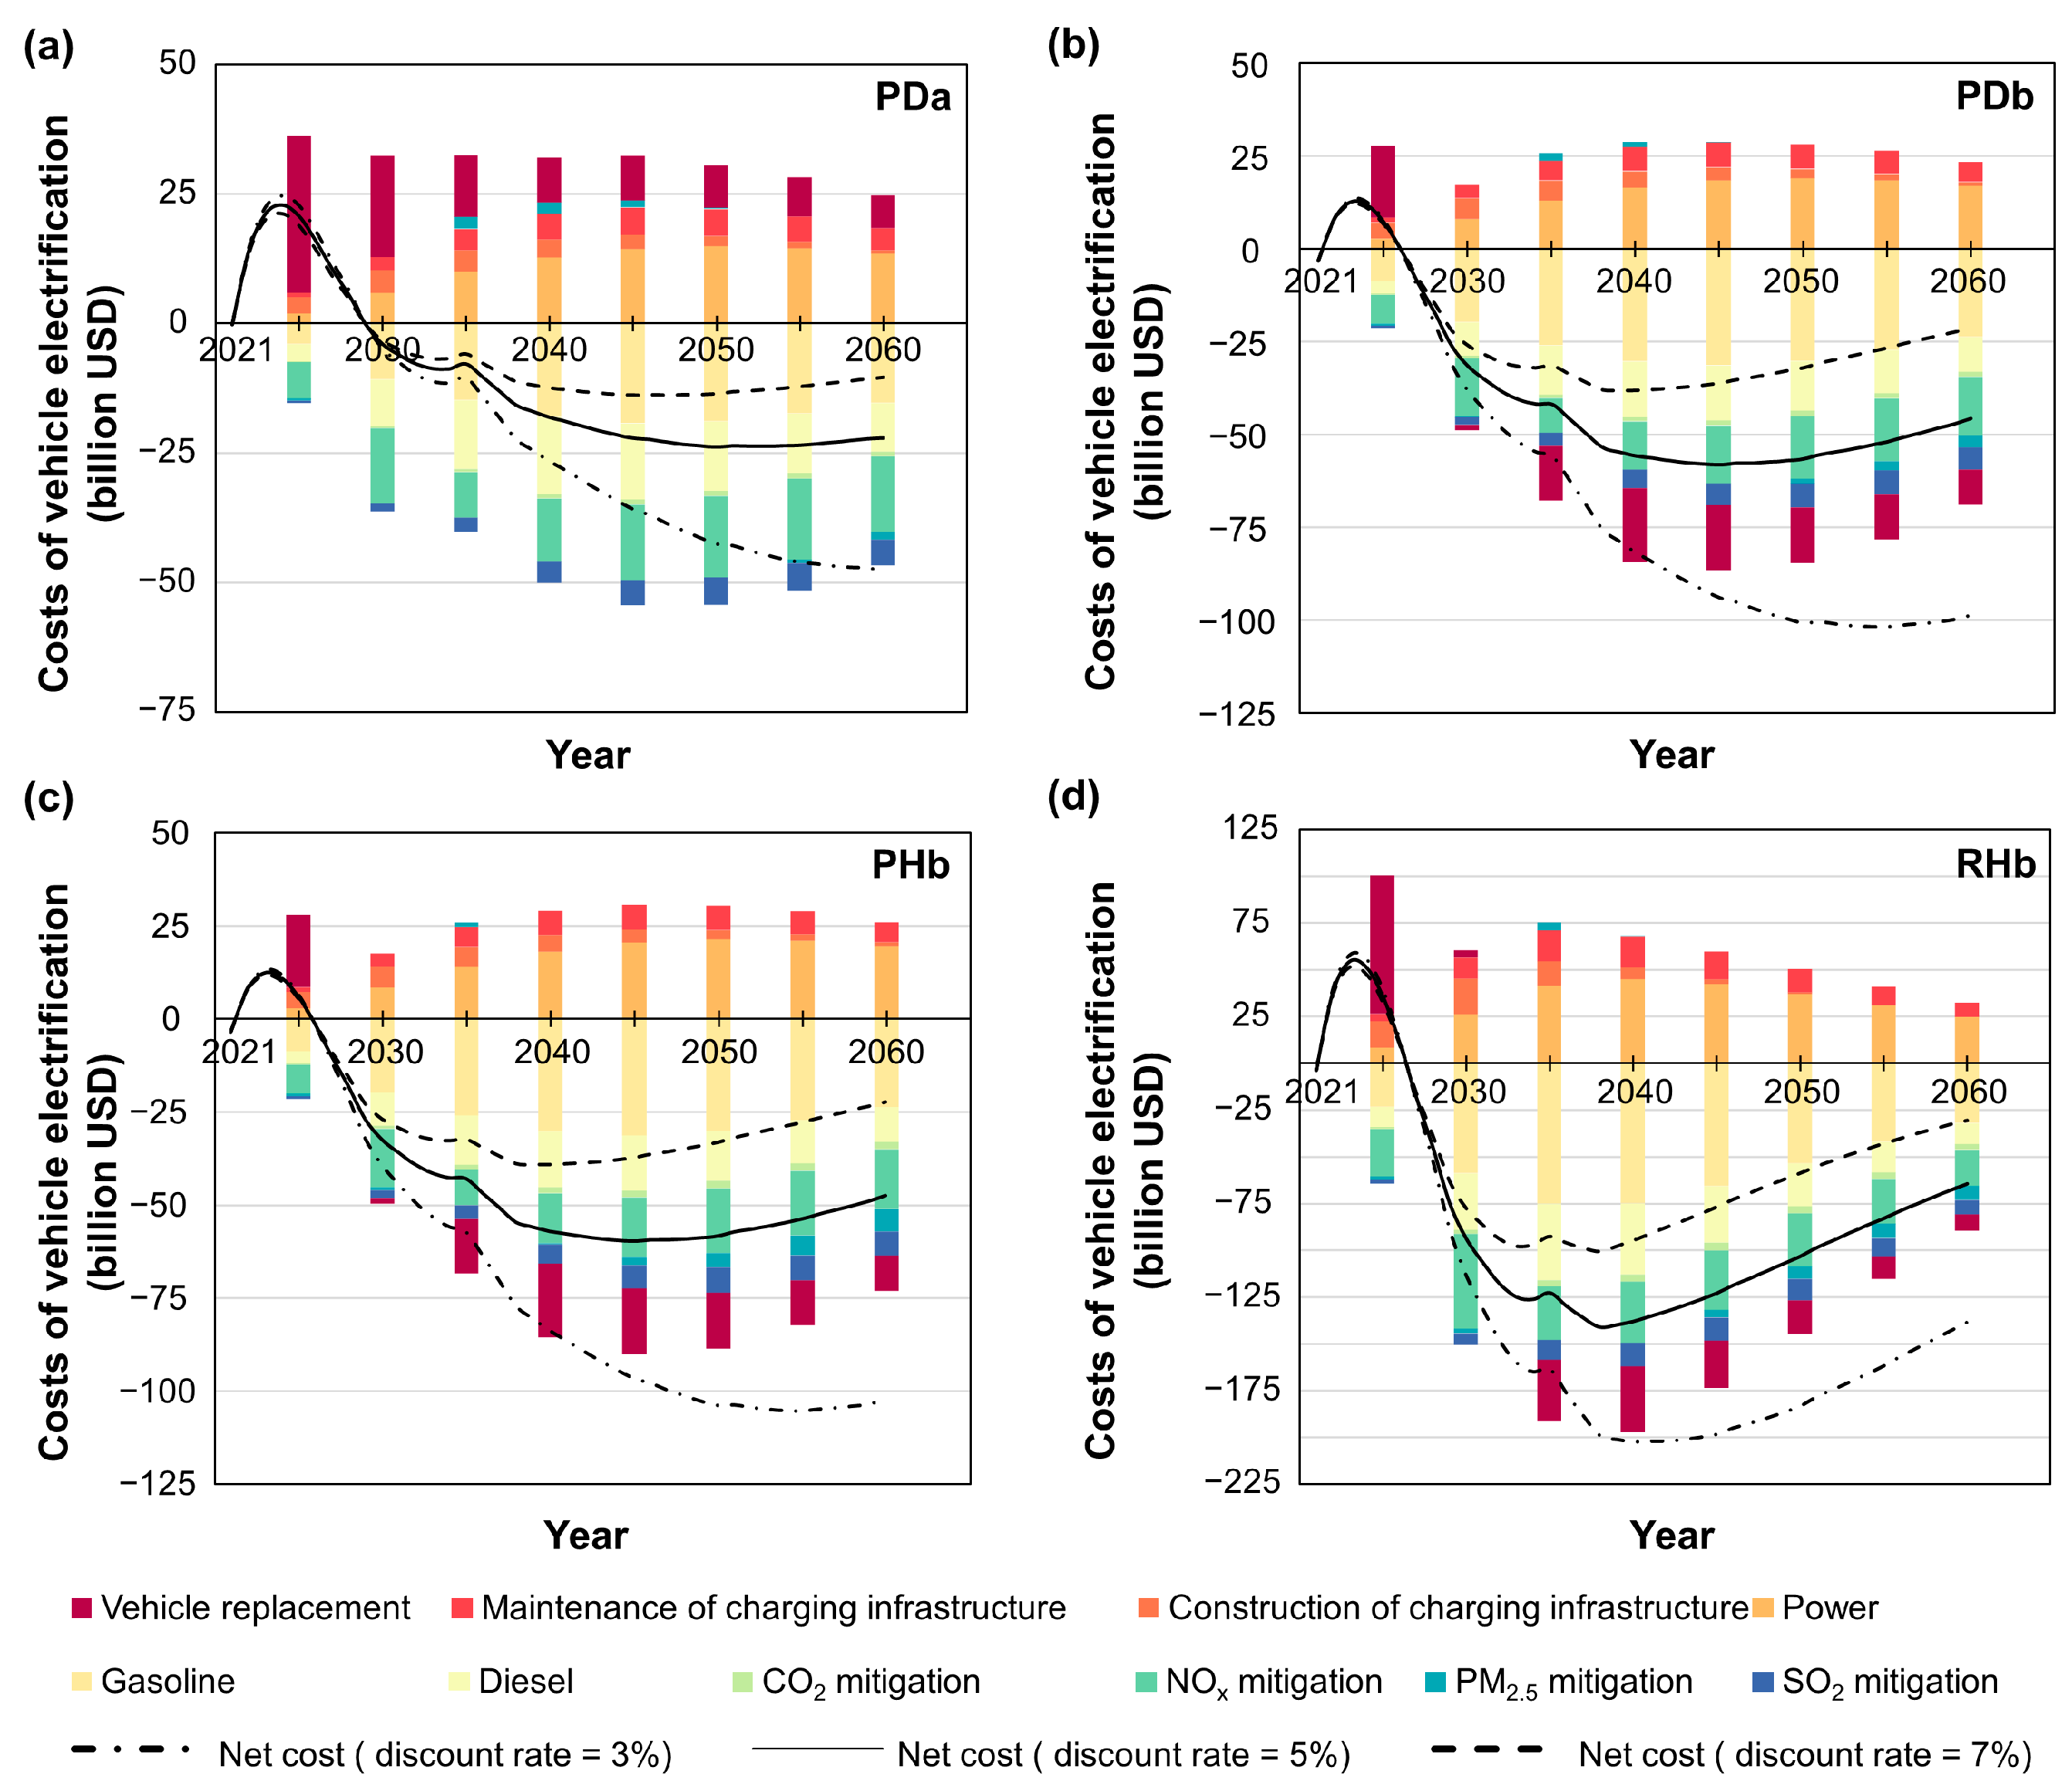
The trade-offs between upfront investments in device replacement, charging infrastructure, and grid upgrades versus the monetized benefits from fuel savings and mitigation of climate and air pollution are calculated and illustrated in Figure 7. Under all scenarios, in the central case with a 5% yr−1 discount rate, costs will peak around 2025, and benefits will exceed costs after around 2028, indicating promising economic benefits of implementing vehicle electrification. As shown by the curves in Figure 7, variations in the discount rate will affect the present value and peaking year of future net costs. Notably, the turning point of net cost curves in 2035 is caused by the change in decrease rate of fuel emission factors. The vehicle replacement costs remain positive only under the PDa scenario, as prices of PHEV are assumed to be higher than ICEV over the study period, while under the other three scenarios all ICEV are substituted with BEV, which are projected to become cheaper than ICEV after around 2030. After around 2035, the growing costs of power consumption constitute the largest component of total costs across all scenarios. In contrast, the largest benefit components are fuel savings and the value of avoided deaths resulting from NOx pollution mitigation. Due to the substantial growth in BEV, the net cost peak under the RHb scenario is the highest among all scenarios, reaching USD 54.9 billion at a 5% yr−1 discount rate, which is 2.4, 4.3, and 4.4 times the net cost peaks under the PDa, PDb, and PHb scenarios, respectively. Benefits are likewise expanded under the RHb scenario, peaking at USD 140.7 billion at a 5% yr−1 discount rate, which is 6.2, 2.4, and 2.3 times the net benefit peaks under the PDa, PDb, and PHb scenarios, respectively, indicating that the substantial upfront investments required for an accelerated vehicle electrification strategy will yield large returns in later stages. To enhance the reliability of this study, the results of sensitivity tests considering uncertainties in the vehicle price pathway, usage patterns of charging piles, VSL elasticity, and SCC are provided in Figure S3. In the early stage of vehicle electrification, cost uncertainty under the RHb scenario is the highest among all scenarios due to the rapid penetration of EV. The total cost of vehicle electrification exhibits the strongest positive response to the changes in the vehicle price pathway and exhibits strongest negative response to the increase in charging pile usage rate (in 2030) and escalated SCC value (in 2060).
Figure 7.
Cost–benefit composition (discount rate = 5% yr−1) and net cost–benefit curves of vehicle electrification in China under the PDa (a), PDb (b), PHb (c), and RHb (d) scenarios.
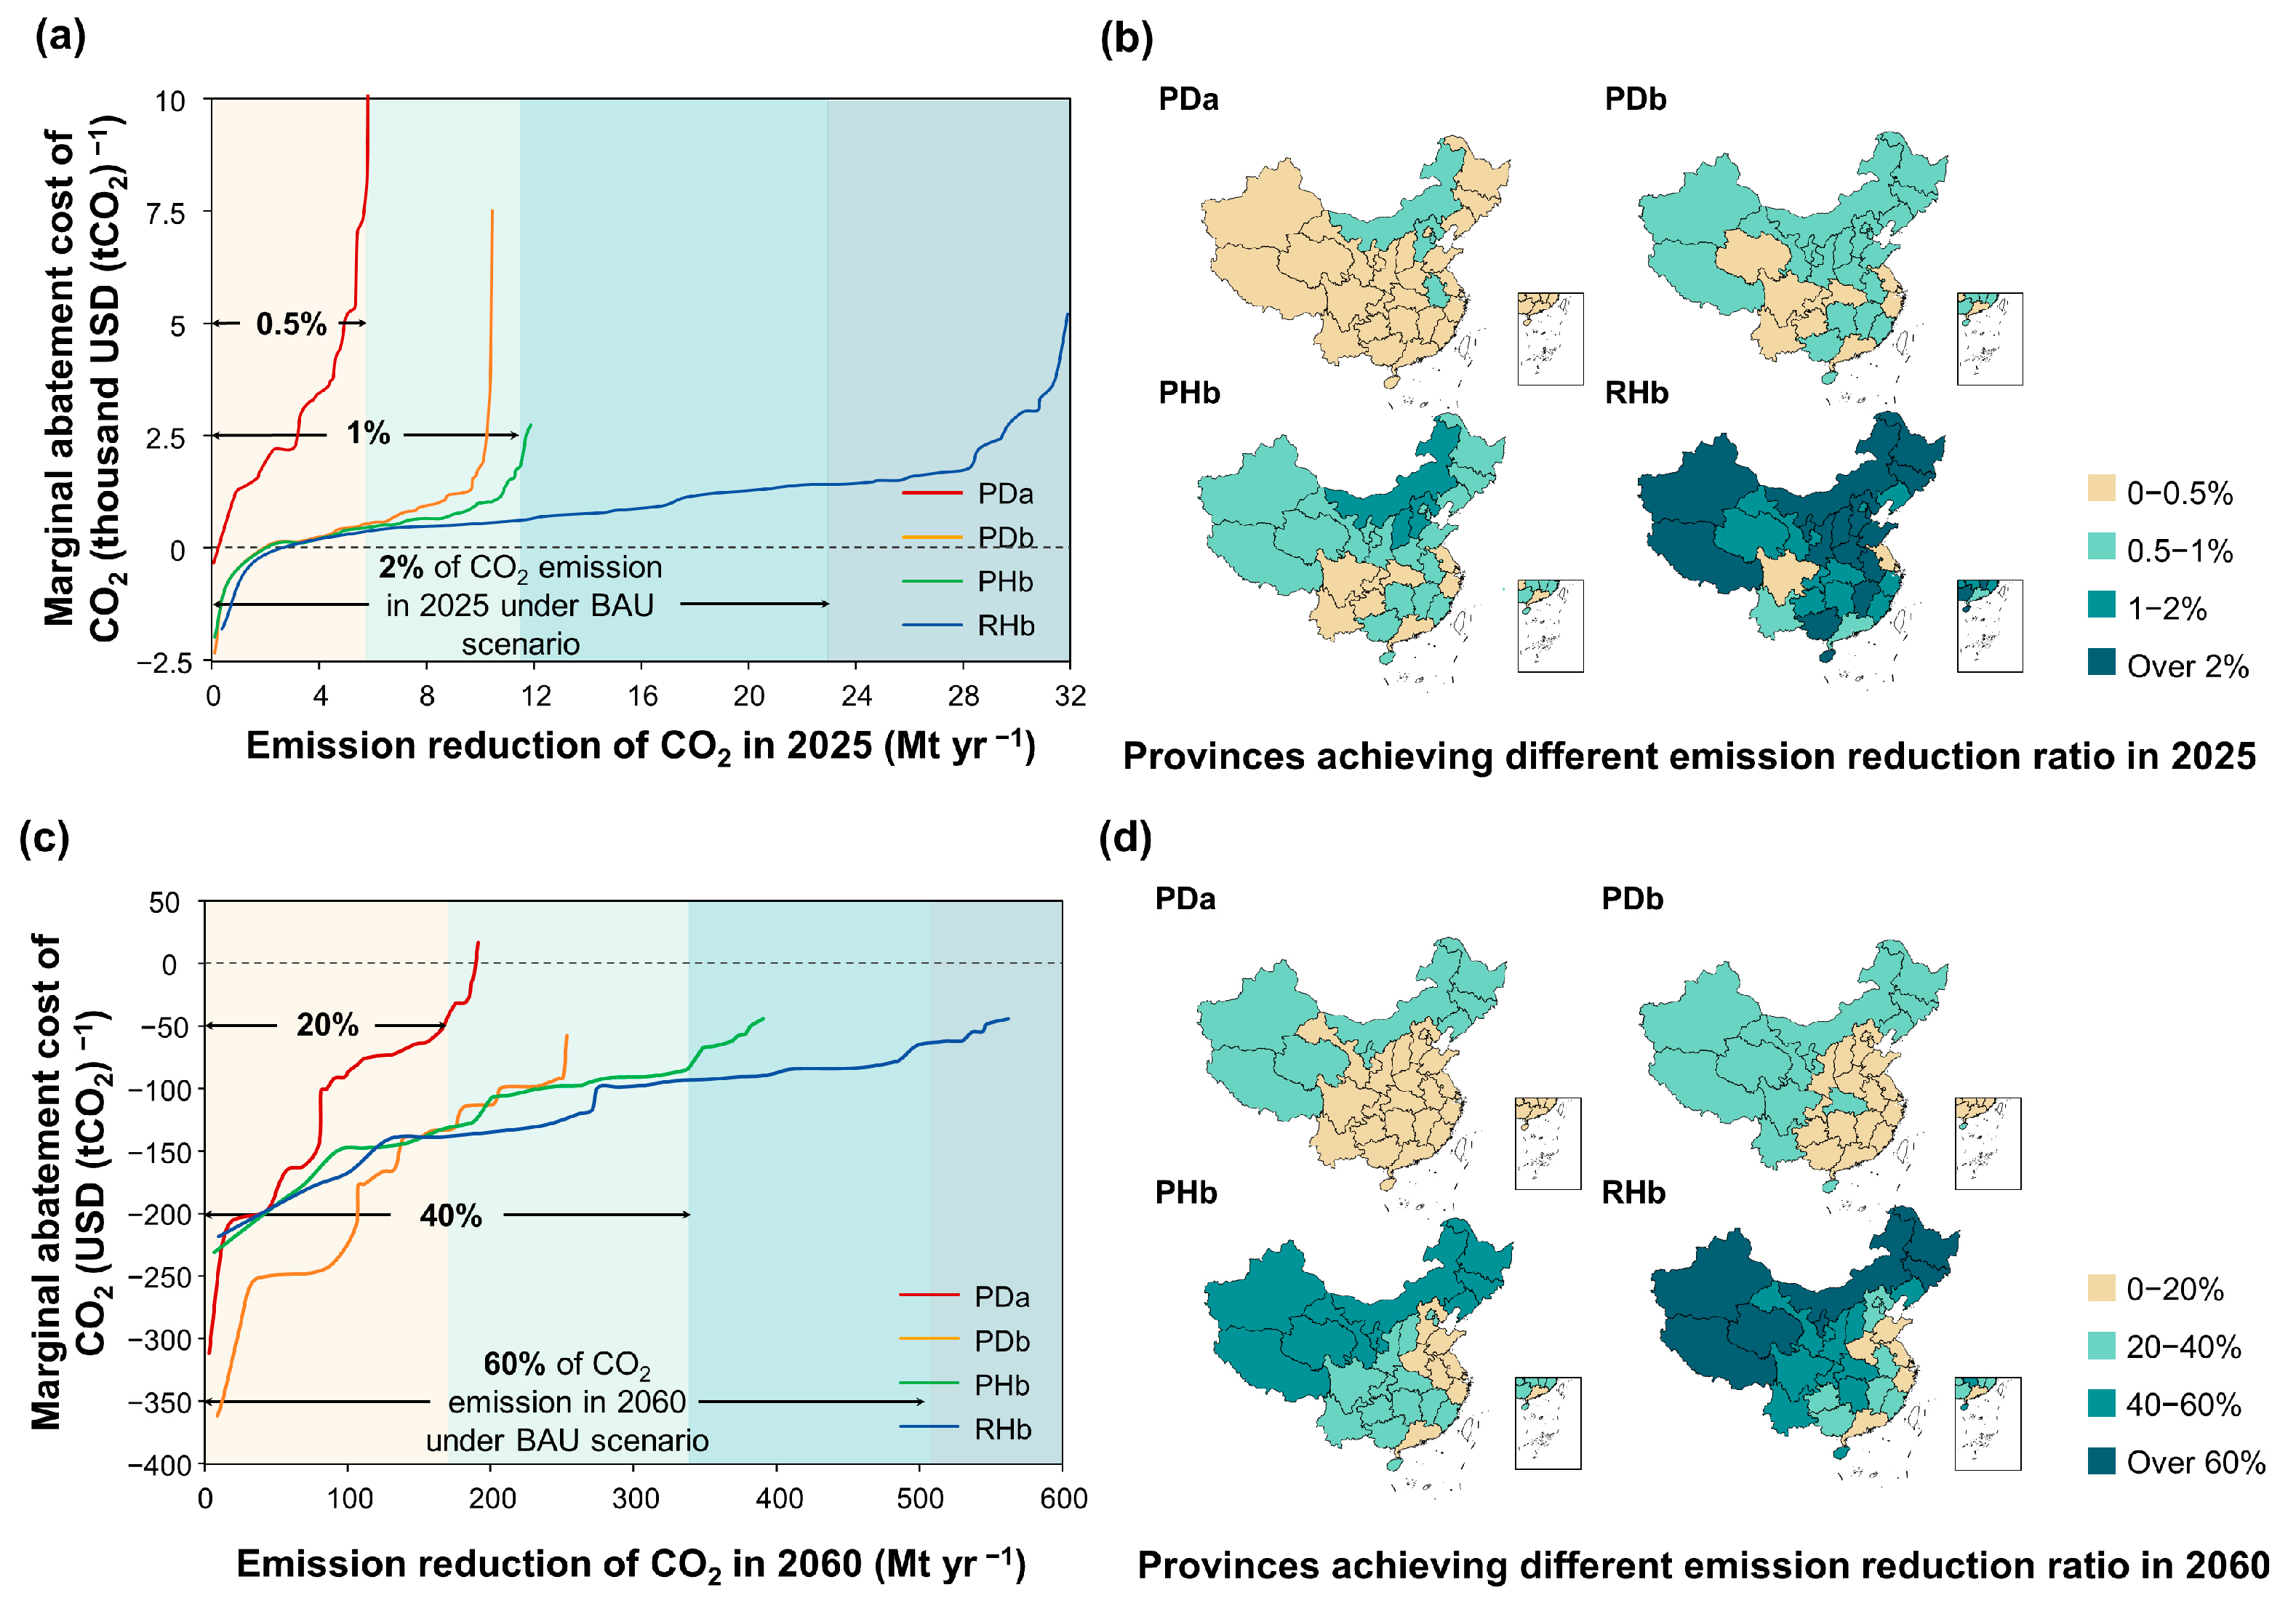
Marginal abatement cost curves further characterize the provincial CO2 abatement potential and corresponding costs in different mitigation stages under each scenario, providing an insight into regional mitigation priorities for policymakers (Figure 8).
Figure 8.
Marginal abatement costs of vehicle electrification. Marginal abatement costs under the PDa, PDb, PHb, and RHb scenarios in 2025 (a) and 2060 (c) when the discount rate is 5% yr−1. Distribution of provinces achieving different emission reduction ratio under different vehicle electrification scenarios in 2025 (b) and 2060 (d).
In 2025, China’s average marginal abatement cost reaches USD 3466, 615, 532, and 1124 tCO2−1 under the PDa, PDb, PHb, and RHb scenarios, respectively, contributing to a 0.5–2.8% reduction in annual emissions under the BAU scenario. These results exceed previous estimates of China’s marginal abatement cost of EV technology during 2021 to 2030, which ranges from CNY 4000–6000 [41,43] (equivalent to USD 580–780) tCO2−1, especially for the PDa and RHb scenarios, when the costs of vehicle replacement are higher than in the other two scenarios (Figure S5). This discrepancy is primarily because previous studies did not include costs from the construction and maintenance of charging piles or synchronous electrification in cargo trucks. To achieve a 0.5% emission reduction, the marginal cost for each scenario reaches USD 8322, USD 583, USD 507, and USD 374 tCO2−1 respectively. Regions with the lowest unit abatement costs are concentrated in provinces that combine large vehicle ownership and high population density such as Shanghai, Guangdong, Jiangsu, and Sichuan, where health benefits from mitigation respond strongly to vehicle electrification efforts. Conversely, provinces with low population density (mainly concentrated in Northeast and Northwest China) and high emission factors of power grids (mainly concentrated in Middle and North China) exhibit markedly higher unit abatement costs at the initial mitigation stage. In 2060, national CO2 emission reductions will reach 22.6–66.5% of the annual emission level under the BAU scenario, with average marginal abatement costs ranging from −USD 180 to −USD 113 tCO2−1. This indicates that the mitigation is shifted from externally incentivized measures to spontaneous actions in the later stage credit to substantial benefits from fuel savings and improved health. Compared with the situation in 2025, marginal abatement benefits become less sensitive to the cleanliness of provincial power grids, since the decarbonization of power grids has been upgraded throughout the country. Therefore, provinces with higher marginal benefits are concentrated in high-population-density regions such as the Yangtze River Delta, Beijing, Guangdong, and Shandong.
4. Conclusions
Based on the foregoing analysis, the principal findings are summarized as follows:
- China’s national vehicle ownership will continue to expand until reaching a peak at 588.3 million in 2048. By the end of the study period, national ownership of PV and CT will be, respectively, 107.8% and 95.8% higher than the base-year level, indicating the necessity of the electrification transition of vehicle fleet. The share of BEV in the total fleet will be boosted to 34.9%, 59.2%, and 81.8% under the PDa, PDb/PHb, and RHb scenarios, signaling a future shift to grid reliance.
- The positive role of vehicle electrification in achieving carbon peaking and carbon neutrality targets is verified. Under the four mitigation scenarios, the national carbon peak of the on-road transportation sector will be reduced by 0.1–0.4 Gt yr−1 and advanced by 1–3 years. By 2060, cumulative CO2 emission reductions in China’s on-road transportation sector will reach 3.0–11.7 Gt. Notably, actions under the RHb scenario will enable all 31 provinces to achieve carbon peaking in their on-road transportation sectors before 2030 and achieve the maximum mitigation effect by coupling an accelerated vehicle electrification strategy with a deeply decarbonized power grid.
- For air pollutants, the provincial co-reduction potential of NOx and SO2 follows a consistent pattern, primarily driven by the diesel consumption intensity of the vehicle fleet. In contrast, the mitigation of PM2.5 requires a high-cleanliness power generation structure and stricter PM2.5 control for power plants to prevent pollution deterioration caused by emissions from the power generation stage.
- The results of the cost–benefit analysis reveal that costs of vehicle replacement and power consumption are the largest cost components in the early and late mitigation stages, respectively. Benefits from health improvements and fuel savings will exceed costs after around 2030, suggesting that targeted subsidies and investments are needed to kickstart vehicle electrification. Under the RHb scenario, both the net cost peak and future benefit peak are the highest across all scenarios, reaching USD 54.9 billion and USD 140.7 billion at a 5% yr−1 discount rate, respectively. The marginal abatement cost ranges from USD 532 to USD 3466 tCO2−1 in 2025 and from −USD 180 to −USD 113 tCO2−1 in 2060 among scenarios. At the provincial level, low marginal abatement costs are mainly concentrated in provinces with high population density and large vehicle ownership, such as Shanghai, Guangdong, and Jiangsu. Over time, marginal abatement costs decrease from thousands of dollars at the start of mitigation to negative values by the end, demonstrating that the economic viability of vehicle electrification improves over time.
These findings can provide insights into designing national and regional vehicle electrification strategies and supporting policies. With the initial priority to implementing vehicle electrification primarily in cost-effective regions (e.g., Shanghai, Guangdong) and a long-term investment in nationwide clean energy, China will be able to enhance emission reductions from the on-road transportation sector through a self-sustaining vehicle electrification process, thereby realizing the carbon neutrality target and gaining substantial economic benefits.
Notably, during the promotion of vehicle electrification, attention should be paid on the limiting factors of electrification levels, such as challenges in the battery supply chain [78] and the reduced driving range of EV in low-temperature environments [76] that might influence consumer preferences. Additionally, the growing penetration of EV should draw attention to their associated negative impacts, including environmental damage from battery production and disposal [79,80], excessive burden on power grids, and fire risks [81]. This study provides a foundational framework for evaluating the emission reduction potential during the promotion of vehicle electrification and monetizing its associated costs and benefits, which can be utilized for further assessment of provincially differentiated vehicle electrification policies based on the current electrification level. Nevertheless, due to data limitations and model assumptions, this study does not account for battery recycling systems, future electricity transmission plans, or provincial heterogeneity in driving behaviors, which could be addressed in future research.
Supplementary Materials
The following supporting information can be downloaded at: https://www.mdpi.com/article/10.3390/su172210116/s1, Supplementary Figures includes: Figure S1: Cargo turnover volume of China under different fuel price increase rates and fuel-price elasticity coefficients from 2021 to 2060; Figure S2: CO2 emission reduction in China’s on-road transportation sector calculated based on the different power grid emission factors under 4 vehicle electrification scenarios compared with BAU scenario.; Figure S3: Tornado charts for cost increment to key variables of vehicle electrification relative to the central case under different scenarios in 2030 (a), 2060 (b); Figure S4: Provincial cumulative emission reduction of PM2.5 in 2030 (a), 2060 (b) under 4 vehicle electrification scenarios; Figure S5: Components of average marginal abatement cost of vehicle electrification in China under 4 scenarios in 2025. Supplementary Tables includes: Table S1: Fitting results of parameters of the historical trend between the number of PV per 1000 people and per capita GDP in each province of China (except Beijing); Table S2: Fitting results of parameters of the historical trend between cargo turnover and income elasticity in each province of China; Table S3: Sales share of each energy type of vehicles in passenger vehicles and cargo trucks under different vehicle electrification strategies; Table S4: Proportion of vehicles that meet different levels of emission standards for different types of vehicles; Table S5: Emission factors of CO2, NOx, PM2.5 and SO2 of provincial power grids in the base year; Table S6: Proportion of vehicles of different structures and sizes among all vehicles in China’s 31 provinces in the base year; Table S7: Average annual mileage for vehicles of different structures and sizes; Table S8: Unit cost to replace ICEV with EV over the study period; Table S9: Parameters for two types of charging piles adopted in this study. Supplementary Dataset includes: Sheet S1: Provincial ownership of passenger vehicles from 2021 to 2060 in China; Sheet S2: Provincial ownership of cargo trucks from 2021 to 2060 in China; Sheet S3: Energy consumption intensity per unit mileage of vehicles by structure, energy type and size over the study period; Sheet S4: Emission factors of air pollutants during the driving phase of different types of ICEV; Sheet S5: Provincial marginal abatement cost in 2025 when discount rate = 5%; Sheet S6: Provincial marginal abatement cost in 2060 when discount rate = 5%; Sheet S7: Provincial value of statistical life over the study period; Sheet S8: Provincial electricity price under dual-carbon development pathway of power generation structure; Sheet S9: Provincial electricity price under high-clean development pathway of power generation structure.
Author Contributions
Conceptualization, J.L. and R.W.; methodology, J.L., Y.W. and R.W.; formal analysis, J.L.; writing—original draft preparation, J.L. and R.W.; writing—review and editing, J.L., Y.W. and R.W.; visualization, J.L.; supervision, R.W. All authors have read and agreed to the published version of the manuscript.
Funding
This study was funded by the National Key Research and Development Program of China (No. 2022YFF0802504) and the National Natural Science Foundation of China (No. 41877506 and 42341205). R.W. acknowledges support from the Shanghai International Science and Technology Partnership Project (No. 21230780200), and the Shanghai B&R Joint Laboratory Project (No. 22230750300). Y.W. acknowledges support from China National Postdoctoral Program for Innovative Talents (No. BX20240083), and the China Postdoctoral science foundation (No. 2025M771284).
Institutional Review Board Statement
Not applicable.
Informed Consent Statement
Not applicable.
Data Availability Statement
The original contributions presented in this study are included in the article/Supplementary Materials. Further inquiries can be directed to the corresponding author.
Conflicts of Interest
The authors declare no conflicts of interest.
Abbreviations
The following abbreviations are used in this manuscript:
| GHG | Greenhouse gas(es) |
| ICEV | Internal-combustion-engine vehicle(s) |
| EV | Electric vehicle(s) |
| BEV | Battery electric vehicle(s) |
| PHEV | Plug-in hybrid electric vehicle(s) |
| LEAP | Low Emission Analysis Platform |
| PV | Passenger vehicle(s) |
| CT | Cargo truck(s) |
| GDP | Per capita gross domestic product |
| BAU | (the) Business-as-usual (scenario) |
| PDa | (the) Policy-Guided PHEV Mix + Dual-Carbon Grid (scenario) |
| PDb | (the) Policy-Guided All-BEV + Dual-Carbon Grid (scenario) |
| PHb | (the) Policy-Guided All-BEV + High-Clean Grid (scenario) |
| RHb | (the) Rapid All-BEV + High-Clean Grid (scenario) |
| TS | Targeted scenario |
| CCUS | Carbon capture, utilization and storage technology |
| CNY | China Yuan |
| USD | United States Dollar |
| NBSC | National Bureau of Statistics of China |
| IEA | International Energy Agency |
| OM | Operating Marginal |
| BM | Build Marginal |
| CO2 | Carbon dioxide |
| tCO2−1 | per ton carbon dioxide |
| NOx | Nitrogen oxides |
| PM2.5 | Particulate matter with a diameter of less than or equal to 2.5 μm |
| SO2 | Sulfur Dioxide |
| SCC | Social Carbon Cost |
| VSL | Value of Statistical Life |
References
- IEA. CO2 Emissions in 2022; International Energy Agency: Paris, France, 2023. [Google Scholar]
- Peng, T.; Ou, X.; Yuan, Z.; Yan, X.; Zhang, X. Development and application of China provincial road transport energy demand and GHG emissions analysis model. Appl. Energy 2018, 222, 313–328. [Google Scholar] [CrossRef] [Scilit]
- Ministry of Ecology and Environment of the People’s Republic of China. China Mobile Source Environmental Management Annual Report; Ministry of Ecology and Environment, China: Beijing, China, 2020. [Google Scholar]
- Chen, W.; Zhang, S.; Tong, Q.; Zhang, X.; Zhao, H.; Ma, S.; Xiu, A.; He, Y. Regional Characteristics and Causes of Haze Events in Northeast China. Chin. Geogr. Sci. 2018, 28, 836–850. [Google Scholar] [CrossRef] [Scilit]
- Gao, C.; Xiu, A.; Zhang, X.; Chen, W.; Liu, Y.; Zhao, H.; Zhang, S. Spatiotemporal characteristics of ozone pollution and policy implications in Northeast China. Atmos. Pollut. Res. 2020, 11, 357–369. [Google Scholar] [CrossRef] [Scilit]
- Huang, W.; Fan, H.; Qiu, Y.; Cheng, Z.; Xu, P.; Qian, Y. Causation mechanism analysis for haze pollution related to vehicle emission in Guangzhou, China by employing the fault tree approach. Chemosphere 2016, 151, 9–16. [Google Scholar] [CrossRef] [Scilit] [PubMed]
- Wang, F.; Zheng, P.; Dai, J.; Wang, H.; Wang, R. Fault tree analysis of the causes of urban smog events associated with vehicle exhaust emissions: A case study in Jinan, China. Sci. Total Environ. 2019, 668, 245–253. [Google Scholar] [CrossRef] [Scilit]
- General Office of the State Council of the People’s Republic of China. New Energy Vehicle Industry Development Plan (2021–2035); General Office of the State Council of the People’s Republic of China: Beijing, China, 2020.
- General Office of the State Council of the People’s Republic of China. Energy Conservation and New Energy Vehicle Industry Development Plan (2012–2020); General Office of the State Council of the People’s Republic of China: Beijing, China, 2012.
- Ministry of Industry and Information Technology of the People’s Republic of China; National Development and Reform Commission of the People’s Republic of China; Ministry of Science and Technology of the People’s Republic of China. Medium- and Long-Term Development Plan for the Automotive Industry; Ministry of Industry and Information Technology of the People’s Republic of China: Beijing, China, 2017.
- General Office of the State Council of the People’s Republic of China. Guidelines of the Central Committee of the Communist Party of China and the State Council on Comprehensively, Accurately and Fully Implementing the New Development Philosophy to Achieve Carbon Peak and Carbon Neutrality; General Office of the State Council of the People’s Republic of China: Beijing, China, 2021.
- He, X.; Zhang, S.; Wu, Y.; Wallington, T.J.; Lu, X.; Tamor, M.A.; McElroy, M.B.; Zhang, K.M.; Nielsen, C.P.; Hao, J. Economic and Climate Benefits of Electric Vehicles in China, the United States, and Germany. Environ. Sci. Technol. 2019, 53, 11013–11022. [Google Scholar] [CrossRef] [Scilit]
- Liang, X.; Zhang, S.; Wu, Y.; Xing, J.; He, X.; Zhang, K.M.; Wang, S.; Hao, J. Air quality and health benefits from fleet electrification in China. Nat. Sustain. 2019, 2, 962–971. [Google Scholar] [CrossRef] [Scilit]
- Lang, V.A.; Camilleri, S.F.; Deylami, N.; Harris, M.H.; Koehler, L.; Urbaszewski, B.; Montgomery, A.; Horton, D.E. Assessing the air quality, public health, and equity implications of an Advanced Clean Trucks policy for Illinois. Front. Earth Sci. 2025. [Google Scholar] [CrossRef] [Scilit]
- Zhao, T.; Heinrich, J. Air pollution, health impacts, and new energy vehicles in China. Front. Environ. Health 2024, 3, 1477209. [Google Scholar] [CrossRef] [Scilit]
- Wang, L.; Chen, X.; Zhang, Y.; Li, M.; Li, P.; Jiang, L.; Xia, Y.; Li, Z.; Li, J.; Wang, L.; et al. Switching to electric vehicles can lead to significant reductions of PM2.5 and NO2 across China. One Earth 2021, 4, 1037–1048. [Google Scholar] [CrossRef] [Scilit]
- Fulton, L.; Ward, J.; Taylor, P.; Kerr, T. Technology Roadmap: Electric and Plug-In Hybrid Electric Vehicles; OECD/IEA: Paris, France, 2009. [Google Scholar]
- Slowik, P.; Pavlenko, N.; Lutsey, N. Assessment of Next-Generation Electric Vehicle Technologies; International Council on Clean Transportation: Washington, DC, USA, 2016. [Google Scholar]
- Nordelöf, A.; Messagie, M.; Tillman, A.-M.; Ljunggren Söderman, M.; Van Mierlo, J. Environmental impacts of hybrid, plug-in hybrid, and battery electric vehicles—What can we learn from life cycle assessment? Int. J. Life Cycle Assess. 2014, 19, 1866–1890. [Google Scholar] [CrossRef] [Scilit]
- Hadley, S.W.; Tsvetkova, A.A. Potential impacts of plug-in hybrid electric vehicles on regional power generation. Electr. J. 2009, 22, 56–68. [Google Scholar] [CrossRef] [Scilit]
- Yuksel, T.; Tamayao, M.-A.M.; Hendrickson, C.; Azevedo, I.M.L.; Michalek, J.J. Effect of regional grid mix, driving patterns and climate on the comparative carbon footprint of gasoline and plug-in electric vehicles in the United States. Environ. Res. Lett. 2016, 11, 044007. [Google Scholar] [CrossRef] [Scilit]
- Huo, H.; Zhang, Q.; Liu, F.; He, K. Climate and Environmental Effects of Electric Vehicles versus Compressed Natural Gas Vehicles in China: A Life-Cycle Analysis at Provincial Level. Environ. Sci. Technol. 2013, 47, 1711–1718. [Google Scholar] [CrossRef] [Scilit]
- Yuksel, T.; Michalek, J.J. Effects of Regional Temperature on Electric Vehicle Efficiency, Range, and Emissions in the United States. Environ. Sci. Technol. 2015, 49, 3974–3980. [Google Scholar] [CrossRef] [Scilit]
- Zhu, Y.; Liu, X.; Liu, Y.; Liu, L.; Zheng, H.; Wang, H. Local Climate Might Amplify Economic and Environmental Impacts of Electric Vehicles in China. Environ. Sci. Technol. 2025, 59, 6037–6048. [Google Scholar] [CrossRef] [Scilit]
- Gan, Y.; Lu, Z.; He, X.; Hao, C.; Wang, Y.; Cai, H.; Wang, M.; Elgowainy, A.; Przesmitzki, S.; Bouchard, J. Provincial Greenhouse Gas Emissions of Gasoline and Plug-in Electric Vehicles in China: Comparison from the Consumption-Based Electricity Perspective. Environ. Sci. Technol. 2021, 55, 6944–6956. [Google Scholar] [CrossRef] [Scilit] [PubMed]
- Xue, L.; Liu, D. Toward Carbon Neutrality: A Long-Term Mitigation Strategy for China’s Road Transport Sector; World Resources Institute China: Beijing, China, 2022. [Google Scholar]
- Liu, F.; Shafique, M.; Luo, X. Quantifying delayed climate mitigation benefits in electric and hydrogen fuel cell vehicle deployment for sustainable mobility. Sustain. Prod. Consum. 2024, 49, 398–414. [Google Scholar] [CrossRef] [Scilit]
- Lyu, W.; Hu, Y.; Liu, J.; Chen, K.; Liu, P.; Deng, J.; Zhang, S. Impact of battery electric vehicle usage on air quality in three Chinese first-tier cities. Sci. Rep. 2024, 14, 21. [Google Scholar] [CrossRef] [Scilit]
- Macioszek, E. The Role of Incentive Programs in Promoting the Purchase of Electric Cars—Review of Good Practices and Promoting Methods from the World. In Research Methods in Modern Urban Transportation Systems and Networks; Macioszek, E., Sierpiński, G., Eds.; Springer International Publishing: Cham, Switzerland, 2021; pp. 41–58. [Google Scholar]
- Peng, B.-B.; Fan, Y.; Xu, J.-H. Integrated assessment of energy efficiency technologies and CO2 abatement cost curves in China’s road passenger car sector. Energy Convers. Manag. 2016, 109, 195–212. [Google Scholar] [CrossRef] [Scilit]
- Kouridis, C.; Vlachokostas, C. Towards decarbonizing road transport: Environmental and social benefit of vehicle fleet electrification in urban areas of Greece. Renew. Sustain. Energy Rev. 2022, 153, 111775. [Google Scholar] [CrossRef] [Scilit]
- Kelly, J.A.; Guo, Y.; Clinch, J.P. Who benefits from fleet electrification? quantifying the costs and benefits of transportation electrification strategies from different perspectives. Transp. Res. Interdiscip. Perspect. 2025, 32, 101492. [Google Scholar] [CrossRef] [Scilit]
- Lutsey, N.; Cui, H.; Yu, R. Evaluating Electric Vehicle Costs and Benefits in China in the 2020–2035 Time Frame; White Paper; International Council on Clean Transportation: Washington, DC, USA, 2021. [Google Scholar]
- Delmas, M.A.; Kahn, M.E.; Locke, S.L. The private and social consequences of purchasing an electric vehicle and solar panels: Evidence from California. Res. Econ. 2017, 71, 225–235. [Google Scholar] [CrossRef] [Scilit]
- Morrison, G.; Stevens, J.; Joseck, F. Relative economic competitiveness of light-duty battery electric and fuel cell electric vehicles. Transp. Res. Part C Emerg. Technol. 2018, 87, 183–196. [Google Scholar] [CrossRef] [Scilit]
- Hennessy, E.M.; Scown, C.D.; Azevedo, I.M.L. The health, climate, and equity benefits of freight truck electrification in the United States. Environ. Res. Lett. 2024, 19, 104069. [Google Scholar] [CrossRef] [Scilit]
- Massiani, J. Cost-Benefit Analysis of policies for the development of electric vehicles in Germany: Methods and results. Transp. Policy 2015, 38, 19–26. [Google Scholar] [CrossRef] [Scilit]
- Sofia, D.; Gioiella, F.; Lotrecchiano, N.; Giuliano, A. Cost-benefit analysis to support decarbonization scenario for 2030: A case study in Italy. Energy Policy 2020, 137, 111137. [Google Scholar] [CrossRef] [Scilit]
- Malmgren, I. Quantifying the Societal Benefits of Electric Vehicles. World Electr. Veh. J. 2016, 8, 996–1007. [Google Scholar] [CrossRef] [Scilit]
- Wang, Y.; Wen, Y.; Xu, Y.; Shi, L.; Yang, X. Health Benefits Quantification for New-Energy Vehicles Promotion: A Case Study of Beijing. Int. J. Environ. Res. Public Health 2022, 19, 13876. [Google Scholar] [CrossRef] [Scilit]
- Peng, B.-B.; Xu, J.-H.; Fan, Y. Modeling uncertainty in estimation of carbon dioxide abatement costs of energy-saving technologies for passenger cars in China. Energy Policy 2018, 113, 306–319. [Google Scholar] [CrossRef] [Scilit]
- Gambhir, A.; Tse, L.K.C.; Tong, D.; Martinez-Botas, R. Reducing China’s road transport sector CO2 emissions to 2050: Technologies, costs and decomposition analysis. Appl. Energy 2015, 157, 905–917. [Google Scholar] [CrossRef] [Scilit]
- Fan, Y.; Peng, B.-B.; Xu, J.-H. The effect of technology adoption on CO2 abatement costs under uncertainty in China’s passenger car sector. J. Clean. Prod. 2017, 154, 578–592. [Google Scholar] [CrossRef] [Scilit]
- The People’s Government of Hainan Province. Implementation Plan for Carbon Peaking in Hainan Province; The People’s Government of Hainan Province: Haikou, China, 2022.
- China Electricity Council. China Electric Power Industry Annual Development Report 2021; China Electricity Council: Beijing, China, 2021. [Google Scholar]
- Xue, L.; Jin, Y.; Yu, R.; Liu, Y.; Ren, H. Pathways to Net-Zero Emissions for China’s Road Transport by 2050; World Resouces Institute China: Beijing, China, 2019. [Google Scholar]
- State Grid Energy Research Institute. China Energy & Electricity Outlook 2021; State Grid Energy Research Institute: Beijing, China, 2021.
- National Bureau of Statistics of China. China Statistical Yearbook; China Statistics Press: Beijing, China, 2024.
- Ministry of Public Security of the People’s Republic of China. Motor Vehicle Types—Terms and Definitions: GA 802-2019; Ministry of Public Security of the People’s Republic of China: Beijing, China, 2019.
- Guo, Y.; Cui, B.; Zhang, X. Medium and Long Term Prediction on Vehicle Ownership Based onCombined Model of Gompertz and Logistic. J. Highw. Transp. Res. Dev. 2023, 40, 201–207. [Google Scholar]
- The People’s Government of Beijing Municipality. Interim Provisions of Beijing Municipality on the Regulation of the Total Number of Small-Passenger Vehicles; The People’s Government of Beijing Municipality: Beijing, China, 2010.
- Ministry of Transport of the People’s Republic of China. Statistical Bulletin on the Development of the Transportation Industry; Ministry of Transport of the People’s Republic of China: Beijing, China, 2012–2020.
- Edelenbosch, O.Y.; van Vuuren, D.P.; Bertram, C.; Carrara, S.; Emmerling, J.; Daly, H.; Kitous, A.; McCollum, D.L.; Saadi Failali, N. Transport fuel demand responses to fuel price and income projections: Comparison of integrated assessment models. Transp. Res. Part D Transp. Environ. 2017, 55, 310–321. [Google Scholar] [CrossRef] [Scilit]
- IEA. China Power System Transformation; International Energy Agency: Paris, France, 2019. [Google Scholar]
- Energy Research Institute of the National Development and Reform Commission. China 2050 High Renewable Energy Penetration Scenario and Roadmap Study; Energy Research Institute of the National Development and Reform Commission: Beijing, China, 2015. [Google Scholar]
- Zhang, S. Technical Guidelines for the Compilation of Atmospheric Pollutant Emission Inventories from On-Road Motor Vehicles (Trial Version); Ministry of Ecology and Environment of the People’s Republic of China: Beijing, China, 2015.
- Energy Research Institute of the National Development and Reform Commission. Guidelines for the Preparation of Provincial Greenhouse Gas Emissions Inventories (Trial Version); Energy Research Institute of the National Development and Reform Commission: Beijing, China, 2011. [Google Scholar]
- Ministry of Ecology and Environment of the People’s Republic of China. Announcement on the Implementation of the National VI Emission Standards for Automobiles; Ministry of Ecology and Environment of the People’s Republic of China: Beijing, China, 2023.
- Shanghai Municipal Committee of the Communist Party of China. Implementation Opinions of the People’s Government of Shanghai Municipality on Further Winning the Battle Against Pollution and Moving Towards a New Journey of Building a Beautiful Shanghai; Shanghai Municipal Committee of the Communist Party of China: Shanghai, China, 2022.
- An, F.; Kang, L.; Qin, L.; Mao, S.; Wang, W.; Dror, M.B. A Study on China’s Timetable for Phasing-Out Traditional ICE-Vehicles; The Innovation Center for Energy and Transportation: Beijing, China, 2019. [Google Scholar]
- Cai, H.; Xie, S. Determination of Emission Factors from Motor Vehicles under DifferentEmission Standards in China. Acta Sci. Nat. Univ. Pekin. 2010, 46, 319–326. [Google Scholar] [CrossRef]
- Mao, S.; Hussein, B.; Pierre-Louis, R.; Zhou, Y.; Felipe, R. Total Cost of Ownership Comparison of Heavy-Duty Freight Trucks in China: Battery Electric, Fuel Cell, and Diesel Trucks; International Council on Clean Transportation: Washington, DC, USA, 2021. [Google Scholar]
- TF Securities. Profitability Analysis of Charging-Station Operating Enterprises; TF Securities: Hong Kong, China, 2019. [Google Scholar]
- Power.in-en.com. Provincial Electricity Transmission, Distribution, and Retail Tariffs Summary, 2021. Available online: https://power.in-en.com/html/power-2380057.shtml (accessed on 5 February 2021).
- Zuo, Q.; Li, C. Electric Power Industry Special Report: Assessment of Electricity Price Trends; Cinda Securities: Beijing, China, 2022. [Google Scholar]
- Wang, T.; Teng, F.; Deng, X.; Xie, J. Climate module disparities explain inconsistent estimates of the social cost of carbon in integrated assessment models. One Earth 2022, 5, 767–778. [Google Scholar] [CrossRef] [Scilit]
- State Administration for Market Regulation; Ministry of Ecology and Environment. Technical Methods for Making Local Emission Standards of Air Pollutants; Ministry of Ecology and Environment: Beijing, China, 1992.
- Wu, Y. The Impact of Transport Policies on Energy, Air Pollutionand Public Health in Beijing, China. Master’s Thesis, Beijing Institute of Technologe, Beijing, China, 2016. [Google Scholar]
- Liu, T. Cost-Benefit Analysis of the NOx Emission Control of Power Industry in China. Master’s Thesis, Tsinghua University, Beijing, China, 2012. [Google Scholar]
- Hoffmann, S.; Krupnick, A.; Qin, P. Building a Set of Internationally Comparable Value of Statistical Life Studies: Estimates of Chinese Willingness to Pay to Reduce Mortality Risk. J. Benefit-Cost Anal. 2017, 8, 251–289. [Google Scholar] [CrossRef] [Scilit]
- Ministry of Ecology and Environment of the People’s Republic of China; National Bureau of Statistics of China. Power-Sector CO2 Emission Factor in 2021; Ministry of Ecology and Environment of the People’s Republic of China: Beijing, China, 2024.
- Ministry of Industry and Information Technology of the People’s Republic of China. Passenger Vehicle Fuel Consumption Limits (Draft for Public Comment); Ministry of Industry and Information Technology of the People’s Republic of China: Beijing, China, 2024.
- Tong, J.; Buda, S.; Cheng, J.; Yanjun, W.; Jinlong, H.; Huanhuan, G.; Yuming, Y.; Guojie, W.; Yong, L. National and Provincial Population and Economy Projection Databases Under Shared Socioeconomic Pathways(SSP1-5)_v2; Science Data Bank: Beijing, China, 2024. [Google Scholar] [CrossRef]
- Gan, Y.; Lu, Z.; Cai, H.; Wang, M.; He, X.; Przesmitzki, S. Future private car stock in China: Current growth pattern and effects of car sales restriction. Mitig. Adapt. Strateg. Glob. Change 2020, 25, 289–306. [Google Scholar] [CrossRef] [Scilit]
- Al-Wreikat, Y.; Serrano, C.; Sodré, J.R. Effects of ambient temperature and trip characteristics on the energy consumption of an electric vehicle. Energy 2022, 238, 122028. [Google Scholar] [CrossRef] [Scilit]
- Taggart, J. Ambient temperature impacts on real-world electric vehicle efficiency & range. In Proceedings of the 2017 IEEE Transportation Electrification Conference and Expo (ITEC), Harbin, China, 22–24 June 2017; pp. 186–190. [Google Scholar]
- Wang, Z.; Mae, M.; Nishimura, S.; Matsuhashi, R. Vehicular Fuel Consumption and CO2 Emission Estimation Model Integrating Novel Driving Behavior Data Using Machine Learning. Energies 2024, 17, 1410. [Google Scholar] [CrossRef] [Scilit]
- Olivetti, E.A.; Ceder, G.; Gaustad, G.G.; Fu, X. Lithium-Ion Battery Supply Chain Considerations: Analysis of Potential Bottlenecks in Critical Metals. Joule 2017, 1, 229–243. [Google Scholar] [CrossRef] [Scilit]
- Melchor-Martínez, E.M.; Macias-Garbett, R.; Malacara-Becerra, A.; Iqbal, H.M.N.; Sosa-Hernández, J.E.; Parra-Saldívar, R. Environmental impact of emerging contaminants from battery waste: A mini review. Case Stud. Chem. Environ. Eng. 2021, 3, 100104. [Google Scholar] [CrossRef] [Scilit]
- Mrozik, W.; Rajaeifar, M.A.; Heidrich, O.; Christensen, P. Environmental impacts, pollution sources and pathways of spent lithium-ion batteries. Energy Environ. Sci. 2021, 14, 6099–6121. [Google Scholar] [CrossRef] [Scilit]
- Mohd Tohir, M.Z.; Martín-Gómez, C. Electric vehicle fire risk assessment framework using Fault Tree Analysis. Open Res. Eur. 2023, 3, 178. [Google Scholar] [CrossRef] [Scilit] [PubMed]









Disclaimer/Publisher’s Note: The statements, opinions and data contained in all publications are solely those of the individual author(s) and contributor(s) and not of MDPI and/or the editor(s). MDPI and/or the editor(s) disclaim responsibility for any injury to people or property resulting from any ideas, methods, instructions or products referred to in the content. |
© 2025 by the authors. Licensee MDPI, Basel, Switzerland. This article is an open access article distributed under the terms and conditions of the Creative Commons Attribution (CC BY) license (https://creativecommons.org/licenses/by/4.0/).