


Abstract
A core challenge in urban green space (UGS) management lies in precisely identifying public demand heterogeneity toward landscape elements. Grounded in Expectation Confirmation Theory (ECT), this study aims to systematically identify the key landscape elements shaping public satisfaction and elucidate their driving mechanisms to inform UGS planning. Using 107 UGS in central Beijing as case studies, this study first retrieved 712,969 social media data (SMD) from multiple online platforms. A landscape element lexicon derived from these data was then integrated with the Bidirectional Encoder Representations from Transformers (BERT) model to assess public attention and satisfaction toward the natural, cultural, and artificial attributes of UGS, achieving an accuracy of 84.4%. Finally, spatial variations and the effects of different landscape elements on public satisfaction were analyzed using GIS-based visualization, K-means clustering, and multiple linear regression. Key findings reveal the following: (1) satisfaction follows a “core-periphery” gradient, peaking in heritage-rich City Wall Parks (>0.63) and plunging in green belts due to imbalanced element configurations (~0.04); (2) naturally dominant green spaces contribute most to satisfaction, while a nonlinear relationship exists between element dominance and satisfaction: strong features enhance perception, balanced patterns mask issues; (3) regression analysis confirms natural elements (vegetation β = 0.280, water β = 0.173) as core satisfaction drivers, whereas artificial facilities (e.g., service infrastructure β = 0.112, p > 0.05) exhibit a high frequency but low satisfaction paradox. These insights culminate in a practical implementation framework for policymakers: first, establish a data-driven monitoring system to flag high-frequency, low-satisfaction facilities; second, prioritize budgeting for enhancing natural elements and contextualizing cultural elements; and finally, implement site-specific optimization based on primary UGS functions to counteract green space homogenization in high-density cities.
1. Introduction
1.1. The Multidimensional Value and Perceptual Challenges of Urban Green Spaces
Urban green spaces (UGS) are vital components of urban ecosystems, enhancing ecological stability, public health, and social well-being [1,2,3]. As primary interfaces between people and nature, they provide ecological, cultural, and recreational services that foster sustainable lifestyles and advance the UN Sustainable Development Goals (SDGs) [4,5,6,7,8]. However, in high-density cities, UGS often suffer from a “quantity–quality imbalance”: while greening standards are met, functional and experiential diversity remains limited [9,10,11]. Understanding how residents perceive and evaluate UGS, and identifying the landscape elements that most effectively enhance satisfaction, are thus essential for improving urban livability and equity [12].
1.2. Conceptualization of Satisfaction
Satisfaction, as an indicator of both UGS usage and public feedback, has become a central topic in current research [13]. Satisfaction is defined as an individual’s overall evaluative judgment formed by comparing the expected and perceived performance of UGS [14,15]. Consistent with previous studies, it encompasses three interrelated dimensions: emotional satisfaction, reflecting affective responses such as pleasure or relaxation; functional satisfaction, indicating the extent to which facilities, accessibility, and services meet user needs; and esthetic satisfaction, referring to the visual and sensory appreciation of landscape quality [13,16]. As an integrated indicator of environmental quality and social well-being, UGS satisfaction captures both tangible experiences (e.g., facility performance) and intangible perceptions (e.g., atmosphere and beauty), serving as a core measure for assessing sustainable landscape performance [17,18,19,20].
1.3. Research Gaps and Theoretical Innovation
Despite growing research, two major gaps persist. First, traditional satisfaction assessments depend on surveys or expert evaluations, which are limited in scope, temporal coverage, and representativeness [18,21,22]. Second, there is limited understanding of how different dominant elements (i.e., the most influential landscape components within a UGS) and balance patterns (i.e., the equilibrium among natural, cultural, and artificial features) affect satisfaction in a multidimensional way.
To address these challenges, this study integrates Expectation Confirmation Theory (ECT) with data-driven perception analysis. ECT provides a psychological framework to explain how users’ pre-visit expectations interact with post-visit perceptions, influencing their satisfaction [23,24,25,26]. Applying ECT to UGS enables us to identify mismatches between expectations and perceived performance—such as when the expected vegetation density or amenity quality fails to meet user anticipation—and to interpret their effects on satisfaction.
1.4. Data and Methodological Innovation
With the rise of social media, user-generated content offers new opportunities for measuring UGS satisfaction at scale [18,27,28,29,30,31]. Social media data (SMD) reflect authentic, first-person experiences, providing a cost-efficient, real-time supplement to traditional surveys [28]. However, SMD are highly unstructured, requiring advanced computational techniques.
To overcome this, this research employs deep learning—specifically a fine-tuned Bidirectional Encoder Representations from Transformers (BERT) model—to extract emotions, attitudes, and perceptions from UGS-related SMD. Combined with the ECT framework, this approach enables quantitative assessment of expectation–satisfaction alignment. Furthermore, spatial analysis and regression are used to identify key satisfaction drivers and spatial patterns of public perception, thus bridging perceptual data and practical planning.
1.5. Scientific Contributions and Global Relevance
This study integrates ECT with a BERT-based deep learning framework, transforming public satisfaction from a static indicator into a process-oriented diagnostic tool for aligning public expectations with actual experience. Building upon the Beijing case, it further proposes a globally replicable “Data–Model–Decision” pathway that enables human-centered, cost-effective, and sustainable green space planning across diverse urban contexts.
Accordingly, this research contributes to UGS research in three main ways. First, it introduces ECT into UGS research, establishing a behavioral framework to explain how the consistency or discrepancy between public expectations and perceived landscape performance influences overall satisfaction. Second, it develops an integrated ECT–BERT analytical model that bridges social media–based perception analysis with behavioral theory, enabling fine-grained assessment of public satisfaction across natural, cultural, and artificial landscape dimensions. Third, by focusing on Beijing—a rapidly urbanizing megacity—this study offers globally relevant insights for high-density cities seeking human-centered, data-informed green space governance [32,33,34,35].
Accordingly, this research aims to:
Systematically identify the key natural, cultural, and artificial elements that shape public satisfaction with UGS through large-scale social media data analysis;
Model the expectation–perception–satisfaction mechanism within the ECT framework using deep learning and spatial analytical approaches;
Provide practical implications for urban managers to improve UGS design and planning.
2. Theoretical Foundations and Research Hypotheses
2.1. UGS Satisfaction Study Based on SMD and BERT Deep Learning Models
Public satisfaction with UGS is commonly evaluated through three approaches: surveys, wearable sensing, and SMD analytics [36,37]. Traditional surveys—such as interviews and questionnaires—are still prevalent but remain time-consuming, resource-intensive, and vulnerable to respondent bias [38,39]. Physiological sensing techniques, including facial recognition and smart wristbands, provide objective emotional or behavioral data [40,41], yet their scope is limited to specific user groups or park types, reducing generalizability and cross-site comparability.
SMD provide large-scale, time-sensitive, and spatially explicit information on public perceptions of UGS [42,43]. The number of geo-tagged posts approximates visitation intensity, while sentiment polarity derived from comment texts reflects satisfaction levels. By applying Natural Language Processing (NLP) techniques, subjective opinions can be transformed into quantifiable sentiment indicators, enabling fine-grained, spatially explicit evaluation of UGS perception [44,45].
Traditional NLP approaches (e.g., word-frequency statistics or keyword matching) identify perception themes but often overlook contextual meaning [22,46]. Advanced models based on neural networks overcome these limits by extracting semantics, entities, and emotions from text [47].
Sentiment analysis aims to identify the emotional polarity embedded in text [48]. Its accuracy has improved substantially with large training corpora, powerful algorithms, and open-source NLP platforms (e.g., Google, Baidu). These advances have enabled urban researchers to quantify subjective perception data from user reviews into measurable sentiment indicators [27,31,49]. Among deep learning models, Long Short-Term Memory (LSTM) and Text Convolutional Neural Networks (TextCNN) are frequently employed. TextCNN is effective for local feature extraction, while LSTM captures long-range contextual dependencies [50].
Recently, Transformer-based architectures such as BERT have redefined NLP performance through superior contextual learning and bidirectional representation [51]. Empirical studies show that BERT consistently outperforms LSTM and TextCNN in sentiment analysis tasks due to its ability to capture semantic nuances and cross-sentence dependencies [52]. Considering these advantages, this study adopts BERT as the pre-trained model for sentiment classification of SMD.
This study employs a BERT-based sentiment analysis framework to quantify public satisfaction and reveal how specific landscape elements shape UGS experiences, offering data-driven guidance for adaptive urban green-space planning.
2.2. The Expectation Confirmation Theory
ECT, first proposed by Oliver [53], primarily explains user satisfaction and behavioral intentions toward products or services. The core premise of ECT posits that user satisfaction stems from the comparison between pre-consumption expectations and post-experience perceptions. Specifically:
Expectation Formation: Users develop anticipations based on prior information;
Experience Evaluation: Satisfaction is determined by the congruence between actual perceptions and initial expectations;
Behavioral Feedback: High satisfaction triggers positive behaviors (e.g., repurchase or revisit), while low satisfaction leads to negative responses (e.g., abandonment or complaints).
Figure 1 illustrates ECT’s structural relationships, demonstrating how satisfaction arises from the cognitive contrast between expectations and experiences.
Figure 1.
The Expectation Confirmation Theory. Note: This figure is adapted from a study by Oliver [53].
The ECT has been widely applied across various fields, including consumer behavior, tourism studies, and information systems. For instance, Fu et al. [54] utilized ECT to analyze passengers’ loyalty to public transportation and examined the influence of perceived service quality on satisfaction. Chiu et al. [55] applied ECT to explore tourists’ satisfaction with Taiwanese bed and breakfast inns, revealing that the gap between expectations and actual experiences plays a critical role in shaping satisfaction. Similarly, Tang et al. [56] employed ECT to identify key factors influencing tourists’ willingness to revisit traditional villages, uncovering the mediating effects that influence overall tourist satisfaction.
The proposed relationship between UGS landscape elements and public satisfaction exhibits inherent theoretical alignment with ECT. Visitors develop specific expectations about UGS features (e.g., vegetation density, recreational facilities), which undergo cognitive appraisal against actual experiences to generate satisfaction evaluations that subsequently shape affective attitudes. As ECT effectively explains satisfaction-expectation discrepancies, it serves as the foundational theoretical framework for this study.
Although alternative models such as the Expectation Disconfirmation Model (EDM), the Technology Acceptance Model (TAM), the Theory of Planned Behavior (TPB), and the SERVQUAL model have been widely used to examine satisfaction formation, these frameworks primarily focus on behavioral intentions or service quality dimensions rather than on the cognitive comparison process between expectations and experiences. In contrast, ECT offers a more direct and cognitively grounded explanation of how users evaluate perceived performance relative to prior expectations. Moreover, ECT has strong cross-domain adaptability and theoretical flexibility, allowing the inclusion of contextual moderators—such as landscape elements in this study—to capture how environmental attributes influence the expectation–satisfaction pathway. Therefore, ECT is adopted as the most appropriate and theoretically coherent framework for investigating the perceptual mechanisms underlying public satisfaction with urban green spaces.
2.3. Research Hypotheses
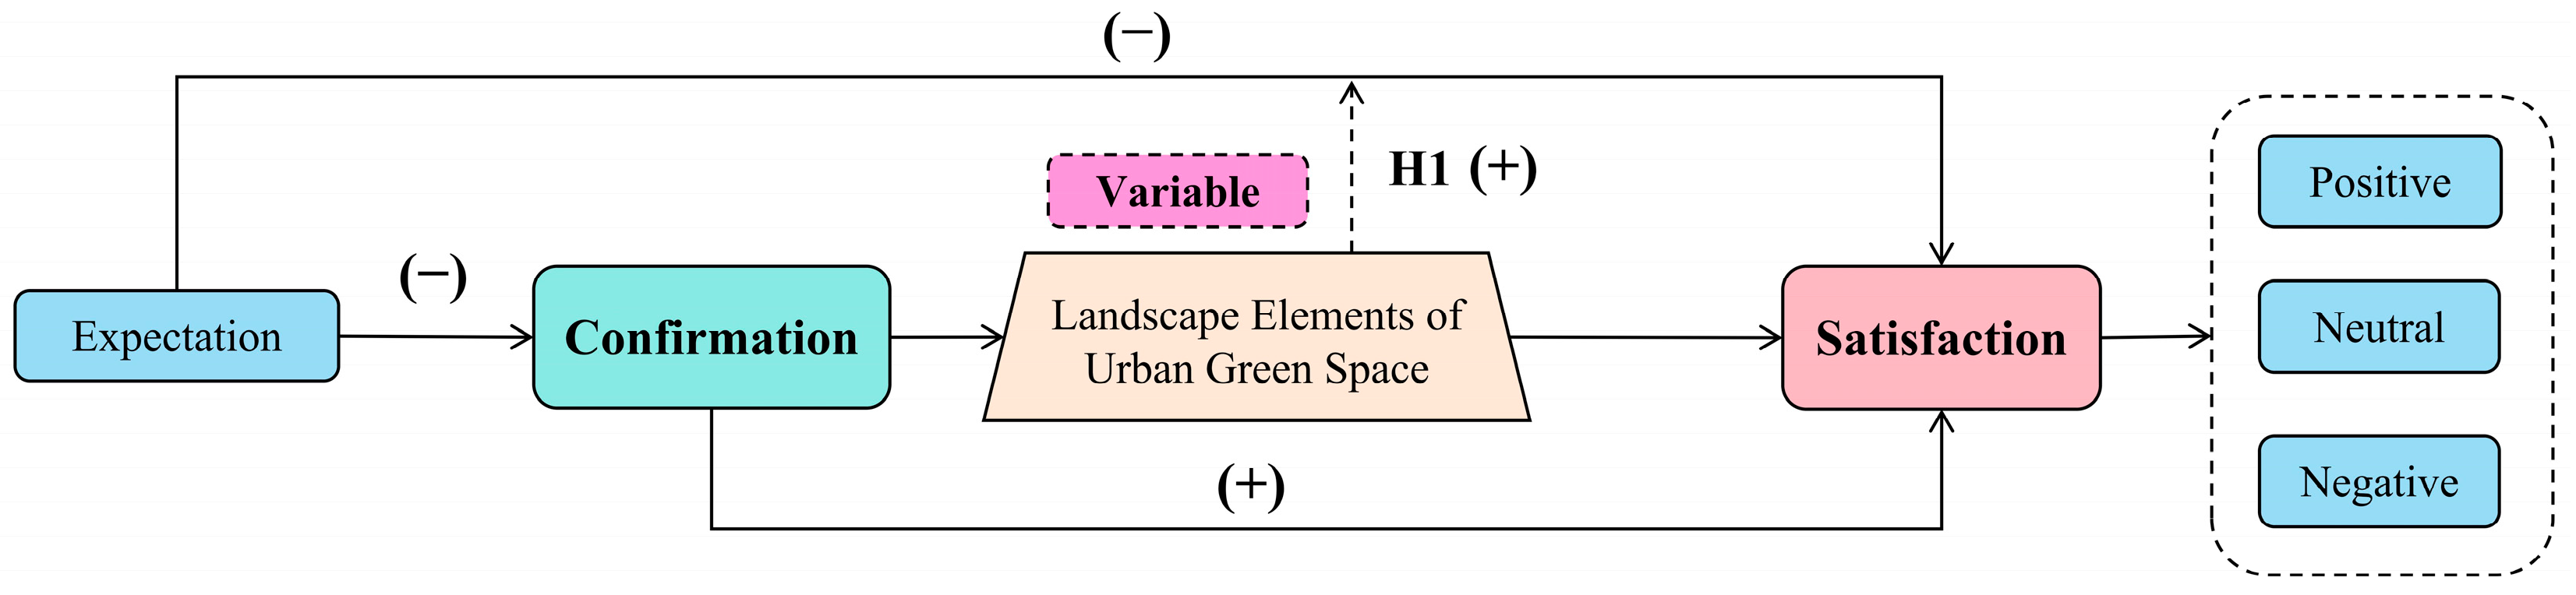
Based on the ECT, user satisfaction results from the cognitive comparison between pre-use expectations and post-use experiences. Prior studies have confirmed two fundamental relationships: higher expectations increase the likelihood of disconfirmation, exerting a negative effect on confirmation [57,58], while confirmation positively influences satisfaction by reinforcing the congruence between anticipated and actual experiences [59,60]. These findings underscore the pivotal role of expectation management and confirmation in shaping satisfaction outcomes.
Building on these established relationships, this study extends the ECT framework to urban green spaces (UGS) by highlighting the moderating role of landscape elements. Landscape composition and quality not only reflect environmental performance but also embody public perceptions of spatial balance and esthetic harmony [61]. High-quality or well-balanced landscape configurations can mitigate the adverse impact of unmet expectations and amplify the positive translation of confirmation into satisfaction.
Accordingly, this study proposes the following hypothesis (Figure 2):
H1:
Landscape elements of UGS moderate the relationship between expectation and satisfaction such that high-quality or well-balanced elements strengthen the positive impact of confirmation on satisfaction.
This refined model illustrates the dynamic interplay among cognitive evaluation, environmental quality, and perceptual experience, providing a theoretical basis for understanding how green-space attributes shape public satisfaction in high-density urban contexts.
Figure 2.
Conceptual framework and research hypothesis based on the ECT.
2.4. Research Framework
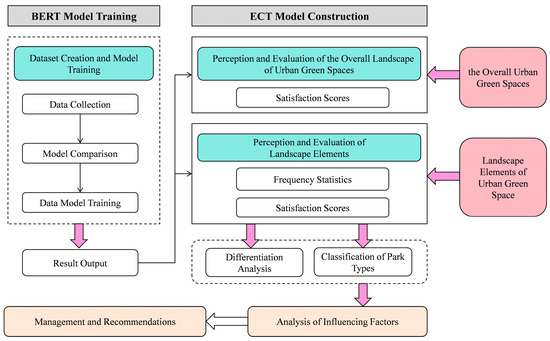
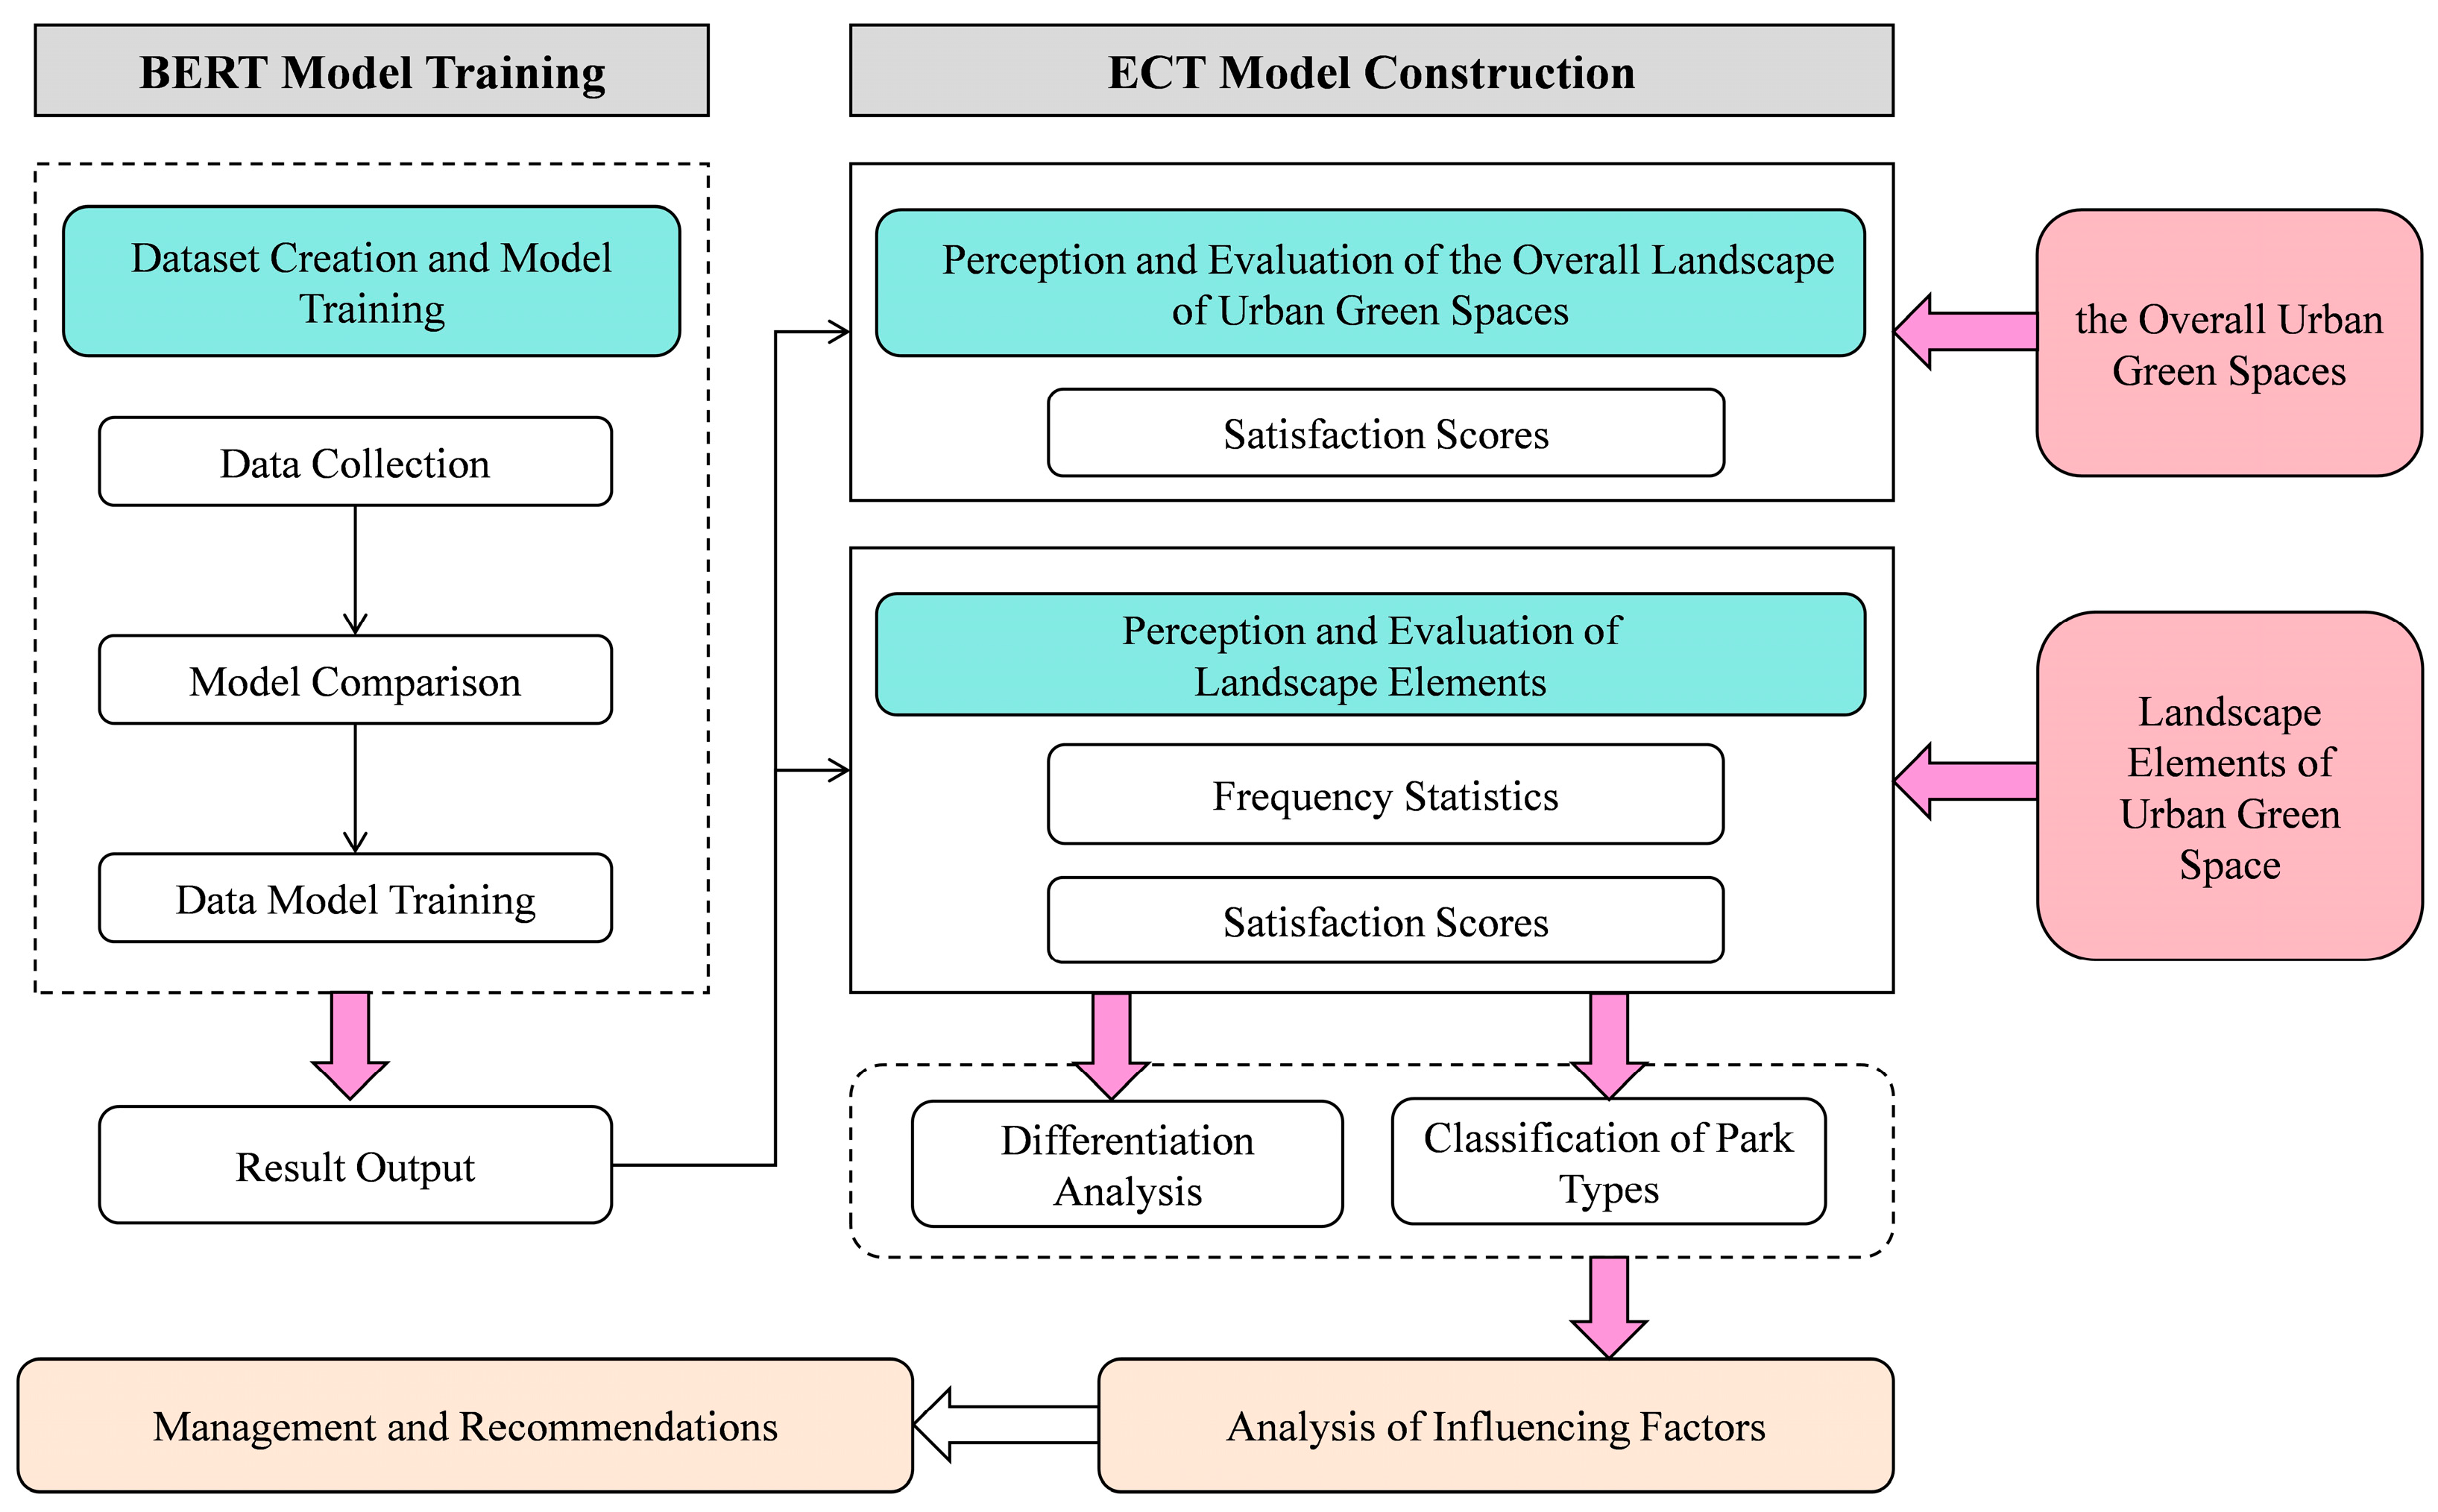
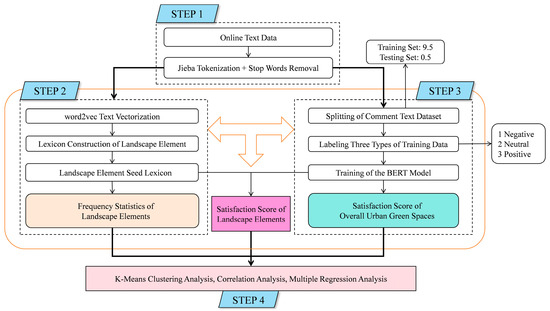
The research framework is illustrated in Figure 3. A total of 712,969 comments were collected from popular Chinese social media platforms, among which 7000 were selected as the training dataset for developing the BERT landscape perception model. This model was subsequently applied to evaluate and interpret landscape perceptions reflected in all comments. In the evaluation phase, the model quantified perception scores for overall UGS and their landscape elements. A visual score map, generated using ArcMap, was utilized to identify parks with low satisfaction scores on a macro scale. Additionally, through park type differentiation and landscape element analysis, we accurately identified specific landscape elements contributing to score variations and provided strategic recommendations for micro-scale optimization.
Figure 3.
Research framework integrating the BERT model training and ECT model construction.
3. Materials and Methodology
3.1. Research Area
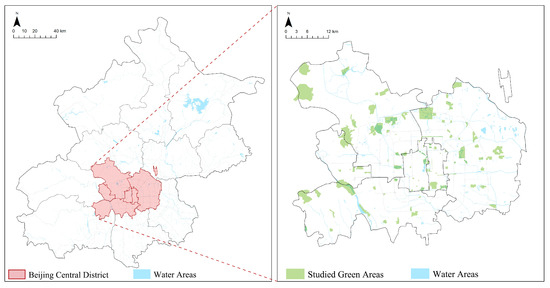
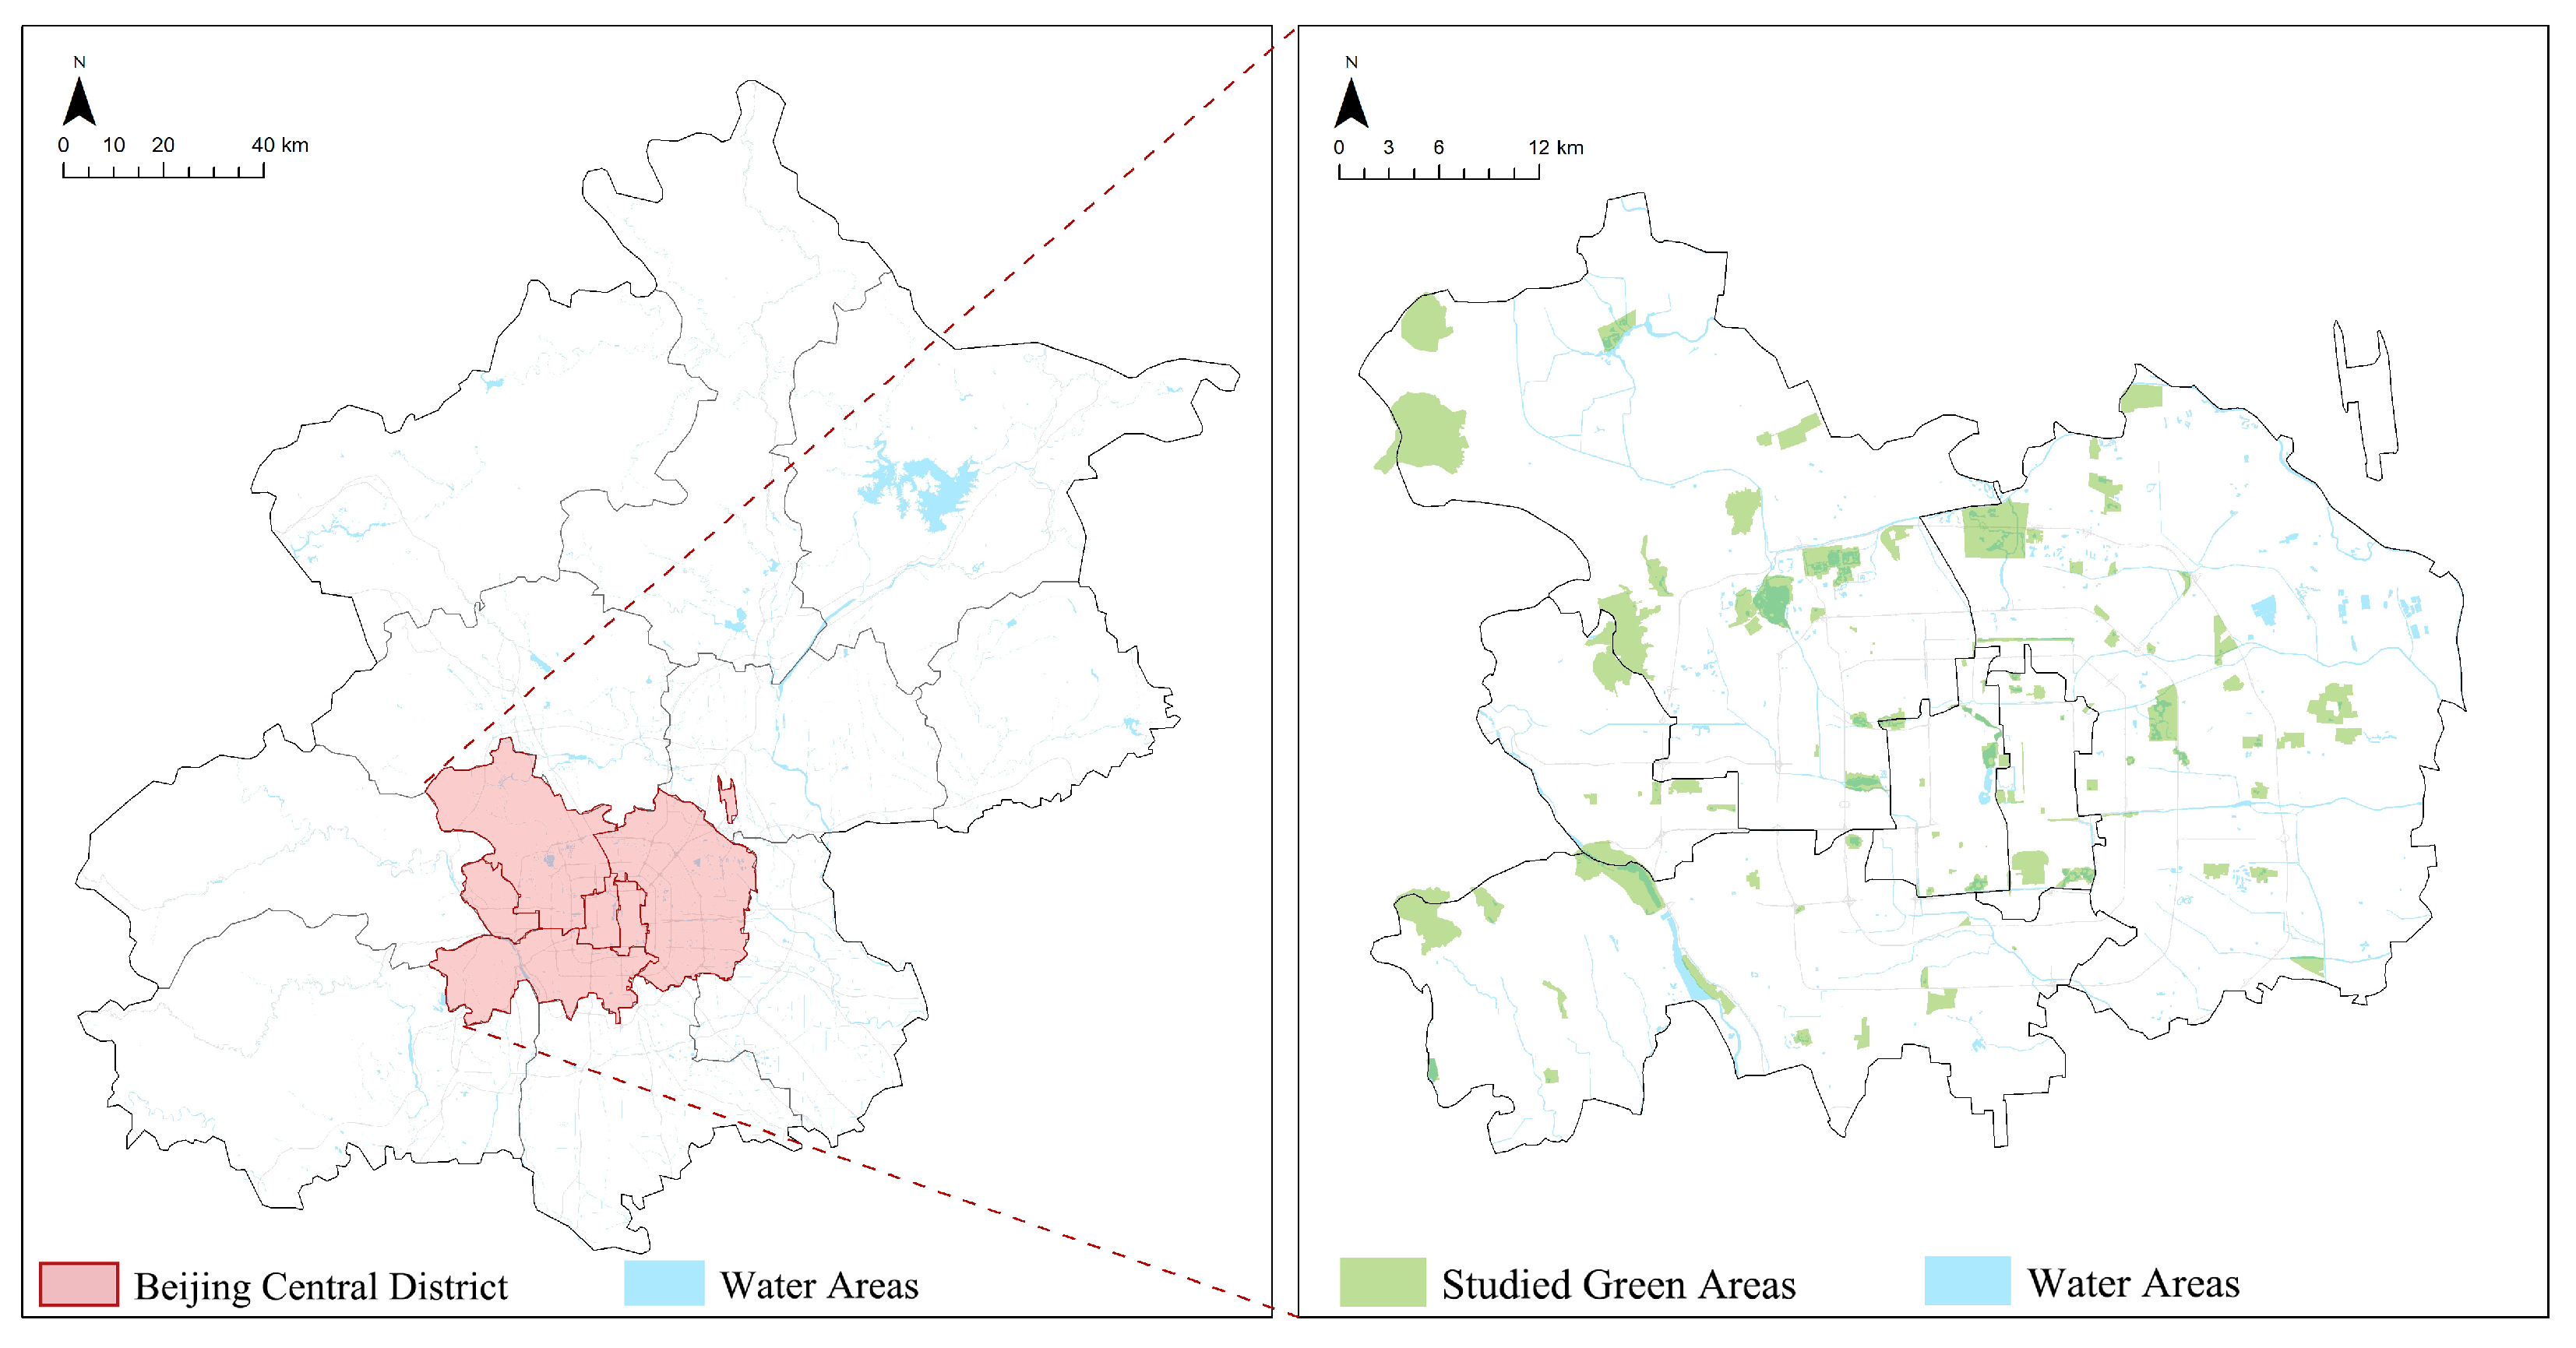
We focus on the six districts of Beijing, China (Figure 4). By 2030, the global urbanization rate is expected to exceed 70% [62], making UGS construction in high-density cities a global challenge. Many cities around the world are enhancing residents’ quality of life and promoting urban sustainability through meticulous planning and design of regional green spaces, such as Stockholm, Vienna, Singapore, and Washington D.C. These examples vividly demonstrate the pivotal role of regional green spaces in advancing global urban sustainability. When examining the urban greening characteristics of Beijing, it becomes evident that the city exhibits notable typicality and representativeness in creating ecological barriers and providing leisure spaces, especially with its “First Green Belt” and the scattered green areas within the central urban districts. These green spaces not only offer citizens places for relaxation and entertainment but also play a significant role as ecological barriers in curbing uncontrolled urban expansion, yielding substantial ecological and social benefits.
Figure 4.
Research scope.
Furthermore, Beijing’s efforts to enhance the quality of life for its residents and strengthen urban sustainability through careful planning and design of green spaces are particularly notable. Specifically, the city’s six central urban districts hold a strategically advantageous position. These areas are not only centrally located geographically but also receive priority in terms of resource allocation and policy support, leading to remarkable achievements in urban greening and ecological construction. Beijing’s rapid urbanization has created a high-density structure and challenges like resource scarcity. The Beijing Urban Master Plan (2016–2035) proposes relieving non-capital functions, aiming to reduce the population in six districts by 15% by 2020 and stabilize it at 10.85 million by 2035 [63]. As part of this process, the green space coverage has increased, expected to reach 91% by 2024 [64]. The Beijing Landscape and Greening Special Plan (2018–2035) plans to increase per capita park area and green space service radius coverage [65]. These measures aim to enhance urban repair, improve urban quality, and increase residents’ sense of gain. Beijing is working hard to become a model garden city and a globally renowned cultural city while promoting the construction of a world-class harmonious and livable city. Its experience in UGS renewal, especially in identifying the public’s differentiated demands for landscape elements, can offer valuable insights for cities worldwide. These developments make the six districts of Beijing an ideal model for UGS research.
3.2. Data Collection and Processing
To minimize potential demographic bias inherent in social media data (SMD) and to enhance data representativeness, this study collected user-generated content from multiple platforms, including Ctrip, Mafengwo, Dianping, and Weibo, which serve different functions and user communities. These platforms have become vital data sources for analyzing urban environments, with users primarily concentrated in first-tier cities such as Beijing. Their geographical distribution advantage also makes them suitable for studying urban green space (UGS) perception in Beijing. Based on the official Beijing Park List, we retrieved park-related reviews within the city’s central urban area from Dianping, complemented by tourism and social interaction data from Ctrip, Mafengwo, and Weibo to expand data volume and diversity. Considering park type, review quantity, and spatial scale, a total of 107 UGS with more than 500 reviews each between 2006 and 2024 were selected. As of May 2024, 712,969 user reviews were collected. All data underwent rigorous cleaning procedures, including duplicate removal, advertisement filtering, and content relevance screening. This multi-platform, large-scale sampling approach improves representativeness and reduces the potential overrepresentation of younger, highly educated, and digitally active users, providing a robust foundation for subsequent sentiment and perception analyses (Figure 2).
We deduplicated the data and removed blank comments. Regular expressions were used to remove web links and emojis without emotional expression, while emojis that convey emotions were standardized and added to the emotional dictionary for later use. Based on semantic segmentation, text was further processed using word segmentation by the Python-based(3.12.3) Jieba library (e.g., I/very/like/this/park) to prepare for subsequent text vectorization and machine learning.
To further improve the accuracy of word segmentation, commonly used Chinese sentiment dictionaries were adopted, including the Hownet sentiment dictionary from CNKI [66,67], NTUSD from National Taiwan University [68], the Dalian University of Technology sentiment dictionary [69], and the positive and negative connotation dictionary from Tsinghua University [70]. After merging and deduplication, a new sentiment dictionary was formed. Additionally, popular internet slang and some slang expressions containing emotional connotations were added to the sentiment dictionary. The compiled sentiment dictionary was then loaded into Jieba’s custom dictionary for word segmentation. After segmentation, a deduplicated collection of stop words was created using stop word lists from Harbin Institute of Technology, Baidu, and the Machine Intelligence Laboratory of Sichuan University, to remove words from the sentiment dictionary, as well as transition words, negations, and degree adverbs. This prepared the data for vectorization and machine learning.
3.3. Dictionary of Landscape Elements
Landscape elements dictionary refers to the related seed word library selected from the comments by classifying the specified landscape elements. Landscape elements refer to the individual components of a landscape, such as terrain, climate, water, organisms, and soil, as well as social and cultural factors [71]. Urban parks, as public open spaces, have three primary attributes: material objects, functional activities, and place significance [72]. Place significance encompasses symbolic meanings, personal emotions, attitudes, and values. Urban parks also offer opportunities for outdoor recreation, providing vital recreational services [73]. Zhu [74] divided landscape elements into natural elements, cultural elements, and supporting facilities, focusing only on the objective material aspects of UGS. Fu et al. [75] studied the emotional characteristics and influencing factors of urban park users, categorized the factors influencing user perception into landscape elements such as park facilities, park design and management, as well as landscape services like natural experiences, spiritual value, esthetic appreciation, recreation, and air quality regulation. Li [76] in his research on public environmental perception of UGS, divided preferences into two aspects: environmental elements and recreational services. He considered both natural and artificial elements while also incorporating the intangible benefits people derive from mental enrichment, cognitive development, reflection, recreation, and esthetic experiences. The classification of landscape elements has thus transitioned from focusing solely on material aspects to integrating objective material, functional activities, and the significance of place.
In summary, given the multifaceted nature of landscape elements, we divide them into three categories: natural elements, artificial elements, and socio-cultural elements. Among these, natural and artificial elements represent objective materials, while socio-cultural elements encompass functional activities and the significance of place. For the selection of landscape element indicators, the study refers to the indicator structures proposed by Buchel and Frantzeskaki [77], as well as Swapan et al. [78], while also taking into account the classification standards from the Chinese Urban Park Design Specifications (GB51192-2016) [79] and the UGS Design Specifications (GB 50420—2007) [80], alongside the specific environments of urban park green spaces. In total, this classification summarizes 3 major categories and 15 subcategories of park landscape elements. To facilitate subsequent data analysis, recreational facilities and activity types are directly displayed as subcategories. The classification of the landscape element lexicon is shown in Table 1.
Table 1.
Classification of Landscape Elements Dictionary.
3.4. Landscape Perception Model
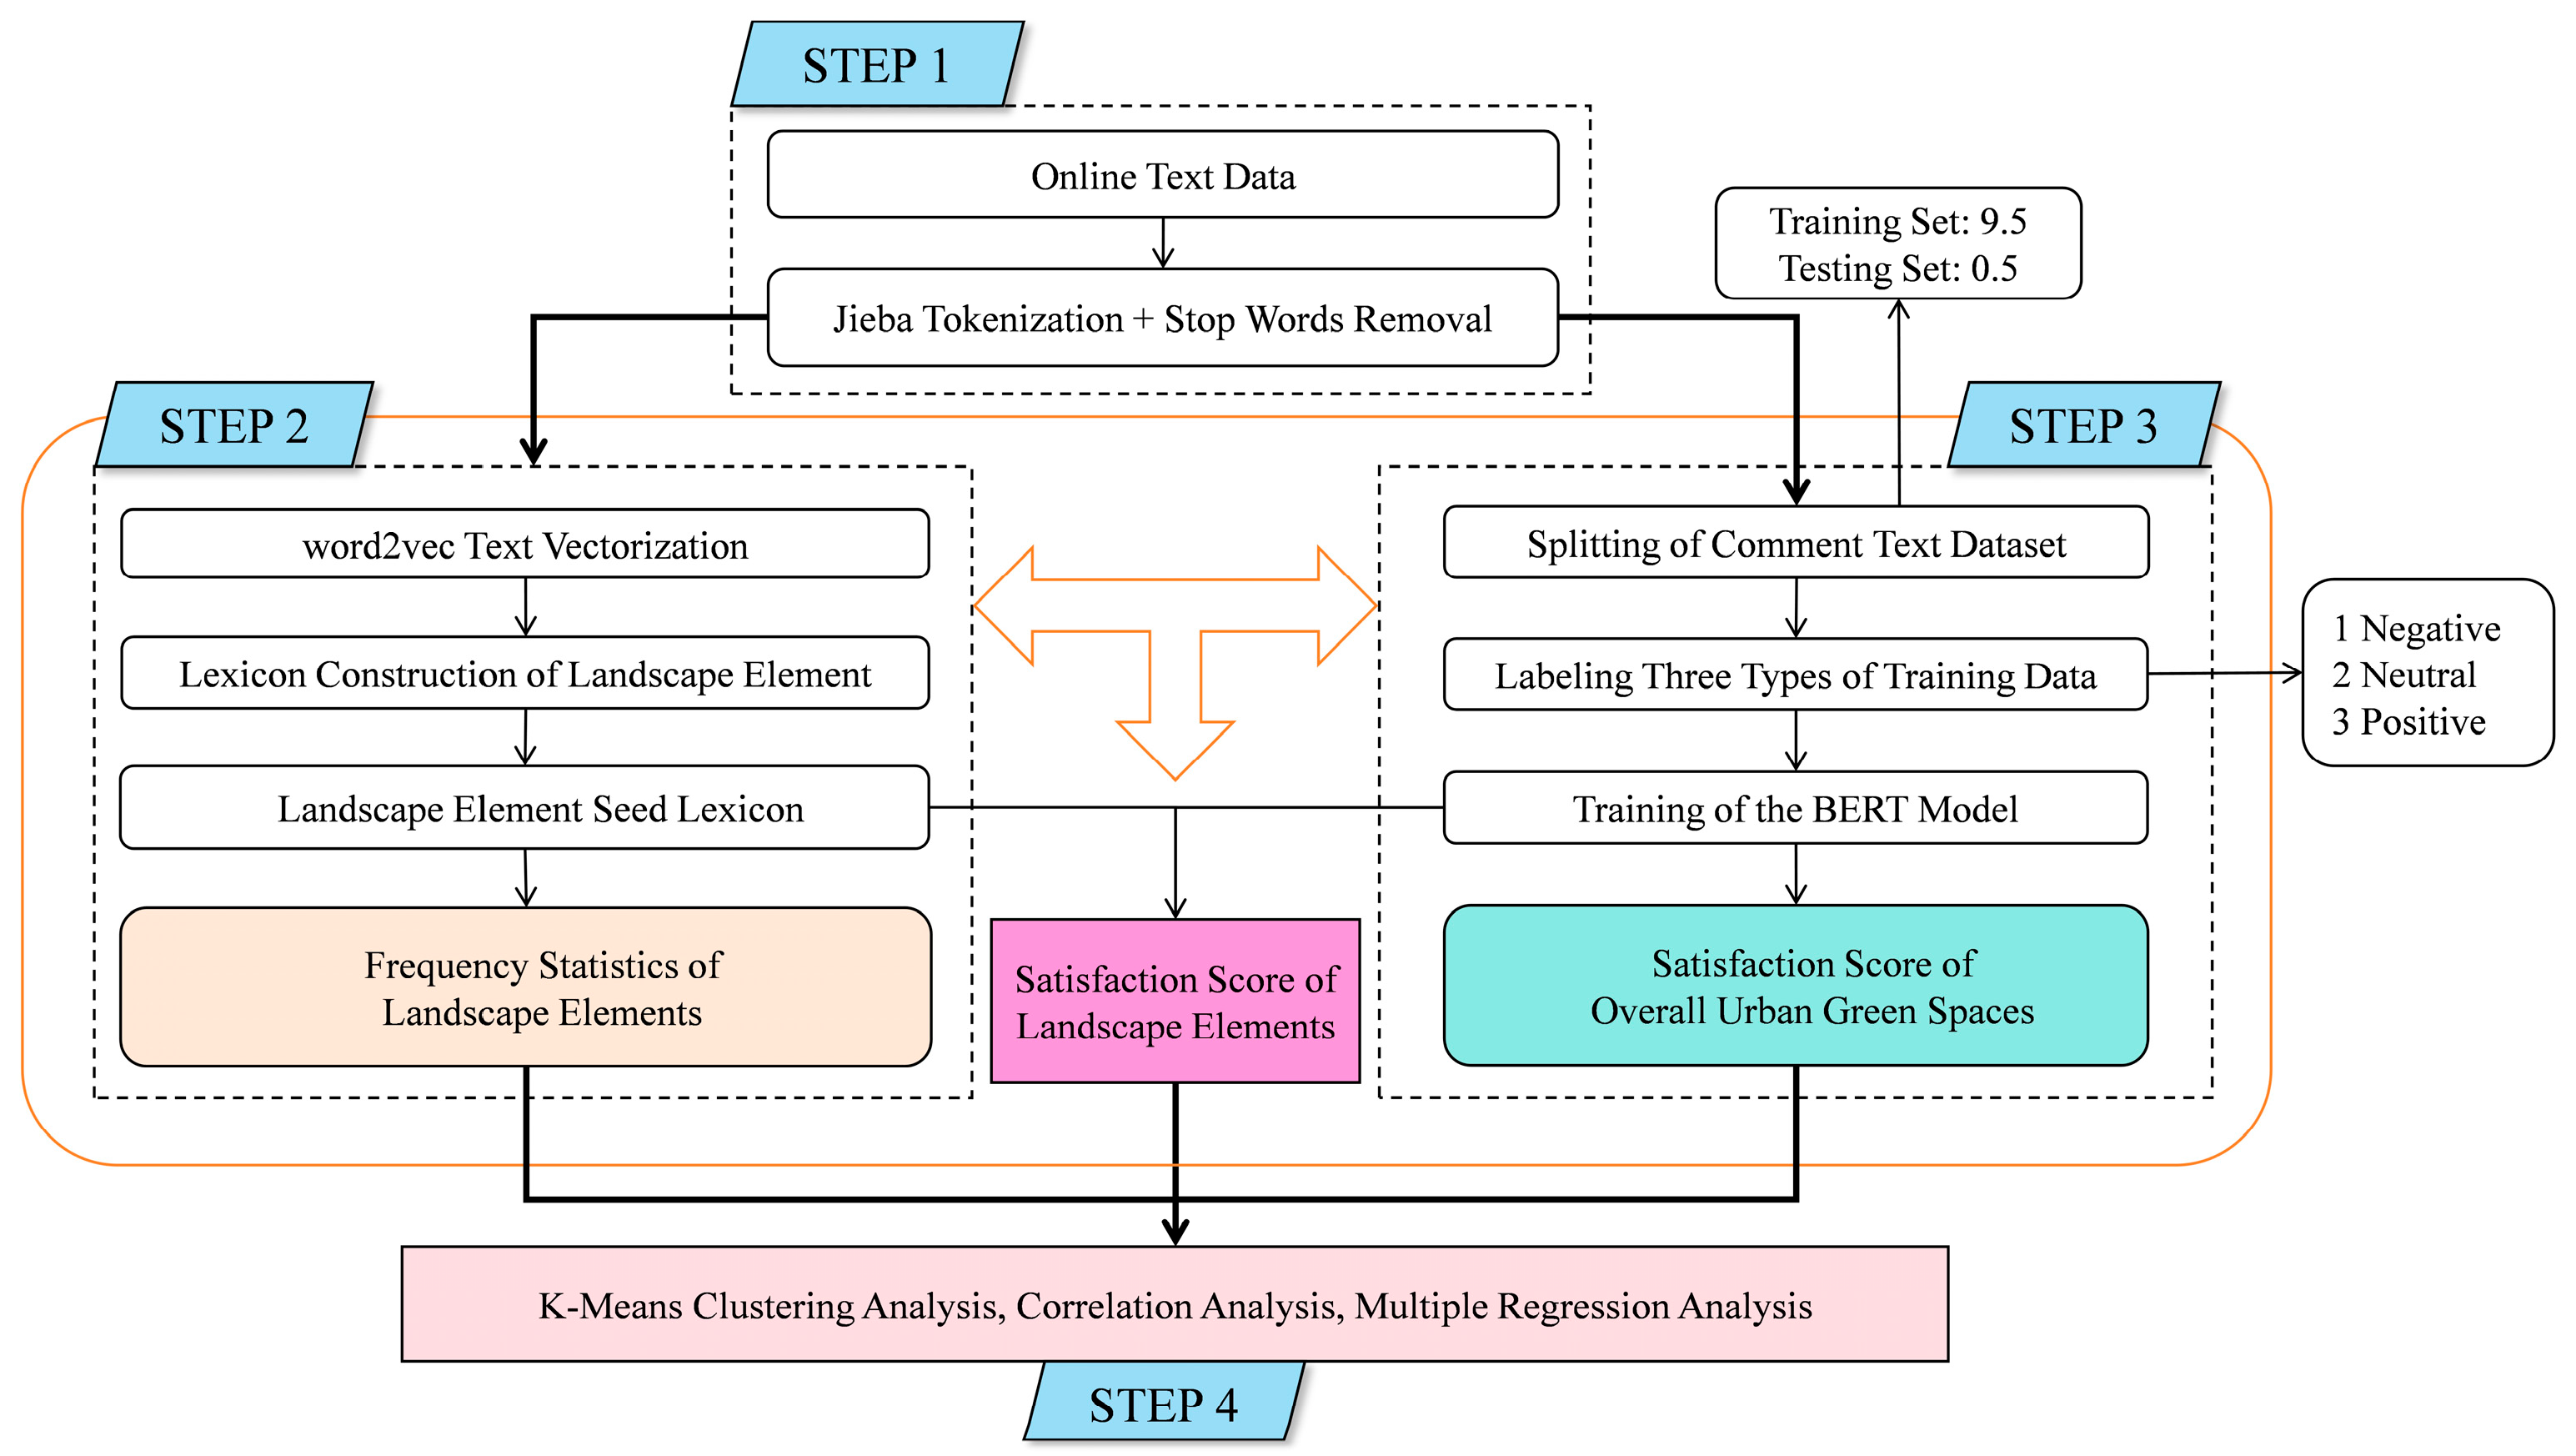
The landscape perception model is shown in Figure 5. 712,969 comments were collected from popular Chinese social media platforms and 7000 comments were selected as the training dataset, which were used to train the BERT landscape perception model, which was subsequently used to evaluate and interpret the landscape perceptions responded to by all comments. In the evaluation section, the landscape perception evaluation model in this study draws on recent advances in the fields of deep learning and NLP. Fine-tuning has become the preferred approach for various NLP tasks, especially since the 2018 BERT model set new benchmarks across multiple NLP tasks, making pre-trained models a research hotspot [31]. In this study, a pre-trained BERT model is used for transfer learning to observe its effectiveness. Additionally, we compare it with TEXTCNN and BILSTM models to identify the optimal landscape perception model.
Figure 5.
Technical process of the Landscape Perception Model.
The proposed landscape perception model comprises four sequential steps (Figure 5), each containing specific functional modules and data interactions. This modular workflow establishes a coherent analytical pipeline linking text preprocessing, semantic learning, sentiment quantification, and statistical validation.
Step 1: Text Preprocessing
Online comment data were collected from multiple social media platforms. Jieba tokenization was applied for Chinese word segmentation, followed by stop-word removal to ensure linguistic clarity. The dataset was randomly divided into a training set (90%) and a testing set (10%) to support model fine-tuning and validation.
Step 2: Lexicon Construction and Text Vectorization.
Using the Word2Vec algorithm, word embeddings were generated to represent textual semantics. Based on the top 1000 high-frequency nouns and verbs, a seed lexicon of landscape elements was established and expanded through cosine similarity matching. Manual proofreading refined this lexicon into 3658 categorized terms. The module of “landscape element word frequency statistics” computed occurrence rates for each element category. The formula for calculating cosine similarity is as shown in Equation (1):
Here, A and B represent the two word vectors being compared, Ai and Bi are their respective i-th components, and n denotes the dimensionality of the vectors. A similarity score close to 1 indicates high semantic correlation.
Step 3: Sentiment Classification and Satisfaction Quantification
A subset of the dataset was manually annotated into three sentiment categories (1 = negative, 2 = neutral, 3 = positive) to support supervised learning.
The pre-trained BERT model was then fine-tuned on this dataset to predict sentiment polarity and satisfaction scores. Two quantitative satisfaction indices were derived: (1) element-level satisfaction, capturing responses to specific landscape components; and (2) overall UGS satisfaction, reflecting aggregated park-level perceptions.
Step 4: Statistical Analysis and Pattern Interpretation
The quantified satisfaction and frequency data were integrated for advanced statistical exploration, including correlation, clustering, and regression analyses. Specifically, Spearman correlation was employed to identify significant associations between landscape elements and overall satisfaction, K-means clustering to classify UGS according to perceptual typologies, and multiple linear regression to quantify the relative contribution of key landscape elements to overall satisfaction.
This modular workflow ensures logical coherence between data preprocessing, semantic learning, sentiment prediction, and statistical validation, forming a robust analytical pipeline for quantifying public perceptions of UGS.
4. Results
4.1. BERT Model Evaluation
To assess the computational efficiency and scalability of the proposed BERT-based sentiment analysis framework, both training and inference processes were evaluated. The model exhibited stable memory usage and linear runtime growth with increasing data volume, indicating robust scalability for large-scale text processing. With a moderate parameter size, the framework balances computational efficiency with high analytical precision, making it adaptable to broader social media datasets through parallel or distributed deployment.
To further validate the robustness of the proposed BERT model, comparative experiments were conducted against two baseline deep learning architectures—TextCNN and BiLSTM—under identical training conditions. Each model was trained and evaluated using the same manually labeled dataset of 7000 UGS comments to ensure comparability and fairness. The performance was assessed through four standard classification metrics: Accuracy, Avg-precision, Avg-recall, and F1-score. As summarized in Table 2, BERT consistently achieved the best results across all evaluation metrics, with an overall accuracy of 84.4%, significantly outperforming TextCNN (73.2%) and BiLSTM (68.4%). These results confirm that BERT’s Transformer-based contextual encoding effectively captures nuanced emotional semantics and implicit sentiment cues in short social media texts. The superior performance and stability across multiple evaluation dimensions verify the validity and generalization capability of the model for large-scale sentiment analysis in urban perception studies.
Table 2.
Comparison of Model Accuracy.
4.2. Perceived Satisfaction with UGS
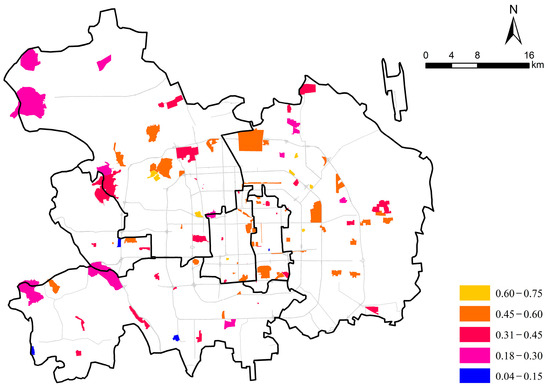
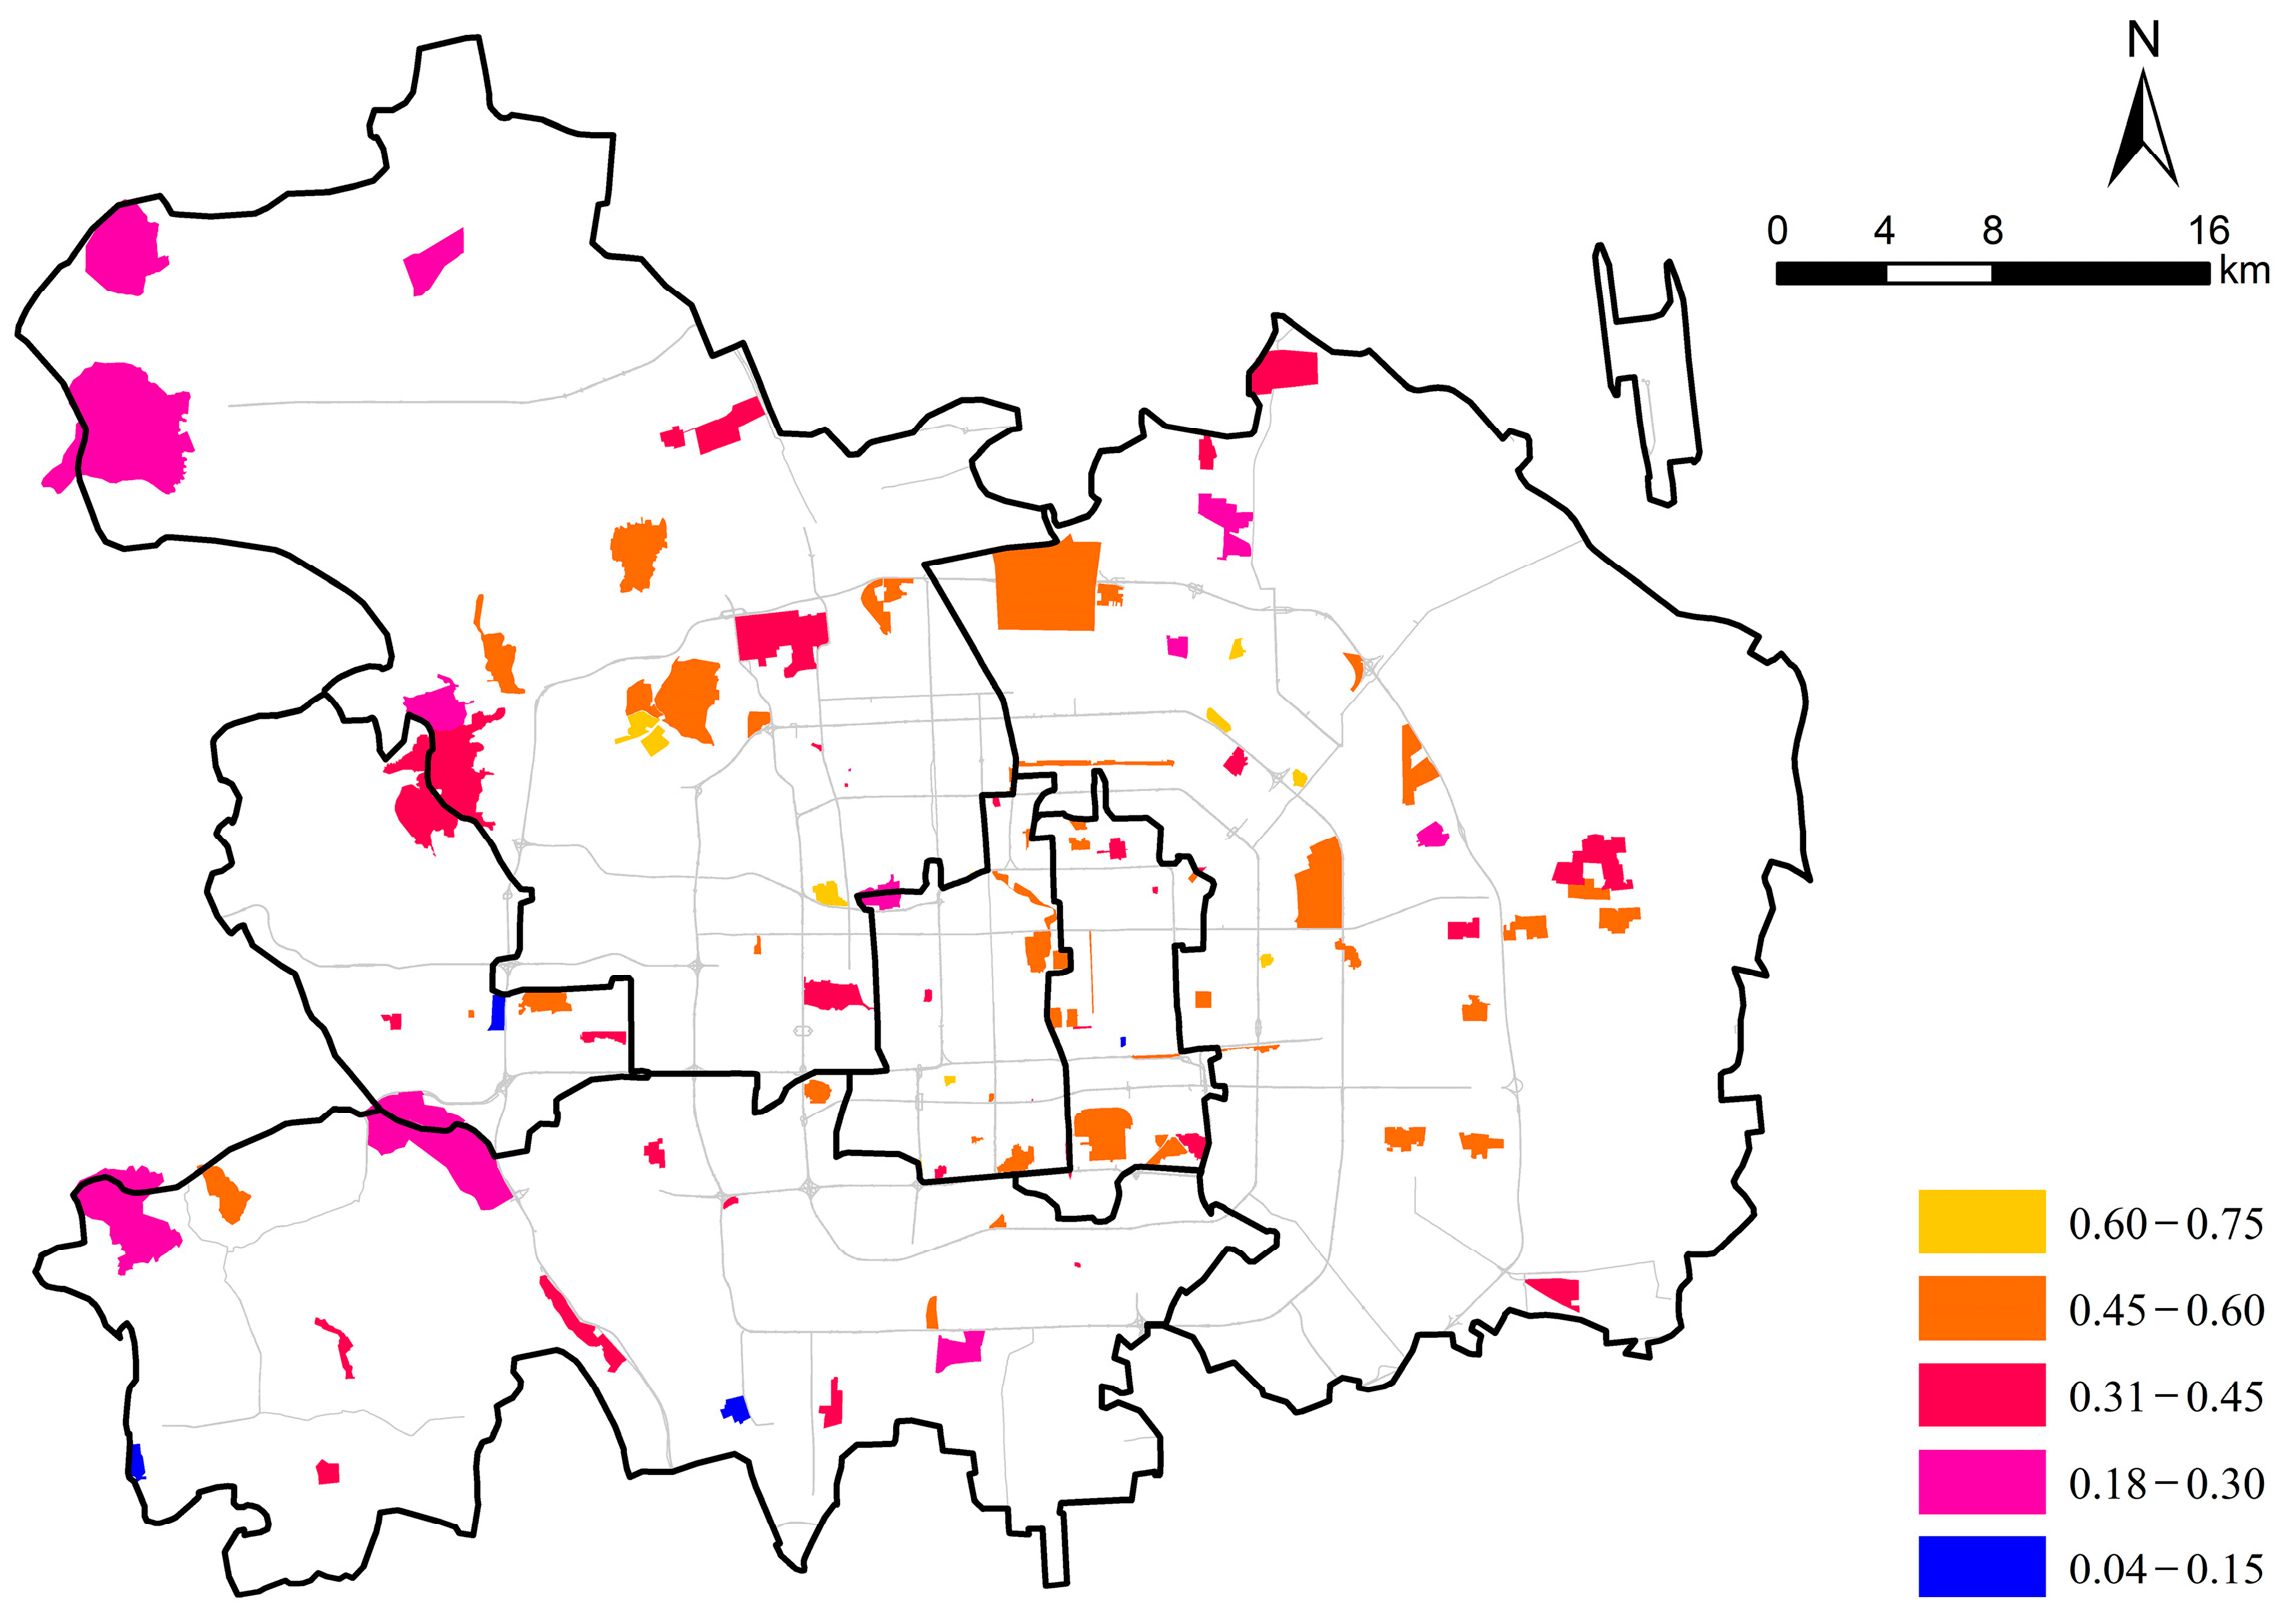
The quantitative assessment of perceived satisfaction with UGS in Beijing reveals an overall positive public perception, with all surveyed parks receiving satisfaction scores above zero. Notably, certain parks—including Tanxi Shengjing Park, Zhongwu Park, Side Park, and Jinzhongdu Park—demonstrated particularly high satisfaction levels (scores > 0.63). In contrast, Qinglonghu Park (0.12), Dongdan Park (0.11), and Shijingshan Amusement Park (0.04) ranked the lowest, indicating significant disparities in public satisfaction across different UGS. This polarization reflects varying public expectations and preferences regarding UGS.
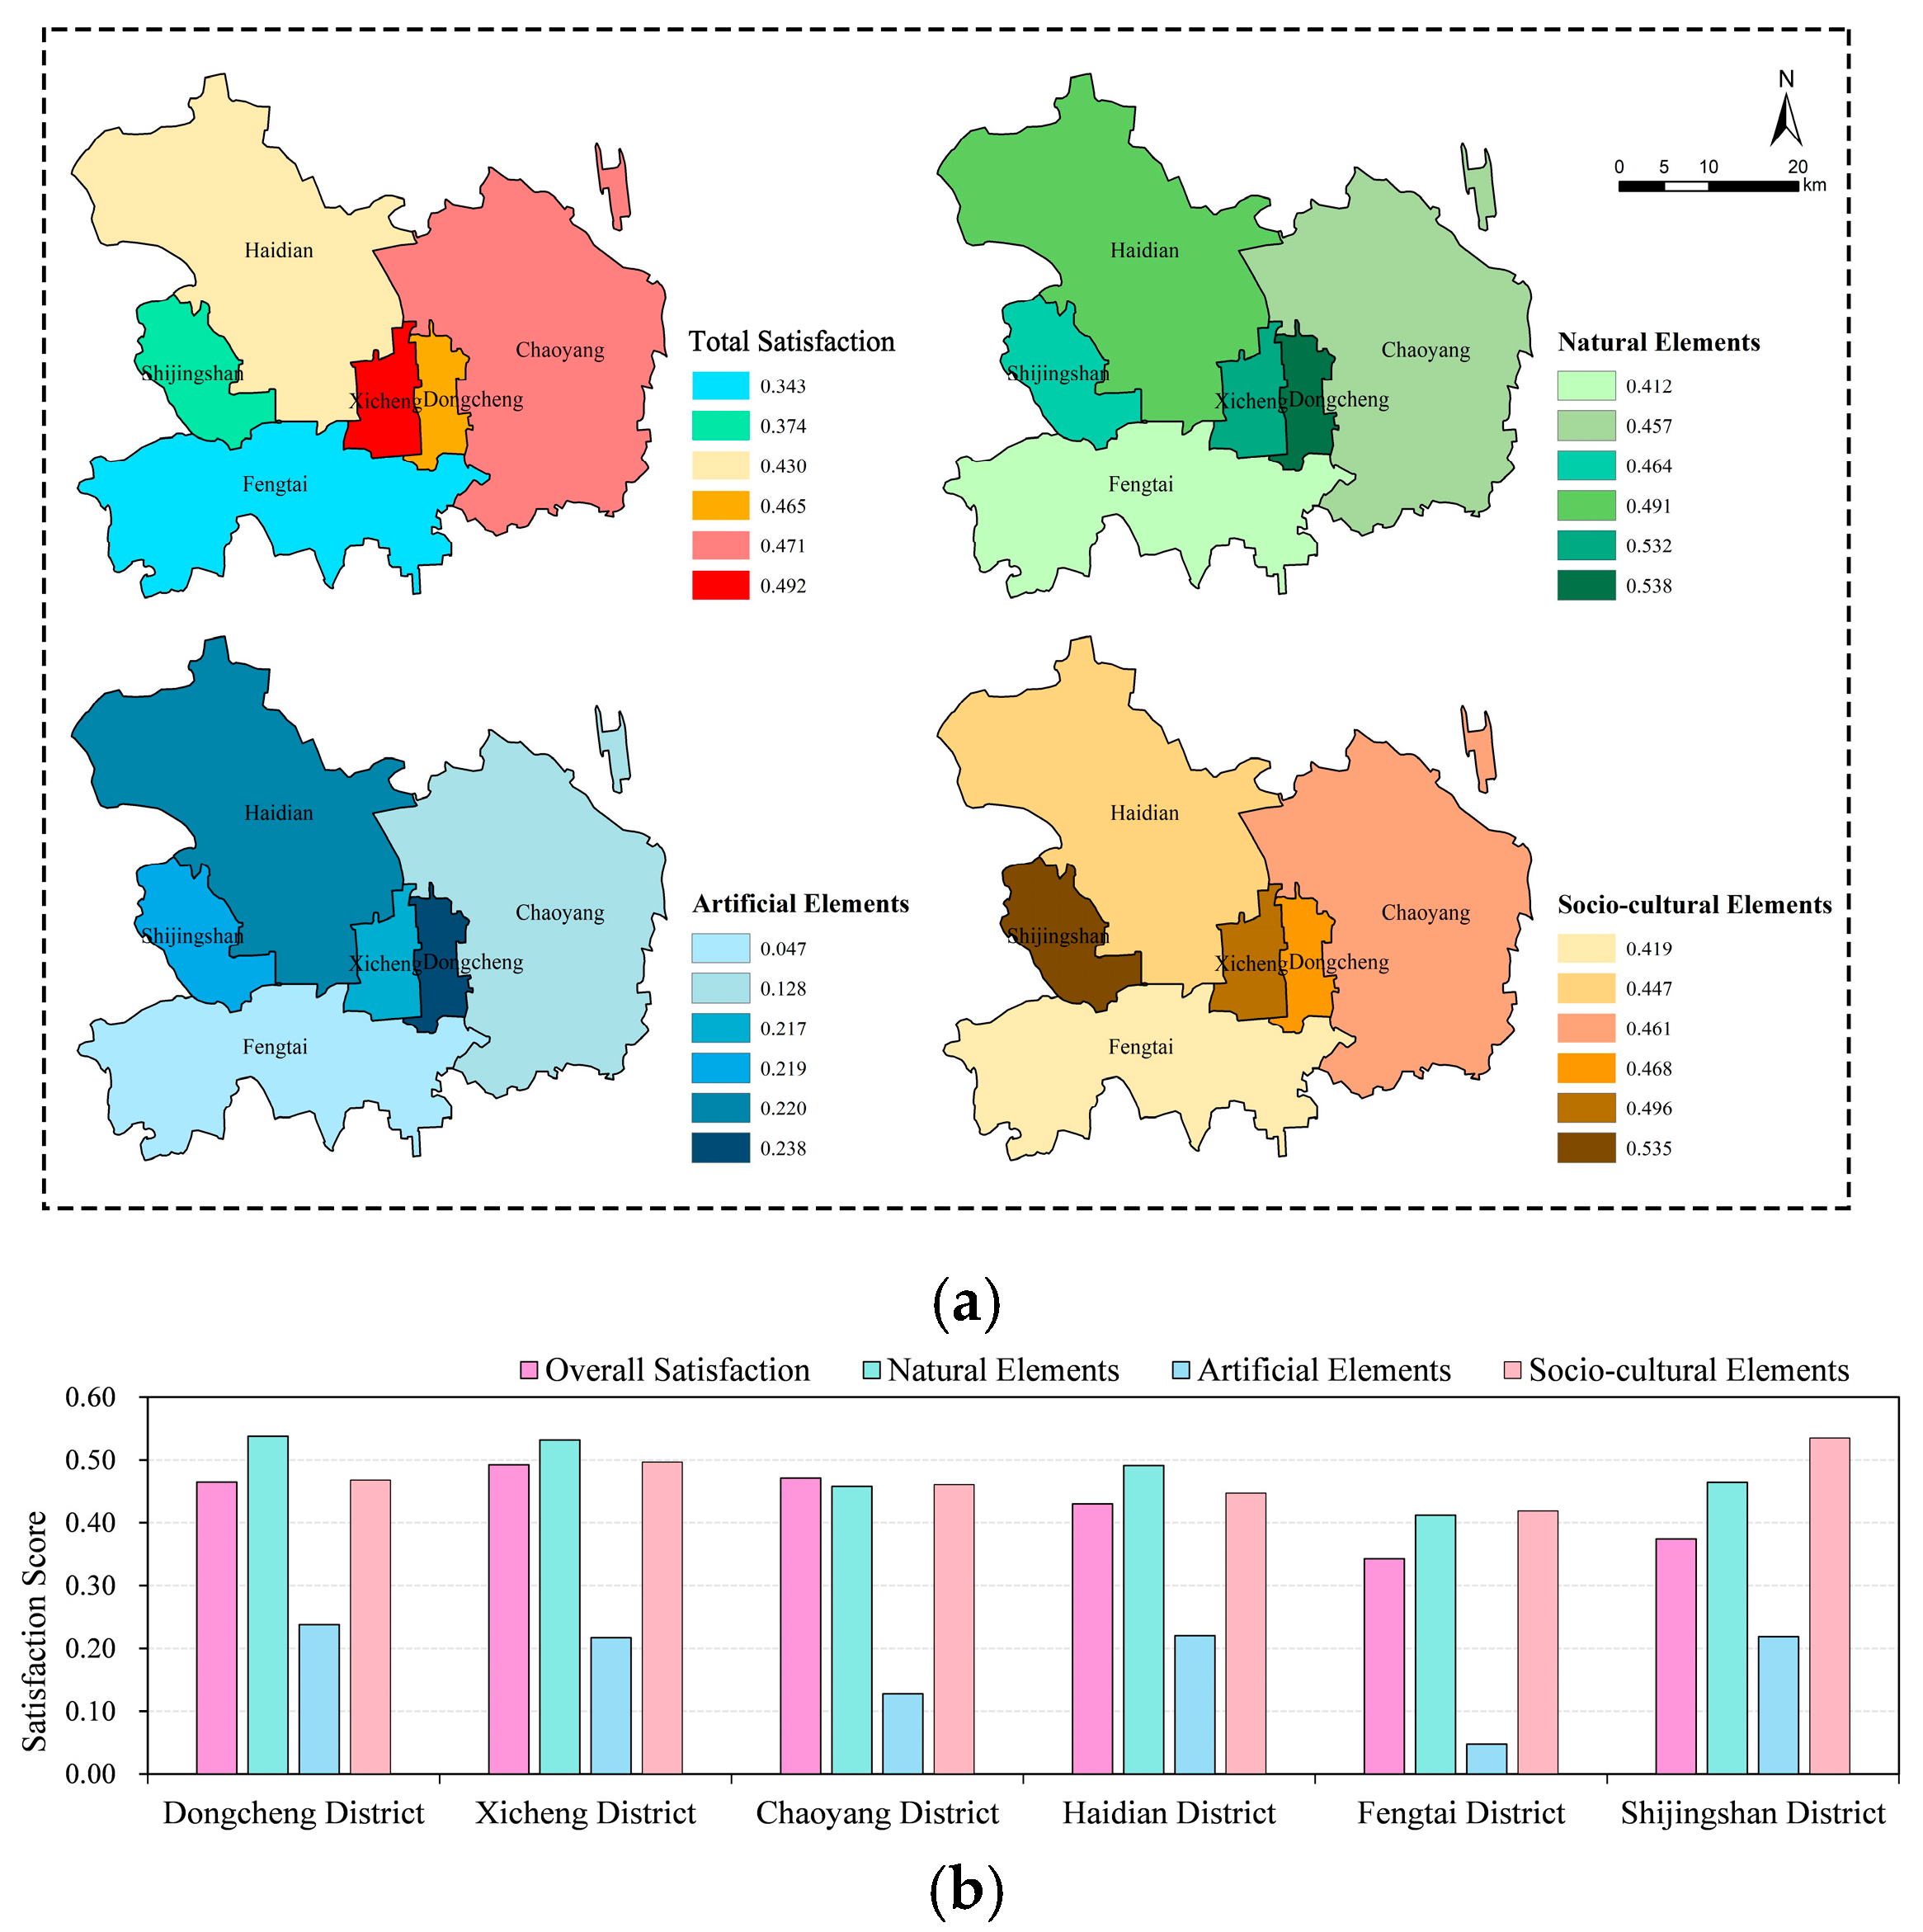
Spatial visualization analysis (Figure 6) highlights distinct geographical patterns in satisfaction levels: parks located in central urban areas generally received higher scores compared to those in peripheral regions. At the district level (Figure 7), Xicheng District and Chaoyang District exhibited the highest UGS satisfaction, while Fengtai District scored the lowest. The overall trend suggests that central parks outperform suburban ones, and eastern parks are rated more favorably than western parks—a distribution consistent with regional development characteristics and further validating the reliability of the landscape perception model.
Figure 6.
Spatial Distribution of Overall Satisfaction with UGS.
Figure 7.
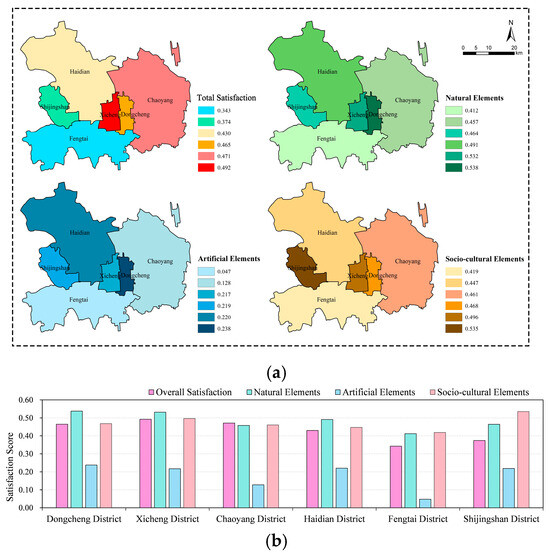
Satisfaction Scores by Districts and Element Categories. (a) Spatial distribution of overall and three-category landscape element satisfaction across different administrative districts. (b) Overall and three-category landscape element satisfaction scores across different administrative districts.
An element-wise comparison reveals that natural features consistently received higher satisfaction ratings than socio-cultural and artificial elements across most districts. However, Chaoyang District presented an exception, with overall satisfaction exceeding the scores for individual elements (natural, socio-cultural, and artificial).
A focused analysis of Beijing’s Green Belt parks indicates a mismatch between public satisfaction and planning objectives. Despite emphasizing high-quality development and improved service capacity, most parks within the primary Green Belt scored relatively low. Although some green spaces in Chaoyang District and Haidian District achieved satisfaction scores above 0.6, over half of the parks in these districts—along with those in Shijingshan District and Fengtai District—remained underrated. This suggests that current UGS development in the Green Belt has yet to fully align with resident expectations.
4.3. Perceived Frequency and Satisfaction of Landscape Elements in UGS
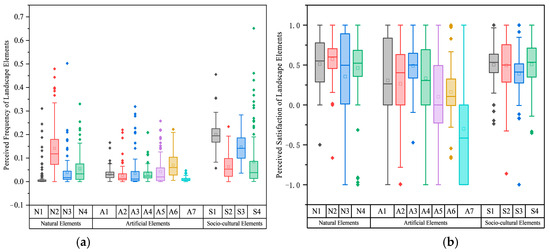
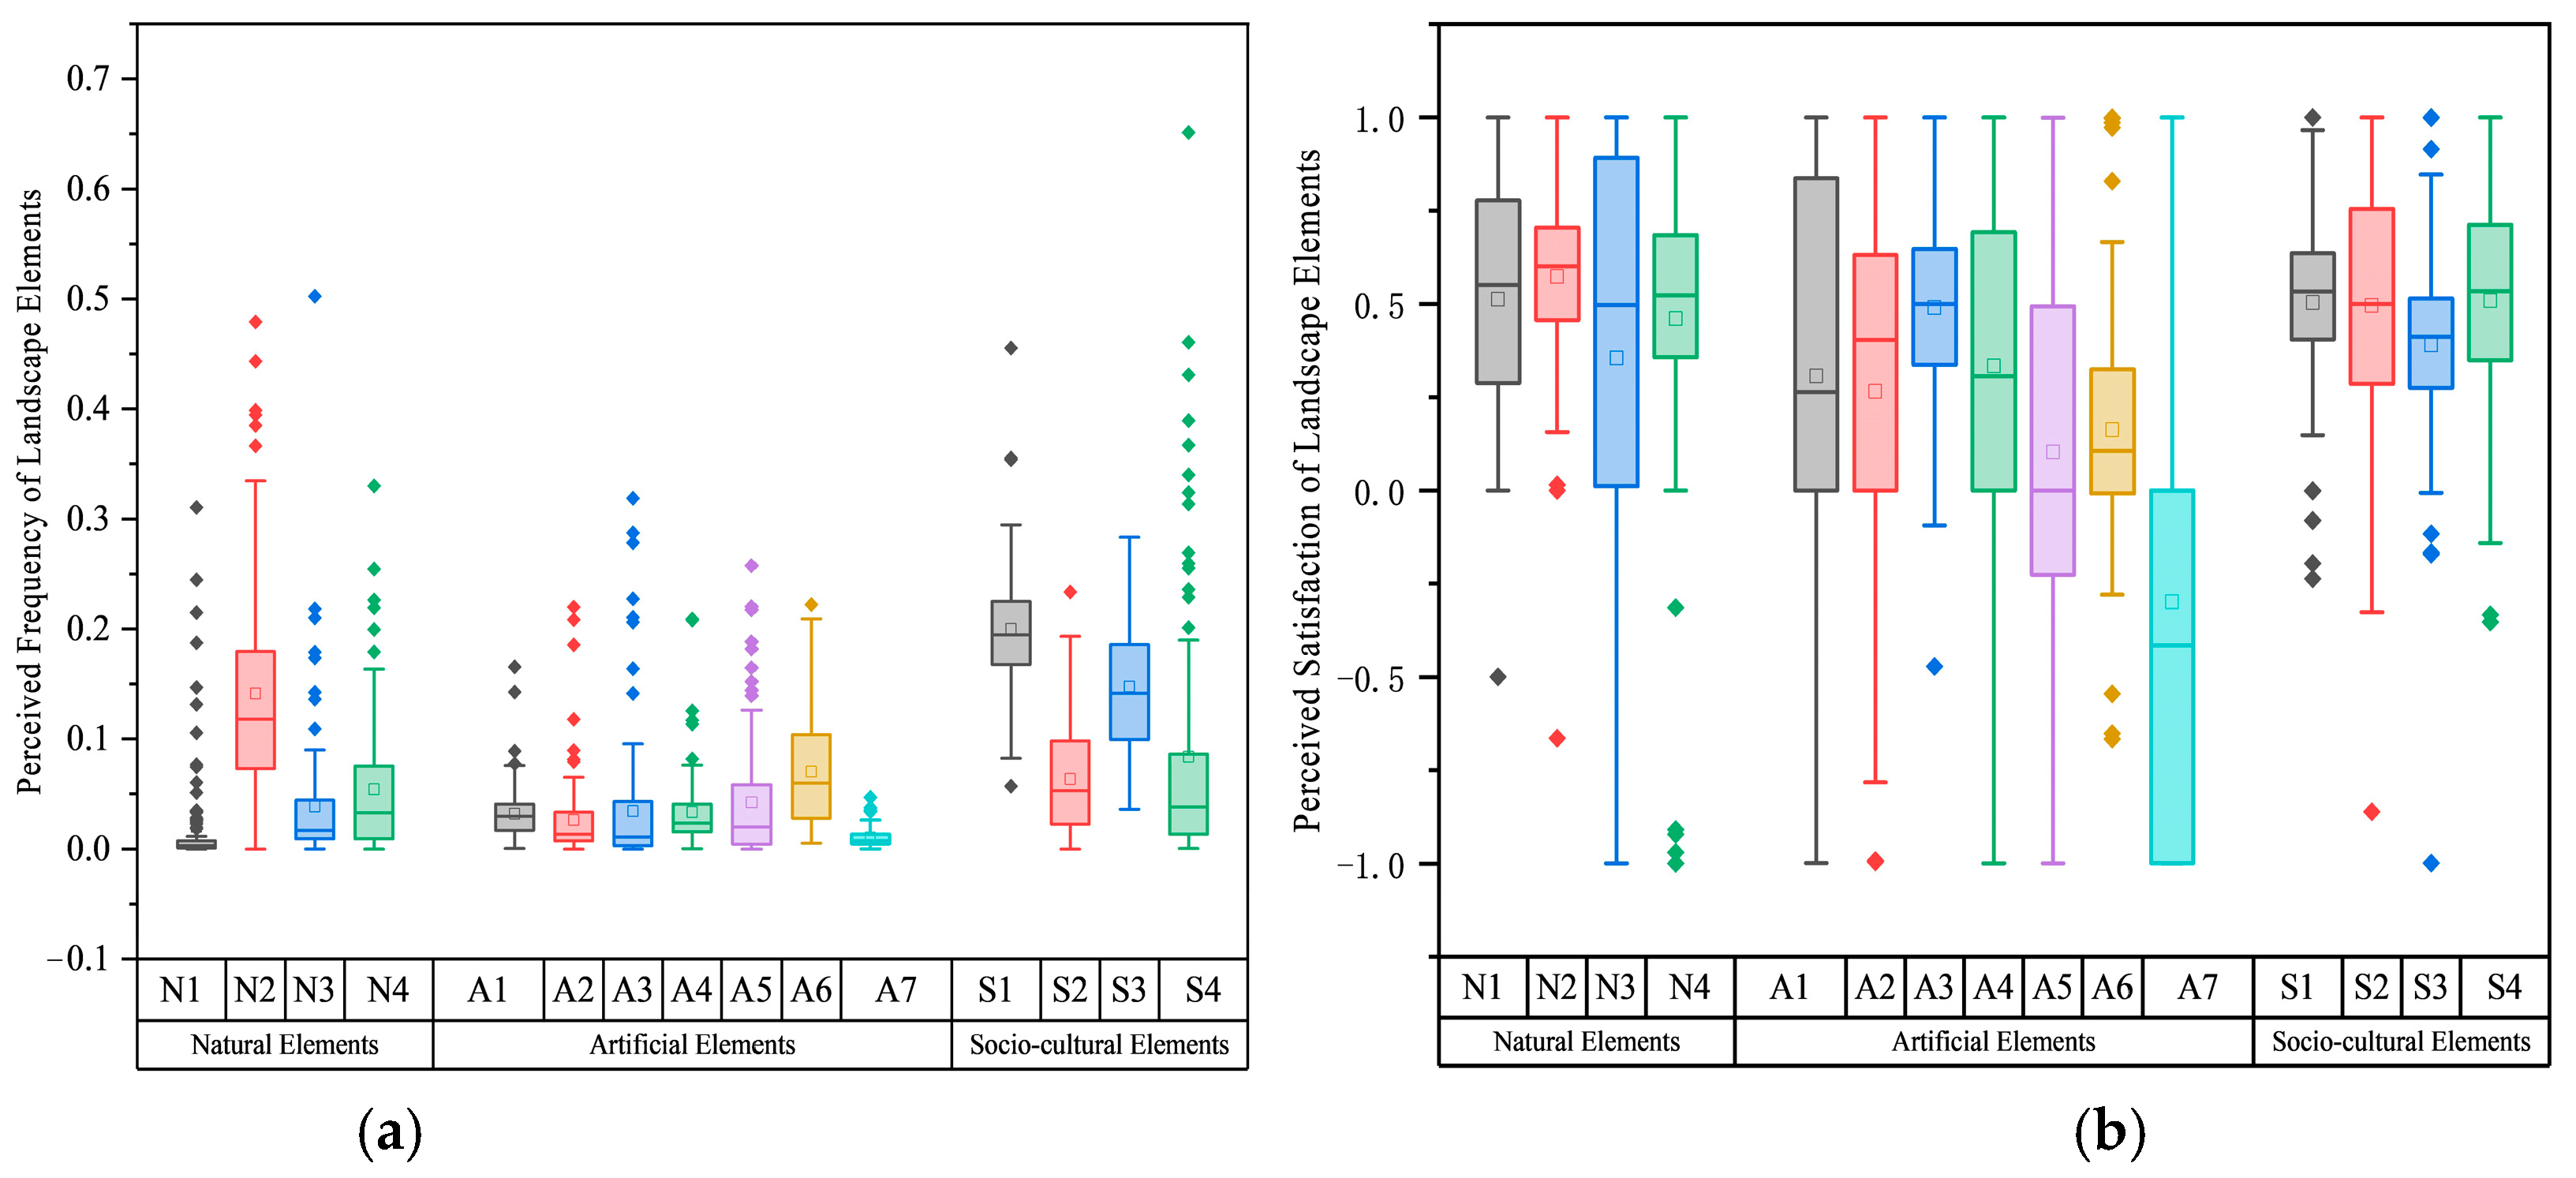
Public perception of UGS landscape elements varies significantly across individual parks and districts. At the park level, socio-cultural elements show the highest perception frequency (mean = 0.124), with leisure and recreational activity (S1) being most frequently mentioned. Natural elements rank second (mean = 0.064), where vegetation (N2) receives notable attention while topography (N1) remains underperceived. Artificial elements exhibit the lowest overall frequency (mean = 0.036), though leisure facilities and management infrastructure show relative prominence. Notably, historical–cultural parks like Temple of Heaven Park demonstrate exceptionally high perception rates for garden architecture (A3), reflecting cultural symbols’ role in directing attention.
Satisfaction displays asymmetric relationships with perception frequency: low-frequency elements such as topography (N1), animal (N3), road square (A1), and art and culture (S4) achieve high satisfaction, whereas high-frequency elements like service facility (A6) and user target audience (S3) score below 0.4 (Figure 8). This contrast reveals that frequent social media mentions do not equate to positive sentiment—for instance, a substantial amount of management facility (A7) discussions convey negative evaluations, exposing systemic functional deficiencies.
Figure 8.
Box Line Plot of Perceived Frequency and Perceived Satisfaction of Landscape Elements in UGS. (a) Box Line Plot of Perceived Frequency of Landscape Elements. (b) Box Line Plot of Perceived Satisfaction of Landscape Elements.
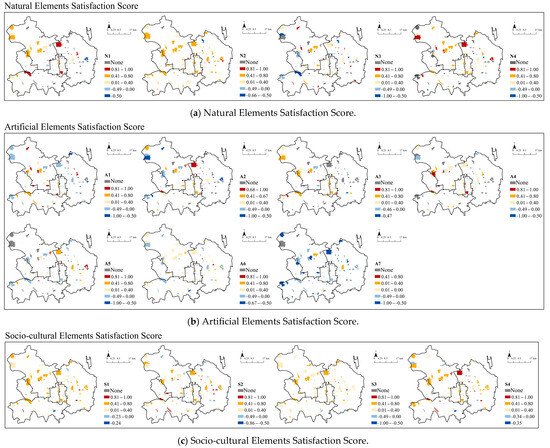
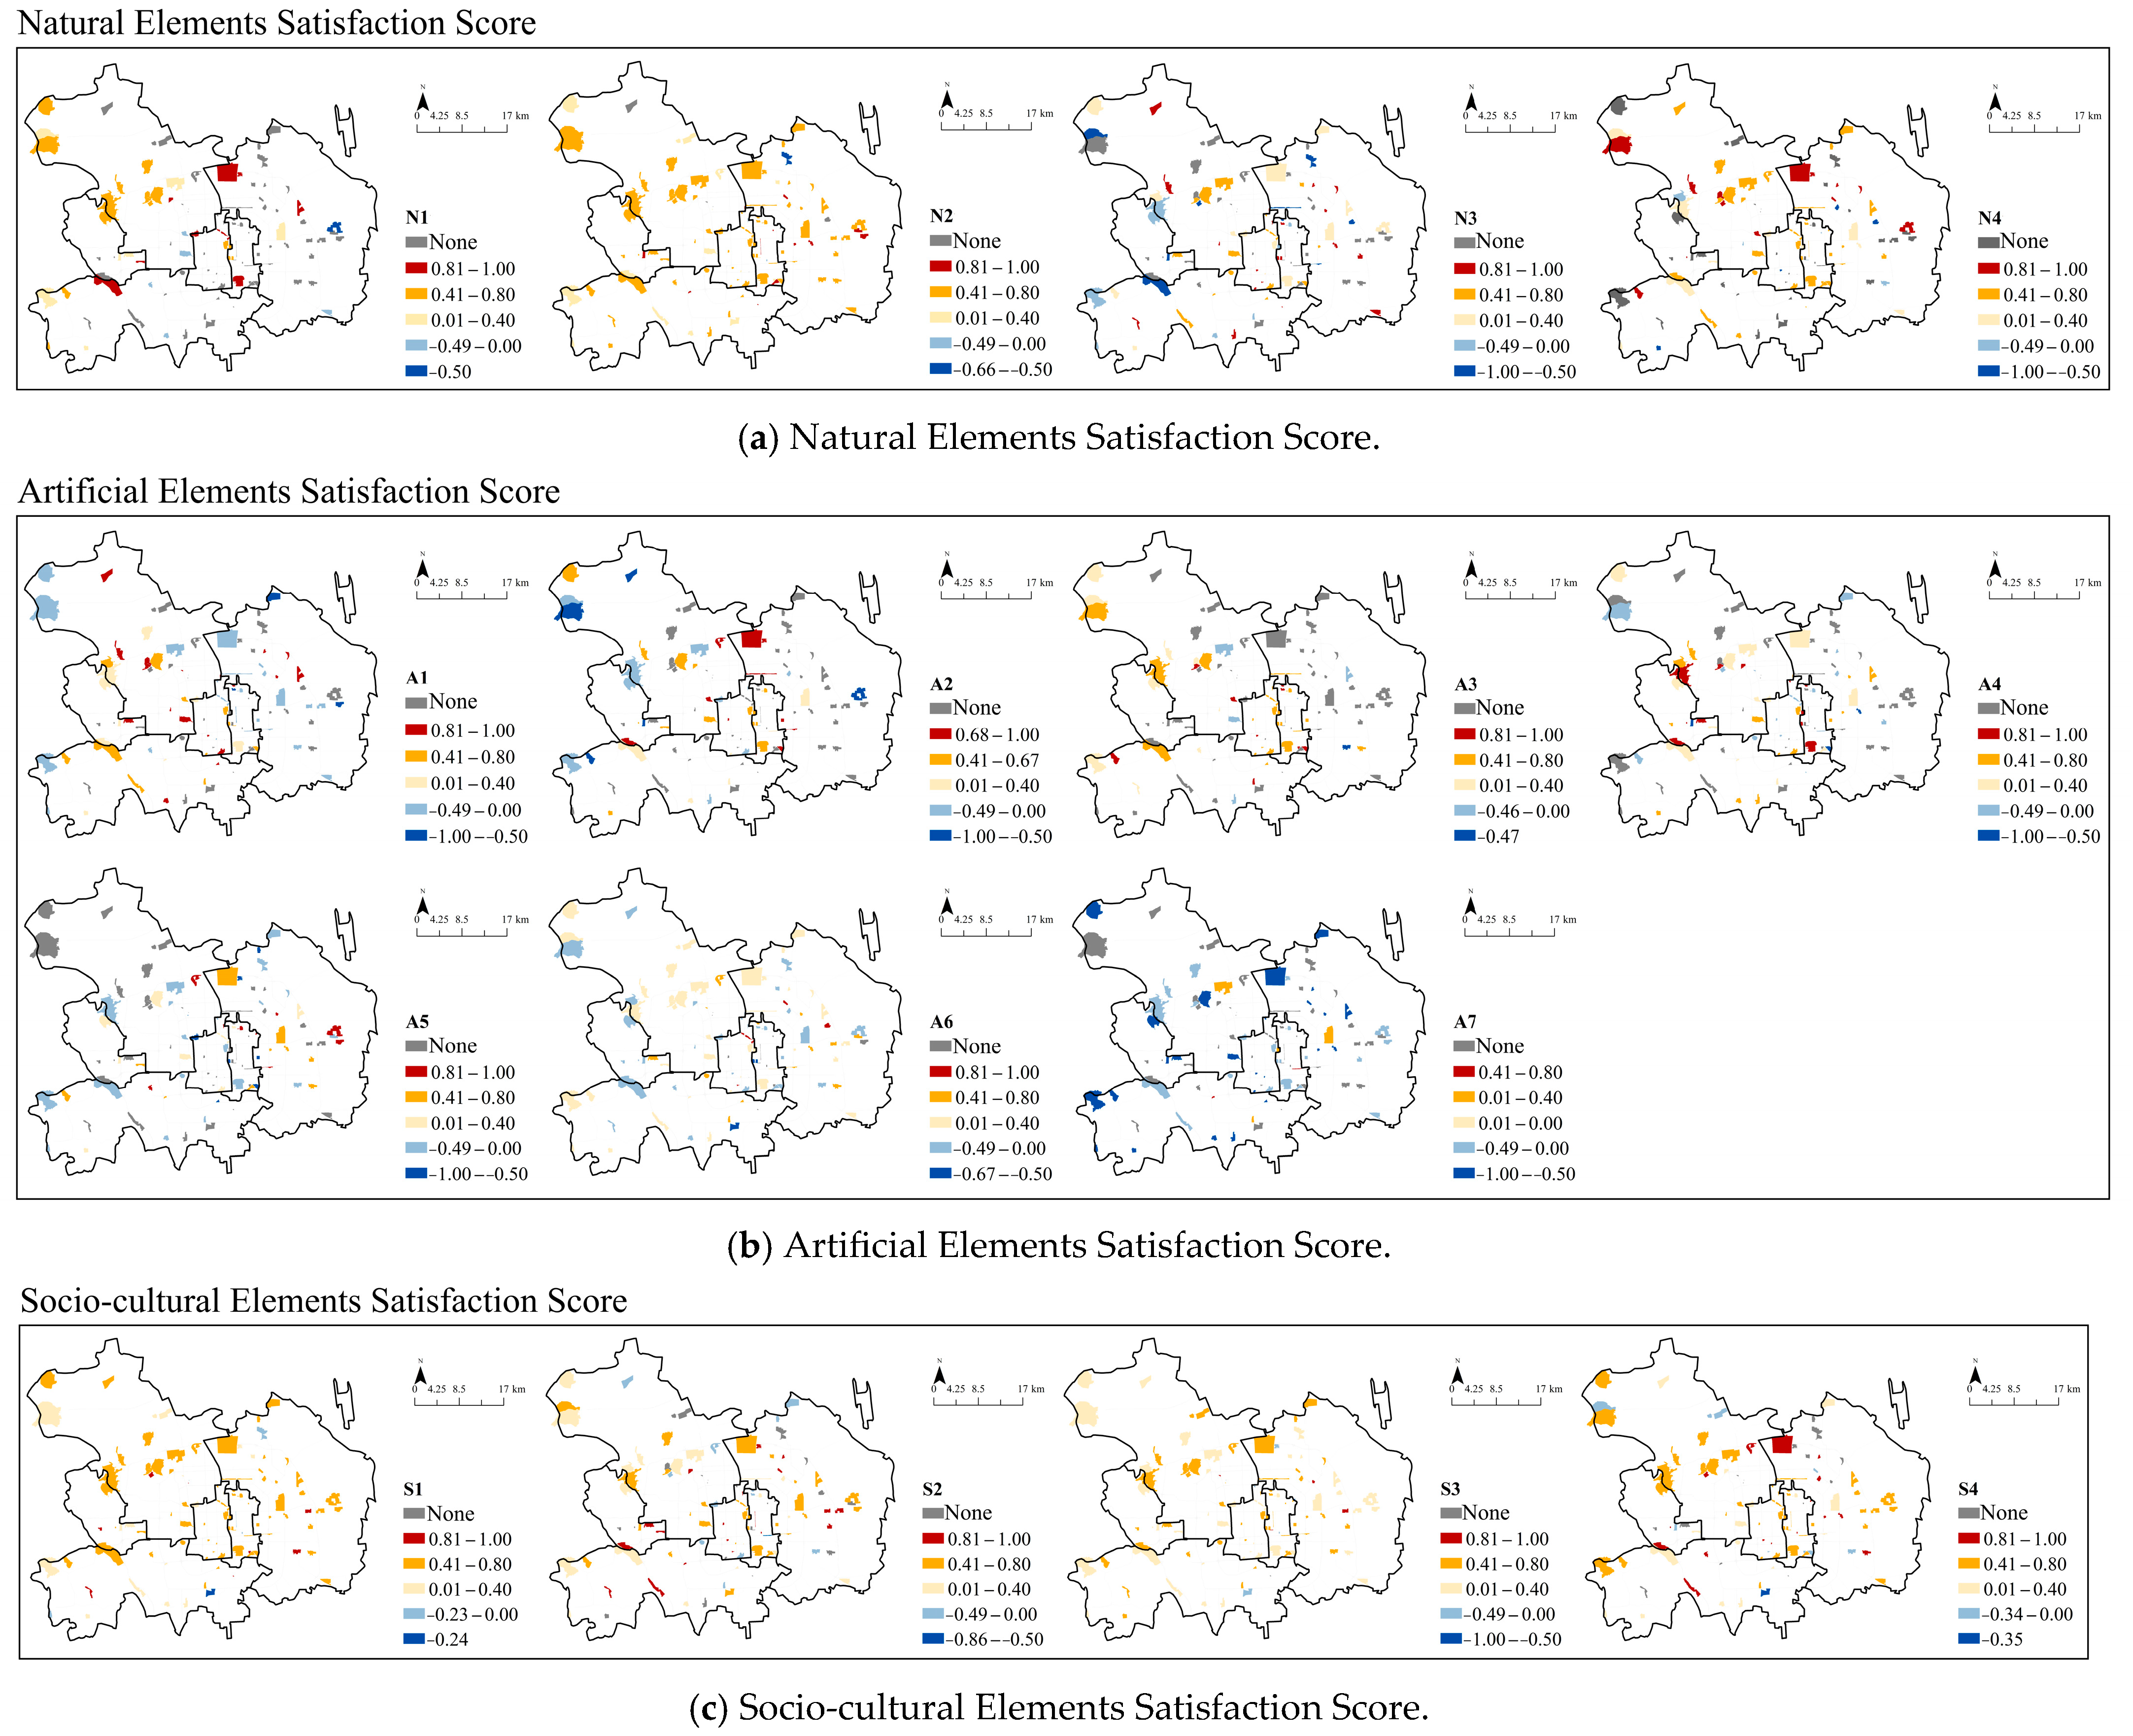
Spatial visualization analysis (Figure 9) highlights locational specificity: ecological parks like Olympic Forest Park lack garden architecture (A3) perception, while Chaoyang District shows pervasive low engagement with artificial elements. To address this “perception preference-location feature” linkage, we propose categorizing UGS based on element perception frequency: prioritize retrofitting high-frequency/low-quality elements (e.g., A6), enhance experiential quality of low-frequency/high-quality elements (e.g., N1), and adopt differentiated strategies to elevate public satisfaction.
Figure 9.
Spatial Distribution of Perceived Satisfaction with Landscape Elements.
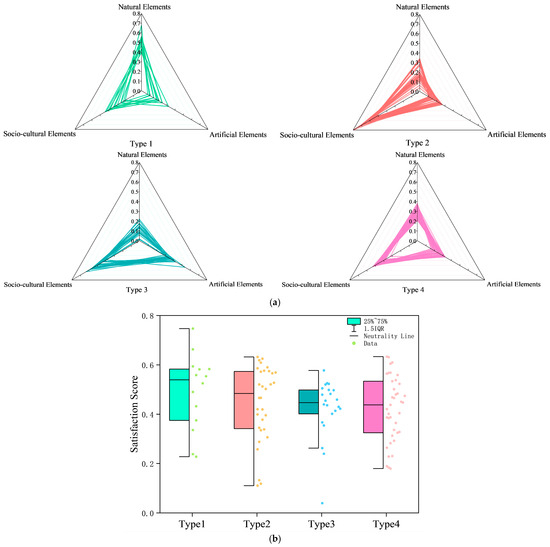
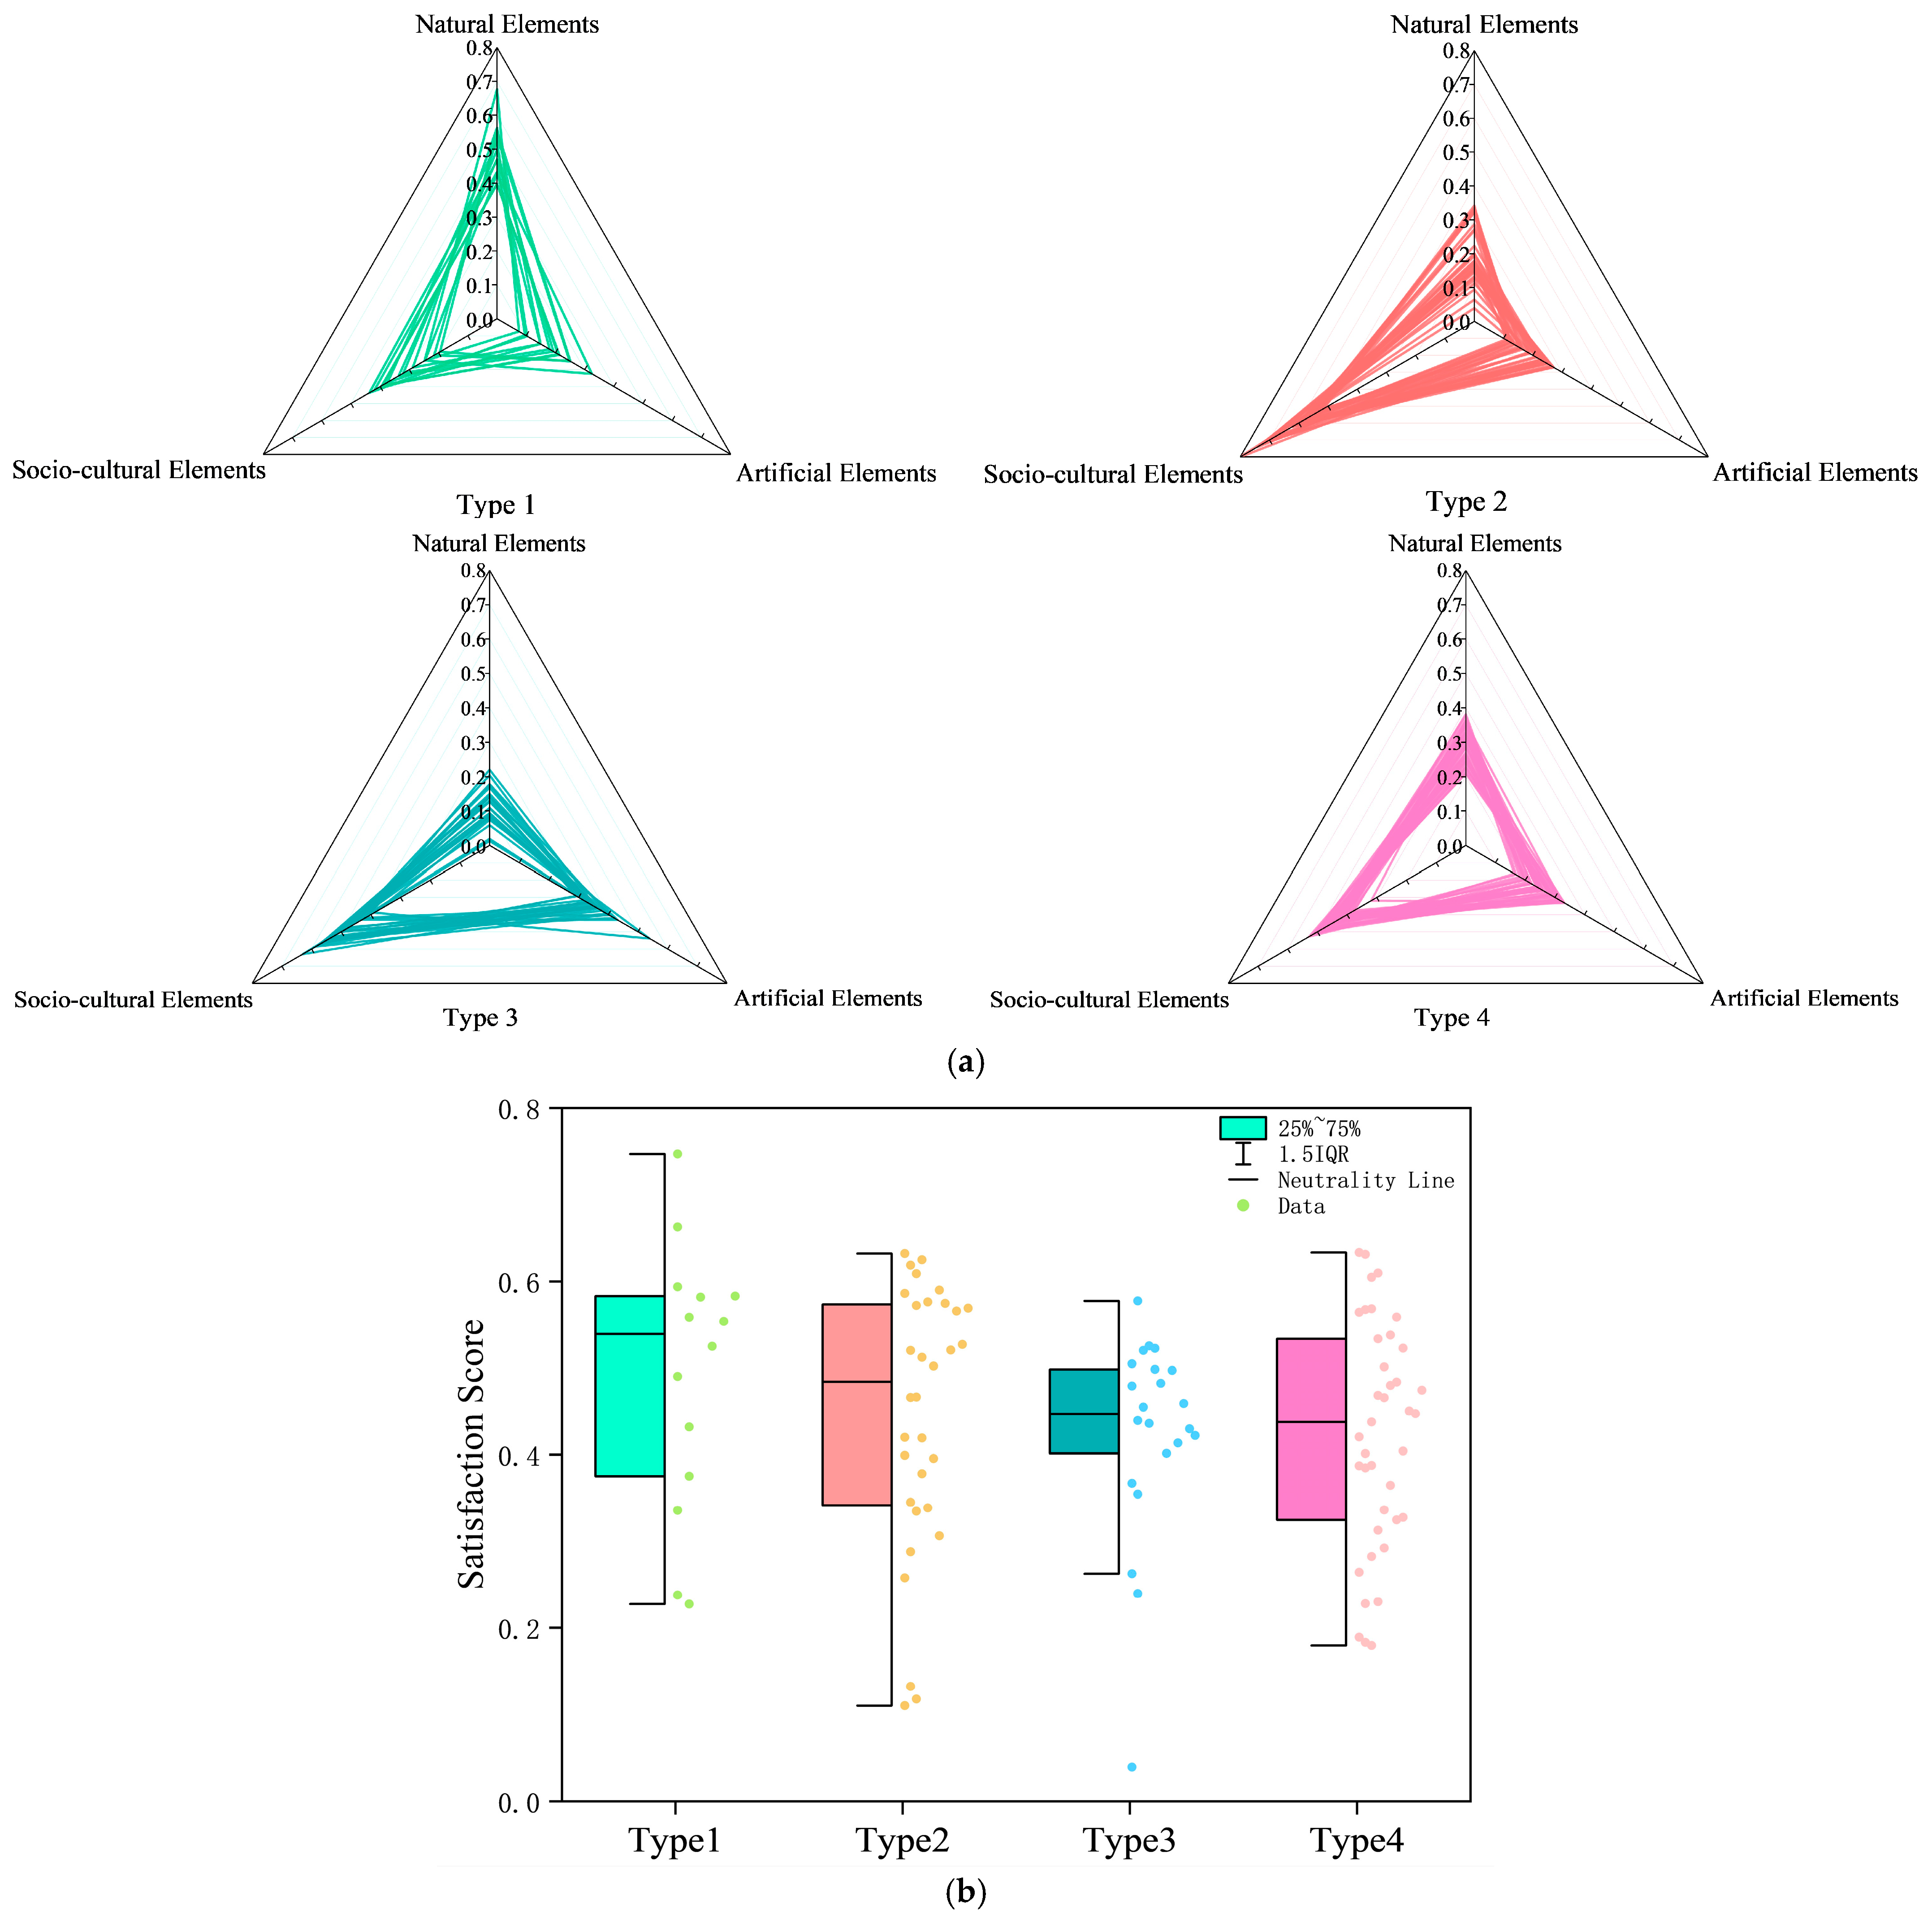
Furthermore, 36% of green spaces (Type 4) showed balanced element perception without dominant features, indicating a lack of distinctive landscape identity that may compromise site appeal.
Perceptual satisfaction analysis (Figure 10) revealed that Nature-Dominant green spaces (Type 1) achieved the highest average satisfaction, whereas Element-Balanced sites (Type 4) scored the lowest. Radar charts demonstrated polarized satisfaction distributions in Types 1 and 2, where public attention focused on dominant elements (e.g., natural landscapes in Type 1 or cultural activities in Type 2), leading to overall positive evaluations. In contrast, Type 4 exhibited evenly distributed but universally low satisfaction, implying systemic deficiencies (e.g., inadequate maintenance or functional monotony) that created a “bucket effect” dragging down comprehensive ratings. These findings highlight a nonlinear relationship between element dominance and satisfaction: strong feature recognition enhances overall perception, yet balanced patterns may mask critical weaknesses requiring targeted intervention.
Figure 10.
Classification of UGS identification patterns based on perceived frequency of landscape elements and box line plot of satisfaction. (a) Four different clustering types of green spaces. (b) Box-line diagram of satisfaction with the four types of UGS.
4.4. Impact of Landscape Elements on UGS Satisfaction
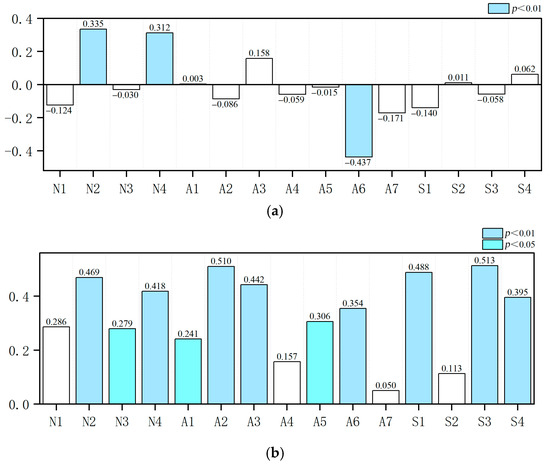
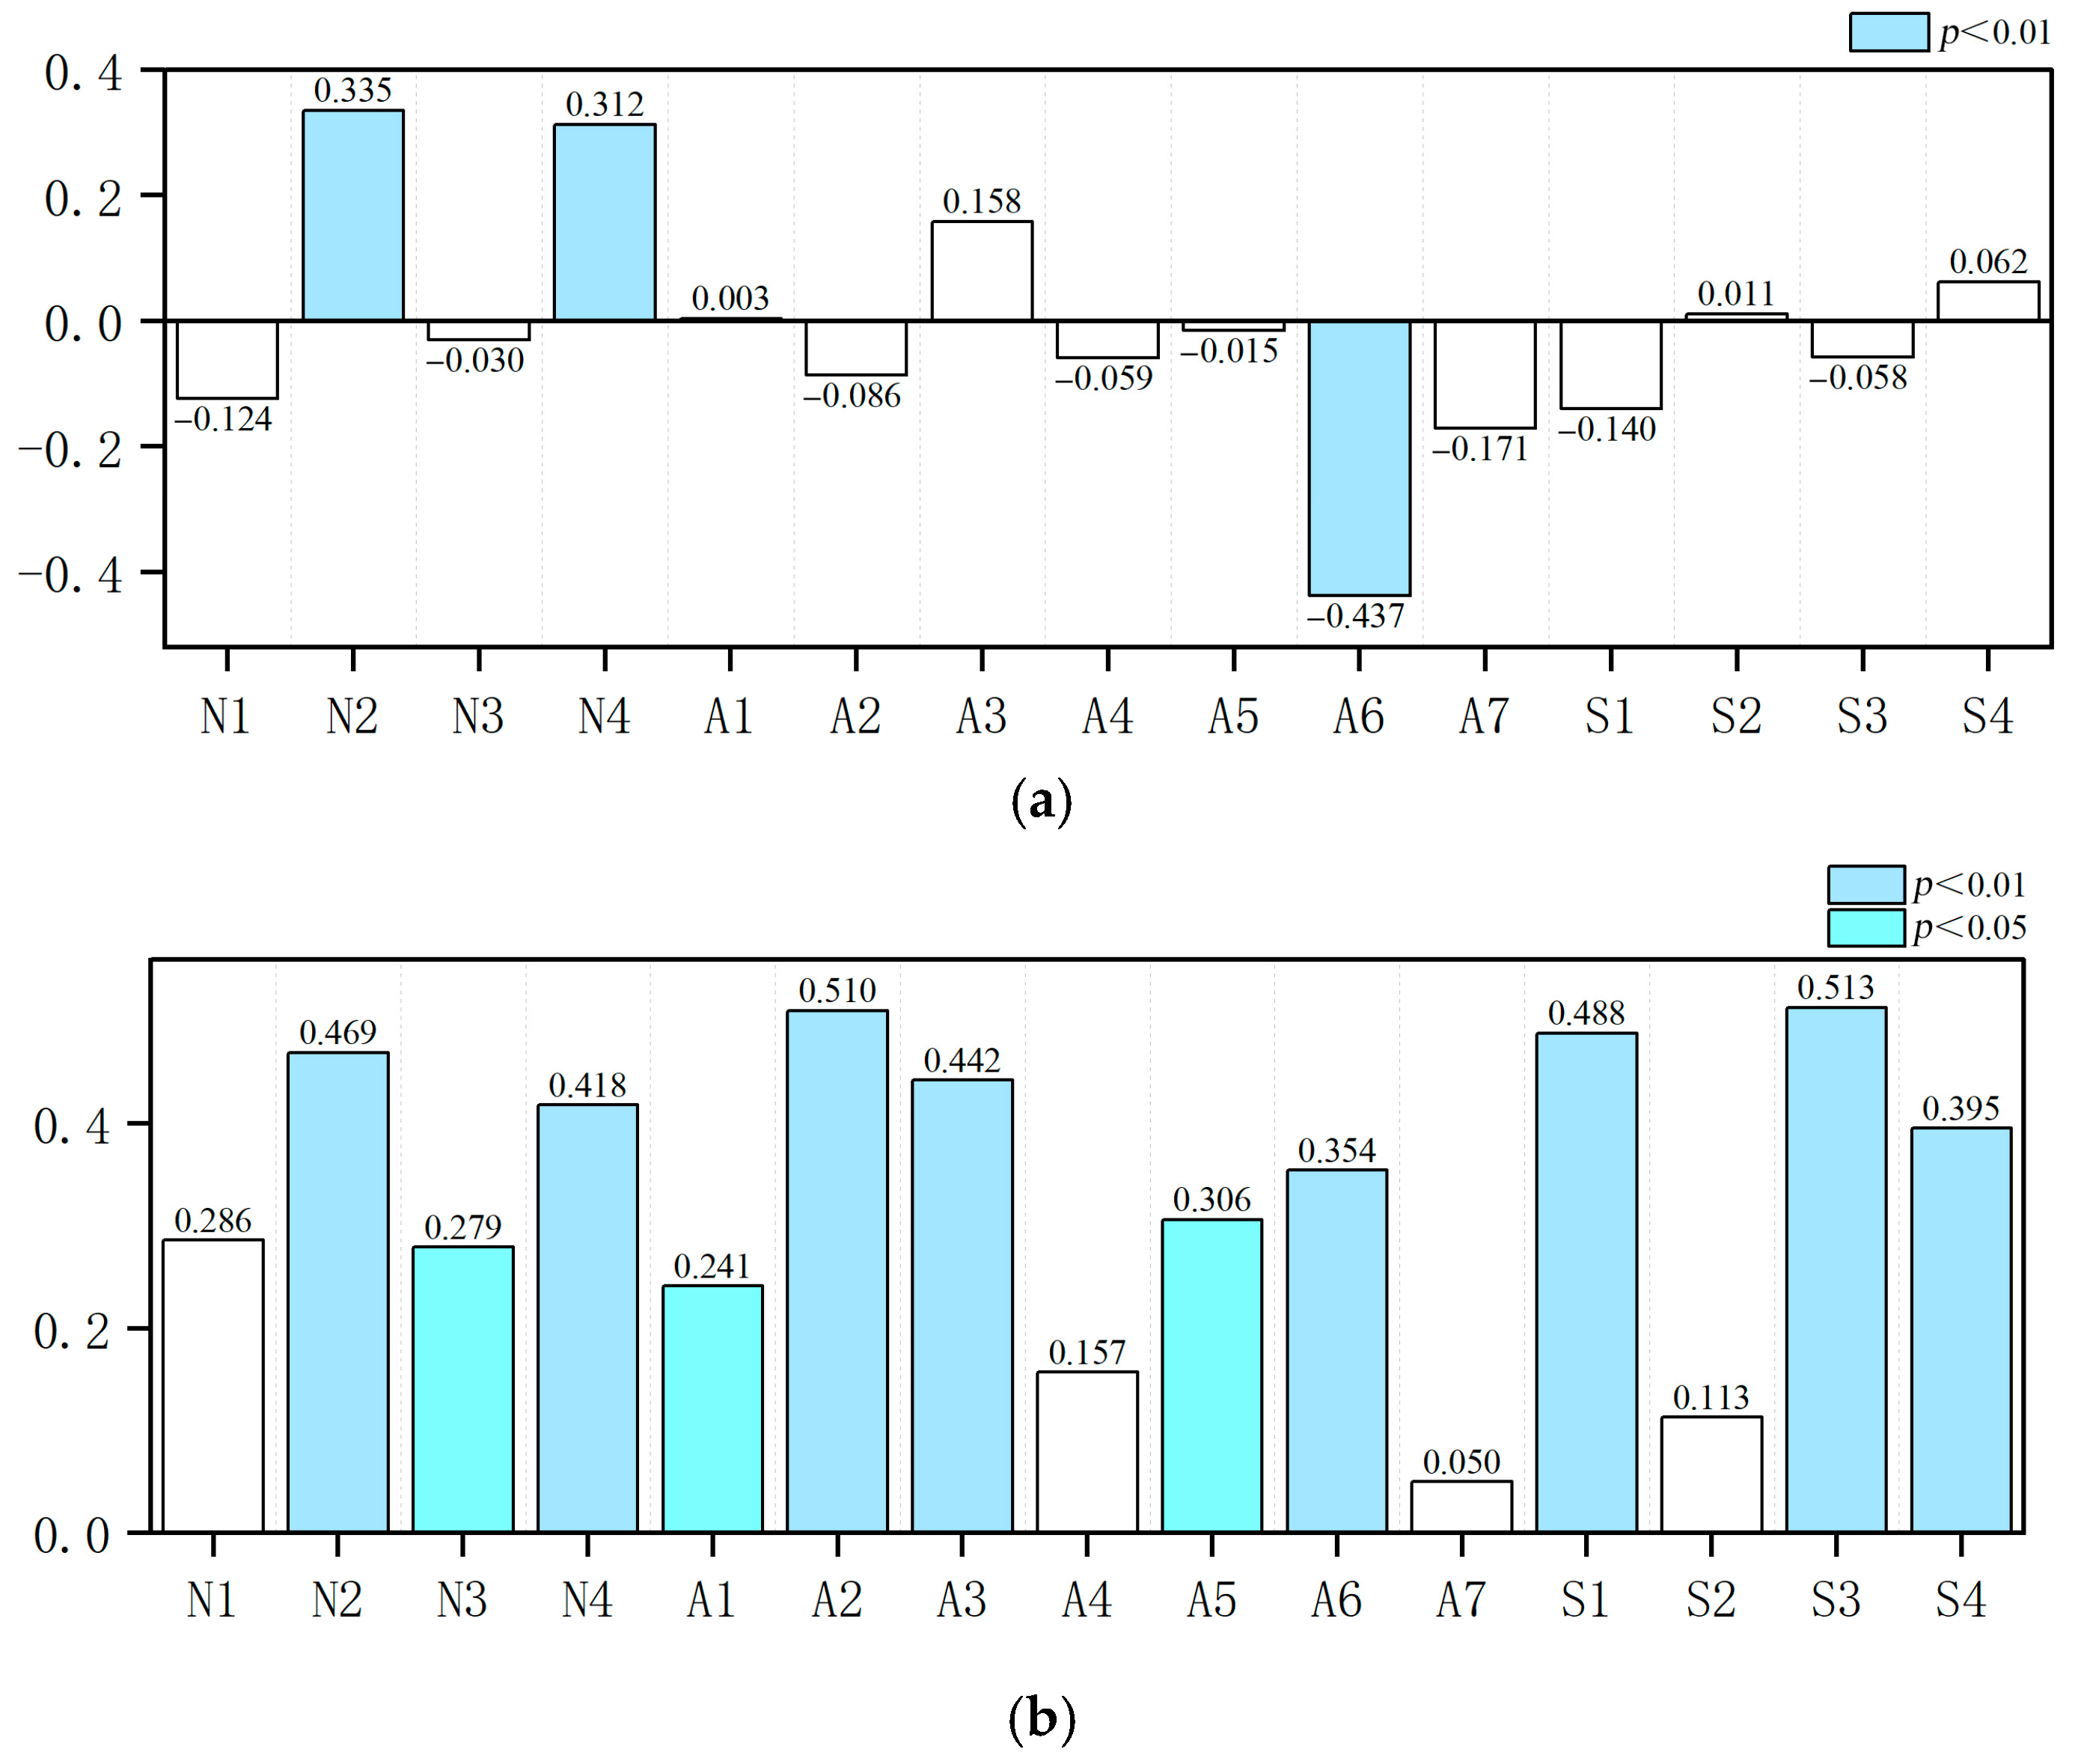
To elucidate the mechanisms by which landscape elements influence public satisfaction, this study employed dual validation through Spearman correlation analysis and multiple linear regression. Correlation analysis (Figure 11) revealed that overall UGS satisfaction was more strongly associated with element satisfaction than with element perception frequency, indicating quality-driven evaluation rather than exposure-driven recognition. Key findings include:
Figure 11.
Graphical representation of Spearman correlation. (a) Correlation coefficient between overall satisfaction and landscape element frequency. (b) Correlation coefficient between overall satisfaction and landscape element satisfaction. White bars indicate weak correlations among variables.
- Primary Drivers: Perception frequency and satisfaction of vegetation (N2), water (N4), and service facility (A6) showed significant correlations with overall satisfaction (p < 0.01);
- Secondary Influencers: Satisfaction with structures (A2), garden architecture (A3), leisure and recreational activity (S1), target audience (S3), and art and culture (S4) exhibited significant positive impacts (p < 0.01);
- Marginal Contributors: Satisfaction with animal (N3), road square (A1), and game fitness facility (A5) reached significance only at p < 0.05, with perception frequency being irrelevant;
- Non-significant Elements: Topography (N1), leisure and recreational facility (A4), management facility (A7), and fitness activity (S2) showed no statistical relevance.
Multiple linear regression was conducted using SPSS 26 to assess the relative impacts of 15 landscape elements on overall satisfaction, with missing values addressed through mean substitution.
The regression model achieved an R2 value of 0.643, indicating that approximately 64.3% of the variation in overall satisfaction is explained by the 15 landscape element variables, reflecting a moderate-to-strong explanatory capacity. The adjusted R2 (0.584) suggests that the inclusion of multiple predictors effectively enhances model performance while minimizing the risk of overfitting. Furthermore, the Durbin–Watson statistic (1.904), which is close to the ideal threshold of 2.0, confirms the absence of residual autocorrelation, implying that the residuals are randomly distributed and independent. These results collectively validate the reliability of the model and underscore the robustness of the identified key drivers—vegetation, water, garden architecture, leisure and recreational activity—in explaining public satisfaction with UGS.
Standardized regression coefficients, where larger absolute values indicate stronger explanatory power, revealed vegetation, water, garden architecture, and recreational activity as the most influential factors under p < 0.01 significance (Table 3).
Table 3.
Coefficients of independent variables of standardized regression model for landscape elements.
The regression model (Equation (2)) formalizes these relationships:
Y = 0.28X1 + 0.173X2 + 0.171X3 + 0.218X4
Y denotes the overall satisfaction with UGS, and X1, X2, X3, X4 represent satisfaction with vegetation, water, garden architecture, leisure and recreational activity, respectively. Multicollinearity tests (VIF < 1.4, Tol > 0.7) confirmed model robustness, validating the independence of predictors.
4.5. Micro-Scale Analysis: Function–Experience Disconnects in Representative Parks
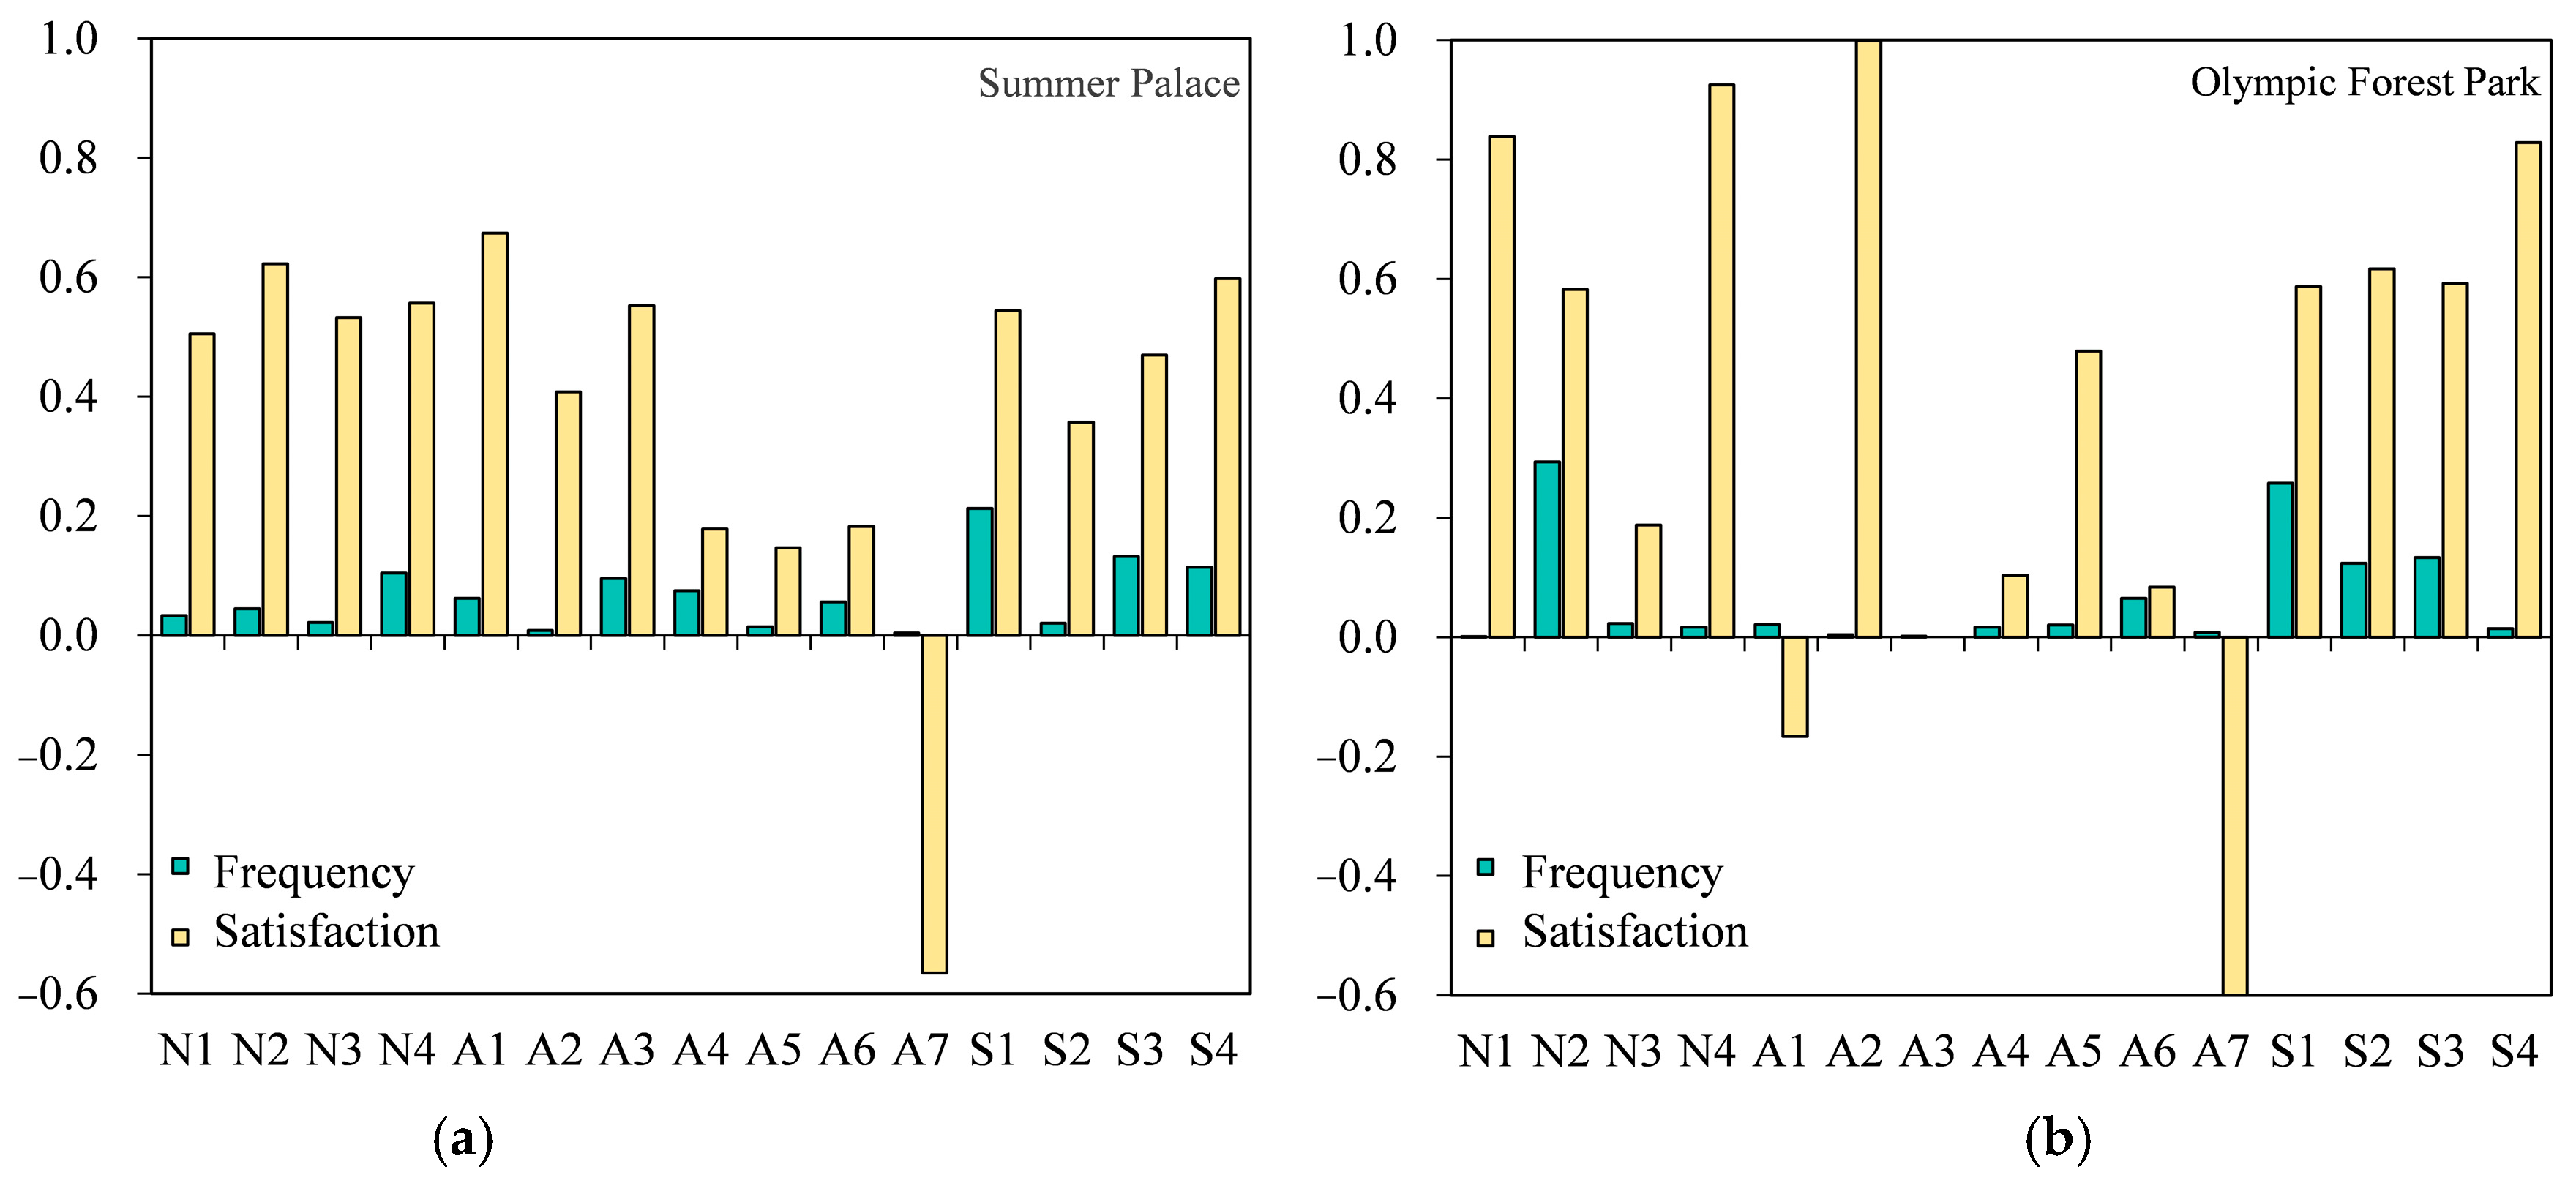
To further interpret the regression outcomes and verify the mechanisms underlying satisfaction differentiation, a micro-scale diagnostic analysis was conducted for two representative UGS: the Summer Palace and Olympic Forest Park. These cases illustrate how discrepancies between resource endowment and experiential translation shape satisfaction outcomes.
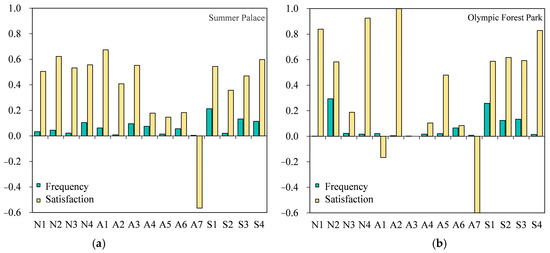
The Summer Palace, a UNESCO World Heritage Site, exhibits a paradoxical disconnect between its monumental heritage value and visitor experience. Element-specific diagnostics (Figure 12a) reveal that leisure and recreational facilities (A4), service facilities (A6), and management facilities (A7) are primary detractors, reflecting a gap between preservation and perception. The findings suggest that heritage protection must evolve from physical conservation toward experiential enhancement to sustain user satisfaction.
Figure 12.
Perception frequency and satisfaction of landscape elements in the Summer Palace and Olympic Forest Park: (a) the Summer Palace; (b) the Olympic Forest Park.
Similarly, the Olympic Forest Park—though boasting 95.61% green coverage—demonstrates functional imbalances that limit experiential translation. Low satisfaction with animal (N3) and negative evaluations of road square (A1) and management facilities (A7) indicate that ecological abundance alone does not guarantee perceived quality (Figure 12b). These results align with the regression findings that functional and service-related elements have weaker effects on satisfaction despite their high visibility.
The relationship between perception frequency (public attention) and satisfaction provides dual insights: strong positive correlations validate successful landscape design, while negative correlations, particularly in high-attention elements of the Summer Palace, indicate misalignment between visitor expectations and actual experience, necessitating management recalibration.
These micro-scale results reinforce the macro-level and statistical findings, confirming that satisfaction depends not merely on ecological quantity or visibility but on the coherence between functional provision, experiential design, and perceived value.
5. Discussions
5.1. The Performance Advantage of BERT in Social Media Sentiment Analysis
This study validates BERT’s superiority in social media sentiment analysis [13,49] through comparative benchmarking of TextCNN (73.2% accuracy), BiLSTM (68.4%), and BERT (84.4%) (Table 2). Mechanistically, BERT’s bidirectional Transformer architecture [81] captures global semantic dependencies via self-attention, resolving BiLSTM’s limitations in long-term dependency modeling [82]. Performance-wise, our findings align with the cross-disciplinary findings of Alves et al. [83](BERT accuracy: 82.64% and 78.75%) while highlighting domain-specific characteristics of UGS—public prioritization of natural elements (e.g., vegetation, water bodies) over artificial facilities [84]. This necessitates domain adaptation strategies (e.g., landscape-specific lexicons) akin to Gururangan et al. (2020)’s domain-adaptive pretraining in biomedicine [85]. To address deployment barriers, knowledge distillation [82] compresses BERT-base into TinyBERT, reducing inference time while retaining accuracy, and SHAP interpretability [86] quantifies the impact of key terms (e.g., “crowding,” “greening rate”), ensuring both transparency and efficiency in urban governance applications.
5.2. Adaptive UGS Planning Through Perception Integration
Conventional studies on UGS often adopt macro-level approaches that obscure the nuanced relationships between specific landscape elements and public satisfaction. This study employs a multi-scale analytical approach to decode public perception of UGS: Macro-scale spatial visualization of 107 sites exposes structural contradictions; Micro-scale diagnostics of individual parks identify functional deficiencies; Pattern-recognition scale deconstructs perceptual logic through landscape element clustering. Together, they establish a comprehensive “spatial pattern-individual function-element combination” framework.
5.2.1. Macro Scale: Systemic Imbalance in Green Space Configuration
At the macro scale, the low-satisfaction clustering in the primary Green Belt parks (Figure 9) reveals a planning inertia of “prioritizing quantity over quality”—despite meeting coverage targets, 36% Type 4 (element-balanced) sites suffer from homogenization, reducing UGS to infrastructural fillers rather than emotional anchors. This correlates with the “copy-paste” design mentality prevalent in urban planning. With Fengtai District and southern Chaoyang exhibiting critically low satisfaction in artificial elements (e.g., pavements, management infrastructure), necessitating targeted investments to bridge regional disparities. Conversely, Dongcheng and Xicheng Districts demonstrate exemplary performance, leveraging well-preserved historical contexts and vegetation maintenance to achieve high satisfaction. Notably, Haidian’s unexpectedly low socio-cultural perception despite its cultural heritage status, and Shijingshan’s underrated natural elements despite abundant resources, expose fundamental mismatches between resource allocation and public perception—a critical challenge for equitable UGS development.
5.2.2. Micro Scale: Function-Experience Disconnects in Individual Parks
Micro-scale analysis confirms that satisfaction depends on the translation of spatial resources into perceptible experience rather than their quantity. In both the Summer Palace and Olympic Forest Park, low satisfaction with management and service facilities indicates that heritage or ecological abundance alone cannot ensure experiential quality. Negative correlations between perception frequency and satisfaction further confirm that frequently noticed but poorly managed elements amplify dissatisfaction—a mechanism consistent with macro-scale findings that balanced yet homogenized landscapes (Type 4) yield weak emotional resonance.
In sum, micro-scale analysis highlights that adaptive UGS planning must go beyond resource supply to focus on experience transformation and perception-based management, aligning physical form with public expectations to bridge the gap between provision and satisfaction.
5.2.3. Pattern Recognition Scale: Divergent Efficacy of Element Combinations
The pattern-recognition analysis translates complex relationships among landscape elements into actionable typologies, revealing divergent efficacy across spatial configurations. Among the four clusters, nature-dominant parks (Type 1, 13%) achieve the highest satisfaction, affirming the “less-is-more” ecological esthetic principle. Socio-cultural–artificial hybrids (Type 3) exhibit synergistic effects, where artificial facilities enhance social vibrancy by enabling cultural activities rather than functioning as isolated attractions. In contrast, the “balance paradox” of Type 4 shows that evenly distributed elements dilute spatial identity and weaken experiential depth.
Integrating these findings, this study proposes an adaptive governance framework linking perception monitoring, element rating, and strategy generation. Macro-scale analyses guide systemic rectification, micro-scale diagnostics enable precision interventions, and pattern-level insights inform differentiated configurations. Through iterative data updates and GIS simulations, fragmented user feedback can be transformed into a multi-tiered decision system—combining spatial equity, functional optimization, and perceptual synergy—to advance UGS renewal from “green presence” to “green excellence”.
5.3. Landscape Elements Influencing UGS Satisfaction
The spatial mapping of satisfaction across 107 UGS in Beijing reveals residents’ overall positive perceptions, consistent with previous findings and highlighting the effectiveness of long-term ecological strategies. Building on this context, the integration of BERT-ECT models allows a finer dissection of satisfaction drivers, advancing beyond traditional macro-scale analyses. Results show that natural elements, particularly vegetation and water, exert the strongest influence on satisfaction, confirming the universal psychological benefits of contact with nature. At the same time, artificial elements such as garden architecture and recreational facilities, although less frequently perceived, play a latent but significant role in enhancing satisfaction by enabling cultural engagement, echoing theories of space–behavior interdependence. Importantly, the observed asymmetry between perception frequency and satisfaction impact underscores the need for quality-centered planning: simple expansion of green space area may not improve perceptions without corresponding improvements in experiential quality, as exemplified by underperforming sites that lack biodiversity or cultural expression. These insights suggest that future UGS management should prioritize high-impact elements such as vegetation maintenance and water quality, integrate cultural and ecological dimensions through experience-oriented design, and adopt dynamic monitoring systems leveraging social media data. Overall, the findings challenge the doctrine of comprehensive element coverage and emphasize adaptive, quality-driven approaches to urban green space planning.
6. Conclusions
6.1. Key Findings
This study unveils the complex mechanisms of public perception in high-density UGS through multi-scale data integration and landscape perception modeling. Key findings demonstrate that natural elements (vegetation, water) serve as core drivers of satisfaction, with significant positive correlations between their perception frequency and satisfaction (p < 0.01), while artificial elements (service facility, management facility) exhibit high-frequency but low-satisfaction patterns, revealing a “functional supply–experiential quality” disconnect. Socio-cultural elements (leisure and recreational facility, art and culture) indirectly enhance place identity through social interactions, though their effectiveness is strongly context-dependent. The study proposes a differentiated governance framework—“protective reinforcement, targeted optimization, experiential activation, and redundancy transformation”—providing empirical solutions to combat “green homogenization”.
Theoretically, integrating the ECT framework with fine-grained social media analytics enables indirect quantification of “expectation-experience gaps,” overcoming the static limitations of conventional satisfaction research and offering methodological support for dynamic adaptive planning. Practically, the data-driven monitoring system (e.g., early warnings for high-frequency but low-satisfaction elements) and context-sensitive optimization strategies (e.g., cultural narrative enhancement in historic districts) facilitate transitioning UGS from “quantity compliance” to “value-added experiences”.
Nevertheless, limitations persist: data constraints—social media data from a single platform (Dianping) and city (Beijing) may overrepresent younger, educated demographics and exhibit “positivity bias”, potentially inflating satisfaction scores; methodological gaps—unstructured SMD’s comparability with structured surveys remains unexamined, despite known issues like sample selection bias and spatial coverage limits; ecological oversight—neglecting biodiversity conservation and climate resilience metrics.
Future research should adopt hybrid methods (e.g., SMD-survey-remote sensing integration) to validate model generalizability across platforms (WeChat, Xiaohongshu) and cities, and quantify intergenerational preferences through discrete choice experiments; enhance ecological synergy by coupling perception data with remote sensing indices (e.g., NDVI, land surface temperature); optimize decision frameworks—in resource-constrained contexts, prioritize comparative SMD-survey studies to clarify methodological boundaries (e.g., SMD for youth preferences vs. interviews for elderly needs). Bridging “perception-behavior-policy” interactions remains pivotal for advancing human-centric green space planning.
6.2. Theoretical and Methodological Contributions
Theoretically, integrating ECT with landscape perception modeling establishes a novel paradigm for interpreting how public expectations align with experiential realities. The ECT-based framework effectively quantifies “expectation–experience gaps”, identifying vegetation (N2) and water (N4) as core satisfaction drivers while revealing latent conflicts in management facilities. Moreover, coupling ECT with BERT-based sentiment analysis enables fine-grained differentiation between symbolic expectations (e.g., heritage identity) and functional experiences (e.g., facility maintenance), extending the applicability of ECT to built-environment studies and promoting human-centered UGS planning.
Methodologically, this research develops a comprehensive “SMD acquisition–BERT analysis–lexicon quantification” pipeline that integrates multi-source SMD for dynamic monitoring of public perceptions. The BERT-based framework significantly improves the interpretation of nuanced and contradictory sentiment expressions compared with traditional models, while the lexicon of 3658 landscape elements, constructed using Word2Vec expansion, effectively addresses semantic sparsity and supports multi-scale analysis. Together, these innovations advance urban perception studies toward a data-intelligence–driven research paradigm.
6.3. Limitations and Future Research Directions
This study has several limitations. First, reliance on social media data may introduce sampling bias, as online users are generally younger and more digitally active, limiting representativeness. Second, satisfaction can also be affected by contextual factors such as population density, season, and microclimate, whereas this study focused mainly on internal landscape composition to isolate perceptual mechanisms. Third, the proposed landscape perception framework requires further evaluation of its scalability and transferability beyond the Beijing context.
Future studies will integrate multi-source data—including surveys, remote sensing, and official statistics—to enhance data diversity and model validation. External environmental variables will be incorporated to develop a more comprehensive satisfaction model. Moreover, cross-regional and cross-cultural comparisons will test the framework’s generalizability, facilitating its application to diverse urban environments and supporting adaptive green space governance.
Author Contributions
Conceptualization, R.Y.; methodology, R.Y., W.K., B.W. and Z.L.; software, R.Y. and J.L.; validation, R.Y. and B.W.; formal analysis, R.Y.; investigation, R.Y.; resources, B.W. and Z.L.; data curation, R.Y. and Y.L.; writing—original draft preparation, R.Y. and W.K.; writing—review and editing, R.Y., W.K., Y.L. and J.L.; visualization, R.Y. and J.L.; supervision, Z.L.; project administration, Z.L.; funding acquisition, Z.L. All authors have read and agreed to the published version of the manuscript.
Funding
This research was funded by the National Major Science and Technology Projects of China, grant number 2018ZX07101005.
Institutional Review Board Statement
Not applicable.
Informed Consent Statement
Not applicable.
Data Availability Statement
The data presented in this study are available on request from the corresponding author due to privacy and platform policy restrictions.
Conflicts of Interest
The authors declare no conflicts of interest.
Abbreviations
The following abbreviations are used in this manuscript:
| UGS | Urban green space |
| ECT | Expectation Confirmation Theory |
| BERT | Bidirectional Encoder Representations from Transformers |
| SMD | Social media data |
References
- Sun, Z.; Lu, Y.; Di, W.; Ta, N.; Wu, J. Spatial variability in the pathways of green space quality on life satisfaction—Mediating effects based on domain satisfaction. J. Environ. Manag. 2024, 370, 122524. [Google Scholar] [CrossRef] [Scilit]
- Reyes-Riveros, R.; Altamirano, A.; De La Barrera, F.; Rozas-Vásquez, D.; Vieli, L.; Meli, P. Linking public urban green spaces and human well-being: A systematic review. Urban For. Urban Green. 2021, 61, 127105. [Google Scholar] [CrossRef] [Scilit]
- Jennings, V.; Larson, L.; Yun, J. Advancing Sustainability through Urban Green Space: Cultural Ecosystem Services, Equity, and Social Determinants of Health. Int. J. Environ. Res. Public Health 2016, 13, 196. [Google Scholar] [CrossRef] [Scilit]
- Fang, X.; Li, J.; Ma, Q. Integrating green infrastructure, ecosystem services and nature-based solutions for urban sustainability: A comprehensive literature review. Sustain. Cities Soc. 2023, 98, 104843. [Google Scholar] [CrossRef] [Scilit]
- Palliwoda, J.; Priess, J. What do people value in urban green? Linking characteristics of urban green spaces to users’ perceptions of nature benefits, disturbances, and disservices. Ecol. Soc. 2021, 26, 28. [Google Scholar] [CrossRef] [Scilit]
- Noszczyk, T.; Gorzelany, J.; Kukulska-Kozieł, A.; Hernik, J. The impact of the COVID-19 pandemic on the importance of urban green spaces to the public. Land Use Policy 2022, 113, 105925. [Google Scholar] [CrossRef] [Scilit] [PubMed]
- Addas, A.; Maghrabi, A. How did the COVID-19 pandemic impact urban green spaces? A multi-scale assessment of Jeddah megacity (Saudi Arabia). Urban For. Urban Green. 2022, 69, 127493. [Google Scholar] [CrossRef] [Scilit] [PubMed]
- Tate, C.; Wang, R.; Akaraci, S.; Burns, C.; Garcia, L.; Clarke, M.; Hunter, R. The contribution of urban green and blue spaces to the United Nation’s Sustainable Development Goals: An evidence gap map. Cities 2024, 145, 104706. [Google Scholar] [CrossRef] [Scilit]
- Haaland, C.; van den Bosch, C.K. Challenges and strategies for urban green-space planning in cities undergoing densification: A review. Urban For. Urban Green. 2015, 14, 760–771. [Google Scholar] [CrossRef] [Scilit]
- Biernacka, M.; Łaszkiewicz, E.; Kronenberg, J. Park availability, accessibility, and attractiveness in relation to the least and most vulnerable inhabitants. Urban For. Urban Green. 2022, 73, 127585. [Google Scholar] [CrossRef] [Scilit]
- Kabisch, N. Ecosystem service implementation and governance challenges in urban green space planning—The case of Berlin, Germany. Land Use Policy 2015, 42, 557–567. [Google Scholar] [CrossRef] [Scilit]
- Wolch, J.R.; Byrne, J.; Newell, J.P. Urban green space, public health, and environmental justice: The challenge of making cities ‘just green enough’. Landsc. Urban Plan. 2014, 125, 234–244. [Google Scholar] [CrossRef] [Scilit]
- Huai, S.; Liu, S.; Zheng, T.; Van de Voorde, T. Are social media data and survey data consistent in measuring park visitation, park satisfaction, and their influencing factors? A case study in Shanghai. Urban For. Urban Green. 2023, 81, 127869. [Google Scholar] [CrossRef] [Scilit]
- Sun, Y.; Shao, Y. Measuring visitor satisfaction toward peri-urban green and open spaces based on social media data. Urban For. Urban Green. 2020, 53, 126709. [Google Scholar] [CrossRef] [Scilit]
- Li, J.; Fu, J.; Gao, J.; Zhou, R.; Zhao, Z.; Yang, P.; Yi, Y. How do urban green space attributes affect visitation and satisfaction? An empirical study based on multisource data. Cities 2025, 156, 105543. [Google Scholar] [CrossRef] [Scilit]
- Zhao, Y.; van den Berg, P.E.W.; Ossokina, I.V.; Arentze, T.A. How do urban parks, neighborhood open spaces, and private gardens relate to individuals’ subjective well-being: Results of a structural equation model. Sustain. Cities Soc. 2024, 101, 105094. [Google Scholar] [CrossRef] [Scilit]
- Grilli, G.; Mohan, G.; Curtis, J. Public park attributes, park visits, and associated health status. Landsc. Urban Plan. 2020, 199, 103814. [Google Scholar] [CrossRef] [Scilit]
- Wang, Z.; Zhu, Z.; Xu, M.; Qureshi, S. Fine-grained assessment of greenspace satisfaction at regional scale using content analysis of social media and machine learning. Sci. Total Environ. 2021, 776, 145908. [Google Scholar] [CrossRef] [Scilit]
- Yang, L.; Wu, Q.; Lyu, J. Which affects park satisfaction more, environmental features or spatial pattern? Landsc. Ecol. 2025, 40, 60. [Google Scholar] [CrossRef] [Scilit]
- Zhang, W.; Su, Y. Perception study of urban green spaces in Singapore urban parks: Spatio-temporal evaluation and the relationship with land cover. Urban For. Urban Green. 2024, 99, 128455. [Google Scholar] [CrossRef] [Scilit]
- Huai, S.; Van de Voorde, T. Which environmental features contribute to positive and negative perceptions of urban parks? A cross-cultural comparison using online reviews and Natural Language Processing methods. Landsc. Urban Plan. 2022, 218, 104307. [Google Scholar] [CrossRef] [Scilit]
- Liu, W.; Hu, X.; Song, Z.; Yuan, X. Identifying the integrated visual characteristics of greenway landscape: A focus on human perception. Sustain. Cities Soc. 2023, 99, 104937. [Google Scholar] [CrossRef] [Scilit]
- Kothencz, G.; Blaschke, T. Urban parks: Visitors’ perceptions versus spatial indicators. Land Use Policy 2017, 64, 233–244. [Google Scholar] [CrossRef] [Scilit]
- Rajeh, M.T.; Abduljabbar, F.H.; Alqahtani, S.M.; Waly, F.J.; Alnaami, I.; Aljurayyan, A.; Alzaman, N. Students’ satisfaction and continued intention toward e-learning: A theory-based study. Med. Educ. Online 2021, 26, 1961348. [Google Scholar] [CrossRef] [Scilit]
- Chou, S.-W.; Min, H.-T.; Chang, Y.-C.; Lin, C.-T. Understanding continuance intention of knowledge creation using extended expectation–confirmation theory: An empirical study of Taiwan and China online communities. Behav. Inf. Technol. 2010, 29, 557–570. [Google Scholar] [CrossRef] [Scilit]
- Shiau, W.-L.; Luo, M.M. Continuance intention of blog users: The impact of perceived enjoyment, habit, user involvement and blogging time. Behav. Inf. Technol. 2013, 32, 570–583. [Google Scholar] [CrossRef] [Scilit]
- He, H.; Sun, R.; Li, J.; Li, W. Urban landscape and climate affect residents’ sentiments based on big data. Appl. Geogr. 2023, 152, 102902. [Google Scholar] [CrossRef] [Scilit]
- Komossa, F.; Wartmann, F.M.; Kienast, F.; Verburg, P.H. Comparing outdoor recreation preferences in peri-urban landscapes using different data gathering methods. Landsc. Urban Plan. 2020, 199, 103796. [Google Scholar] [CrossRef] [Scilit]
- Wilkins, E.J.; Van Berkel, D.; Zhang, H.; Dorning, M.A.; Beck, S.M.; Smith, J.W. Promises and pitfalls of using computer vision to make inferences about landscape preferences: Evidence from an urban-proximate park system. Landsc. Urban Plan. 2022, 219, 104315. [Google Scholar] [CrossRef] [Scilit]
- Wartmann, F.M.; Baer, M.F.; Hegetschweiler, K.T.; Fischer, C.; Hunziker, M.; Purves, R.S. Assessing the potential of social media for estimating recreational use of urban and peri-urban forests. Urban For. Urban Green. 2021, 64, 127261. [Google Scholar] [CrossRef] [Scilit]
- Rui, J. Exploring the association between the Settlement Environment and Residents’ Positive Sentiments in Urban Villages and Formal Settlements in Shenzhen. Sustain. Cities Soc. 2023, 98, 104851. [Google Scholar] [CrossRef] [Scilit]
- Bhattacherjee, A. Understanding Information Systems Continuance: An Expectation-Confirmation Model. MIS Q. 2001, 25, 351–370. [Google Scholar] [CrossRef] [Scilit]
- Hossain, M.A.; Quaddus, M. Expectation–Confirmation Theory in Information System Research: A Review and Analysis. In Information Systems Theory: Explaining and Predicting Our Digital Society; Dwivedi, Y.K., Wade, M.R., Schneberger, S.L., Eds.; Springer: New York, NY, USA, 2012; Volume 1, pp. 441–469. [Google Scholar]
- Lin, T.-C.; Wu, S.; Hsu, J.S.-C.; Chou, Y.-C. The integration of value-based adoption and expectation–confirmation models: An example of IPTV continuance intention. Decis. Support Syst. 2012, 54, 63–75. [Google Scholar] [CrossRef] [Scilit]
- Lee, M.-C. Explaining and predicting users’ continuance intention toward e-learning: An extension of the expectation–confirmation model. Comput. Educ. 2010, 54, 506–516. [Google Scholar] [CrossRef] [Scilit]
- Linwei, H.; Longyu, S.; Fengmei, Y.; Xue-qin, X.; Lijie, G. Method for the evaluation of residents’ perceptions of their community based on landsenses ecology. J. Clean. Prod. 2021, 281, 124048. [Google Scholar] [CrossRef] [Scilit]
- Wartmann, F.M.; Stride, C.B.; Kienast, F.; Hunziker, M. Relating landscape ecological metrics with public survey data on perceived landscape quality and place attachment. Landsc. Ecol. 2021, 36, 2367–2393. [Google Scholar] [CrossRef] [Scilit]
- Chen, H.; Qiu, L.; Gao, T. Application of the eight perceived sensory dimensions as a tool for urban green space assessment and planning in China. Urban For. Urban Green. 2019, 40, 224–235. [Google Scholar] [CrossRef] [Scilit]
- Daniel, T.C.; Meitner, M.M. Representational validity of landscape visualizations: The effects of graphical realism on perceived scenic beauty of forest vistas. J. Environ. Psychol. 2001, 21, 61–72. [Google Scholar] [CrossRef] [Scilit]
- Benita, F.; Bansal, G.; Tunçer, B. Public spaces and happiness: Evidence from a large-scale field experiment. Health Place 2019, 56, 9–18. [Google Scholar] [CrossRef] [Scilit] [PubMed]
- Svoray, T.; Dorman, M.; Shahar, G.; Kloog, I. Demonstrating the effect of exposure to nature on happy facial expressions via Flickr data: Advantages of non-intrusive social network data analyses and geoinformatics methodologies. J. Environ. Psychol. 2018, 58, 93–100. [Google Scholar] [CrossRef] [Scilit]
- Schrammeijer, E.A.; van Zanten, B.T.; Verburg, P.H. Whose park? Crowdsourcing citizen’s urban green space preferences to inform needs-based management decisions. Sustain. Cities Soc. 2021, 74, 103249. [Google Scholar] [CrossRef] [Scilit]
- Hodorog, A.; Petri, I.; Rezgui, Y. Machine learning and Natural Language Processing of social media data for event detection in smart cities. Sustain. Cities Soc. 2022, 85, 104026. [Google Scholar] [CrossRef] [Scilit]
- Plunz, R.A.; Zhou, Y.; Carrasco Vintimilla, M.I.; McKeown, K.; Yu, T.; Uguccioni, L.; Sutto, M.P. Twitter sentiment in New York City parks as measure of well-being. Landsc. Urban Plan. 2019, 189, 235–246. [Google Scholar] [CrossRef] [Scilit]
- Ghahramani, M.; Galle, N.J.; Ratti, C.; Pilla, F. Tales of a city: Sentiment analysis of urban green space in Dublin. Cities 2021, 119, 103395. [Google Scholar] [CrossRef] [Scilit]
- Tang, Z.; Zhao, Y.; Fu, M.; Wang, Y.; Xue, J. Which factors influence public perceptions of urban attractions?—A comparative study. Ecol. Indic. 2023, 154, 110541. [Google Scholar] [CrossRef] [Scilit]
- Khurana, D.; Koli, A.; Khatter, K.; Singh, S. Natural language processing: State of the art, current trends and challenges. Multimed. Tools Appl. 2023, 82, 3713–3744. [Google Scholar] [CrossRef] [Scilit]
- Wankhade, M.; Rao, A.C.S.; Kulkarni, C. A survey on sentiment analysis methods, applications, and challenges. Artif. Intell. Rev. 2022, 55, 5731–5780. [Google Scholar] [CrossRef] [Scilit]
- Cheng, Y.; Zhang, J.; Wei, W.; Zhao, B. Effects of urban parks on residents’ expressed happiness before and during the COVID-19 pandemic. Landsc. Urban Plan. 2021, 212, 104118. [Google Scholar] [CrossRef] [Scilit]
- Yan, R.; Liao, J.; Yang, J.; Sun, W.; Nong, M.; Li, F. Multi-hour and multi-site air quality index forecasting in Beijing using CNN, LSTM, CNN-LSTM, and spatiotemporal clustering. Expert Syst. Appl. 2021, 169, 114513. [Google Scholar] [CrossRef] [Scilit]
- Liu, M.; Shibuya, Y.; Sekimoto, Y. Emotions, behaviors and places: Mapping sentiments with behaviors in Japanese tweets. Cities 2024, 155, 105449. [Google Scholar] [CrossRef] [Scilit]
- Kaur, K.; Kaur, P. Improving BERT model for requirements classification by bidirectional LSTM-CNN deep model. Comput. Electr. Eng. 2023, 108, 108699. [Google Scholar] [CrossRef] [Scilit]
- Oliver, R. Measurement and Evaluation of Satisfaction Process in Retail Settings. J. Retail. 1981, 57, 25–48. [Google Scholar]
- Fu, X.-m.; Zhang, J.-h.; Chan, F.T.S. Determinants of loyalty to public transit: A model integrating Satisfaction-Loyalty Theory and Expectation-Confirmation Theory. Transp. Res. Part A Policy Pract. 2018, 113, 476–490. [Google Scholar] [CrossRef] [Scilit]
- Chiu, W.; Zeng, S.; Cheng, P.S.-T. The influence of destination image and tourist satisfaction on tourist loyalty: A case study of Chinese tourists in Korea. Int. J. Cult. Tour. Hosp. Res. 2016, 10, 223–234. [Google Scholar] [CrossRef] [Scilit]
- Tang, H.; Liu, X.; Li, J.; Wang, H. Research on design intervention in spatial planning of traditional rural tourism: Based on the perspective of tourists’ willingness to visit again. J. Asian Archit. Build. Eng. 2025, 1–21. [Google Scholar] [CrossRef] [Scilit]
- Fornell, C.; Robinson, W. Industrial Organization and Consumer Satisfaction/Dissatisfaction. J. Consum. Res. 1983, 9, 403–412. [Google Scholar] [CrossRef] [Scilit]
- De Lima, M.M.; Mainardes, E.W.; Rodrigues, R.G. Tourist expectations and perception of service providers: A Brazilian perspective. Serv. Bus. 2020, 14, 131–166. [Google Scholar] [CrossRef] [Scilit]
- Zhang, Y.; Van den Berg, A.E.; Van Dijk, T.; Weitkamp, G. Quality over Quantity: Contribution of Urban Green Space to Neighborhood Satisfaction. Int. J. Environ. Res. Public Health 2017, 14, 535. [Google Scholar] [CrossRef] [Scilit]
- Arabatzis, G.; Grigoroudis, E. Visitors’ satisfaction, perceptions and gap analysis: The case of Dadia–Lefkimi–Souflion National Park. For. Policy Econ. 2010, 12, 163–172. [Google Scholar] [CrossRef] [Scilit]
- Chen, Y.; Hong, C.; Yang, Y.; Li, J.; Wang, Y.; Zheng, T.; Zhang, Y.; Shao, F. Mining Social Media Data to Capture Urban Park Visitors’ Perception of Cultural Ecosystem Services and Landscape Factors. Forests 2024, 15, 213. [Google Scholar] [CrossRef] [Scilit]
- Fragkias, M.; Güneralp, B.; Seto, K.C.; Goodness, J. A Synthesis of Global Urbanization Projections. In Urbanization, Biodiversity and Ecosystem Services: Challenges and Opportunities: A Global Assessment; Elmqvist, T., Fragkias, M., Goodness, J., Güneralp, B., Marcotullio, P.J., McDonald, R.I., Parnell, S., Schewenius, M., Sendstad, M., Seto, K.C., et al., Eds.; Springer: Dordrecht, The Netherlands, 2013; pp. 409–435. [Google Scholar]
- Beijing Urban Master Plan (2016–2035). Available online: https://www.beijing.gov.cn/gongkai/guihua/wngh/cqgh/201907/t20190701_100008.html (accessed on 29 September 2017).
- The Coverage Rate of the 500-Meter Service Radius of Parks and Green Spaces in the City Will Reach 91% in 2024. Available online: https://www.beijing.gov.cn/ywdt/gzdt/202401/t20240131_3550408.html (accessed on 31 January 2024).
- Beijing Municipal Landscaping Plan (2018–2035). Available online: https://yllhj.beijing.gov.cn/zwgk/ghxx/gh/202109/t20210923_2500345.shtml (accessed on 17 September 2021).
- Fu, X.; Liu, W.; Xu, Y.; Cui, L. Combine HowNet Lexicon to Train Phrase Recursive Autoencoder for Sentence-Level Sentiment Analysis. Neurocomputing 2017, 241, 18–27. [Google Scholar] [CrossRef] [Scilit]
- Liu, Y.; Xiao, S.; Wang, T.; Shi, S. Building Chinese Sentiment Lexicon Based on HowNet. Adv. Mater. Res. 2011, 187, 405–410. [Google Scholar] [CrossRef] [Scilit]
- Ku, L.-W.; Liang, Y.-T.; Chen, H.-H. Opinion Extraction, Summarization and Tracking in News and Blog Corpora. In AAAI Spring Symposium: Computational Approaches to Analyzing Weblogs; The Association for the Advancement of Artificial Intelligence: Washington, DC, USA, 2006. [Google Scholar]
- Xu, L.; Lin, H.; Pan, Y.; Ren, H.; Chen, J. Constructing the affective lexicon ontology. J. China Soc. Sci. Tech. Inf. 2008, 27, 180–185. [Google Scholar]
- Li, J. Chinese Dictionary of Praise and Depreciation. Available online: https://nlp.csai.tsinghua.edu.cn/news/112/ (accessed on 6 September 2024).
- Zakharova, N.; Lopatchenko, T. Sociocultural aspect of landscape components in the conditions of urban environment. BIO Web Conf. 2024, 113, 05034. [Google Scholar] [CrossRef] [Scilit]
- Zhang, Z.; Zhang, P.; Zhu, J. New Interpretation of Place Theories Applied into Urban Space Design Researches and the Brief Introduction on the Design Methodologies. Mod. Urban Res. 2010, 25, 29–39. [Google Scholar]
- Bertram, C.; Meyerhoff, J.; Rehdanz, K.; Wüstemann, H. Differences in the recreational value of urban parks between weekdays and weekends: A discrete choice analysis. Landsc. Urban Plan. 2017, 159, 5–14. [Google Scholar] [CrossRef] [Scilit]
- Zhu, Z. An Assessment Framework of Green Space Satisfaction Using Social Media Data: Content Analysis with MachineLearning. Master’s Thesis, Peking University, Beijing, China, 2020. [Google Scholar]
- Fu, H.; Wang, Z.; Jie, H.; Wang, L. Emotional Characteristics and Influencing Factors of Urban Park Users: A Case Study of South China Botanical Garden and Yuexiu Park. Acta Sci. Nat. Univ. Pekin. 2021, 57, 1108–1120. [Google Scholar] [CrossRef] [Scilit]
- Li, J. Study on the Influence and Driving Mechanism of Urban Green Space Landscape Patternand Ecological-Social Effect on Human Perception to Environment. PhD. Thesis, Shanghai Normal University, Shanghai, China, 2021. [Google Scholar]
- Buchel, S.; Frantzeskaki, N. Citizens’ voice: A case study about perceived ecosystem services by urban park users in Rotterdam, the Netherlands. Ecosyst. Serv. 2015, 12, 169–177. [Google Scholar] [CrossRef] [Scilit]
- Swapan, M.; Iftekhar, S.; Li, X. Contextual variations in perceived social values of ecosystem services of urban parks: A comparative study of China and Australia. Cities 2017, 61, 17–26. [Google Scholar] [CrossRef] [Scilit]
- Parks Design Specification. Available online: https://yllhj.beijing.gov.cn/zwgk/fgwj/qtwj/202006/P020200616648314043407.pdf (accessed on 5 June 2024).
- Urban Green Space Design Specification. Available online: https://www.mohurd.gov.cn/gongkai/zc/wjk/art/2016/art_17339_228081.html (accessed on 5 June 2024).
- Devlin, J.; Chang, M.-W.; Lee, K.; Toutanova, K. Bert: Pre-training of deep bidirectional transformers for language understanding. In Proceedings of the 2019 Conference of the North American Chapter of the Association for Computational Linguistics: Human Language Technologies, Minneapolis, MN, USA, 2–7 June 2019; Volume 1, pp. 4171–4186. [Google Scholar]
- Li, W.; Qi, F.; Tang, M.; Yu, Z. Bidirectional LSTM with self-attention mechanism and multi-channel features for sentiment classification. Neurocomputing 2020, 387, 63–77. [Google Scholar] [CrossRef] [Scilit]
- Alves, P.M.; Geraldo Filho, P.; Gonçalves, V.P. Leveraging BERT’s Power to Classify TTP from Unstructured Text. In Proceedings of the 2022 Workshop on Communication Networks and Power Systems (WCNPS), Fortaleza, Brazil, 17–18 November 2022; pp. 1–7. [Google Scholar]
- Qiu, Y.; Pan, H.; Kalantari, Z.; Giusti, M.; Che, S.J.E.I. The natural focus: Combining deep learning and eye-tracking to understand public perceptions of urban ecosystem aesthetics. Ecol. Indic. 2023, 156, 111181. [Google Scholar] [CrossRef] [Scilit]
- Gururangan, S.; Marasović, A.; Swayamdipta, S.; Lo, K.; Beltagy, I.; Downey, D.; Smith, N.A. Don’t stop pretraining: Adapt language models to domains and tasks. arXiv 2020, arXiv:2004.10964. [Google Scholar]
- Lundberg, S.M.; Lee, S.-I. A unified approach to interpreting model predictions. Adv. Neural Inf. Process. Syst. 2017, 30, 4768–4777. [Google Scholar]



Disclaimer/Publisher’s Note: The statements, opinions and data contained in all publications are solely those of the individual author(s) and contributor(s) and not of MDPI and/or the editor(s). MDPI and/or the editor(s) disclaim responsibility for any injury to people or property resulting from any ideas, methods, instructions or products referred to in the content. |
© 2025 by the authors. Licensee MDPI, Basel, Switzerland. This article is an open access article distributed under the terms and conditions of the Creative Commons Attribution (CC BY) license (https://creativecommons.org/licenses/by/4.0/).