Article

Corporate Sustainability Reporting and Its Influence on Brand Value: A Sectoral Analysis of Top Brands in an Emerging Market

by
Hümeyra Adıgüzel
and
Ahu Ergen
*
Faculty of Economics, Administrative and Social Sciences, Bahçeşehir University, 34353 İstanbul, Türkiye
*
Author to whom correspondence should be addressed.
Sustainability 2025, 17(22), 10108; https://doi.org/10.3390/su172210108 (registering DOI)
Submission received: 15 October 2025 / Revised: 2 November 2025 / Accepted: 7 November 2025 / Published: 12 November 2025

Abstract

This study employs a mixed-methods approach to examine the relationship between sustainability reporting and brand value in Türkiye’s most valuable brands. In the first phase, panel data regression analysis is utilized to evaluate the association between the presence of sustainability reports and firms’ brand values, with a focus on the impact of sustainability reporting on brand value over time. The findings showed that sustainability reports have a positive impact on brand value in four sectors among ten. These are construction, manufacturing, financial institutions, and wholesale & retail sectors. To better interpret these results, the second phase employs qualitative content analysis, utilizing Leximancer software (LexiDesktop 5) to analyze sustainability reports and identify evolving thematic patterns in reports across various sectors from 2020 to 2023. The results suggest that ESG reporting is evolving to become more comprehensive, multi-faceted, and responsive to sector-specific contexts, driven by heightened stakeholder attention and the continuous development of global standards. The findings provide insights into the role of sustainability reporting in shaping corporate brand value and highlight sector-specific trends in sustainability practices.

1. Introduction

Brands are considered the most valuable assets of companies [1,2]. A strong brand is regarded as an asset that facilitates the attraction of investors and access to financing. Additionally, brand value is utilized in mergers and acquisitions, as it helps determine the value of the acquired brand [3]. Numerous elements contribute to brand value. According to Aaker [4], the dimensions that constitute brand value include brand awareness, brand associations, brand loyalty, perceived quality, and other proprietary brand assets. Keller [5], on the other hand, classifies the components of brand value into brand awareness and brand associations.
To build a strong brand, adopting a holistic marketing approach is crucial. According to Keller and Kotler [6], holistic marketing comprises four components: internal marketing, integrated marketing, relationship marketing, and performance marketing. Performance marketing refers to the approach that considers the impact of a company’s marketing programs and activities on the environment, society, and the economy, that is, its sustainability impact. From this perspective, corporate sustainability performance emerges as a key determinant of brand value. Corporate sustainability performance, along with sustainability reporting as its key output, plays an important role in increasing the value and competitiveness of companies in global markets.
The number of Turkish brands that measure and report their sustainability performance based on environmental, social, and economic indicators is steadily increasing. However, according to 2023 data from Brand Finance, a leading independent brand valuation consultancy, the world’s most valuable brand, Amazon, has a brand value of $299.3 billion, approximately 19 times the total brand value of Türkiye’s top 100 brands. Currently, there is no Turkish brand among the world’s top 100 most valuable brands [7,8]. According to Brand Finance’s 2023 report, Turkish Airlines has a brand value of $2 billion, Arçelik $1.5 billion, and Vestel $927 million. For Türkiye’s economic development, there is a pressing need for strong and sustainable brands that rank high in global listings and generate greater added value. According to Article 265 of Türkiye’s 12th Development Plan, it is aimed to support branding efforts over the next five years and to ensure that at least five Turkish brands are included among the world’s top 100 most valuable brands. Article 266 of the Plan states that Türkiye aims to transform into a structure that consistently generates a trade surplus in international goods and services by offering knowledge- and technology-intensive, environmentally friendly, branded, and high value-added products and services [9].
Türkiye ratified the Paris Agreement in 2016 as part of its commitment to combat climate change, and officially put it into effect in 2021, announcing its goal to become carbon-neutral by 2053. Similarly, the European Union introduced the European Green Deal in 2019 to fight the climate crisis and support sustainable development, declaring its ambition to become the first climate-neutral continent by 2050. This goal was accompanied by a new growth strategy. The Green Deal has brought fundamental changes to the EU’s trade policies, which in turn have significantly impacted Türkiye as a major trade partner. One of the most influential developments in this context has been the introduction of the Carbon Border Adjustment Mechanism (CBAM), which has the potential to directly affect Türkiye’s trade with EU member states. Türkiye’s Green Deal Action Plan outlines 81 actions aligned with the EU’s policy priorities. These cover areas such as carbon border regulations, green and circular economy, green financing, clean, economical, and secure energy supply, sustainable agriculture, sustainable smart transportation, climate change mitigation, diplomacy, and awareness-raising activities [10]. These developments have especially brought the environmental dimension of sustainability to the forefront, more than ever before, and have begun to influence the way companies operate in Türkiye. So, corporate sustainability has become a top priority on the agenda of many companies. In a study by Aksoy [11] using a sample of 63 companies listed in the Borsa Istanbul 100 Index, it was found that brand performance is sensitive to corporate sustainability performance.
This study examines the relationship between the brand value and sustainability performance of Türkiye’s most valuable brands through panel regression analysis. Based on the results of the regression, the sustainability reports of brands from four selected sectors were further analyzed through content analysis by Leximancer.
This study makes three main contributions to the literature on sustainability and brand value. First, it advances theoretical understanding of how legitimacy, stakeholder engagement, and cognitive legitimacy mechanisms operate in emerging markets. The paper illustrates how legitimacy-building dynamics differ from those observed in developed economies by situating these frameworks within Türkiye’s transitional regulatory environment, where sustainability reporting is evolving from a voluntary to a semi-mandatory practice. Second, it provides novel empirical evidence by applying a sequential explanatory mixed-methods design that combines panel regression analysis with Leximancer-based content mapping of sustainability reports. This dual approach allows for both quantitative assessment and qualitative interpretation, revealing that the content and thematic evolution of sustainability disclosure, rather than its mere existence, drive brand value across sectors over time. Third, the study contributes practical insights for both managers and policymakers. For corporate decision-makers, the findings emphasize that high-quality, data-driven, and sector-relevant sustainability reporting strengthens stakeholder trust and enhances brand equity. For policymakers, the results support the development of sector-sensitive reporting frameworks offering guidance for the institutionalization of sustainability disclosure in emerging market contexts.

2. Literature Review and Hypothesis Development

2.1. Brand Equity and Value Drivers

Aaker [4] defines consumer-based brand equity as an intangible construct arising from marketing actions, consisting of assets and liabilities linked to brand identifiers such as the name or symbol, which can increase or decrease the perceived value of a company’s offerings. Brands that demonstrate high loyalty, strong awareness, perceived quality, and robust brand associations, as well as assets such as patents and trademarks, tend to have higher brand value [12].
Research consistently finds that firms with substantial loyal customer bases achieve greater market share and higher returns on investment [13]. Repeat purchase behavior exerts the strongest influence on brand loyalty, followed by functional and emotional values. Brand trust and affect play complementary roles in shaping both behavioral and psychological loyalty, which together drive brand equity indicators such as market share and price premium [14,15]. Qiao et al. [16] also confirm that perceived product value enhances customer-based brand equity, mediated by brand resonance and affective commitment.
Collectively, these studies demonstrate that brand value is rooted in consumer perceptions of trust, quality, and commitment and that these perceptions are increasingly shaped by firms’ social and sustainability-related behaviors.

2.2. Corporate Social Responsibility, Sustainability, and Brand Value

Corporate social responsibility (CSR) initiatives have long been recognized as strategic drivers of brand and firm value. Rahman et al. [17] demonstrate that the level of advertising intensity positively moderates the relationship between CSR and market share. Harjoto and Salas [18], drawing on strategic and legitimacy theories, show that CSR strengths proactive efforts to meet stakeholder interests enhance brand value, whereas CSR concerns diminish it. Similarly, Ajour et al. [19] find that higher levels of corporate sustainability are associated with greater brand equity, with gender diversity on the board further enhancing brand value in financial institutions.
However, the impact of CSR is not uniform. Some studies report that CSR effects are contingent upon firm visibility and reputation management. For example, CSR actions increase firm value among companies with high public visibility, but they may backfire when inconsistencies or controversies arise [20]. Advertising intensity can also weaken the CSR-value link if it creates perceptions of insincerity or greenwashing.
Together, these studies highlight that CSR and sustainability initiatives can enhance brand value but the strength and direction of this relationship depend on stakeholder perceptions, communication credibility, and the institutional context.

2.3. Sustainability Reporting and Its Link to Brand and Firm Value

Recent research has begun to explore how sustainability reporting (SR) specifically affects firm and brand value. Loh and Tan [21], analyzing the top 100 brands in Singapore, find that firms publishing sustainability reports have higher brand value than non-reporting firms, and that report quality amplifies this effect over time. Conversely, Taiwo et al. [22], studying Nigerian listed firms, report no statistically significant relationship between SR and market value growth, emphasizing the role of local institutional maturity. Kinnunen et al. [23] demonstrate that in Finland’s construction sector, strategic sustainability dimensions such as eco-innovation and marketing improve brand value through enhanced sustainability performance.
Findings remain mixed. Some studies find positive effects of SR on firm value [24,25,26], while others report neutral or negative relationships [27,28,29]. For example, Nguyen [27] finds a negative relationship between GRI adherence and firm value among German firms, suggesting that extensive disclosure can be perceived as costly signaling. Bachoo et al. [25] show that report quality matters most in environmentally sensitive industries, where markets react positively to credible disclosure. Friske et al. [30] further argue that while SR may initially act as a costly signal, it becomes value-enhancing over time as firms improve report quality and stakeholder interpretation.
Overall, the literature indicates that the relationship between sustainability reporting and brand value is context-dependent shaped by market maturity, industry characteristics, and communication credibility. These inconsistencies underscore the need for sectoral, longitudinal, and content-based analyses that capture both the existence and substance of sustainability reporting, particularly within emerging markets such as Türkiye.

2.4. Brand Valuation Methods and Relevance to This Study

Brand valuation enables companies to quantify the contribution of intangible brand assets to firm value [8]. Three major independent approaches are widely recognized: Brand Finance, Interbrand, and Kantar BrandZ. Brand Finance uses the Royalty Relief method, estimating the amount a company would pay to license its own brand by forecasting brand-specific revenues and applying sector-adjusted royalty rates [31]. Interbrand’s approach combines financial performance, the brand’s role in purchase decisions, and competitive strength [32]. Kantar BrandZ, in turn, integrates financial data with consumer perception metrics such as meaningfulness, differentiation, and salience [33].
Among these, Brand Finance’s royalty relief method has been shown to exhibit the strongest correlation with market-based measures of firm value [34]. Accordingly, this study adopts the Brand Finance brand value as the dependent variable, aligning with previous research and ensuring consistency between accounting-based and perception-based dimensions of brand equity.
Brand Finance determines brand value through the Royalty Relief method, which estimates the amount a company would theoretically pay to license its brand if it were not the owner. This approach entails forecasting the future revenues attributable to the brand and applying an appropriate royalty rate that reflects the cost of using the brand. The valuation process follows several key steps [31]:
Step 1.
Calculate Brand Strength (Brand Strength Index—BSI): Brand strength is assessed on a 0–100 scale using a balanced scorecard of attributes such as familiarity, emotional appeal, consideration, reputation, and loyalty.
Step 2.
Determine the Royalty Rate Range: An appropriate royalty rate range for the brand’s sector is identified by analyzing comparable licensing agreements from Brand Finance’s proprietary database and other public sources.
Step 3.
Calculate the Royalty Rate: The BSI score is mapped onto the royalty rate range to establish a specific royalty rate.
Step 4.
Estimate Brand-Specific Revenues: A portion of the parent company’s total revenues is attributed to the specific brand and its industry sector, isolating brand-generated income.
Step 5.
Forecast Future Brand Revenues: Brand-specific revenues are projected using historical performance data, equity analyst forecasts, and macroeconomic growth indicators.
Step 6.
Apply the Royalty Rate: The forecasted brand revenues are multiplied by the determined royalty rate to calculate the implied royalty payments for brand usage.
Step 7.
Discount to Present Value: The projected post-tax royalty streams are discounted to their net present value (NPV) using an appropriate discount rate.
On the other side, Interbrand valuations are based on three core components: an assessment of the financial performance of the branded products or services, an evaluation of the brand’s role in influencing purchase decisions, and an analysis of the brand’s competitive strength. The process begins with market segmentation and concludes by integrating these elements to determine the brand’s overall financial value [32]. Lastly, Kantar’s valuation approach places consumer perception at the core of its model, reflecting how brand equity drives shareholder value. The methodology follows a three-step process combining financial analysis with consumer-based brand equity data [33].

2.5. Summary and Research Gap

In summary, while prior studies provide valuable insights into the links among CSR, sustainability, and brand value, three major limitations persist: a lack of sectoral differentiation in analyzing these relationships, limited attention to longitudinal dynamics over time, and minimal focus on the content and substance of sustainability reporting itself.
This study directly addresses these gaps by applying a mixed-methods, sector-sensitive, and content-based approach to Türkiye’s top 100 brands between 2020 and 2023. By integrating quantitative regression with Leximancer-based content mapping, the study shows that brand value depends not on the mere existence of sustainability reports, but on how their content evolves and matures over time.

2.6. Theoretical Framework Linking Sustainability Reporting to Brand Value

The relationship between sustainability reporting and brand value can be explained through the perspectives of legitimacy theory, stakeholder engagement theory, and cognitive legitimacy theory. Legitimacy theory suggests that to maintain their existence, firms must align their activities with societal expectations and beliefs [35,36]. In this context, sustainability reporting functions as a mechanism through which companies attempt to gain legitimacy by disclosing their environmentally and socially responsible practices, thereby enhancing their brand value.
Stakeholder engagement theory emphasizes that firms are accountable not only to shareholders but also to all their stakeholders, including customers, employees, and regulatory authorities [37,38]. Sustainability reporting provides a channel of communication with these stakeholders [39]. Since stakeholder expectations may differ across industries, the impact of sustainability reporting on brand value is also expected to vary depending on the sector.
Finally, according to cognitive legitimacy theory, some practices are perceived by stakeholders as “the way things should be.” As sustainability reporting becomes a widely accepted practice among global corporations, the absence of such disclosure may be interpreted as “abnormal” or “irresponsible,” potentially leading to negative consequences for brand value [40].
Together, these theories explain how sustainability reporting contributes to brand value through different but related mechanisms. Legitimacy theory focuses on gaining social approval, stakeholder engagement theory highlights the role of transparent communication with diverse audiences, and cognitive legitimacy theory emphasizes conformity with emerging norms of responsible business.
Furthermore, the link between sustainability reporting and brand value depends on how effectively sustainability information is communicated and perceived. Companies use multiple channels, corporate websites, social media, and marketing campaigns to reach stakeholders and consumers. Prior studies [20,39,41,42,43] indicate that the credibility and visibility of these communications moderate the impact of sustainability on value. This communication and public awareness channel therefore play a crucial role in determining how legitimacy and stakeholder trust translate into brand value.
This relationship is illustrated in Figure 1, which conceptually integrates the three theoretical perspectives and shows how these mechanisms are connected through a communication and public awareness channel that determines whether legitimacy signals are effectively transmitted and perceived by stakeholders.
Beyond the general theoretical mechanisms, each framework also produces testable expectations specific to Türkiye’s institutional context.
From a legitimacy theory perspective, firms in Türkiye operate within a rapidly evolving sustainability landscape shaped by both domestic regulations and international convergence pressures. The introduction of the Turkish Sustainability Reporting Standards (TSRS1 and 2) by the Public Oversight, Accounting and Auditing Standards Authority (KGK) [44] represents a critical step toward the institutionalization of sustainability disclosure. According to this regulation, only entities listed among public-interest entities and exceeding specific thresholds are required to prepare sustainability reports starting from the 2024 fiscal year. This threshold-based and selective approach indicates that sustainability reporting in Türkiye remains partially voluntary and primarily limited to large-scale or systemically important firms. Within the framework of stakeholder engagement theory, this situation leads to varying levels of stakeholder maturity across sectors. Environmental and social expectations are more institutionalized in export-oriented, manufacturing, and financial industries, while remaining weaker in local service sectors. Therefore, the positive effect of sustainability reporting on brand value is expected to be stronger in industries with higher stakeholder pressure and public visibility, and weaker in sectors where such expectations are still emerging.
From the perspective of cognitive legitimacy theory, Türkiye represents a transitional institutional stage compared to developed countries, where sustainability reporting has become a legal and normative requirement. In Türkiye, by contrast, reporting remains largely voluntary for many firms and is only gradually gaining normative legitimacy. This distinction creates an important empirical differentiation: while the absence of sustainability disclosure in developed economies is often interpreted as a lack of responsibility, in Türkiye it may still be perceived as normal for smaller or domestically oriented firms. However, as regulatory convergence with the EU accelerates and investor expectations increase, non-disclosure is likely to be perceived progressively as a sign of irresponsibility or lack of competitiveness.
Accordingly, firms that are not yet legally required to report but voluntarily disclose sustainability information can be seen as engaging in proactive legitimacy-seeking behavior. These firms use disclosure as a reputational strategy to align with international norms and enhance credibility among global investors. This transitional context provides a unique testing ground to examine how global sustainability norms diffuse into emerging markets and how voluntary disclosure evolves into an institutionalized expectation over time.
Accordingly, this integrated framework provides a comprehensive foundation for interpreting the mixed empirical results in prior research and for testing how the impact of sustainability reporting on brand value differs across industries with varying degrees of stakeholder pressure, regulatory maturity, and public awareness. On this basis, the following hypotheses are developed to capture both the overall and sector-specific effects of sustainability disclosure on brand value.
H1: 
Sustainability reporting positively influences brand value by enhancing firms’ legitimacy, stakeholder trust, and cognitive credibility.
H2: 
The relationship between sustainability reporting and brand value varies across industries depending on the nature of stakeholder expectations and the degree of institutionalization of sustainability norms.

3. Methodology

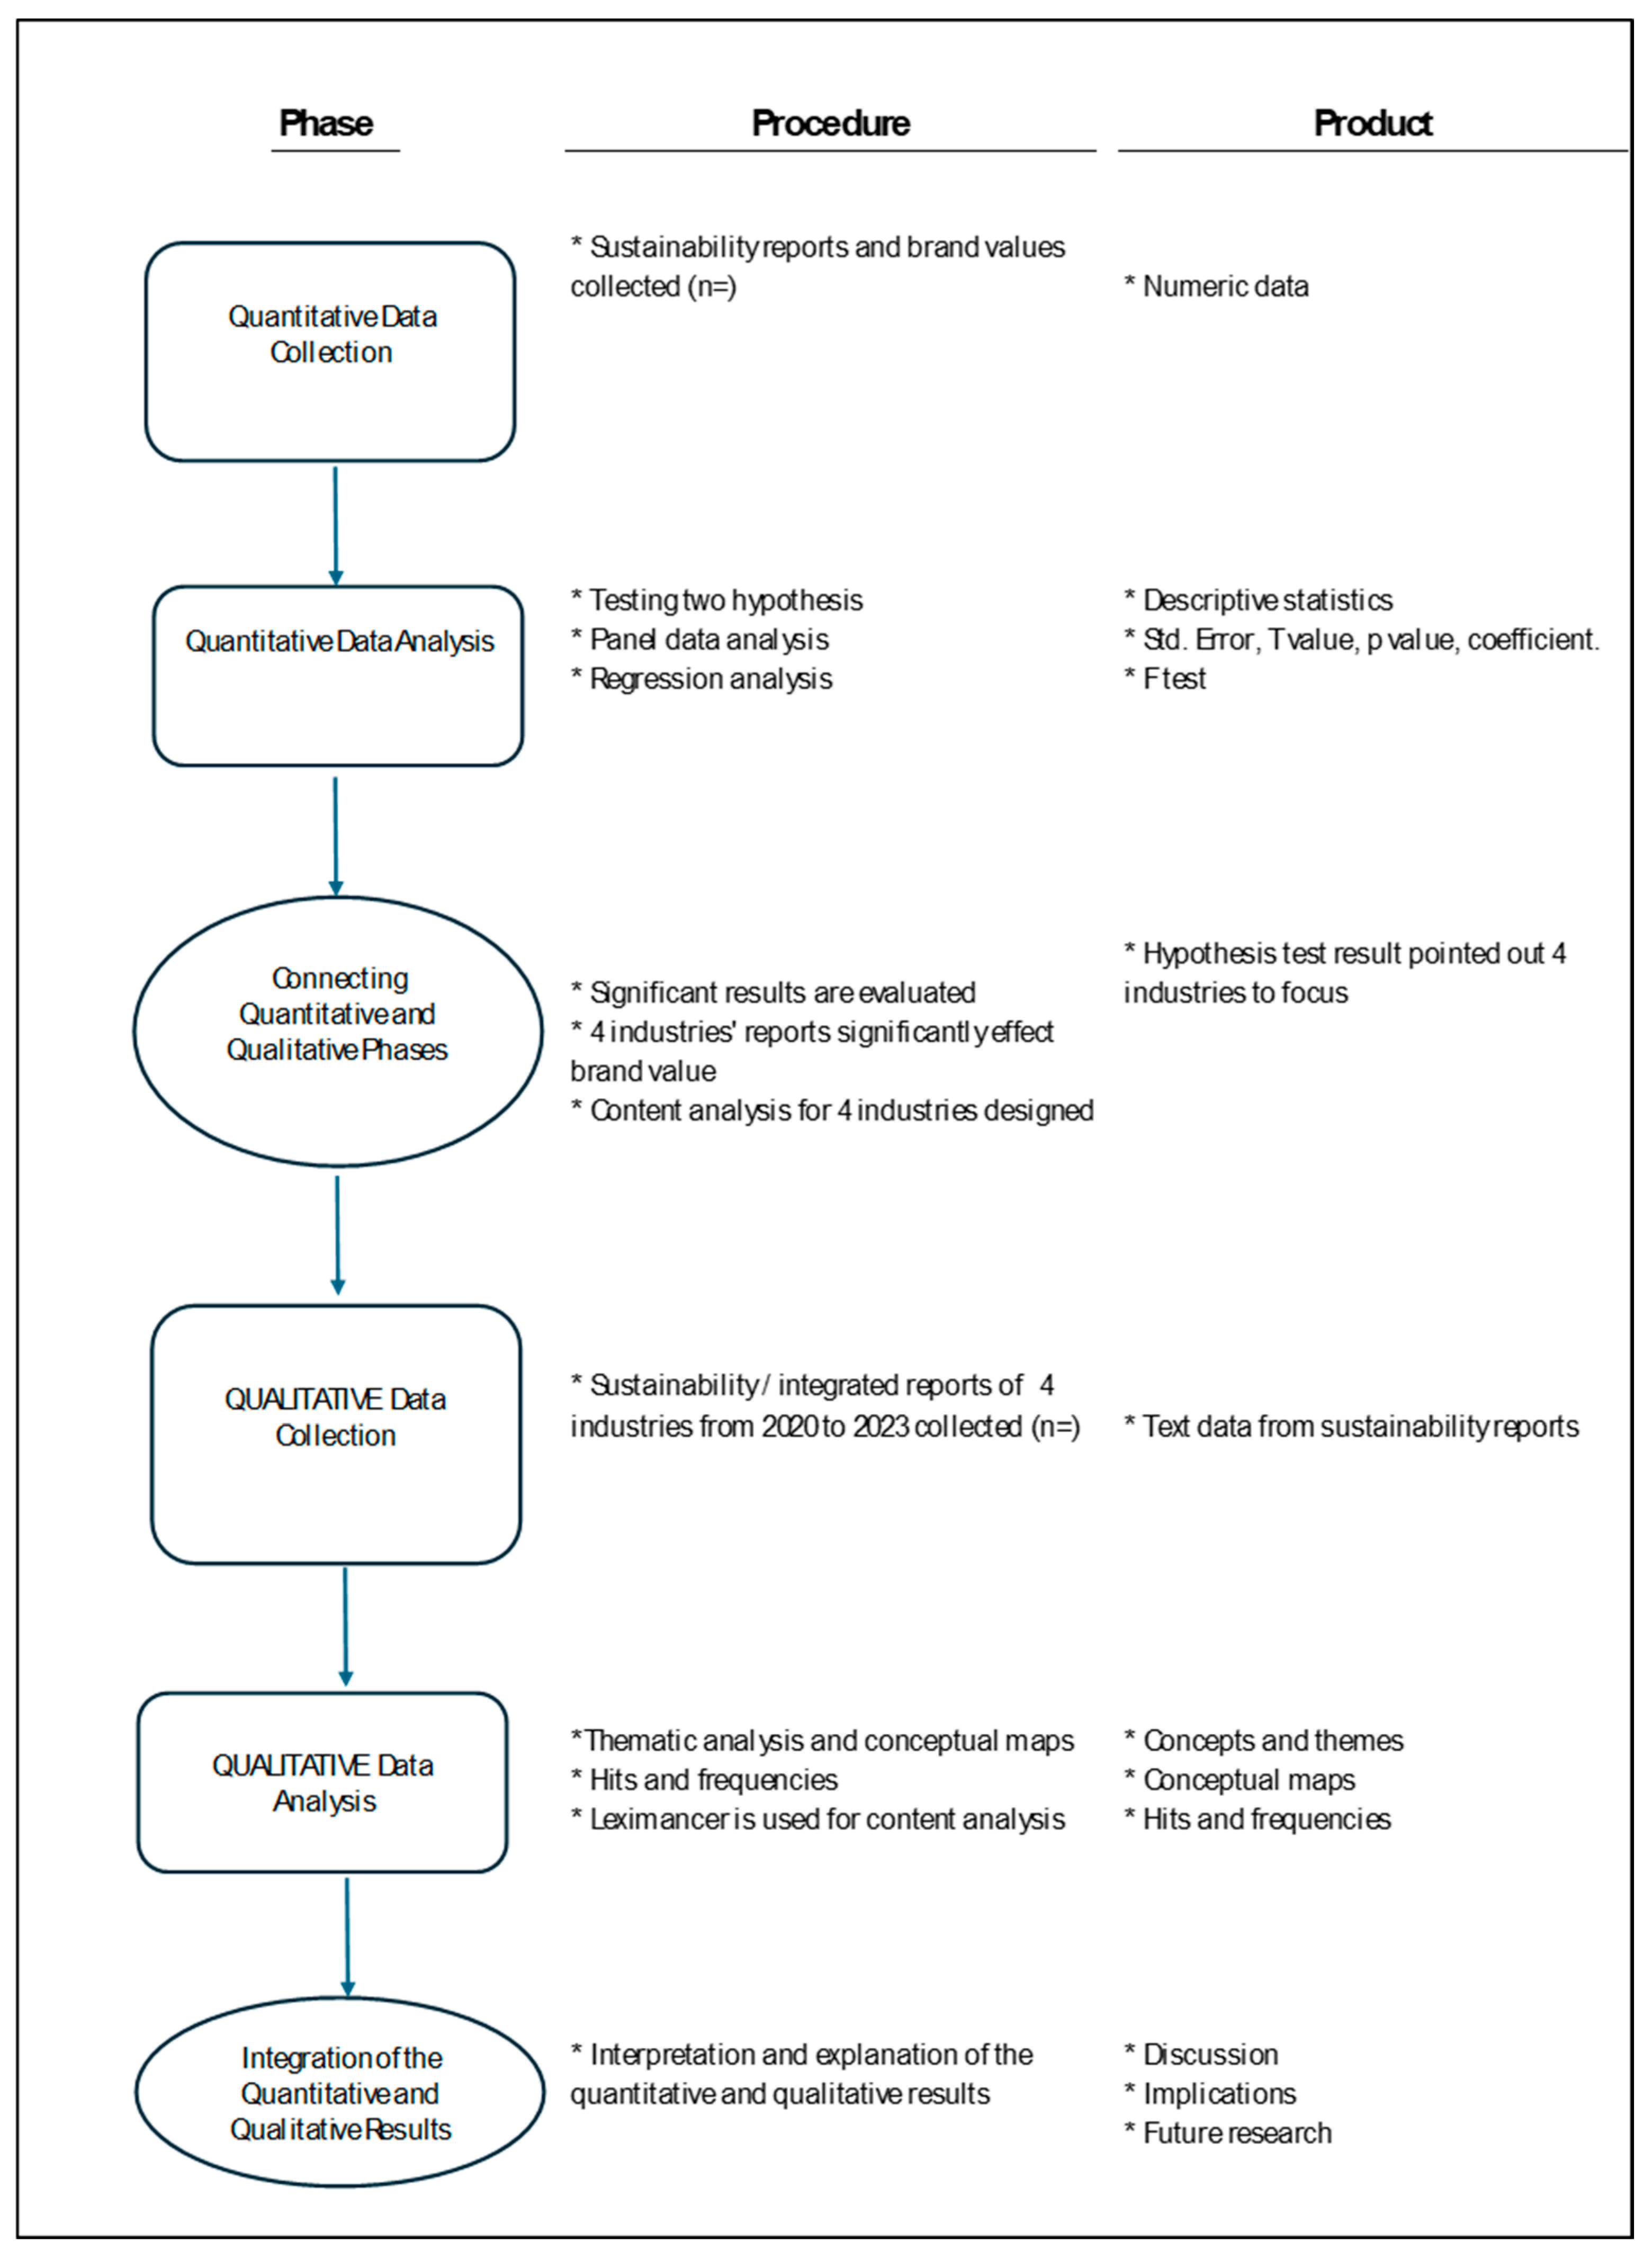
This study adopts a mixed-methods sequential explanatory design to examine the relationship between the sustainability reports of Türkiye’s most valuable brands and their respective brand values from BrandFinance [45]. According to Creswell and Creswell [46], an explanatory sequential design involves two distinct phases: initially, quantitative data is collected and analyzed, followed by the collection and analysis of qualitative data, which serves to further explain or elaborate on the quantitative findings. Figure 2 outlines the detailed steps of the research process.
In the first phase of this study, a quantitative analysis is conducted to test the hypotheses. In the second phase, a qualitative content analysis using Leximancer software (LexiDesktop5) is employed to gain deeper insights into the results through thematic exploration. The mixed method is designed to answer the research questions:
  • RQ1: Is there a relationship between the company’s brand value and the sustainability reporting?
  • RQ2: If yes, how does this relationship vary by sector?
  • RQ3: How has the thematic content of reports evolved in key sectors?

4. Results

4.1. Quantitative Research (Phase 1)

In this phase, a panel data analysis was conducted using STATA. The relationship between the publication of sustainability reports and brand values of Türkiye’s top 100 most valuable brands (as published by Brand Finance) during the period 2020–2023 was examined through panel regression analysis. Industry classification was used as a moderating variable, while firm size and leverage (debt ratio) were included as control variables. Industry acts as a moderator in the relationship between sustainability reporting and brand value. Financial data was accessible for 81 out of the 100 brands listed in the 2023 Brand Finance report. A total of 303 firm-year observations were gathered from these 81 companies. In the data set used for this study, sustainability reports were obtained for 146 firm years, of which 49 included an assurance report. Integrated reports were obtained for 65 firm years, and 43 of these included an assurance report (Table 1).
A total of 19 firms from the initial sample were not included in the analysis, as their financial data could not be obtained (Table 2).
Table 3 shows the descriptive statistics of the variables. The study includes firm size and leverage as control variables. Consistent with prior research [48,49,50], these variables are among the most common financial controls used in studies examining firm value and performance. Firm size (measured as the natural logarithm of total assets) captures scale effects and visibility, while leverage (total liabilities to total assets) reflects the firm’s financial structure and risk exposure. Financial data was obtained from companies’ audited annual reports and verified through the Public Disclosure Platform (KAP) database.
The brand value variable exhibits a wide distribution, with a mean of 227 and a median of 66. This indicates a right-skewed distribution, suggesting that some firms have exceptionally high brand values. The average leverage ratio is 1.67, with values ranging from very low (0.0021) to very high (11.90) across firms. The logarithm of total assets has a mean of 4.39 and displays a more balanced distribution.
The model was estimated using a fixed effects specification The fixed effects model is used to control for unobserved, time-invariant characteristics of each firm. If these unobserved fixed characteristics are potentially correlated with the independent variables (e.g., sustainability reporting), the fixed effects model is preferred. This approach helps to reduce such hidden biases and provides more reliable estimates.
Brand Valuei,t = α0 + β1 SRi,t + β2 ARi,t + β3 Sector Dummyi + β4 LogAssetsi,t + β4 Leveragei,t +
β5 (SRi,t × Sector Dummyi) + ui + ϵit
The analysis employs a firm fixed-effects model, which controls for all time-invariant firm-specific characteristics such as brand history, ownership structure, and managerial culture that could otherwise bias the estimated relationship between sustainability reporting and brand value. Time fixed effects were not included, as the study period (2020–2023) covers only four consecutive years. Including both firm and time effects would substantially reduce the degrees of freedom given the limited time dimension. Nevertheless, robustness tests were conducted by incorporating year dummies, and the results remained consistent, confirming the stability of the findings.
The variables in the model were measured as follows:
Dependent Variable
Brand Value: Brand value reported by Brand Finance (in million USD)
Independent Variables
SR: Sustainability reporting status (dummy variable; 1 = publishes sustainability report, 0 = does not)
AR: Sustainability assurance reporting status (dummy variable; 1 = publishes assurance report, 0 = does not)
Sector Dummy: Firm’s industry sector (categorical dummy variables; 1 = belongs to the sector, 0 = otherwise)
Interaction Variable
SR × Sector Dummy: Interaction term used to test whether the sector moderates the strength or direction of the relationship between sustainability reporting and brand value
Control Variables
LogAssets: Firm size, measured as the natural logarithm of total assets (control variable)
Leverage: Leverage ratio, calculated as total liabilities divided by total assets (control variable)
u: Firm fixed effect
ϵ: Error term
Table 4 presents the Pearson correlation coefficients among the main variables. Brand Value shows moderate and statistically significant positive correlations with SR (r = 0.281, p < 0.01), AR (r = 0.265, p < 0.01), and firm size (LogAssets, r = 0.493, p < 0.01), indicating that larger firms and those engaging in sustainability and assurance reporting tend to have higher brand values. Leverage is weakly and negatively correlated with Brand Value (r = −0.150, p < 0.05), suggesting that higher debt ratios are slightly associated with lower brand values. The intercorrelations among independent variables remain below 0.60, confirming that no serious multicollinearity is present. Spearman correlation results presented at Table 5 are also consistent with the Pearson correlations, confirming the robustness of the relationships across data types. Brand Value is positively associated with SR, AR, and firm size (LogAssets), while Leverage shows a weak negative relationship. No evidence of multicollinearity was detected, as all correlation coefficients remain below 0.60.
The regression results are shown in Table 6. A significant and negative relationship was found between the independent variable “SR” (sustainability reporting status) and the dependent variable “Brand Value”. When controlling sectoral effects, the brand values of firms that publish sustainability reports are statistically significantly lower than those of firms that do not. The significant interaction terms between “SR×Sector Dummy” and the dependent variable “Brand Value” suggest that the effect of sustainability reporting on brand value varies by sector. According to the findings, sustainability reports have a positive and statistically significant impact on brand value in the Construction, Manufacturing, Financial Institutions, and Wholesale & Retail Trade sectors. To better interpret these results obtained through panel data analysis, the content of sustainability reports was further analyzed by sector in the second phase of the study using the Leximancer software for qualitative analysis.

4.2. Qualitative Research (Phase 2)

In this phase, content analysis of the sustainability reports was conducted using the Leximancer software. The qualitative phase focused on the sectors where the quantitative analysis revealed a positive and statistically significant relationship between sustainability reporting and brand value specifically, Construction, Manufacturing, Financial Institutions, and Wholesale & Retail Trade. This sectoral focus aligns with the sequential explanatory mixed-methods design of the study, allowing for a deeper exploration of how sustainability report content and thematic patterns may explain the positive quantitative associations observed in these industries. Table 7 shows the inclusion criteria of SR and data preprocessing steps for Leximancer Analysis.
Content analysis is a suitable method for identifying patterns and trends within documents. In qualitative research, content analysis often relies on the assumption that the most frequently used words represent the most prominent ideas or themes [51]. This approach allows for the generation of concept maps and networks, enabling a holistic and comprehensive understanding of key issues [52].
Leximancer generates a dashboard of statistical outcomes derived from textual analysis. The core indicators of this report include the following: Words that frequently co-occur in similar contexts are identified as “concepts.” Groups of related concepts are clustered into “themes.” The importance of a theme is determined not only by the frequency of concepts but also by the strength of their relational connections, their co-occurrence, and linkages with other themes. Concepts are essentially clusters of words that tend to appear together in text. The “hit count” represents the raw frequency of a word-like concept within the dataset. The “count” indicates the total number of text segments (context blocks) in which the concept appears. Clicking on a concept reveals the text blocks in which it is used. The “relevance” metric reflects the relative co-occurrence of each concept compared to the most frequently occurring concept; in other words, it is the percentage of a concept’s count relative to the highest count. Therefore, the most frequent concept is always assigned a relevance of 100%, regardless of its presence in every block [53]. Concept maps visualize the analytical outcomes, highlighting the most frequently used and contextually interconnected key concepts within the text [54].
Such analysis allows for the identification of which topics organizations emphasize in the context of sustainability and how these thematic priorities evolve.
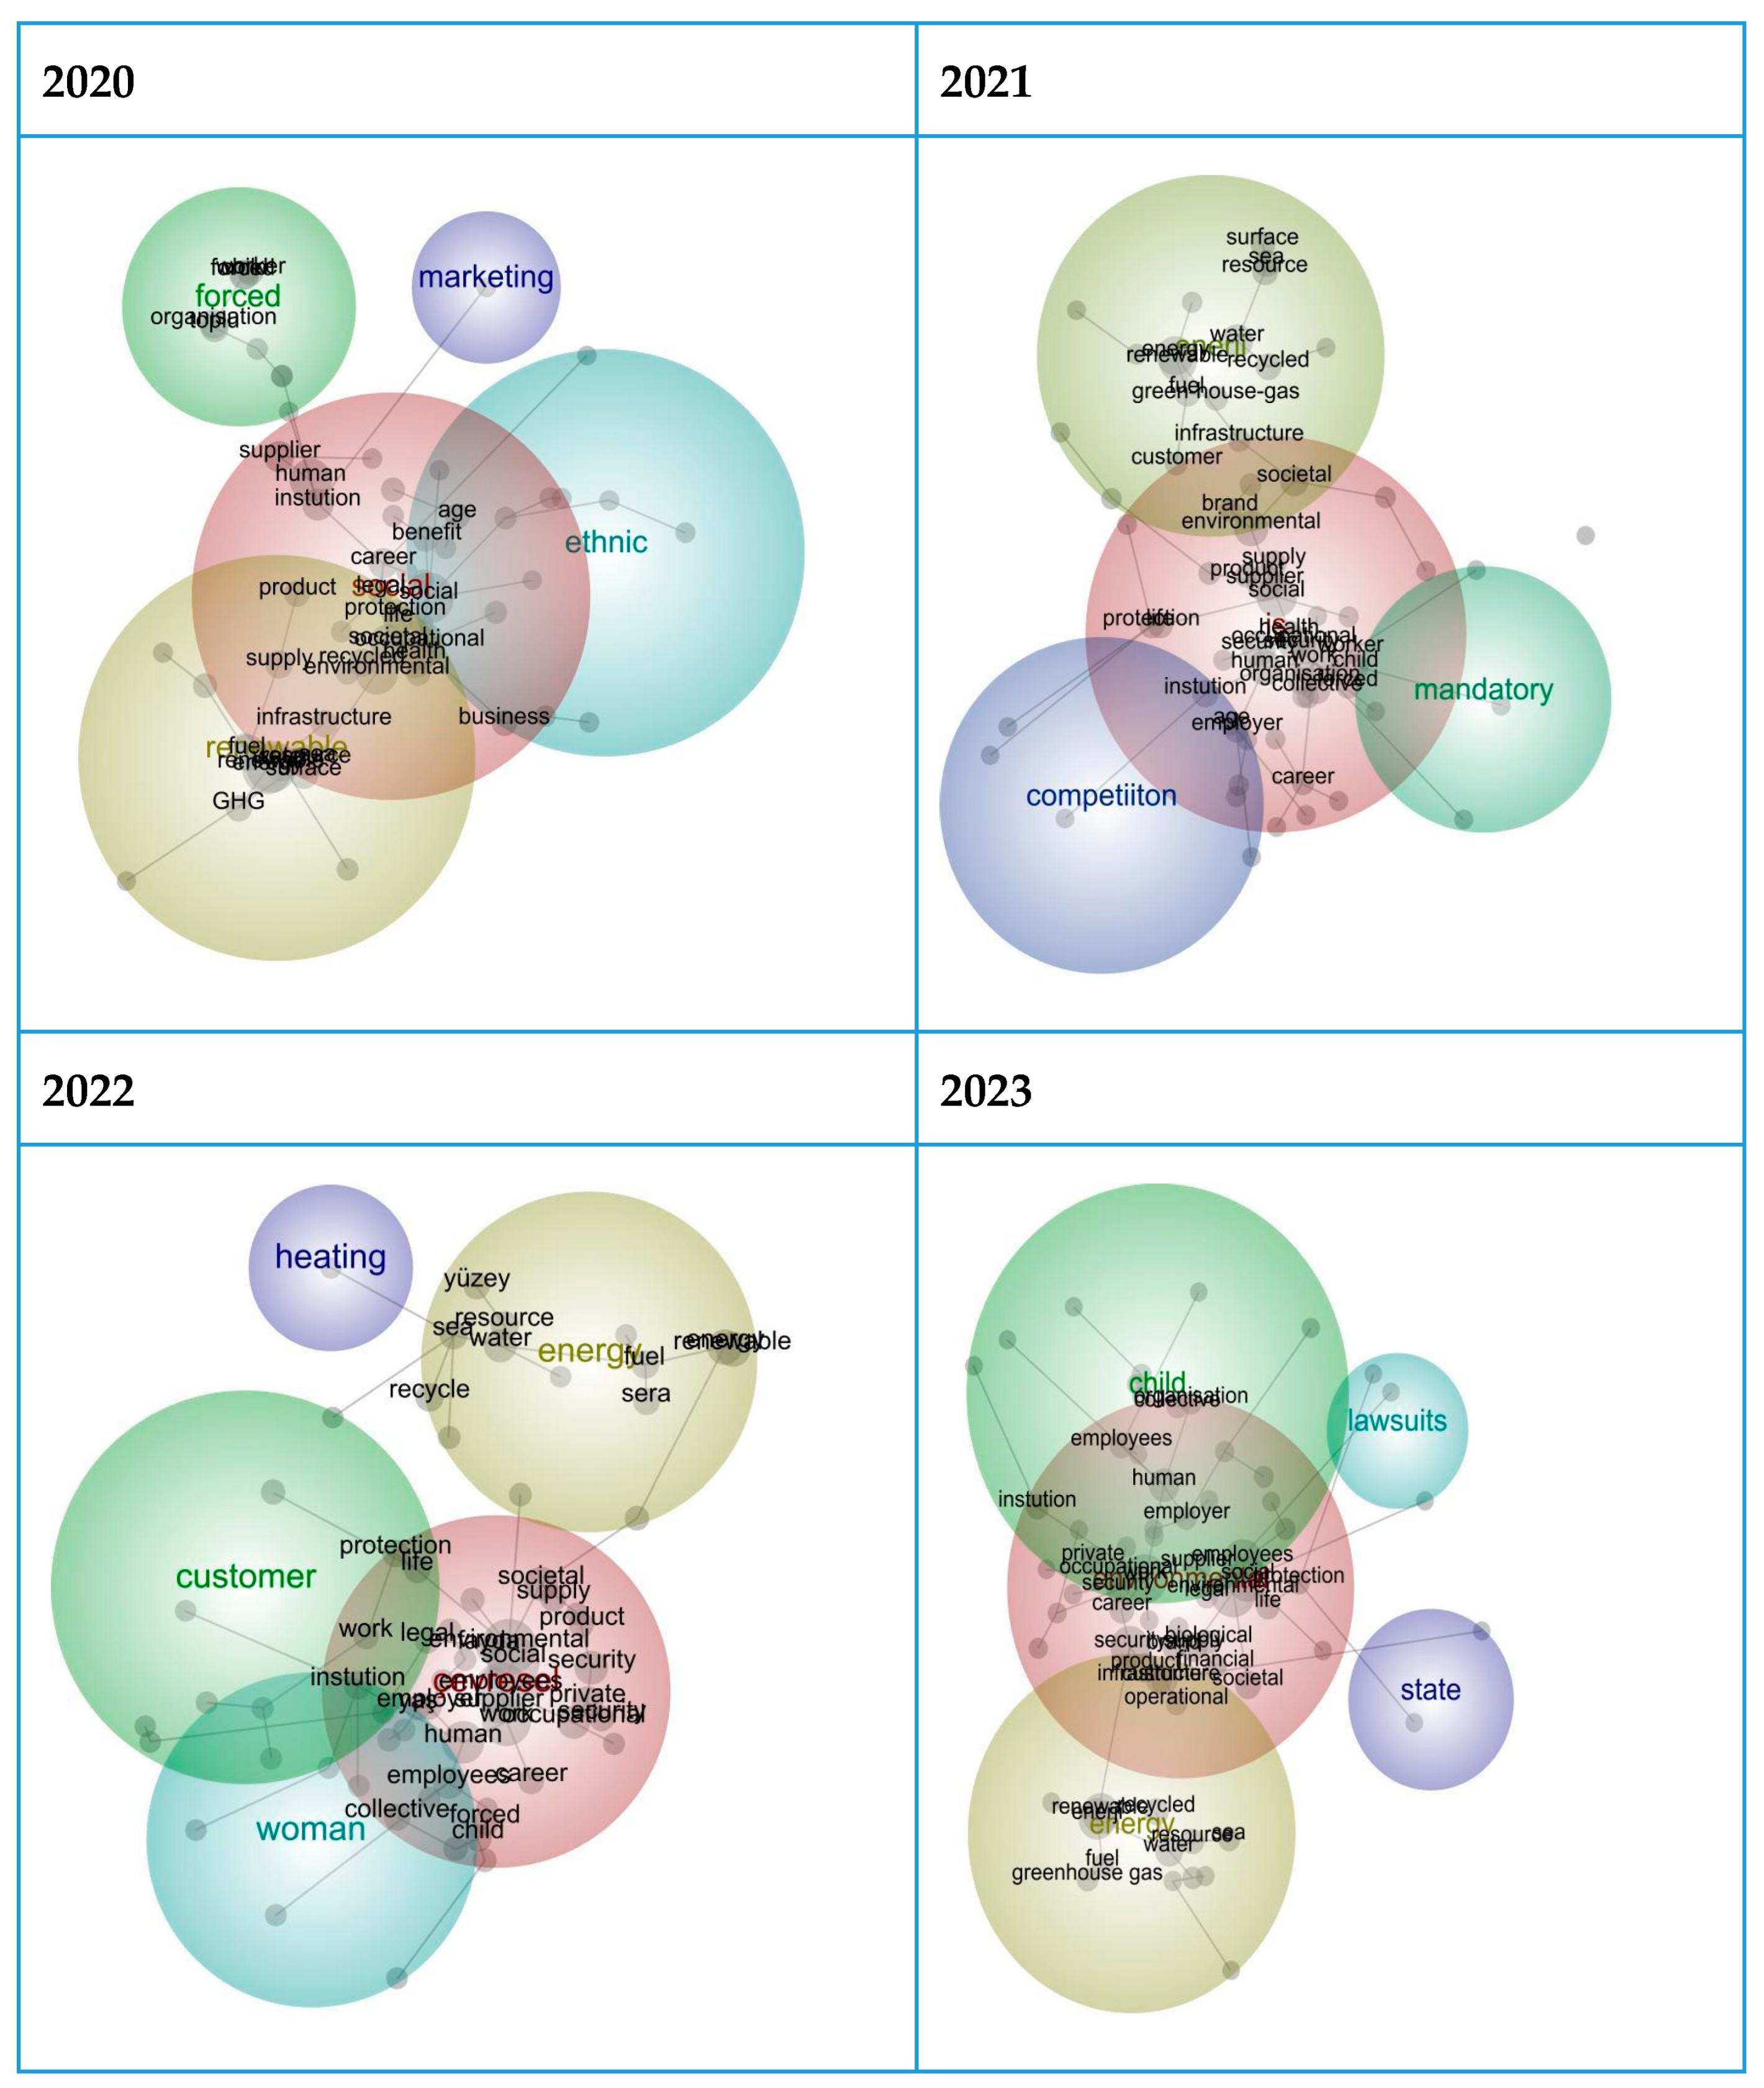
Figure 3 presents the concept maps derived from sustainability reports of the most valuable construction sector brands across four consecutive years. In the 2020 reports, five main themes emerged: social (355), renewable (127), forced (30), marketing (5), and ethnic (3). The dominant concept was “social” indicating a strong emphasis on societal impact, environmental awareness, and corporate responsibility during this initial phase. The presence of terms such as “forced” and “ethnic” suggests that sensitive issues such as labor rights, working conditions, and potential discrimination were also addressed. Overall, the sector’s discourse in 2020 appeared rooted in macro-level concerns of social responsibility and sustainability.
In 2021, the thematic focus shifted toward more operational and economic realities. The top concepts were work (488), energy (213), mandatory (6), and competition (4). Compared to the previous year, this shift reflects increased concern with workforce continuity, energy access, and market competitiveness. The relative decline in social-oriented themes may reflect the sector’s response to post-pandemic recovery pressures and realignment toward resilience and business continuity.
By 2022, environmental awareness resurfaced prominently, with environmental (456) and energy (181) dominating the reports. Emerging themes such as customer (26), women (11), and heating (4) suggest that sustainability discourse began to include more specific and nuanced issues. This year marks a transition toward a more multidimensional engagement with complex topics such as the climate crisis, gender equality, and stakeholder responsiveness.
In 2023, the environmental theme reached its highest frequency across all years, with environmental (736) being the most recurring concept. Alongside energy (274), new themes such as children (15), government (2), and lawsuits (2) began to appear, indicating a broadening of discourse into legal, political, and ethical domains. The heightened focus on environmental concerns suggests a critical tipping point, possibly driven by growing regulatory scrutiny, public pressure, and policy intervention.
In summary, the sector’s sustainability discourse evolved from broad, macro-level social themes toward more technical, legal, and sector-specific issues over time. While early reports emphasized social responsibility and renewable focus, later years displayed increasing diversification, incorporating environmental justice, children’s rights, and governmental roles. This progression reflects a shift from general sustainability awareness to more structured, multifaceted, and context-responsive communication strategies. The trajectory also aligns with external drivers such as regulatory developments and heightened public sensitivity to climate and social issues, particularly by 2023.
Figure 4 presents the concept maps derived from the sustainability reports of the most valuable financial institutions in Turkey between 2020 and 2023. The analysis reveals a clear thematic evolution from general corporate responsibility to more specific and socially charged issues, reflecting a growing maturity in non-financial reporting practices and alignment with ESG mindset.
In 2020, five main themes were identified: employees (9183), financial (5432), social (3809), mandatory (189), and donations (10). The concept “employees” was the most frequently mentioned, highlighting the sector’s early emphasis on workforce well-being during the onset of the COVID-19 pandemic. The top concepts of financial, work, safety, employees, and customer reflect a foundational concern for employee rights, internal solidarity, and financial stability. However, the relatively broad and generic nature of the themes suggests that sustainability discourse in this initial stage remained at a surface level, with limited detail and granularity.
In 2021, six dominant themes emerged: safety (10,873), financial (7954), institution (5532), social (5449), infrastructure (589), and mergers (21). The increasing prominence of “safety” points to growing attention toward occupational and digital security concerns. The emergence of terms such as institution, infrastructure, and mergers also indicates a shift toward corporate governance, strategic management, and operational continuity, hallmarks of ESG’s governance pillar. This year represents a transition from reactive pandemic-era reporting to more proactive structural sustainability efforts, incorporating governance-focused indicators into the reporting landscape. A marked thematic shift occurred in 2022, with six new themes: discrimination (20,561), safety (10,931), energy (2975), lineage (120), lawsuits (45), and violations (3). “Discrimination” emerged as the most frequently referenced concept, signaling a growing sensitivity to social equity, diversity, and inclusion. Themes such as gender, human rights, and legal accountability suggest that financial institutions began facing greater stakeholder expectations around ethical conduct and social justice. The sustained presence of energy also reflects a reinforced awareness of environmental sustainability. Compared to previous years, the 2022 reports demonstrate deeper engagement with the social and governance dimensions of ESG, moving beyond policy-level declarations into more complex and value-driven themes.
In 2023, the sector’s reporting reached a new level of specificity. The six main themes were safety (12,855), work (12,190), financial (11,872), minimum wage (753), salaries (70), and promotion (29). The consistent recurrence of safety alongside new labor-specific terms such as minimum wage, salary, and promotion highlights a transition toward greater transparency on concrete workforce policies and rights. The re-emergence of strong financial themes may also reflect economic volatility during the reporting period, prompting institutions to communicate stability and resilience. The 2023 reports suggest that organizations are no longer focusing solely on broad declarations of sustainability principles, but are beginning to disclose measurable, stakeholder-relevant indicators, particularly related to employee satisfaction, compensation equity, and internal accountability.
Taken together, the concept maps from 2020 to 2023 illustrate a distinct trend in the financial sector’s sustainability communication: from macro-level social responsibility and pandemic response, toward institutional maturity, ethical depth, and operational transparency. This evolution demonstrates not only increasing alignment with ESG frameworks but also a more deliberate effort to address complex societal expectations through detailed and credible sustainability narratives.
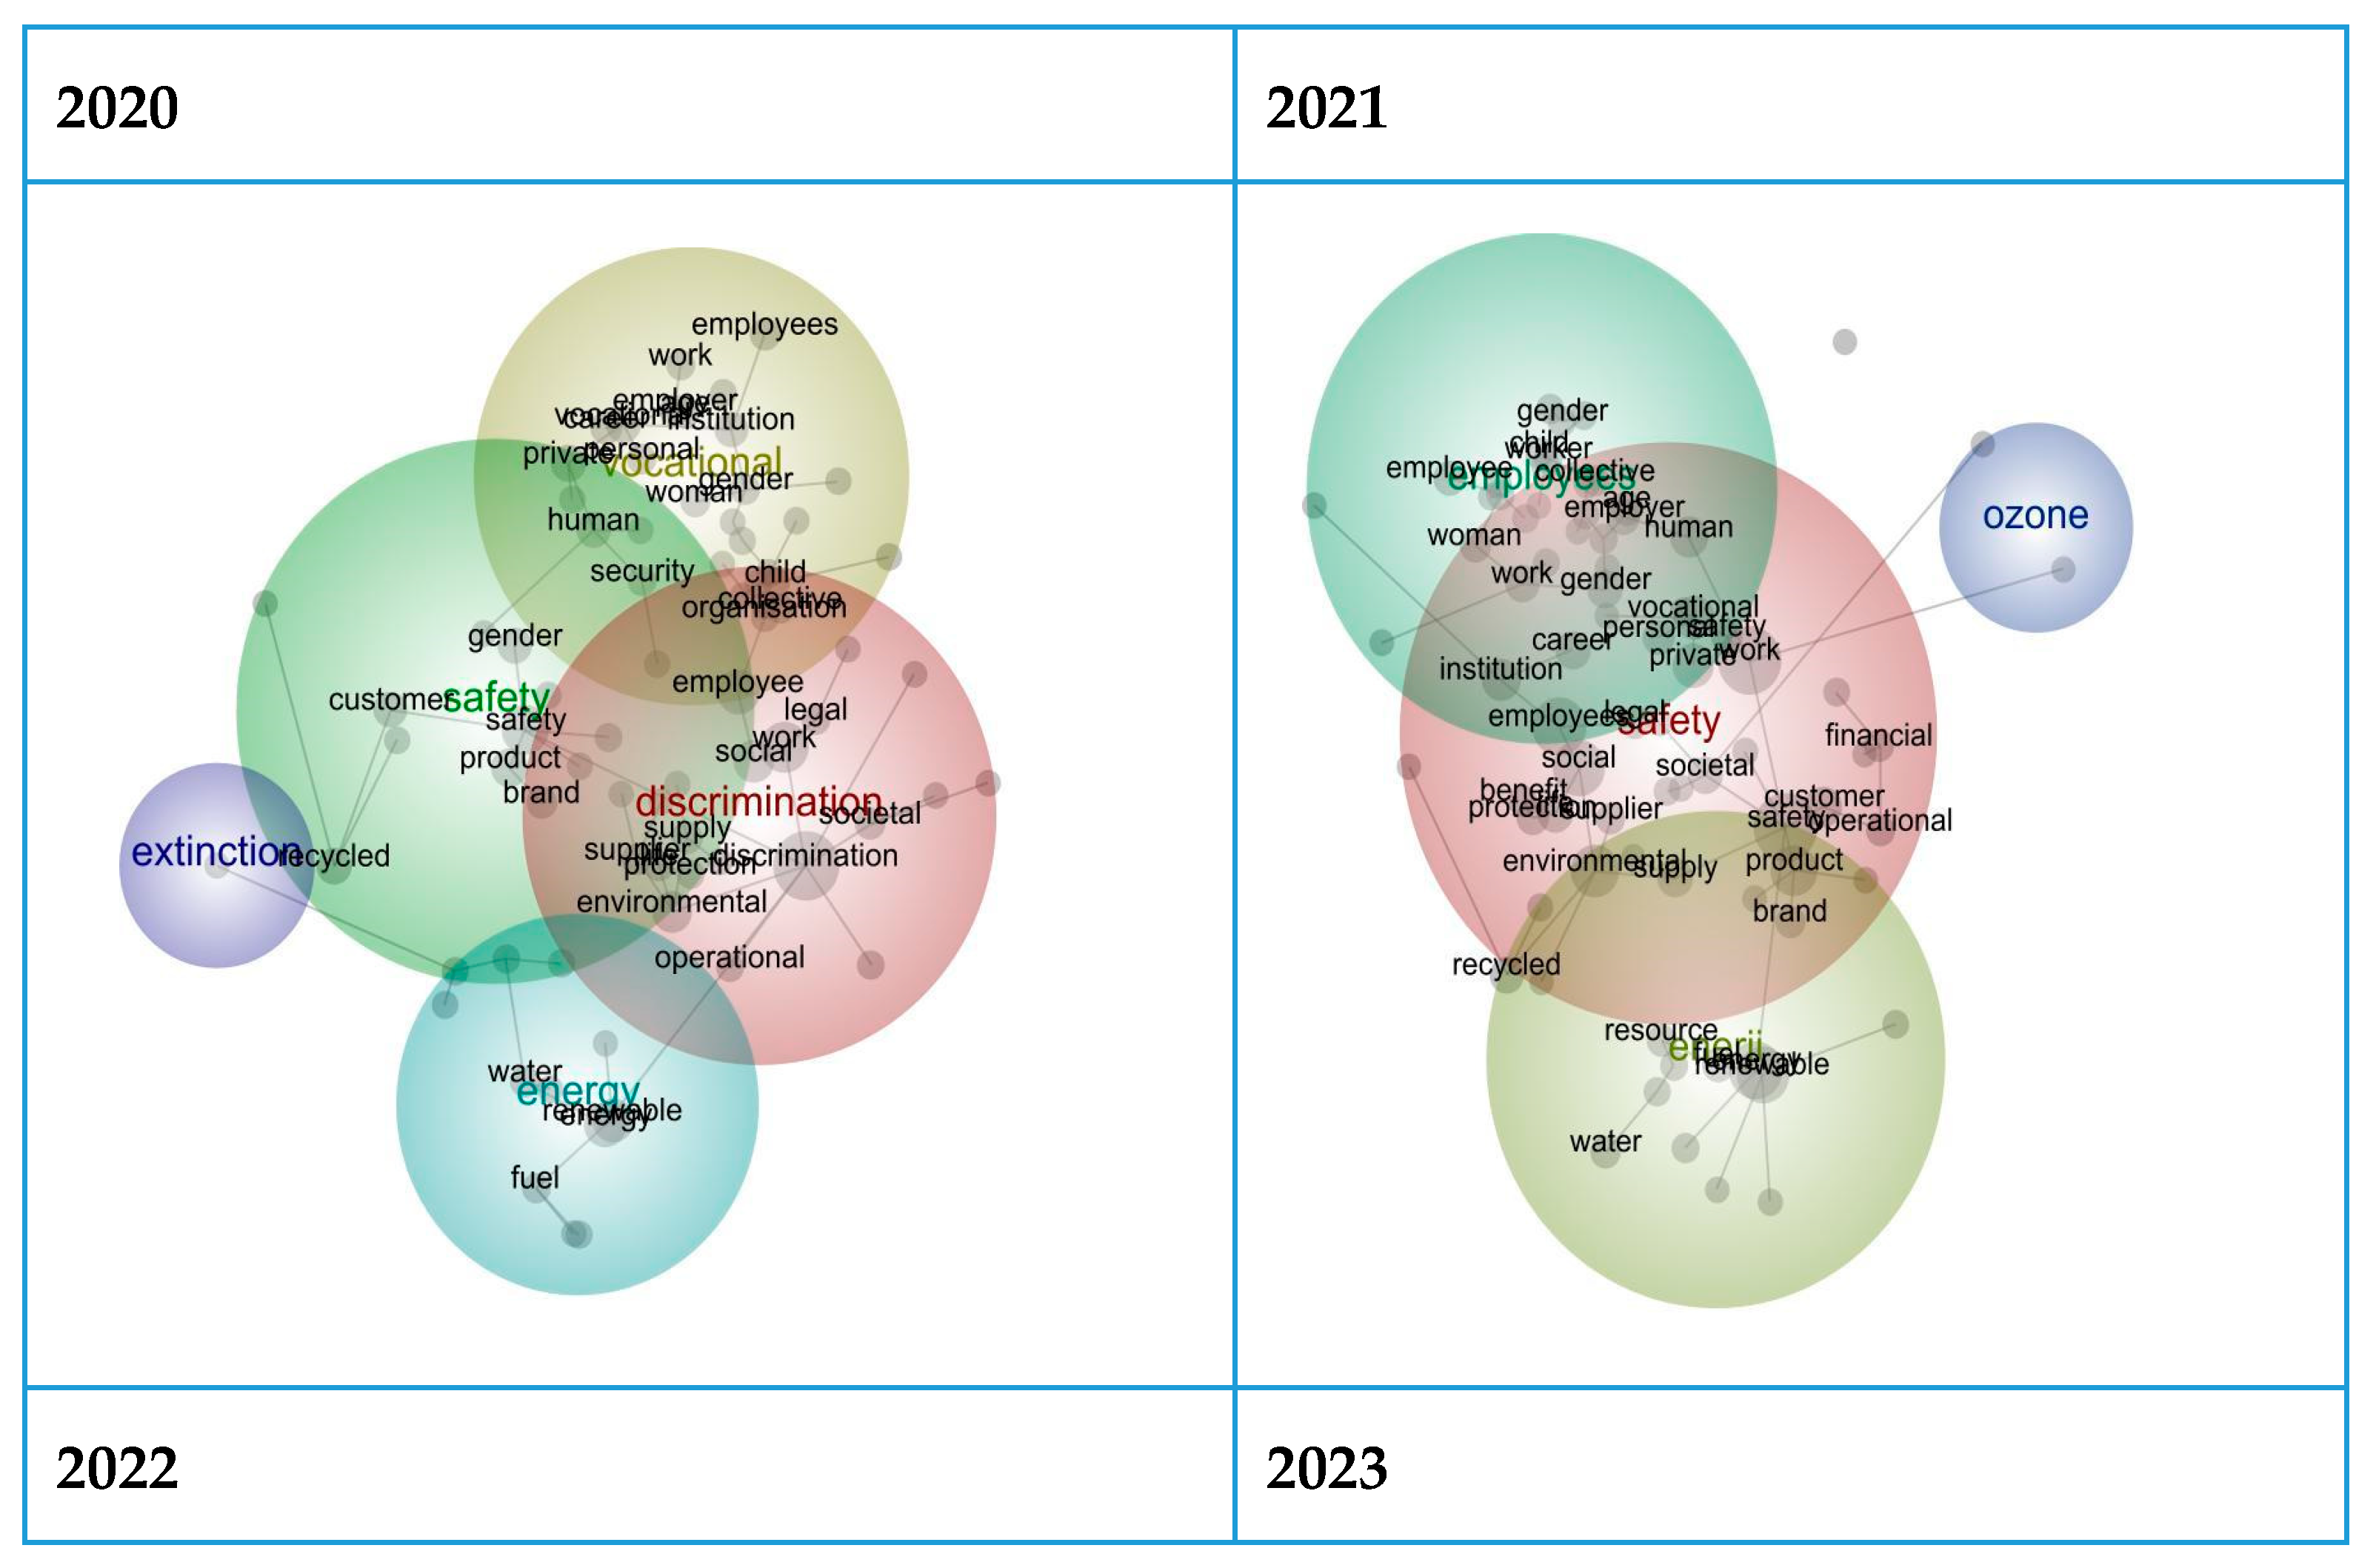
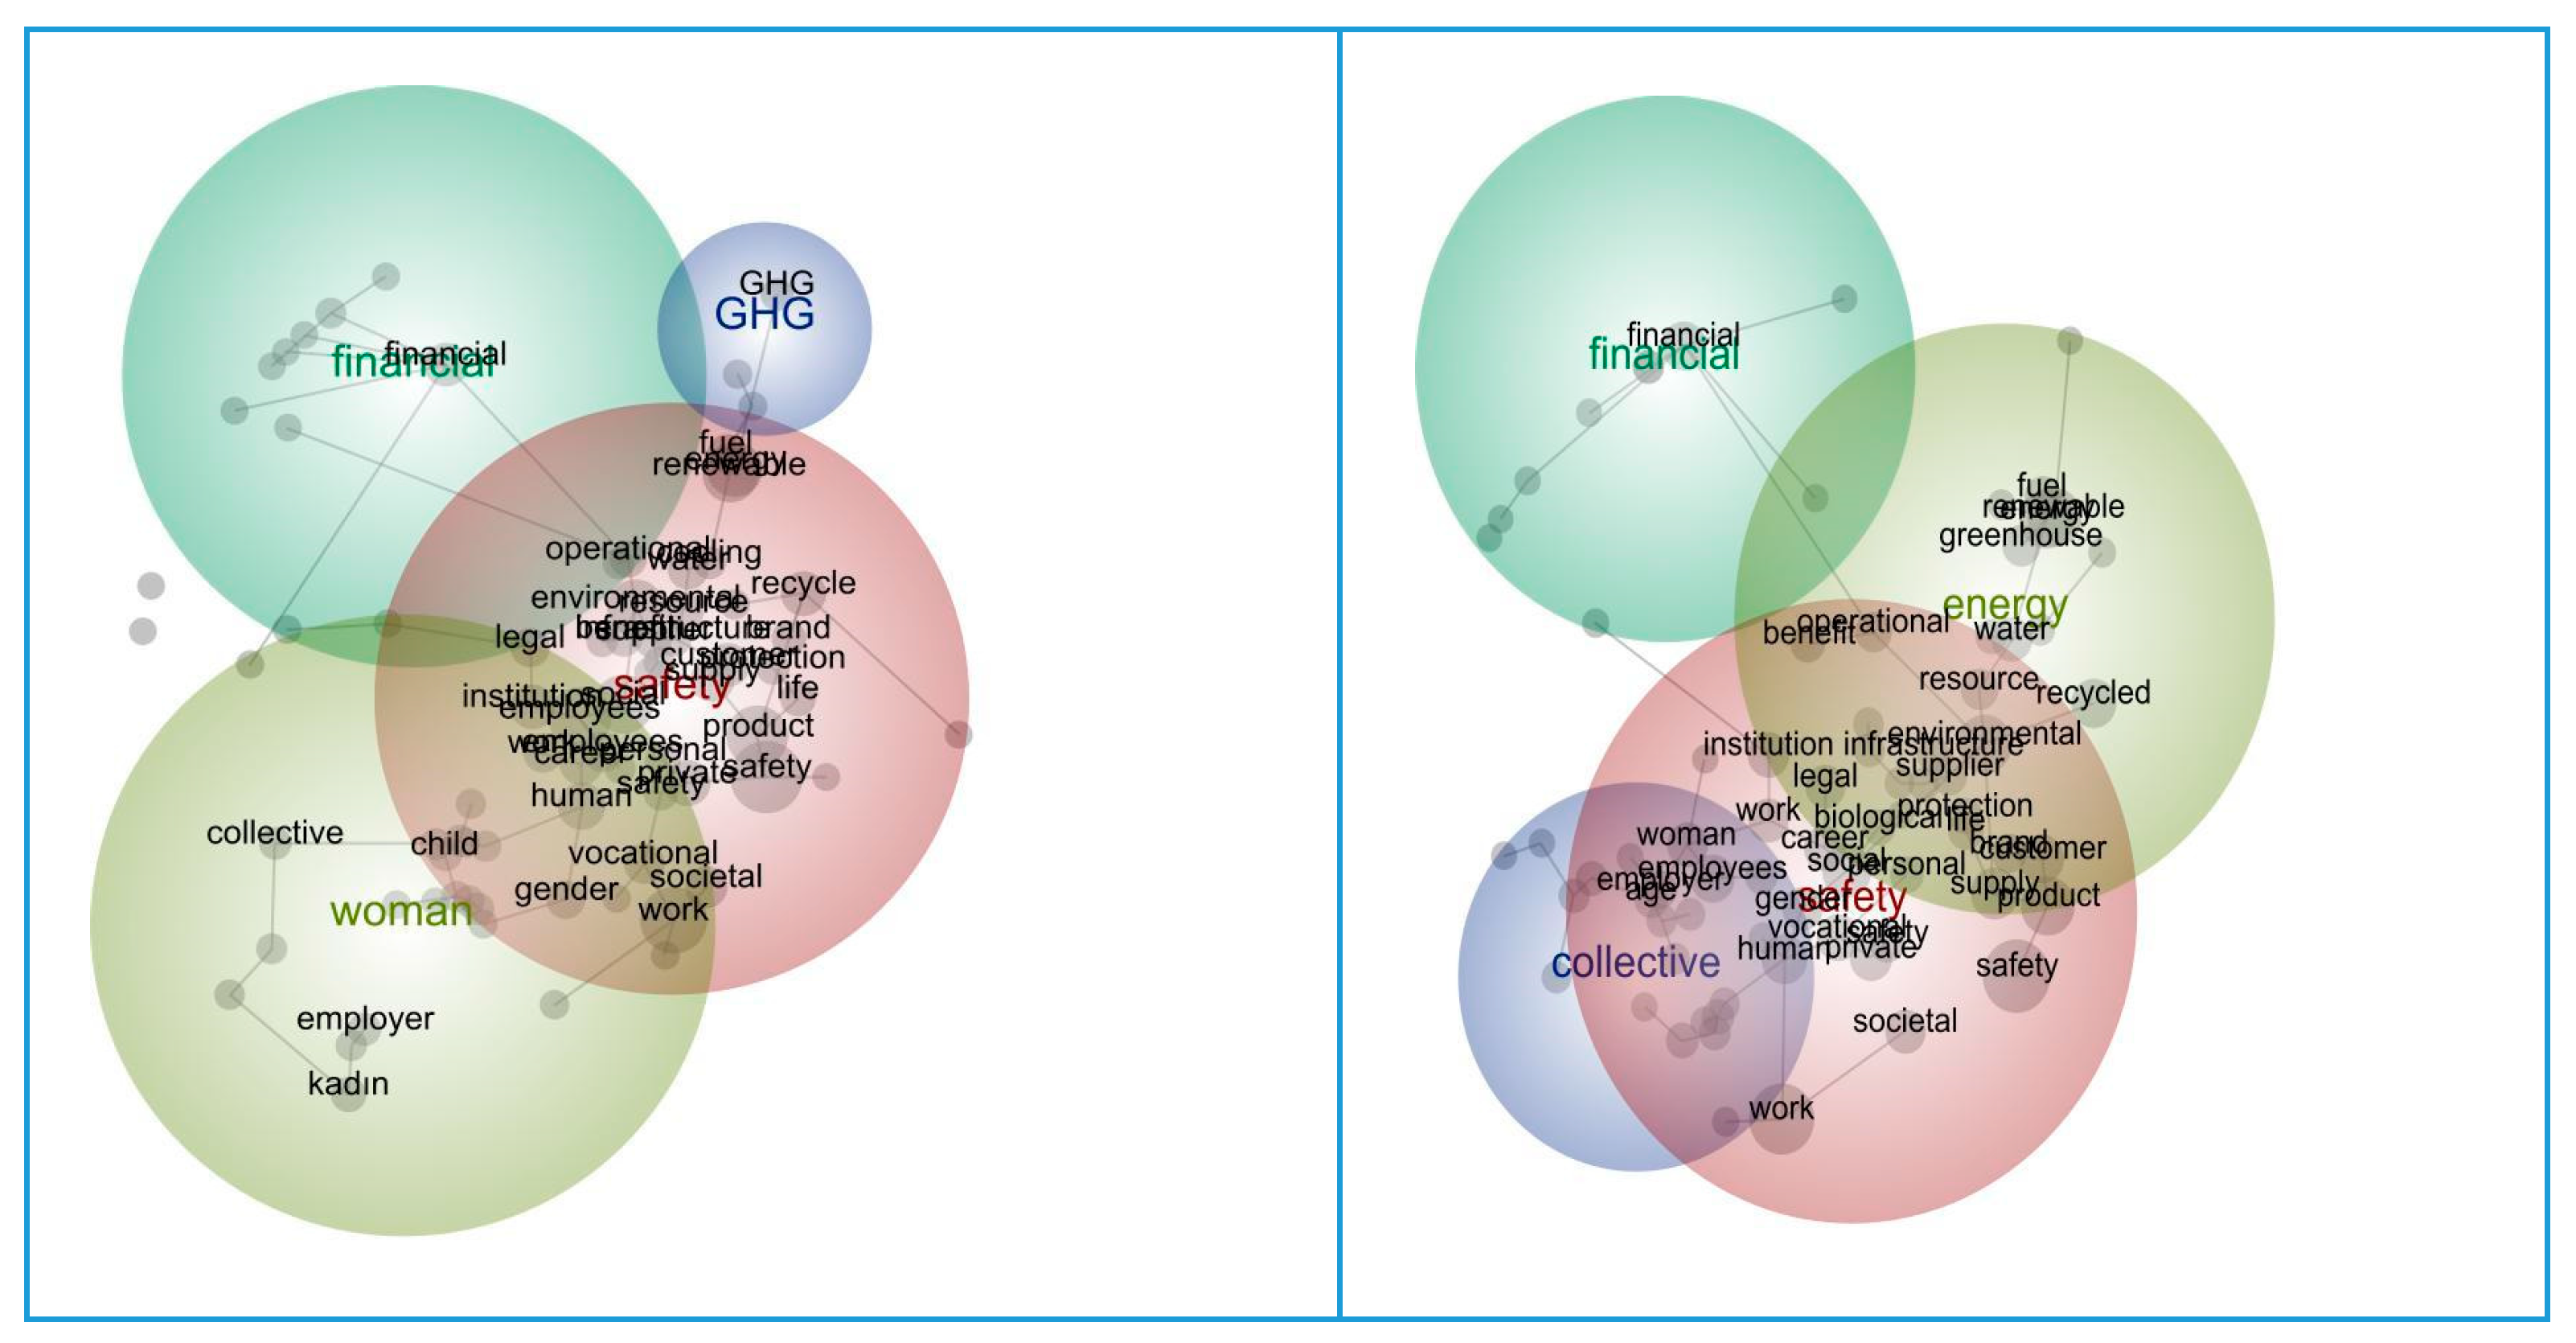
Figure 5 presents the concept maps generated from the sustainability reports of Turkey’s most valuable wholesale and retail brands between 2020 and 2023. The longitudinal analysis reveals a progressive diversification and maturation of sustainability themes, with a notable transition from a strong social justice emphasis toward a more balanced inclusion of environmental and financial concerns in subsequent years.
In 2020, five key themes were identified: discrimination (2767), safety (1605), vocational (1116), energy (608), and lineage (2). The most frequently recurring concept was “discrimination,” indicating that early reports prominently emphasized diversity, equity, and inclusion (DEI) within the context of social sustainability. The frequent appearance of safety and vocational development also reflects a sector-wide concern for occupational health and employee wellbeing. Environmental dimensions, while present (e.g., energy), were less dominant at this stage. This initial reporting phase highlights a foundational commitment to social responsibility, particularly workplace equity and labor conditions.
By 2021, the thematic emphasis shifted. Four primary themes emerged: safety (3598), energy (1035), employees (478), and ozone (221). The consistent dominance of “safety” suggests a heightened concern for both physical and digital risk management, likely influenced by the ongoing effects of the COVID-19 pandemic. Simultaneously, increased attention to energy and environmental terms (e.g., ozone) signals a growing awareness of ecological impact. However, social justice themes such as discrimination, which were prominent in 2020 received relatively less attention, indicating a temporary rebalancing of priorities.
The 2022 reports marked a more diversified thematic landscape, with four main themes: safety (2556), financial (303), women (270), and greenhouse (74). The continued dominance of “safety” demonstrates the persistent relevance of risk mitigation, while the emergence of gender equality and greenhouse gas concerns reflects broader ESG engagement. The increasing visibility of financial sustainability also suggests that companies have begun to respond to investor and market expectations for economic resilience. Collectively, the 2022 data show a more comprehensive integration of environmental, social, and governance components in reporting practices.
In 2023, sustainability communication became both more detailed and operationally focused. Six themes emerged: safety (4536), energy (2233), financial (860), and collective (83), among others. Safety remained the leading concept, further supported by sustained references to energy and financial topics. The persistence and growth of energy-related terms such as greenhouse, ozone, and energy since 2021 reflect the increasing prioritization of climate-related performance and resource efficiency. Moreover, the visibility of financial themes continued to grow, indicating stronger attention to economic continuity and transparent governance. Compared to earlier years, 2023 reporting demonstrates improved thematic balance, with nearly equal emphasis on environmental, financial, and operational issues.
Taken together, the evolution of sustainability discourse among Turkey’s top wholesale and retail brands from 2020 to 2023 reveals a clear thematic shift. Initial reports were strongly focused on social justice and workplace safety, particularly in response to the socio-economic effects of the pandemic. Over time, environmental and financial dimensions gained prominence, reflecting both external regulatory pressures and internal maturity in ESG strategy. From a focus on equity and protection in 2020, the narrative has expanded to include climate impact, economic sustainability, and more structured reporting across all ESG pillars. The trend demonstrates growing sophistication, accountability, and multidimensionality in corporate sustainability practices within the retail sector.
Figure 6 illustrates the concept maps derived from the sustainability reports of Turkey’s most valuable manufacturing brands between 2020 and 2023. The data reveal an evolving trajectory in sustainability reporting, shifting from a primary focus on occupational well-being and energy usage to the inclusion of more nuanced social justice themes such as discrimination, gender equality, and labor rights.
In 2020, five major themes were identified: employees (2972), energy (2296), suppliers (286), and mergers (8). The top five most frequently mentioned concepts were energy, recycling, employees, renewable, and social. These results suggest that the initial emphasis was on employee welfare and environmental awareness, particularly in relation to energy efficiency and renewable resource usage. Governance-related topics such as supply chain and mergers were noted but remained limited in focus, indicating that internal organizational sustainability had not yet become a central reporting priority.
The 2021 reports featured six main themes: work (4913), energy (4508), financial (570), profession (42), lineage (5), and promotion (3). With “work” and “energy” being the dominant concepts, this phase reflects a stronger preoccupation with employment security and energy performance, likely as a response to ongoing economic uncertainties and regulatory shifts. The appearance of terms like lineage and profession indicates the initial emergence of social justice and employee rights topics, albeit in a limited scope.
By 2022, the thematic focus experienced a major inflection point. Four core themes emerged: discrimination (14,517), energy (4168), financial (1401), and disabled (7). The overwhelming frequency of “discrimination” marked a significant turn toward addressing issues of diversity, equity, and inclusion. Simultaneously, energy and financial sustainability maintained their presence, suggesting that while social issues gained momentum, environmental and economic dimensions continued to be integral. The emergence of the “disabled” concept signals the sector’s initial steps toward more inclusive reporting practices that consider marginalized groups.
In 2023, the reports became more refined and socially conscious. The leading themes included discrimination (13,472), energy (6962), gender (6082), union (23), and revenue (10). Social sustainability concepts were now more detailed and topic-specific: gender equality, union rights, and workplace discrimination had become prominent, signaling increased institutional sensitivity to human rights and workforce diversity. Notably, energy reached its highest reported frequency across all years, highlighting the growing importance of energy efficiency, renewable energy use, and carbon impact mitigation. Despite consistent appearances of financial themes, such as financial and revenue, these topics were somewhat secondary to the broader social and environmental focus. The relatively limited presence of governance-related concepts, such as suppliers and revenue suggests a gap in addressing corporate governance and value chain accountability compared to other ESG dimensions.
In summary, sustainability reporting in Türkiye’s manufacturing sector has undergone a significant transformation between 2020 and 2023. Initial narratives were dominated by employee well-being and environmental stewardship, particularly around energy. Over time, however, reports began incorporating more pointed and sophisticated social issues such as discrimination, gender equity, and labor rights. These changes reflect not only a maturing ESG discourse but also growing institutional engagement with inclusive and rights-based sustainability frameworks. The steady rise of environmental concerns, especially energy-related concerns across all years, demonstrates a persistent commitment to climate-conscious operations. Overall, the sector has embraced a more comprehensive, inclusive, and thematically enriched approach to sustainability, aligning its communication strategies with global ESG standards and stakeholder expectations.
Across all sectors, workplace safety, employee-related issues, and energy use emerged as consistently dominant themes throughout the four years. These results reflect the growing prioritization of occupational health and safety, as well as environmental sustainability awareness, likely influenced by both regulatory frameworks and stakeholder expectations. The prominence of the “energy” concept across all industries suggests an increasing institutional engagement with energy efficiency, renewable resources, and environmental impact mitigation.
Another key cross-sectoral trend was the rise of social justice and diversity-related topics, particularly in 2022 and 2023. Terms such as “discrimination,” “gender,” “inclusion,” and “women” became significantly more frequent, signaling that the Social (S) component of ESG reporting is gaining ground in Turkish corporate discourse. This shift marks a movement from generic declarations of responsibility to more specific and measurable social metrics.
Over time, sustainability reports also evolved from general expressions of intent to richer, more detailed narratives involving tangible dimensions such as “minimum wage,” “promotions,” “unions,” and “employee rights.” This thematic deepening indicates a maturing approach to ESG communication, where qualitative and quantitative elements are integrated to demonstrate compliance, transparency, and social accountability.
Nevertheless, the results reveal sector-specific nuances. For example, the construction sector transitioned from broad social themes to environmental and legal-political concerns in 2023. Financial institutions initially emphasized workplace well-being and later addressed diversity, wage transparency, and employee satisfaction. The wholesale and retail sector shifted from anti-discrimination concerns in 2020 to a more balanced ESG representation by 2022 and 2023. Meanwhile, the manufacturing sector showed a sharp rise in themes related to discrimination, gender equity, and labor rights, coupled with consistently strong emphasis on energy, making it one of the most socially enriched reporting clusters.

5. Discussion

This study employed a mixed-methods approach to investigate the relationship between sustainability reporting and brand value across Turkey’s most valuable companies. The first phase utilized panel data regression analysis to quantitatively assess whether the presence of sustainability reporting (SR) is associated with firms’ brand valuations. The second phase involved a qualitative content analysis of sustainability reports using Leximancer software to identify evolving thematic patterns across sectors from 2020 to 2023.

5.1. Quantitative Insights

The panel regression results revealed a statistically significant and negative relationship between the independent variable “SR” (sustainability reporting) and the dependent variable “Brand Value” when sectoral effects were not accounted for. In other words, on average, firms publishing sustainability reports appeared to have lower brand value than those not publishing such reports.
Although sustainability reporting is often assumed to enhance brand value through transparency and trust-building, the finding that firms with such reports may exhibit lower brand value can be interpreted in several ways. Stakeholders may perceive these reports as greenwashing when disclosures appear symbolic or unsubstantiated, leading to skepticism and reduced brand credibility. Additionally, sustainability reports are sometimes reactive, produced after reputational or performance issues, which can further weaken their signaling effect. In emerging contexts such as Türkiye, where ESG reporting practices are still maturing, disclosure may indicate compliance rather than genuine commitment. Overall, the result underscores that the presence of a report alone does not guarantee legitimacy or value creation; reporting quality, authenticity, and stakeholder trust are decisive mediators.
However, this initial finding was modulated by significant interaction effects between SR and sectoral dummy variables (SR*Sector), suggesting that the impact of sustainability reporting on brand value is contingent upon sectoral context. When sectoral heterogeneity was considered, sustainability reporting had a positive and statistically significant effect on brand value in four key sectors: Construction, Manufacturing, Financial Institutions, and Wholesale & Retail Trade. This indicates that, within these industries, engaging in transparent sustainability disclosure practices is associated with enhanced brand equity and stakeholder trust.

5.2. Qualitative Insights from Sectoral Content Analysis

To contextualize these findings, Phase 2 of the study analyzed the content of sustainability reports published between 2020 and 2023 using Leximancer. This software-assisted qualitative analysis allowed for a nuanced examination of thematic evolution by sector. In the construction sector, earlier reports focused heavily on broad social responsibility themes (e.g., “social,” “human,” “energy”), while more recent reports reflected an intensifying concern for environmental and regulatory issues (e.g., “environmental,” “government,” “lawsuits”). This thematic maturation likely aligns with increasing regulatory scrutiny and public attention, which may explain the observed rise in brand value for reporting firms in this sector.
Financial institutions demonstrated a shift from general employee well-being and workplace safety in 2020 to specific disclosures around diversity, inclusion, minimum wage policies, and anti-discrimination efforts by 2023. This progression toward transparency and depth in social metrics reflects a sector increasingly shaped by ESG accountability, reinforcing the positive SR–brand value association identified quantitatively.
In the wholesale and retail sector, early attention to social justice and discrimination gave way to more balanced coverage across ESG dimensions, particularly workplace safety, environmental impact, and financial transparency by 2022 and 2023. The diversity and specificity of these disclosures likely contributed to stakeholder trust, strengthening brand perception.
The manufacturing sector presented one of the most socially enriched reporting profiles, especially in 2022 and 2023. Themes such as “discrimination,” “gender,” “union rights,” and “energy” dominated recent reports, illustrating an increased commitment to both social justice and environmental sustainability. The Leximancer analysis showed a consistent rise in “energy” across all years, suggesting that firms are responsive to environmental performance metrics. These evolving disclosures are consistent with the sector’s positive and significant SR–brand value relationship.

5.3. Integration and Interpretation

The integration of quantitative and qualitative findings reveals that the effectiveness of sustainability reporting in enhancing brand value is not uniform across sectors. Rather, it depends on both what is reported and how those themes evolve in alignment with sector-specific expectations and stakeholder concerns. Industries that demonstrated greater thematic diversity, specificity, and responsiveness to social and environmental challenges also tended to benefit from the reputational gains that translate into higher brand value.
This pattern reinforces the argument that substantive, strategically aligned sustainability reporting, not symbolic or generic disclosures, drives positive brand outcomes. The findings lend empirical support to theories of legitimacy, stakeholder engagement, and cognitive legitimacy in the context of ESG communication.

6. Conclusions

This study advances understanding of the relationship between sustainability reporting (SR) and brand value through the application of a mixed-methods design that integrates panel data with content analysis. By combining quantitative and qualitative evidence, the study moves beyond binary assessments of whether firms report and demonstrates that what they report and how reporting themes evolve are more decisive in shaping brand outcomes than the mere existence of a sustainability report.
The quantitative analysis revealed that the simple presence of sustainability reporting is, on average, associated with lower brand value when sectoral heterogeneity is ignored. This finding underscores that disclosure alone does not guarantee legitimacy or value creation. However, once sectoral dynamics were incorporated, the results indicated that SR exerts a positive and statistically significant influence on brand value in the construction, manufacturing, financial, and wholesale–retail sectors. These patterns suggest that industry context mediates the reputational and financial effects of sustainability communication.
The qualitative Leximancer-based analysis provided further insight into the content evolution of sustainability reporting between 2020 and 2023. Across sectors, reports demonstrated increasing thematic sophistication from broad social responsibility language to more specific and measurable commitments related to social justice, energy efficiency, regulatory compliance, and diversity. This thematic deepening aligns with growing stakeholder expectations and reflects a shift from symbolic compliance toward substantive ESG disclosure.
Taken together, the mixed-methods integration offers robust evidence that content quality, thematic evolution, and sectoral responsiveness are the key drivers linking sustainability reporting to brand value. The study contributes to literature by introducing a methodologically rigorous mixed-methods framework that captures both the quantitative effects and the qualitative substance of ESG communication.
From a managerial perspective, firms operating in sectors where sustainability reporting (SR) demonstrates a positive association with brand value should emphasize the depth and specificity of their disclosures. Rather than relying on broad or symbolic statements, managers are encouraged to provide verifiable and sector-relevant data such as quantitative indicators on employee compensation, energy efficiency achievements, or anti-discrimination measures to strengthen report credibility and stakeholder trust. From a policy standpoint, regulators could support this process by developing sector-specific reporting frameworks and performance benchmarks, thereby enhancing the comparability, transparency, and overall legitimacy of sustainability disclosures across industries.
For managers operating in the four sectors where sustainability reporting exhibits a positive association with brand value construction, manufacturing, financial institutions, and wholesale–retail—it is crucial to move beyond symbolic or generic disclosures and instead prioritize thematic depth and specificity. Firms are encouraged to incorporate verifiable, data-driven indicators such as employee wage transparency, energy efficiency achievements, and anti-discrimination initiatives that directly demonstrate accountability and performance. Such concrete evidence strengthens the credibility of reports and reinforces stakeholder trust, thereby enhancing brand equity. From a policy perspective, regulators and standard-setting bodies should consider developing sector-specific sustainability reporting frameworks that align with the material issues and risk profiles of each industry. Establishing clear performance benchmarks and disclosure requirements would not only improve cross-sectoral comparability but also enhance the transparency, consistency, and legitimacy of sustainability communication in emerging markets such as Türkiye.
Future studies could extend this analysis in several ways. First, longitudinal research covering a broader time span could capture the long-term evolution of ESG reporting practices and their responsiveness to global regulatory shifts. Second, comparative studies across countries or industries would provide deeper insights into how national culture, institutional pressures, and market maturity influence sustainability disclosure patterns. Moreover, qualitative approaches such as interviews with sustainability managers could further reveal motivation and internal dynamics shaping disclosure practices.

Author Contributions

Conceptualization, H.A. and A.E.; methodology, H.A. and A.E.; validation, H.A. and A.E.; formal analysis, H.A. and A.E.; data curation, H.A. and A.E.; writing—original draft preparation, H.A. and A.E.; writing—review and editing, H.A. and A.E. All authors have read and agreed to the published version of the manuscript.

Funding

The research is funded by TÜBİTAK ARDEB 1002-B EMERGENCY Support Module (Project No: 224K199).

Data Availability Statement

The data are contained within the article.

Acknowledgments

During the preparation of this manuscript, the authors used ChatGPT-4o to improve the readability and language of the manuscript. After using this tool, the authors reviewed and edited the content as needed and take full responsibility for the content of the published article.

Conflicts of Interest

The authors declare no conflicts of interest.

References

  1. Doyle, P. Shareholder-value-based brand strategies. J. Brand Manag. 2001, 9, 20–30. [Google Scholar] [CrossRef]
  2. Ambler, T. Marketing and the Bottom Line; Pearson Education: London, UK, 2000. [Google Scholar]
  3. Brand Finance. 2022. Available online: https://brandirectory.com/reports/turkiye/2022 (accessed on 6 March 2024).
  4. Aaker, D. Managing Brand Equity: Capitalizing on The Value of a Brand Name; The Free Press: New York, NY, USA, 1991. [Google Scholar]
  5. Keller, K.L. Conceptualizing, measuring, and managing customer-based brand equity. J. Mark. 1993, 57, 1–22. [Google Scholar] [CrossRef]
  6. Keller, K.L.; Kotler, P. Holistic marketing: A broad, integrated perspective to marketing management. In Does Marketing Need Reform? Fresh Perspectives on the Future; Routledge: Abingdon, UK, 2015; pp. 308–313. [Google Scholar]
  7. Interbrand. Available online: https://interbrand.com (accessed on 6 March 2024).
  8. Brand Finance. 2023. Available online: https://static.brandirectory.com/reports/brand-finance-global-500-2023-preview.pdf (accessed on 6 March 2024).
  9. Presidency of the Republic of Türkiye. Directorate of Strategy and Budget. 2024. “On İkinci Kalkınma Planı (2024–2028)”. Available online: https://www.sbb.gov.tr/wp-content/uploads/2023/12/On-Ikinci-Kalkinma-Plani_2024-2028_11122023.pdf (accessed on 6 March 2024).
  10. Republic of Türkiye Ministry of Trade. 2024. “Yeşil Mutabakat”. Available online: https://ticaret.gov.tr/dis-iliskiler/yesil-mutabakat/genel-bilgi (accessed on 6 March 2024).
  11. Aksoy, M. Relationship between corporate sustainability performance and brand performance: Evidence from Borsa Istanbul. Res. J. Bus. Manag. 2019, 7, 139–148. [Google Scholar]
  12. Kotler, P.; Keller, K.L.; Chernev, A. Marketing Management, 16th ed.; Global Edition; Pearson: London, UK, 2022. [Google Scholar]
  13. Møller Jensen, J.; Hansen, T. An empirical examination of brand loyalty. J. Prod. Brand Manag. 2006, 15, 442–449. [Google Scholar] [CrossRef]
  14. Punniyamoorthy, M.; Prasanna Mohan Raj, M. An empirical model for brand loyalty measurement. J. Target. Meas. Anal. Mark. 2007, 15, 222–233. [Google Scholar] [CrossRef]
  15. Chaudhuri, A.; Holbrook, M.B. The chain of effects from brand trust and brand affect to brand performance: The role of brand loyalty. J. Mark. 2001, 65, 81–93. [Google Scholar] [CrossRef]
  16. Qiao, Y.; Yin, X.; Xing, G. Impact of perceived product value on customer-based brand equity: Marx’s theory–value-based perspective. Front. Psychol. 2022, 13, 931064. [Google Scholar] [CrossRef] [PubMed]
  17. Rahman, M.; Rodríguez-Serrano, M.Á.; Lambkin, M. Corporate social responsibility and marketing performance: The moderating role of advertising intensity. J. Advert. Res. 2017, 57, 368–378. [Google Scholar] [CrossRef]
  18. Harjoto, A.M.; Salas, J. Strategic and institutional sustainability: Corporate social responsibility, brand value, and Interbrand listing. J. Prod. Brand Manag. 2017, 26, 545–558. [Google Scholar] [CrossRef]
  19. Ajour El Zein, S.; Consolacion-Segura, C.; Huertas-Garcia, R. The role of sustainability in brand equity value in the financial sector. Sustainability 2019, 12, 254. [Google Scholar] [CrossRef]
  20. Servaes, H.; Tamayo, A. The impact of corporate social responsibility on firm value: The role of customer awareness. Manag. Sci. 2013, 59, 1045–1061. [Google Scholar] [CrossRef]
  21. Loh, L.; Tan, S. Impact of sustainability reporting on brand value: An examination of 100 leading brands in Singapore. Sustainability 2020, 12, 7392. [Google Scholar] [CrossRef]
  22. Taiwo, O.J.; Owowlabi, B.A.; Adedokun, Y.; Ogundajo, G. Sustainability reporting and market value growth of quoted companies in Nigeria. J. Financ. Report. Account. 2022, 20, 542–557. [Google Scholar] [CrossRef]
  23. Kinnunen, J.; Saunila, M.; Ukko, J.; Rantanen, H. Strategic sustainability in the construction industry: Impacts on sustainability performance and brand. J. Clean. Prod. 2022, 368, 133063. [Google Scholar] [CrossRef]
  24. Loh, L.; Thomas, T.; Wang, Y. Sustainability Reporting and Firm Value: Evidence from Singapore-Listed Companies. Sustainability 2017, 9, 2112. [Google Scholar] [CrossRef]
  25. Bachoo, K.; Tan, R.; Wilson, M. Firm value and the quality of sustainability reporting in Australia. Aust. Account. Rev. 2013, 23, 67–87. [Google Scholar] [CrossRef]
  26. Kuzey, C.; Uyar, A. Determinants of sustainability reporting and its impact on firm value: Evidence from the emerging market of Turkey. J. Clean. Prod. 2017, 143, 27–39. [Google Scholar] [CrossRef]
  27. Nguyen, D.T.T. An empirical study on the impact of sustainability reporting on firm value. J. Compet. 2020, 12, 119–135. [Google Scholar] [CrossRef]
  28. Yondrichs, M.; Laupe, S.; Mayapada, A.G.; Jurana, R. The effect of fundamental factors, sustainability reporting, and corporate governance on firm value. Univers. J. Account. Financ. 2021, 9, 1503–1509. [Google Scholar] [CrossRef]
  29. Suhartini, D.; Tjahjadi, B.; Fayanni, Y. Impact of sustainability reporting and governance on firm value: Insights from the Indonesian manufacturing sector. Cogent Bus. Manag. 2024, 11, 2381087. [Google Scholar] [CrossRef]
  30. Friske, W.; Hoelscher, S.A.; Nikolov, A.N. The impact of voluntary sustainability reporting on firm value: Insights from signaling theory. J. Acad. Mark. Sci. 2023, 51, 372–392. [Google Scholar] [CrossRef]
  31. Brand Finance. Brand Valuation Methodology. Available online: https://brandirectory.com/methodology (accessed on 1 March 2024).
  32. Interbrand Best Global Brands. Available online: https://interbrand.com/best-global-brands/ (accessed on 1 March 2024).
  33. Kantar. Available online: https://www.kantar.com/campaigns/brandz/global (accessed on 5 September 2025).
  34. Bagna, E.; Dicuonzo, G.; Perrone, A.; Dell’Atti, V. The value relevance of brand valuation. Appl. Econ. 2017, 49, 5865–5876. [Google Scholar] [CrossRef]
  35. Bebbington, J.; Larrinaga, C.; Moneva, J.M. Corporate social reporting and reputation risk management. Account. Audit. Account. J. 2008, 21, 337–361. [Google Scholar] [CrossRef]
  36. O’donovan, G. Environmental disclosures in the annual report: Extending the applicability and predictive power of legitimacy theory. Account. Audit. Account. J. 2002, 15, 344–371. [Google Scholar] [CrossRef]
  37. Aguilera, R.V.; Rupp, D.E.; Williams, C.A.; Ganapathi, J. Putting the S back in corporate social responsibility: A multilevel theory of social change in organizations. Acad. Manag. Rev. 2007, 32, 836–863. [Google Scholar] [CrossRef]
  38. Freeman, R.E. Strategic Management: A Stakeholder Approach; Cambridge University Press: Cambridge, UK, 2010. [Google Scholar]
  39. Kochkina, N.; Macchia, S.; Floris, M. Strategic Language Use in Sustainability Reporting: An Empirical Study. Sustainability 2024, 16, 10229. [Google Scholar] [CrossRef]
  40. Suchman, M.C. Managing legitimacy: Strategic and institutional approaches. Acad. Manag. Rev. 1995, 20, 571–610. [Google Scholar] [CrossRef]
  41. Tregidga, H.; Milne, M.J. From sustainable management to sustainable development: A longitudinal analysis of a leading New Zealand environmental reporter. Bus. Strategy Environ. 2006, 15, 219–241. [Google Scholar] [CrossRef]
  42. Crane, A.; Glozer, S. Researching corporate social responsibility communication: Themes, opportunities and challenges. J. Manag. Stud. 2016, 53, 1223–1252. [Google Scholar] [CrossRef]
  43. Birth, G.; Illia, L.; Lurati, F.; Zamparini, A. Communicating CSR: Practices among Switzerland’s top 300 companies. Corp. Commun. Int. J. 2008, 13, 182–196. [Google Scholar] [CrossRef]
  44. KGK Raporlama Standartları. Available online: https://www.kgk.gov.tr/SustainabilityDetailForm/11455/surdurulebilirlik-yayinlar. (accessed on 1 November 2025).
  45. Brand Finance. Available online: https://brandfinance.com/offices/turkey (accessed on 1 March 2024).
  46. Creswell, J.W.; Creswell, J.D. Research Design: Qualitative, Quantitative, and Mixed Methods Approaches; Sage Publications: Thousand Oaks, CA, USA, 2017. [Google Scholar]
  47. Ivankova, N.V.; Creswell, J.W.; Stick, S.L. Using mixed-methods sequential explanatory design: From theory to practice. Field Methods 2006, 18, 3–20. [Google Scholar] [CrossRef]
  48. Brammer, S.; Millington, A. Firm size, organizational visibility and corporate philanthropy: An empirical analysis. Bus. Ethics A Eur. Rev. 2006, 15, 6–18. [Google Scholar] [CrossRef]
  49. Wang, M.C. The relationship between firm characteristics and the disclosure of sustainability reporting. Sustainability 2017, 9, 624. [Google Scholar] [CrossRef]
  50. Alghamdi, O.A.; Agag, G. Unlocking the Power of Reporting: Exploring the Link between Voluntary Sustainability Reporting, Customer Behavior, and Firm Value. Sustainability 2023, 15, 15584. [Google Scholar] [CrossRef]
  51. Stemler, S. An overview of content analysis. Pract. Assess. Res. Eval. 2000, 7, 17. [Google Scholar]
  52. Brglez, K.; Perc, M.; Lukman, R.K. The complexity and interconnectedness of circular cities and the circular economy for sustainability. Sustain. Dev. 2023, 32, 2049–2065. [Google Scholar] [CrossRef]
  53. Leximancer. Available online: https://www.leximancer.com/resources (accessed on 5 March 2024).
  54. Tunca, S.; Sezen, B.; Wilk, V. An exploratory content and sentiment analysis of the guardian metaverse articles using Leximancer and natural language processing. J. Big Data 2023, 10, 82. [Google Scholar] [CrossRef]
Figure 1. Theoretical Pathways Linking Sustainability Reporting and Brand Value (created by the authors).
Sustainability 17 10108 g001
Figure 2. Visual Model for Mixed-Methods Sequential Explanatory Design Procedure. Source: created by authors. Figure adapted from Ivankova, Creswell & Stick [47].
Sustainability 17 10108 g002
Figure 3. Construction sector brands concept maps.
Sustainability 17 10108 g003
Figure 4. Financial institution brands’ concept maps.
Sustainability 17 10108 g004
Figure 5. Wholesale and retail brands concept maps.
Sustainability 17 10108 g005aSustainability 17 10108 g005b
Figure 6. Manufacturing brands concept maps.
Sustainability 17 10108 g006
Table 1. Distribution of Companies by Reporting Type (Total Firm-Years).
Report TypeIndependent Assurance Report on Sustainability
Disclosures
Total
YesNo
Sustainability Report4997146
Integrated Report432265
Non-reporting--92
Total Firm-Years92119303
Table 2. Distribution by Sector.
Firms with
Available Data
Initial
Sample Size
S1—Information and Communication/
Telecommunications
79
S2—Education, Health, Sports, and Entertainment
Services
04
S3—Manufacturing3034
S4—Construction and Public Works33
S5—Logistics13
S6—Financial Institutions2022
S7—Healthcare11
S8—Technology13
S9—Wholesale and Retail Trade1416
S10—Transportation and Storage45
Total81100
Table 3. Descriptive Statistics of the Variables.
StatisticsBrand ValueLeverageLogAssets
Mean227.581.674.39
Median66.001.414.37
Standard Deviation 361.230.980.91
Min 6.000.00211.53
Max2000.0011.906.63
Table 4. Pearson Correlations Table.
VariablesBrand ValueSRARLogAssetsLeverage
Brand Value1.000
SR0.281 ***1.000
AR0.265 ***0.436 ***1.000
LogAssets0.493 ***0.380 ***0.488 ***1.000
Leverage−0.150 **−0.064−0.095−0.212 ***1.000
*** p < 0.01, ** p < 0.05, * p < 0.10.
Table 5. Spearman Correlations Table.
VariablesBrand ValueSRARLeverageLogAssets
Brand Value1.000
SR0.462 ***1.000
AR0.401 ***0.436 ***1.000
Leverage−0.157 **−0.039−0.132 *1.000
LogAssets0.585 ***0.408 ***0.484 ***−0.361 ***1.000
*** p < 0.01, ** p < 0.05, * p < 0.10.
Table 6. Regression Results.
Independent VariablesCoef.Std. Err.t-Statisticsp > t
SR−392.6962132.1025−2.970.003
AR−61.6017535.07876−1.760.081
Leverage6.98978611.062660.630.528
LogAssets−97.489721.53358−4.530.000
Sector Dummy 9−7.9969123.9595−0.060.949
SR × Sector Dummy 1238.3936163.97431.450.147
SR × Sector Dummy 3477.6127143.22843.330.001
SR × Sector Dummy 4406.375190.88642.130.034
SR × Sector Dummy 6411.7703119.80883.440.001
SR × Sector Dummy 9474.947146.35913.250.001
Constant658.0295.173676.910.000
Variables: Brand Value (dependent variable): Brand value reported by Brand Finance (in million USD). SR: Sustainability reporting status (dummy variable; 1 = publishes sustainability report, 0 = does not); AR: Sustainability assurance reporting status (dummy variable; 1 = publishes assurance report, 0 = does not). Sector Dummy: Firm’s industry sector (categorical dummy variables; 1 = belongs to the sector, 0 = otherwise). SR × Sector Dummy: Interaction term used to test whether the industry sector moderates the strength or direction of the relationship between sustainability reporting and brand value. LogAssets: Firm size, measured as the natural logarithm of total assets (control variable). Leverage: Leverage ratio, calculated as total liabilities divided by total assets (control variable). Some sectors were omitted from the model. This indicates that these sectors were treated as the reference category, and the model attempts to explain the brand value of other sectors related to this reference group. Some sectors were automatically omitted by the software to avoid the dummy variable trap, which occurs when all category dummies and the constant term are included simultaneously, leading to perfect multicollinearity. The F-test result of the model (p-value (Prob > F): 0.0000) is statistically significant, indicating that the model has a meaningful explanatory power in predicting brand value.
Table 7. Inclusion Criteria and Preprocessing Steps for Leximancer Analysis.
PhaseProcedureDescription/Criteria
Inclusion Criteria of Sustainability ReportsData SourceSustainability or integrated reports publicly disclosed by brands listed in the annual Top 100 Most Valuable Brands in Türkiye ranking compiled by BrandFinance, an independent brand valuation organization.
Time FrameReports published between 2020 and 2023 to ensure temporal comparability.
Eligibility Criteria(i) Available in full text; (ii) issued directly by the corporation (excluding subsidiaries or third-party summaries); (iii) explicitly structured according to sustainability, ESG, or integrated reporting frameworks.
Preprocessing for LeximancerLanguage and FormatAll reports were originally in Turkish
CleaningRemoval of conjunctions, prepositions, and function words (e.g., ‘and’, ‘not’).
Semantic NormalizationMerging of singular/plural and morphological variants (e.g., ‘product/products’, ‘work/works’).
Stop-word RefinementExclusion of generic, low-information terms (e.g., ‘importance’, ‘year’, ‘concrete’).
Concept AlignmentDevelopment of user-defined concepts based on Global Reporting Initiative (GRI) topic structure to ensure international consistency.
Parameter SettingsConcept visibility: 33%; theme size: 60% (to balance comprehensiveness and interpretability).
Post-processingConcept labels were translated into English for cross-sectoral comparison and interpretation.
Disclaimer/Publisher’s Note: The statements, opinions and data contained in all publications are solely those of the individual author(s) and contributor(s) and not of MDPI and/or the editor(s). MDPI and/or the editor(s) disclaim responsibility for any injury to people or property resulting from any ideas, methods, instructions or products referred to in the content.