


Abstract
Background: Reducing agricultural carbon emissions can enhance agricultural resilience and promote sustainable agricultural development. Although prior research has examined how agricultural new-quality productive forces (ANQP) reshape factor allocation, technology adoption, and production efficiency, their implications for agricultural carbon emissions remain insufficiently studied. Objective: To quantify the impact of ANQP on agricultural carbon emissions, assess regional heterogeneity across the east, central, and west, between grain and non-grain areas, between the Yangtze River Economic Belt and other regions, and across different levels of fiscal support, and to identify an efficiency-based transmission mechanism. Materials and Methods: A panel of 30 Chinese provinces for 2012–2022 is analyzed using province and year fixed effects. Results: ANPQ significantly reduce agricultural carbon emissions. The effect is stronger in western provinces, in non-grain areas, within the Yangtze River Economic Belt, and where fiscal support is higher, and weaker in eastern and low-support regions. Trade-offs between yield stabilization and emission reduction emerge in the central region and in major grain-producing areas. Mechanism results indicate that ANQP lowers emissions primarily by improving agricultural production efficiency measured by total factor productivity.
1. Introduction
Global warming caused by rising greenhouse gas (GHG) emissions has become a major concern for governments and scholars worldwide [1]. This challenge is closely linked to the United Nations Sustainable Development Goal 13 (Climate Action), which emphasizes the need for immediate measures to address climate change and its consequences. People often link carbon emissions to industry, and many policies focus on industrial emissions [2]. However, agriculture produces about 30% of global GHG emissions and is the second-largest source after fossil fuels [3,4]. As a large agricultural country, China faces strong pressure from agricultural emissions [5,6]. In 2022, agricultural emissions across 31 provinces totaled about 2.1 billion tons. This is closely related to the heavy use of chemical fertilizers, pesticides, and machinery [7,8,9]. Agriculture not only supports global food security, but also helps keep grain production resilient [10,11].
To achieve goals, it is necessary to reduce emissions from agriculture and increase carbon sinks, so that low-carbon development can guide agricultural transition and green rural growth [12]. China has long been exploring low-carbon agriculture. Existing research indicates that the Chinese government is exploring ways to reduce agricultural carbon emissions through policy support, industrial restructuring, and technological advancement [13,14,15]. Some progress has been made, but there is still a gap to close. In recent years, the concept of Agricultural New-Quality Productive Forces (ANQP) has entered the field with the aim of improving efficiency and lowering emissions. It has been applied in farming and is adding new momentum to high-quality growth [16,17]. ANQP is innovation-driven, with a focus on digital tools, green and low-carbon practices, and intensive use [18]. It not only changes agricultural production methods, but also helps ease resource and environmental limits and raise system resilience [19,20]. Combining ANQP with agriculture can provide new ideas for sustainability and open new paths for low-carbon growth. It is therefore meaningful to ask whether ANQP reduces emissions and how its effects differ across regions. These questions are important for speeding up the “dual-carbon” strategy and advancing green, low-carbon, high-quality growth.
In response to these challenges, both policymakers and scholars have increasingly focused on the agricultural sector’s potential for carbon reduction and sustainable transformation. Related studies can be grouped into three areas. The first is research on sources and measurement of agricultural emissions. Jin et al. focus on crop production [21], while Jahangir et al. study livestock [22]. Huang et al. point out that emissions mainly come from fertilizer and pesticide use, energy consumption, and tillage [23]. The IPCC proposed the emission-factor method, and Ye et al. used IPCC coefficients and the life-cycle method (LCA) for measurement [24]. The second is research on ANQP. Theoretical studies explain its meaning, logic, and practice, and many agree that developing ANQP is essential for high-quality growth [25,26,27]. Evaluation systems often include three elements—laborers, labor objects, and labor means—or three dimensions—technology, digital, and green [28,29]. The third is research on drivers of agricultural emissions. Efficiency usually helps reduce emissions. In Heilongjiang, adjusting cropping and improving irrigation and fertilization cut emissions [30]. Xiong et al. found that efficiency lowered emissions [31], but Zhu and Huo reported an inverted U-shape about efficiency and emissions [5]. Industrial structure also matters: irrational structures raise emissions, while upgrading reduces them [32,33,34]. Economic development increases resource use and drives emissions, with stronger coupling in Central China than in the West [35,36]. Labor scale can help restrain emissions [37].
Through the above literature, several limitations remain. First, most existing studies on ANQP remain conceptual, focusing mainly on theoretical discussions and descriptive frameworks, without providing empirical evidence linking ANQP to agricultural carbon emissions. Second, while previous research has investigated the roles of land transfer, agricultural insurance, or digital finance in influencing carbon emissions, few studies directly assess how ANQP contributes to emission reduction and sustainability outcomes at the provincial level, leading to a lack of comparative understanding across regions. Third, many studies rely on limited samples or single-period data and lack methodological validation, making it difficult to identify causal relationships or regional heterogeneity.
Addressing these gaps is crucial for aligning China’s agricultural modernization with its “dual-carbon” goals. Therefore, we construct an index of ANQP and combine it with dynamic measures of agricultural carbon emissions to systematically examine their relationship. From a methodological perspective, the ANQP index is constructed using the entropy weight method, following the measurement principles in existing literature [25]. Entropy weighting provides objective, data-driven weights that reflect cross-provincial dispersion of indicators, enhancing comparability over time and space. Compared with PCA and AHP, entropy weighting reduces model dependence while preserving interpretability. For identification, we estimate province–year fixed-effects models in the spirit of existing literature to absorb time-invariant provincial heterogeneity and nationwide shocks via year effects [24]. Relative to random effects or pooled OLS, fixed effects are more appropriate for our balanced provincial panel.
The contributions of this study are threefold. First, this study breaks through previous conceptual research by empirically testing the impact of ANQP on agricultural carbon emissions using interprovincial annual panel data, thereby linking innovation-driven new productive forces with quantifiable emission reduction effects. Second, this study reveals significant regional heterogeneity in the emission reduction effects of ANQP, clarifying under which regional conditions and circumstances ANQP proves most effective for agricultural emission reduction. Third, this study verifies that ANQP primarily achieves carbon emission reduction by enhancing agricultural production efficiency, revealing an efficiency-driven emission reduction mechanism. This provides new empirical evidence for the green and low-carbon development of agriculture.
2. Theoretical Analysis and Research Hypotheses
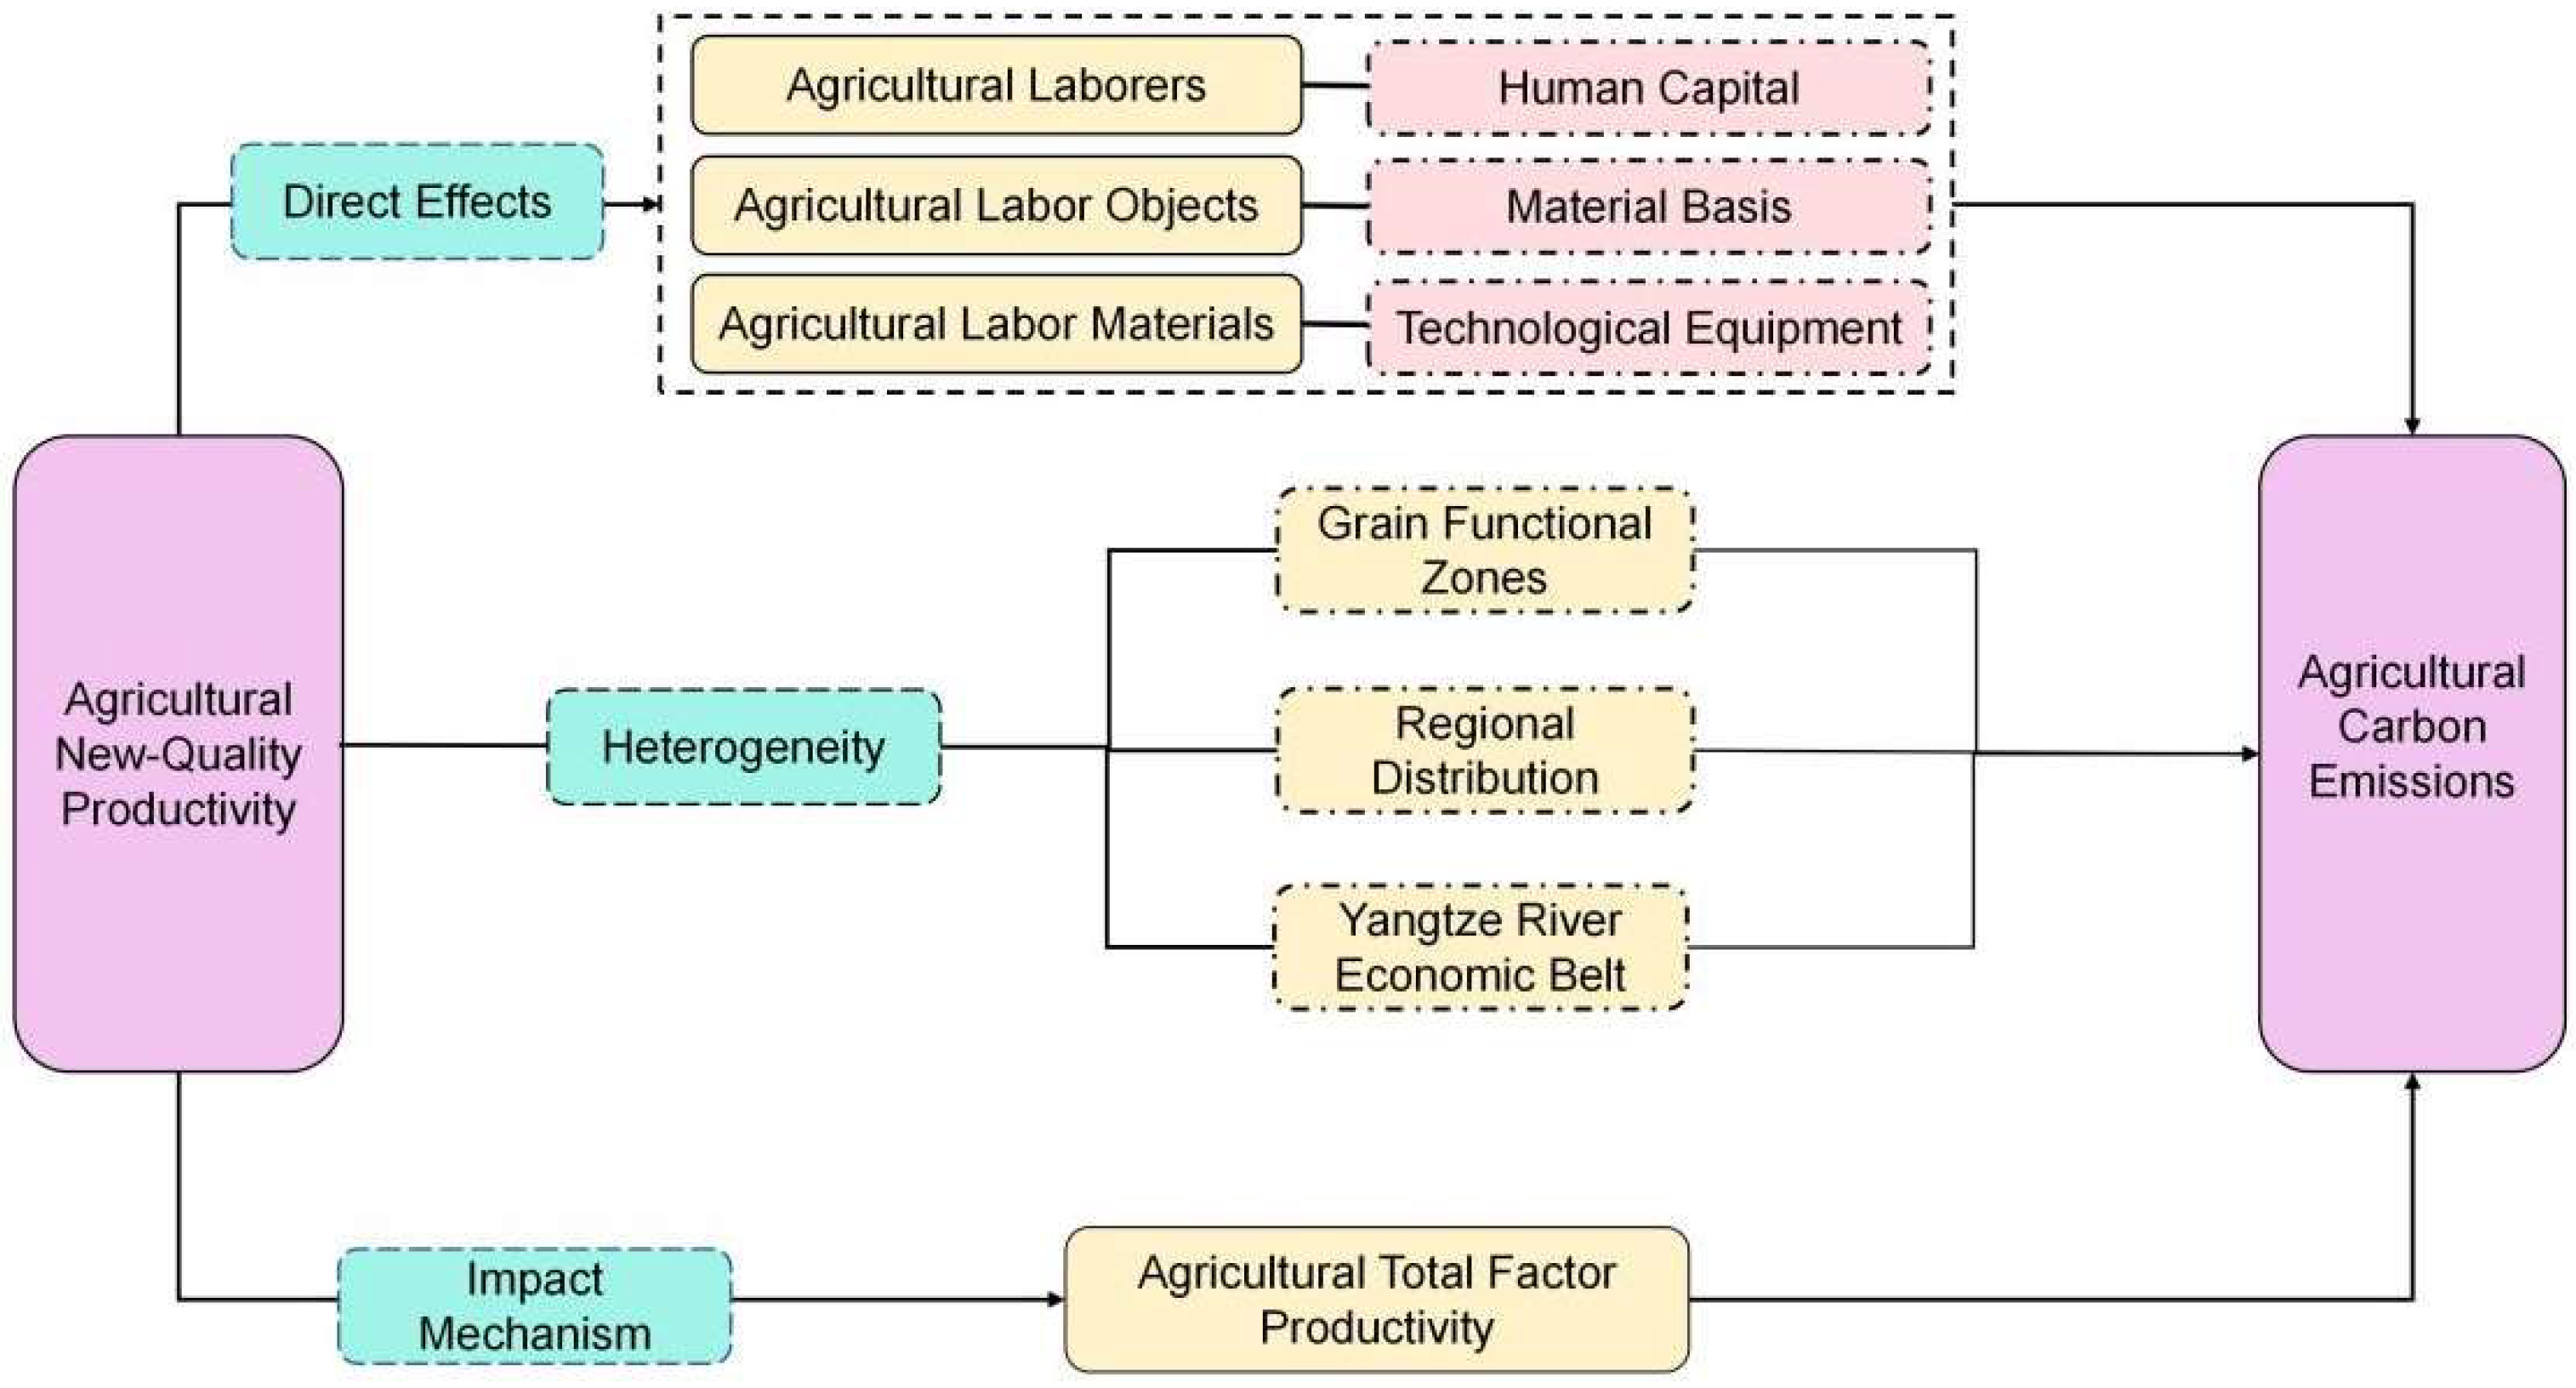
In agriculture, ANQP takes the form of advances such as biotechnology, smart machinery, and digital tools. These advances reallocate production factors—for example, data becoming a new farm input—and shift farming from traditional planting to precision agriculture, smart farms, and green low-carbon modes. In this process, agricultural emissions can be significantly reduced. Based on this idea, we build the theoretical framework in Figure 1.
Figure 1.
Theoretical framework of analysis.
2.1. Direct Effect
ANQP shares the same logic as China’s “dual-carbon” goal, both guided by new development concepts to promote high-quality growth [38,39]. ANQP affects agricultural emissions through laborers, production materials, and production objects, and can reduce emissions in several ways. First, ANQP improves the quality of agricultural labor. It cultivates skilled workers who match the needs of modern agriculture. A more professional labor force allows for intensive management. Intensive management reduces waste of inputs. Reduced waste helps cut unnecessary carbon emissions [40]. Second, ANQP relies on digital platforms. Examples include smart agricultural parks and digital management systems. These tools change how farmers access and use knowledge. Farmers can obtain real-time information. They can make more precise production decisions. Precision farming reduces fertilizer use. It also lowers pesticide application. This avoids traditional high-emission practices that were often used to stabilize yields. As a result, the production process becomes greener and more efficient. Third, ANQP encourages the adoption of energy-saving machinery. New equipment improves fuel efficiency. It reduces diesel consumption in farming. At the same time, higher mechanization raises productivity. Technical innovation improves resource use efficiency. Better use of resources lowers carbon emissions. Over time, the cumulative effect of technology adoption is a steady reduction in agricultural emissions [41,42].
H1.
There is a significant negative relationship between ANQP and agricultural carbon emissions, indicating that higher levels of ANQP reduce agricultural carbon emissions.
China’s regions differ in economic levels, resources, digitalization, and policies. These differences make the impact of ANQP on emissions vary across regions. In the West, supportive policies such as “Western Development” and lower economies of scale allow ANQP to show stronger effects [43]. In the East, high economic and technological levels and fast policy response also matter, while the Central region still relies on traditional practices due to weak technology and low digitalization [44]. Grain production areas and non-grain areas also differ. Grain areas must secure yields, and subsidies often go to yield-boosting inputs, which increase emissions. Traditional, high-input modes are still common in these provinces [45]. By contrast, non-grain areas have less yield pressure and can use ANQP more effectively for emission reduction. Regional gaps also appear between the Yangtze River Economic Belt, which benefits from strong policy support and active green innovation, and non-Yangtze areas, where ANQP is less developed. Similarly, regions with higher agricultural subsidies can better combine ANQP with low-carbon development, while low-support regions may not see the same effects.
H2.
The magnitude of the negative effect of ANQP on agricultural carbon emissions varies significantly across regions.
2.2. Mechanism of ANQP’s Impact on Agricultural Carbon Emissions
ANQP reduces emissions mainly by raising efficiency through advanced technologies and innovative models. For example, smart machines—such as satellite-controlled land levelers, unmanned tractors, and electric seeders—are used in modern farms. These integrate seeding, planting, and harvesting, cut repeated work and idling, reduce fuel use and field emissions, and at the same time raise labor productivity and save cost and time. Traditional farming cannot match these results. Biotechnology also matters. Gene editing and other frontier methods create crop varieties with better resistance, higher yield, and improved quality. This reduces fertilizer, pesticide, and irrigation needs for the same output, lowering emissions of N2O, energy-related CO2, and CH4 from rice fields. Systematic efficiency improvement provides a strong base for emission reduction. High-efficiency systems cut input intensity, spread clean and energy-saving technology, and improve material and energy cycling. This reduces reliance on fossil fuels and high-carbon inputs, lowering total and per-unit emissions. In this way, agriculture can keep output stable while moving toward low-carbon and sustainable growth.
H3.
Agricultural production efficiency serves as a mediating mechanism through which ANQP reduces agricultural carbon emissions.
3. Materials and Methods
3.1. Models
3.1.1. Measurement of ANQP
Following Lei et al. [28], this study measures ANQP from three aspects: agricultural laborers, production objects, and production materials. Based on these dimensions, we build the ANQP indicator system shown in Table 1.
Table 1.
Evaluation index of ANQP.
To ensure the objectivity and scientific validity of the indicator weighting, this study adopts the entropy method to conduct a weighted comprehensive evaluation of grain production resilience. The entropy method is an objective weighting technique based on information entropy theory. Its core idea is that the greater the variation of an indicator across regions, the more information it conveys, and the higher the weight it should be assigned. The calculation steps are as follows:
First, data standardization. To eliminate the dimensional differences among indicators and unify their directions, the raw data are normalized using the range standardization method. For positive indicators, where a larger value indicates higher resilience:
For negative indicators, where smaller values represent higher resilience:
Second, calculate the weight of each indicator. The standardized value of the indicator for the sample is converted into a proportional value using the following formula:
Third, calculate the information entropy. The formula for information entropy is expressed as follows:
Fourth, calculate the redundancy. Redundancy reflects the variability of an indicator: the greater the variability, the higher the redundancy, which indicates that the indicator contributes more information. The calculation formula is expressed as follows:
Fifth, calculate the weight of each indicator. The formula is as follows:
Sixth, calculate the composite score (grain production resilience index). The composite resilience score of each region is obtained by the weighted summation:
3.1.2. Measurement of Agricultural Carbon
Following Ye et al. [24], six principal agricultural carbon sources are considered (Table 2), and total carbon emissions from crop production are calculated accordingly. The calculation formula is:
Table 2.
Major carbon sources in crop production and their emission coefficients.
In Equation (1), represents carbon emissions, represents carbon source, and represents coefficient of the i-th source. To avoid zero values in agricultural carbon emissions, taking the logarithm directly would affect model. Therefore, one is added to the total emissions prior to taking logarithms. This processed variable is used as the dependent variable of the analysis.
3.1.3. Model of ANQP’s Impact on Agricultural Carbon Emissions
To investigate the direct influence of ANQP on agricultural carbon, this paper builds a panel fixed-effects model, drawing on previous studies [46]. Fixed effects purge this bias by absorbing province constants and common time shocks, so identification comes from within-province variation over time. Compared with random effects or pooled OLS, fixed effects are more appropriate for balanced provincial panel and research focus. The model is defined as:
In Equation (10), represents the agricultural carbon emissions. denotes the ANQP level. is control variables. refers to province fixed effects, which control for unobservable regional heterogeneity. is the time fixed effect that captures omitted variables that do not vary across provinces but change over time. is the random error term. All regressions are estimated with province and year fixed effects. Standard errors are computed using Arellano/White cluster-robust variance estimators via xtreg, fe vce (robust), which are clustered at the province level and are robust to within-province serial correlation and groupwise heteroskedasticity.
3.1.4. Mechanism Effect Model
On the basis of the baseline regression, a mechanism model is developed that incorporates agricultural production efficiency as a mediator. The aim is to explore the transmission pathway through which ANQP affects agricultural carbon emissions. Specifically, total factor productivity (TFP) is selected as the metric for agricultural production efficiency. The model is specified as follows:
In Equation (11), represents agricultural production efficiency. The definitions of other variables are the same as in Equation (10). If is significantly positive, it indicates that ANQP improves agricultural production efficiency. This improvement will in turn strengthen the ANQP.
3.2. Variable Selection
3.2.1. Dependent Variable: Agricultural Carbon Emissions
The dependent variable is agricultural carbon emissions. Six main carbon sources are considered: chemical fertilizers, pesticides, agricultural film, diesel, irrigation, and tillage. The carbon emissions from each input are calculated according to their respective emission coefficients. To avoid zero values, the total emissions are log-transformed after adding one, and this value is taken as the final dependent variable.
3.2.2. Core Explanatory Variable: ANQP
The core explanatory variable is ANQP. Based on existing studies, this paper constructs an ANQP index for agriculture from labor quality, production input allocation, and application of science and technology. The specific measurement method has been introduced earlier. This variable reflects not only the overall level of green technologies, digital tools, and factor optimization in agricultural production, but also the potential of the agricultural system in low-carbon transition and climate risk adaptation. By linking ANQP with agricultural carbon emissions, this study provides insight into how ANQP promotes green development, reduces emissions, and contributes to food system sustainability.
3.2.3. Control Variables
Following Xiong et al. [47], four control variables are selected: annual average temperature (AAT), fiscal support for agriculture (Fasl), agricultural import dependence (Aidd), and industrial structure upgrading (ISU). AAT is included because climate factors affect agricultural production, and different temperatures influence both output and greenhouse gas emissions. The definitions are as follows: AAT refers to the annual average temperature of each provincial capital city; Fasl is measured by the ratio of expenditure on agriculture, forestry, and water affairs to local public fiscal expenditure; Aidd is the ratio of grain import value to grain production value; ISU is measured by the ratio of value added in the tertiary industry to that in the secondary industry. To ensure data completeness and accuracy, linear interpolation was applied only to the variable of Fasl, which had one-year gaps for a few provinces.
3.3. Data Sources
To ensure data quality and methodological rigor, the following procedures were applied. First, the sample selection follows the principle of data continuity and completeness. The study includes 30 Chinese provinces from 2012 to 2022, while Tibet, Hong Kong, Macao, and Taiwan were excluded due to incomplete or inconsistent agricultural statistics. Second, regarding inclusion and exclusion criteria, only indicators with continuous time-series data and less than 5% missing values were retained. When small data gaps existed (e.g., for Fasl), linear interpolation was used, following the procedures described in Section 3.2.3. Third, for data validity and reliability verification, all data were cross-checked across multiple official sources (China Statistical Yearbook, China Rural Statistical Yearbook, and China Agricultural Statistical Report) to ensure internal consistency. Descriptive statistics were examined for outliers and extreme values, and all continuous variables were tested for multicollinearity (VIF < 5) and heteroskedasticity, confirming reliability and comparability across regions and years. Descriptive statistics of all variables are reported in Table 3.
Table 3.
Descriptive Statistics.
4. Results and Discussion
4.1. Multicollinearity Test
Before conducting the baseline regression, a multicollinearity test was carried out to avoid estimation bias caused by correlations among variables. The results are shown in Table 4. The mean VIF is 1.8, and the maximum VIF is 2.573, all below the threshold of 10, indicating that multicollinearity is not a concern.
Table 4.
Multicollinearity test results.
4.2. Baseline Regression
To examine the effect of agricultural new-quality productive forces (Newp) on agricultural carbon emissions (Lnco2), two baseline regressions were conducted: one without control variables and the other including all control variables. Comparative estimates are used to assess whether the effect of ANQP is consistent and robust; the results are reported in Table 5.
Table 5.
Baseline regression results.
In column (1), without control variables, the coefficient of Newp is −0.698, which is significantly negative at the 1% level. This indicates that Newp significantly reduces agricultural carbon emissions, providing preliminary support for Hypothesis H1. In column (2), after adding control variables, the coefficient of Newp is −0.387, still significantly negative at the 5% level. This shows that the development of Newp continues to effectively reduce agricultural carbon emissions, further confirming Hypothesis H1. This means that technological upgrading and factor optimization under ANQP have a meaningful practical impact on reducing agricultural emissions and improving sustainability outcomes. Similar findings are reported by Tian and Zhang [48], who observed that improvements in agricultural technology and factor allocation reduce carbon intensity and energy consumption.
After adding control variables, the value of the model increased from 0.024 to 0.549, which means the explanatory power improved a lot and the risk of serious omitted variable bias was reduced. This also makes the coefficient of the core variable (Newp) closer to the real effect, that is, a 1% increase in ANQP reduces agricultural carbon emissions by 0.387 percentage points. For the control variables, fiscal support for agriculture (Fasl), agricultural import dependence (Aidd), industrial structure upgrading (ISU), and average annual temperature (AAT) all had significant effects on agricultural carbon emissions. AAT was significantly negative at the 5% level, showing that moderate warming can improve crop yield efficiency and reduce emissions, which is consistent with the findings of Bhatti et al. [49]. Fasl was significantly positive at the 1% level, meaning that if fiscal spending is concentrated on traditional factors, it will increase the reliance on high-carbon inputs [50]. Aidd was significantly negative at the 1% level, showing that trade openness can ease domestic high-carbon production pressure. Lu et al. reported the opposite result, showing that trade liberalization raises emissions [51], but the difference comes from the fact that our data are agricultural while theirs are industrial. ISU was significantly negative at the 1% level, showing the positive role of structural optimization in promoting agricultural low-carbon transition [52]. These findings confirm that structural, fiscal, and trade policies jointly shape the carbon efficiency of agricultural systems, offering practical guidance for policy design in sustainable agriculture.
4.3. Robustness Tests
4.3.1. Adjusting the Sample Period
The sample period in this study covers 2012–2022. However, the concept of ANQP had not yet been proposed in the early years, and related policies were also lagging. To avoid bias, the sample period is adjusted and the model is re-estimated over two sub-periods: 2015–2022 and 2018–2022. The results are shown in columns (1) and (2) of Table 6. ANQP still shows a significant negative effect on agricultural carbon emissions. In particular, for 2018–2022, the coefficient is −0.767, which means a 1% increase in ANQP reduces agricultural carbon emissions by 0.767 percentage points, showing stronger effects in the later period.
Table 6.
Robustness test results.
4.3.2. Excluding Municipalities
We excluded the four municipalities of Beijing, Shanghai, Chongqing, and Tianjin to avoid potential bias from these highly developed and special administrative regions. The results are reported in column (3) of Table 6. ANQP remains significantly negative at the 5% level, with a coefficient of −0.335.
4.3.3. Winsorizing the Data
To reduce the influence of outliers while keeping all observations, a 1% winsorization is applied to all variables. The results are shown in column (4) of Table 6. ANQP is still significantly negative at the 5% level, with a coefficient of −0.465. Overall, across all robustness checks, the negative effect of ANQP on agricultural carbon emissions remains stable.
4.4. Heterogeneity Tests
4.4.1. Regional Heterogeneity
Considering that the development of ANQP varies across regions in China, the sample is divided into eastern, central, and western groups for regression analysis to examine the differentiated impacts of ANQP on agricultural carbon emissions. The results are shown in Table 7. In the western region, ANQP is significant at the 1% level, with a coefficient of −1.739, meaning that a 1% increase in ANQP reduces agricultural carbon emissions by 1.739 percentage points. This shows a strong carbon reduction effect of ANQP in the west. In the eastern region, although the result is not statistically significant, the coefficient is still negative, suggesting that ANQP also helps reduce emissions, but the effect is weak. In the central region, however, a slight positive effect is observed. This gradient is consistent with Ye et al. [24] and Lei et al. [28], who report that policy incentives and digital/green technology diffusion generate larger carbon-intensity reductions in less-saturated regions, whereas technologically advanced eastern provinces face diminishing returns and machinery-related energy use that can offset gains.
Table 7.
Regional heterogeneity analysis.
The different results may come from variations in regional conditions. In the west, the “Western Development” strategy has directed more fiscal support toward ecological agriculture projects such as returning farmland to forests, shelterbelt construction, and photovoltaic agriculture. These policies are directly linked to emission reduction goals. At the same time, the lower level of economies of scale in western agriculture makes marginal policy effects more obvious. Together, these factors allow ANQP to better optimize resource allocation and unlock the west’s carbon reduction potential [50]. In contrast, the east has strong economic foundations, high technological innovation, and advanced agricultural production and infrastructure. Since intensive production is already achieved, further reductions would require disruptive innovation, while extensive use of machinery may even increase emissions, weakening the overall reduction effect. In the central region, the slight positive effect indicates that ANQP has not been fully integrated with agriculture, and thus does not significantly boost efficiency or reduce emissions. Agriculture there still relies heavily on fertilizers and pesticides, with weaker adoption of new technologies and digitalization. Therefore, due to differences in economic development, innovation capacity, and policy implementation, the effect of ANQP on reducing agricultural carbon emissions shows clear regional heterogeneity [53].
4.4.2. Heterogeneity Across Grain Functional Regions
China’s main grain-producing areas and non-grain-producing areas differ in production modes, resource endowments, policy preferences, and technological path dependence, which may lead to different effects of ANQP on carbon emissions. The heterogeneity test results are reported in Table 8, with column (1) showing results for grain-producing areas and column (2) for non-grain-producing areas. The results indicate that ANQP has a strong negative effect on agricultural carbon emissions in non-grain-producing areas, while it shows a weak positive effect in grain-producing areas. In column (2), the coefficient is −1.166 and significant at the 1% level, meaning that ANQP can significantly reduce agricultural carbon emissions in non-grain-producing regions. In column (1), the coefficient for grain-producing areas is slightly positive and not significant. Ye et al. [43] also found that many policies can be more effectively implemented in China’s non-grain-producing regions.
Table 8.
Heterogeneity analysis across grain functional regions.
Several reasons may explain this result. Grain-producing areas often have stronger agricultural capacity and higher mechanization levels. Since mechanization is positively correlated with carbon emissions, intensive operations and high fiscal support directed toward yield enhancement (with a significant positive coefficient of 3.489) may offset the reduction effect. At the same time, grain-producing regions shoulder the key responsibility of national food security. Local governments tend to prioritize short-term yield maximization, sometimes relying on increased use of fertilizers and pesticides or expanding irrigation areas with high emissions. Rice cultivation, which accounts for a large share in these areas, produces high methane emissions and is costly to control [48]. These factors may increase carbon emissions, making the reduction effect of ANQP weaker than the emission growth caused by production expansion. In contrast, non-grain-producing areas face less pressure to ensure yields, allowing more resources to be directed toward technological promotion and innovation. This supports the development of ANQP and enhances its effectiveness in reducing agricultural carbon emissions [54,55].
4.4.3. Heterogeneity by Yangtze River Economic Belt
The Yangtze River Economic Belt (YREB) is a key area of China’s economic development, with clear advantages in development model, resource endowment, and policy support. The level of ANQP integration with agriculture and technology application in this region may differ significantly from other areas. The YREB covers 11 provinces and municipalities: Shanghai, Jiangsu, Zhejiang, Anhui, Jiangxi, Hubei, Hunan, Chongqing, Sichuan, Yunnan, and Guizhou. The sample is divided into YREB and non-YREB for regression analysis, with results shown in Table 9.
Table 9.
Heterogeneity analysis by Yangtze River Economic Belt.
Columns (1) and (2) show that the coefficients of ANQP are negative and significant, at the 5% and 1% levels, respectively. After adding control variables, the significance of ANQP improves from 5% to 1%, while the coefficient changes from −1.003 to −0.727. In the non-YREB sample, ANQP also has a negative coefficient but is not statistically significant. These results indicate that ANQP reduces agricultural carbon emissions in both regions, with stronger effects in the YREB.
The reasons may be that as a national strategic region, the YREB responds more quickly to national policies and adopts green technology innovation to effectively cut emissions. ANQP in this region has been better applied to agricultural systems and has delivered stronger carbon reduction outcomes [56]. In contrast, the non-YREB regions are less industrialized, ANQP is less integrated with traditional industries, and the spillover effects of emission reduction technologies are limited [57,58].
4.4.4. Heterogeneity Analysis by Fiscal Support Level
Capital is an important driver of development, and fiscal support for agriculture is a key policy tool to promote technological progress and transformation of production methods. However, due to regional differences in fiscal support levels, the contribution of ANQP to carbon reduction may vary. In this study, provinces were ranked by the average level of fiscal support, with those above 0.12 defined as high-support regions and those below 0.12 as low-support regions. The heterogeneity analysis results are reported in Table 10.
Table 10.
Heterogeneity analysis by fiscal support level.
In high-support regions (columns (1) and (2)), the mitigating effect of ANQP on agricultural carbon emissions is significant. In particular, column (2) shows a stronger negative effect: a 1% increase in ANQP leads to a 0.79 percentage point reduction in emissions. This finding is consistent with the policy objective, suggesting that fiscal investment can continuously empower the development of ANQP by stimulating technological innovation, optimizing resource allocation, and promoting industrial upgrading, thereby achieving agricultural carbon reduction targets. By contrast, in low-support regions (columns (3) and (4)), ANQP still has a negative effect on carbon emissions, and column (4) passes the 10% significance test. This indicates that even in regions with weaker fiscal support, ANQP can still reduce agricultural carbon emissions to some extent. However, in these regions, agricultural production often relies on traditional high-carbon models, while ANQP involves more intensive production methods and energy-consuming equipment. Without adequate fiscal and policy support, improving energy efficiency may not achieve expected emission reductions and could even increase carbon intensity due to shifts in production modes. Therefore, Hypothesis H2 is supported.
4.5. Mechanism Analysis
To test the internal mechanism through which ANQP affects agricultural carbon emissions by improving efficiency, this paper introduces TFP as a mediating variable. In the measurement, labor, land, machinery, fertilizers, pesticides, plastic films, and irrigation are selected as inputs, while agricultural gross output value is output. Based on the DEA–Malmquist index method, a global TFP index is constructed; meanwhile, the window analysis method is applied to calculate a window TFP index to reflect short-term efficiency fluctuations. The combination of the two indices allows us to capture both long-term production efficiency and short-term dynamics. The DEA–Malmquist calculations are conducted under a constant-returns-to-scale (CRS) assumption to ensure a common, proportionally scalable provincial production frontier suitable for long-run productivity comparisons across regions. Both the global and window TFP indices are computed in Stata 17 using the malmq2 command. The regression results are shown in Table 11.
Table 11.
Analysis of the mechanism of influence.
From the regression results, the coefficients of ANQP are 0.422 and 0.243 in Models 1 and 2, significant at the 10% and 1% levels, respectively. This indicates that ANQP can reduce agricultural carbon emissions through the channel of enhancing TFP. Specifically, the global TFP index suggests that ANQP improves overall agricultural efficiency in the long run, thereby lowering agricultural carbon emissions; at the same time, the window TFP index shows that even when short-term efficiency fluctuations are considered, ANQP continues to exert a stable mitigating effect. Overall, these findings provide empirical support for Hypothesis H3. This result highlights that improving total factor productivity is not only a statistical mediator but also a practical pathway through which innovation-driven agricultural upgrading supports carbon neutrality goals.
4.6. Discussion
The findings offer insights for enhancing agricultural resilience and advancing sustainable development. Firstly, the development of ANQP can strengthen the resilience of agricultural systems. By improving production efficiency and reducing dependence on high-carbon inputs, agricultural systems gain greater capacity to withstand external shocks. Reduced carbon emissions not only diminish vulnerability to resource constraints, energy price volatility, and climate risks during production, but also facilitate faster recovery and long-term adaptation following shocks.
Secondly, ANQP injects fresh momentum into sustainable agricultural development. Its core characteristics—greening, digitalization, and innovation—align closely with fundamental principles of sustainable agriculture. By integrating clean technologies and digital tools into production, ANQP facilitates the transition from resource-intensive to low-carbon, high-efficiency agriculture. This process alleviates environmental pressures, optimizes resource allocation, and promotes ecological balance [59].
Thirdly, the differentiated effects of ANQP across regions underscore the critical importance of tailored policy design. Significant carbon reduction outcomes were observed in western regions, the Yangtze River Economic Belt, and areas with higher levels of fiscal support for agriculture. This underscores that fiscal backing, institutional design, and technological support are vital conditions for deepening the integration of ANQP with low-carbon transformation [60]. Local governments that establish comprehensive support systems combining fiscal resources, technology, and innovation tailored to regional endowments and industrial characteristics will be better positioned to achieve both agricultural resilience and sustainable development.
Finally, the study underscores the need to reconcile food security with environmental objectives. Major grain-producing regions face structural tensions between safeguarding national food security and balancing output with emission control. Consequently, low-carbon, high-efficiency production pathways should be explored—such as promoting low-emission crop varieties, precision irrigation, and green compensation mechanisms—to ensure food systems are both resilient and aligned with low-carbon transition goals.
5. Conclusions and Policy Implications
5.1. Research Conclusions
Based on panel data from 30 Chinese provinces during 2012–2022, this study employs a fixed-effects model to examine the impact of ANQP on agricultural carbon emissions and its heterogeneity. The main findings are as follows.
First, ANQP can effectively reduce agricultural carbon emissions. Specifically, a 1% increase in ANQP leads to a 0.387 percentage point reduction in agricultural carbon emissions, and this result is robust across multiple tests.
Second, the heterogeneity analysis reveals differentiated effects. ANQP demonstrates significant emission reduction effects in the western region, non-grain-producing areas, the Yangtze River Economic Belt, and regions with high levels of fiscal support for agriculture. In contrast, in the eastern region, non-Yangtze River areas, and regions with low fiscal support, the effect remains negative but statistically insignificant. Notably, in the central region and major grain-producing areas, ANQP even shows a weak positive effect, reflecting structural constraints such as policy priorities on yield maximization and reliance on high-input practices.
Third, the mechanism analysis confirms that ANQP reduces agricultural carbon emissions primarily by improving production efficiency, underscoring efficiency enhancement as an essential mediating pathway for agricultural low-carbon transformation.
5.2. Policy Implications
First, strengthen national support for ANQP to accelerate its integration with green agricultural transformation. The government should improve the overall policy framework by establishing dedicated funds for key technologies such as smart machinery, precision irrigation, and biological carbon sequestration. Financial institutions should expand green credit and insurance products to help farmers and enterprises invest in low-carbon equipment and digital tools. Tax incentives and subsidies should be aligned with emission reduction targets to ensure sustained incentives for innovation and technology adoption.
Second, promote region-specific strategies to advance ANQP according to local conditions. Provinces with strong carbon-reduction effects should deepen ANQP application by linking it with local industrial chains and promoting large-scale demonstration projects. In the central region, targeted farmer training and technology extension should be strengthened to improve the understanding and practice of ANQP. In areas with low fiscal support, governments should provide additional financial assistance, guide private capital to participate through credit guarantees, and support the development of digital service platforms to reduce farmers’ adoption costs.
Third, cultivate professional and innovative talent to drive ANQP development. Local governments should set up specialized teams for technology extension and carbon management, helping farmers adopt efficient, low-carbon production modes. Agricultural universities and research institutes should strengthen collaboration with enterprises to train high-level personnel in digital agriculture, green innovation, and sustainability management, forming a talent chain that supports the whole ANQP ecosystem.
5.3. Research Limitations and Future Research Directions
Despite providing systematic theoretical and empirical analysis, this study has several limitations. First, due to data availability, the analysis relies mainly on provincial-level panel data, which may not fully capture micro-level heterogeneity. Future studies could incorporate household or village survey data. Second, the mechanism analysis focuses mainly on efficiency improvement through TFP. Future research could extend this work by using micro-level data and exploring additional mechanisms—such as institutional, market, and social factors—to provide a more comprehensive understanding of how ANQP drives agricultural decarbonization and sustainable transformation.
Author Contributions
Conceptualization, F.Y.; methodology, F.Y. and Q.Z.; software, F.Y.; validation, F.Y.; formal analysis, F.Y.; resources, F.Y.; data curation, F.Y.; writing—original draft preparation, F.Y.; writing—review and editing, F.Y. and Q.Z.; visualization, F.Y.; supervision, Q.Z.; project administration, F.Y.; funding acquisition, F.Y. All authors have read and agreed to the published version of the manuscript.
Funding
This research was funded by Jiangxi Provincial Social Science Foundation Project (Grant No. 25YJ20) and Jiangxi Provincial Education Science Planning Project (2025GYB058).
Informed Consent Statement
Not applicable.
Data Availability Statement
The data can be found according to the corresponding data source. Scholars requesting more specific data may email the corresponding author or the first author.
Conflicts of Interest
The authors declare no conflicts of interest.
References
- Liu, Z.; Deng, Z.; Davis, S.J.; Giron, C.; Ciais, P. Monitoring global carbon emissions in 2021. Nat. Rev. Earth Environ. 2022, 3, 217–219. [Google Scholar] [CrossRef] [Scilit]
- Chen, L.; Xu, L.; Cai, Y.; Yang, Z. Spatiotemporal patterns of industrial carbon emissions at the city level. Resour. Conserv. Recycl. 2021, 169, 105499. [Google Scholar] [CrossRef] [Scilit]
- Han, G.; Xu, J.; Zhang, X.; Pan, X. Efficiency and driving factors of agricultural carbon emissions: A study in Chinese state farms. Agriculture 2024, 14, 1454. [Google Scholar] [CrossRef] [Scilit]
- Ji, M.; Li, J.; Zhang, M. What drives the agricultural carbon emissions for low-carbon transition? Evidence from China. Environ. Impact Assess. Rev. 2024, 105, 107440. [Google Scholar] [CrossRef] [Scilit]
- Zhu, Y.; Huo, C. The impact of agricultural production efficiency on agricultural carbon emissions in China. Energies 2022, 15, 4464. [Google Scholar] [CrossRef] [Scilit]
- Li, J.; Gao, M.; Luo, E.; Wang, J.; Zhang, X. Does rural energy poverty alleviation really reduce agricultural carbon emissions? The case of China. Energy Econ. 2023, 119, 106576. [Google Scholar] [CrossRef] [Scilit]
- Song, S.; Zhao, S.; Zhang, Y.; Ma, Y. Carbon emissions from agricultural inputs in China over the past three decades. Agriculture 2023, 13, 919. [Google Scholar] [CrossRef] [Scilit]
- Guo, Z.; Zhang, X. Carbon reduction effect of agricultural green production technology: New evidence from China. Sci. Total Environ. 2023, 874, 162483. [Google Scholar] [CrossRef] [Scilit] [PubMed]
- Guo, L.; Zhao, S.; Song, Y.; Tang, M.; Li, H. Green finance, chemical fertilizer use and carbon emissions from agricultural production. Agriculture 2022, 12, 313. [Google Scholar] [CrossRef] [Scilit]
- Nazir, M.J.; Li, G.; Nazir, M.M.; Zulfiqar, F.; Siddique, K.H.; Iqbal, B.; Du, D. Harnessing soil carbon sequestration to address climate change challenges in agriculture. Soil Tillage Res. 2024, 237, 105959. [Google Scholar] [CrossRef] [Scilit]
- Oldfield, E.E.; Eagle, A.J.; Rubin, R.L.; Rudek, J.; Sanderman, J.; Gordon, D.R. Crediting agricultural soil carbon sequestration. Science 2022, 375, 1222–1225. [Google Scholar] [CrossRef] [Scilit]
- Lin, L.; Gu, T.; Shi, Y. The influence of new quality productive forces on high-quality agricultural development in China: Mechanisms and empirical testing. Agriculture 2024, 14, 1022. [Google Scholar] [CrossRef] [Scilit]
- Zou, J.; Shen, L.; Wang, F.; Tang, H.; Zhou, Z. Dual carbon goal and agriculture in China: Exploring key factors influencing farmers’ behavior in adopting low carbon technologies. J. Integr. Agric. 2024, 23, 3215–3233. [Google Scholar] [CrossRef] [Scilit]
- Lu, H.; Chen, Y.; Luo, J. Development of green and low-carbon agriculture through grain production agglomeration and agricultural environmental efficiency improvement in China. J. Clean. Prod. 2024, 442, 141128. [Google Scholar] [CrossRef] [Scilit]
- Yang, X.; Zhou, X.; Deng, X. Modeling farmers’ adoption of low-carbon agricultural technology in Jianghan Plain, China: An examination of the theory of planned behavior. Technol. Forecast. Soc. Change 2022, 180, 121726. [Google Scholar] [CrossRef] [Scilit]
- Liu, Y.; He, Z. Synergistic industrial agglomeration, new quality productive forces and high-quality development of the manufacturing industry. Int. Rev. Econ. Financ. 2024, 94, 103373. [Google Scholar] [CrossRef] [Scilit]
- Xie, F.; Jiang, N.; Kuang, X. Towards an accurate understanding of ‘new quality productive forces’. Econ. Political Stud. 2025, 13, 1–15. [Google Scholar] [CrossRef] [Scilit]
- Huang, Q.; Guo, W.; Wang, Y. A study of the impact of new quality productive forces on agricultural modernization: Empirical evidence from China. Agriculture 2024, 14, 1935. [Google Scholar] [CrossRef] [Scilit]
- Xu, S.; Wang, J.; Peng, Z. Study on the promotional effect and mechanism of new quality productive forces on green development. Sustainability 2024, 16, 8818. [Google Scholar] [CrossRef] [Scilit]
- Dai, D.; Zheng, Y. The New Quality Productive Force, Science and Technology Innovation, and Optimization of Industrial Structure. Sustainability 2025, 17, 4439. [Google Scholar] [CrossRef] [Scilit]
- Jin, M.; Feng, Y.; Wang, S.; Chen, N.; Cao, F. Can the development of the rural digital economy reduce agricultural carbon emissions? A spatiotemporal empirical study based on China’s provinces. Sci. Total Environ. 2024, 939, 173437. [Google Scholar] [CrossRef] [Scilit]
- Jahangir, M.H.; Montazeri, M.; Mousavi, S.A.; Kargarzadeh, A. Reducing carbon emissions of industrial large livestock farms using hybrid renewable energy systems. Renew. Energy 2022, 189, 52–65. [Google Scholar] [CrossRef] [Scilit]
- Huang, J.; Lu, H.; Du, M. Regional differences in agricultural carbon emissions in China: Measurement, decomposition, and influencing factors. Land 2025, 14, 682. [Google Scholar] [CrossRef] [Scilit]
- Ye, F.; Yang, Z.; Yu, M.; Watson, S.; Lovell, A. Can market-oriented reform of agricultural subsidies promote the growth of agricultural green total factor productivity? Empirical evidence from maize in China. Agriculture 2023, 13, 251. [Google Scholar] [CrossRef] [Scilit]
- Zhong, Y.; Lai, H.; Zhang, L.; Guo, L.; Lai, X. Does public data openness accelerate new quality productive forces? Evidence from China. Econ. Anal. Policy 2025, 85, 1409–1427. [Google Scholar] [CrossRef] [Scilit]
- Huang, C.; Zhao, J.; Yang, Z.; Wang, L. The impact mechanisms of new quality productive forces on rural transformation: Evidence from Shandong Province, China. Sustainability 2025, 17, 5869. [Google Scholar] [CrossRef] [Scilit]
- Zhang, Z.; Li, P.; Wang, X.; Ran, R.; Wu, W. New energy policy and new quality productive forces: A quasi-natural experiment based on demonstration cities. Econ. Anal. Policy 2024, 84, 1670–1688. [Google Scholar] [CrossRef] [Scilit]
- Lei, X.; Zhao, W.; Du, H. Study on the impact of new quality productive forces on agricultural green production efficiency. Sci. Rep. 2025, 15, 20652. [Google Scholar] [CrossRef] [Scilit]
- Wang, Q.; Chen, X. Can new quality productive forces promote inclusive green growth: Evidence from China. Front. Environ. Sci. 2024, 12, 1499756. [Google Scholar] [CrossRef] [Scilit]
- Guo, X.; Yang, J.; Shen, Y.; Zhang, X. Prediction of agricultural carbon emissions in China based on a GA-ELM model. Front. Energy Res. 2023, 11, 1245820. [Google Scholar] [CrossRef] [Scilit]
- Xiong, C.; Chen, S.; Xu, L. Driving factors analysis of agricultural carbon emissions based on extended STIRPAT model of Jiangsu Province, China. Growth Change 2020, 51, 1401–1416. [Google Scholar] [CrossRef] [Scilit]
- Shi, H.; Chang, M. How does agricultural industrial structure upgrading affect agricultural carbon emissions? Threshold effects analysis for China. Environ. Sci. Pollut. Res. 2023, 30, 52943–52957. [Google Scholar] [CrossRef] [Scilit] [PubMed]
- Liu, L.; Zhang, L.; Li, B.; Wang, Y.; Wang, M. Can financial agglomeration curb carbon emissions reduction from agricultural sector in China? Analyzing the role of industrial structure and digital finance. J. Clean. Prod. 2024, 440, 140862. [Google Scholar] [CrossRef] [Scilit]
- Yu, Y.; Jiang, T.; Li, S.; Li, X.; Gao, D. Energy-related CO2 emissions and structural emissions’ reduction in China’s agriculture: An input–output perspective. J. Clean. Prod. 2020, 276, 124169. [Google Scholar] [CrossRef] [Scilit]
- Han, H.; Zhong, Z.; Guo, Y.; Xi, F.; Liu, S. Coupling and decoupling effects of agricultural carbon emissions in China and their driving factors. Environ. Sci. Pollut. Res. 2018, 25, 25280–25293. [Google Scholar] [CrossRef] [Scilit]
- Huang, X.; Xu, X.; Wang, Q.; Zhang, L.; Gao, X.; Chen, L. Assessment of agricultural carbon emissions and their spatiotemporal changes in China, 1997–2016. Int. J. Environ. Res. Public Health 2019, 16, 3105. [Google Scholar] [CrossRef] [Scilit]
- Wei, T.; Zhu, Q.; Glomsrød, S. How will demographic characteristics of the labor force matter for the global economy and carbon dioxide emissions? Ecol. Econ. 2018, 147, 197–207. [Google Scholar] [CrossRef] [Scilit]
- Zhao, H.; Li, C.; Yang, Z.; Zhang, Z.; Jin, C.; Guo, S. How can new quality productivity decrease carbon emission intensity? Evidence from 30 provincial regions in China. Energy 2025, 327, 136487. [Google Scholar] [CrossRef] [Scilit]
- Zhang, L. Understanding the new quality productive forces in the energy sector. Energy Nexus 2024, 16, 100352. [Google Scholar] [CrossRef] [Scilit]
- Erickson, B.; Fausti, S.; Clay, D.; Clay, S. Knowledge, skills, and abilities in the precision agriculture workforce: An industry survey. Nat. Sci. Educ. 2018, 47, 1–11. [Google Scholar] [CrossRef] [Scilit]
- Garcia Kerdan, I.; Giarola, S.; Skinner, E.; Tuleu, M.; Hawkes, A. Modelling future agricultural mechanisation of major crops in China: An assessment of energy demand, land use and emissions. Energies 2020, 13, 6636. [Google Scholar] [CrossRef] [Scilit]
- Zhang, J.; Wang, F.; Ding, X. Can agricultural mechanization promote carbon reduction in countries along the Belt and Road? J. Environ. Plan. Manag. 2025, 68, 2194–2216. [Google Scholar] [CrossRef] [Scilit]
- Ye, F.; Qin, S.; Li, H.; Li, Z.; Tong, T. Policy-driven food security: Investigating the impact of China’s maize subsidy policy reform on farmer productivity. Front. Sustain. Food Syst. 2024, 8, 1349765. [Google Scholar] [CrossRef] [Scilit]
- Xu, Y.; Zhang, Y.; Wang, S.; Zhao, M.; Li, G.; Kang, Y.; Zhao, C. Internal mechanism and empirical analysis of digital economy’s impact on agricultural new quality productive forces: Evidence from China. Sustainability 2025, 17, 6844. [Google Scholar] [CrossRef] [Scilit]
- Wang, S.; Jin, M.; Liu, L.; Cao, F. Impacts of China’s main grain-producing areas on agricultural carbon emissions: A sustainable development perspective. Sustainability 2024, 16, 4607. [Google Scholar] [CrossRef] [Scilit]
- Ye, F.; Sun, S.; Razzaq, A.; Zhang, Q. Harvesting environmental sustainability—The fertilizer use efficiency gains of China’s high-standard farmland initiative. Humanit. Soc. Sci. Commun. 2025, 12, 846. [Google Scholar] [CrossRef] [Scilit]
- Xiong, C.; Yang, D.; Xia, F.; Huo, J. Changes in agricultural carbon emissions and factors that influence agricultural carbon emissions based on different stages in Xinjiang, China. Sci. Rep. 2016, 6, 36912. [Google Scholar] [CrossRef] [Scilit] [PubMed]
- Tian, Y.; Zhang, J. Research on spatial-temporal characteristics and driving factor of agricultural carbon emissions in China. J. Integr. Agric. 2014, 13, 1393–1403. [Google Scholar] [CrossRef] [Scilit]
- Bhatti, U.A.; Bhatti, M.A.; Tang, H.; Syam, M.S.; Awwad, E.M.; Sharaf, M.; Ghadi, Y.Y. Global production patterns: Understanding the relationship between greenhouse gas emissions, agriculture greening and climate variability. Environ. Res. 2024, 245, 118049. [Google Scholar] [CrossRef] [Scilit]
- Wang, Y.; Zhang, T.; Wang, X.; Jiang, B.; Huang, X. Impact of technical progress and fiscal support to agriculture on agricultural carbon emissions. Cogent Food Agric. 2024, 10, 2300186. [Google Scholar] [CrossRef] [Scilit]
- Lu, Z.; Mahalik, M.K.; Mallick, H.; Zhao, R. The moderating effects of democracy and technology adoption on the relationship between trade liberalisation and carbon emissions. Technol. Forecast. Soc. Change 2022, 180, 121712. [Google Scholar] [CrossRef] [Scilit]
- Wu, L.; Sun, L.; Qi, P.; Ren, X.; Sun, X. Energy endowment, industrial structure upgrading, and CO2 emissions in China: Revisiting resource curse in the context of carbon emissions. Resour. Policy 2021, 74, 102329. [Google Scholar] [CrossRef] [Scilit]
- Ye, F.; Wang, L.; Razzaq, A.; Tong, T.; Zhang, Q.; Abbas, A. Policy impacts of high-standard farmland construction on agricultural sustainability: Total factor productivity-based analysis. Land 2023, 12, 283. [Google Scholar] [CrossRef] [Scilit]
- Xie, H.; Zhang, Y.; Choi, Y. Measuring the cultivated land use efficiency of the main grain-producing areas in China under the constraints of carbon emissions and agricultural nonpoint source pollution. Sustainability 2018, 10, 1932. [Google Scholar] [CrossRef] [Scilit]
- Xie, Y.; Khan, A.; Wang, Y.; Waqas, M.; Ke, S. Evaluating the impact of agricultural economic quality and energy consumption on greenhouse gas emissions: Evidence from China’s major grain-producing regions. Appl. Energy 2025, 393, 126121. [Google Scholar] [CrossRef] [Scilit]
- Sun, D.; Cai, S.; Yuan, X.; Zhao, C.; Gu, J.; Chen, Z.; Sun, H. Decomposition and decoupling analysis of carbon emissions from agricultural economic growth in China’s Yangtze River economic belt. Environ. Geochem. Health 2022, 44, 2987–3006. [Google Scholar] [CrossRef] [Scilit]
- Wu, H.; Liu, B.; Zhu, B.; Zhen, Z.; Song, K.; Ren, J. Combining Vegetation Indices to Identify the Maize Phenological Information Based on the Shape Model. Agriculture 2024, 14, 1608. [Google Scholar] [CrossRef] [Scilit]
- Jin, S.; Chen, Z.; Bao, B.; Zhang, X. Study on the influence of digital financial inclusion on agricultural carbon emission efficiency in the Yangtze River Economic Belt. Int. J. Low-Carbon Technol. 2023, 18, 968–979. [Google Scholar] [CrossRef] [Scilit]
- Zhao, Y.; Ning, S.; Yan, A.; Jiang, P.; Ren, H.; Li, N.; Huo, T.; Sheng, J. Analysis of Carbon Emissions and Ecosystem Service Value Caused by Land Use Change, and Its Coupling Characteristics in the Wensu Oasis, Northwest China. Agronomy 2025, 15, 2307. [Google Scholar] [CrossRef] [Scilit]
- Khafagy, A.; Vigani, M. External finance and agricultural productivity growth. Agribusiness 2023, 39, 448–472. [Google Scholar] [CrossRef] [Scilit]

Disclaimer/Publisher’s Note: The statements, opinions and data contained in all publications are solely those of the individual author(s) and contributor(s) and not of MDPI and/or the editor(s). MDPI and/or the editor(s) disclaim responsibility for any injury to people or property resulting from any ideas, methods, instructions or products referred to in the content. |
© 2025 by the authors. Licensee MDPI, Basel, Switzerland. This article is an open access article distributed under the terms and conditions of the Creative Commons Attribution (CC BY) license (https://creativecommons.org/licenses/by/4.0/).