


Abstract
Rapid urbanization has increased pressure on ecosystems, posing serious risks to environmental quality and sustainable development. Understanding the spatiotemporal dynamics and driving mechanisms of Fractional Vegetation Cover (FVC), a key indicator of ecological health, is essential for advancing high-quality regional development and ecological civilization. In this study, Normalized Difference Vegetation Index (NDVI), meteorological, and socio-economic data from 2000 to 2022 were used to analyze the changes and driving forces of FVC in the Beijing–Tianjin–Hebei (BTH) urban cluster using a pixel dichotomy model and Partial Least Square–Structural Equation Modeling (PLS–SEM). The CA-Markov model was applied to predict future FVC patterns under different scenarios. The results show that FVC in the BTH increased from 0.462 to 0.576 between 2000 and 2022. However, this positive trend was accompanied by pronounced spatial differences: FVC increased significantly in the northwestern mountains, while it declined in urban built-up areas. PLS–SEM analysis further indicated that climate factors were the main drivers of FVC growth (0.903), whereas socioeconomic (−0.469) and topographic (−0.260) factors exerted limiting effects. Compared with 2022, FVC declined to varying degrees under all scenarios. Notably, the ecological protection scenario resulted in far less FVC degradation than the inertial development and economic priority scenarios. These findings provide scientific support for spatial planning and emphasize the importance of ecological protection policies in sustaining vegetation and promoting long-term sustainable development.
1. Introduction
Global climate change and rapid urbanization significantly affect the sustainable development of ecosystems and socioeconomic systems. Vegetation is an essential component of terrestrial ecosystems [1,2], and serves as a sensitive indicator for observing and responding to climate change [3]. Fractional Vegetation Cover (FVC) reflects ecosystem structure and function [4,5], and is vital for ecological protection and sustainable socioeconomic development. Accurate monitoring of FVC dynamics and understanding its driving forces are thus crucial. Advances in remote sensing technology now allow timely, large-scale monitoring of FVC, facilitating the analysis of its spatial and temporal patterns, the improvement of analytical models, and deeper insights into the underlying drivers [6].
In the field of FVC estimation, various methods such as spectral mixture analysis, machine learning regression techniques, and physical-based inversion models have continuously improved [7], providing more accurate and reliable FVC calculations, even in complex scenarios [8,9,10]. However, the sub-pixel decomposition method based on the pixel dichotomy model remains the most widely adopted technique for remote sensing inversion of FVC [11]. Its popularity stems from clear physical meaning, computational efficiency, and ease of integration with commonly used vegetation indices [12,13]. This model, requiring fewer parameters and being easy to interpret, demonstrates broad applicability and is therefore essential for long-term vegetation monitoring. The Moderate Resolution Imaging Spectroradiometer (MODIS) aboard NASA’s Terra and Aqua satellites provides high-temporal-resolution global observations. Its monthly composite vegetation index products, rigorously corrected for atmospheric effects and geometric distortions, minimize noise from clouds and view-angle variations [14]. These datasets offer a robust basis for applying models such as the pixel dichotomy model for consistent, long-term monitoring of FVC dynamics [15]. Currently, researchers can accurately characterize the spatiotemporal changes in FVC for various areas such as watersheds, cities, and mining regions, by using spatial analysis tools in GIS [16], as well as trend analysis methods like Mann–Kendall tests and Sen’s Slope analysis [17]. Nevertheless, existing studies generally focus on individual, localized areas [18]. There remains a significant research gap concerning systematic analysis at the scale of urban agglomerations, particularly regarding spatial heterogeneity and inter-city interactions within these regions.
Regarding driving factor analysis, studies examining factors influencing FVC have gradually developed into a comprehensive framework involving climate, topography, and human activities [19,20]. Research methods have evolved from analyzing simple correlations toward exploring complex, multi-level interactions among these factors. Currently, most studies use methods such as geo-detector models, correlation analysis [21], and multivariate regression to quantify the impacts of climate and human activities on FVC [22]. These methods can intuitively quantify the correlation between climate, human activities, and FVC, offering a convenient and effective tool for the preliminary assessment of factor influence intensity. However, traditional approaches struggle to fully clarify the interaction pathways and combined effects due to the complexity and interdependency among driving factors. In recent years, Structural Equation Modeling (SEM) has become increasingly popular in ecological research because it simultaneously assesses direct and indirect relationships among multiple influencing factors. This approach provides deeper insights into the underlying mechanisms driving FVC changes.
FVC prediction and simulation, core methods for understanding ecosystem dynamics, have significantly advanced due to interdisciplinary collaboration [23,24,25]. Traditional prediction approaches, such as GIS-based analyses and Excel modeling, are limited by their single-objective perspectives, while classic methods like Markov chains [26] and logistic regression [27] typically focus solely on land-use changes. However, integrating Markov models with Cellular Automata (CA) effectively addresses the spatial and temporal limitations of standalone Markov models [28,29]. The CA–Markov model not only provides accurate quantification of land use transformation processes but is also simpler to operate than many other models. It supports multi-factor and multi-objective scenario simulations, with accuracy comparable to, or even exceeding, that of alternative approaches [30]. Owing to the intrinsic linkage between FVC dynamics and land use patterns, the CA–Markov model has been widely employed in vegetation coverage prediction by directly relating vegetation evolution to changes in land use structure [31]. Compared to methods that require complex nested processes, CA–Markov maintains strong explanatory power while reducing computational complexity and data requirements. Moreover, this model aligns with the current shift from passive prediction to active management in multi-scenario simulations, allowing systematic exploration of FVC evolution pathways [32]. Such analysis provides critical scientific support for regional ecological planning and vegetation restoration policies. Moreover, current multi-scenario FVC simulations primarily emphasize climate-driven dynamics, while largely overlooking the impacts of human factors such as socio-economic transformation.
The Beijing–Tianjin–Hebei urban cluster (BTH), Northern China’s largest urban agglomeration and a significant economic hub, plays a crucial role in achieving China’s “dual carbon” goals and promoting green development. Intensive human activities in this region have drastically altered land-use patterns, encroaching upon ecological spaces such as forests and grasslands around cities. These changes have led to reduced FVC and increased pressures on the region’s ecosystem carrying capacity, posing significant challenges to sustainable development. Therefore, maintaining the ecological barrier function of the BTH region is vital for regional ecological security and achieving China’s green development objectives.
Current research on FVC change still lacks systematic analysis at the urban agglomeration scale, particularly in uncovering regional spatial heterogeneity and intercity interactions. Furthermore, few studies have examined the complex interplay among multiple driving factors—such as topography, climate, and socio-economic conditions—or incorporated multi-scenario simulations. To address existing research gaps, this study focuses on the BTH region, utilizing MODIS data and the pixel dichotomy model to analyze FVC spatiotemporal dynamics from 2000 to 2022. Specifically, the objectives are to (1) integrate topography, climate, and socioeconomic factors and employ DEM to clarify the interactions and influence pathways driving FVC changes, and (2) apply the CA–Markov model to predict future FVC under various development scenarios. This research enhances the understanding of FVC dynamics in the BTH region and provides theoretical and practical guidance for ecological security, environmental quality improvement, balanced urban–rural development, and sustainable regional growth.
2. Materials and Methods
2.1. Research Framework
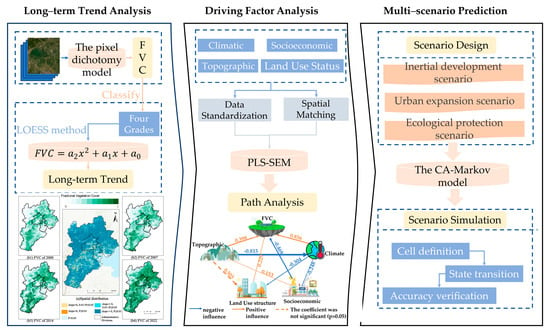
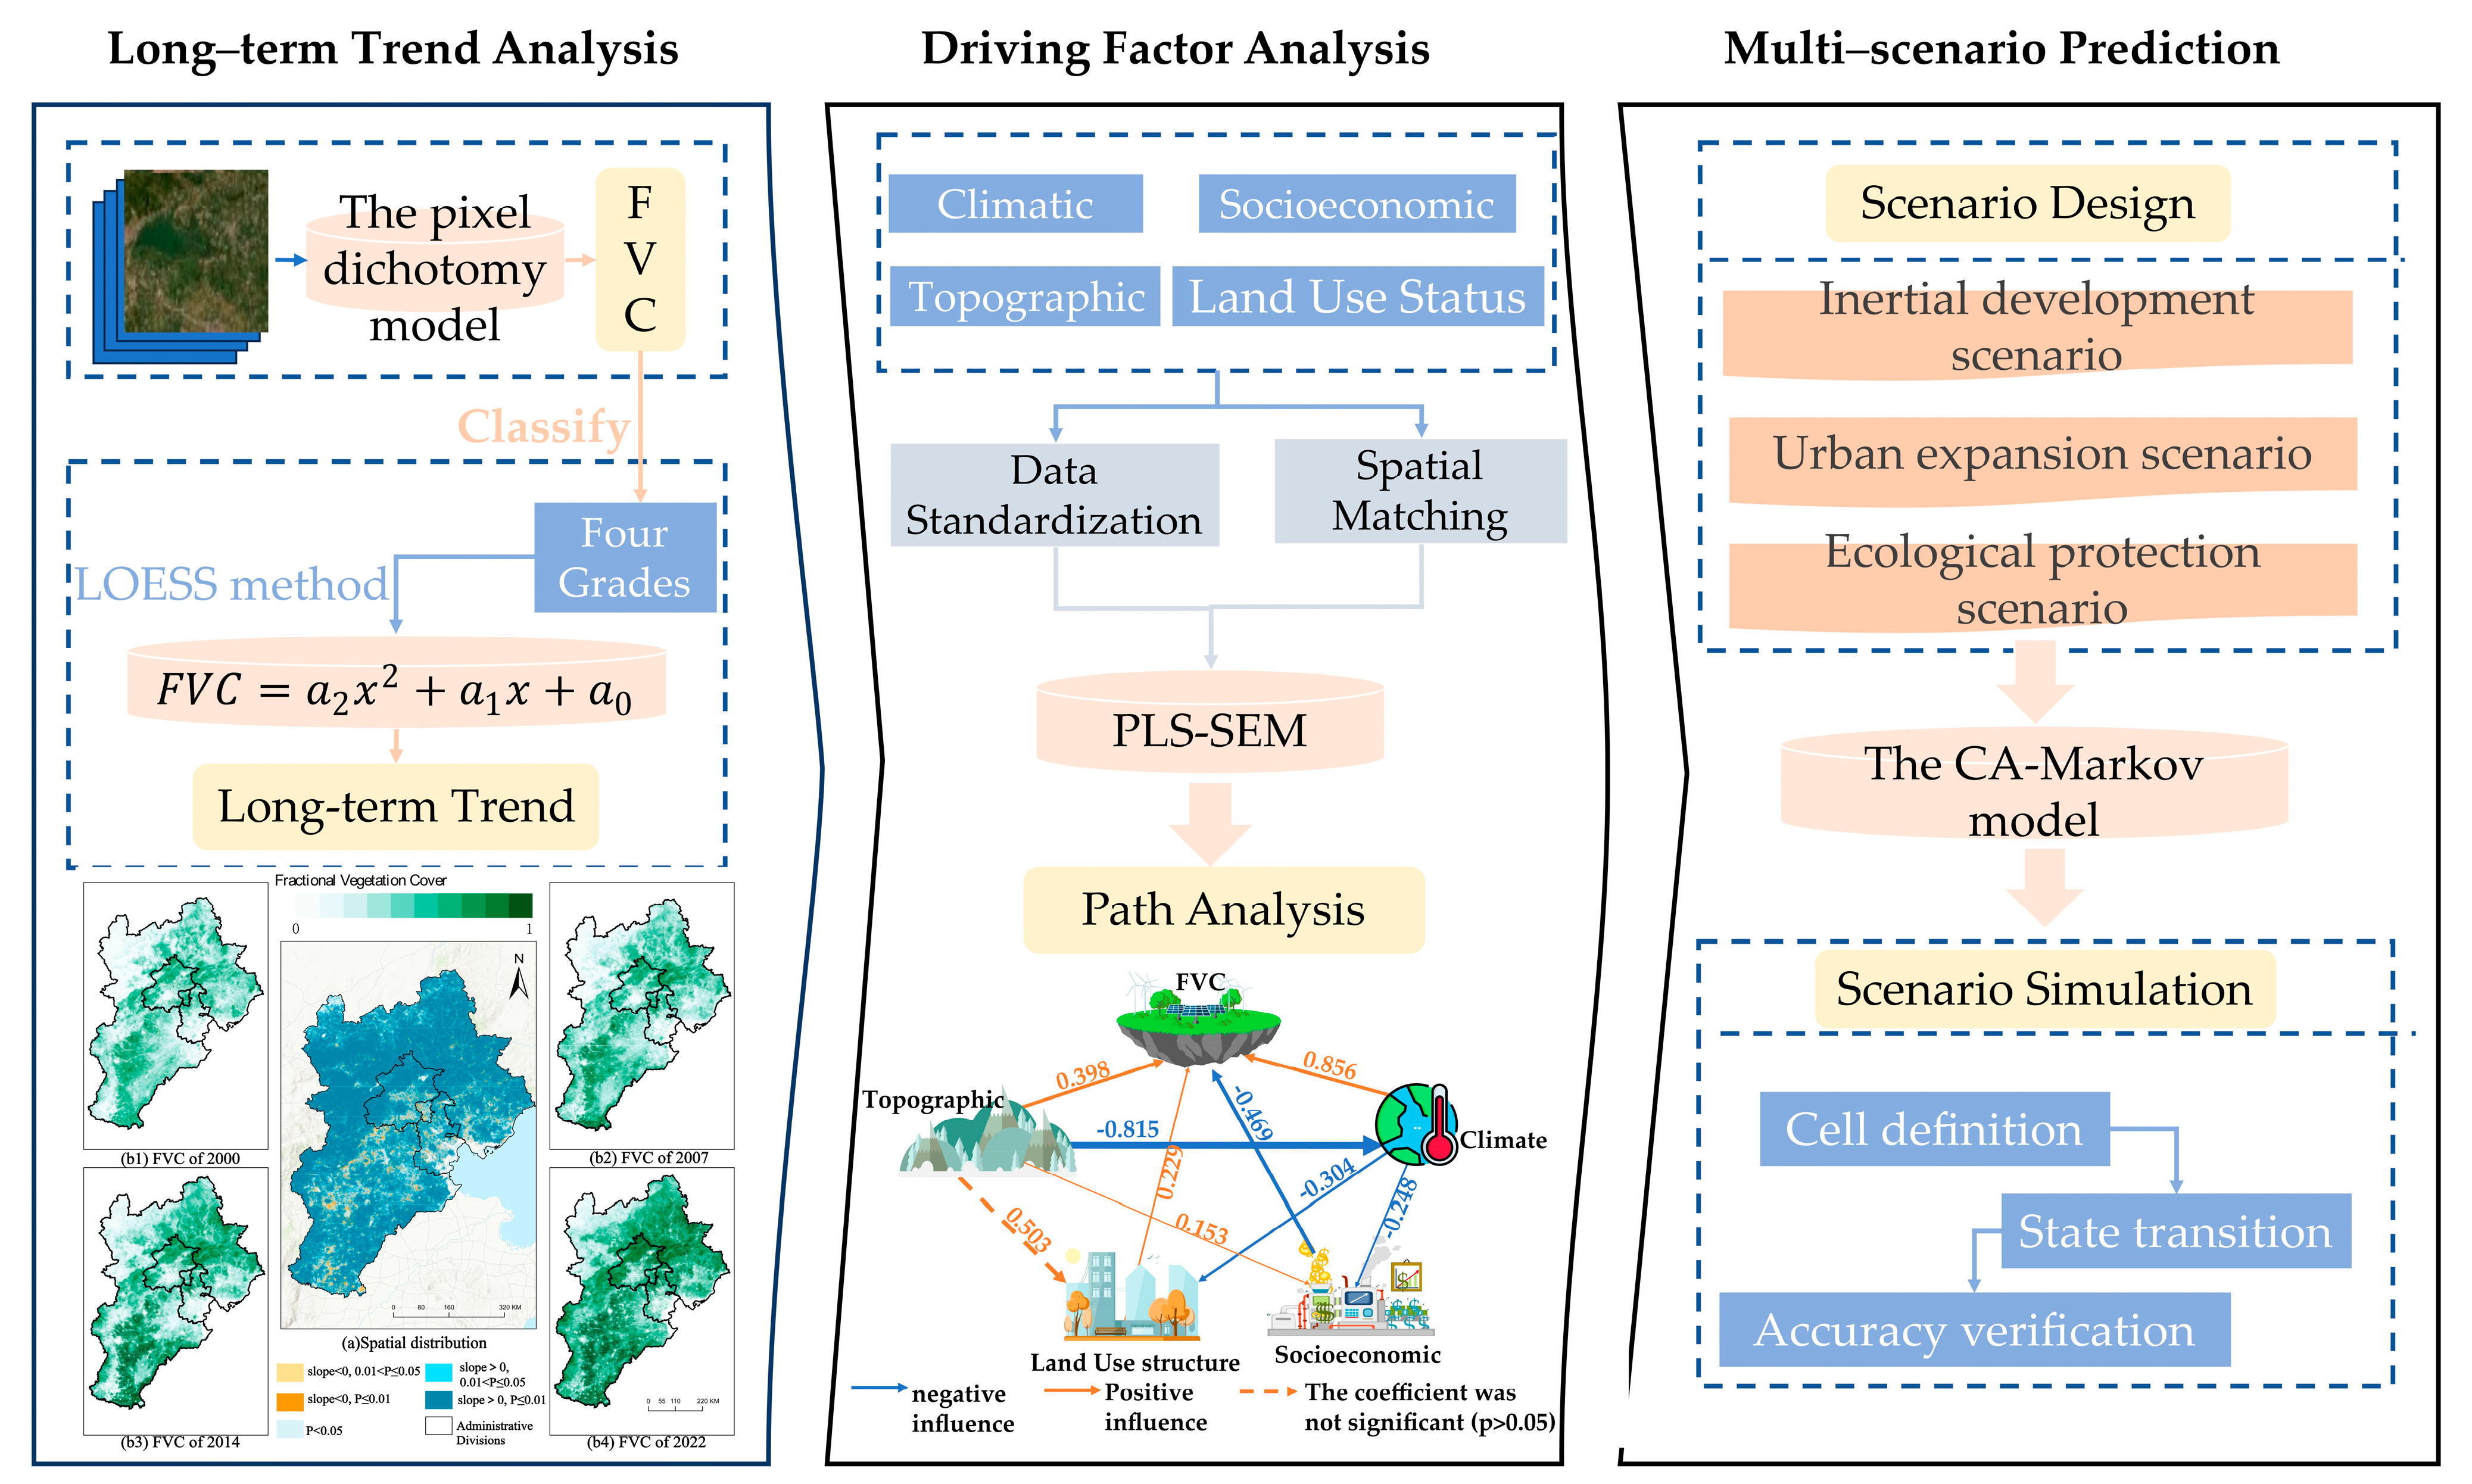
This study integrates spatiotemporal analysis, driving mechanism identification, and scenario-based prediction to assess FVC dynamics in the BTH urban cluster (Figure 1). Multi-source datasets—remote sensing imagery, climatic records, and socio-economic statistics—were preprocessed and analyzed using the pixel dichotomy model to quantify FVC, followed by trend analysis and classification. Partial Least Square–Structural Equation Modeling (PLS–SEM) was employed to reveal direct and indirect effects of topographic, climatic, and socio-economic drivers. Future FVC trajectories were simulated with the CA–Markov model under three scenarios: Inertial Development, Urban Expansion, and Ecological Protection. This integrated approach offers robust insights to guide spatial planning and sustainable development policy.
Figure 1.
Technical roadmap of the methodological framework for FVC analysis.
2.2. Study Area and Data
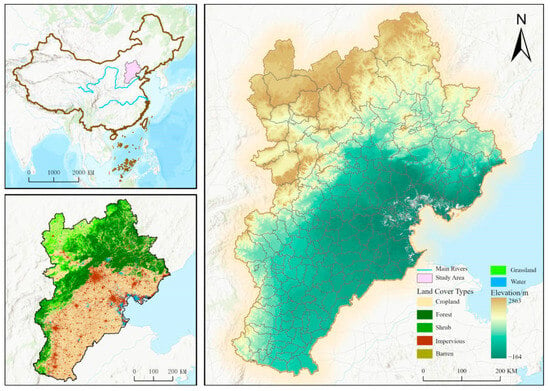
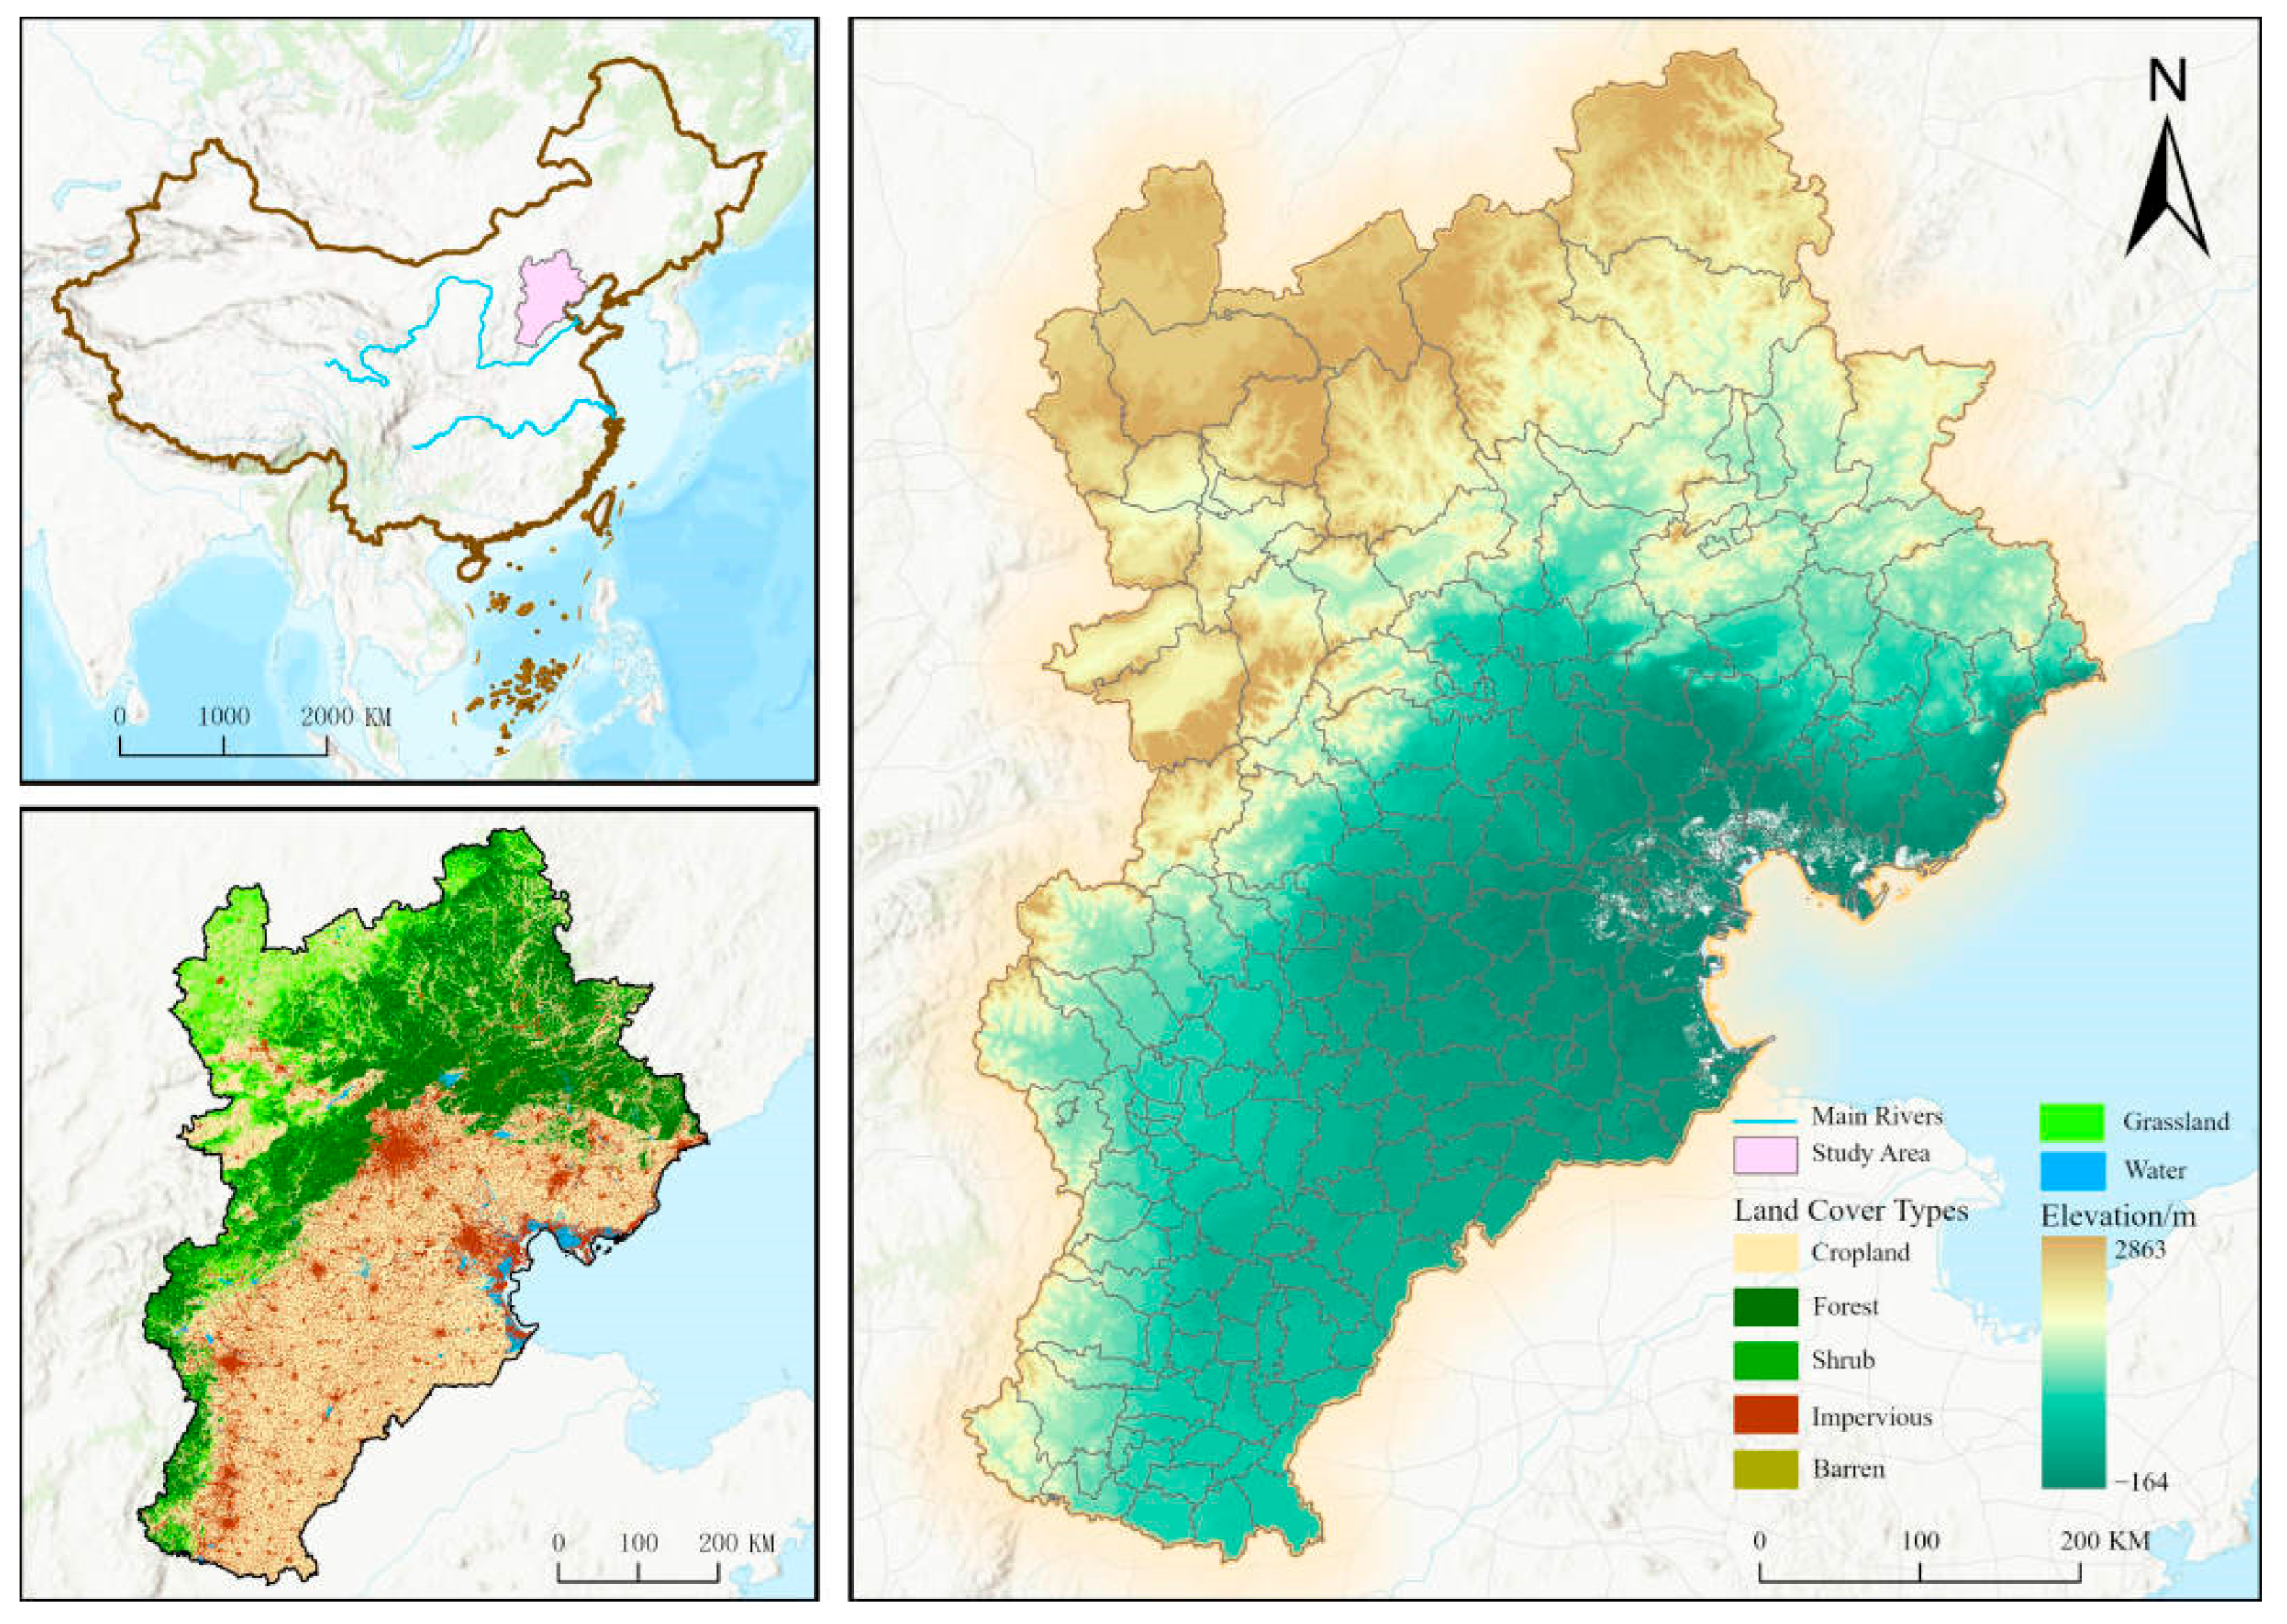
The BTH, located in the North China Plain, covers an area of approximately 218,000 km2, encompassing Beijing Municipality, Tianjin Municipality, and Hebei Province. The region has a temperate semi-arid monsoon climate characterized by hot, rainy summers and cold, dry winters, with distinct wet and dry seasons and notable monsoon features [33]. Topographically, the northwest and north areas are dominated by the elevated terrain of the Yanshan Mountains, while the southern and eastern regions comprise the flat, open terrain of the North China Plain [34] (Figure 2).
Figure 2.
The spatial distribution of land use (2022) and DEM in the BTH.
Rapid urbanization has driven significant economic growth in BTH, making it one of China’s fastest-growing and most economically advanced regions [35]. By 2022, BTH had a permanent population of about 110 million and a GDP of CNY 9.97 trillion (Chinese Yuan), representing an annual growth rate of 2.00%. The region’s economic structure (primary/secondary/tertiary) was 6:37:57, with an overall per capita GDP of approximately CNY 90,900. However, significant economic disparities existed within the region: Beijing had the highest per capita GDP at CNY 189,900, followed by Tianjin at CNY 117,900, while Hebei lagged behind at only CNY 56,500 per capita. Regarding land use in 2022, cultivated land was predominant (42.86%), followed by forest land (25.53%) and grassland (15.06%). Construction land accounted for 14.96%, water bodies covered 1.33%, and bare land represented only 0.02%.
This study utilized comprehensive datasets, including NDVI, meteorological, socioeconomic, and land use data. Annual NDVI raster data from 2000 to 2022 were obtained from MOD13A3.061 Vegetation Indices Monthly L3 Global 1 km SIN Grid (https://doi.org/10.5067/MODIS/MOD13A3.061, accessed on 7 October 2023, USA), processed using the maximum value composite method at a spatial resolution of 250 m. Meteorological data, such as annual average temperature, were acquired from the National Tibetan Plateau Scientific Data Center (https://doi.org/10.11888/Meteoro.tpdc.270961, accessed on 3 December 2023, China) [36]. Population density data at a 1 km resolution was sourced from the LandScan Global dataset (https://landscan.ornl.gov/, accessed on 5 December 2023, USA), while GDP data were extracted from provincial and municipal statistical yearbooks (https://tjj.beijing.gov.cn/; https://stats.tj.gov.cn/; http://tjj.hebei.gov.cn/, accessed on 16 December 2023, China). Land use data were derived from the China Land Cover Dataset (CLCD) at a 30 m resolution (https://zenodo.org/records/5816591#.ZAWM3BVBy5c, accessed on 21 May 2024, China). All datasets were resampled to a consistent 250 m resolution using the nearest neighbor method and projected into the WGS 1984 Web Mercator (auxiliary sphere) coordinate system.
2.3. Fractional Vegetation Cover Calculation and Classification
The pixel dichotomy model is a widely applied sub-pixel scale analysis method for estimating FVC from remote sensing data. This method assumes that each mixed pixel comprises only two components: vegetation and soil. FVC values are calculated by weighting the spectral characteristics of vegetation and bare soil pixels [4,37], using the following formula [38]:
where FVC ranges from 0 to 1, and and represent NDVI values of pure bare soil and pure vegetation pixels, respectively. In this study, the NDVI thresholds corresponding to the cumulative probabilities of 2% and 98% from 2000 to 2022 were used as and . Considering actual vegetation and landscape characteristics in BTH, FVC was classified into four categories [39] (Table 1).
Table 1.
Fractional vegetation cover classification criteria for BTH.
2.4. Long-Term Series Analysis of Fractional Vegetation Cover
This study employed the Locally Estimated Scatterplot Smoothing (LOESS) method to analyze long-term FVC trends in BTH from 2000 to 2022. LOESS is a non-parametric approach that reduces data fluctuations by applying weighted regression locally around each data point [40,41], thus clearly capturing underlying trends. Additionally, quadratic polynomial fitting was applied to the smoothed data to map overall FVC temporal patterns, described by
where x represents the year, and , , and are regression coefficients. Based on trend magnitudes, FVC changes were categorized into five types—no change, degradation, severe degradation, improvement, and significant improvement—to highlight spatial variations in vegetation dynamics across BTH.
2.5. Interaction and Path Analysis of FVC Influencing Factors
An evaluation index system for factors affecting FVC was established based on relevant literature (Table 2). By integrating natural and socioeconomic factors, PLS–SEM was used to analyze the contributions and interaction pathways of various drivers. PLS–SEM combines advantages from factor, regression, and path analyses [42,43], effectively addressing small sample sizes, non-normal distributions, and both formative and reflective constructs [44]. The model comprises measurement and structural components:
Table 2.
FVC influencing factors in the PLS–SEM model for BTH.
Structural model: Represents linear relationships between latent variables:
where is an endogenous latent variable, is an exogenous latent variable, denotes path coefficients, and represents error terms.
Measurement model: Describes relationships between latent () and observed variables ():
where represents the factor loadings, and is the measurement error.
For model reliability testing, this study mainly focused on the internal consistency of the scale, using Cronbach’s α coefficient and composite reliability as evaluation criteria; both values greater than 0.7 indicate acceptable reliability. For validity testing, this study used convergent validity as the measure, with key indicators including factor loading and average variance extracted (AVE); factor loading needs to be greater than 0.6, and AVE needs to be greater than 0.5, to ensure that latent variables can adequately explain their observed variables. In addition, to evaluate the goodness-of-fit, explanatory power, and predictive ability of the PLS–SEM model, this study used standardized root mean square residual (SRMR), coefficient of determination (R2), and effect size (f2). Simultaneously, the Bootstrap resampling method was used to test the statistical significance of path coefficients, total effects, and indirect effects. All statistical analyses in this study used a two-sided p-value less than 0.05 as the significance standard.
2.6. Multi-Scenario Prediction of Fractional Vegetation Cover
2.6.1. Scenario Design
Based on previous studies [45,46] and future socioeconomic plans for BTH, three scenarios were designed to simulate FVC change trends (Table 3):
Table 3.
Transition probability matrices for FVC under different scenarios in BTH.
- (1)
- Inertial development scenario (IDS): Continuation of 2010–2020 FVC patterns, without intervention.
- (2)
- Urban expansion scenario (UES): Increases the probability of medium and high FVC converting to extremely low FVC by 20%, while reducing the probability of extremely low FVC improving to higher levels by 20%.
- (3)
- Ecological protection scenario (EPS): Reduces the probability of medium and high FVC converting to extremely low FVC by 50%, and increases the probability of medium FVC improving to high FVC by 30%.
2.6.2. Parameter Setting
This study utilized the CA-Markov model to perform multi-scenario simulations and predictions of FVC spatial distribution patterns in BTH for 2030 and 2060. The specific steps are as follows:
- (1)
- Cell definition: Reclassify the FVC grade data to generate FVC grade raster maps for the study area from 2000 to 2022, and conduct simulation calculations using a 5 × 5 filter.
- (2)
- State transition: The FVC grade distribution for 2020 was simulated using a Markov module. FVC data from 2000 and 2010 were imported to create a benchmark state transition matrix over a 10-year period with a 0.15 proportional error. This benchmark was then modified by applying specific adjustment rules for IDS, UES, and EPS to construct a unique transition matrix for each scenario (Table 3).
- (3)
- Prediction Period Setting: With 2020 as the intermediate validation node, the 2020 FVC distribution was first simulated using the 2000–2010 transition matrix. Taking the 2020 actual results as the initial state, combined with scenario-specific transition matrices, iterative calculations were performed to 2030 and 2060, respectively, ultimately outputting FVC spatial distribution data for target years under different scenarios.
2.6.3. Model Verification
We evaluated the predictive performance of the 2020 FVC simulation by comparing the Modeled map with the observed 2020 FVC map. Validation employed Kappa coefficient, computed from the confusion matrix (CROSSTAB module) as
where is the overall accuracy, and is the expected accuracy due to chance. The kappa coefficient ranges from 0 to 1, with higher values indicating better simulation accuracy. The model achieved Kappa coefficient = 0.8729 (>0.80), evidencing strong consistency between simulated and observed FVC and meeting commonly accepted accuracy criteria. This verification supports the use of the simulation outputs in subsequent spatial analyses and scenario evaluations.
3. Results
3.1. Analysis of Long-Term Trends in FVC
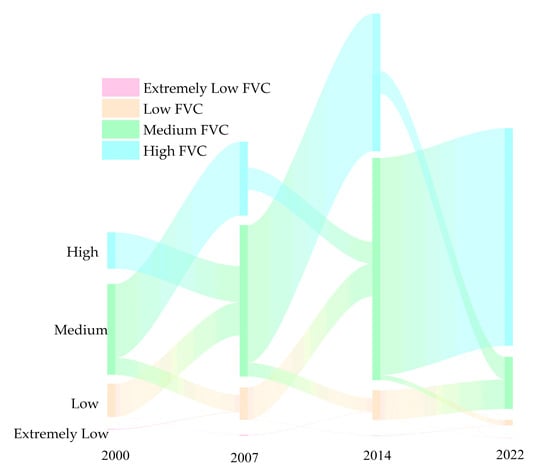
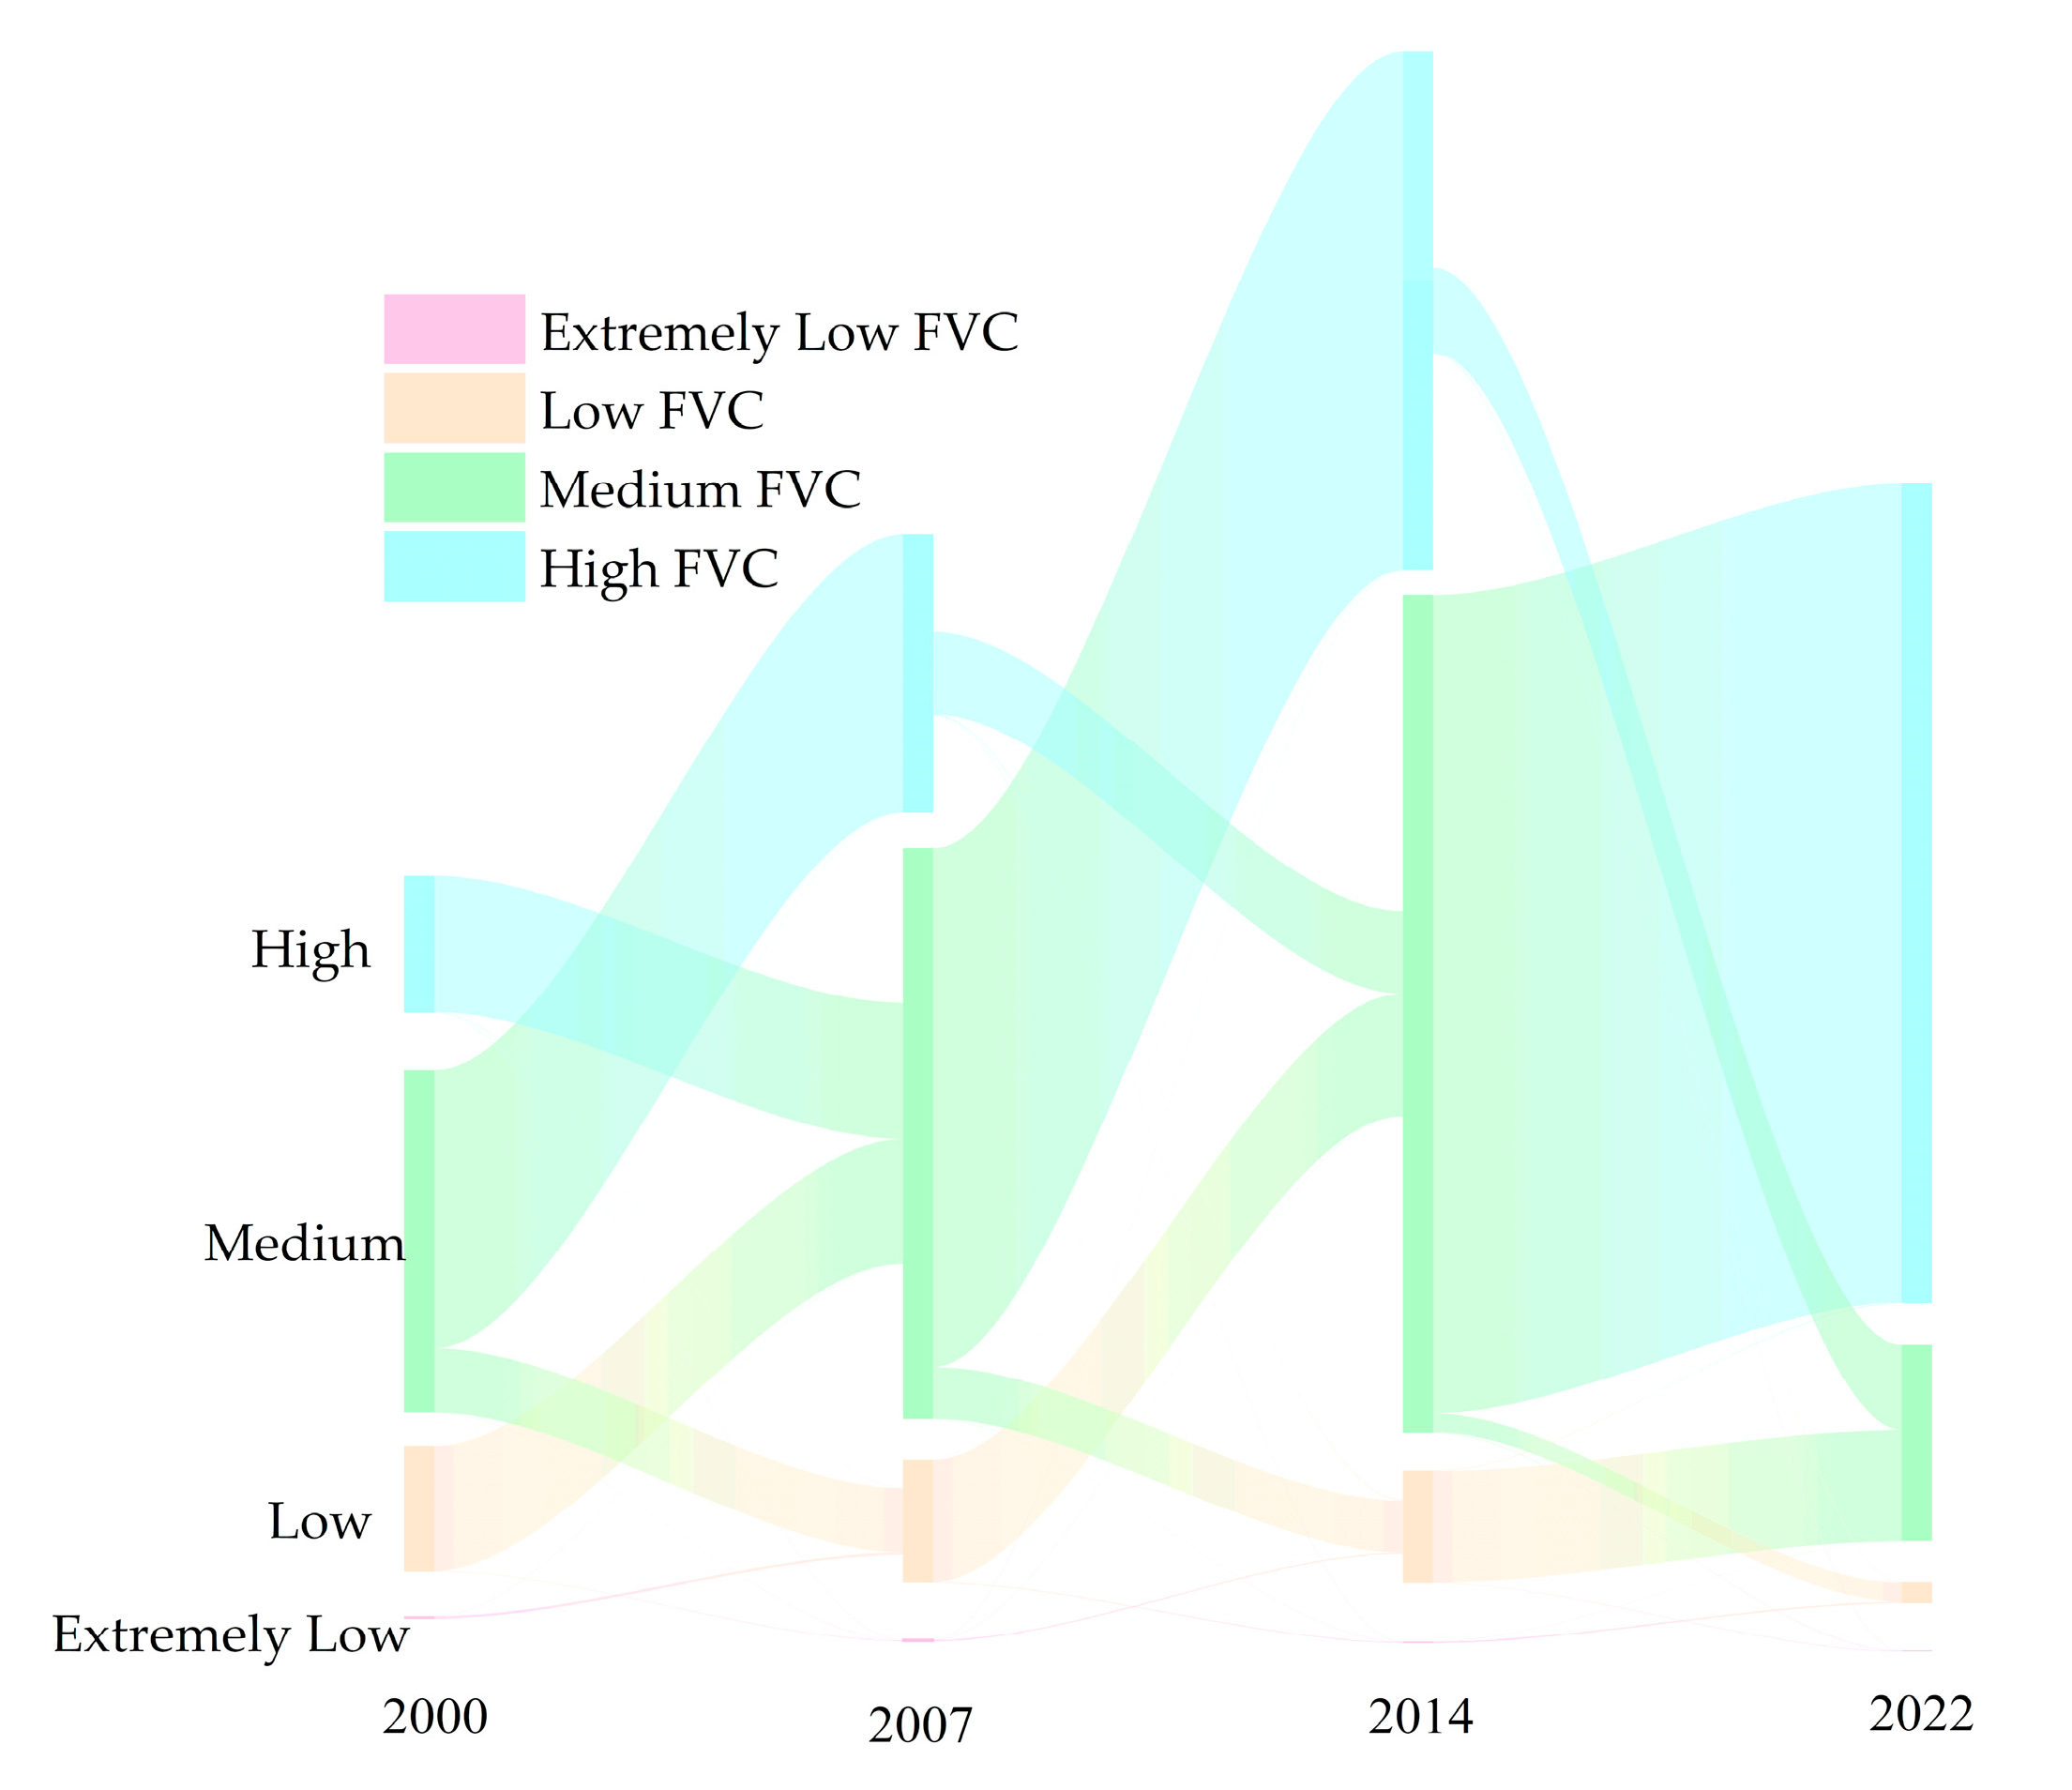
Overall, FVC in BTH showed an increasing trend, with the annual average rising from 0.462 in 2000 to 0.576 in 2022, despite some periodic declines. Notably, FVC decreased by 0.023 during 2004–2006 and by 0.029 from 2008 to 2009, indicating significant temporal fluctuations (Figure 3). Between 2000 and 2004, low-FVC areas varied considerably, peaking at 246,970 km2 in 2001, indicating substantial vegetation degradation. Ecological restoration efforts from 2005 to 2012 steadily led to an increase in high-FVC areas, with an average annual growth rate of 3.5%, while extremely low-FVC areas remained limited, signaling successful restoration. However, from 2013 to 2022, FVC exhibited divergent trends: high-FVC areas increased by about 6% annually, while extremely low-FVC areas expanded approximately 10% annually. By 2018, high-FVC areas exceeded 850,000 km2, and extremely low-FVC areas surpassed 13,540 km2.
Figure 3.
Sankey diagram of fractional vegetation cover change from 2000 to 2022.
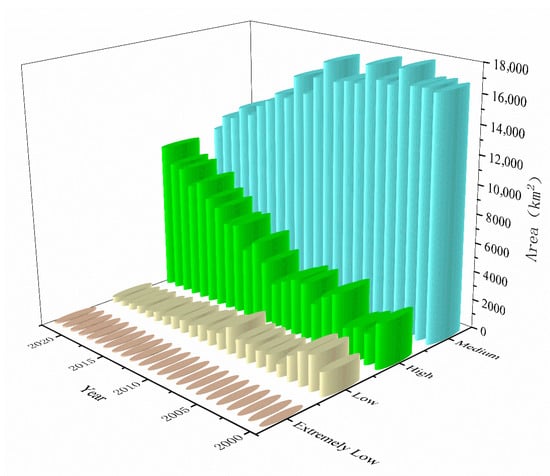
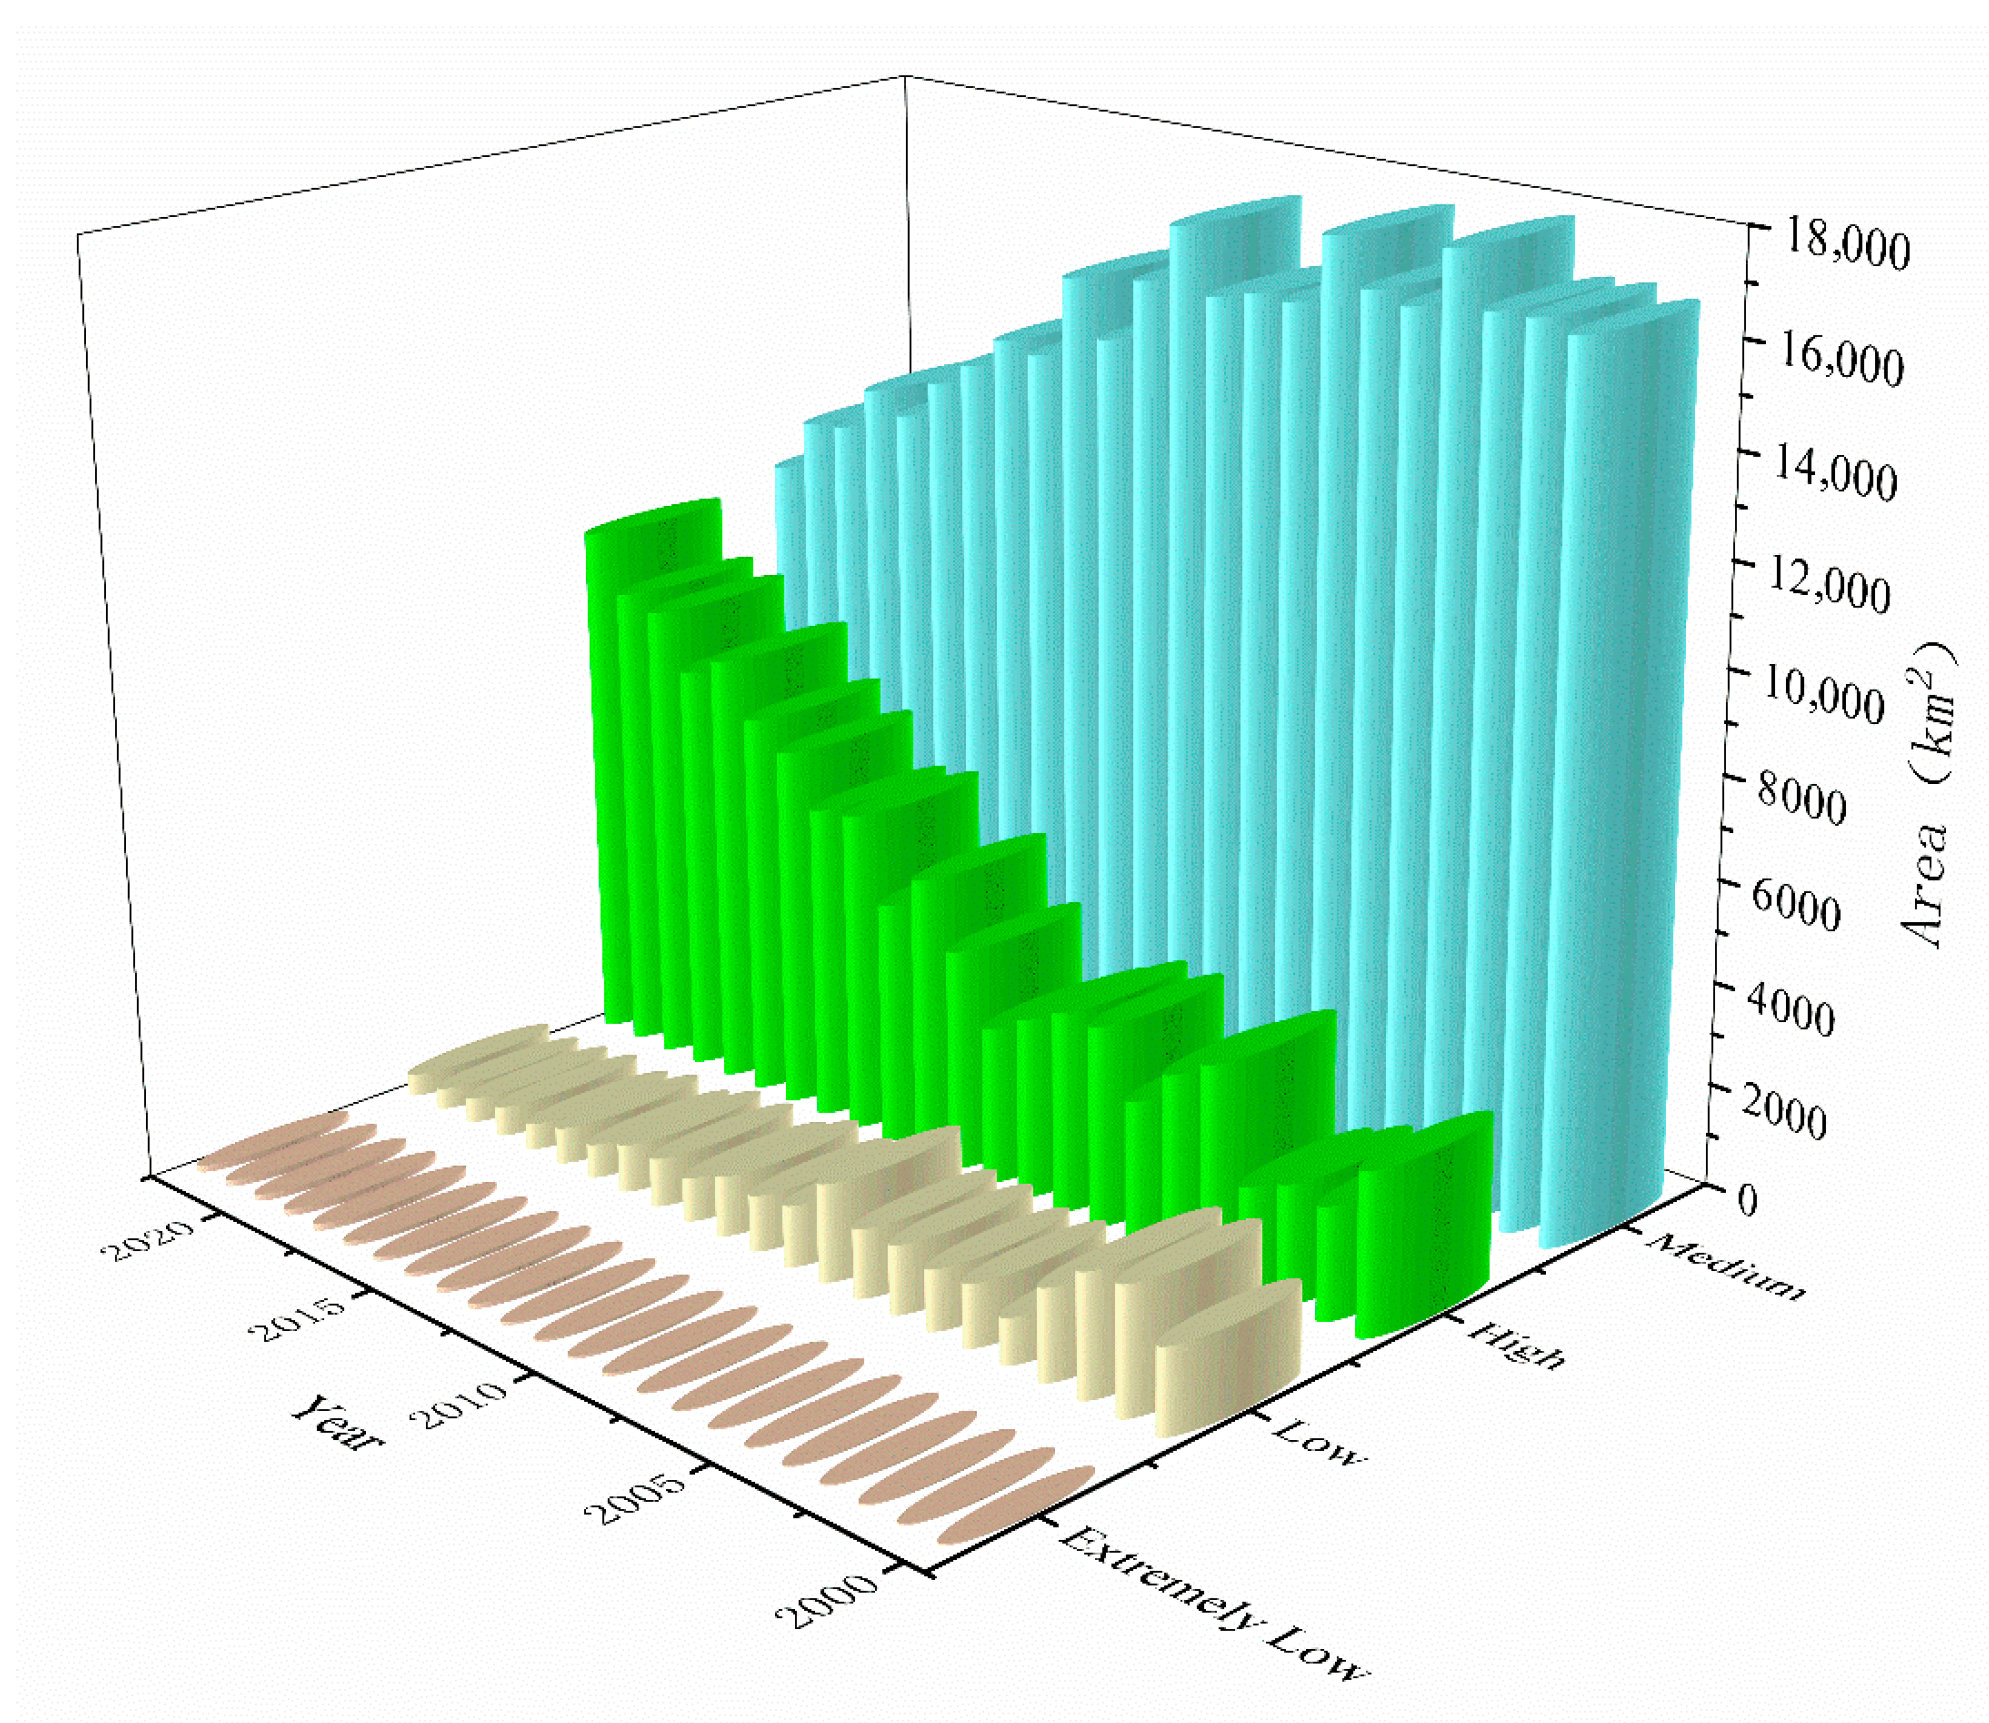
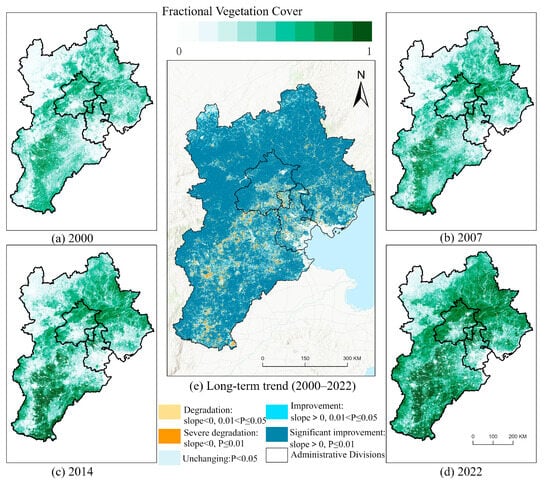
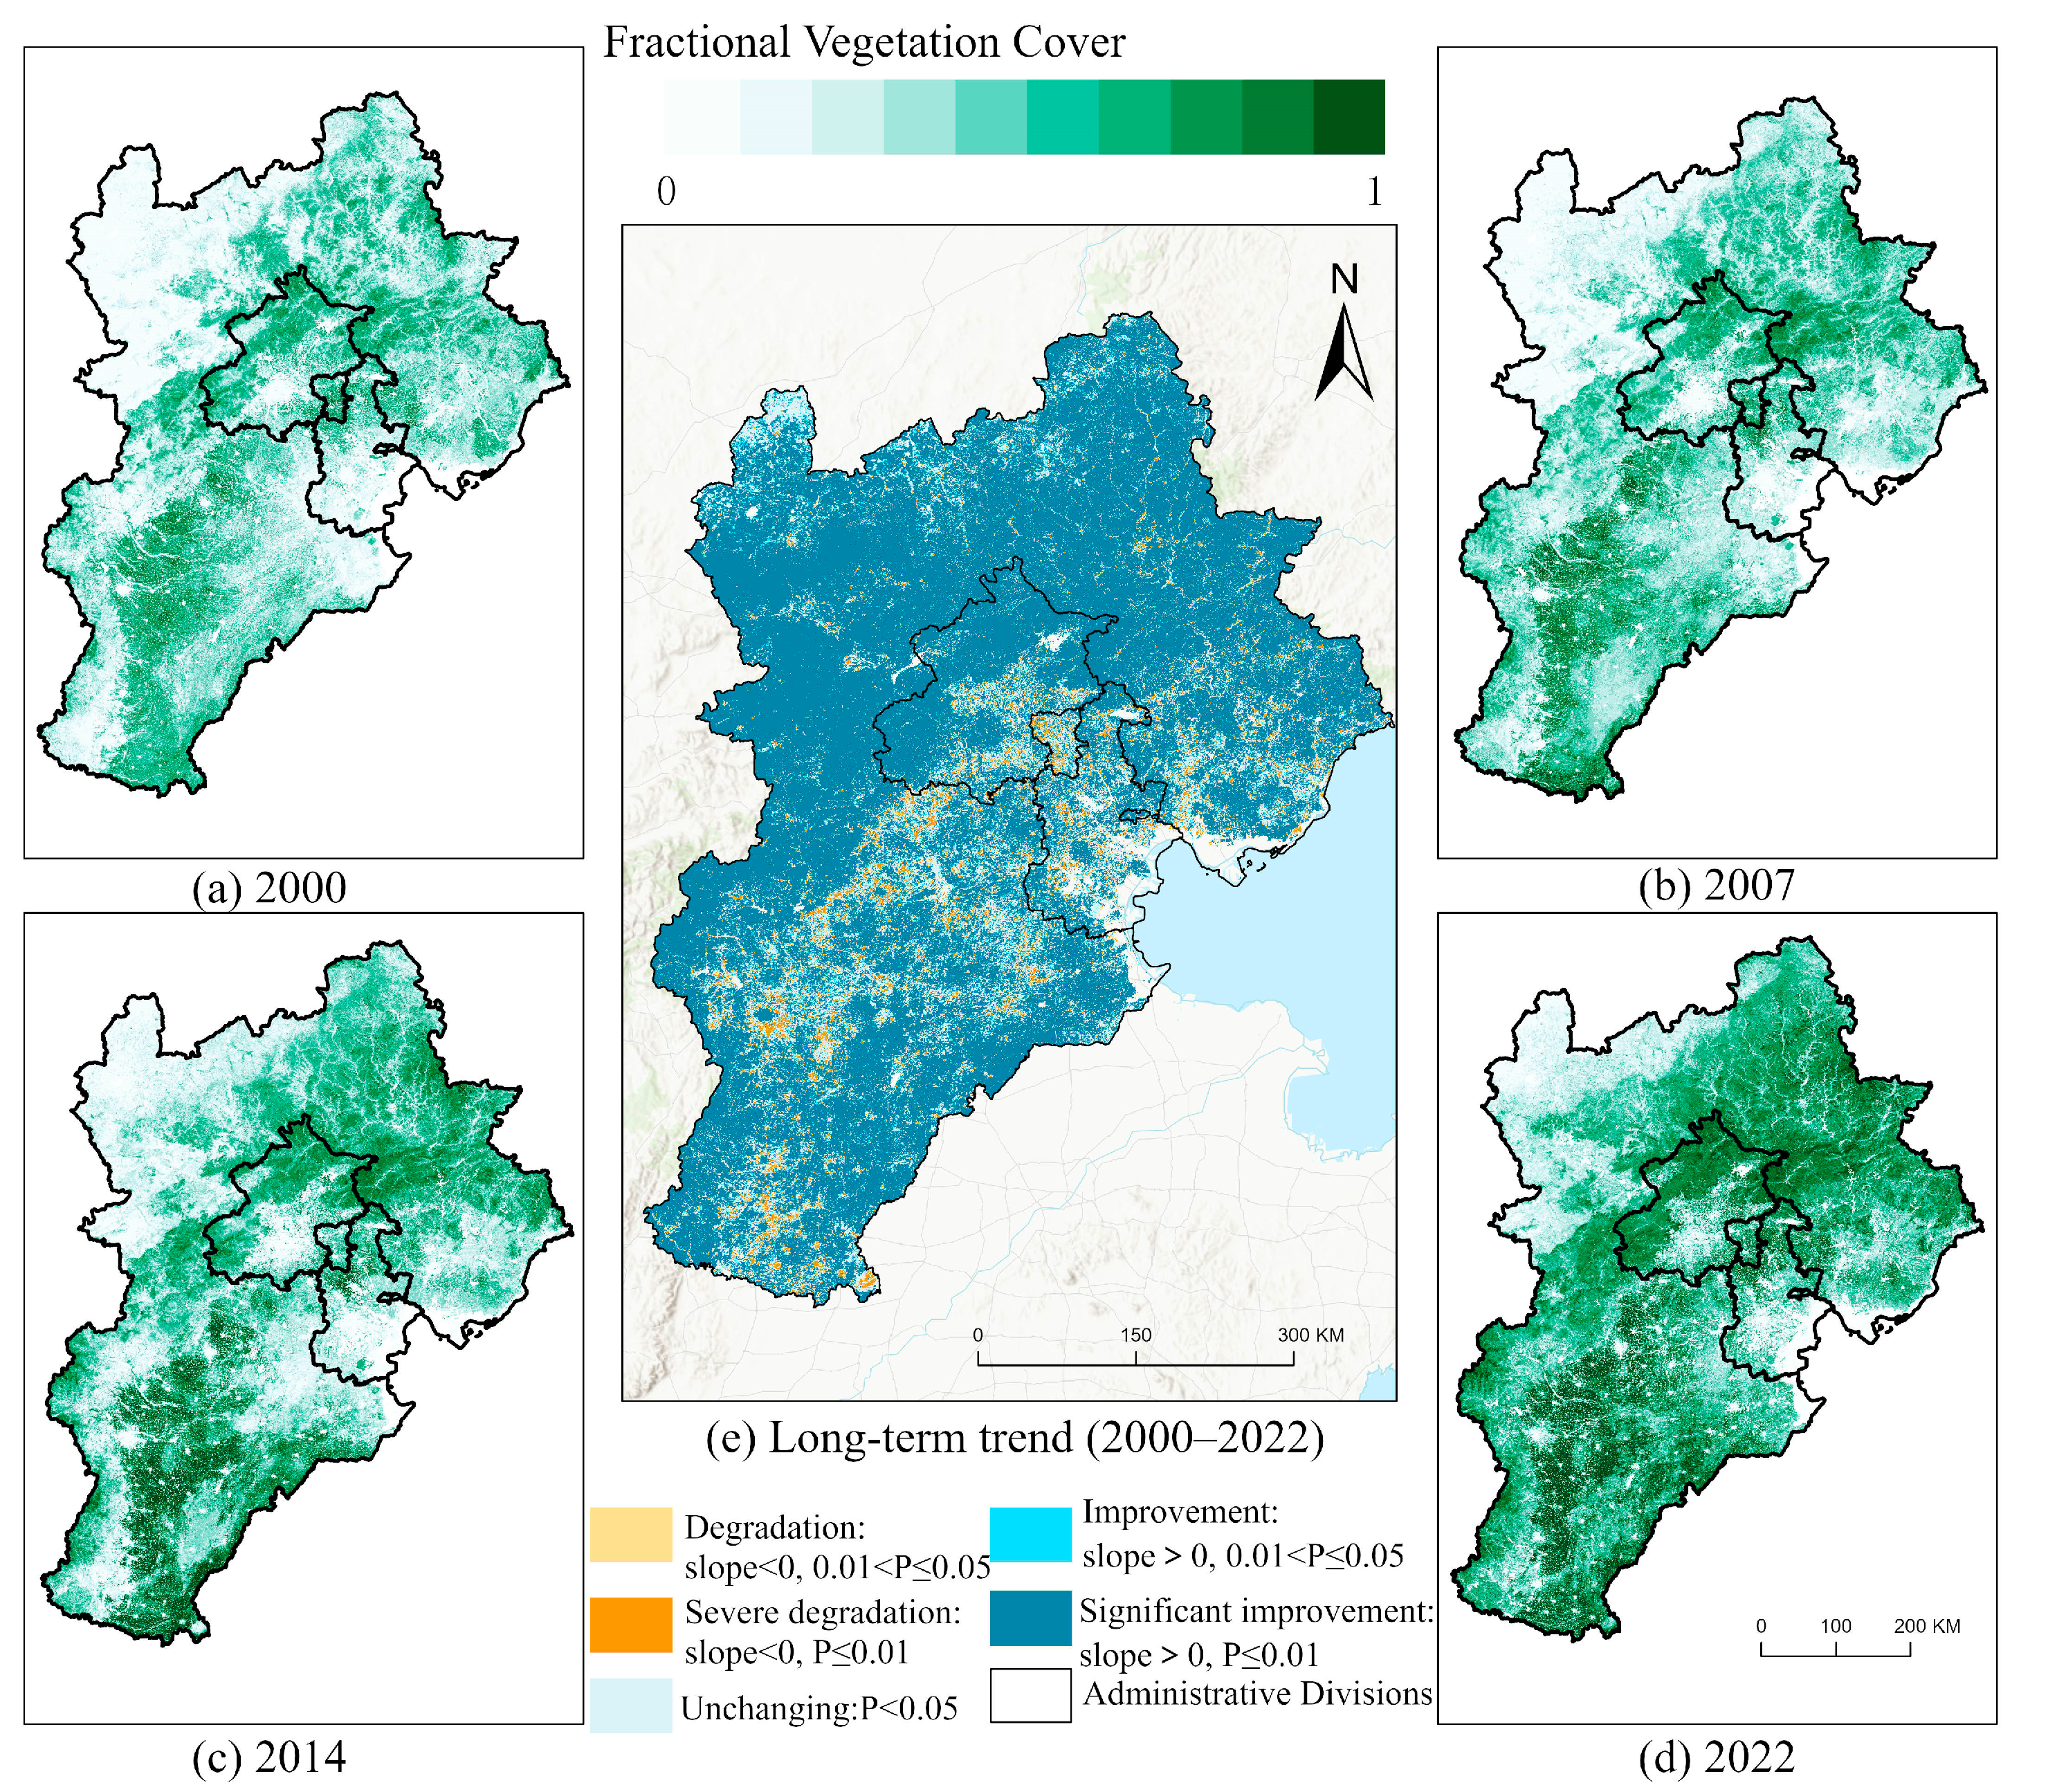
From 2000 to 2022, FVC improvement dominated in terms of area, covering 1,752,182 km2 (81.12% of the total). Areas with no significant change accounted for 10.04%, while degraded areas were minimal at only 23,120 km2 (Figure 4). Spatially, most regions displayed improving FVC trends, with degradation concentrated in urban built-up areas and their surroundings (Figure 5). Severe degradation was highly clustered, whereas moderate degradation appeared more scattered. Regionally, Beijing had the highest average FVC, followed by Hebei and Tianjin.
Figure 4.
Changes in fractional vegetation cover area of different grades in the BTH from 2000 to 2022.
Figure 5.
Spatial distributions of fractional vegetation cover in the BTH for (a) 2000, (b) 2007, (c) 2014, and (d) 2022, and (e) the long-term trend (2000–2022).
3.2. Analysis of Influencing Factors
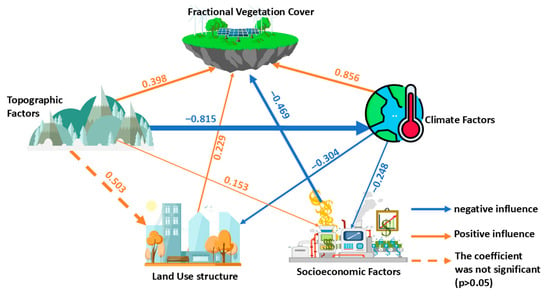
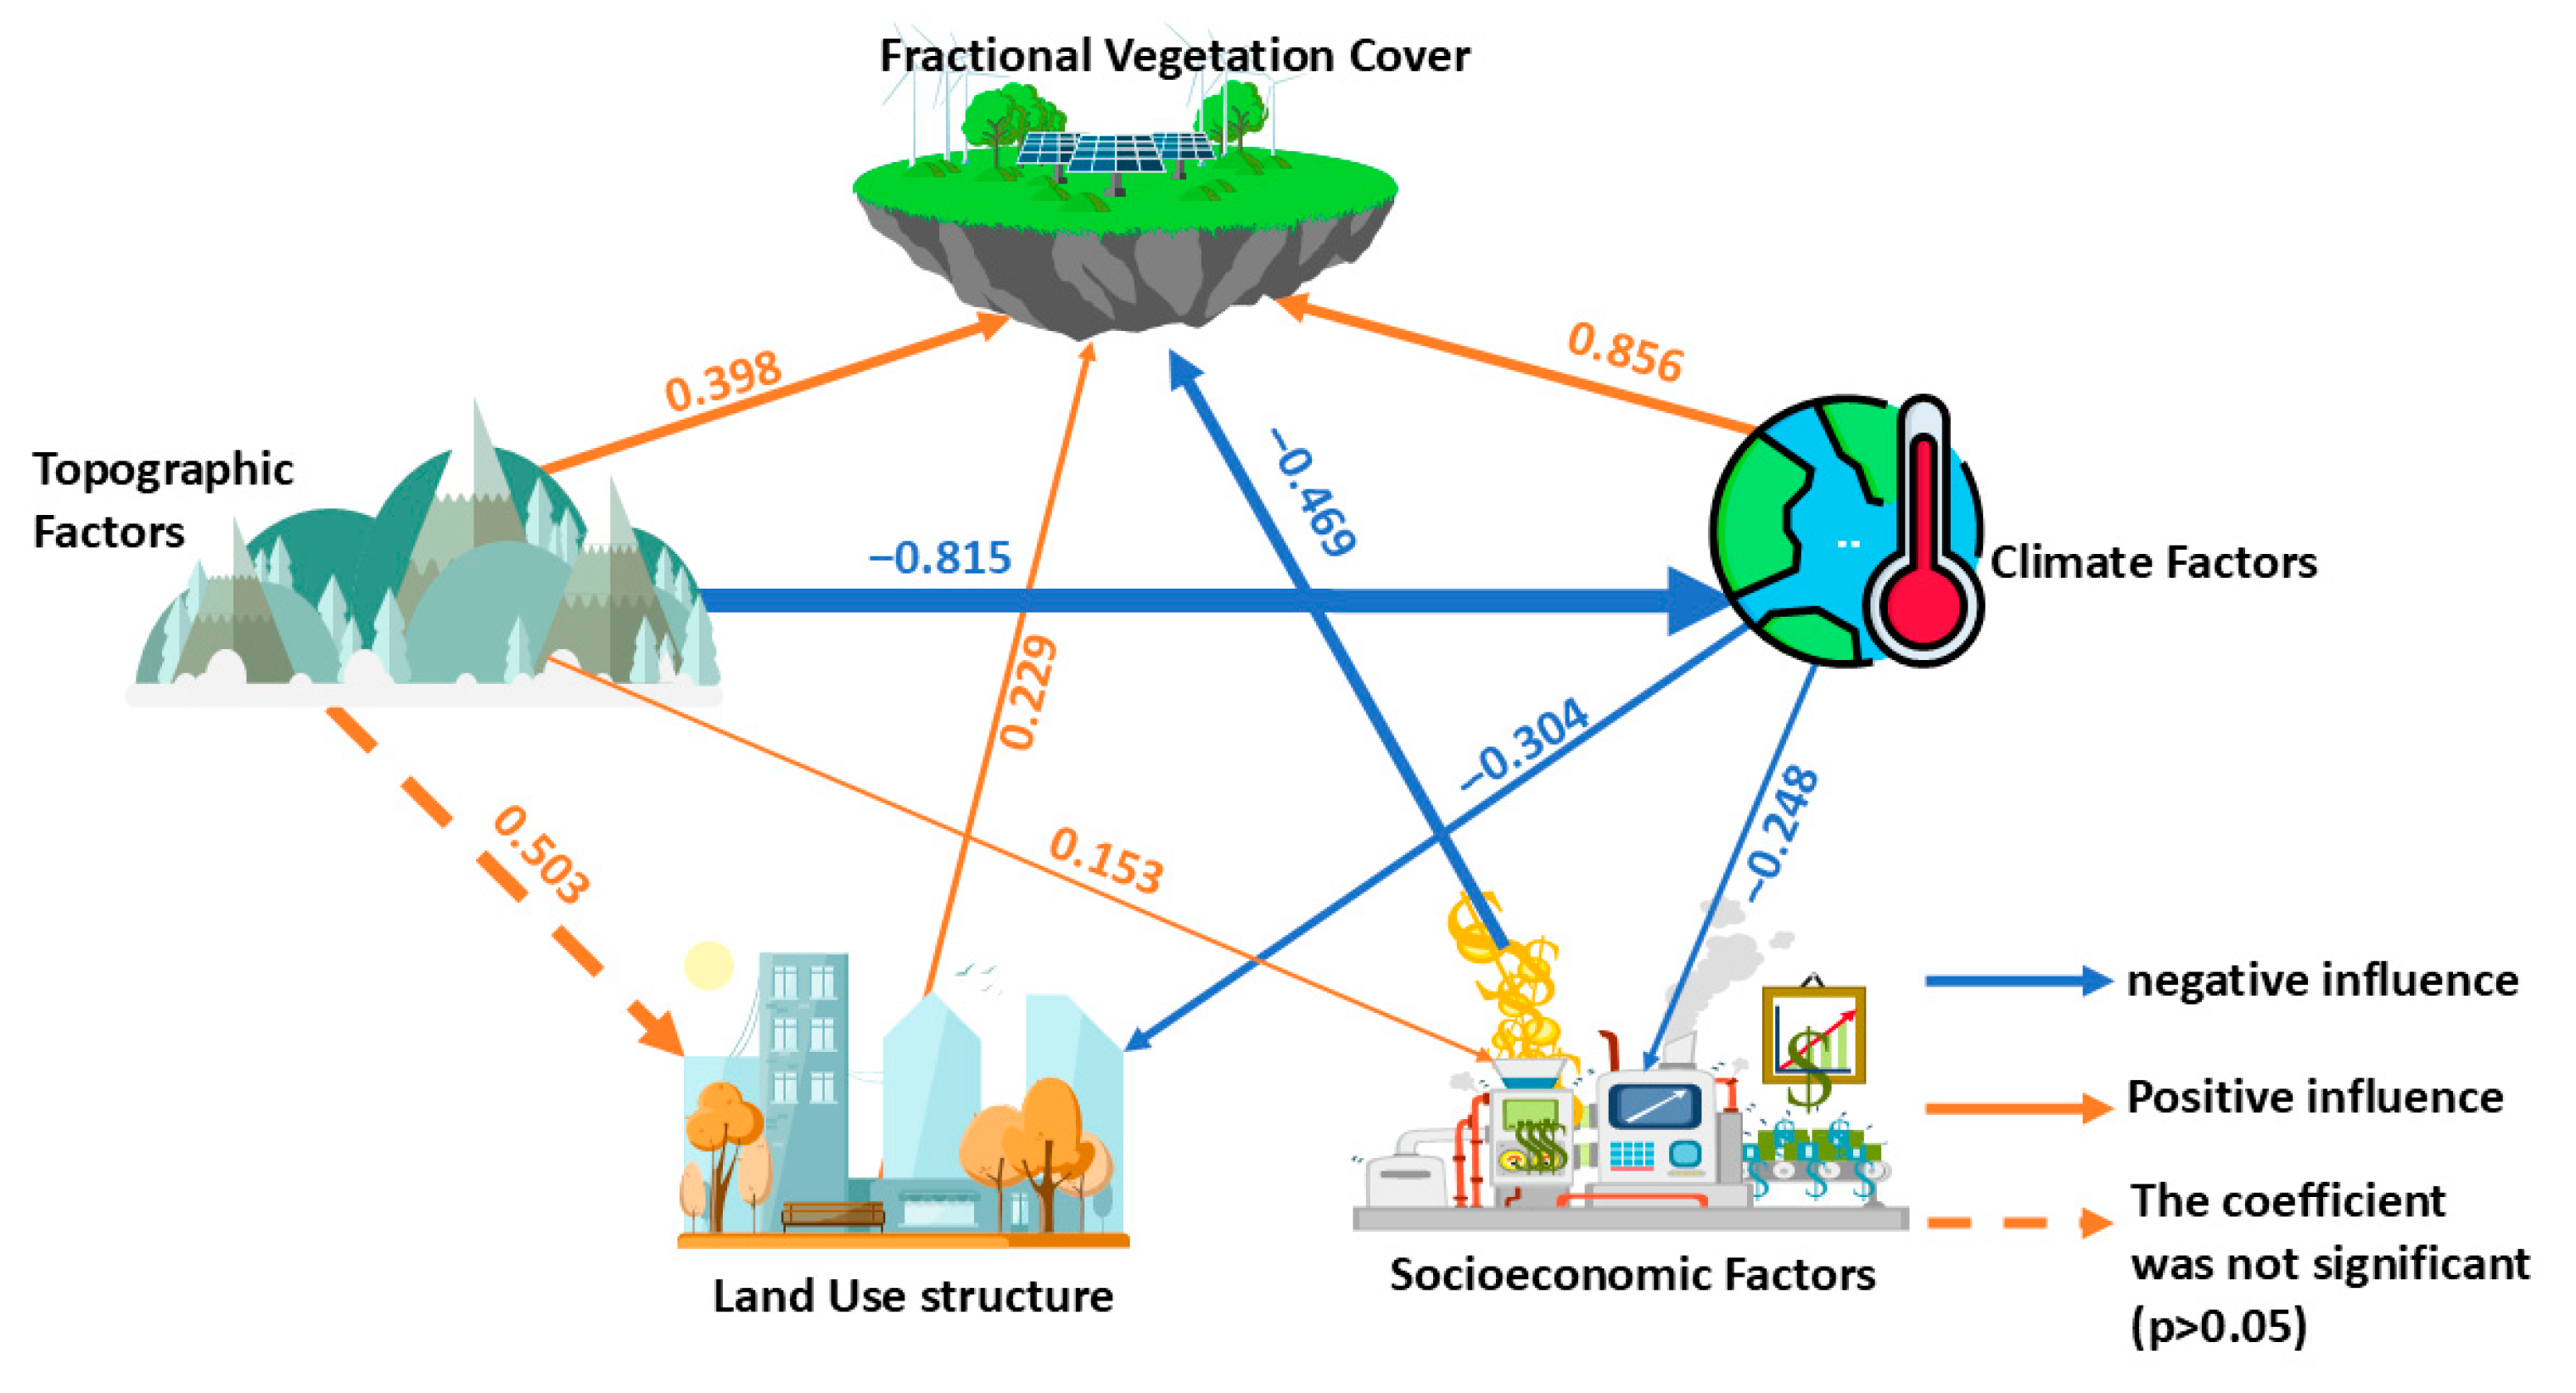
PLS–SEM analysis yielded a good model fit (SRMR = 0.094, below the 0.10 threshold), revealing a complex network of interactions among the driving factors. All path coefficients were significant, except for the total effect of topographic factors on FVC (Figure 6). Climate factors emerged as the dominant driver, with a total positive effect coefficient of 0.903. This included a strong direct positive effect (0.856), while the indirect effects were mixed—a slight negative impact through land use structure (−0.070) and a positive effect through socioeconomic factors (0.116). In contrast, topographic factors had an overall negative effect on FVC (−0.260). Although they exhibited a significant direct positive effect (0.397), this benefit was outweighed by substantial cumulative indirect negative effects—most notably a strong inhibitory impact through climate factors (−0.700), as well as a minor, non-significant positive indirect effect via land use structure (0.115) and a slight negative indirect effect through socioeconomic factors (−0.072). Moreover, both land use structure and socioeconomic factors influenced FVC exclusively through direct effects. Land use structure had a positive direct effect (0.229), whereas socioeconomic factors exhibited a significant negative direct effect (−0.469).
Figure 6.
The influence path and coefficient of different influencing factors of fractional vegetation cover in the BTH.
Overall, climate was the dominant natural driver of FVC improvement, while human activities and topography–climate interactions served as primary constraints.
3.3. Future Change Trends of FVC
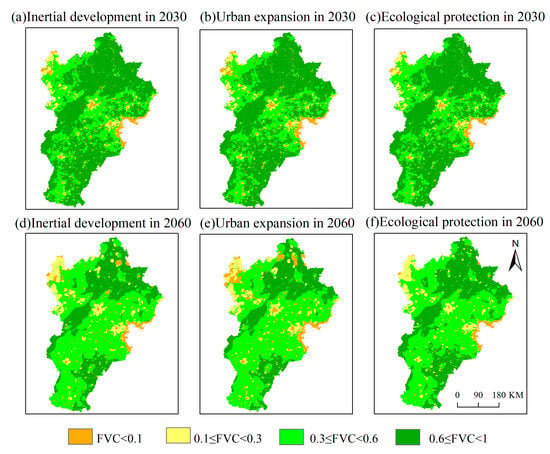
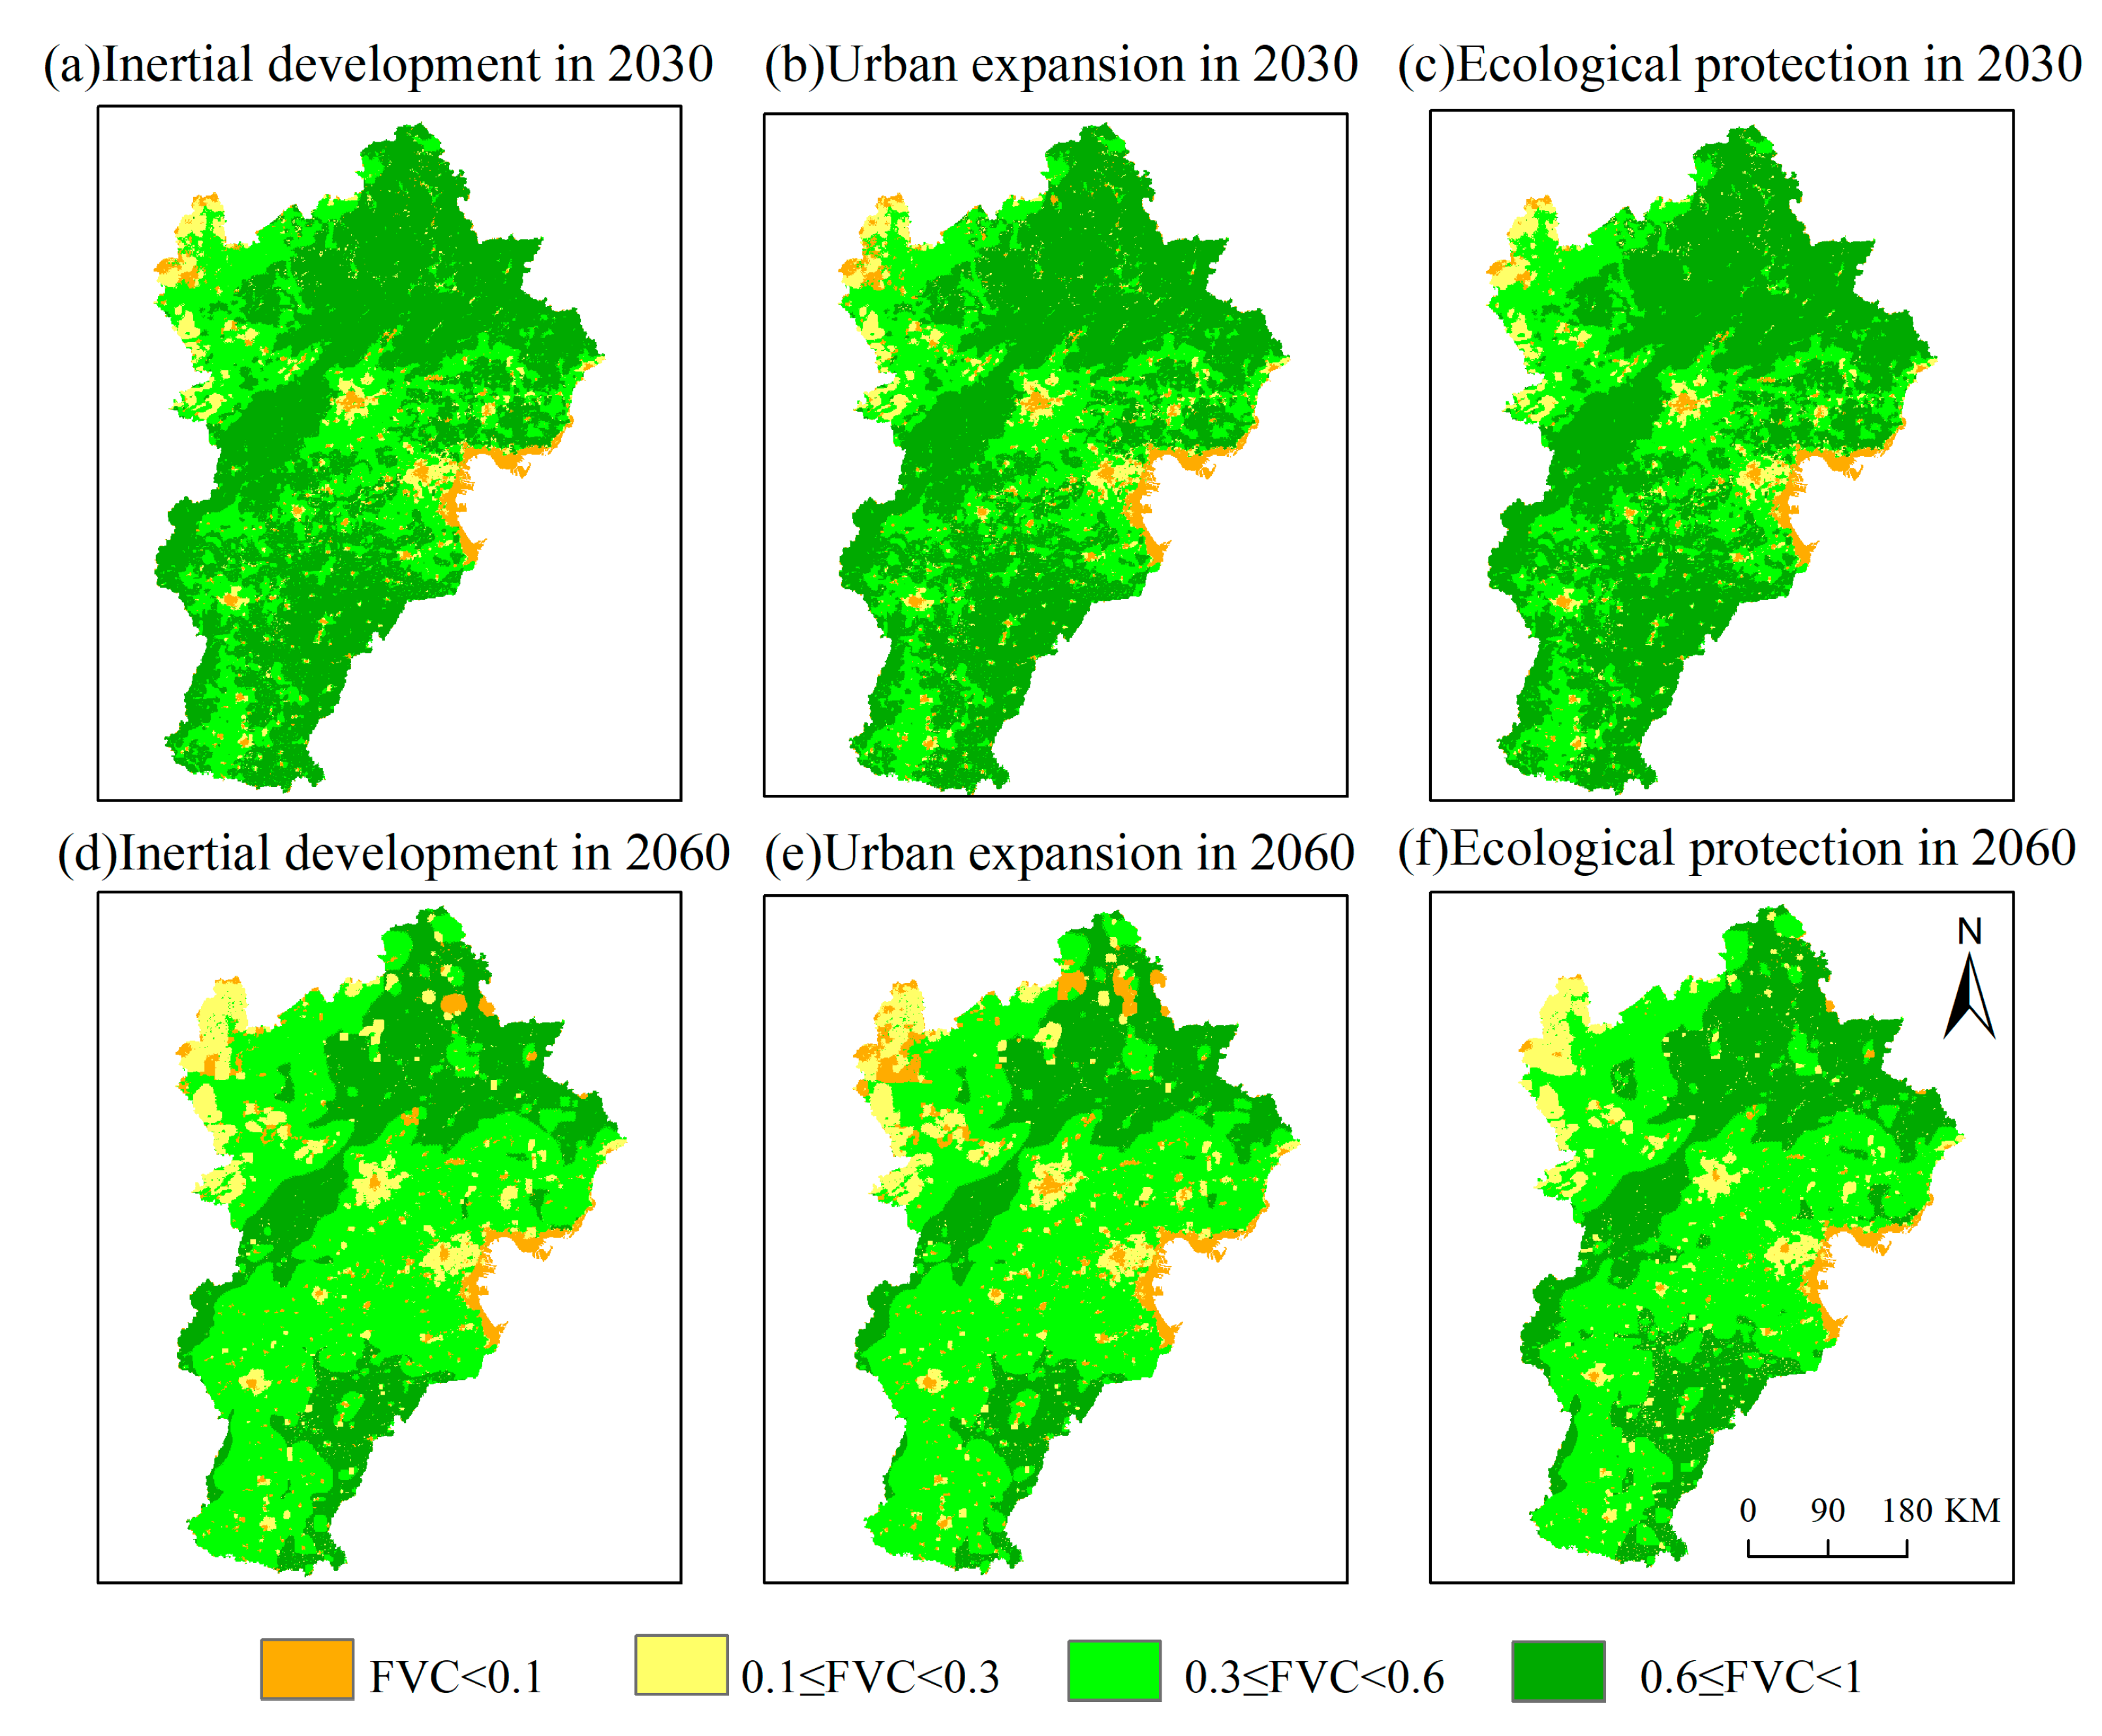
Future FVC trends in BTH varied significantly across scenarios (Figure 7). Compared with 2022, FVC declined to varying degrees under all scenarios, but the ecological protection scenario consistently outperformed both the IDS and EPS in maintaining vegetation cover. Specifically, by 2030, high-FVC areas under the IDS and UES decreased significantly by 22,685 km2 and 24,545 km2, respectively, while medium-FVC areas increased by 22,301 km2 and 23,091 km2, compared with 2022. By 2060, the decline in high-FVC areas was even more pronounced, with losses of 60,090 km2 and 65,670 km2, respectively, and this simultaneously increased in medium-, low-, and extremely low-FVC areas. Notably, urban expansion led to the most significant growth in medium-FVC areas, which could result in the formation of large, contiguous degraded zones by 2060—highlighting the ecological risks associated with uncontrolled urbanization. In contrast, under the EPS, FVC degradation was much more limited. By 2030, the loss of high-cover vegetation was restricted to 19,575 km2, while extremely low-cover areas were reduced by 1368 km2, and medium-FVC areas increased by 20,691 km2. This trend continued by 2060, with high- and extremely low-FVC areas declining by 50,760 km2 and 1830 km2, respectively, while medium- and low-FVC areas expanded by 45,630 km2 and 6960 km2.
Figure 7.
Projected spatial distribution of fractional vegetation cover in the BTH under alternative scenarios: (a) inertial development, 2030; (b) urban expansion, 2030; (c) ecological protection, 2030; (d) inertial development, 2060; (e) urban expansion, 2060; (f) ecological protection, 2060.
4. Discussion
4.1. Key Interpretations of FVC Trends
This study thoroughly analyzed the evolution and significant spatial variability of FVC in the BTH region from 2000 to 2022. FVC retrievals for 2015–2022 were validated against Landsat 8-derived FVC for the same period. Cohen’s kappa exceeded 0.89 across all years, indicating high accuracy and supporting the subsequent analyses. Our results are broadly consistent with Wang et al. [47], showing similar FVC trends during 2000–2022; nevertheless, the absolute FVC values differ between the two studies, likely due to the NDVI-based threshold settings used for FVC extraction–Wang et al. applied the 5% cumulative-distribution bounds, whereas we adopted a 2% threshold. Overall, FVC improved notably, increasing from 0.462 to 0.576, largely driven by national ecological restoration projects. Significant gains in northwestern mountainous regions confirm the effectiveness of initiatives such as the “Grain for Green” program and ecological corridor construction, highlighting the synergy between natural recovery and policy interventions.
However, at a finer spatial scale, the FVC situation in urban built-up areas remains less optimistic, characterized by continuous declines. Simultaneously, expansions of both high-coverage and extremely low-coverage vegetation areas occurred. Between 2013 and 2022, high-coverage vegetation areas grew by an average of 6% annually, while extremely low-coverage areas expanded by approximately 10% annually. These contrasting trends illustrate significant ecological fragmentation and degradation pressures associated with rapid urbanization, underscoring a critical imbalance between urban development and ecological conservation efforts. Addressing this imbalance requires coordinated strategies to reconcile economic growth with ecosystem protection.
In this study, our suite of FVC analyses provides a multi-dimensional lens for assessing the effectiveness of EPS. Time-series results show an overall increase in FVC from 0.462 to 0.576 between 2000 and 2022, a trajectory that aligns with the sustained implementation of multiple ecological protection strategies in the BTH. In particular, large-scale afforestation–an essential ecological restoration measure–has expanded vegetated area, while ecological compensation mechanisms have created economic incentives that mobilize local governments and residents to engage in conservation, jointly contributing to the observed gains in FVC.
Results from multi–scenario simulations using the CA–Markov model provide crucial insights and quantitative bases for future regional development policies. Although FVC exhibits a clear downward trend across all scenarios, its overall condition under the EPS remains markedly better than under the UES and IDS. This emphasizes the effectiveness of proactive ecological measures in mitigating vegetation degradation and preserving ecological integrity. Conversely, under the urban expansion scenario, extremely low-FVC areas expand significantly, resulting in pronounced vegetation fragmentation that declines in high-FVC areas (by about 1.5%), highlighting severe risks to ecosystem stability. Thus, this study advocates for strengthened control of ecological protection areas, optimized land-use management, and strict limitations on intensive development to achieve sustainable development and ecological security.
4.2. Driver Pathways
Our analysis indicates that FVC dynamics in the BTH region result from complex interactions among climate, topography, and human activities. Climate is the dominant driver of FVC change in the BTH, consistent with Ma et al. [48]. However, differences in variable selection and model specification preclude factor-level comparisons within the climate domain or across other drivers. Among climatic variables, temperature and evapotranspiration are significant positive drivers of FVC and directly promote vegetation growth. In contrast, precipitation did not significantly influence FVC, likely due to extensive human management of water resources for vegetation through irrigation and water diversion initiatives. Temperature and evapotranspiration indirectly influence vegetation patterns by affecting land-use changes, although this indirect pathway had a minimal influence coefficient (−0.070).
Topography, represented by slope and elevation, significantly shapes vegetation spatial patterns through regulation of local climatic conditions and by limiting human activities. High-elevation and steep-slope areas, such as the northwestern Yanshan Mountains, consistently show higher FVC values, reflecting lower human disturbance. Conversely, topography indirectly negatively impacts vegetation recovery by modulating regional temperature conditions, thus indirectly constraining FVC.
Socioeconomic factors, specifically population density and GDP, negatively correlate with FVC, reflecting vegetation degradation pressures from rapid urbanization, industrialization, agriculture, mining, and tourism. However, targeted regional policies, including ecological restoration projects, industrial restructuring, and ecological compensation, have partially mitigated these negative impacts, aiding vegetation recovery and creating positive ecological outcomes despite ongoing human pressures.
4.3. Transferability of the Integrated Modeling Approach
The integrated framework developed in this study exhibits strong transferability and can be applied to ecological assessments in other urban agglomerations and regions. Its adaptability lies in flexible, multi-scenario parameterization that must be localized during transfer. In regions facing concurrent pressures of rapid urbanization and ecological protection (e.g., the Yangtze River Delta, the Pearl River Delta, and large metropolitan areas in developing countries), the combined PLS–SEM and CA–Markov paradigm can be readily adopted, provided that the driver set is screened and adapted to local climatic, socioeconomic, and topographic conditions. Rather than transplanting the factor system wholesale, PLS–SEM should be re-specified to ensure construct validity and credible causal pathways. The framework is also extensible to other indicators–such as ecosystem service value and habitat quality–by aligning driver selection and quantification with indicator attributes and decomposing direct and indirect effects to deepen process understanding. When porting the CA–Markov component to other land-cover systems, the transition matrix and constraints in the multi-scenario stage should be revised according to local land policies, development plans, and scenario assumptions, ensuring that simulated trajectories reflect regional change processes and provide policy-relevant evidence.
4.4. Policy Implications
FVC exhibits pronounced spatial heterogeneity across the BTH region: values are relatively low in and around the urban cores of Beijing and Tianjin, but higher–and increasing more markedly–in the region’s northwestern mountainous areas. This pattern reflects divergent implementation priorities and constraints of ecological protection strategies. In dense urban zones, green-space planning and construction have delivered incremental gains, yet expansion of construction land and high development intensity limit further improvement. By contrast, measures such as mountain closure for afforestation and ecological resettlement have reduced human disturbance in mountainous areas, enabling natural vegetation recovery and producing substantial increases in FVC.
Accordingly, low-altitude urban areas within the BTH should prioritize coordinated ecological restoration alongside low-impact urban development. Building continuous green-infrastructure networks (e.g., urban forests, riparian buffers, ecological corridors) can buffer the effects of urban expansion on vegetation and reduce landscape fragmentation. Land-use controls framed by ecological redlines and carbon-emission targets should be tightened to optimize land-use structure and curb sprawling growth. In parallel, integrated monitoring and decision-support systems–combining high-resolution remote sensing, ground observation networks, and machine-learning models–can enhance the precision, timeliness, and effectiveness of vegetation management and ecological protection, thereby strengthening ecological resilience and supporting sustainable regional development.
4.5. Limitations and Prospects
Despite yielding important insights into FVC dynamics, drivers, and scenarios, this study has several limitations. First, the 250 m FVC product is appropriate for urban-agglomeration and regional planning applications (such as evaluating greenbelt continuity, delineating ecological corridors, and appraising inter-city spatial patterns), but it is not suited to parcel-level permitting or site-scale restoration design, which require higher spatial detail (on the order of 10–30 m, or finer). Second, the driver framework does not fully incorporate potentially salient variables—such as explicit policy instruments, groundwater dynamics, geological conditions, and finer-grained typologies of human activities–nor does it sufficiently account for inter-regional differences among Beijing, Tianjin, and Hebei in natural and anthropogenic contexts (e.g., conservation policies, hydrogeology). These omissions may reduce spatial explanatory power and introduce omitted-variable bias. Third, socio-economic pressures are represented coarsely by GDP and population density alone, limiting the ability to diagnose specific human drivers. Fourth, the CA–Markov component is only weakly sensitive to abrupt, nonlinear disturbances (e.g., extreme climate events or sudden policy shifts), which can lead to underestimation of their impacts and increase forecast uncertainty.
Future work can address these gaps along several fronts. A priority is to build a systematic indicator framework that explicitly represents regional heterogeneity and quantifies its contribution to FVC variability. Socio-economic descriptors should be refined—incorporating, for example, industrial structure, infrastructure and road density, nighttime lights, mining intensity, and policy intensity metrics—and paired with higher-resolution data to clarify causal pathways from human activities to FVC. Modeling capability can be strengthened by coupling CA–Markov with machine- or deep-learning approaches and by integrating system-dynamics and process-based ecological models to better capture nonlinear dynamics and feedback; uncertainty should be explicitly characterized via ensembles, sensitivity analysis, and (where appropriate) Bayesian methods. Data-fusion strategies should harmonize multi-sensor remote-sensing products to generate FVC series with higher spatial and temporal resolution, while enriching the driver set with higher-resolution imagery, targeted socio-economic surveys, explicit policy variables, and key natural factors. Finally, scenario design should align with IPCC climate projections and regional carbon targets, with formal uncertainty analysis embedded to support robust, policy-relevant land-management decisions.
5. Conclusions
Using integrated remote-sensing, climate, and socio-economic datasets for 2000–2022, we combined the pixel dichotomy model, PLS–SEM, and a CA–Markov framework to quantify FVC dynamics, diagnose drivers, and project scenario-based futures in the BTH region. Overall FVC rose from 0.462 to 0.576, largely attributable to ecological restoration in mountainous areas, whereas urban built-up zones experienced persistent declines, underscoring the ecological costs of urbanization. These spatially explicit results inform planning to strengthen ecological protection in urban expansion fronts while consolidating restoration gains in mountainous regions. PLS–SEM indicates that climate is the dominant positive driver (total effect = 0.903), partly offset by negative socio-economic (−0.468) and topographic (−0.260) influences–implying a need for adaptive management in climate-sensitive terrain and tighter coupling of urban growth controls with ecological safeguards. Scenario simulations show FVC declines relative to 2022 under all scenarios; however, the EPS yields substantially smaller losses than the IDS and UES. Collectively, these findings argue for strengthened ecological policies and land-use regulation to balance ecological sustainability with socio-economic development and safeguard regional ecological security.
Author Contributions
Software, validation and writing—original draft preparation, H.L.; resources and writing—review and editing, supervision, validation, W.L.; methodology, data curation, J.W.; methodology, conceptualization, L.W.; methodology, K.L.; resources and writing—review and editing, supervision, F.Z. All authors have read and agreed to the published version of the manuscript.
Funding
This research is supported by the Natural Science Foundation of Shandong Province (grant number ZR2024QD114, ZR2024QD174), the Shandong Province Youth Innovation Team for Higher Education Institutions (2024KJG061), the Shandong Province Undergraduate Teaching Reform Project (Grant number Z20220004), the 2024 Experimental Teaching Reform Research Project of Shandong Normal University (grant number 2024MS22), and the Jinan City–School Integration Project (grant number JNSX2023036).
Data Availability Statement
We will provide the data as required.
Conflicts of Interest
The authors declare no conflicts of interest.
References
- Pu, J.; Shen, A.; Liu, C.; Wen, B. Impacts of ecological land fragmentation on habitat quality in the Taihu Lake basin in Jiangsu Province, China. Ecol. Indic. 2024, 158, 111611. [Google Scholar] [CrossRef] [Scilit]
- Dang, L.; Zhao, F.; Teng, Y.; Teng, J.; Zhan, J.; Zhang, F.; Liu, W.; Wang, L. Scale dependency of trade-offs/synergies analysis of ecosystem services based on Bayesian Belief Networks: A case of the Yellow River Basin. J. Environ. Manag. 2025, 375, 124410. [Google Scholar] [CrossRef] [Scilit] [PubMed]
- Andres, S.; Adrian, F.; Graciela, M. Assessing the accuracy of Landsat vegetation fractional cover for monitoring Australian Drylands. Remote Sens. 2022, 14, 6322. [Google Scholar] [CrossRef] [Scilit]
- Gu, F.; Xu, G.; Wang, B.; Jia, L.; Xu, M. Vegetation cover change and restoration potential in the Ziwuling Forest Region, China. Ecol. Eng. 2023, 187, 106877. [Google Scholar] [CrossRef] [Scilit]
- Morancho, A.B. A hedonic valuation of urban green areas. Landsc. Urban Plan. 2003, 66, 35–41. [Google Scholar] [CrossRef] [Scilit]
- Mengyang, M.; Qingming, W.; Rong, L.; Yong, Z.; Dongqing, Z. Effects of climate change and human activities on vegetation coverage change in northern China considering extreme climate and time-lag and -accumulation effects. Sci. Total Environ. 2022, 860, 160527. [Google Scholar] [CrossRef] [Scilit]
- Teng, J.; Chang, J.; Zhai, Y.; Qin, X.; Yin, Z.; Guo, L.; Liu, W. Lagged and instantaneous effects between vegetation and surface water storage in the Yellow River Basin. Sustainability 2025, 17, 1709. [Google Scholar] [CrossRef] [Scilit]
- Xin, X.; Zhang, T.; He, F.; Zhang, W.; Chen, K. Assessing and simulating changes in ecosystem service value based on land use/cover change in coastal cities: A case study of Shanghai, China. Ocean. Coast. Manag. 2023, 239, 106591. [Google Scholar] [CrossRef] [Scilit]
- Zhao, T.; Mu, X.; Song, W.; Liu, Y.; Xie, Y.; Zhong, B.; Xie, D.; Jiang, L.; Yan, G. Mapping spatially seamless fractional vegetation cover over China at a 30-m resolution and semimonthly intervals in 2010–2020 based on Google Earth Engine. J. Remote Sens. 2023, 3, 0101. [Google Scholar] [CrossRef] [Scilit]
- Liu, Y.; Liu, R.; Qi, L.; Chen, J.; Dong, J.; Wei, X. Global mapping of fractional tree cover for forest cover change analysis. ISPRS J. Photogramm. Remote Sens. 2024, 211, 67–82. [Google Scholar] [CrossRef] [Scilit]
- Gao, L.; Wang, X.; Johnson, B.A.; Tian, Q.; Wang, Y.; Verrelst, J.; Mu, X.; Gu, X.; Sensing, R. Remote sensing algorithms for estimation of fractional vegetation cover using pure vegetation index values: A review. ISPRS J. Photogramm. Remote Sens. 2020, 159, 364–377. [Google Scholar] [CrossRef] [Scilit]
- Huang, T.; Olsoy, P.J.; Glenn, N.F.; Cattau, M.E.; Roser, A.V.; Boehm, A.; Clark, P.E. Quantifying rangeland fractional cover in the Northern Great Basin sagebrush steppe communities using high-resolution unoccupied aerial systems (UAS) imagery. Landsc. Ecol. 2024, 39, 196. [Google Scholar] [CrossRef] [Scilit]
- Liu, W.; Mo, X.; Liu, S.; Lu, C. Impacts of climate change on grassland fractional vegetation cover variation on the Tibetan Plateau. Sci. Total Environ. 2024, 939, 173320. [Google Scholar] [CrossRef] [Scilit] [PubMed]
- Liu, Y.; Liu, R.; Chen, J.; Wei, X.; Qi, L.; Zhao, L. A global annual fractional tree cover dataset during 2000–2021 generated from realigned MODIS seasonal data. Sci. Data 2024, 11, 832. [Google Scholar] [CrossRef] [Scilit] [PubMed]
- Anees, S.A.; Mehmood, K.; Rehman, A.; Rehman, N.U.; Muhammad, S.; Shahzad, F.; Hussain, K.; Luo, M.; Alarfaj, A.A.; Alharbi, S.A. Unveiling fractional vegetation cover dynamics: A spatiotemporal analysis using MODIS NDVI and machine learning. Environ. Sustain. Indic. 2024, 24, 100485. [Google Scholar] [CrossRef] [Scilit]
- Hu, B.; Xie, M.; He, R.; Shi, Z.; Zhou, Y.; Ni, H.; Li, H. Spatio-temporal evolution of cropland ecosystem services value and its spatially varying dominate over the past two decades: A case study in Jiangxi Province in southern China. J. Clean. Prod. 2023, 427, 139228. [Google Scholar] [CrossRef] [Scilit]
- Deng, X.; Wang, S.; Zhang, B.; Hu, X.; Wang, Y.; Liu, X.; Huang, E.; Luo, M. Effects of emergent vegetation on bed surface texture in a meandering-anabranching channel. J. Hydrol. 2025, 661, 133643. [Google Scholar] [CrossRef] [Scilit]
- Yu, H.; Izni, Z.; Fai, C.M. Vegetation as an ecological indicator in assessing environmental restoration in mining areas. iScience 2023, 26, 107667. [Google Scholar] [CrossRef] [Scilit]
- Gu, Z.; Zhang, Z.; Yang, J.; Wang, L. Quantifying the influences of driving factors on vegetation EVI changes using structural equation model: A case study in Anhui Province, China. Remote Sens. 2022, 14, 4203. [Google Scholar] [CrossRef] [Scilit]
- Chen, L.; Wang, Y.; Yan, Y.; Zhou, Z.; Xie, B.; You, X. Coupling and coordination development, spatiotemporal evolution, and driving factors of China’s digital countryside and inclusive green growth in rural areas. Sustainability 2024, 16, 5583. [Google Scholar] [CrossRef] [Scilit]
- Anees, S.A.; Zhang, X.; Shakeel, M.; Al-Kahtani, M.A.; Khan, K.A.; Akram, M.; Ghramh, H.A. Estimation of fractional vegetation cover dynamics based on satellite remote sensing in Pakistan: A comprehensive study on the FVC and its drivers. J. King Saud Univ.-Sci. 2022, 34, 101848. [Google Scholar] [CrossRef] [Scilit]
- Wang, B.; Spessa, A.C.; Feng, P.; Hou, X.; Yue, C.; Luo, J.-J.; Ciais, P.; Waters, C.; Cowie, A.; Nolan, R.H.; et al. Extreme fire weather is the major driver of severe bushfires in southeast Australia. Sci. Bull. 2022, 67, 655–664. [Google Scholar] [CrossRef] [Scilit]
- Alvarez, J.R.; Page, G.F.M.; Zdunic, K.; Prober, S.M. Estimating woody vegetation cover in arid and semi-arid rangelands. Ecol. Indic. 2025, 177, 113741. [Google Scholar] [CrossRef] [Scilit]
- Buren, Q.Q.; Li, X.; Chen, G.K.; Ye, G.H.; Sun, S.S.; Jin, Y.L.; Ming, M.; Fu, H.P.; Yuan, S. Ecological responses of Orientallactaga sibirica: Variations in body size and trophic niche across changing habitats. Glob. Ecol. Conserv. 2025, 61, e03670. [Google Scholar] [CrossRef] [Scilit]
- Lin, B.; Guan, C. Determinants of household food waste reduction intention in China: The role of perceived government control. J. Environ. Manag. 2021, 299, 113577. [Google Scholar] [CrossRef] [Scilit] [PubMed]
- Wu, B.; Wang, W.; Tan, Z.; Ding, D. Resilience modeling for discrete-time multi-state systems based on aggregated Markov chains. Reliab. Eng. Syst. Saf. 2025, 264, 111426. [Google Scholar] [CrossRef] [Scilit]
- Zheng, S.; Wang, Z.; Zhao, J. Network-assisted Semi-supervised Logistic Regression. Stat. Comput. 2025, 35, 157. [Google Scholar] [CrossRef] [Scilit]
- Meng, C.; Gu, Y.; Li, H.; Jin, H.; Zhang, G.; Cui, J. A physical mechanism-based scheme for parameterizing the fractional vegetation cover. Russ. Meteorol. Hydrol. 2024, 49, 430–434. [Google Scholar] [CrossRef] [Scilit]
- Tian, J.; Tian, Q.; Li, S.; Li, Q.; Zhang, S.; He, S. Quasi-HSL color space and its application: Sunlit and shaded component fractional cover estimation in vegetated ecosystem. Int. J. Appl. Earth Obs. Geoinf. 2024, 135, 104298. [Google Scholar] [CrossRef] [Scilit]
- Cui, L.; Zhao, Y.; Liu, J.; Wang, H.; Han, L.; Li, J.; Sun, Z. Vegetation coverage prediction for the Qinling mountains using the CA–Markov model. ISPRS Int. J. Geo-Inf. 2021, 10, 679. [Google Scholar] [CrossRef] [Scilit]
- Adhikari, S.; Southworth, J. Simulating forest cover changes of Bannerghatta National Park based on a CA-Markov model: A remote sensing approach. Remote Sens. 2012, 4, 3215–3243. [Google Scholar] [CrossRef] [Scilit]
- Zhang, Z.; Hörmann, G.; Huang, J.; Fohrer, N. A random forest-based CA-Markov model to examine the dynamics of land use/cover change aided with remote sensing and GIS. Remote Sens. 2023, 15, 2128. [Google Scholar] [CrossRef] [Scilit]
- Li, L.; Huang, C.; Liu, Y. Detecting the contribution of transport development to urban construction land expansion in the Beijing-Tianjin-Hebei region of China based on machine learning. Land Use Policy 2025, 157, 107622. [Google Scholar] [CrossRef] [Scilit]
- Lin, M.; Peng, B. Does regional coordinated development enhance urban resilience? Evidence from China’s Beijing-Tianjin-Hebei region. Econ. Anal. Policy 2025, 87, 1232–1261. [Google Scholar] [CrossRef] [Scilit]
- Yin, H.; Zhang, F.; Tan, W.; Huang, C.; Xiao, R. Urban flood resilience assessment and driving effects exploration: A case study of the Beijing-Tianjin-Hebei urban agglomeration. Int. J. Disaster Risk Reduct. 2025, 126, 105608. [Google Scholar] [CrossRef] [Scilit]
- Peng, S.; Ding, Y.; Wen, Z.; Chen, Y.; Cao, Y.; Ren, J. Spatiotemporal change and trend analysis of potential evapotranspiration over the Loess Plateau of China during 2011–2100. Agric. For. Meteorol. 2017, 233, 183–194. [Google Scholar] [CrossRef] [Scilit]
- Mackay, B.R.; Shaker, R.R. A Megacities Review: Comparing Indicator-Based Evaluations of Sustainable Development and Urban Resilience. Sustainability 2024, 16, 8076. [Google Scholar] [CrossRef] [Scilit]
- Sasongko, I.; Gai, A.M.; Azzizi, V.T. Sustainable Development Concept of HeritageKampungTourism Using Novel Prioritization Approach. Sustainability 2024, 16, 2934. [Google Scholar] [CrossRef] [Scilit]
- Gui, B.; Sam, L.; Bhardwaj, A.; Gómez, D.S.; Peñaloza, F.G.; Buchroithner, M.F.; Green, D.R. SAGRNet: A novel object-based graph convolutional neural network for diverse vegetation cover classification in remotely-sensed imagery. ISPRS J. Photogramm. Remote Sens. 2025, 227, 99–124. [Google Scholar] [CrossRef] [Scilit]
- Wang, B.; Si, J.; Jia, B.; He, X.; Zhou, D.; Zhu, X.; Liu, Z.; Ndayambaza, B.; Bai, X. Monitoring Spatial-Temporal Variability of Vegetation Coverage and Its Influencing Factors in the Yellow River Source Region from 2000 to 2020. Remote Sens. 2024, 16, 4772. [Google Scholar] [CrossRef] [Scilit]
- Zhou, Q.; Wei, C.; Wang, H.; Wang, D. Spatiotemporal evolution and driving factors analysis of fractional vegetation coverage in the arid region of northwest China. Sci. Total Environ. 2024, 954, 176271. [Google Scholar] [CrossRef] [Scilit] [PubMed]
- Hu, Y.; Su, H.; Song, H.; Xiong, Q.; Zhou, Z.; Huang, B.; Wang, X.; Xiao, N.; Yu, M. Synergistic impacts of anthropogenic and climatic drivers on total phosphorus dynamics in a mega river basin. Environ. Technol. Innov. 2025, 39, 104259. [Google Scholar] [CrossRef] [Scilit]
- Lv, S.; Meng, F.; Li, T.; Fu, Q.; Xiao, Z.; Li, M.; Hou, R.; Jiang, M. Analysis of changes in water-heat-carbon fluxes at different time scales and their influencing factors in the cold black soil region of Northeast China. Agric. Water Manag. 2025, 316, 109595. [Google Scholar] [CrossRef] [Scilit]
- Wu, Q.; Cao, Y.; Su, D.; Cao, Y. A multi-scale framework for understanding spatial scale effects on ecosystem service heterogeneity, interactions, drivers and their socio-ecological impact pathways for adaptive management. J. Clean. Prod. 2025, 516, 145757. [Google Scholar] [CrossRef] [Scilit]
- Zhang, F.; Wang, C.; Pan, K.; Guo, Z.; Liu, J.; Xu, A.; Ma, H.; Pan, X. The Simultaneous Prediction of Soil Properties and Vegetation Coverage from Vis-NIR Hyperspectral Data with a One-Dimensional Convolutional Neural Network: A Laboratory Simulation Study. Remote Sens. 2022, 14, 397. [Google Scholar] [CrossRef] [Scilit]
- Fei, F.; Xin, Y.; Baoquan, J.; Xiaoting, L.; Xianwen, L.; Chengyang, X.; Kaicun, W. Variability of urban fractional vegetation cover and its driving factors in 328 cities in China. Sci. China Earth Sci. 2024, 67, 466–482. [Google Scholar] [CrossRef] [Scilit]
- Wang, Y.; Zhang, A.; Gao, X.; Zhang, W.; Wang, X.; Jiao, L. Spatial–temporal differentiation and driving factors of vegetation landscape pattern in Beijing–Tianjin–Hebei region based on the ESTARFM Model. Sustainability 2024, 16, 10498. [Google Scholar] [CrossRef] [Scilit]
- Ma, Z.; Wu, J.; Yang, H.; Hong, Z.; Yang, J.; Gao, L. Assessment of vegetation net primary productivity variation and influencing factors in the Beijing-Tianjin-Hebei region. J. Environ. Manag. 2024, 365, 121490. [Google Scholar] [CrossRef] [Scilit]

Disclaimer/Publisher’s Note: The statements, opinions and data contained in all publications are solely those of the individual author(s) and contributor(s) and not of MDPI and/or the editor(s). MDPI and/or the editor(s) disclaim responsibility for any injury to people or property resulting from any ideas, methods, instructions or products referred to in the content. |
© 2025 by the authors. Licensee MDPI, Basel, Switzerland. This article is an open access article distributed under the terms and conditions of the Creative Commons Attribution (CC BY) license (https://creativecommons.org/licenses/by/4.0/).