


Abstract
The number of bridges in China is increasing year by year. The contradiction between the declining performance of bridge structures and the increasing traffic volume in China is becoming increasingly prominent, causing a concentrated upsurge in operation and maintenance needs during the service life of the bridges. In accordance with the goal and vision of the comprehensive construction of the Bridge Structural Health Monitoring (BSHM) system, the study of bridge cost-effectiveness now focuses on the installation, operation, and maintenance costs of the BSHM system, the renovation costs of bridge structure repair and maintenance, and the benefits of the BSHM system in assisting in expansion of the service life of bridges. In this study, a new cost-effectiveness framework is proposed that could be used for the operation and maintenance period. The cost-effectiveness framework is constructed from five perspectives: installation, operation, and maintenance costs of the BSHM system; repair and renovation costs during the operation and maintenance period; demolition costs; operation benefits during the operation and maintenance period; and the recovery benefits. The difference between costs and benefits is calculated to evaluate the cost-effectiveness, the service life, and the structural reliability of bridges, in order to provide auxiliary decision making for bridges. A bridge in China is used as an example; the difference between the reliability and operation of the bridge and the maintenance benefits and costs corresponding to different operating times is calculated, and maintenance decision analysis is performed. This can greatly extend the service time of the bridge without major repairs when the bridge reliability meets the requirements. Therefore, the BSHM operation and maintenance cost-effectiveness framework reduces resource waste, reduces operation and maintenance costs, and maximizes resource utilization and benefits, while ensuring the safety of the bridge structure and extending the service life of the bridge.
1. Introduction
With the development of science and technology, the span of bridges is increasing, and their structural forms are becoming more and more complex. China has gone through a period of rapid and concentrated bridge construction. However, most of the bridges have already served for more than half of their life cycle. The transportation infrastructure has entered a period of integrated construction and maintenance. The Bridge Structural Health Monitoring (BSHM) system has also emerged [1]. A program called “Opinions on Further Improving the Safety and Durability of Highway Bridges”, whose purpose is to construct bridge structural health monitoring systems on every long-span bridge in China, was fully launched in 2022. It requires the full establishment of special BSHM systems and the completion of renovation of some of the BSHM systems of older bridges by 2025 [2]. The BSHM system monitors the safety of bridge structures in real-time through sensors installed at various key points of the bridge; it accurately guides decisions regarding bridge structure maintenance and repair, avoids potential accidents, and extends the service life of bridges [3]. The BSHM system plays an important role in bridge management and maintenance by virtue of its real-time monitoring and intelligent evaluation of bridge structures [4,5]. While ensuring service requirements, in many cases bridges are designed and constructed at the lowest possible initial cost, ignoring the cost of repairs, such as bridge damage and failures during subsequent operation. However, establishment and transformation of the BSHM system will greatly increase the cost during the operation period. According to the Statistical Bulletin on the Development of the Transportation Industry in 2022, released by the Ministry of Transport in 2022, the income from bridge operation has been declining year by year, while investment has been increasing year by year [6]. This shows that the installation, operation, and maintenance costs of the BSHM system, the transformation costs of bridge structure repair and maintenance, and the benefits brought by the BSHM system to extend the service life of bridges have become the focus of bridge cost-effectiveness.
Previous studies have assessed the structural performance of the bridge itself or conducted a comprehensive evaluation based on cost. Frangopol et al. [7] used multi-objective optimization to evaluate the performance and cost of the bridge’s life cycle for prediction and decision making. Lin Tao et al. [8] combined bridge reliability, life cycle cost, and sustainability to select the optimal maintenance strategy for bridges based on multi-attribute effects. However, only selecting the structural performance of the bridge itself, or conducting a comprehensive evaluation that includes the cost, often ignores the economic benefits of the bridge. Godwin et al. [9] studied the sustainability of the building life cycle and pointed out that the operation, maintenance and repair, replacement, and decommissioning costs accounted for 2%, 8%, 13%, and 4% of the building cost, respectively. The total accounts for 27% of the total building cost as an extra investment, indicating that it is necessary to conduct a cost–benefit analysis. For maintenance and repair costs, deterioration models [10,11,12] are used to associate reliability with cost and to continuously optimize intervention costs. For decommissioning costs, the use of carbon emissions to quantify demolition costs is currently the main research method [13,14,15]. Björnssona et al. [16] constructed a decision support framework for bridge condition assessment to provide decision support when deciding whether condition assessment was needed, whether intervention should be carried out, and what assessment method to adopt. Barone et al. [17] studied the optimal maintenance plan for deteriorated structures based on the optimization of multiple objectives, such as reliability, risk, availability, hazards, and costs throughout their life cycle.
Most of the above studies are based on the reliability theory of bridge safety, with the general minimum cost as the control condition; their aim was to establish a model to allow the optimal remaining service life of operating bridges. However, these studies have some limitations: most of the literature on bridge structure health monitoring only considers cost minimization, while ignoring the benefits of bridge structure health monitoring and the dual goal of finding the optimal balance between costs and benefits. In the later stage of bridge operation, when bridge performance has significantly declined and maintenance costs have continued to increase, there is still a gap in the research regarding whether to continue maintenance or carry out demolition.
Therefore, a tail-end evaluation method based on the cost-effectiveness of the whole life cycle of the bridge is proposed. As the ultimate aim is to build a comprehensive BSHM system, it is necessary to consider not only the installation and operation maintenance cost of the bridge structure health monitoring system, the maintenance and renovation cost during the operation and maintenance period, and the demolition cost, but also the operation benefit and recovery benefit during the operation and maintenance period. A cost-effectiveness framework was constructed from multiple perspectives to achieve a more comprehensive evaluation and optimization of the three indicators of the whole life cycle cost, bridge structure safety, and bridge service life. By calculating the installation cost and monitoring cost of the BSHM system, based on the monitoring data of various indicators of the bridge, a reliability model was introduced to calculate the real-time reliability of the bridge; then, the maintenance and renovation cost during the operation of the bridge was obtained. The bridge demolition cost was calculated by combining the direct cost of demolition and the carbon emission cost of demolition; the operation benefit was calculated according to the user cost; the emission reduction generated by the reusable materials was calculated to obtain the bridge recovery benefit; and the difference between the total benefit value and the total cost value was determined. The difference was combined with the service life of the bridge and the reliability of the bridge structure to obtain the analysis results, and timely decision optimization was made possible. The innovation of this study lies in the fact that it considered the cost of the BSHM system and the cost of bridge maintenance, as well as the recovery benefits of the bridge after disposal; furthermore, it analyzed and studied the structural reliability, cost-effectiveness, and service life of the bridge. Compared with previous studies, more comprehensive influencing factors are considered. This study uses a bridge in service in China as an example. After 22 years of operation, a BSHM system was installed in response to national policies and to consider the structural safety of the bridge. The bridge has not yet been overhauled; therefore, it was used for analysis and calculation.
The paper is structured as follows: Section 2 introduces the proposed bridge operation and maintenance cost model, by calculating the installation cost and monitoring cost of the BSHM systems; it introduces a reliability model to calculate the real-time reliability of the bridge and to obtain the maintenance and renovation cost during the bridge operation. The bridge demolition cost is calculated by integrating the direct costs and carbon emission costs. Section 3 covers the proposed bridge operation and maintenance benefit model by calculating the operation benefit based on user costs; the bridge recycling benefit is obtained by calculating the emission reduction that results from the use of reusable materials. Section 4 integrates the models from the previous two sections, constructs a cost–benefit framework for bridge operation and maintenance, and analyzes the results. Section 5 uses Chinese bridge cases and analyzes the results in combination with the service life of bridges and the reliability of bridge structures to illustrate the feasibility of the proposed framework. Section 6 includes the conclusions drawn from the above work.
2. Bridge Operation and Maintenance Cost Model
2.1. Installation, Operation, and Maintenance Costs of BSHM System
The “Opinions on Further Improving the Safety and Durability of Highway Bridges” states that Class IV and V bridges need to have a bridge structure health monitoring system [1]. For old bridges, the sensor installation cost, sensor equipment cost, and software and hardware maintenance cost during the system monitoring process must be considered.
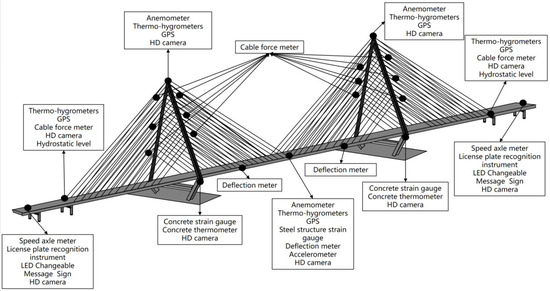
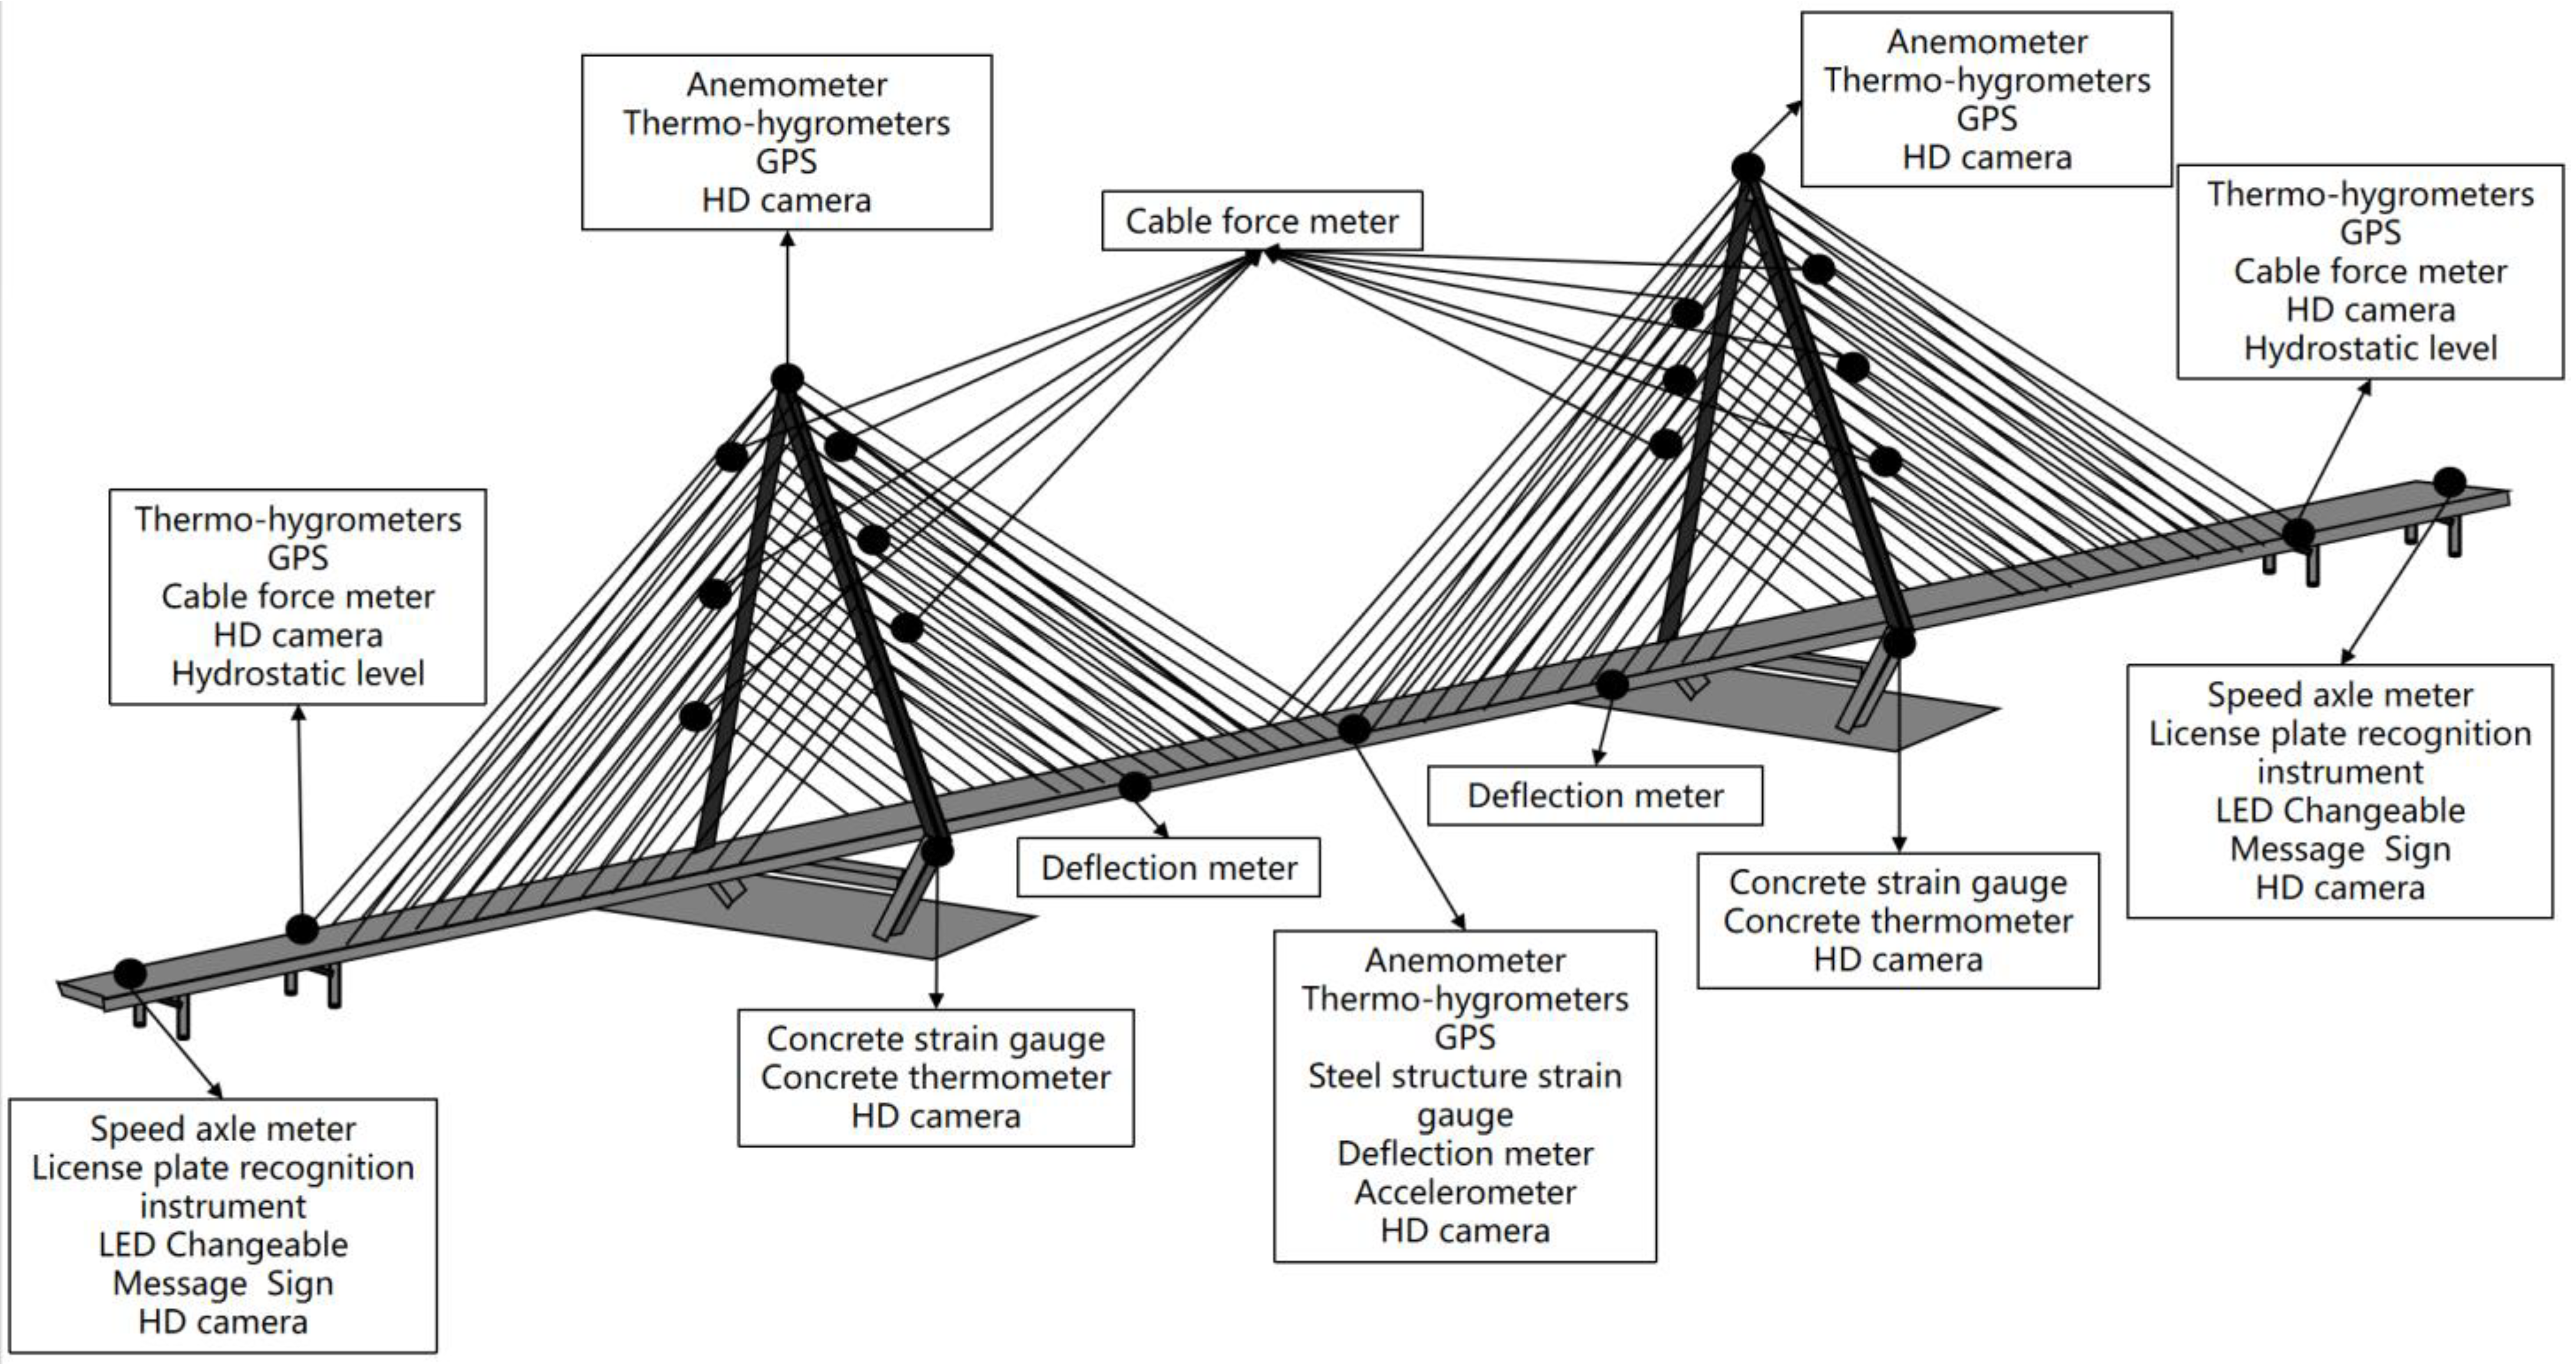
According to the Technical Specifications for Highway Bridge Structure Monitoring, the installation location of sensors should meet the following requirements: the measurement points for structural response and structural change monitoring should be arranged at locations with large stress and large deformation; locations that are easy to damage and affect the safety and durability of major components and the overall safety of the structure; and locations with existing diseases and damage. For bridge components with performance degradation and serious damage, the number of monitoring points should be increased in a targeted manner [18]. Sensors should be installed according to the schematic diagram of the monitoring point layout of conventional suspension bridges, cable-stayed bridges, beam bridges, and arch bridges in the Highway Bridge and Culvert Maintenance Specifications [19]. Different bridge structure health monitoring methods will result in different monitoring costs, different degrees of bridge structure damage, and different repair and renovation costs. At the same time, because the old bridges were in operation for a period of time before the bridge structure health monitoring system was installed, the installation, operation, and maintenance costs of the BSHM system are divided into installation costs and operation and maintenance costs.
As shown in Figure 1, the corresponding sensor equipment is installed according to the monitoring content, and the installation cost of the BSHM system is expressed as the sum of the number of sensor equipment units, the unit price of the sensor equipment, and the equipment installation cost:
wherein represents the number of sensor equipment units, represents the unit price of sensor , and represents the cost of installing sensor . For different structural types and monitoring systems in bridge cost–benefit frameworks, the actual construction cost of the bridge can be substituted into Formula (1) as needed for calculation.
Figure 1.
Sensor measurement point layout.
The operation and maintenance of the BSHM system includes daily inspection, regular maintenance, and emergency maintenance of hardware and software. The operation and maintenance costs of the BSHM system mainly consist of the costs of manual inspection and maintenance and the costs of sensor equipment failures. The inspection frequency determines the labor cost. In conjunction with the provisions of the system operation and maintenance inspection frequency in the “Highway Bridge and Culvert Maintenance Specifications” and “Urban Bridge Maintenance Technical Standards”, the labor costs and monitoring equipment costs of each aspect of the inspection content are calculated. Every year, maintenance personnel are needed to perform maintenance and to replace and repair faulty monitoring sensors and equipment in the monitoring system. The annual hardware maintenance cost is 1 M. The self-compiled software is revised and upgraded every year. The annual software maintenance cost is 1 M. Maintenance personnel are needed to process the alarm information of the data of each monitoring point every month and to troubleshoot system faults on site, register system faults found in daily inspections, formulate fault maintenance schedules and maintenance registration forms, and formulate maintenance plans. The cost of carrying out routine hardware maintenance twelve times a year is 12 M. On-duty personnel are needed to check the real-time data collection and system operation of each monitoring point every month. The cost of carrying out routine software maintenance twelve times a year is CNY 12 million [19,20]. Therefore, if the inspection frequency was unified in annual units, the unit cost of the daily manual inspection and maintenance of the hardware and software of the structural health monitoring system would be CNY 25 million per year. The operation and maintenance cost of the BSHM system can be expressed as:
wherein represents the unit cost of manual maintenance and inspection and represents the manual maintenance cost of special maintenance and emergency maintenance.
2.2. The Maintenance and Renovation Costs During Operation and Maintenance
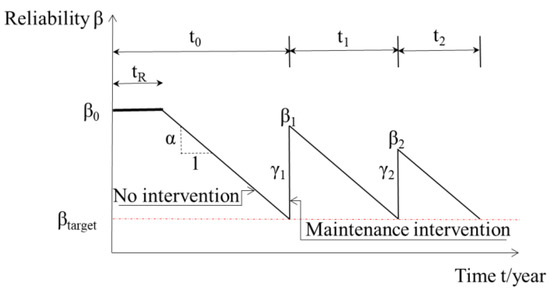
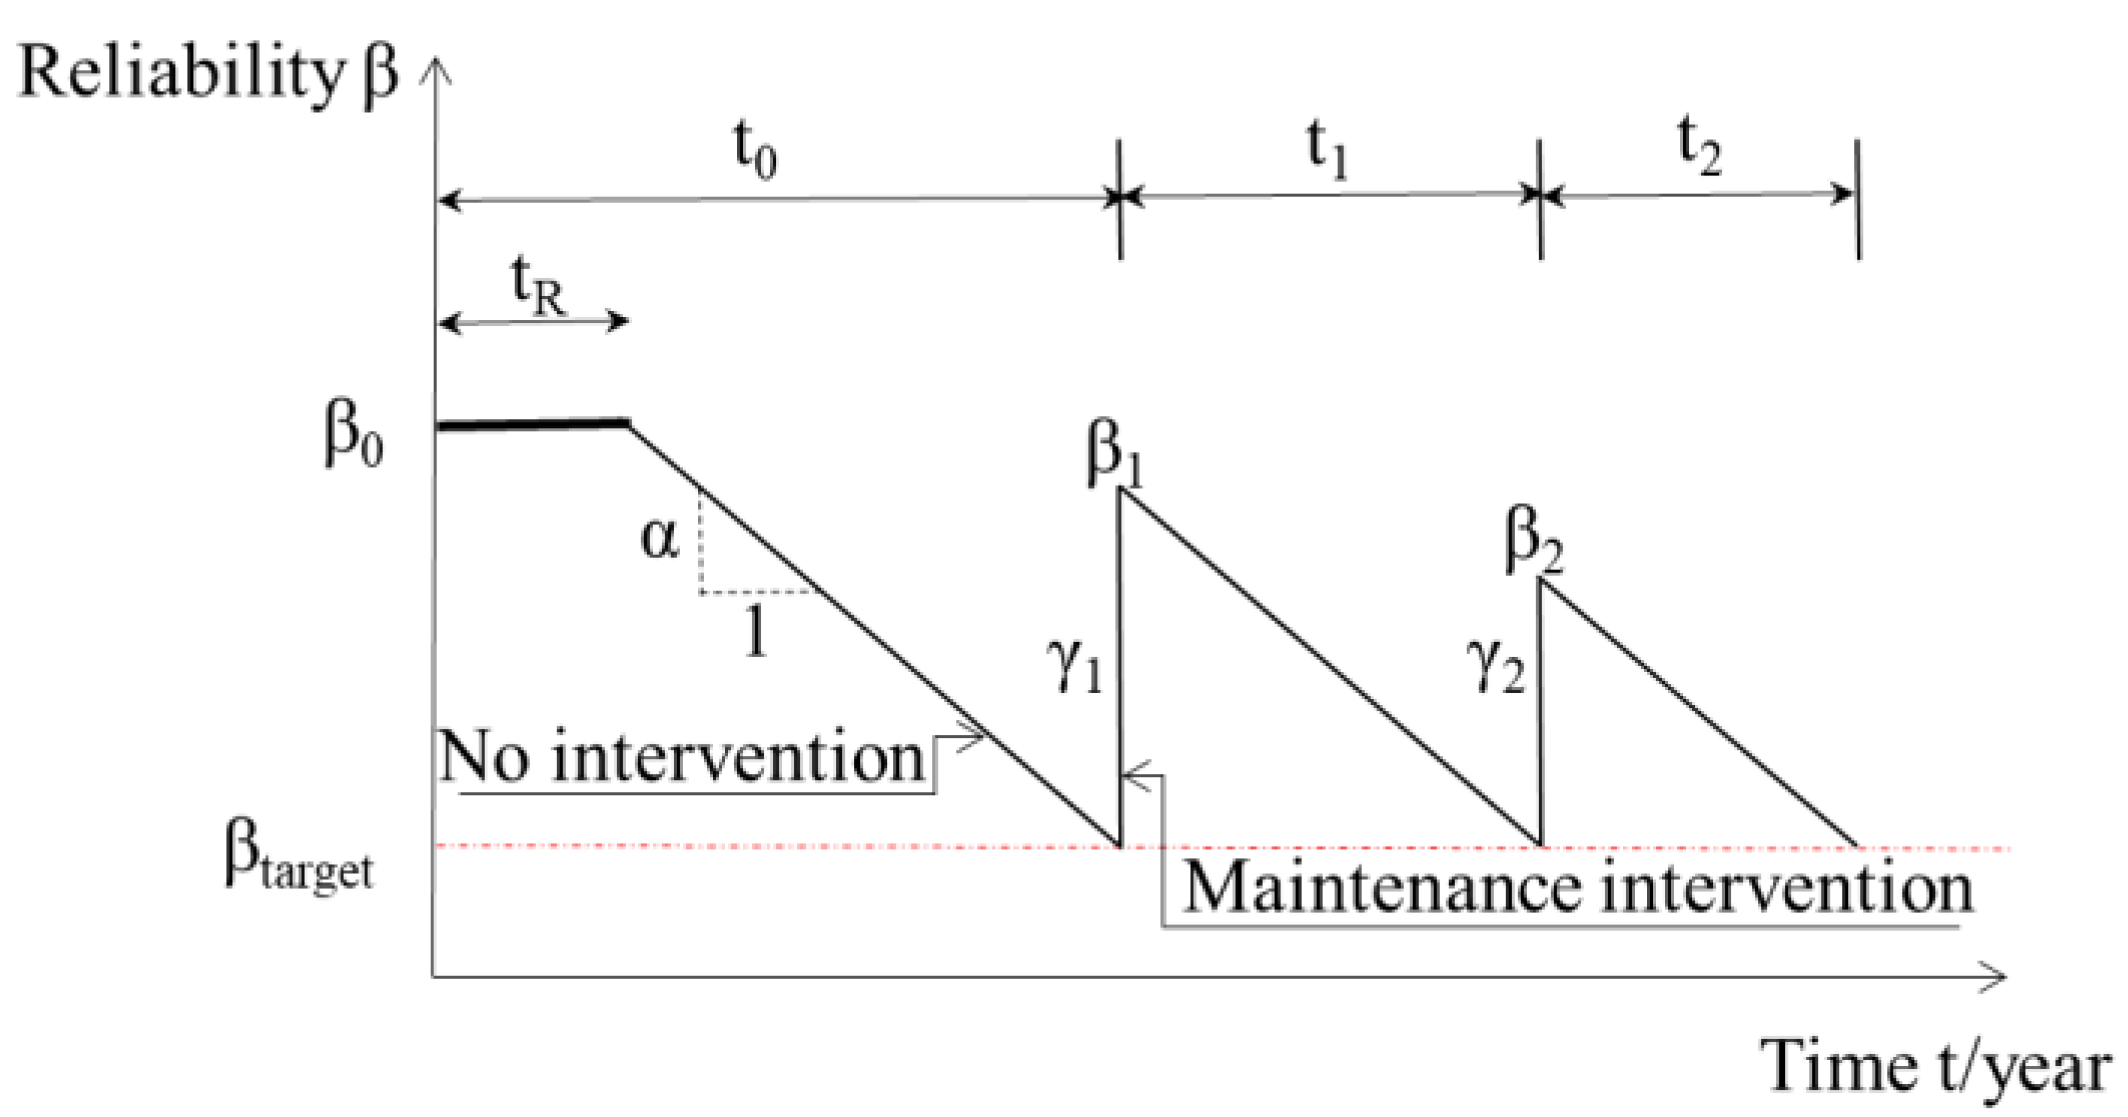
In the diagram showing the relationship between reliability and the maintenance scheme and maintenance cost studied by F. Biondini et al. [21], three schemes are listed. The first involves carrying out large-scale maintenance after reliability reaches the threshold reliability , so that the reliability returns to the initial value. At this stage, the maintenance cost also increases in a cliff-like manner. The second involves regularly repairing the bridge; reliability changes in a sawtooth shape, but it is always above the threshold reliability , and the maintenance cost increases slowly in a step-like manner. The third is a combination of the first two. When the threshold reliability is not reached, sawtooth maintenance is carried out, and after the threshold reliability is reached, large-scale maintenance is carried out. At this stage, the maintenance cost increases slowly in a step-like manner in the early stage, and the maintenance cost increases significantly in the later stage. Different maintenance plans incur different costs. Among these three plans, the third one has the smallest total maintenance cost, followed by the second one, and the first one has the largest total maintenance cost. Deterioration models usually use initial reliability, initial deterioration time, and deterioration rate for reliability analysis. Based on the research by F. Biondini et al. [21] and the research by Shao et al. [22], a deterioration model with lower maintenance cost is selected. With reference to the case value of the natural aging deterioration model by Liang et al. [12], the maintenance and modification cost during operation is calculated. In the actual operation and maintenance of bridge structural health monitoring systems, intervention maintenance is performed when abnormal monitoring data are detected. Depending on the situation, either minor or major repairs are selected. This intervention maintenance spans the bridge’s entire life cycle, which means that minor repairs occur frequently, while major repairs are reserved for cases with clear structural issues. Minor repairs generally have minimal impact on the bridge system’s reliability. Although the monitoring data may show significant changes post-repair, the structural condition of the bridge remains largely unchanged. This study focuses on scenarios in which the monitoring data show significant improvement following each major repair, indicating a marked enhancement in the bridge system’s reliability, which exceeds its pre-intervention state. The deterioration model is shown in Figure 2.
Figure 2.
Deterioration model.
In the above equation ; ; time-varying reliability ; initial reliability ; time ; time when the bridge reliability is constant at ; natural degradation rate α without intervention; threshold reliability for forced external intervention; when the threshold reliability is reached, the external intervention maintains the reliability effect .
The corresponding relationships among the values of the bridge structure reliability and bridge category, the bridge periodic inspection score, and the status are shown in Table 1. When the bridge reliability β(t) < 50, the bridge status requires a major overhaul.
Table 1.
Correspondence among bridge structure reliability and category, scheduled inspection score, and bridge status.
The maintenance and renovation costs during operation are divided into basic maintenance costs and functional maintenance costs. The unit maintenance cost depends on the reliability of the bridge structure, the difficulty in carrying out maintenance, the man-hours required to perform maintenance, the man-hour cost, and the material and equipment cost. The functional maintenance cost depends on the number of lanes closed for maintenance, the total number of lanes, and the traffic volume. The basic maintenance cost is obtained by multiplying the unit maintenance cost by the reliability of the maintenance intervention change, and the functional maintenance cost is obtained by multiplying the user cost by the ratio of the number of lanes closed for maintenance to the total number of lanes by the traffic volume. Therefore, the maintenance and modification cost during the operation period is expressed as:
wherein represents the bridge maintenance area; represents the unit cost of unit maintenance; represents the initial reliability; represents the time-varying reliability; represents the user cost of road congestion, traffic accidents, and user delays caused by the number of lanes closed due to maintenance; represents the number of lanes closed due to maintenance; and represents the total number of lanes.
2.3. Demolition Cost
In the later stage of bridge operation, when faced with the decision of whether to continue maintenance or proceed with demolition, the demolition cost is included as a predictable cost at the end of the bridge’s life cycle. A study by Liu et al. [13] showed that landfill has the highest carbon emissions, followed by the production of recycled aggregates. Among landfills, plastic landfill produces the most carbon dioxide. During the demolition process, mechanical operations produce the highest carbon emissions, and the carbon emission cost cannot be ignored. Therefore, the demolition cost consists of departmental direct costs and carbon emission costs. The departmental direct costs are calculated in proportion to the cost data of the demolished bridges; the carbon emission costs are calculated using the carbon emissions generated by the demolition of the bridge and its ancillary structures. Using carbon trading as a medium, the carbon emissions at the end of the bridge’s life cycle are combined with the carbon price in the actual carbon trading market to obtain the corresponding carbon emission costs [23]. Carbon emissions mainly come from machine operation; therefore, this study currently only considers the carbon emissions from machine operation [24]. Therefore, the maintenance and renovation cost during operation is expressed as:
wherein represents the total cost of the demolished bridge; represents the volume of the demolished bridge; represents the volume of the case bridge; represents the carbon emissions generated by the operation of the machine; and represents the average transaction price in the carbon market.
3. Bridge Operation and Maintenance Benefit Model
3.1. User Benefits During Bridge Operation and Maintenance Period
The construction of bridges reduces the detour distance of vehicles, and the benefits of bridges can be calculated using the traffic detour distance. The detour cost saved by the bridge is the benefit generated by the bridge. The cost of the bridge detour is estimated by using the marginal benefit of the bridge compared with the nearest driving route without the bridge. A vehicle’s average fuel consumption per kilometer multiplied by the average oil price of the year represents the cost of the vehicle per kilometer. Average fuel consumption is used to ignore the uncertain effects caused by different types of vehicles, making the data calculation more accurate. The average oil price for the year is used to minimize error caused by increases in oil prices. Therefore, the user benefit during the operation period is expressed as:
wherein represents the traffic volume at time ; represents the average fuel consumption of a car per kilometer; represents the average oil price of the year; represents the distance the user travels to the destination without crossing the bridge; and represents the distance the user travels to the destination on the bridge.
3.2. Recycling Benefits
Public data from the International Energy Agency and the 2023 China Building and Urban Infrastructure Carbon Emissions Research Report show that carbon dioxide generated by steel, cement, and transportation accounts for 74% of the production and transportation of building materials [25]. Therefore, the construction waste generated by bridge demolition can be recycled and processed into aggregates, which not only reduces the demand for raw materials, but also greatly reduces carbon emissions in the production and transportation of building materials. The carbon emission reduction generated by processing and recycling construction waste can bring economic benefits, namely recycling income. However, the reprocessing of construction waste requires additional labor costs and other expenses; therefore, selling construction waste to recycling plants can generate more economic benefits [13].
In on the above equation, the conversion rate of construction waste recycling into aggregate is 85%. represents the volume of the case bridge; represents the carbon emission coefficient of concrete; represents the average transaction price in the carbon market; and represents the unit price of selling construction waste aggregate.
4. Analysis and Decision Making Using the Cost–Benefit Framework During Bridge Operation and Maintenance
4.1. Cost-Effectiveness Framework for Bridge Operation and Maintenance
Based on Equations (3), (5), and (6), the bridge operation and maintenance cost model is constructed, as follows:
Based on (6) and (7), the bridge operation and maintenance benefit model is constructed, as follows:
Then, the benefit model of the bridge operation and maintenance period minus the cost model can give the difference between the benefits and costs at any time :
4.2. Cost–Benefit Analysis of Bridge Operation and Maintenance Period
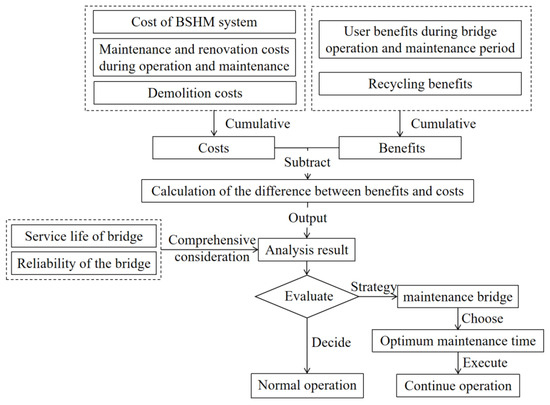
The decision-making flowchart is shown in Figure 3. According to the needs of the decision makers, multi-objective constraints are set, and the multi-objective optimization of the difference, bridge service life, and bridge structure reliability is calculated. The change curve of the difference between the benefits and costs during the bridge operation and maintenance period is analyzed to continue maintenance or demolition. When the value is always greater than 0, this means that the bridge benefits are greater than the cost at this stage. The bridge will be regularly inspected and maintained according to the original operation plan. As the service life of the bridge increases, the bridge can be evaluated, and the operation and maintenance plan of the bridge structure health monitoring system can be adjusted. When the value is less than 0 and the maximum value of is still greater than 0, this means that the bridge at this stage has a benefit greater than the cost. Although the initial maintenance cost is high, it may bring more economic benefits in the long run. The bridge structure will continue to be retained. Under the condition of ensuring the structural safety of the bridge during service, the cost investment will be adjusted in time. However, when the value is less than 0 and the maximum value of is also less than 0, this means that the operation status of the bridge is always in a loss state. When the loss is serious and the bridge is replaceable, the demolition decision is made by comprehensively considering the function of the bridge and its historical significance.
Figure 3.
Decision-making flowchart.
5. Example Verification
5.1. Data Sources
A bridge that was put into operation in the 20th century had a BSHM system installed 22 years after operation, with a total of 178 measurement points. The total contract value of the BSHM system was about CNY 8.4 million, that is, million. According to the survey of the bridge monitoring companies, the manual maintenance and detection cost . Because the sensors of the bridge in this case are operating normally, and there are no sudden failures, the manual maintenance cost of special maintenance and emergency maintenance was not considered.
The main disease of bridges is cracks, and the maintenance area is very small. The bridge maintenance area ; the unit maintenance unit cost is calculated according to the literature [12] and multiplied by the inflation rate and the exchange rate; that is, CNY/square meter; the initial reliability is according to the literature; the user cost of road congestion, traffic accidents, and user delays caused by the number of lanes closed due to maintenance is CNY/square meter; the number of lanes closed due to maintenance is one or two; thus, the average value of is taken, and the total number of lanes is .
The total cost of the demolished bridge is million; the ratio of the volume of the case bridge to the volume of the demolished bridge is calculated to be ; the carbon emissions generated by the machine operation tons; the average transaction price of the domestic carbon market in the 9th period of 2024 is CNY/ton.
Calculation of the traffic volume at the time uses the average daily traffic volume of vehicles; based on data from the Ministry of Industry and Information Technology in 2023, the average fuel consumption of a car per kilometer is L/km; the average oil price of the year is CNY/L; the distance that the user travels to the destination without passing the bridge is km; the distance that the user travels to the destination on the bridge is km; the volume of the case bridge is m3; according to the “Building Carbon Emission Calculation Standard”, the carbon emission coefficient is ; the unit price of the building waste aggregates sold is CNY/cubic meter.
According to the above analysis, the data source Table 2 is organized as follows:
Table 2.
Data source table.
5.2. Case Calculation
Substituting the data in Table 2 into the formula, we can obtain based on the time when the case bridge was put into operation and the time when the BSHM system was installed. We set and obtain based on the score of the latest bridge safety assessment.
million.
As the case bridge has not yet been overhauled, and the operation and maintenance time is greater than , it is in the stage of , as shown in Figure 1. Therefore, in the segmented case of , only the case of is calculated.
The constraints are satisfied:
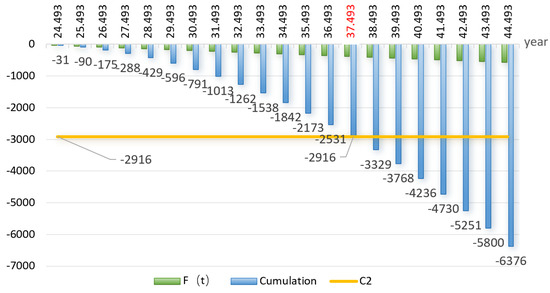
Considering that the case bridge has not yet been overhauled and the bridge reliability has a linear relationship with time, the multi-objective linear programming method is mainly used. According to the determined objective function and constraints, the planning problems of three single-objective functions are solved, respectively, to obtain the ideal value of each objective function; then, the allowable deviation value is set according to the decision maker’s preference and actual situation. The values of , , and are calculated to achieve multi-objective optimization. In this study, the permissible deviation value for bridge reliability is set at 40, which represents the acceptable threshold at the bridge’s ultimate limit state. This value is established with bridge safety in mind, ensuring sufficient structural stability and durability during operation. For economic cost and service life, no specific deviation value is prescribed; instead, the goal is to maximize both lifespan and profitability. While some deviation is permitted in the optimization process, it must remain within an acceptable range to ensure the bridge’s economic viability and sustainability. Under the condition of ensuring the safety of the bridge’s structure, the waste of maintenance resources is reduced; thus, the loss-making period of the bridge’s operation can be reduced when the service life of the bridge is longer. As the service life increases, the difference between the benefits and costs during the bridge’s operation period shows a negative growth, as shown in Figure 4; when years, and million; the cumulative at this time most closely approximates the cost of a major overhaul. At this time, maintenance can extend the service life of the bridge without reaching the threshold of bridge reliability, and it will generate lower costs; thus, the bridge can still operate at a loss.
Figure 4.
Relationship between cumulative F(t) and maintenance cost.
In Figure 4, the horizontal axis represents the service life of the bridge, the yellow line represents the cost of a major repair, the green bars represent the annual value as the service life of the bridge increases, and the blue bars represent the annual cumulative value as the service life of the bridge increases.
5.3. Case Analysis
Three special situations are calculated so that decision makers can make decisions at the time nodes or in the time intervals of the three situations. The calculation results of the case are shown in Table 3.
Table 3.
The calculation results of the case table.
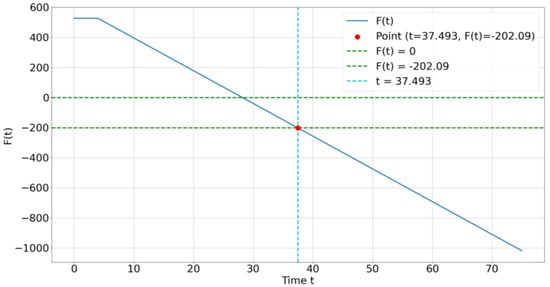
(1) At years, and million. This point corresponds to the end of May, roughly 37 years after the bridge’s operation began. If no major repairs are carried out after this point, the daily maintenance costs will exceed the cost of a major repair. Conducting the first major repair at this time would optimize the bridge’s structural reliability, extend its service life, and balance the benefits and costs of the BSHM (Bridge Structural Health Monitoring) system. At this point, the accumulated operational losses are equal to the cost of the first major repair. If the repair is performed before this point, the accumulated operational losses will be less than the cost of the major repair. However, if the first major repair is delayed beyond this point, the bridge’s reliability will decline, and the accumulated losses will exceed the cost of the repair. Therefore, the safest and most economical option is to carry out the repair at the appropriate time. The cumulative is shown in Figure 4; this time point (i.e., 37.493 years) is exactly the moment when the overhaul cost and the cumulative benefit are equal. This means that, if the service life is increased, not only will the reliability of the bridge structure maintain a downward trend, but the cumulative benefit will gradually decrease and become less than the maintenance cost of a major overhaul. At this time, maintenance will become neither economical nor safe. Conversely, if the overhaul is carried out in advance, when the reliability of the bridge structure is still at a relatively safe level, the cumulative at this time will be greater than the maintenance cost of a major overhaul, which means that the bridge can continue to operate for a period of time with benefits greater than costs and without the need for major overhaul. If a major overhaul is carried out at this time, not only will some operating benefits be lost, but it will also cause inconvenience to the daily lives of residents during the maintenance period. At this time, the reliability of the bridge structure is still at a relatively safe stage, and there is no urgent need for maintenance. Therefore, considering the safety, economic, and social benefits, 37.493 years is determined to be the safest and most economical maintenance time.
In Figure 5, the blue line represents the changing trend of the difference between the benefits and costs of the bridge ; the green straight lines are and obtained by substituting time ; the cyan straight line represents the straight line at time , and the coordinates of the red intersection are (37.493, −202.09). Combined with Figure 4, this point means that the cumulative value of is exactly equal to the cost of a major repair.
Figure 5.
The optimal solution for the F(t) − t graph when F(t) = −202.07, t = 37.493.
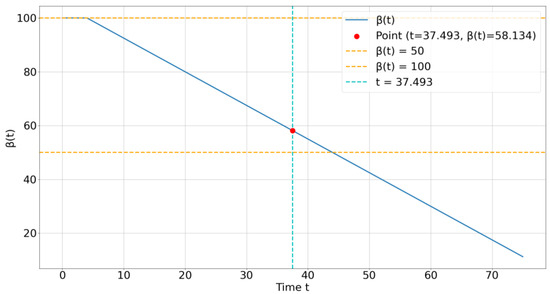
In Figure 6, the blue straight line represents time-varying reliability ; the yellow straight lines are the two constraint lines of and ; the cyan straight line represents the straight line at time , and the coordinates of the red intersection are (37.493, 58.134).
Figure 6.
Bridge limit state for the β(t) − t diagram when β(t) = 58.134, t = 37.493.
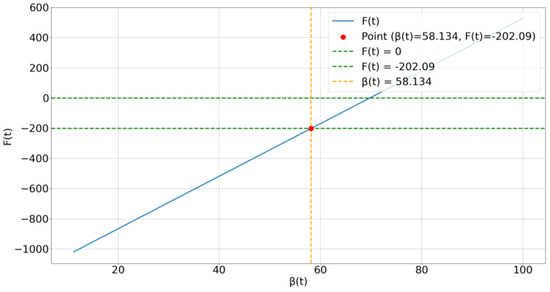
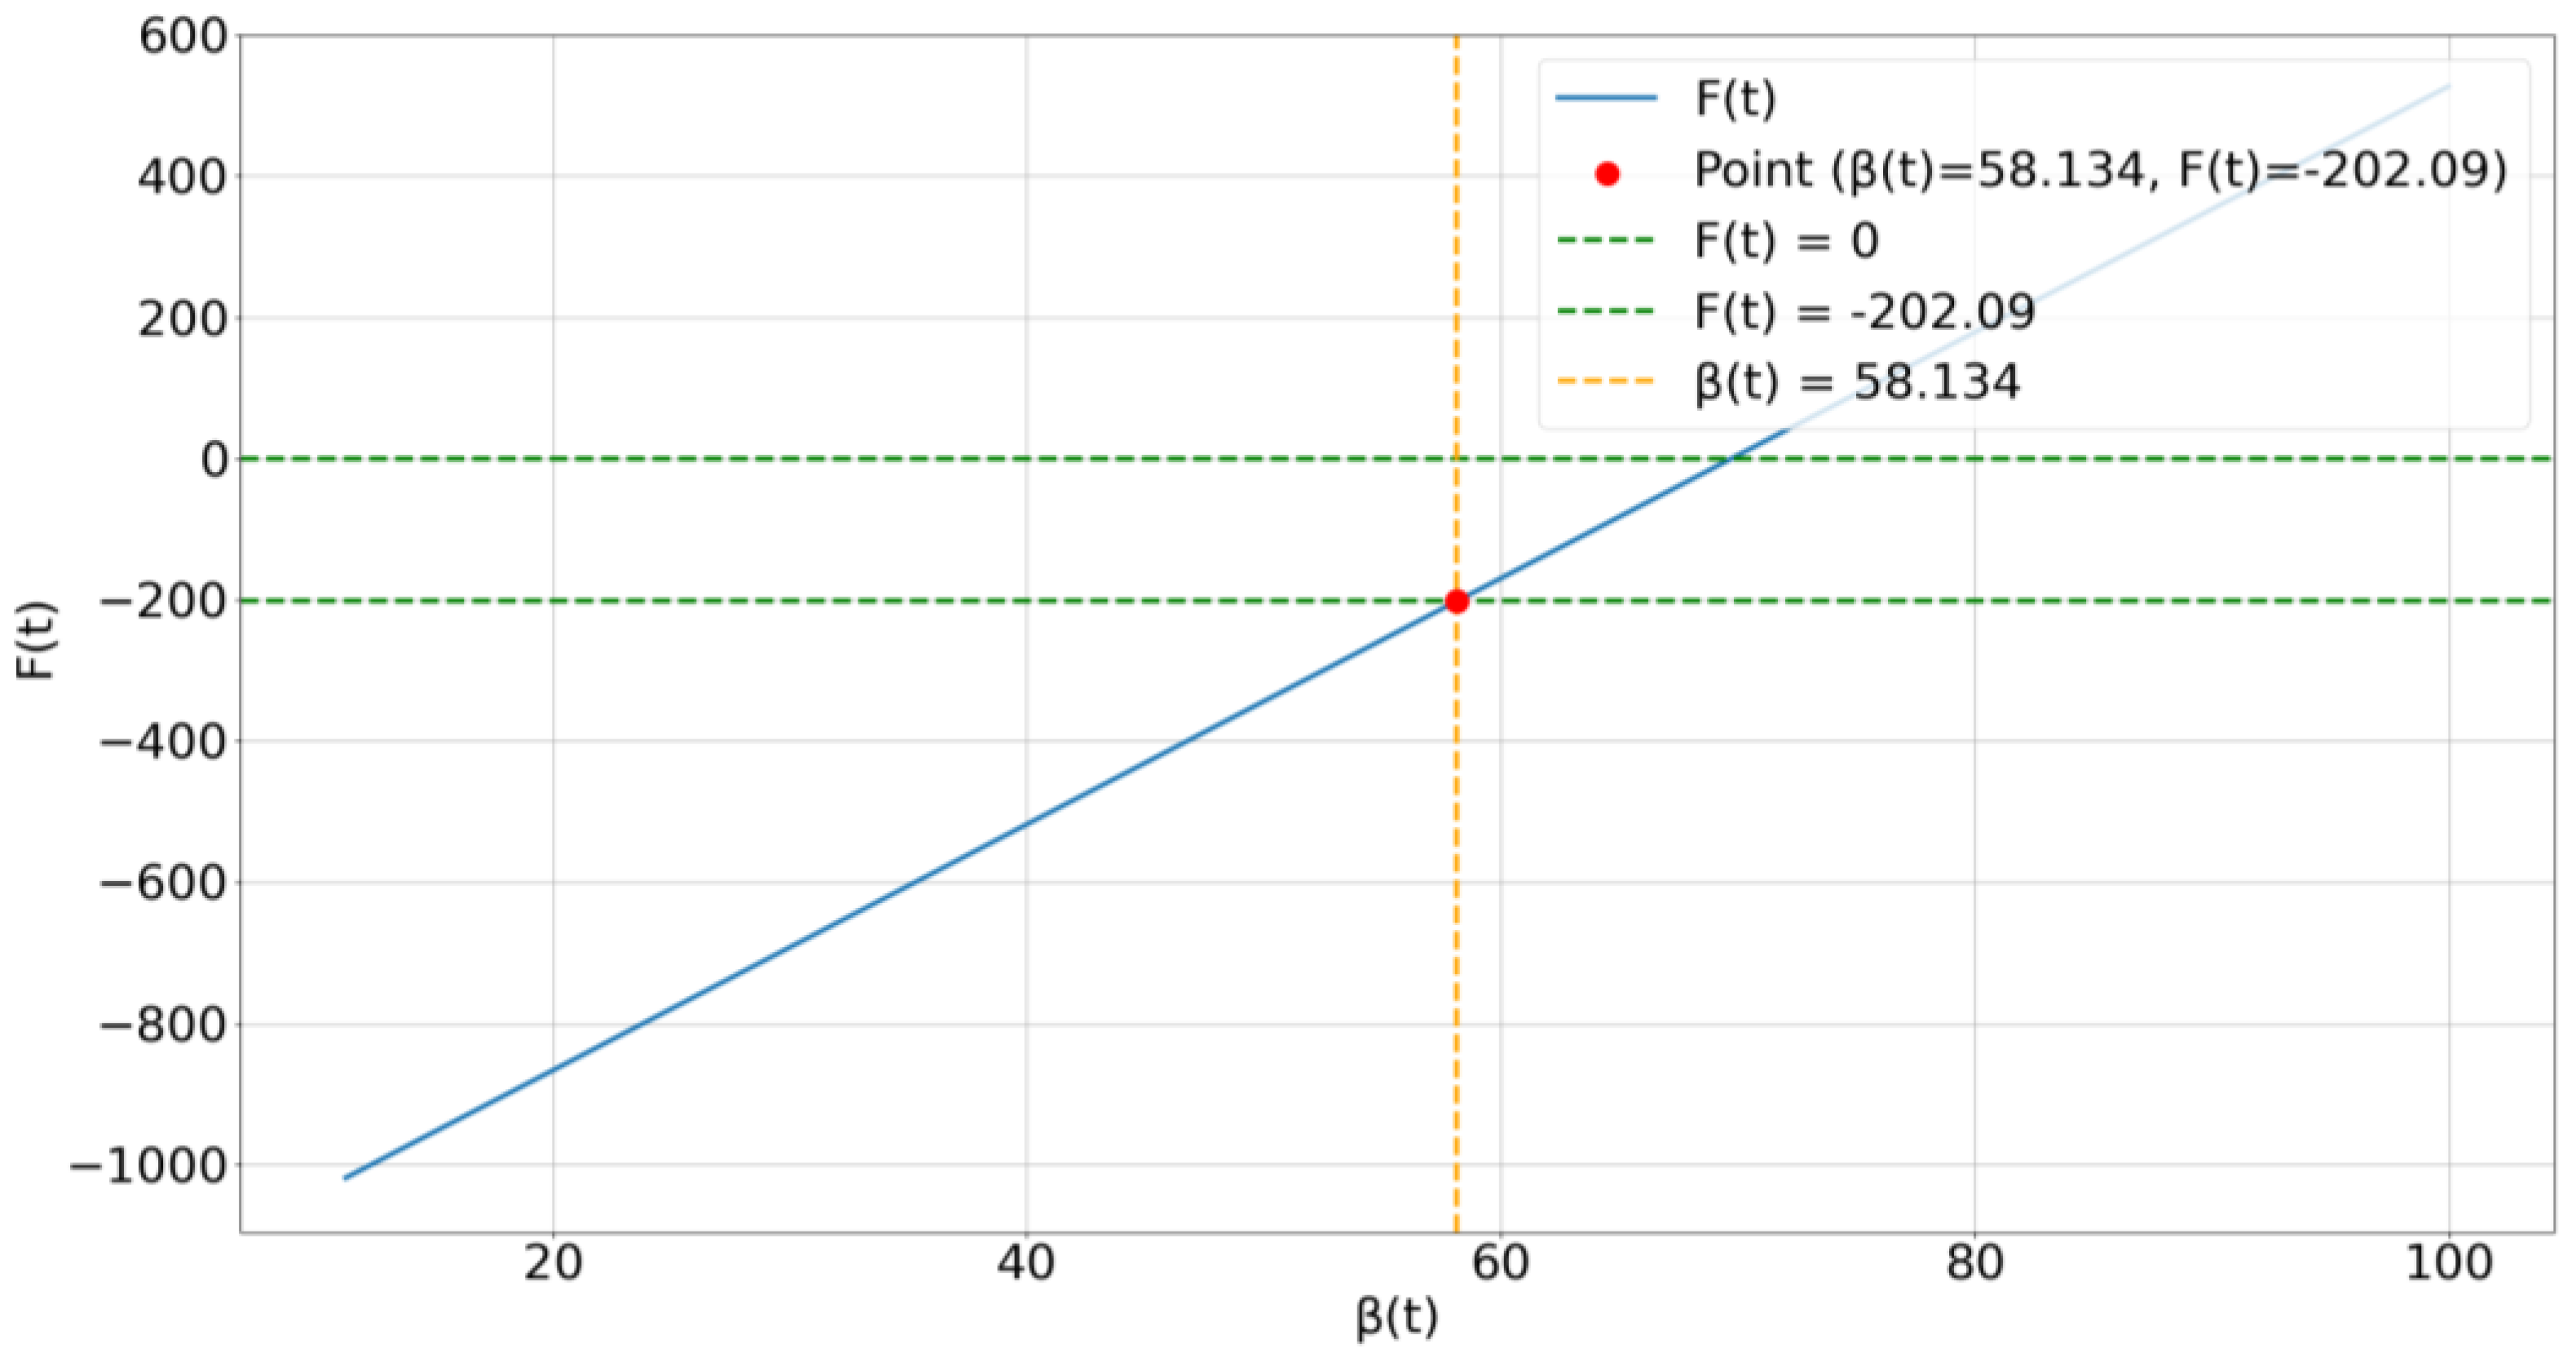
In Figure 7, the blue straight line represents the trend of the difference between the benefits and costs of the bridge ; the green straight lines are the constraint straight lines of and at time ; the yellow straight line represents the straight line at time , and the coordinates of the red intersection are (58.134, −202.09).
Figure 7.
The optimal solution for the F(t) − β(t) graph when F(t) = −202.09, β(t) = 58.134.
(2) At years, and million. Although indicates that the operational revenues and costs are balanced, when the bridge’s reliability the operational costs begin to exceed the revenue, signifying that the bridge is entering a loss-making phase. The maintenance costs will continue to rise. When the bridge remains profitable and has a high level of safety. As the reliability at is still relatively high and the bridge’s service time at years is comparatively short with good operational conditions, the goal is to maximize resource efficiency, minimize resource waste, and reduce operating costs. Therefore, continuing the bridge’s operation without a major repair is recommended, though regular maintenance and minor repairs are still necessary.
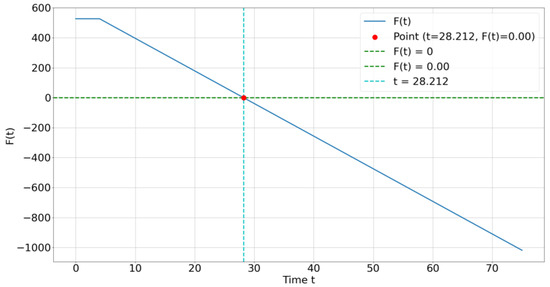
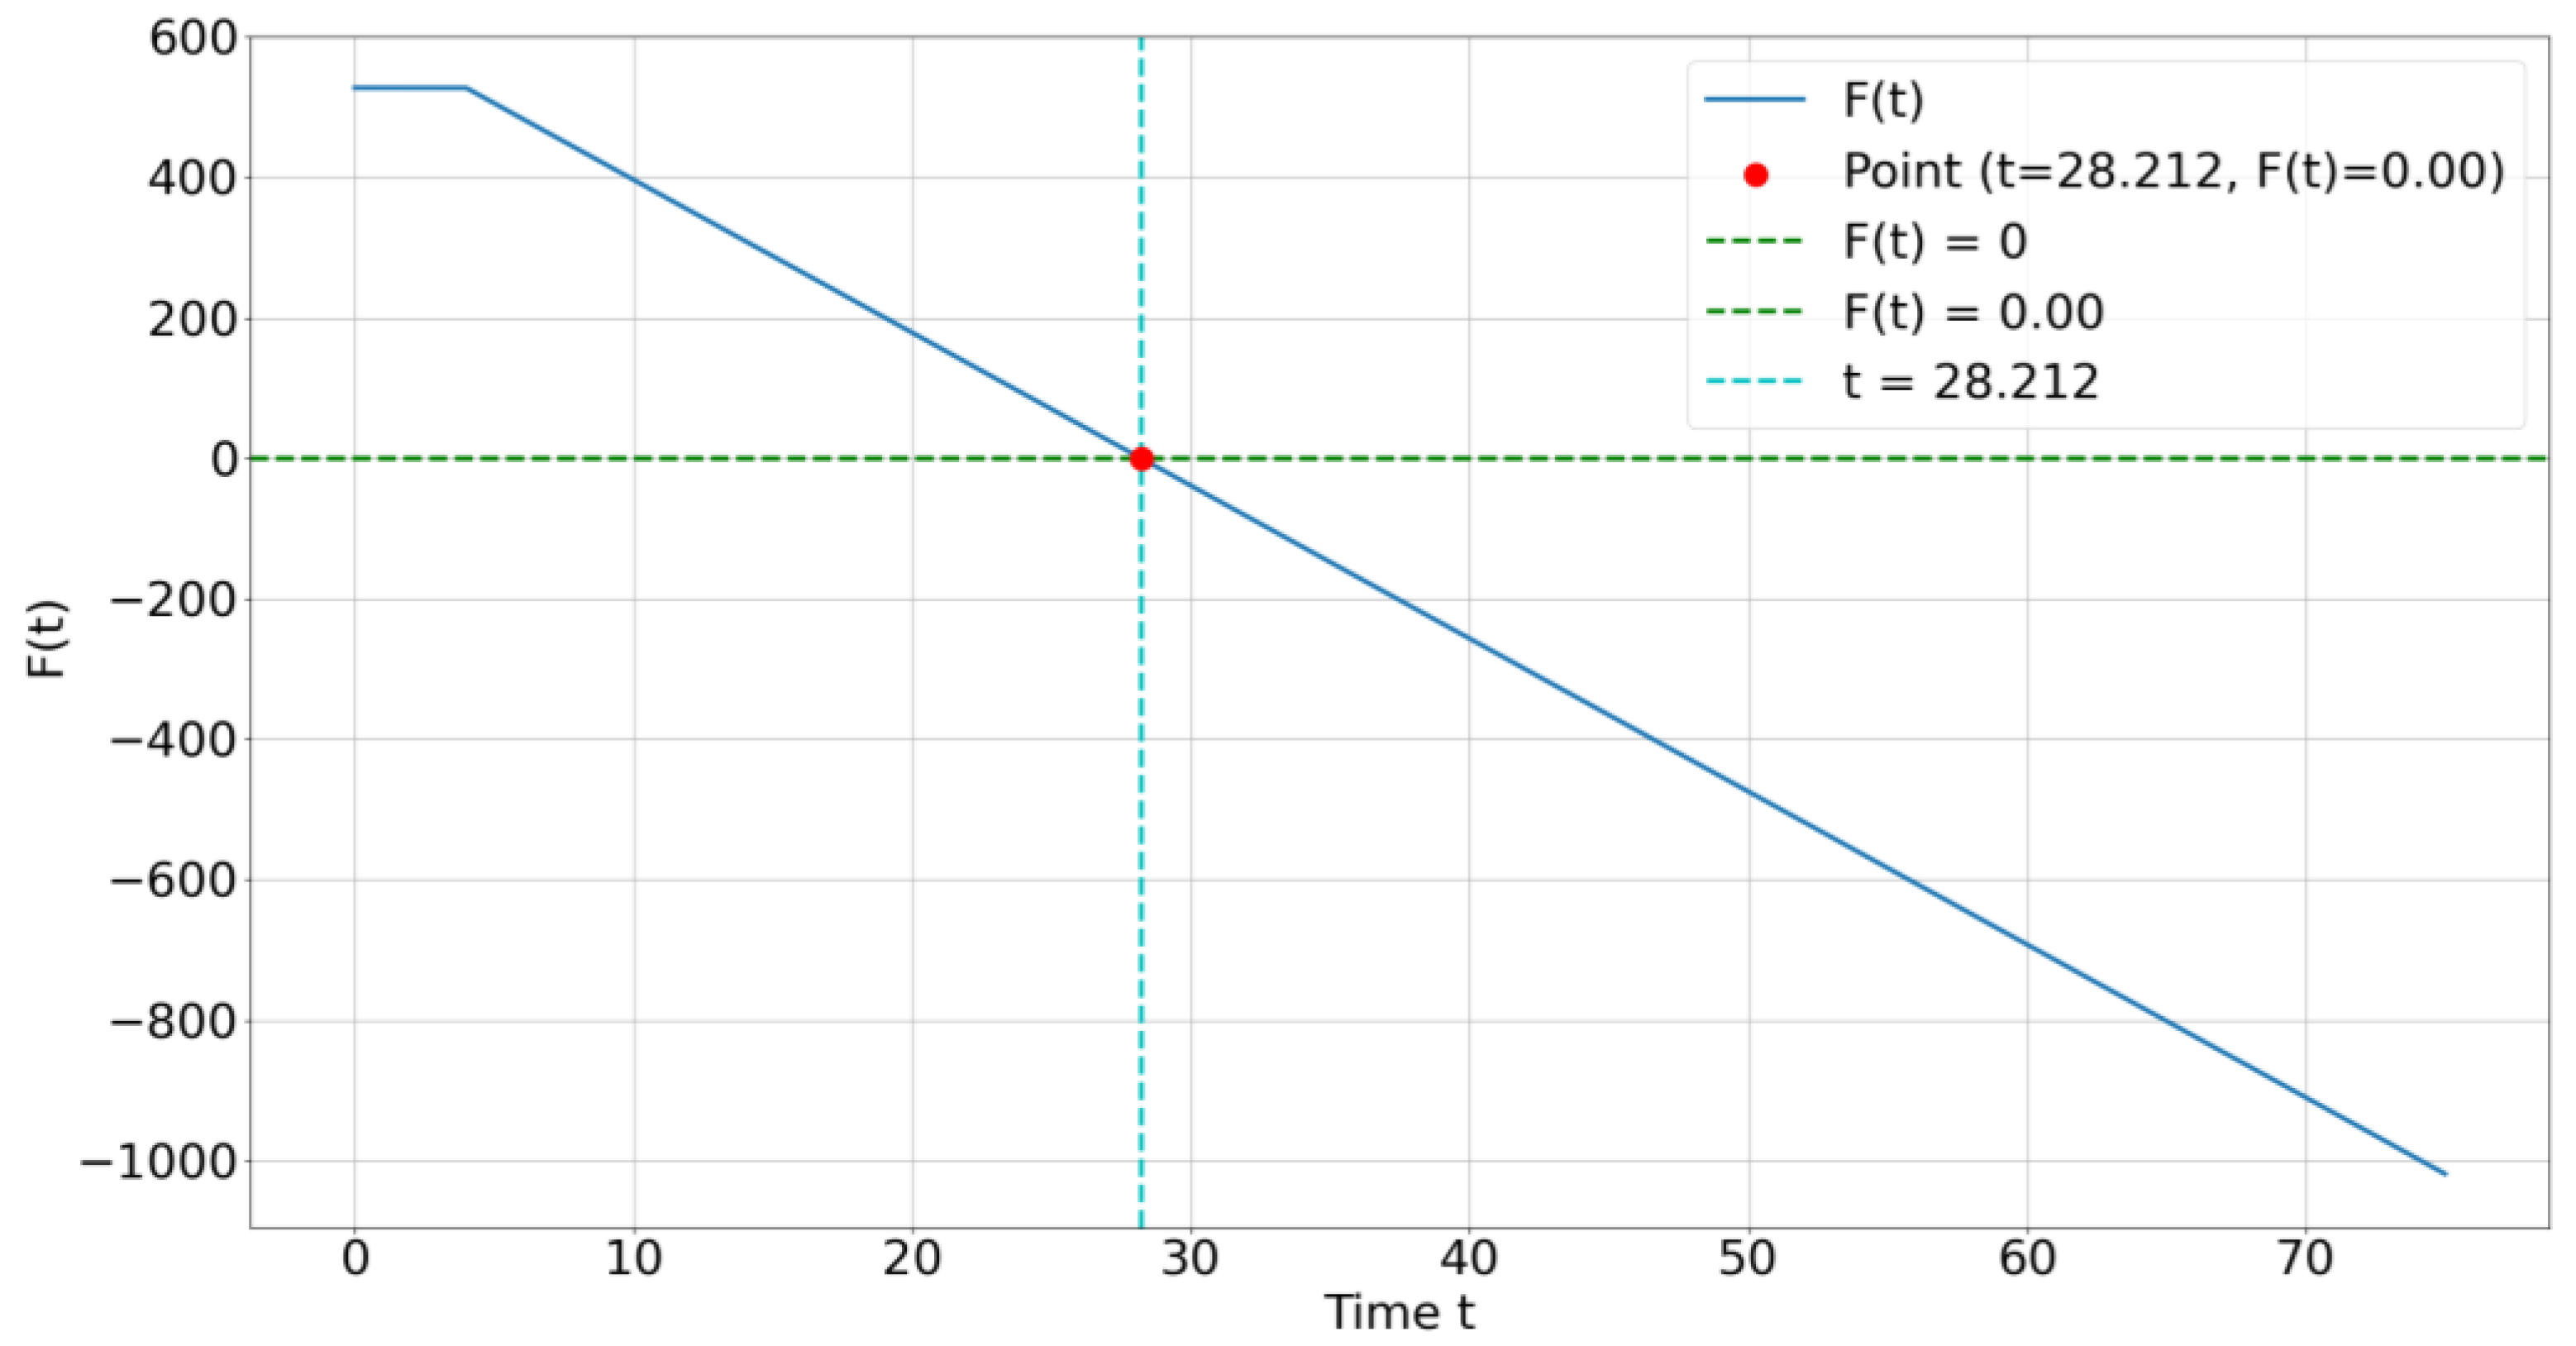
In Figure 8, the blue line represents the changing trend of , which is the difference between the benefits and costs of the bridge. The green straight lines are and and are the result of substituting time . The cyan straight line represents the straight line at time . The coordinates of the red intersection are (28.212, 0). This means that, when the bridge is in service for 28.212 years, the cost–benefit generated by the bridge operation is exactly equal.
Figure 8.
The optimal solution for the F(t) − t graph when F(t) = 0, t = 28.212.
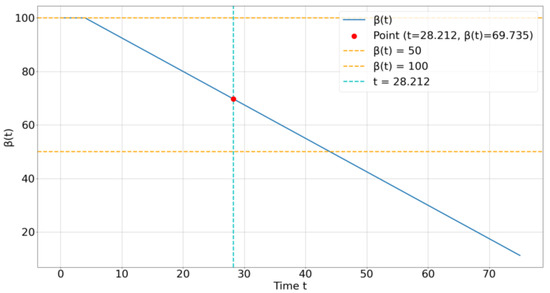
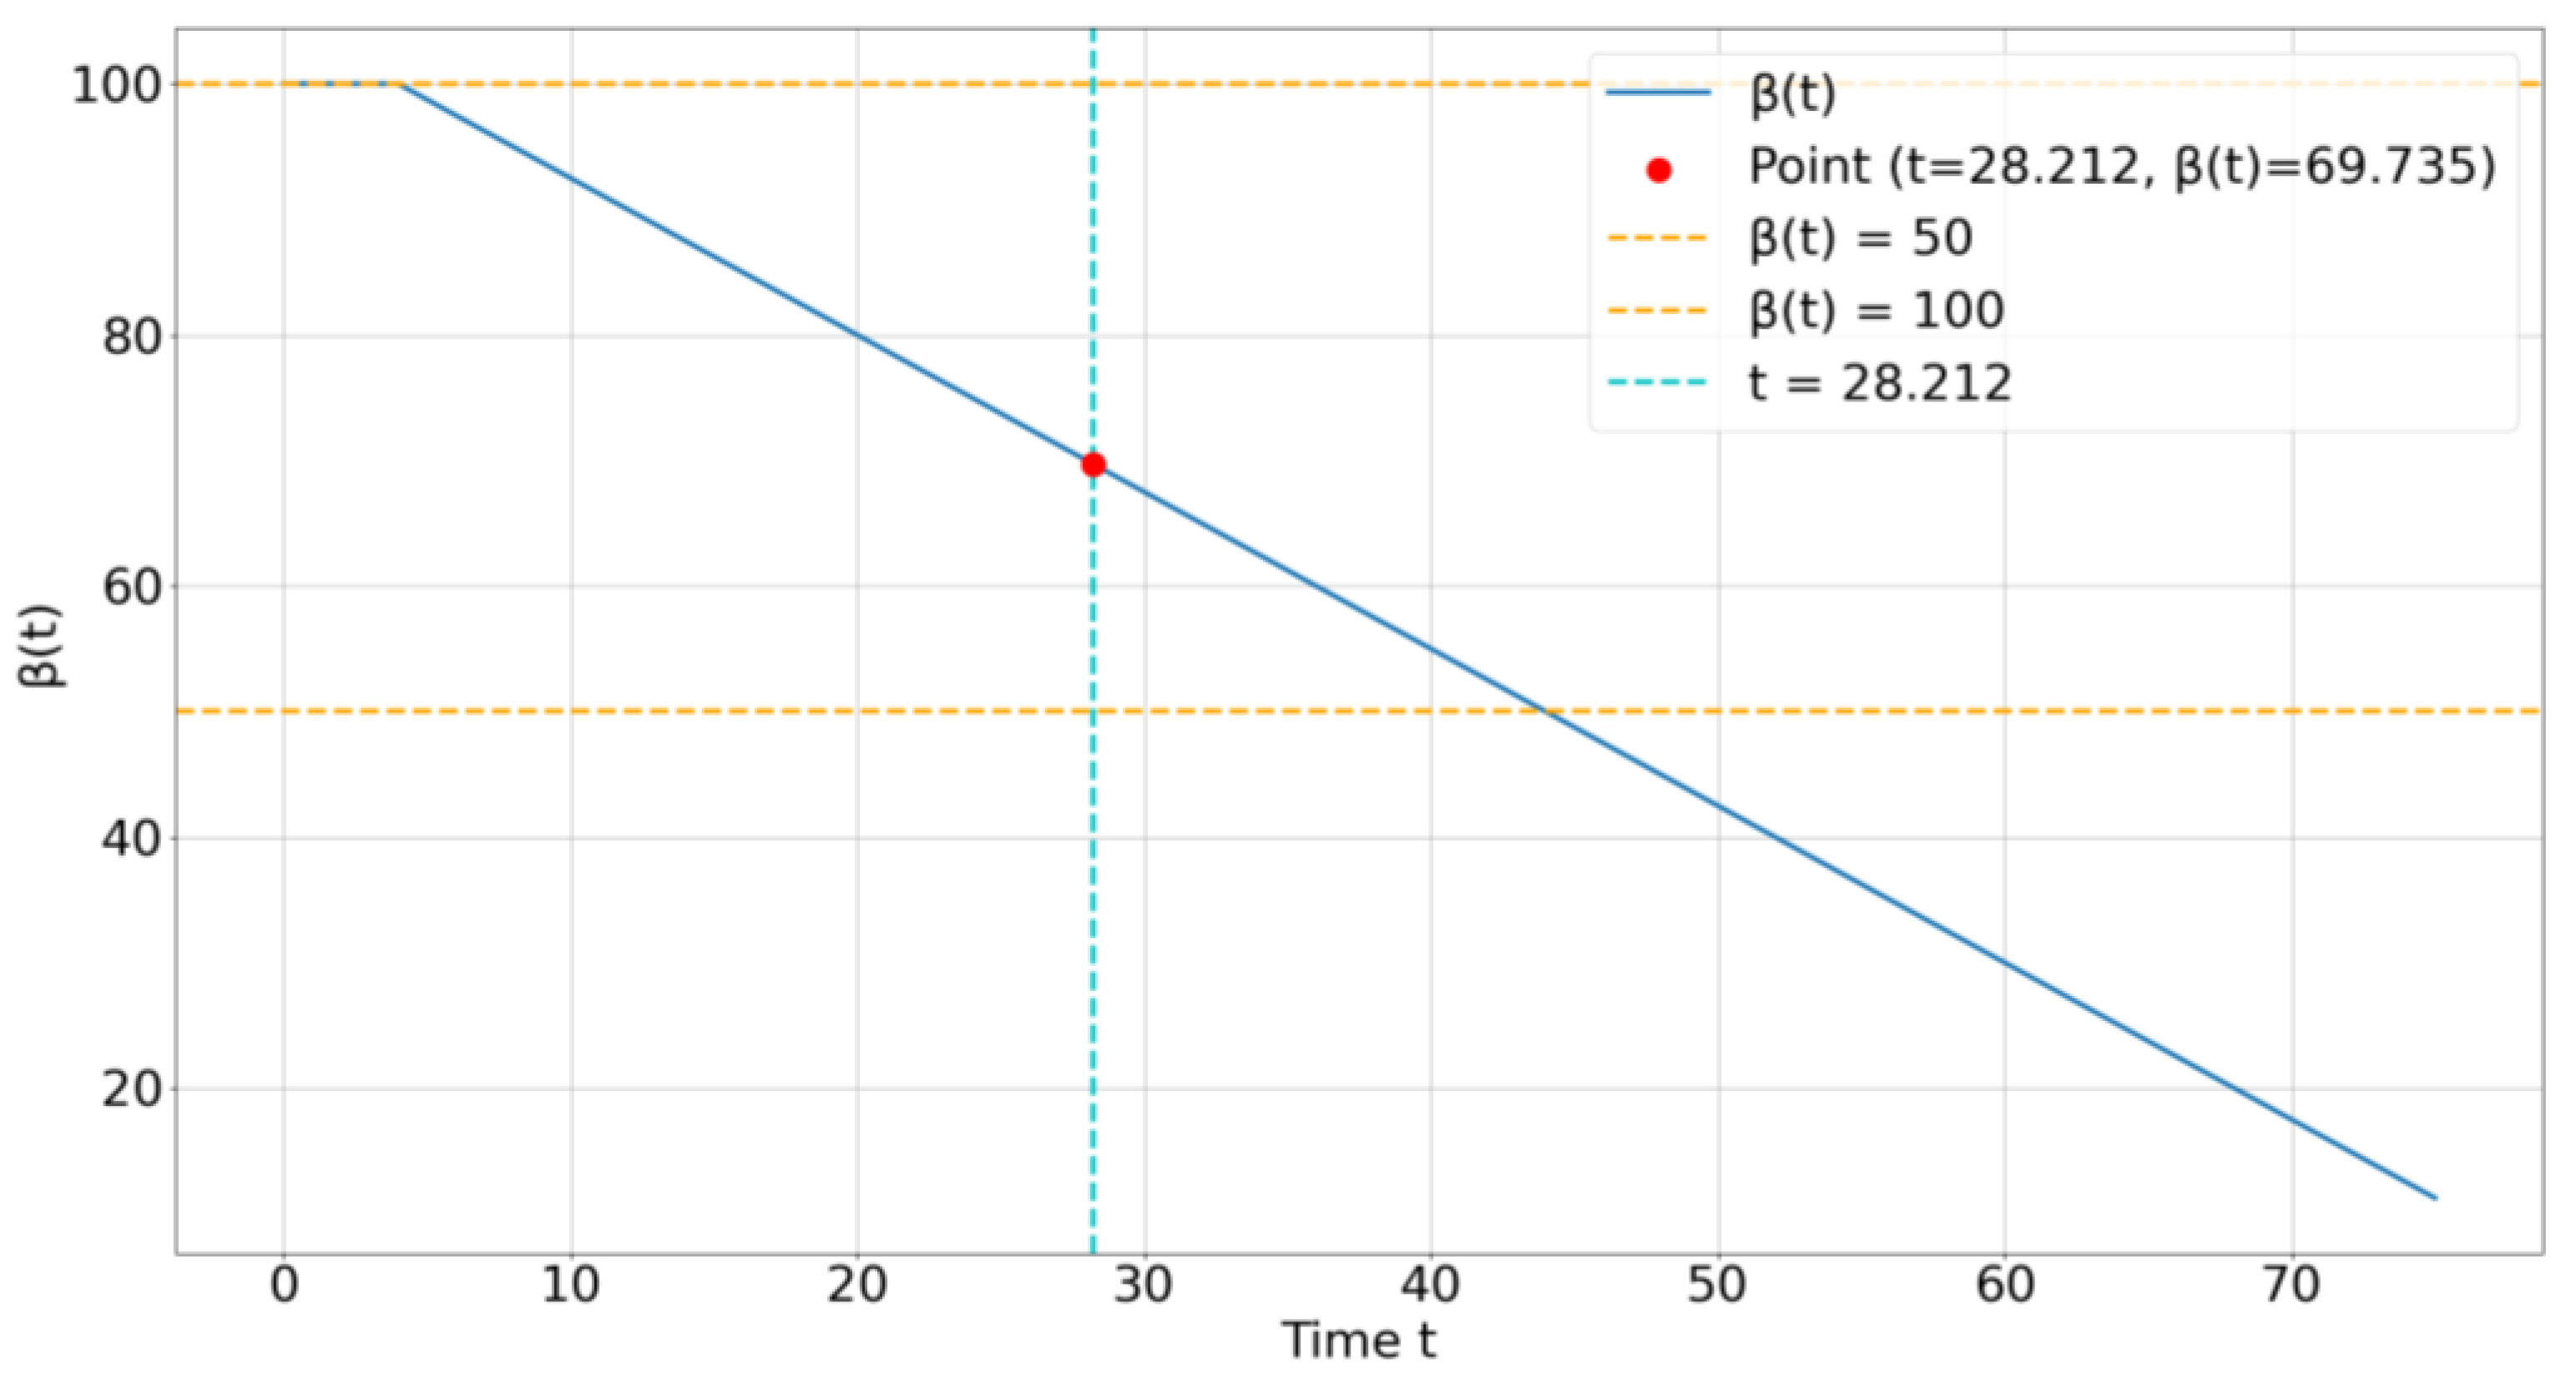
In Figure 9, the blue straight line represents time-varying reliability ; the yellow straight lines are the two constraint lines of and ; the cyan straight line represents the straight line at time , and the coordinates of the red intersection are (28.212, 69.735).
Figure 9.
Bridge limit state for the β(t) − t diagram when β(t) = 69.735, t = 28.212.
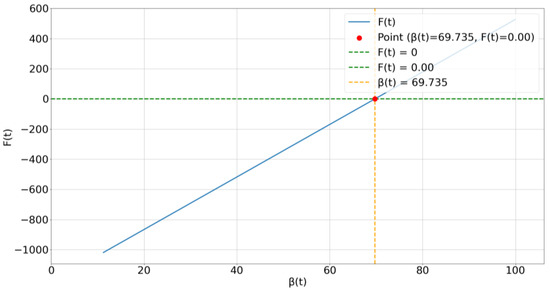
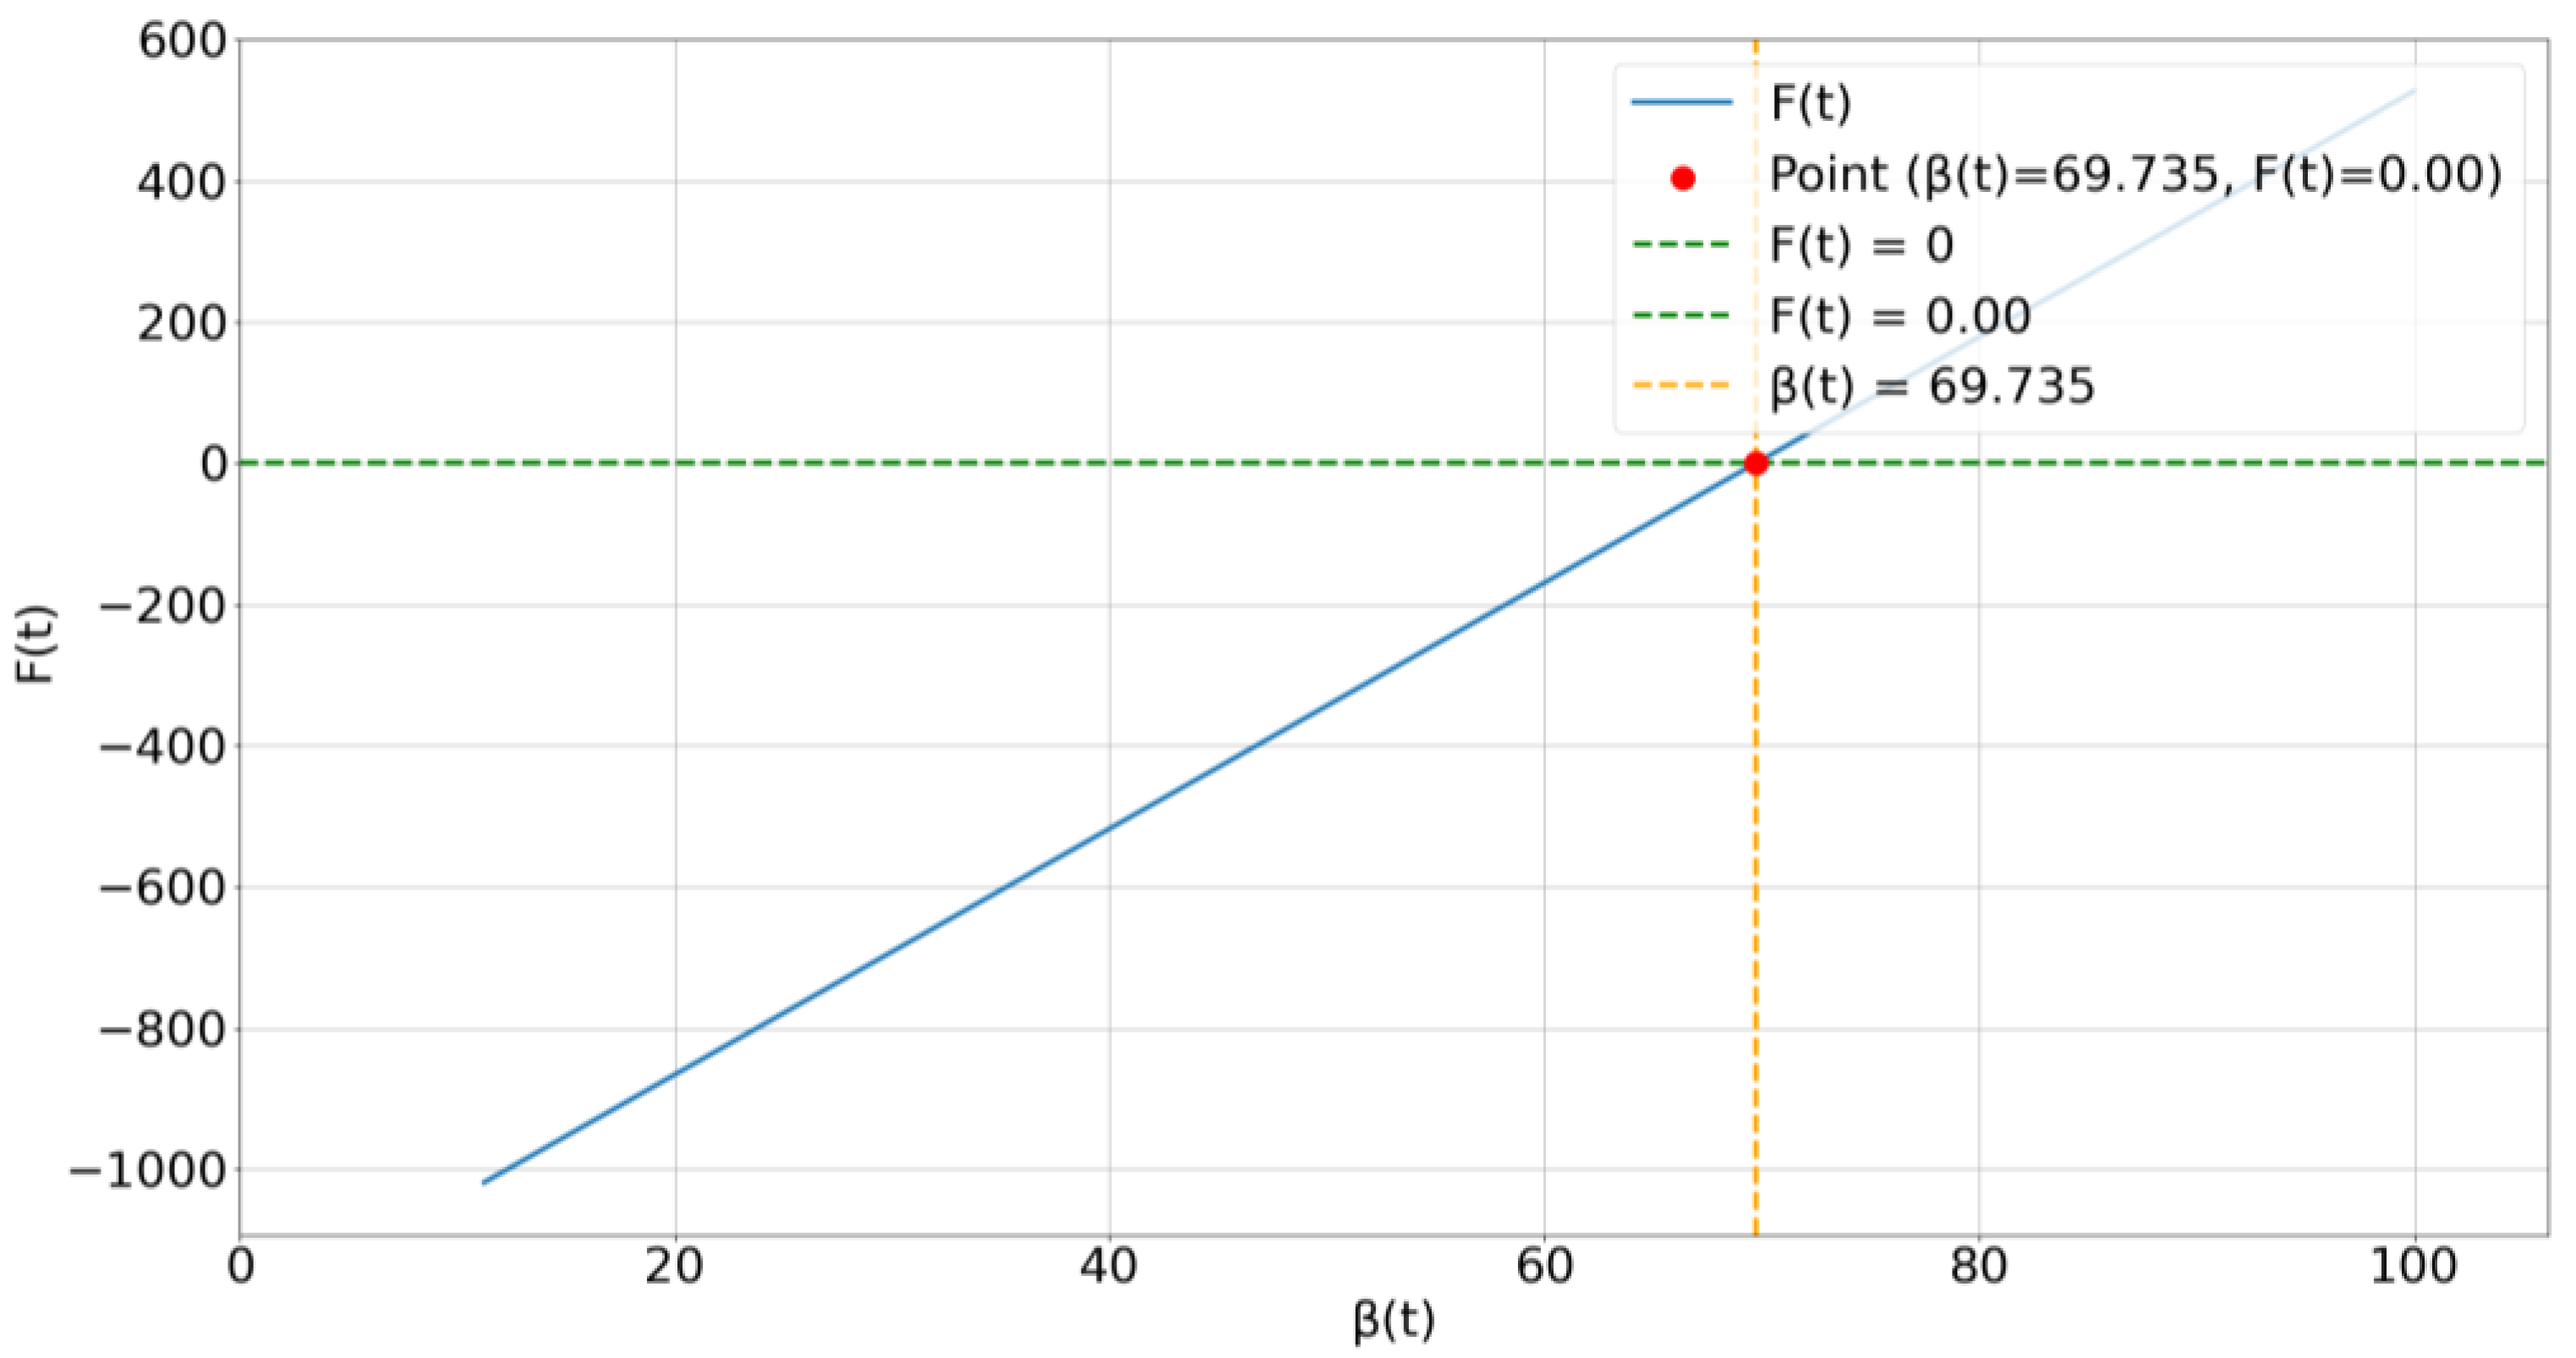
In Figure 10, the blue straight line represents the trend of the difference between the benefits and costs of the bridge ; the green straight lines are the constraint straight lines of and at time ; the yellow straight line represents the straight line at time , and the coordinates of the red intersection are (69.735, 0).
Figure 10.
The optimal solution for the F(t) − β(t) graph when F(t) = 0, β(t) = 69.735.
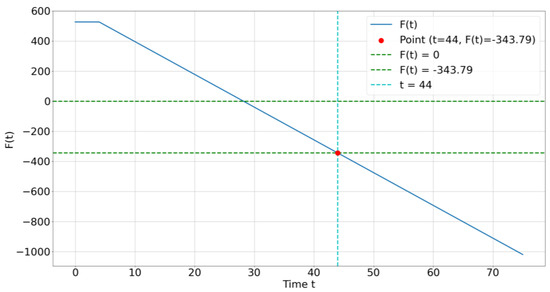
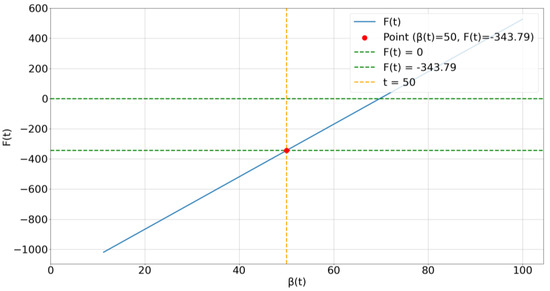
(3) At years, and million. At this point, the bridge’s reliability reaches its limit, and if no major repair is carried out, the bridge’s service life will have been fully exhausted, increasing the risk of a safety accident. If the bridge did not undergo any major repairs before this point, the implication is that the bridge operated at a loss for over 20 years. The cost of a single major repair is approximately CNY 29.16 million. As shown in Figure 4, at t = 44 years, the cumulative cost of daily maintenance far exceeds the cost of a major repair. When the bridge reaches this point, it is recommended to demolish the bridge to prevent safety accidents.
In Figure 11, the blue line represents the trend of the difference between the benefits and costs of the bridge when takes the limit value of 50. The green straight lines are the two constraint lines and , obtained by substituting time . The cyan line represents the line at time . The coordinates of the red intersection are (44, −343.79).
Figure 11.
Bridge limit state for the F(t) − t diagram when F(t) = −343.79, t = 44.
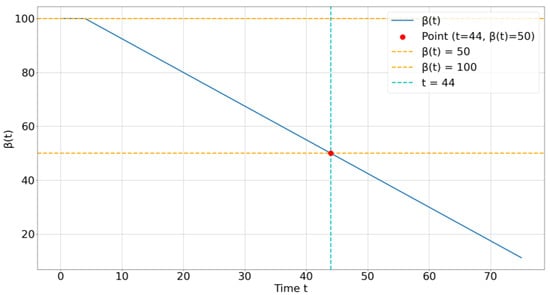
In Figure 12, the blue straight line represents time-varying reliability ; the yellow straight lines are the two constraint lines of and ; the cyan straight line represents the straight line at time , and the coordinates of the red intersection are (44, 50).
Figure 12.
Bridge limit state for the β(t) − t diagram when β(t) = 50, t = 44.
In Figure 13, the blue straight line represents the trend of the difference between the benefits and costs of the bridge ; the green straight lines are the constraint line of and the constraint line of when ; the yellow straight line represents the straight line at time β(t) = 50, and the coordinates of the red intersection are (50, −343.79).
Figure 13.
Bridge limit state for the F(t) − β(t) diagram when F(t) = −343.79, β(t) = 50.
6. Conclusions
The cost–benefit framework for the operation and maintenance period proposed in this study has significant feasibility and importance in solving the problems of the increasing demand for bridge operation and maintenance and in addressing the prominent cost–benefit contradictions in China. For verification, a bridge in China was used as an example, and the following conclusions were drawn:
- (1)
- Verification of framework feasibility: The study, which used a bridge as an example, verified the feasibility of the cost–benefit framework for the operation and maintenance period proposed in this study. The framework was used to construct the cost model and benefit model for the bridge operation and maintenance period from multiple perspectives, to set conditional constraints based on the goal orientation of decision makers, and to perform multi-objective optimization; thus, it provided a comprehensive reference as well as auxiliary suggestions for bridge operation and maintenance decisions.
- (2)
- Comprehensiveness of cost–benefit evaluation: The framework of this study considers multiple factors covering the installation, operation, and maintenance costs of the BSHM system, the maintenance and renovation costs during the operation and maintenance period, the demolition costs, and the operation benefits and recovery benefits, and it provides a comprehensive cost–benefit evaluation.
- (3)
- Rational use of resources and social and economic benefits: By calculating the bridge reliability and operating benefits in each service period during the operation of the bridge, the framework improves the safety of the bridge and extends its service life while achieving a rational use of resources and effective cost control; thus, it reduces resource use and capital investment, ensures the safety of the bridge structure, extends the service life, reduces interference with the public’s daily life and economic activities, and promotes the sustainable development of the society and economy.
Compared with the research of other scholars, this framework not only considers installation and operation costs, but also includes maintenance and renovation, demolition costs, operation benefits, and recycling benefits. By setting conditional constraints and multi-objective optimization, it provides decision makers with a more flexible and comprehensive decision-making reference. In addition, the bridge reliability and operating benefits can be calculated in each service period to achieve a rational use of resources and cost control.
There has been an emergence of new equipment, new technologies, and new concepts. For example, machine vision sensors may bring about cost changes and benefits; the new generation of artificial intelligence algorithms improves data processing and analysis capabilities and thus reflects value in the cost-effectiveness framework; lightweight monitoring has the potential to reduce system complexity, costs, and so on. In the face of the continuous emergence of new equipment, new technologies, and new concepts, the cost-effectiveness framework is not static and needs to be flexibly adjusted and optimized according to actual conditions. Further collection and analysis of actual data from more bridges are necessary to verify and improve the applicability and accuracy of the framework. At the same time, the impact of further factors (such as environmental impact, climate change, etc.) on bridge operation and maintenance needs to be explored, and collaborative optimization research should be conducted.
Author Contributions
Conceptualization, S.Z.; methodology, S.Z.; software, S.Z. and J.L.; validation, S.Z. and X.M.; formal analysis, S.Z.; investigation, S.Z., L.H., and J.L.; resources, X.M and Y.B.; data curation, X.M. and Y.B.; writing original draft preparation, S.Z.; writing review and editing, X.M., Y.B., and L.H.; visualization, S.Z.; supervision, X.M., Y.B., L.H., and J.L.; project administration, S.Z., L.H., and J.L.; funding acquisition, X.M. and Y.B. All authors have read and agreed to the published version of the manuscript.
Funding
The GeoSHM was funded by the European Space Agency (ESA) with contract numbers 4000116646/16/NL/US and 4000108996/13/NL/US. This research was funded by the National Natural Science Foundation of China, grant numbers 51829801 and 52378385.
Institutional Review Board Statement
Not applicable.
Informed Consent Statement
Not applicable.
Data Availability Statement
The data presented in this study are available on request from the corresponding author.
Conflicts of Interest
The authors declare no conflicts of interest.
References
- Meng, X.; Nguyen, D.T.; Owen, J.S.; Xie, Y.; Psimoulis, P.; Ye, G. Application of GeoSHM System in Monitoring Extreme Wind Events at the Forth Road Bridge. Remote Sens. 2019, 11, 2799. [Google Scholar] [CrossRef] [Scilit]
- Ministry of Transport of the People's Republic of China. Opinions of the Ministry of Transport on Further Improving the Safety and Durability Level of Highway Bridges [EB/OL]. 28 December 2020. Available online: https://xxgk.mot.gov.cn/2020/jigou/glj/202012/t20201228_3509089.html (accessed on 12 September 2023).
- Sun, L.M.; Shang, Z.; Xia, H. Research Status and Prospect of Bridge Structural Health Monitoring Under the Background of Big Data. China J. Highw. Transp. 2019, 11, 2799. [Google Scholar]
- Wang, L.B.; Wang, Q.L.; Zhu, L.; Zhao, Y. Research Status and Prospect of Bridge Health Monitoring Technology. China J. Highw. Transp. 2021, 34, 25–45. [Google Scholar]
- He, S.H.; Wang, A.; Zhu, G.; Zhao, Y. Research Progress of Intelligent Inspection Technology for Highway Bridges. China J. Highw. Transp. 2021, 34, 12–24. [Google Scholar]
- Ministry of Transport of the People's Republic of China. Statistical Bulletin on Development of Transportation Industry in 2023. China Water Transp. 2024, 8, 29–33. [Google Scholar]
- Frangopol, D.M.; Dong, Y.; Sabatino, S. Bridge life-cycle performance and cost: Analysis, prediction, optimisation and decision-making. Struct. Infrastruct. Eng. 2017, 13, 1239–1257. [Google Scholar] [CrossRef] [Scilit]
- Lin, T.; Jia, L.; Dong, Y.; Zhang, J.X. Comprehensive Performance Maintenance Decision Algorithm of Bridge Based on Multi-Attribute Utility. J. Appl. Basic Eng. Sci. 2023, 31, 1278–1296. [Google Scholar]
- Akeke, G.A.; Osok, M.S.; Nwoji, C.U. Sustainability assessment of building life cycle costing: A case study of Calabar International Conference Center. World J. Adv. Eng. Technol. Sci. 2021, 2, 101–109. [Google Scholar] [CrossRef] [Scilit]
- Kong, J.S.; Frangopol, D.M. Cost–reliability interaction in life-cycle cost optimization of deteriorating structures. J. Struct. Eng. 2004, 130, 1704–1712. [Google Scholar] [CrossRef] [Scilit]
- Kong, J.S.; Frangopol, D. Life-cycle reliability-based maintenance cost optimization of deteriorating structures with emphasis on bridges. J. Struct. Eng. 2003, 129, 818–828. [Google Scholar] [CrossRef] [Scilit]
- Liang, X.; Shi, J.; Li, Z. Decision method of bridge deck pavement maintenance based on the decision maker’s objective. Adv. Civ. Eng. 2021, 2021, 5593722. [Google Scholar] [CrossRef] [Scilit]
- Liu, J.; Huang, Z.; Wang, X. Economic and environmental assessment of carbon emissions from demolition waste based on LCA and LCC. Sustainability 2020, 12, 6683. [Google Scholar] [CrossRef] [Scilit]
- Wang, J.Y.; Wu, H.Y.; Duan, H.B.; Zillante, G.; Zuo, J.; Yuan, H.P. Combining life cycle assessment and Building Information Modelling to account for carbon emission of building demolition waste: A case study. J. Clean. Prod. 2018, 172, 3154–3166. [Google Scholar] [CrossRef] [Scilit]
- Wang, Y.H.; Jiang, J.N.; Xie, H.J.; Zhou, Z.Y.; Ma, J.X. Calculation and Analysis of Carbon Emission Flow During the Whole Life Cycle of Bridge Engineering. Sci. Technol. Eng. 2023, 23, 9605–9614. [Google Scholar]
- Björnsson, I.; Ivanov, O.L.; Honfi, D.; Leander, J. Decision support framework for bridge condition assessments. Struct. Saf. 2019, 81, 101874. [Google Scholar] [CrossRef] [Scilit]
- Barone, G.; Frangopol, D.M. Life-cycle maintenance of deteriorating structures by multi-objective optimization involving reliability, risk, availability, hazard and cost. Struct. Saf. 2014, 48, 40–50. [Google Scholar] [CrossRef] [Scilit]
- JT/ T1037-2022; Highway Bridge Structure Monitoring. Standards Press of China: Beijing, China, 2022.
- JTG 5120-2021; Maintenance Code for Highway Bridges and culverts. Standards Press of China, Ministry of Transport of the People's Republic of China: Beijing, China, 2021.
- CJJ99-2017; Technical Standard of Urban Bridge Maintenance. Standards Press of China, Ministry of Housing and Urban-Rural Development: Beijing, China, 2017.
- Biondini, F.; Bontempi, F.; Frangopol, D.M.; ASCE, F.; Malerba, P. Probabilistic service life assessment and maintenance planning of concrete structures. J. Struct. Eng. 2006, 132, 810–825. [Google Scholar] [CrossRef] [Scilit]
- Shao, X.D.; Liu, X.H.; Liu, D.Q.; Peng, J.X. Relationship Between Bridge Deterioration Model and Maintenance Strategy Based on Probability. J. Chongqing Jiaotong Univ. (Nat. Sci. Ed.) 2007, 107, 32–36. [Google Scholar]
- Nguyen, D.H.; Chapman, A.; Farabi-Asl, H. Nation-Wide Emission Trading Model for Economically Feasible Carbon Reduction in Japan. Appl. Energy 2019, 255, 113869. [Google Scholar] [CrossRef] [Scilit]
- Huang, Z.H.; He, Z.S.; Ji, L.; Wang, Y.J.; Wang, H.L.; Wang, J.F.; Yin, H.; Ding, Y. Evaluation of Carbon Dioxide and Pollutant Emission Status of Construction Machinery in China. Environ. Sci. Res. 2023, 36, 2108–2117. [Google Scholar]
- China Building Energy Efficiency Association, Chongqing University. 2023 Research Report on Carbon Emissions from Buildings and Urban Infrastructure in China. [R/OL]. 28 December 2023. Available online: https://mhuanbao.in-en.com/html/huanbao-2384668.shtml (accessed on 1 March 2024).

Disclaimer/Publisher’s Note: The statements, opinions and data contained in all publications are solely those of the individual author(s) and contributor(s) and not of MDPI and/or the editor(s). MDPI and/or the editor(s) disclaim responsibility for any injury to people or property resulting from any ideas, methods, instructions or products referred to in the content. |
© 2024 by the authors. Licensee MDPI, Basel, Switzerland. This article is an open access article distributed under the terms and conditions of the Creative Commons Attribution (CC BY) license (https://creativecommons.org/licenses/by/4.0/).