


Abstract
Supply chain network design and inventory management are both significant for improving the core competitiveness of enterprises. This study investigates the joint optimization problem of facility locations and inventory for assembly manufacturing enterprises’ multi-echelon supply chain networks, considering the locations of facilities, the selection of suppliers, transport mode choices, and inventory decisions simultaneously. A corresponding integrated optimization model is proposed, which aims to minimize the total cost, consisting of the fixed open cost of facilities, the inventory cost of the open plants and distribution centers, and the transportation cost of vehicles in the entire supply chain network as well as the cost of CO2 emissions. Based on the characteristics of the proposed optimization model, a hybrid genetic algorithm embedded with a local search is developed to solve the proposed model. Numerical examples and a case study are provided to illustrate the effectiveness of the proposed model and the corresponding algorithm. The findings show that the model is reasonable and applicable, and hybrid genetic algorithm (HGA) is more efficient than the standard genetic algorithm (SGA). In addition, plants’ maximum lead-time has a significant impact on the total cost of the supply chain.
1. Introduction
In the environment of fierce competition within today’s global market, it is significant for most enterprises to improve the corresponding key competitiveness with supply chain management (SCM). SCM aims to decrease the total costs and ensure a quick and effective response to customers by integrating suppliers, core manufacturing enterprises, and third-party logistics [1].The main context of a supply chain management includes the selection of suppliers, network design, production planning, and inventory control as well as transportation and distribution. SCM usually exists in three different flows, logistics, information flow, and capital, among suppliers, plants, distribution centers (DCs), and end customers.
In general, the decision-making problem on SCM is classified into the following three hierarchical levels, i.e., strategic (long term), tactical (medium term), and operational (short terms). The strategic level includes development strategy of supply chain, network design, sales, sourcing channel planning, etc., which covers many years and needs some related approximate and aggregated data. The tactical level, such as the annual operation plan and master production planning, falls between those two extremes with respect to the time horizon and the amount and accuracy of data required. The operational one deals with some short-term decisions, generally within a day and needs transactional data [2]. Tactical or operational decisions are related to inventory control, supplier selection, quantity allocation, the choice of transport mode, vehicle routing and service relationships [3,4].
To deal with the above green supply chain network design with inventory management, it needs optimization theories and methods about supply chain management. The joint optimization problem on location-allocation decisions and inventory control has become a hot research topic, which aims to minimize the total costs of facilities locations, transportation, and inventory. Ventura et al. [5] investigated the supply chain management inventory, which considers the multi-period inventory management with lot-sizing for a single commodity as well as supplier selection and evaluation. Huang et al. [6] found that it is necessary to coordinate and integrate some activities in the supply chain and that selecting and evaluating suppliers effectively is a vital process to build competitive supply chains. Fazayeli et al. [7] investigated the joint optimization problem on location and routing problem by a two-stage method, which considers the selection of transportation mode. Miranda and Garrido [8] proposed a location-inventory model with two novel capacity constraints, of which the first is the warehouse capacity constraint and the second is the inventory capacity constraints with stochastic bound. As we know, freight transportation is a primary contributor to climate change and global warming due to various pollution emissions [9,10,11].
The traditional supply chain network design mainly focuses on total costs or revenue while the green supply chain network design problem considers the corresponding costs and service efficiency and externalities simultaneously, so as to achieve a sustainable balance between economic, environmental, and social objectives [12,13]. There are a number of studies on green supply chain network design in the literature [14,15]. Li et al. [16] studied an integrated optimization model for the green location-inventory problem for a three-level distribution network, which aims to minimize the total costs and which mainly includes the following components, such as the fixed costs of facilities, hold cost of inventory management, costs of long-haul transportation and distribution, and external cost of CO2 emissions. Wang et al. [17] explored the green supply chain network design problem and presented a multi-objective optimization model, in which the environmental investment decisions is considered. Mohebalizadehgashti et al. [18] investigated the a green meat supply chain network design problem by a multi-objective approach, which is solved by augmented epsilon-constraint method. Ma et al. [19] applied the game theory to address the sustainable supply chain management with the technology investments and government intervention. Some corresponding management insights on green technology investments for the manufacturer and retailer are obtained.
As mentioned before, supplier selection, location-inventory-allocation, and transportation mode selection are important problems in the strategic decision-making level. To the best of our knowledge, the existing studies integrating supplier selection, facilities location, inventory management, and transport modes selection are still scarce, considering the external cost of CO2 emissions. To fill this gap, this study investigates the four-echelon green supply chain network design with inventory management by an integrated optimization method, which aims to minimal the total cost of entire supply chain.
Our contributions are summarized as follows. First, an integrated optimization model on a green supply chain network design with inventory management and multiple the selections of suppliers and transport modes is established, which considers the production costs and transport costs simultaneously. Second, an improved hybrid genetic algorithm (HGA) embedded with local search is proposed and examined by some corresponding instances. Finally, some management insights are revealed based on the analysis of simulations results.
The structure of this paper is organized as follows: Section 2 is a literature review, Section 3 describes an integrated optimization model on green supply chain network design and inventory management, and Section 4 gives a hybrid genetic algorithm embedded with local search. Section 5 presents numerical examples and conduct some analyses. The proposed model is applied in a real-world supply chain network design of an electronic equipment assembly company in China in Section 6. A summary of this paper and future research directions is presented in Section 7.
2. Literature Review
There exists a considerable number of studies related to the integrated optimization problem of a supply chain network design with inventory management. The existing research can be classified into three categories according to the corresponding objectives and methodologies: (1) location-inventory problem, (2) location-routing and inventory problem, and (3) green supply chain network design.
The location-inventory problem (LIP) is an extension of the classical facility location problem (FLP), which simultaneously determines the optimal decisions on location, allocation, and inventory. LIP has been widely investigated in recent years. Abdul-Jalbar et al. [20] addressed a multi-echelon inventory distribution problem, which do not allow the (Q,R) inventory policy and the shortages. Ozsen et al. [21] investigated a joint LIP with risk sharing and warehouse capacity constraints. Tsao et al. [22] presented a novel optimization model of the location and inventory problem, which determines the optimal location of the regional distribution centers (RDCs) and rational inventory policies at the RDCs. Bhatnagar et al. [23] addressed the joint optimization problem on transshipment and production schemes for a multi-location production/inventory system. They formulated the corresponding optimization model, and two heuristic algorithms were designed. Fathi et al. [24] investigated the location–inventory problem for supply chain configuration, which considers the stochastic customer demand as well as replenishment lead-time.
As we known, there usually exists a trade-off between transportation cost and inventory one. The integrated optimization problem on location, routing, and inventory has attracted many scholars focuses. A joint optimization model of location–inventory–routing problem (LIRP) deals with to location planning, inventory management, and vehicle routing problems by an integrated approach [25]. Most of existing studies the related LIRP on manufacturing enterprises focus on minimizing the total cost with consideration of the service level and capacity constraints [25,26,27]. Sadjadi et al. [28] explored a three-level LIRP, which considers the demand and lead-time are both uncertain, following Poisson and exponential distributions, respectively. They applied a queuing approach to solve the above proposed model. Chen et al. [29] studied the integration optimization model of location-routing-inventory problem in food distribution network by two-stage method. An improved hybrid heuristic is proposed, which embedded with genetic algorithm and distance-based clustering approach. Saragih et al. [30] explored the location-inventory-routing problem with inventory decisions within a three-echelon supply chain system and designed a heuristic method to solve the above problem. In the supply chain management, there often exits multiple optimization objectives, such as total costs (or total revenue), customer service level, and environmental external cost. Abbasi et al. [31] addressed the location and routing problem with the considerations of the consolidation hubs disruption risks and product perishability. Ghasemkhani et al. [27] addressed the production-inventory-routing problem on multi-perishable products with uncertain demand, which is solved by a meta-heuristic algorithm, which embedded with imperialist competitive algorithm and self-adaptive differential evolution method. Chavez et al. [32] investigated the location-inventory-routing model of agricultural waste-based biofuel supply chain with stochastic demand with a multi-objective optimization method; a two-phase heuristic method is given.
With increasing environmental awareness, the network design problem of green supply chain includes not only economic indexes, but also social environment ones [33,34]. Recently, the green supply chain network design with an inventory and routing problem has attracted the attention of some researchers.
Golpira et al. [35] investigated a robust bi-level optimization for a green supply chain network design problem against uncertainty and environmental. Miranda-Ackerman et al. [36] investigated a green supply network design framework on the processed food industry by heuristic method with clustering. Zhang et al. [37] addressed the green supply chain network for a manufacturing enterprise, which considers the economies of scale about logistics facilities and the external cost of CO2 emissions. They found that the optimal location of regional distribution centers (RDCs) is affected by the customers’ demand and the level of economies of scale on logistics facilities. Moreover, some researchers introduce green technology and government subsidies to promote the development of sustainable supply chain management [38,39]. Zhang et al. [40] considered a green supply chain with one manufacturer and two competing, which aimed to obtain the manufacturer’s optimal green technology investment. Ma et al. [19] addressed the sustainable supply chain management considering technology investments and government intervention and proposed the corresponding dynamic game model. They found that a higher emission reduction subsidy encourages green technology investments and increases supply chain members’ profits. For a comprehensive review of green supply chain network design problem, interested readers can refer to the references [41,42,43,44].
However, our proposed problem differs from the existing studies in the following aspects. First, our proposed model of a green supply chain network design deals with the integrated optimization problem on the locations of facilities, selection of suppliers, transport mode choices, and inventory management. Secondly, we design an improved hybrid GA (HGA) embedded with a local search to solve the proposed problem. Finally, the proposed model and algorithm are suitable for a green supply chain network design of assembly manufacturing enterprises, such as electronics, construction machinery, and automobiles.
3. Problem Description and Model Formulation
3.1. Problem Description
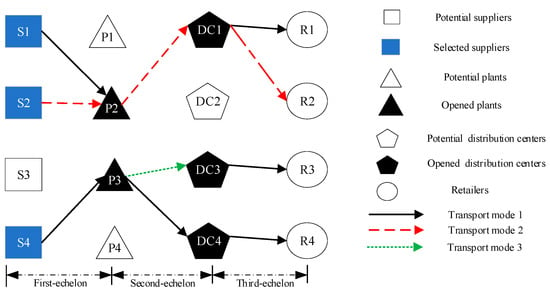
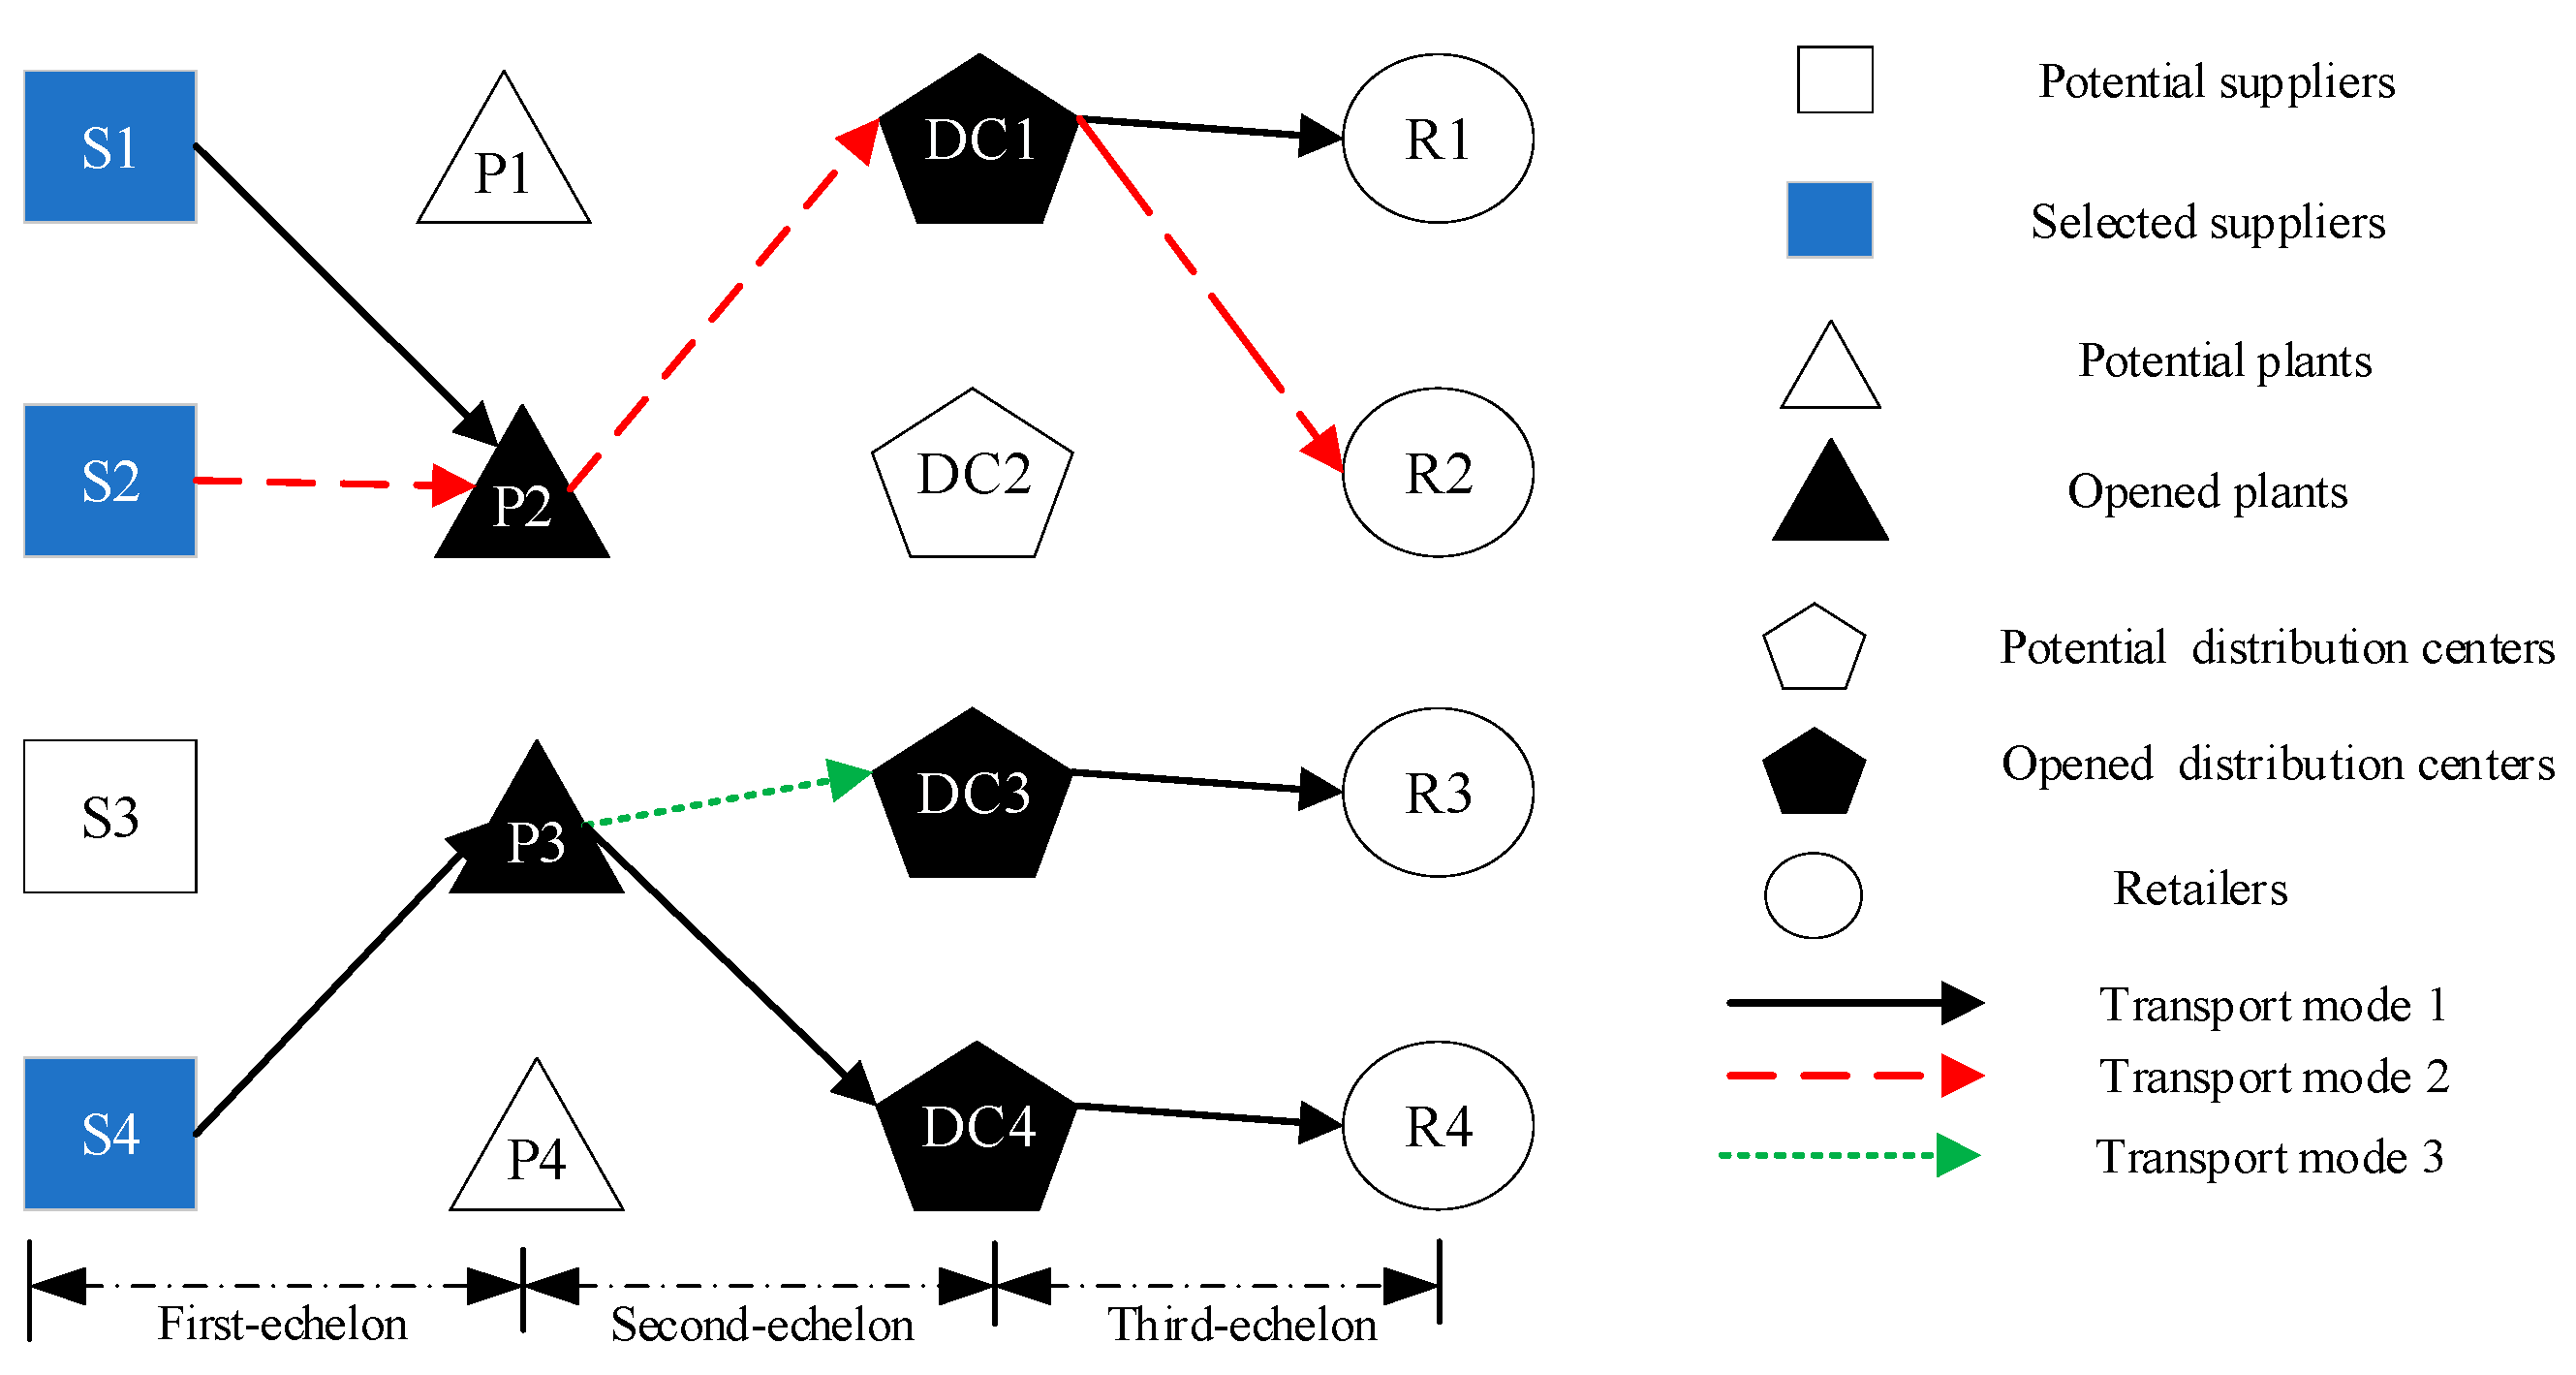
The above proposed problem can be illustrated as a three-echelon supply chain network consisting of suppliers, plants, DCs, and retailers, as shown in Figure 1. In the first-echelon, the selected suppliers provide the raw material to the plants, and the plants fulfill the orders of DCs in the second echelon while the DCs in turn fulfill the demands of retailers in the third echelon. This study investigates the integrated optimization problem of a three-echelon supply chain network design with inventory control and supplier selection and environment concerns, which determines the optimal combined scheme on the locations and inventory decisions for plants and DCs, supplier selection, and transport mode choice simultaneously. The objective of the proposed model aims to minimize the total cost, which consists of the fixed open cost of facilities, the inventory cost of the opened plants and DCs, the transportation cost, and CO2 emission costs among the entire supply chain network.
Figure 1.
Distribution in the three-echelon supply chain.
In this study, the following key questions about the above green supply chain network with the inventory control and selection of suppliers should be solved:
- (1)
- How to determine the appropriate suppliers among the candidates;
- (2)
- How to determine the optimal number, location of plants, and DCs;
- (3)
- How to develop a reasonable allocation scheme among the suppliers, plants, DCs, and retailers;
- (4)
- How to choose optimal combined transport modes among the entire supply chain network.
3.2. Assumptions
To facilitate the presentation of essential ideas without loss of generality, the following basic assumptions are made:
- A1
- The demand of each retailer is independent and follows a normal distribution with a known mean and variance;
- A2
- There are a set of candidate plants and DCs with specific capacities;
- A3
- There exists several different transport modes with limited capacities among networks, which are pre-defined;
- A4
- A continuous review inventory method based on (Q,r) inventory policy is adopted in plants and DCs, and economic order quantity (EOQ) purchase strategy is adopted;
- A5
- A retailer can be served by only one DC, which is also served only by a plant, but a plant can be served by several suppliers;
- A6
- The shipment incurred between two adjacent nodes are served by only one transport mode, which means that the demands cannot be divided;
- A7
- The lead-time of suppliers is not permitted to exceed the required maximum lead-time of the plant.
3.3. Notations
Sets:
- I: Set of suppliers
- J: Set of candidate plants
- K: Set of candidate DCs
- L: Set of retailers
- M: Set of transportation modes
Decision variables:
- : Binary variable that takes the value of 1 if plant j is opened, and 0 otherwise
- : Binary variable that takes the value of 1 if DC k is opened, and 0 otherwise
- : Binary variable that takes the value of 1 if supplier i is assigned to plant j by transportation mode m, and 0 otherwise
- : Binary variable that takes the value of 1 if plant j is assigned to DC k by transportation mode m, and 0 otherwise
- : Binary variable that takes the value of 1 if DC k is assigned to retailer l by transportation mode m, and 0 otherwise
- : Order quantity from supplier i to plant j
Auxiliary variables:
- : Average demand for plant j
- : Variance demand for plant j
- : Average demand for DC k
- : Variance demand for DC k
Retailer parameters:
- : Average demand for retailer l
- : Variance demand for retailer l
Plant parameters:
- : Fixed cost of opening plant j
- : Ordering cost from supplier i to plant j
- : Inventory holding cost per unit at plant j
- α: Inventory service level
- Value of the accumulated standard normal distribution with a probability related to the service level
- Lead-time from supplier i to plant j by transportation mode m
- : Maximum lead-time of plant j
- : Purchase cost per unit from supplier i
- : Production cost at plant j
- : Production capacity of supplier i
- : Capacity at plant j
DC parameters:
- : Fixed cost of opening DC k
- : Ordering cost from plant j to DC k
- : Inventory holding cost per unit at DC k
- : Capacity at DC k
- : Lead-time from plant j to DC k by transportation mode m
Transportation parameters:
- : Transport cost from supplier i to plant j by transportation mode m
- : Transport cost from plant j to DC k by transportation mode m
- : Transport cost from DC k to customer l by transportation mode m
Other parameters:
- : Unit CO2 emission of transportation between the arc by mode m (kg/t-km)
- : Unit CO2 emission from handing per unit product in pant,
- : Unit CO2 emission from handing per unit product in DC,
- : Emission taxes per unit CO2 emission ($/kg)
3.4. Model Formation
The total cost incurred in the first echelon is denoted as TC1.
where TC1 states the total costs incurred at the first echelon, namely from suppliers to plants, which consists of two parts. The first part is the fixed cost of opening plants while the second part is the total operational cost. The operational cost includes three items, i.e., the ordering cost and holding cost, safety inventory cost, and production cost. Moreover, the first term represents the fixed order and holding inventory costs since each plant uses an EOQ policy, and the second one represents the safety inventory costs for all opening plants [1,8,45].
Similarly, we can obtain the total costs of the second echelon between plants and DCs, denoted TC2.
The first item is the fixed cost of opening DCs. The second item of Equation (2) is the order and holding inventory costs in DCs while the third one is the sum of safe inventory costs incurred in DCs.
Moreover, the total cost of transportation is calculated by Equation (3).
Equation (4) represents the CO2 emission charge cost incurred among the entire supply chain network, including transportation and handling activities in plants and DCs.
subject to:
where Equation (6) states that each customer is served by only one DC. Equation (7) assures us that each DC is served by exactly one plant. Equation (8) and Equation (10) compute the corresponding served average demand by DC k and plant j, respectively. Equation (9) and Equation (11) calculates the total standard deviation of served demand by DC k and plant j, respectively. The purchase amount from each supplier is equal to the quantity demanded by the plant, which is shown as Equation (12).
Equation (13) implies that the supplier’s supply capacity cannot exceed its production capacity. Equaretion (14) ensures that the production capacity of plants is not exceeded (only if the plant is open). Equation (15) and Equation (16) imply that the inventory capacity of the plants and DCs cannot exceed their capacities, respectively.
Equations (17)–(19) state that the shipments cannot exceed the corresponding capacities of available transport modes. Equations (20)–(22) ensure that the shipments are served only by one transport mode at each arc among the entire supply chain network. Equation (23) means that the lead-time from the supplier to the plant cannot exceed the plant’s maximum lead-time.
4. Solution Algorithm
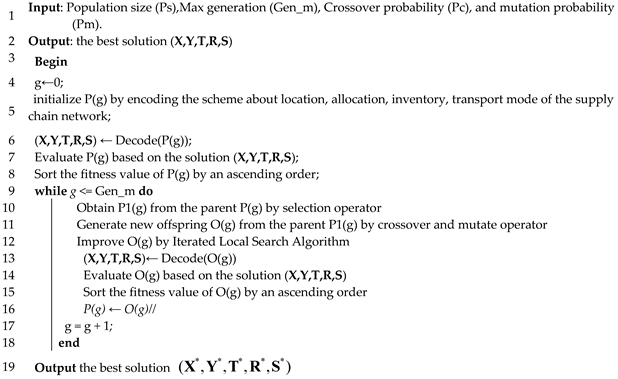
As a variant of the location-inventory problem (LIP), the proposed problem is also an NP-hard, which faces a great computational challenge to deal with large-size instances with exact solution algorithms [46]. In this regard, a heuristic method or hybrid metaheuristic one are proven as effective methods to solve the above NP-hard problems. A genetic algorithm (GA) is a stochastic global search metaheuristics approach based on evolutionary processes, which is approved as an effective method to solve NP-hard problems [47,48]. In this study, we have designed a hybrid genetic algorithm (HGA) based on standard GA and local search (LS) to solve our proposed problem. The following are some key operations in a hybrid genetic algorithm.
- (1)
- Selection operator
The selection operator is a significant to ensure select good chromosomes from the population. There are some feasible methods, e.g., roulette wheel selection, Boltzmann selection, rank selection, and some others [47]. In this study, we designed a combination method, which is embedded with the roulette wheel selection and optimal individual preservation, so as to choose excellent individuals from their parents. This combination selection strategy can inherit the contemporary optimal individual into the next children individuals [45].
- (2)
- Crossover operator
We implement a crossover operation for the two parts of the chromosome. The partially matched crossover (PMX) method is adopted to randomly select two intersections in a chromosome in this study [45,49]. The process of crossover operator is shown as follows:
- Step 1: Choose two parent individuals to crossover;
- Step 2: Determine the crossover section;
- Step 3: Determine the crossover position, namely the columns to be exchanged;
- Step 4: Modify the relationship between individual fragments. If there are sections that do not meet the condition, then reconstruct upstream, and the process is similar to the initial solution.
- (3)
- Mutation operator
Mutation changes the gene value of some chromosomes. The mutation operation process is basically similar to the crossover operation. The difference lies in two points: (1) the chromosomes are selected according to a certain probability, and the chromosomes are not necessarily even numbers; (2) the 2-opt algorithm is used for row mutation operations, and other similar parts would not repeat here.
- (4)
- Process of local search
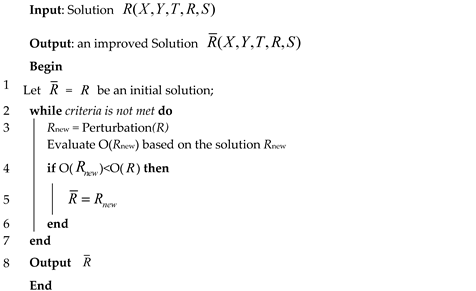
On the basis of determining the optimal individual of each generation by genetic algorithm, the local search operator is used for further optimization. The local search operator is as follows: (i) swap traverses all the elements in the matrix and exchanges them with the elements in another position; (ii) insert indicates that the elements in a row in the matrix are inserted into other different positions in that row; and (iii) 3-opt traverses the rows in the matrix for a 3-opt operator.
- (5)
- Adaptive probabilities of crossover and mutation
The probabilities of a crossover operator and mutation operator have significant effect on the GA’s performance, and the unreasonable crossover ratio and mutation ratio will cause the algorithm to fail to converge to the global optimal solution. The improved adaptive crossover ratio and mutation ratio are adapted from Ge et al. [50] and Zhang and Xing [51]. The corresponding probability of a crossover operator (Pc) and that of mutation (Pm) are shown as Equations (24) and (25).
where , , , , , and are the weights of each calculation component. Moreover, , , , , , and fall in the interval (0, 1) and [45,51]. represents the fitness function value of the individual. Moreover, , , and represent the minimum, maximum, and average values of the current population, respectively.
Algorithm 1 below shows the pseudo-code for the HGA to find a near optimal solution. In order to improve the efficiency of the hybrid genetic algorithm, the local search is performed, whose pseudo-code is shown as Algorithm 2.
| Algorithm 1: Hybrid Genetic Algorithm (The pseudo-code for the hybrid genetic algorithm (HGA). |
 |
| Algorithm 2: Iterated Local Search Algorithm (The pseudo-code for Iterated Local Search). |
 |
5. Computational Experiments
In this section, we first validate our model and compare the computational performance of the proposed hybrid genetic algorithm (i.e., HGA) and standard genetic algorithm (i.e., SGA) by several instances. Moreover, we reveal some managerial insights based on the corresponding analysis.
5.1. Data Input
We considered a four-level supply chain network (i.e., suppliers, plants, DCs, and retailers), which illustrates the above proposed model and solution algorithm. Three alternative transport modes were chosen between suppliers and plants, from plants to DCs, and from DCs to retailers.
To test the computational performance, five instances were generated based on the corresponding parameters shown in Table 1. The proposed hybrid genetic algorithms were coded in MATLAB R2020a. All experiments were conducted on a Lenovo ThinkPad T450 laptop with an Intel Core i5 CPU and 8 GB RAM under the Windows 10 operating system.
Table 1.
Parameters to generate the instances.
The numerical experiment tested 5 different instances to compare the HGA with SGA. The crossover rate and mutation rate were set to and respectively. Moreover, crossover and mutation parameters in HGA were shown as follows, i.e., = 0.9, = 0.8, = 0.7, = 0.1, = 0.08, and = 0.06.
Each arc was associated with a different transport mode, which had different cost and unit product cost of CO2 emissions. The unit CO2 emission from handing per unit product in plants and DCs was 0.22 kg. The unit CO2 emission tax was 0.12 $/kg. The unit transport cost and CO2 emission of different transport modes are shown in Table 2 [10,45].
Table 2.
Unit transport cost and CO2 emissions.
5.2. Comparison of the Two Algorithms
The numerical experiment tested 5 different scenario groups to compare optimal solution and running time of SGA and HGA. Each group was tested 20 times, and the operation results of the different algorithms are recorded in Table 3.
Table 3.
Comparison of computational results reported by SGA and HGA algorithms.
- (1)
- The HGA resulted in the best solution, and the inferior solution and the average objective function value were smaller than those of the SGA, which meant that the HGA could find a higher-quality solution and had better optimization performance.
- (2)
- The running time of the HGA was longer than that of the SGA, but the difference was small. Based on the above comparison analysis, we found that the HGA was more practical for the model.
5.3. Discussion and Analysis
In this section, we address the effects of some significant parameters on the supply chain network and the optimal solution based on Instance 1, which mainly includes the service levels, taxes of carbon emissions, and lead-time of plants.
5.3.1. Effects of Different Service Levels on the Supply Chain Network
First, we investigated the effects of different service levels on the supply chain network and the optimal solution. We vary the values of service level α, from 0.65 to 0.95 and run each scenario 20 times to calculate the corresponding mean values.
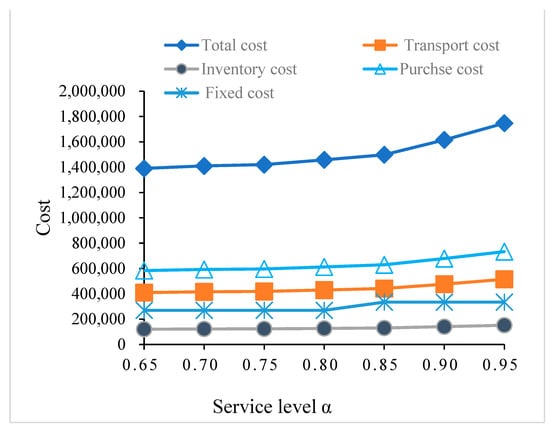
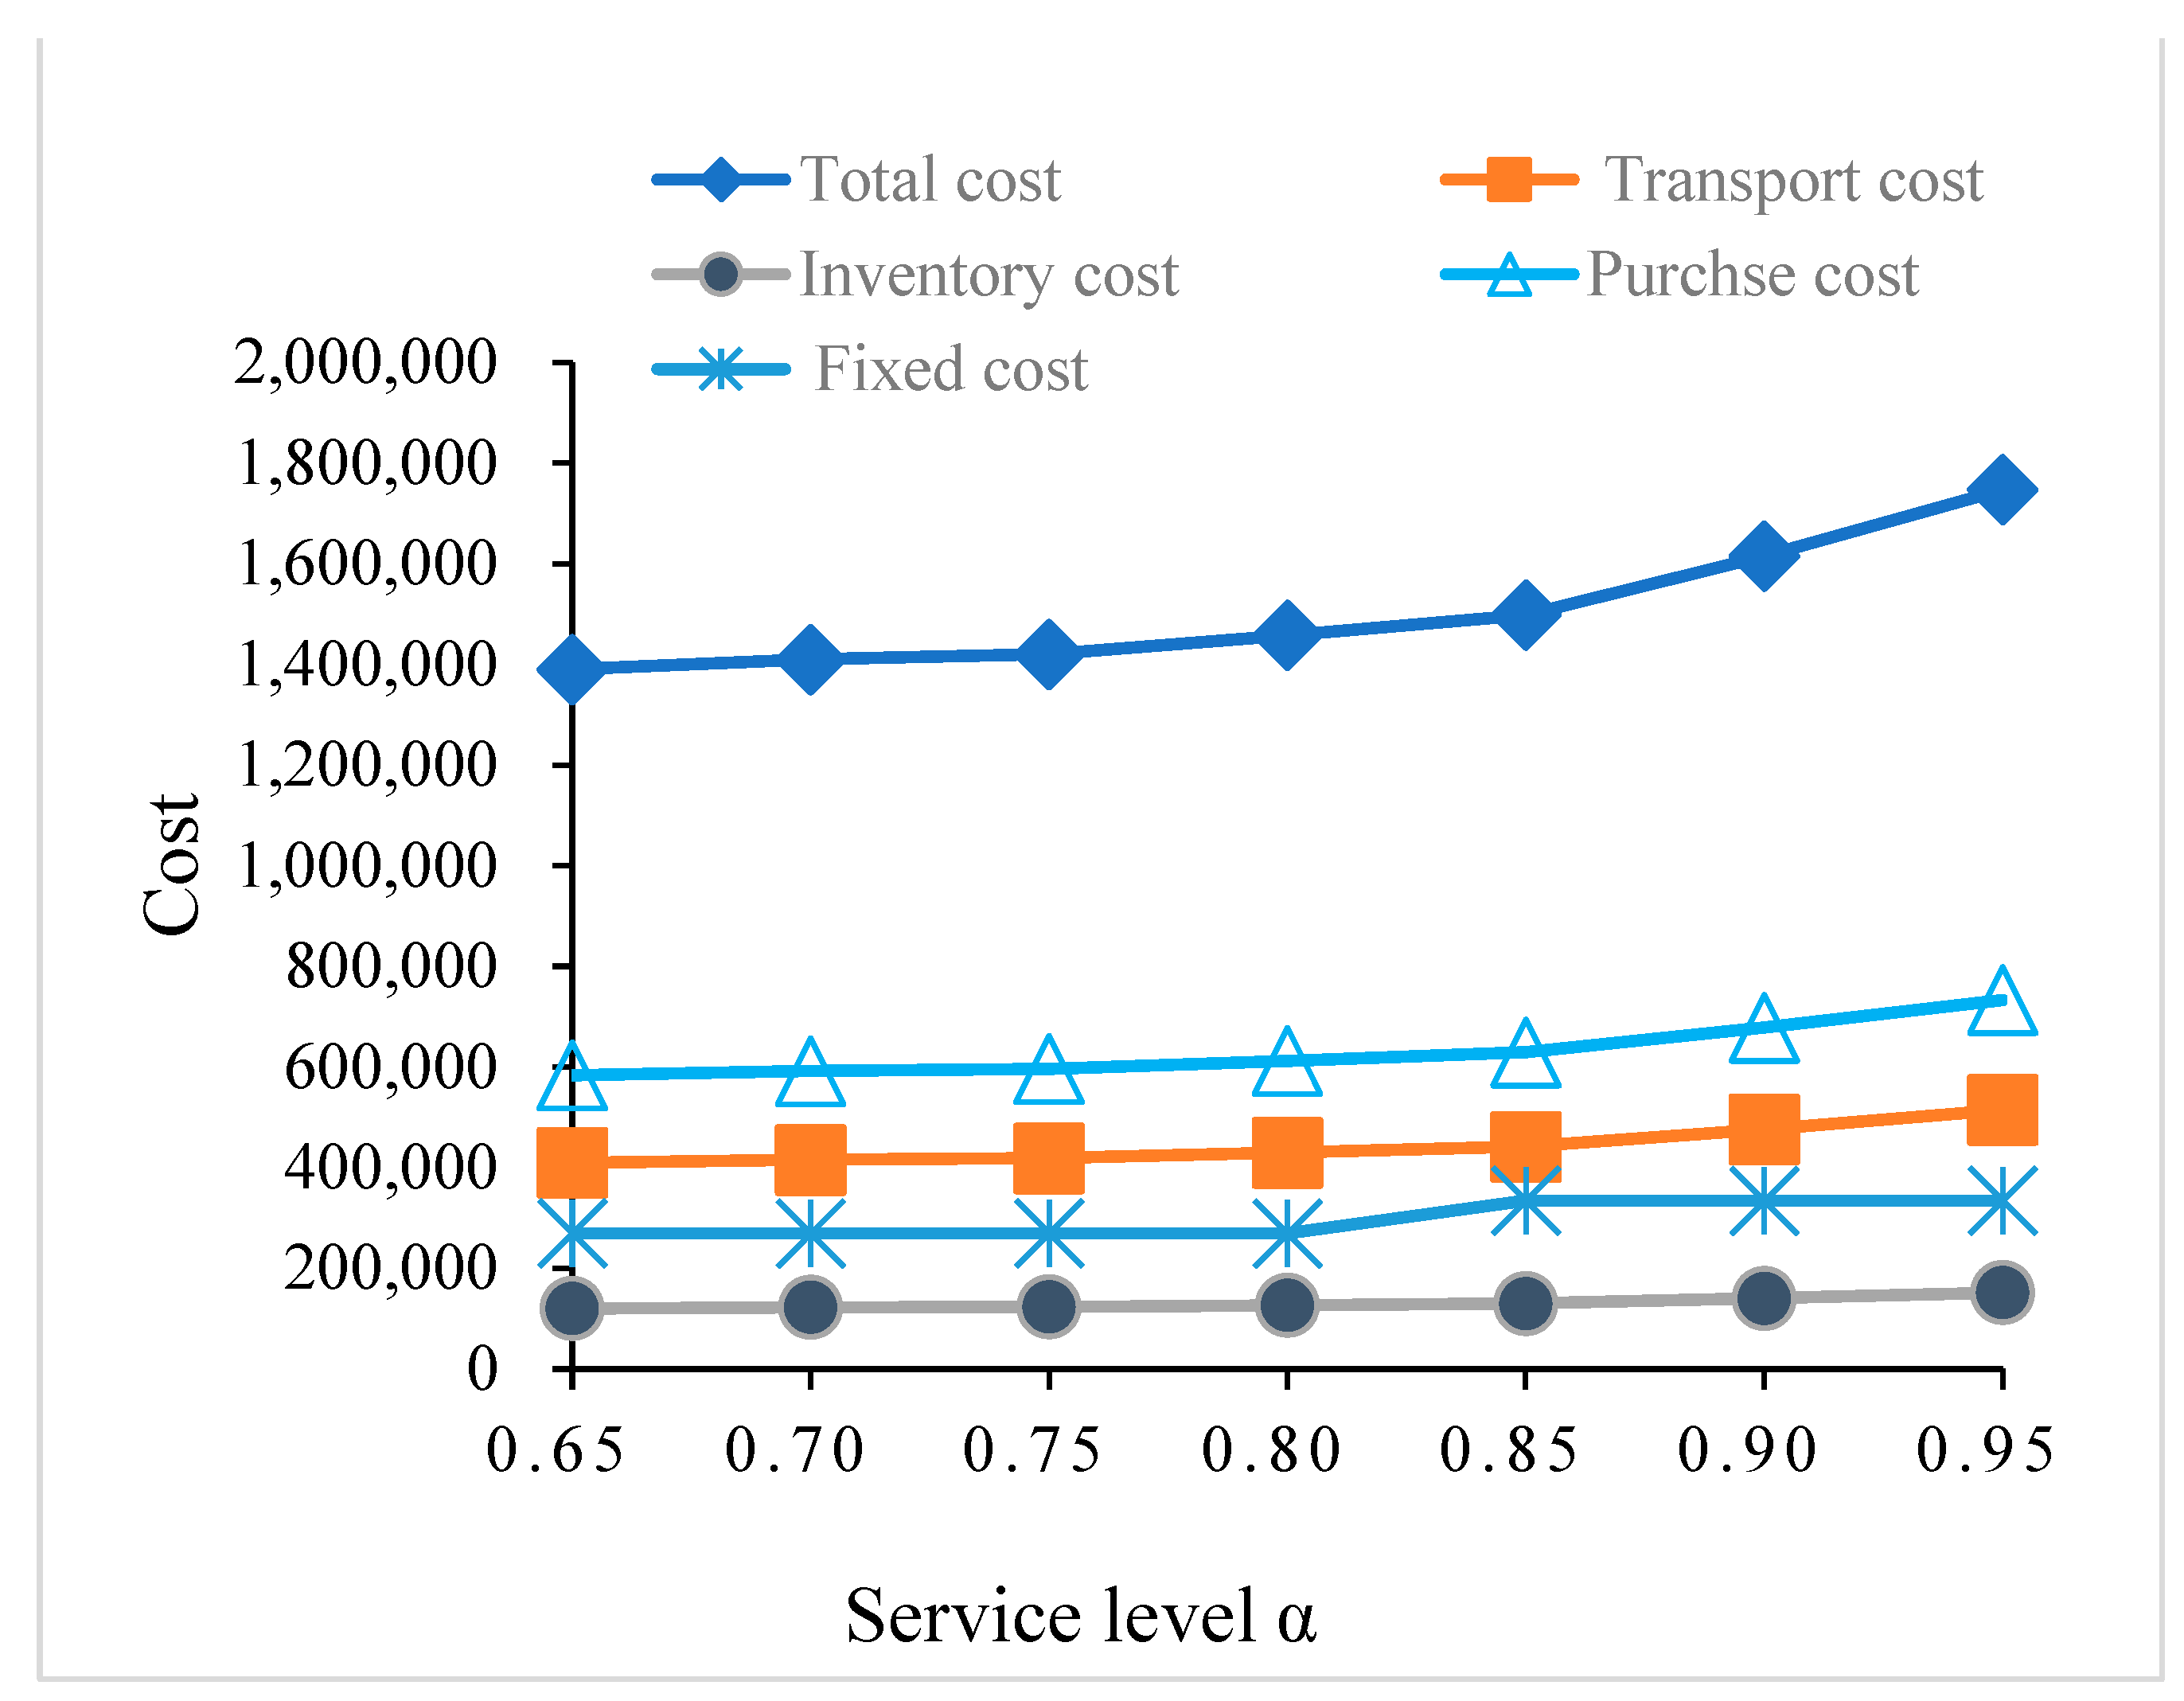
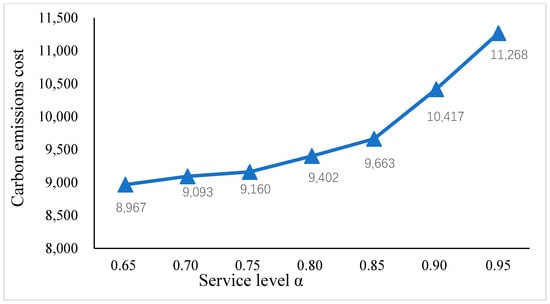
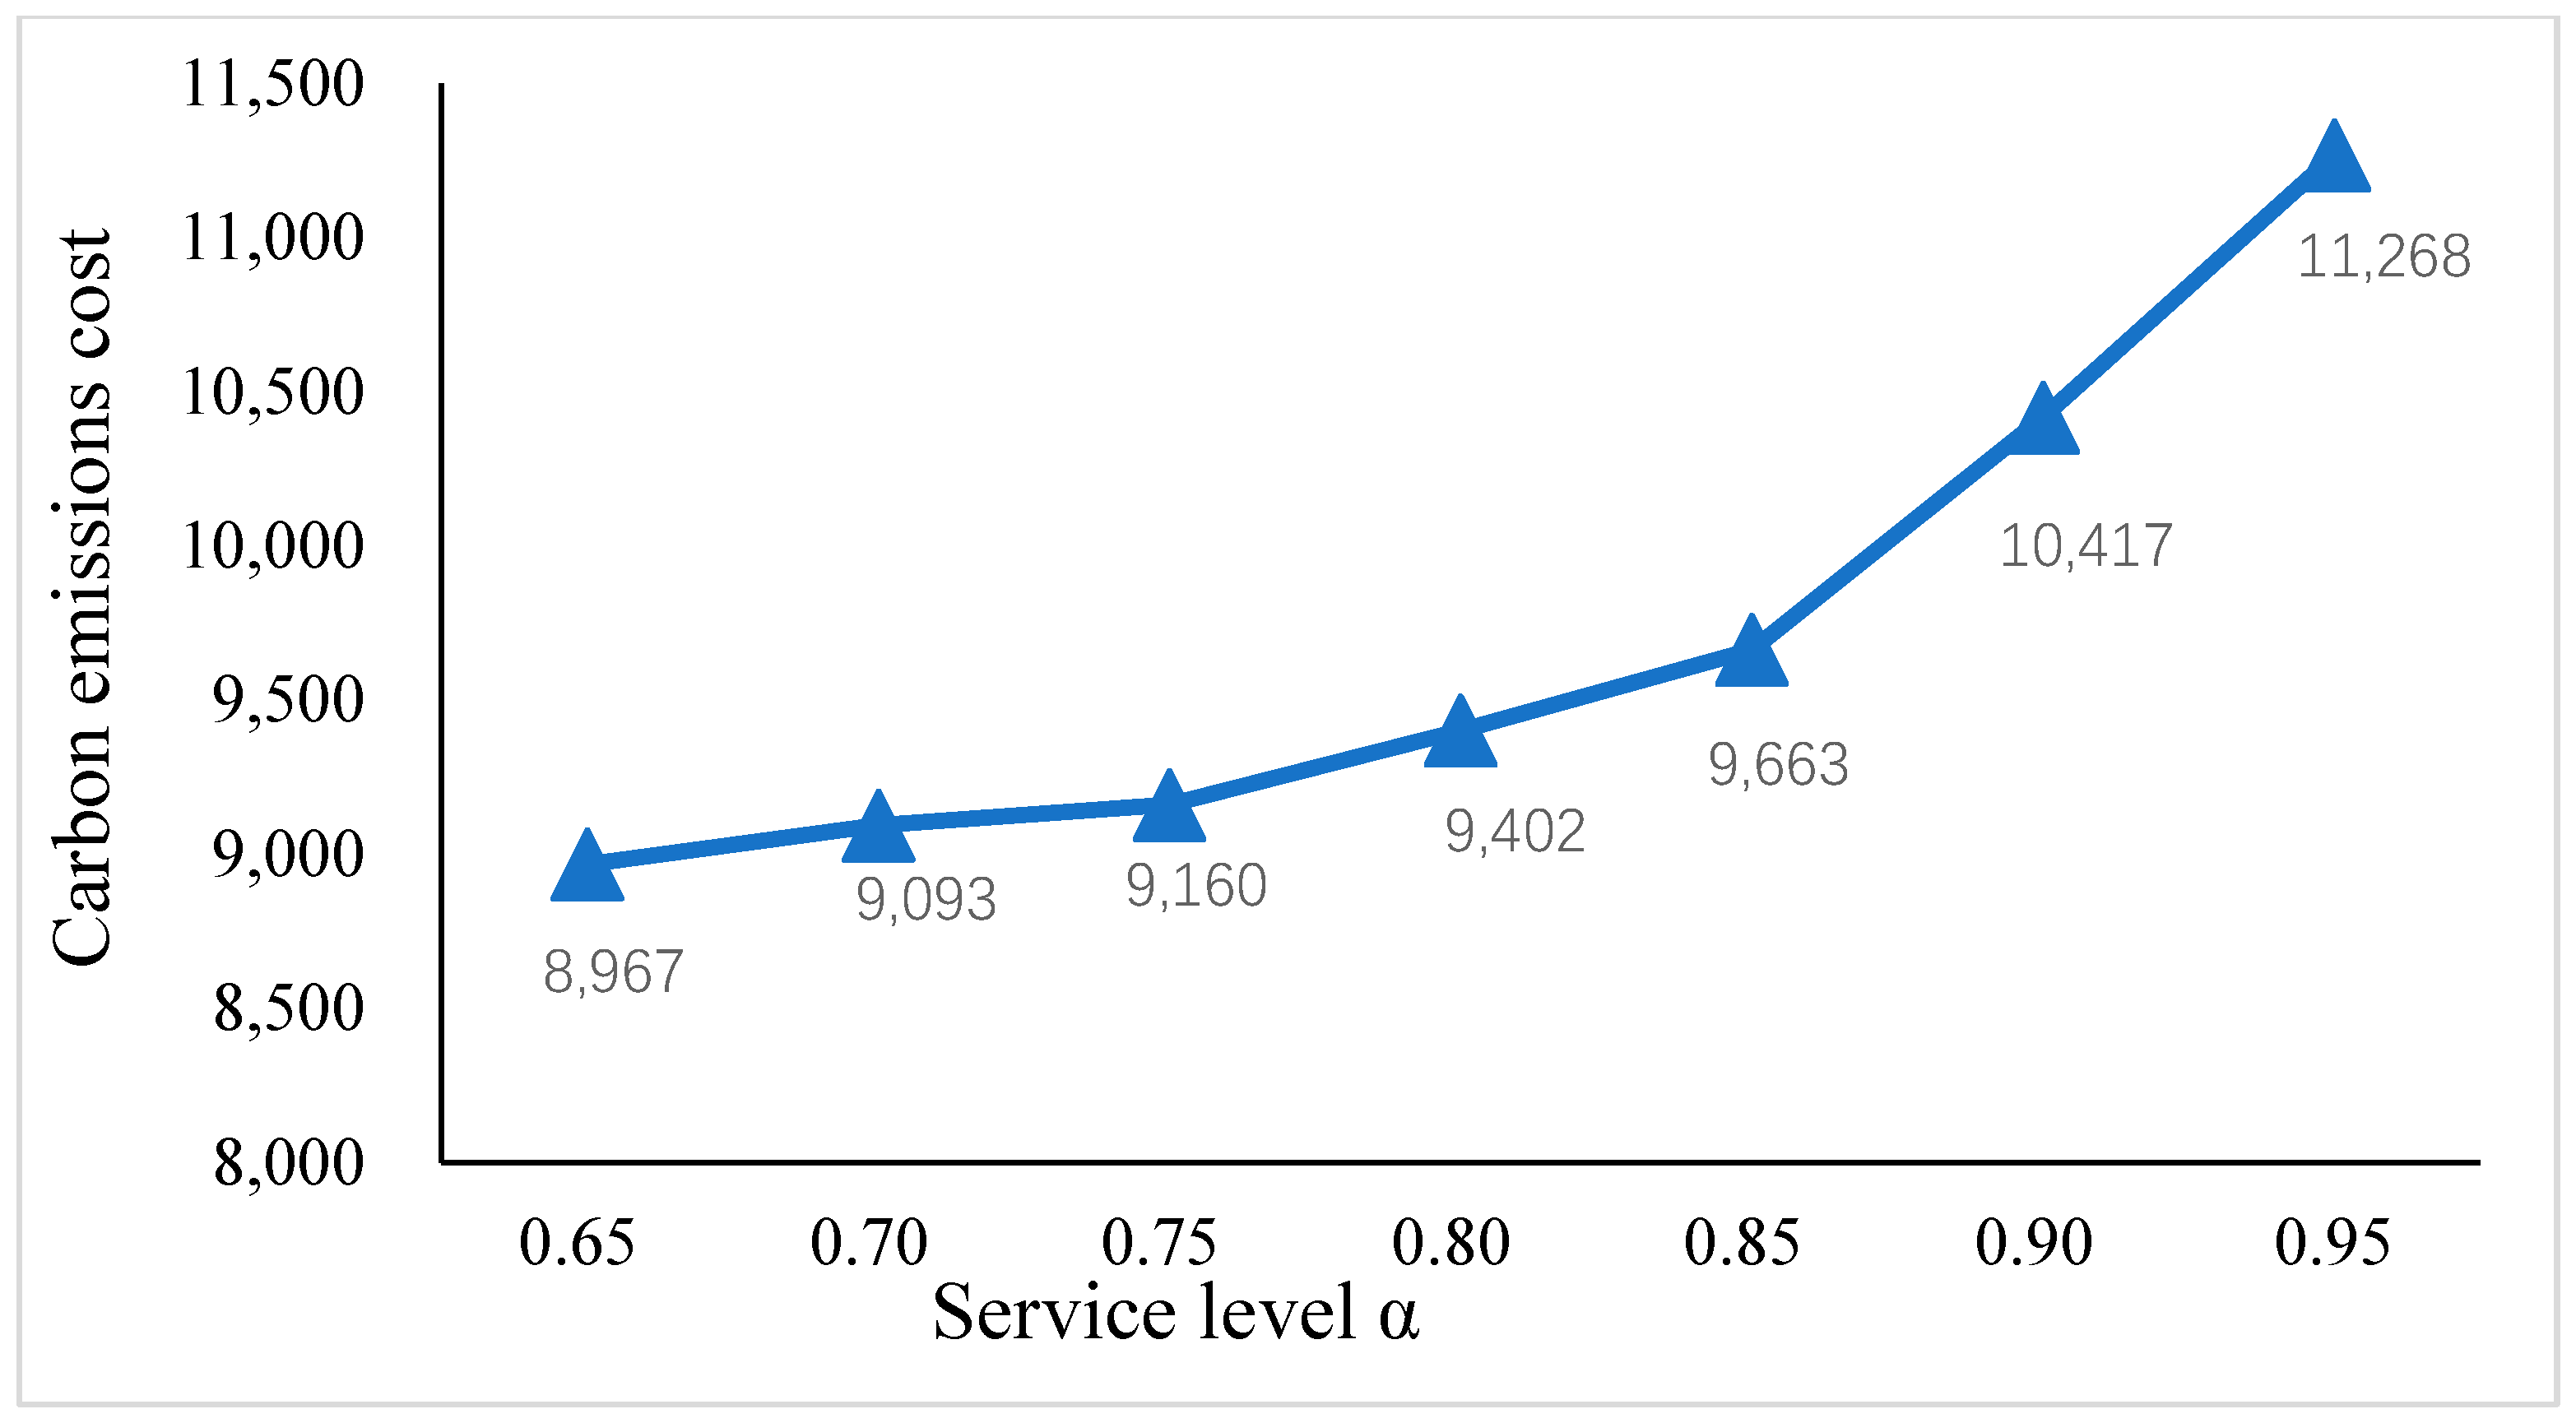
Figure 2 shows the change in the relationship of all the costs under different service levels. It can be seen that the total cost, transportation cost, purchase cost, inventory cost, and fixed cost are all increase with the increase of the value of the service level parameter α. Moreover, the purchase cost and transport cost curves will have an obvious increase comparing other costs, which means that the customer service level has a great influence on the purchase cost and transport cost in the supply chain network. Figure 3 shows that the total carbon emission cost is also related to the service level. Specifically, the cost of carbon emission is 8967 under the service level with 0.65, while the corresponding value will increase to 11,268 if the value of service level changes to 0.95.
Figure 2.
Cost analysis under different service levels.
Figure 3.
Carbon emission Cost analysis under different service levels.
The above findings reveal two important managerial implications: (1) More frequent purchases and more inventories are needed when the service level is higher, therefore the total cost of the whole supply chain will increase; and (2) enterprises must determine the best customer service level to achieve the lowest total cost in the supply chain.
5.3.2. Effects of Different Carbon Emission Taxes on the Supply Chain Network
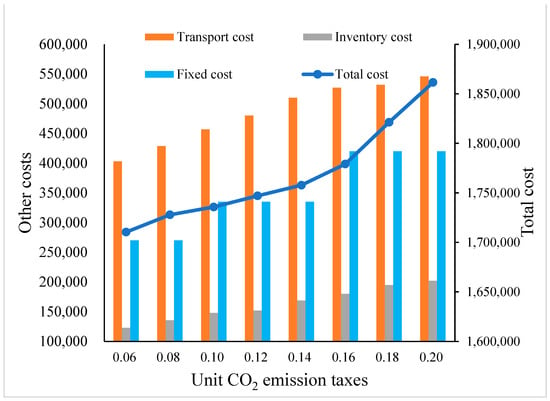
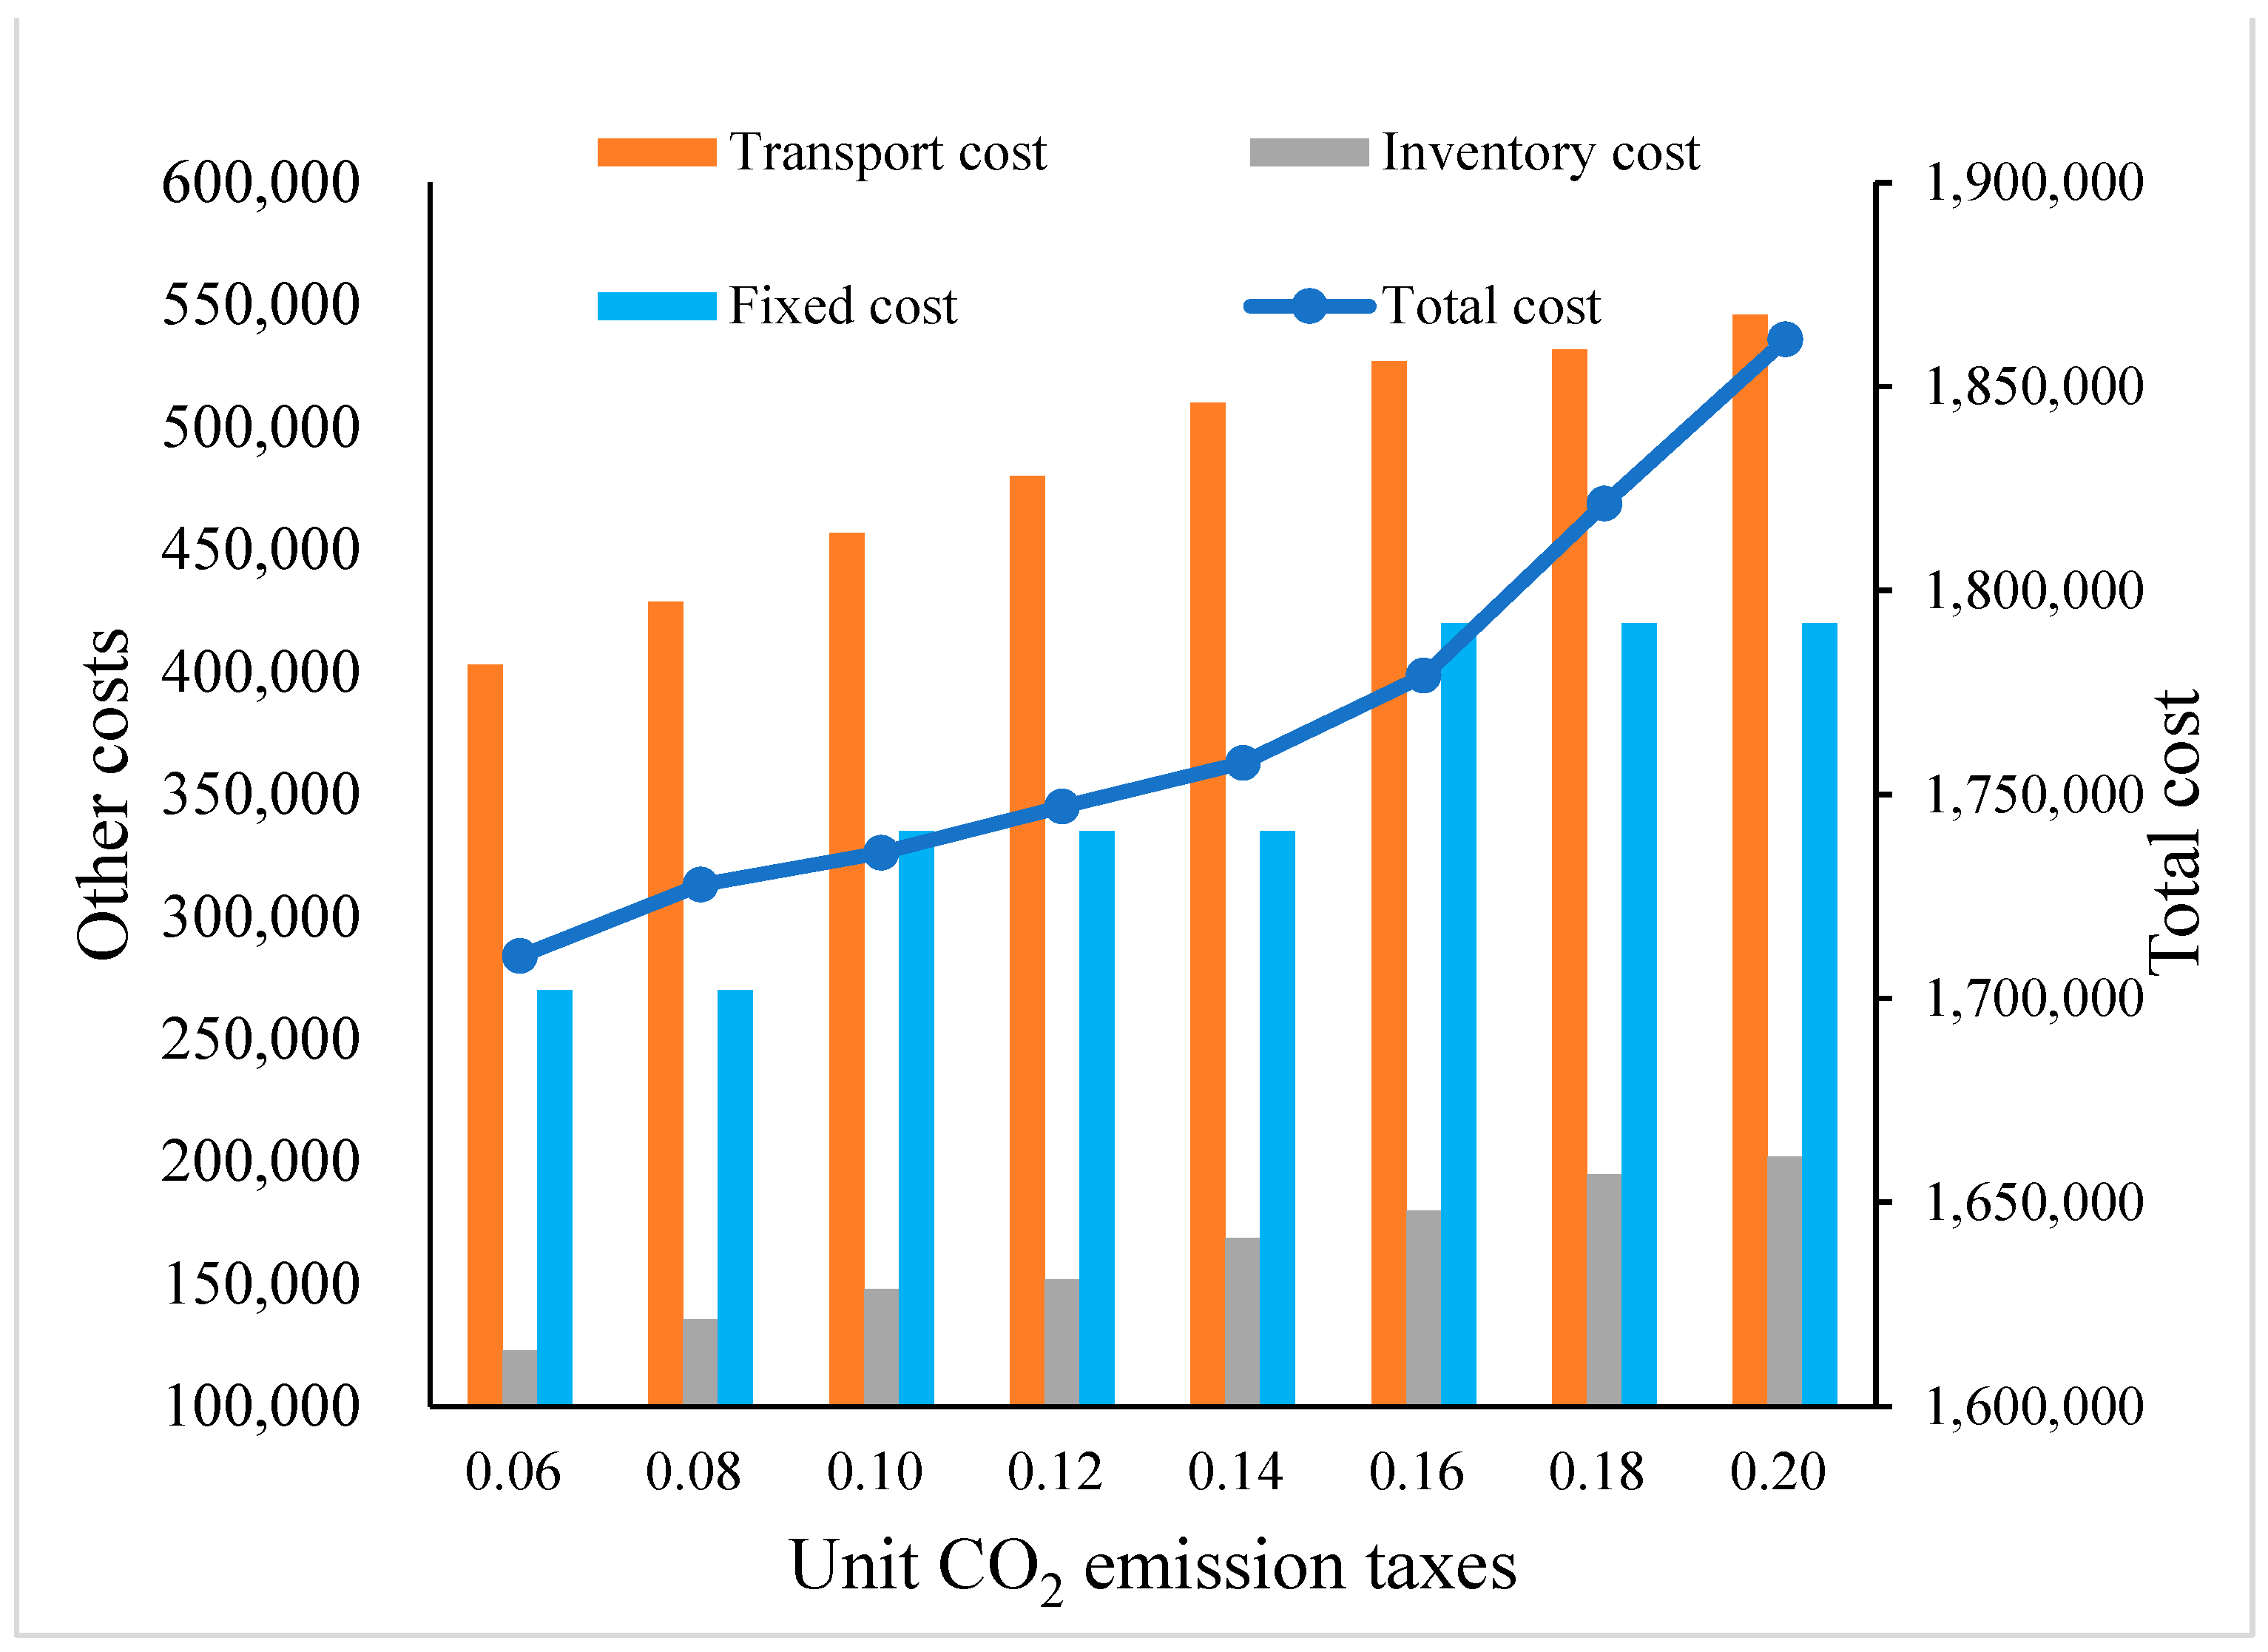
Next, we addressed the effects of different carbon emission taxes on the supply chain network. We vary the values of the charging on unit carbon emission taxes from 0.06 to 0.20 $/kg. Figure 4 shows that the total cost of supply chain will keep a growth trend with the increase of unit CO2 emission taxes. The transport cost increase fast with the increase of unit CO2 emission taxes, while it will keep slowly increase after the point of 0.16. The inventory cost keeps the increase trend with the increase of the CO2 emission taxes. Moreover, we found that the inventory cost keeps the step-shape changes, i.e., increase from 27,000 to 420,000. The open plants and DCs among the candidates are shown as Table 4 under the different unit CO2 emission taxes. We can see that the number of DCs becomes more with the increase of the CO2 emission taxes. And we also find that more DCs are open and more green transport modes (e.g., railway) are selected, which ensures to reduce the total cost. This implies that the inventory cost and fixed cost will increase to reduce the corresponding transport cost. So, the CO2 emission taxes show some significant effect on the supply chain network and transport mode.
Figure 4.
Cost analysis under different unit CO2 emission taxes.
Table 4.
Open plants and DCs under different unit CO2 emission taxes.
5.3.3. Effects of Different Lead-Time on the Performance of Supply Chain Network
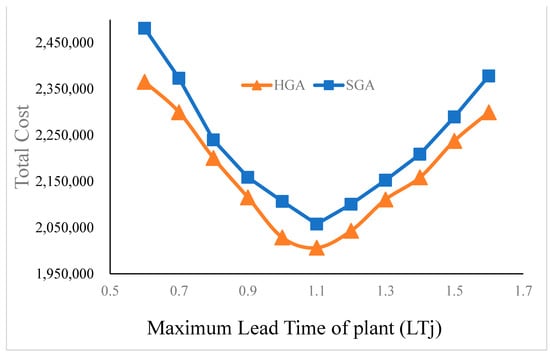
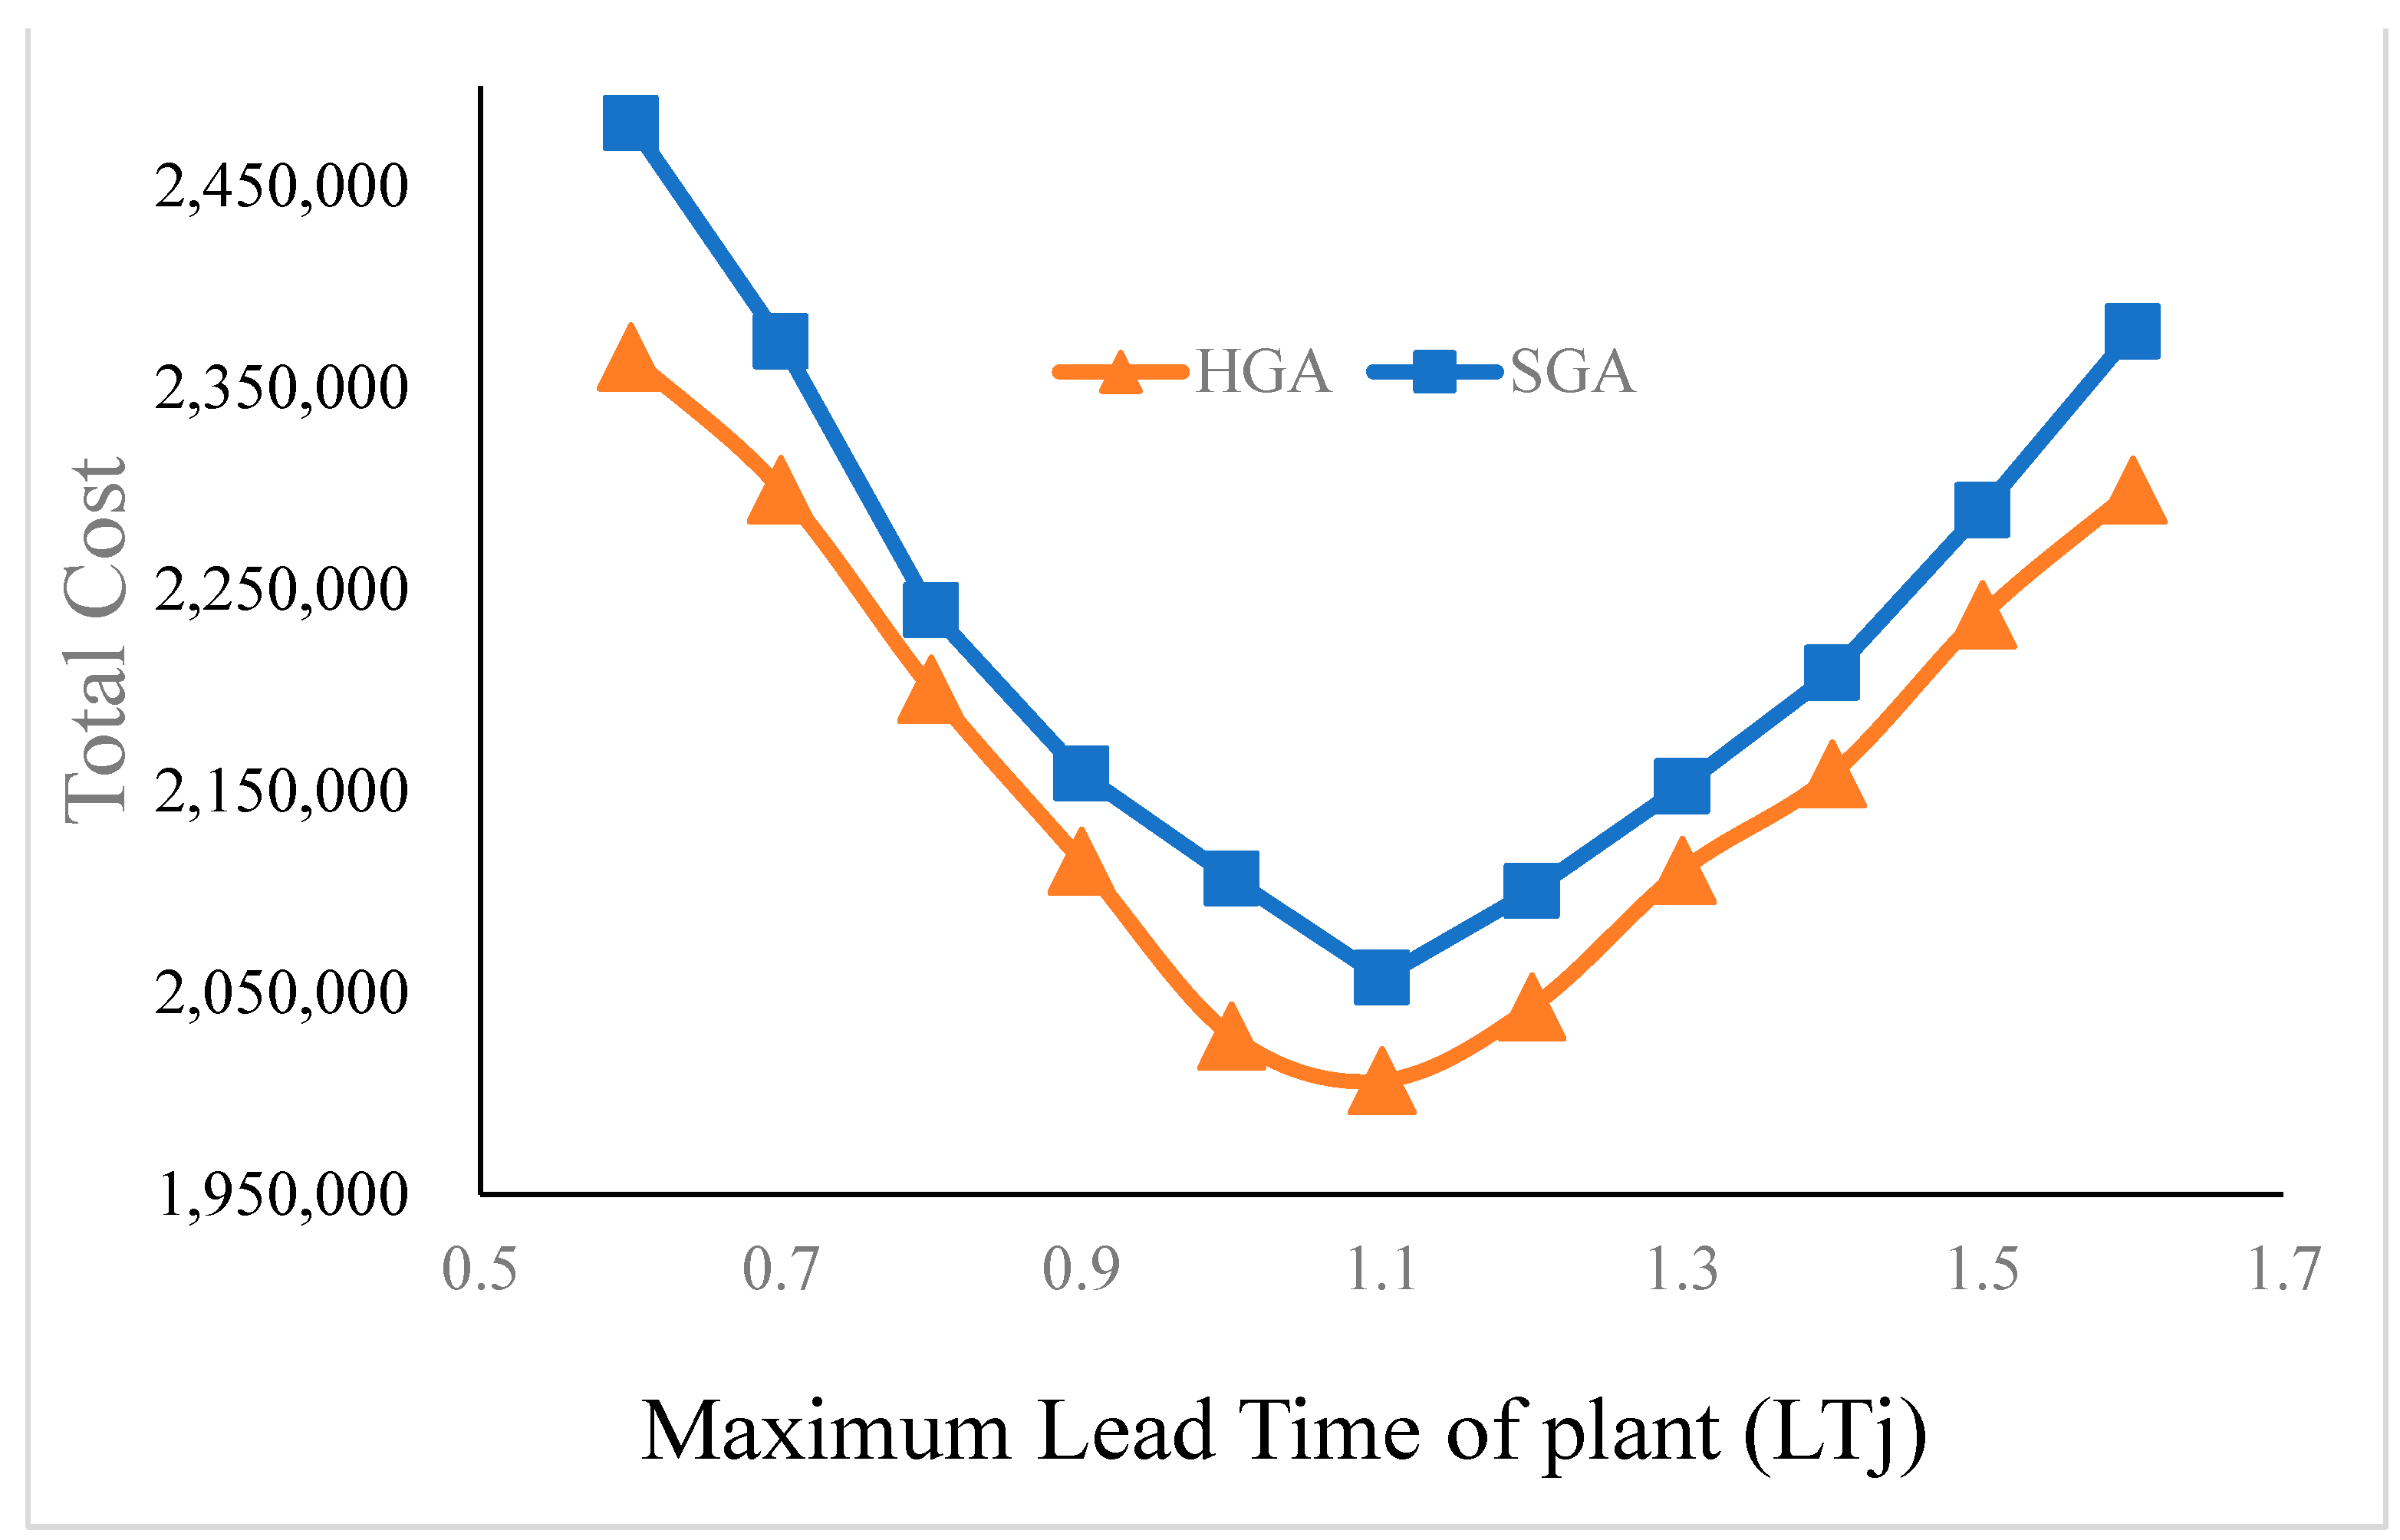
Moreover, we address the effects of different lead-times of plants on the network design of the green supply chain. We vary the lead-time of plants to test the solution algorithm, whose range falls into the interval of [0.5, 1.7]. The other basic input parameters remain unchanged. The maximum lead-time of the plant is adjusted, and the data for each group are run 20 times to obtain the average value. The results are shown in Figure 5.
Figure 5.
Cost analysis under different maximum lead-times for plants.
As shown Figure 5, we find that the total cost will decrease first and then increase with the increase of the maximum lead-time of plants. The total cost of the supply chain will decrease gradually when the maximum lead-time of all plants changes in the range of 0.70 to 1.10. The possible reason is that the factories with less lead-time will receive orders more urgently, so the costs of procurement, transportation and production will increase. However, the total cost of the supply chain network will increase gradually when the maximum lead-time of plants continues to increase from 1.10 to 1.70. This discloses that a large amount of inventory will be accumulated and that the total cost of the supply chain will rise to meet customer needs in time. The optimal maximum lead-time of a plant is near 1.10.
The above findings reveal that the maximum lead-time of plants will have a significant effect on the whole supply network design and its corresponding total cost, and there exists an optimal lead-time for plants.
6. Case Study
The proposed model and solution algorithm are applied to a real-world supply chain network design of an electronic equipment assembly company, A, in China. The main business of company A covers mobile phones, computers, laptops, and other products. Currently, there are 15 candidate suppliers, 5 assembly plants, 10 distribution centers, and 30 retailers. The distances from suppliers to plants, from plants to DCs, and from DCs to retailers is shown in Table A1, Table A2, Table A3, Table A4 and Table A5. The demand of retailers is shown in Table 5. The capacity of the suppliers is shown in Table 6. The other parameters are shown as Table 7, Table 8, Table 9, Table 10 and Table 11.
Table 5.
The demand of retailers.
Table 6.
The supply capacity of suppliers.
Table 7.
The operational parameters of assembly plants.
Table 8.
The operational parameters of distribution centers.
Table 9.
The unit purchasing costs of assembly plants ($/unit).
Table 10.
The ordering costs of the assembly plants ($/shift).
Table 11.
The ordering costs of the distribution centers ($/shift).
The comparison analysis of the current solution to the supply chain network design of company A and optimization is shown in Table 12.
Table 12.
Comparative analysis of the current solution and the optimized solution (Million dollars/year).
As shown Table 12, the optimized total annual cost of Company A’s supply chain network is 4093.17 million dollars, which is an annual savings of 98.76 million dollars compared with the current supply chain network design scheme 4191.93 million dollars. The percent of total cost saving is 2.36%. The fixed cost saved 130.59 million dollars, with a decrease percent of 14.84%. The inventory cost is reduced by 1.36 million dollars, with a saving percent of 12.73%. The procurement and production cost is reduced by 64.74 million dollars, with an optimization of 2.69%. Transportation cost is reduced from 109,07 to 100.04 million dollars, with an decrease of 8.28%. The CO2 emission cost is reduced from 5.63 to 5.11 million dollars, and the corresponding decrease percent is up to 9.24%.
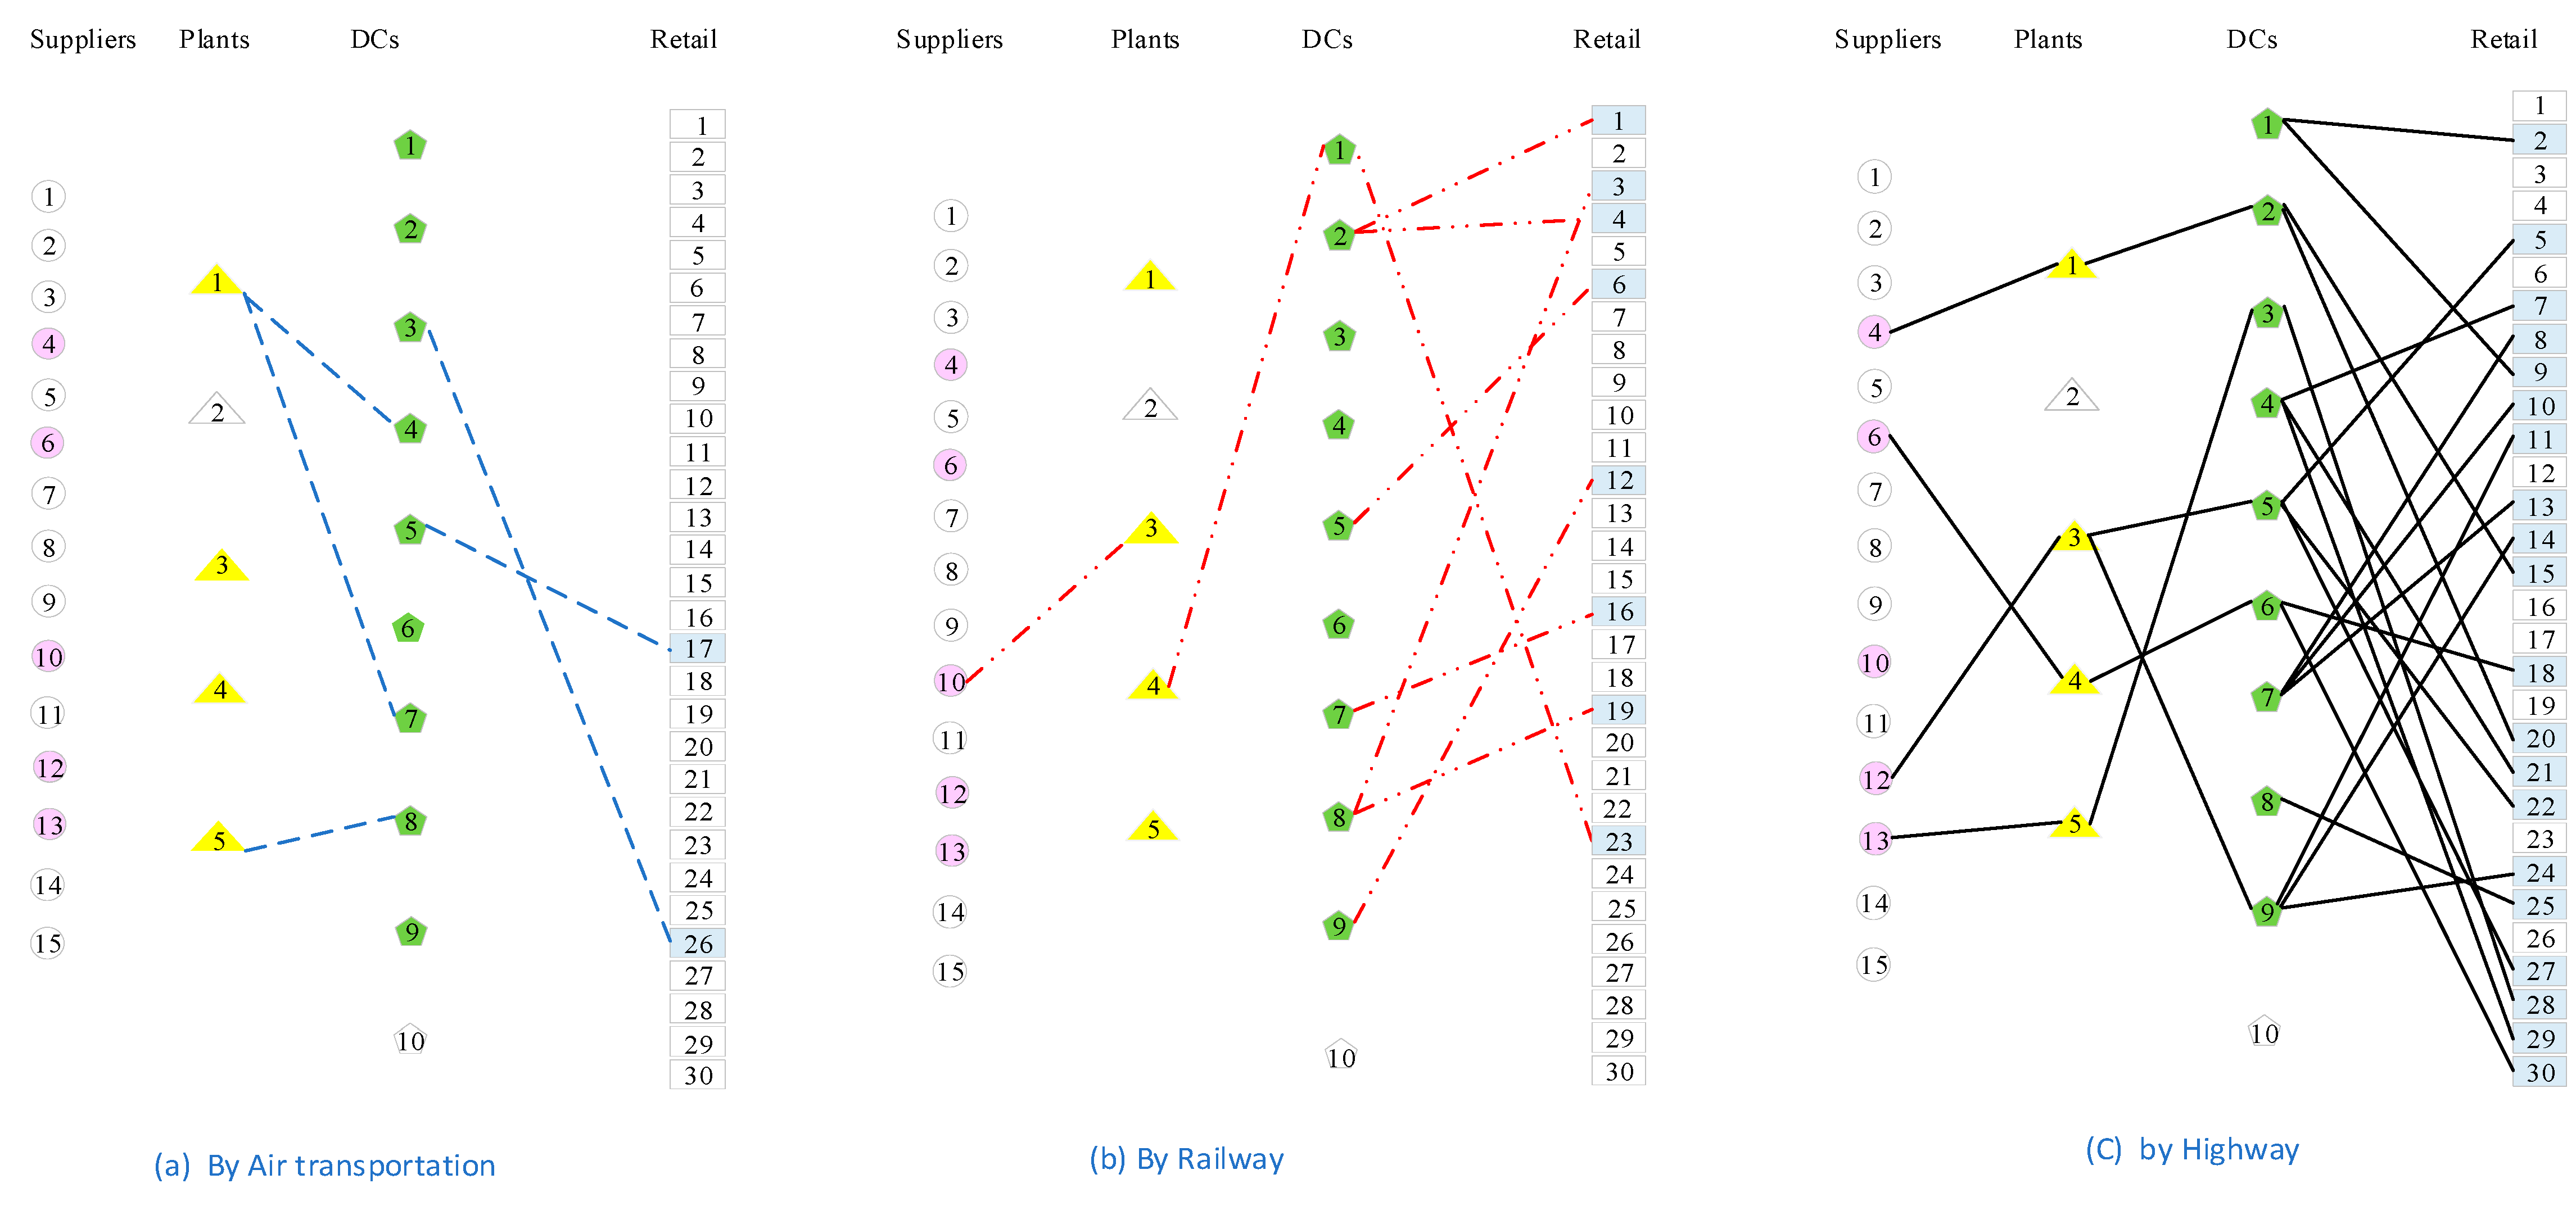
The optimization supply chain network design of company A is shown in Figure 6.
Figure 6.
Optimization supply chain network design.
Since the inventory control methods based on (Q,r) and the economic order quantity (EOQ) purchase strategies are adopted in plants and DCs, the corresponding optimal re-order point and purchase quantities of plants and DCs are shown Table 13 and Table 14, respectively.
Table 13.
The optimal re-order point and purchase quantities of plants.
Table 14.
The optimal re-order point and purchase quantities of DCs.
The results show that the proposed optimization model and algorithms in this study significantly reduce fixed inventory costs, transportation costs, and CO2 emission costs with optimization on the supply chain network design with inventory management. Although the proposed optimization model and algorithms also contribute to reducing procurement and production costs, their impacts are relative limited. The finding reveals that an effective supply chain network design can decease the total cost of supply chains and benefit from reducing CO2 emissions.
7. Conclusions and Future Work
Achieving low-cost, high-efficiency, and high-service level, the green supply chain has been a hot research topic in recent years. This paper establishes an integrated non-linear programming model, which integrates and optimizes the multi-echelon green sup-ply chain network design with inventory management as well as the selection of suppliers. An improved hybrid genetic algorithm embedded with a local search is presented to solve the above proposed optimization model. To verify the above model and corresponding algorithm, some mathematical experiments and a case study are conducted. By comparing the proposed hybrid genetic algorithm (HGA) and the standard genetic algorithm (SGA), we found that the computational performance of HGA is better than that of SGA.
The following findings are also obtained:
- (1)
- An effective supply chain network design can decease the total cost of the supply chain and benefit from reducing CO2 emissions;
- (2)
- The service level has the greatest impact on the purchase and holding costs in the supply chain network;
- (3)
- The CO2 emission taxes show some significant effect on the supply chain network and transport mode;
- (4)
- It is important for enterprises to set a rational maximum lead-time of a plant, which shows a significant effect on the whole supply network design and its corresponding total cost.
Future research directions are listed as follows:
- (1)
- Establishing an uncertain robust multi-echelon supply network considering the determination of customer requirements and procurement lead-time;
- (2)
- Considering a flexible supply network to combine multi-source supply with supply interruption;
- (3)
- Designing heuristic or meta-heuristic algorithms to solve the model to obtain better solutions.
Author Contributions
Conceptualization, L.Z. and X.L.; Methodology, L.Z., D.Z., S.L. and X.L.; Software, L.Z.; Validation, L.Z.; Data curation, L.Z.; Writing—original draft, L.Z.; Writing—review & editing, D.Z. and S.L.; Visualization, D.Z. and X.L.; Project administration, S.L.; Funding acquisition, D.Z. and S.L. All authors have read and agreed to the published version of the manuscript.
Funding
This study is jointly supported by the Science and Technology Research and Development Plan Project of China National Railway Group Co. (No. 2023X022)) and the High-end Think Tank Project of Central South University No. 2021znzk08. The work is supported in part by the Natural Science Foundation of Hunan Province of China under Grant Nos. 2021JJ30857, 2021JJ31167, in part by Hunan Social Science Foundation under Grant No. 19YBA378.
Institutional Review Board Statement
Not applicable.
Informed Consent Statement
Not applicable.
Data Availability Statement
Not applicable.
Conflicts of Interest
The authors declare no conflict of interest.
Appendix A
Table A1.
Distance from suppliers to plants by different transport modes (km).
Table A2.
Distance from plants to DCs by different transport modes (km).
Table A3.
Distance from plants to DCs by highway (km).
Table A4.
Distance from plants to DCs by Railway (km).
Table A5.
Distance from plants to DCs by Air transportation (km).
References
- Miranda, P.A.; Garrido, R.A. Incorporating inventory control decisions into a strategic distribution network design model with stochastic demand. Transp. Res. Part E Logist. Transp. Rev. 2004, 40, 183–207. [Google Scholar] [CrossRef] [Scilit]
- Vidal, C.J.; Goetschalckx, M. Strategic production-distribution models: A critical review with emphasis on global supply chain models. Eur. J. Oper. Res. 1997, 98, 1–18. [Google Scholar] [CrossRef] [Scilit]
- Soysal, M.; Çimen, M.; Belbağ, S.; Toğrul, E. A review on sustainable inventory routing. Comput. Ind. Eng. 2019, 132, 395–411. [Google Scholar] [CrossRef] [Scilit]
- Jalal, A.M.; Toso, E.A.V.; Morabito, R. Integrated approaches for logistics network planning: A systematic literature review. Int. J. Prod. Res. 2022, 60, 5697–5725. [Google Scholar] [CrossRef] [Scilit]
- Ventura, J.A.; Valdebenito, V.A.; Golany, B. A dynamic inventory model with supplier selection in a serial supply chain structure. Eur. J. Oper. Res. 2013, 230, 258–271. [Google Scholar] [CrossRef] [Scilit]
- Huang, Y.; Huang, G.Q.; Newman, S.T. Coordinating pricing and inventory decisions in a multi-level supply chain: A game-theoretic approach. Transp. Res. Part E Logist. Transp. Rev. 2011, 47, 115–129. [Google Scholar] [CrossRef] [Scilit]
- Fazayeli, S.; Eydi, A.; Kamalabadi, I.N. Location-routing problem in multimodal transportation network with time windows and fuzzy demands: Presenting a two-part genetic algorithm. Comput. Ind. Eng. 2018, 119, 233–246. [Google Scholar] [CrossRef] [Scilit]
- Miranda, P.A.; Garrido, R.A. Inventory service-level optimization within distribution network design problem. Int. J. Prod. Econ. 2009, 122, 276–285. [Google Scholar] [CrossRef] [Scilit]
- Dekker, R.; Bloemhof, J.; Mallidis, I. Operations Research for green logistics—An overview of aspects, issues, contributions and challenges. Eur. J. Oper. Res. 2012, 219, 671–679. [Google Scholar] [CrossRef] [Scilit]
- Zhang, D.; Zhan, Q.; Chen, Y.; Li, S. Joint optimization of logistics infrastructure investments and subsidies in a regional logistics network with CO2 emission reduction targets. Transp. Res. Part D Transp. Environ. 2018, 60, 174–190. [Google Scholar] [CrossRef] [Scilit]
- Qu, Y.; Bektaş, T.; Bennell, J. Sustainability SI: Multimode Multicommodity Network Design Model for Intermodal Freight Transportation with Transfer and Emission Costs. Netw. Spat. Econ. 2016, 16, 303–329. [Google Scholar] [CrossRef] [Scilit]
- Elhedhli, S.; Merrick, R. Green supply chain network design to reduce carbon emissions. Transp. Res. Part D Transp. Environ. 2012, 17, 370–379. [Google Scholar] [CrossRef] [Scilit]
- Nematollahi, M.; Tajbakhsh, A. Past, present, and prospective themes of sustainable agricultural supply chains: A content analysis. J. Clean.Prod. 2020, 271, 122201. [Google Scholar] [CrossRef] [Scilit]
- Abbasi, S.; Choukolaei, H.A. A systematic review of green supply chain network design literature focusing on carbon policy. Decis. Anal. J. 2023, 6, 100189. [Google Scholar] [CrossRef] [Scilit]
- Jahani, H.; Abbasi, B.; Sheu, J.-B.; Klibi, W. Supply chain network design with financial considerations: A comprehensive review. Eur. J. Oper. Res. 2023. [Google Scholar] [CrossRef] [Scilit]
- Li, S.; Li, X.; Zhang, D.; Zhou, L. Joint Optimization of Distribution Network Design and Two-Echelon Inventory Control with Stochastic Demand and CO2 Emission Tax Charges. PLoS ONE 2017, 12, e0168526. [Google Scholar] [CrossRef] [Scilit]
- Wang, F.; Lai, X.; Shi, N. A multi-objective optimization for green supply chain network design. Decis. Support Syst. 2011, 51, 262–269. [Google Scholar] [CrossRef] [Scilit]
- Mohebalizadehgashti, F.; Zolfagharinia, H.; Amin, S.H. Designing a green meat supply chain network: A multi-objective approach. Int. J. Prod. Econ. 2020, 219, 312–327. [Google Scholar] [CrossRef] [Scilit]
- Ma, S.; He, Y.; Gu, R.; Li, S. Sustainable supply chain management considering technology investments and government intervention. Transp. Res. Part E Logist. Transp. Rev. 2021, 149, 102290. [Google Scholar] [CrossRef] [Scilit]
- Abdul-Jalbar, B.; Gutiérrez, J.; Puerto, J.; Sicilia, J. Policies for inventory/distribution systems: The effect of centralization vs. decentralization. Int. J. Prod. Econ. 2003, 81–82, 281–293. [Google Scholar] [CrossRef] [Scilit]
- Ozsen, L.; Coullard, C.R.; Daskin, M.S. Capacitated warehouse location model with risk pooling. Nav. Res. Logist. (NRL) 2008, 55, 295–312. [Google Scholar] [CrossRef] [Scilit]
- Tsao, Y.-C.; Mangotra, D.; Lu, J.-C.; Dong, M. A continuous approximation approach for the integrated facility-inventory allocation problem. Eur. J. Oper. Res. 2012, 222, 216–228. [Google Scholar] [CrossRef] [Scilit]
- Bhatnagar, R.; Lin, B. The joint transshipment and production control policies for multi-location production/inventory systems. Eur. J. Oper. Res. 2019, 275, 957–970. [Google Scholar] [CrossRef] [Scilit]
- Fathi, M.; Khakifirooz, M.; Diabat, A.; Chen, H. An integrated queuing-stochastic optimization hybrid Genetic Algorithm for a location-inventory supply chain network. Int. J. Prod. Econ. 2021, 237, 108139. [Google Scholar] [CrossRef] [Scilit]
- Tavana, M.; Tohidi, H.; Alimohammadi, M.; Lesansalmasi, R. A location-inventory-routing model for green supply chains with low-carbon emissions under uncertainty. Environ. Sci. Pollut. Res. 2021, 28, 50636–50648. [Google Scholar] [CrossRef] [Scilit] [PubMed]
- Askin, R.G.; Baffo, I.; Xia, M. Multi-commodity warehouse location and distribution planning with inventory consideration. Int. J. Prod. Res. 2014, 52, 1897–1910. [Google Scholar] [CrossRef] [Scilit]
- Ghasemkhani, A.; Tavakkoli-Moghaddam, R.; Rahimi, Y.; Shahnejat-Bushehri, S.; Tavakkoli-Moghaddam, H. Integrated production-inventory-routing problem for multi-perishable products under uncertainty by meta-heuristic algorithms. Int. J. Prod. Res. 2022, 60, 2766–2786. [Google Scholar] [CrossRef] [Scilit]
- Sadjadi, S.J.; Makui, A.; Dehghani, E.; Pourmohammad, M. Applying queuing approach for a stochastic location-inventory problem with two different mean inventory considerations. Appl. Math. Model. 2016, 40, 578–596. [Google Scholar] [CrossRef] [Scilit]
- Chen, C.; Tian, Z.; Yao, B. Optimization of two-stage location-routing-inventory problem with time-windows in food distribution network. Ann. Oper. Res. 2019, 273, 111–134. [Google Scholar]
- Saragih, N.I.; Bahagia, S.N.; Suprayogi; Syabri, I. A heuristic method for location-inventory-routing problem in a three-echelon supply chain system. Comput. Ind. Eng. 2019, 127, 875–886. [Google Scholar] [CrossRef] [Scilit]
- Abbasi, S.; Saboury, A.; Jabalameli, M.S. Reliable supply chain network design for 3PL providers using consolidation hubs under disruption risks considering product perishability: An application to a pharmaceutical distribution network. Comput. Ind. Eng. 2020, 152, 107019. [Google Scholar] [CrossRef] [Scilit]
- Chavez, M.M.M.; Costa, Y.; Sarache, W. A three-objective stochastic location-inventory-routing model for agricultural waste-based biofuel supply chain. Comput. Ind. Eng. 2021, 162, 107759. [Google Scholar] [CrossRef] [Scilit]
- Cambero, C.; Sowlati, T. Assessment and optimization of forest biomass supply chains from economic, social and environmental perspectives—A review of literature. Renew. Sustain. Energy Rev. 2014, 36, 62–73. [Google Scholar] [CrossRef] [Scilit]
- Wang, C.; Zhang, L.; Chang, Y.; Pang, M. Biomass direct-fired power generation system in China: An integrated energy, GHG emissions, and economic evaluation for Salix. Energy Policy 2015, 84, 155–165. [Google Scholar] [CrossRef] [Scilit]
- Golpîra, H.; Najafi, E.; Zandieh, M.; Sadi-Nezhad, S. Robust bi-level optimization for green opportunistic supply chain network design problem against uncertainty and environmental risk. Comput. Ind. Eng. 2017, 107, 301–312. [Google Scholar] [CrossRef] [Scilit]
- Miranda-Ackerman, M.A.; Azzaro-Pantel, C.; Aguilar-Lasserre, A.A. A green supply chain network design framework for the processed food industry: Application to the orange juice agrofood cluster. Comput. Ind. Eng. 2017, 109, 369–389. [Google Scholar] [CrossRef] [Scilit]
- Zhang, D.; Zou, F.; Li, S.; Zhou, L. Green Supply Chain Network Design with Economies of Scale and Environmental Concerns. J. Adv. Transp. 2017, 2017, 6350562. [Google Scholar] [CrossRef] [Scilit]
- Bian, J.; Zhang, G.; Zhou, G. Manufacturer vs. Consumer Subsidy with Green Technology Investment and Environmental Concern. Eur. J. Oper. Res. 2020, 287, 832–843. [Google Scholar] [CrossRef] [Scilit]
- Jung, S.H.; Feng, T. Government subsidies for green technology development under uncertainty. Eur. J. Oper. Res. 2020, 286, 726–739. [Google Scholar] [CrossRef] [Scilit]
- Zhang, X.; Chen, T.; Shen, C. Green investment choice in a duopoly market with quality competition. J. Clean. Prod. 2020, 276, 124032. [Google Scholar] [CrossRef] [Scilit]
- Waltho, C.; Elhedhli, S.; Gzara, F. Green supply chain network design: A review focused on policy adoption and emission quantification. Int. J. Prod. Econ. 2019, 208, 305–318. [Google Scholar] [CrossRef] [Scilit]
- Elshaer, R.; Awad, H. A taxonomic review of metaheuristic algorithms for solving the vehicle routing problem and its variants. Comput. Ind. Eng. 2020, 140, 106242. [Google Scholar] [CrossRef] [Scilit]
- Zhou, X.; Wei, X.; Lin, J.; Tian, X.; Lev, B.; Wang, S. Supply chain management under carbon taxes: A review and bibliometric analysis. Omega 2021, 98, 102295. [Google Scholar] [CrossRef] [Scilit]
- Joshi, S. A review on sustainable supply chain network design: Dimensions, paradigms, concepts, framework and future directions. Sustain. Oper. Comput. 2022, 3, 136–148. [Google Scholar] [CrossRef] [Scilit]
- Zhang, D.; Yang, S.; Li, S.; Fan, J.; Ji, B. Integrated Optimization of the Location–Inventory Problem of Maintenance Component Distribution for High-Speed Railway Operations. Sustainability 2020, 12, 5447. [Google Scholar] [CrossRef] [Scilit]
- Zhang, Y.; Qi, M.; Miao, L.; Liu, E. Hybrid metaheuristic solutions to inventory location routing problem. Transp. Res. Part E Logist. Transp. Rev. 2014, 70, 305–323. [Google Scholar] [CrossRef] [Scilit]
- Hiassat, A.; Diabat, A.; Rahwan, I. A genetic algorithm approach for location-inventory-routing problem with perishable products. J. Manuf. Syst. 2017, 42, 93–103. [Google Scholar] [CrossRef] [Scilit]
- Martin, F.; Hemmelmayr, V.C.; Wakolbinger, T. Integrated express shipment service network design with customer choice and endogenous delivery time restrictions. Eur. J. Oper. Res. 2021, 294, 590–603. [Google Scholar] [CrossRef] [Scilit]
- Biuki, M.; Kazemi, A.; Alinezhad, A. An integrated location-routing-inventory model for sustainable design of a perishable products supply chain network. J. Clean. Prod. 2020, 260, 120842. [Google Scholar] [CrossRef] [Scilit]
- Ge, L.; Liu, J.; Wang, B.; Zhou, Y.; Yan, J.; Wang, M. Improved adaptive gray wolf genetic algorithm for photovoltaic intelligent edge terminal optimal configuration. Comput. Electr. Eng. 2021, 95, 107394. [Google Scholar] [CrossRef] [Scilit]
- Zhang, J.; Xing, L. An improved genetic algorithm for the integrated satellite imaging and data transmission scheduling problem. Comput. Oper. Res. 2022, 139, 105626. [Google Scholar] [CrossRef] [Scilit]

Disclaimer/Publisher’s Note: The statements, opinions and data contained in all publications are solely those of the individual author(s) and contributor(s) and not of MDPI and/or the editor(s). MDPI and/or the editor(s) disclaim responsibility for any injury to people or property resulting from any ideas, methods, instructions or products referred to in the content. |
© 2023 by the authors. Licensee MDPI, Basel, Switzerland. This article is an open access article distributed under the terms and conditions of the Creative Commons Attribution (CC BY) license (https://creativecommons.org/licenses/by/4.0/).