


Abstract
Life cycle assessment (LCA) is a scientific method for evaluating the environmental impact of products. Standards provide a general framework for conducting an LCA study and calculation rules specifically for buildings. The challenge is to design energy-efficient buildings that have a low environmental impact, reasonable costs, and high thermal comfort as these are usually conflicting aspects. Efficient mathematical optimisation algorithms can be applied to such engineering problems. In this paper, a framework for automated optimisation is described, and it is applied to a multi-story residential building case study in two locations, Portugal and Hungary. The objectives are to minimise the life cycle environmental impacts and costs. The results indicate that optimum solutions are found at a higher cost but lower global warming potential for Portugal than for Hungary. Optimum solutions have walls with a thermal transmittance in the intervals of 0.29–0.39 and 0.06–0.19 W/m2K for Portugal and Hungary, respectively. Multi-objective optimisation algorithms can be successfully applied to find solutions with low environmental impact and an eco-efficient thermal envelope.
1. Introduction
The construction and retrofit of buildings can cause substantial environmental impacts [1] due to their significant consumption of energy (40%) and materials and energy-related greenhouse gas emissions (36%; [2]).
The potential environmental impact caused by buildings can be evaluated with the life cycle assessment (LCA) method. LCA can help compare design alternatives or find environmental hotspots over their life cycle, from the production of materials and throughout the use phase to end-of-life [3]. Shifting the focus from the operation of buildings to their full life cycles is important as the significance of embodied impacts is growing with stricter energy regulations and more complex building systems [4]. Similarly, a full life cycle should be considered when assessing the economic viability of design options with the life cycle costing (LCC) method.
Optimisation algorithms are applied in an increasing number in research to assist the design of sustainable buildings [5,6,7]. These algorithms can evaluate a very large number of design alternatives and can automatically find the solutions that are optimal for a chosen objective function. In the literature, objectives are, for example, the minimisation of energy use [8,9] and/or costs [10,11,12,13] while providing high thermal comfort in buildings. The number of research papers focusing on the minimisation of life cycle environmental impact is still limited but rapidly growing [14,15,16].
Both environmental impact and costs depend on factors that may vary from country to country, even within the European Union. Embodied impacts mostly depend on the material use and on their availability at the construction site. Local and imported materials, therefore, show significant differences in embodied impacts, considering their transport distances. Röck et al. [17] collected 238 case studies and concluded that operational and embodied emissions highly depend on climatic and socio-economic conditions. Construction costs are highly dependent on labour costs, which vary significantly across EU member states [18]. Operational impacts and costs are primarily determined by operational energy use. The latter depends on climatic conditions, which not only result in reduced or increased heating and cooling needs but also in a shift between the dominance of heating or cooling. A reduced energy demand indirectly causes a higher share of embodied impacts. Lavagna et al. developed benchmarks for the environmental impact of European housing stock and showed the effect of different space heating needs, depending on the climate [19]. The environmental impact of energy use also depends on the source used; for example, there are significant differences between countries in the composition of the electricity mix and the share of renewables. The energy price for household consumers is also influenced by local strategic policy-related decisions and by the availability of energy sources. All these considerations influence the optimal solutions in terms of absolute environmental impacts and costs as well as in the trade-off between environmentally optimal and cost-optimal solutions.
This research has two main objectives. The first objective is to show the applicability of multi-objective optimisation techniques for designing sustainable and energy-efficient buildings. The second objective is to test how regional differences influence the range of optimum solutions. For this purpose, an innovative optimisation framework was developed and integrated into a common platform. This framework is capable of parametric building modelling, dynamic simulation, life cycle assessment, life cycle costing, and the optimisation of building variables. Furthermore, specific statistical metrics have been developed that allow for the comprehensive evaluation of the full range of Pareto-optimal solutions in a multi-objective optimisation space. Two locations for a case study building are analysed: Portugal and Hungary. Hungary has a continental climate with warm summers and cold winters, while the climate of Portugal is temperate Mediterranean with mild winters and warm summers. Portugal had ca. 40% higher GDP per capita in 2019 than Hungary [20], and labour costs are about 30% higher in the construction sector [18]. Additionally, the price of electricity and natural gas is about twice as high in Portugal as in Hungary. The share of renewables in the energy mix in Portugal was more than 30% in 2019, while in Hungary, it was about 12% [21]. Electricity production in Portugal has a high share of hydro and wind power [22], while Hungary relies mostly on fossil and nuclear electricity sources [23].
In this paper, the following questions are analysed:
- -
- How much do the total life cycle CO2 emissions, expressed as global warming potential (GWP), and LCC, depend on local economic and climatic conditions?
- -
- How much is the improvement potential in terms of GWP and LCC in a different climate and for different construction practices?
- -
- To what extent does the trade-off between GWP and LCC change in another local context?
The paper is organised in the following sections: the optimisation framework and the scope of the study are presented in the Material and Methods section. This section also describes the energy modelling parameters and environmental and cost data. Section 3 describe the results achieved, analysing in detail the optimal solutions identified. The next section discusses the main similarities and differences found in the results for the two locations, Portugal and Hungary, and their causes. The paper ends with a summary of the main conclusions reached.
2. Materials and Methods
2.1. Optimisation Framework
This research applies a modular computing framework described by Kiss and Szalay [24]. This framework has been further developed to enable dynamic energy simulation as well as LCC calculations; it combines existing tools and new modules for automatic building optimisation.
The aim of this framework is to provide automated optimisation to minimise life cycle environmental impact and LCC of a building design and valuable guidance on how to achieve it. The core of the framework is the parametric building data model that incorporates all necessary information for an energy simulation (construction materials, assemblies, geometry, HVAC systems) and links to additional background data on the cost and environmental impact. Optimisation variables are translated into design parameters linked to the model. The preparation of the model, the parameters’ definition, and the datasets comprise the setup phase of the workflow.
In the optimisation phase, the objective values of the optimisation (environmental impact and LCC of the building design) are calculated based on the model and using specific design parameter settings. The results serve as input to the optimisation algorithm, and the algorithm achieves progress by modifying the design parameters (as optimisation variables). The new model is recreated based on the modified design parameter values, and the loop continues until a certain stop criterion (e.g., number of loops) is met. During the optimisation process, the parameter and objective values, as well as additional result data, are saved to a database.
In the third step, the various visualisations and data analysis tools are used to evaluate the results of the optimisation. This includes the quantification of the improvement (in terms of environmental impact and cost) achieved through the optimisation as well as the corresponding design parameters.
The modularity of the framework is reflected by the integration with existing software tools for specific steps of the calculations such as DesignBuilder [25] and EnergyPlus [26] for the energy simulation, OpenLCA [27] for the preparation of environmental impact data, and Jupyter [28] with Pandas [29] and Matplotlib [30] for the results’ analysis. All other components are self-developed using the Python [31] programming language.
2.2. Case Study Building
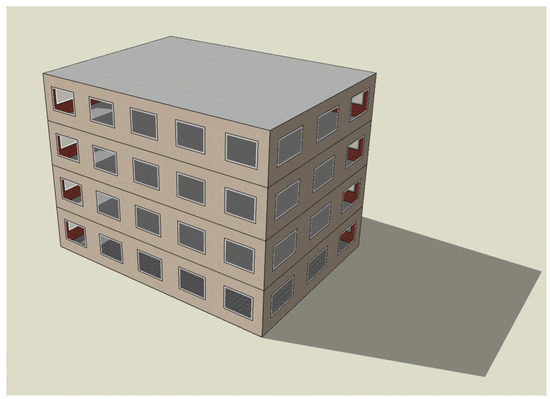
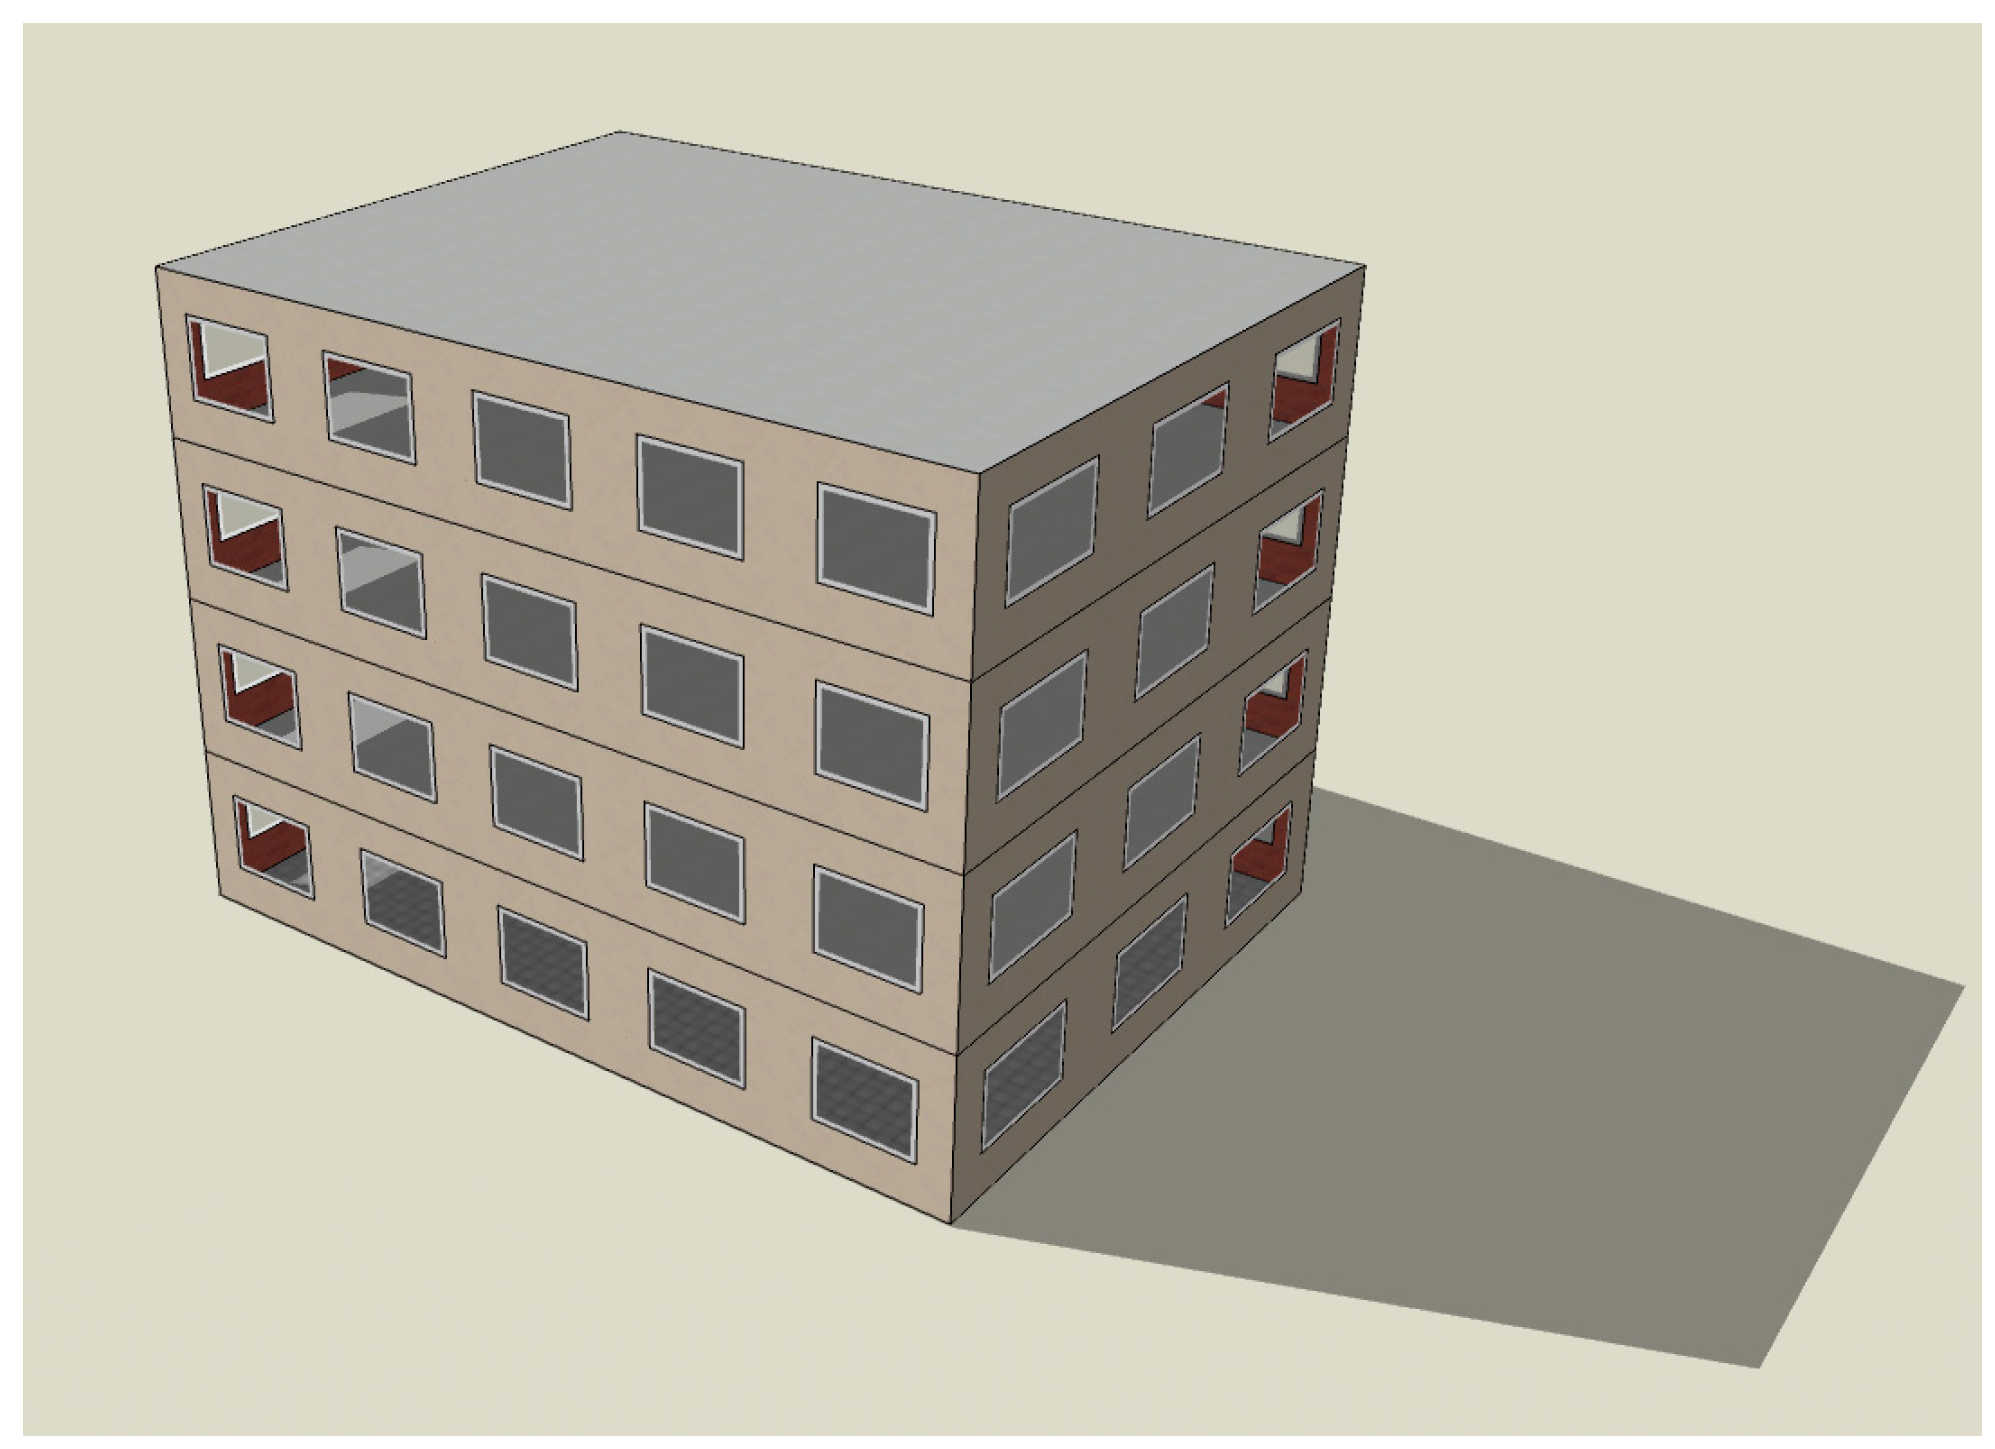
The case study building is a four-storey rectangular apartment building with an area of 192 m2 on each floor and a headroom of 3 m (Figure 1). The building elements and building service systems have been selected so that they represent typical construction systems and are applicable in both countries. The material composition of the buildings’ elements is in the following list (from inside to outside and bottom to top), and the material properties are included in Table A1 and Table A2.
Figure 1.
Illustration of the building model.
External walls (load-bearing): 1 cm plaster + 30 cm ceramic hollow block + 1.5 cm plaster + adhesive + insulation with variable thickness + cover coat (External Thermal Insulation Composite System—ETICS);
- Internal partitions: 1 cm plaster + 10 cm ceramic hollow block + 1 cm plaster;
- Internal slabs: 1 cm plaster + 20 cm reinforced concrete + 4 cm sound insulation + PE foil + 6 cm screed + adhesive + ceramic tiles;
- Flat roof: 1 cm plaster + 20 cm reinforced concrete slab + vapour barrier + insulation with variable thickness + bituminous waterproofing membrane;
- Slab-on-ground: 15 cm hardcore + 10 cm concrete + bituminous waterproofing + insulation + PE foil + 6 cm screed + adhesive + ceramic tiles.
In the model, only the building elements that have a direct or indirect effect on operational energy demand were modelled as these influence the optimisation results (e.g., partition walls and internal slabs were included, but foundations are not considered).
For space heating, a gas boiler was applied with an efficiency of 0.9, and, for cooling, a heat pump with a seasonal efficiency of 2.8 was considered. Auxiliary electricity is calculated as a percentage of the net demand. Distribution and storage losses are omitted in the model. No mechanical ventilation is assumed.
2.3. Optimisation Parameters
The optimisation has two objective functions: (1) to minimise the life cycle environmental impact of the building, expressed in terms of GWP, and (2) to minimise the LCC of the building over a time period of 50 years.
The optimisation algorithm changes the variables to find the best solutions. Variables include the properties of the building envelope that have an influence on both the embodied and operational impacts and costs: the window-to-wall ratio on each façade, the type of glazing and window frame, the thickness and type of insulation on the wall and roof and in the slab-on-ground, with ranges according to Table 1. These ranges also include extreme values that are not realistic in practice but help find the theoretical optima. A moveable horizontal aluminium blind is considered an option for the windows as a separate variable on each façade. Variables can be classified as continuous or discrete. In this case, continuous variables were discretised by defining a sufficiently small step size (1% for fenestration ratio and 1 cm for insulation thickness).
Table 1.
Design parameters used as variables for the optimisation, their limits, and values representing the BAU case in both locations.
For the optimisation, the NSGA-II [32] genetic algorithm was used. This is a stochastic population-based algorithm, one of the most frequently used algorithms for building performance optimisation [33]. The settings were as follows:
- Population size: 100;
- Max. population number: 30 in the single-objective and 50 in the multi-objective optimisation;
- Crossover probability: 0.6;
- Mutation probability: 0.2;
- Number of evaluations: 6000 in the single-objective and 10,000 in the multi-objective optimisation.
In addition to the optimisation runs, a Monte Carlo simulation was also performed to define the LCA and LCC of the ‘business as usual’ (BAU) case for new buildings. This will be used as a reference to quantify the improvement potential that can be achieved by the optimisation algorithm. The design parameter ranges are defined in accordance with the current practice and considering the energy regulations in force [34,35,36,37]. Insulation thickness was selected so that U value requirements are fulfilled: 0.50 W/m2K for vertical elements and 0.40 W/m2K for horizontal elements in Portugal, and 0.24 W/m2K for external walls and 0.17 W/m2K for flat roofs in Hungary. The most common material used were selected based on consultation with local experts. The design parameter limits and the construction options in the BAU case are summarised in Table 1.
2.4. Climate Scenarios—Budapest and Lisbon
The climate of Hungary can be classified as a warm summer continental climate (Dfb), while the Portuguese climate is temperate Mediterranean with dry summers, being warm (Csb) in the north of the country and hot (Csa) in the south (Köppen-Geiger climate classification). The weather file for Budapest (Lat: 47.43; Lon: 19.182) and Lisbon (Lat: 38.714, Lon: −9.138) was downloaded from the TMY tool of the PVGIS webpage [38].
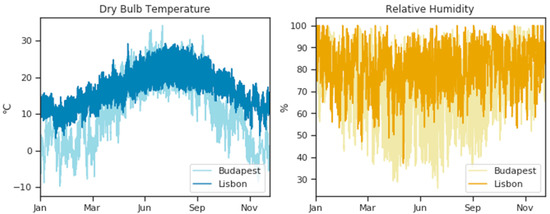
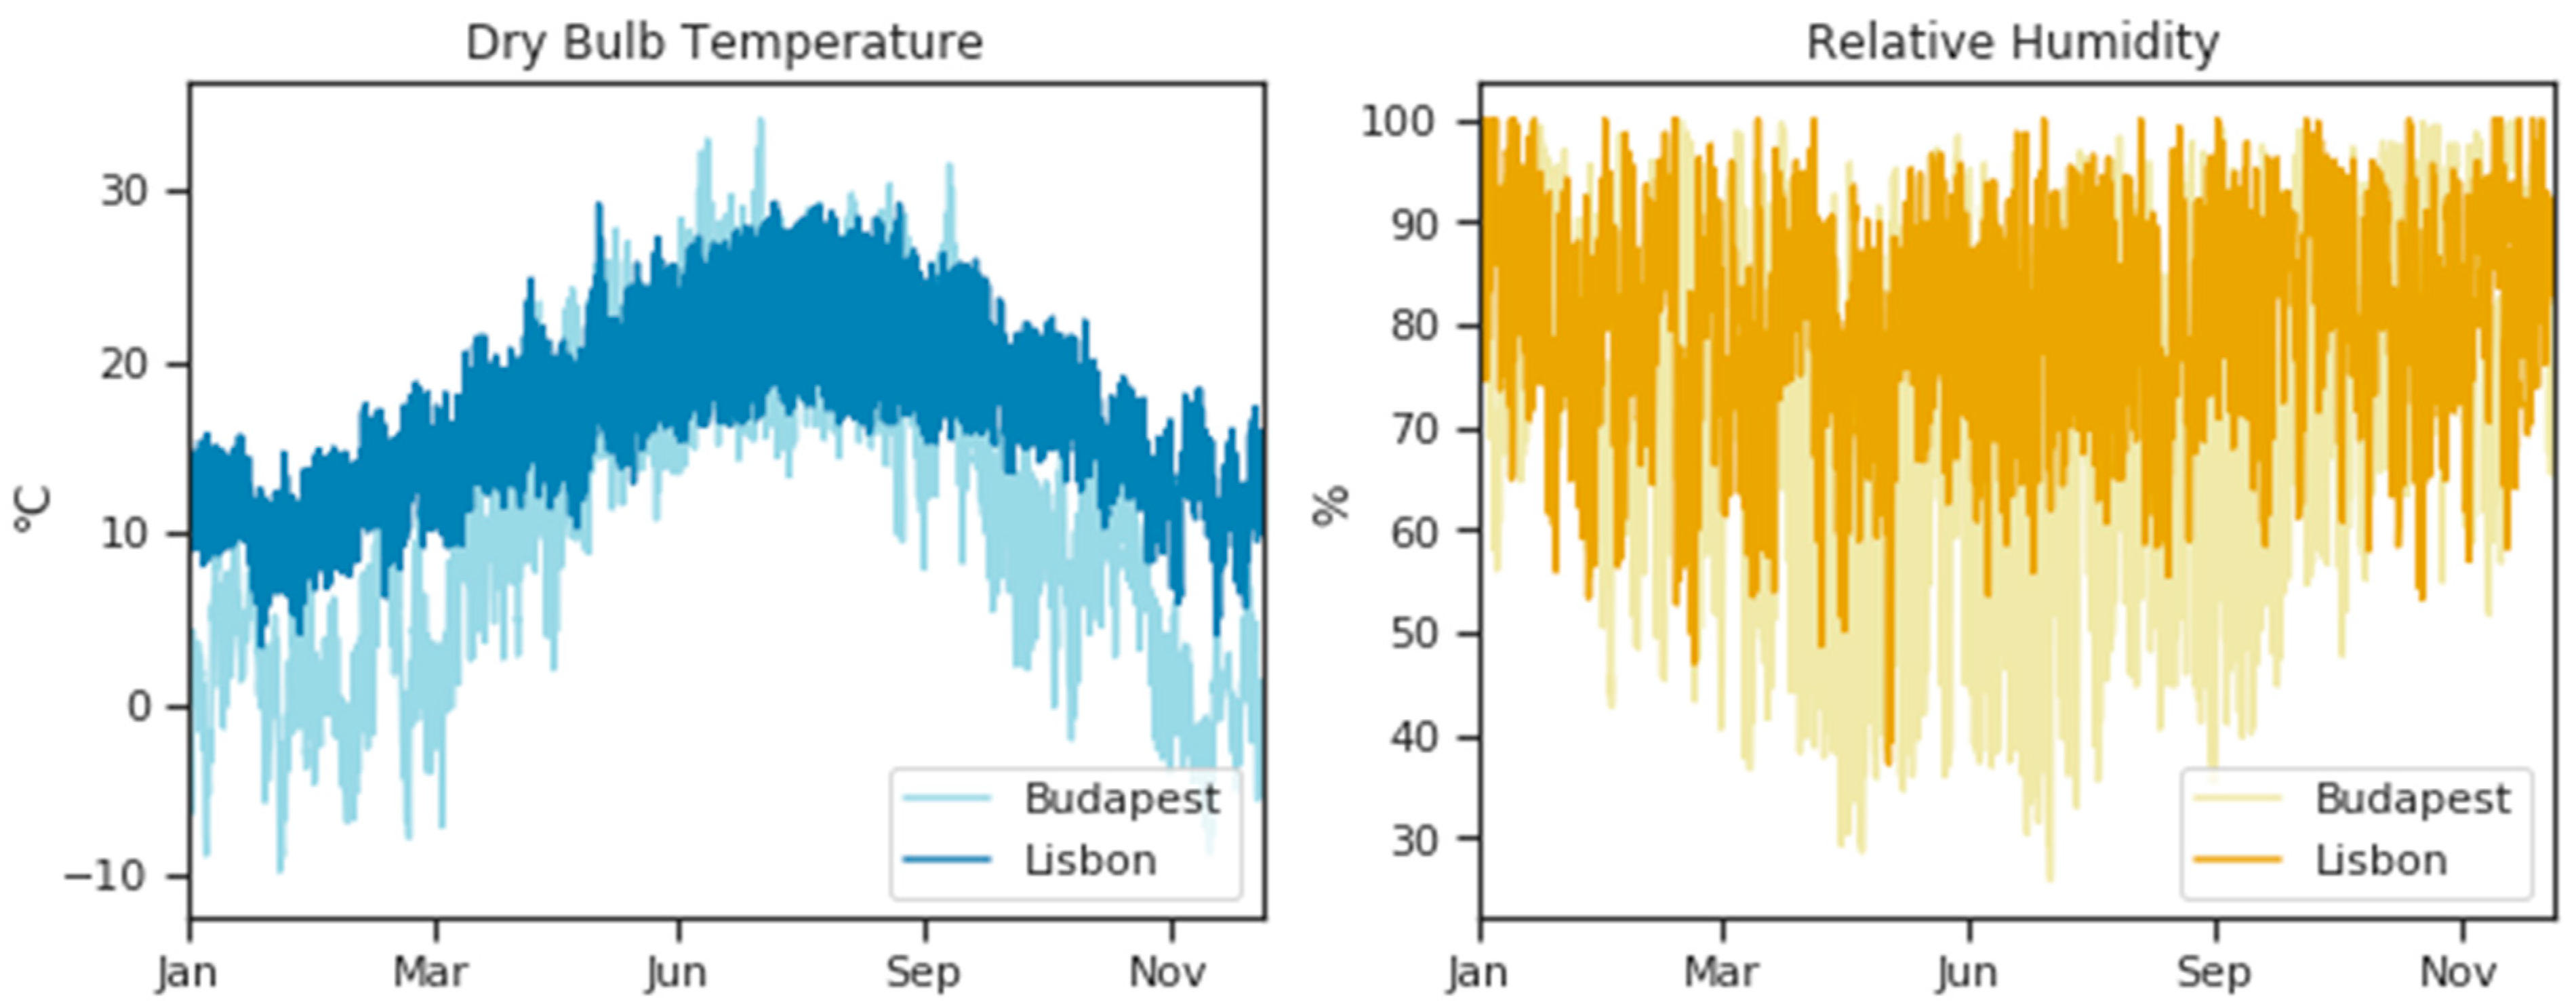
The comparison of climatic conditions in the two locations in terms of temperature and humidity is shown in Figure 2. Budapest has colder winters than Lisbon; the heating degree days are 2696 vs. 1071 (base 18 °C). The temperature in summer is very similar in the two locations; the mean outdoor temperature is 21.2 °C vs. 21.7 °C in the cooling season. At the same time, relative humidity is high throughout the entire year in Lisbon, while, in Budapest, it drops in the summer period. The cold winter implies higher heating demand in Hungary, but cooling demand is expected to be somewhat higher in Portugal due to the hot and humid summer period.
Figure 2.
Comparison of climatic conditions of Portugal and Hungary according to the weather files used in the simulations.
2.5. Energy Calculation Method
The operational energy demand was calculated with the hourly dynamic energy simulation tool EnergyPlus (version 8.9.0 [26]) and DesignBuilder (version 6.1.0 [25]). Space heating, cooling, and lighting were considered. User-dependent end-uses such as domestic hot water and appliances were excluded from the analysis as they have no influence on the optimisation [39,40].
Each floor was modelled as a single zone as this delivers sufficiently accurate results with acceptable simulation time. The thermal mass of internal partition walls was considered. For the two locations, the local climate file was used but user-related settings were harmonised to ensure the comparability of the results. Space heating was set to 20 °C, with a set-back temperature of 16 °C during the night. The cooling setpoint was 26 °C during the day, and natural cooling was assumed at night. The main assumptions were a fixed 4.7 W/m2 value for internal gains, including occupancy and appliances, and 0.5 1/h air change rate. For the summer period’s natural cooling, an increased air change of 4.0 1/h was assumed when conditions were favourable, i.e., internal temperature exceeds 23 °C, outdoor temperature is below 25 °C, and outdoor temperature is at least 2 °C cooler than the indoor temperature. For lighting, efficient LED lighting was assumed with 1 W/m2 power density and control according to daylight availability. Shading operated above an incident solar radiation of 300 W/m2. Thermal bridges were neglected in the calculation. External shading by neighbouring buildings or trees was not considered.
2.6. Environmental Assessment
Environmental impacts were calculated using the LCA method in accordance with the standards [41,42,43]:
where EPi is the vector containing the indicator values of component i in the building; ai is the vector containing the gross amounts of products and services used in component i; M is the matrix containing the environmental indicator values per unit used in component i.
The impact is calculated for each life cycle stage. The functional equivalent is the building for a study period of 50 years. Environmental data can be taken from generic databases or environmental product declarations (EPD). The number of EPDs is still limited in both countries, although a number of site-specific studies have been completed by the authors in Portugal [44,45,46,47]. For the sake of consistency, the environmental impact was calculated based on the Ecoinvent v3.6 cut-off database, with contextualisation for the Hungarian and Portuguese markets. The electricity and natural gas datasets were changed to the specific country datasets for materials produced locally. Cutting waste was considered in A4. Material transport distances to the construction site in A5 were adjusted to the local context depending on the number of factories in the countries.
In general, no replacement of the materials was assumed except for waterproofing on the roof after 15 years, plaster after 30 years, and windows after 40 years. For waste treatment, standard country-specific Ecoinvent data was considered for both countries.
The CML 2001 [48] baseline method was applied to calculate the GWP.
2.7. Cost Assessment
LCC, the present value of the total costs for investment, replacement, operation, and disposal, was calculated according to EU guidelines [49], referred to the starting year, and expressed as the present value:
where τ is the calculation period; CI is the initial investment costs for measure or set of measures j; Ca,i (j) is the annual cost during year i for measure or set of measures j; Vf,τ (j) is the residual value of measure or set of measures j at the end of the calculation period (discounted to the starting year); and Rd (i) is the discount factor for year i based on discount rate r.
For Hungary, the costs were collected from a national guide based on up-to-date average market prices, including material and installation costs ([50]. Most of the cost datasets for the Portuguese case were collected from several research studies [44,51], construction firms, market surveys and building material suppliers, and reference national documents [52]. Further data were collected from a construction cost estimation website [53] (detailed values in Table A3).
Energy prices and labour costs were collected from Eurostat [18,54,55]. Consumer prices included local VAT, expressed in EUR. A discount rate of 3% and an energy price increase of 3% was applied. The reference study period is 50 years, the same as for the LCA calculations.
Table 2 shows the comparison of some building-related cost indicators of Portugal and Hungary. In 2019, hourly labour costs in the construction sector were 33% higher in Portugal than in Hungary. Natural gas and electricity prices for household consumers were about twice as high in Portugal as in Hungary. While the former affects investment costs, the latter influences the operational costs of the building.
Table 2.
Comparison of labour costs in the construction sector [18] and household natural gas [54] and electricity prices [55] in Portugal and Hungary.
3. Results
The objective of the optimisation is to minimise both life cycle GWP and LCC. One multi-objective optimisation, with a limit of 10,000 function evaluations, and two single-objective optimisations (for each of the objectives separately), with a limit of 6000 function evaluations each, as well as a Monte-Carlo simulation based on the BAU case, with a limit of 5000 evaluations, were performed for the two countries.
3.1. Comparison of the Environmental and Cost Data of Insulation Materials
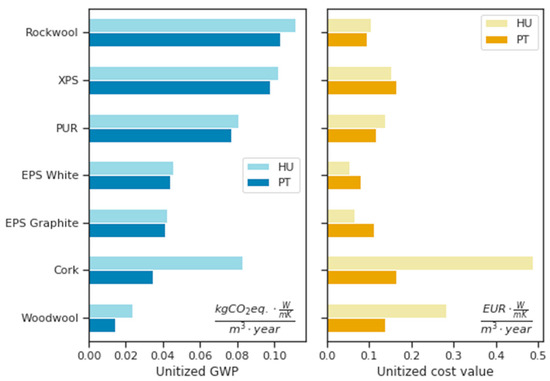
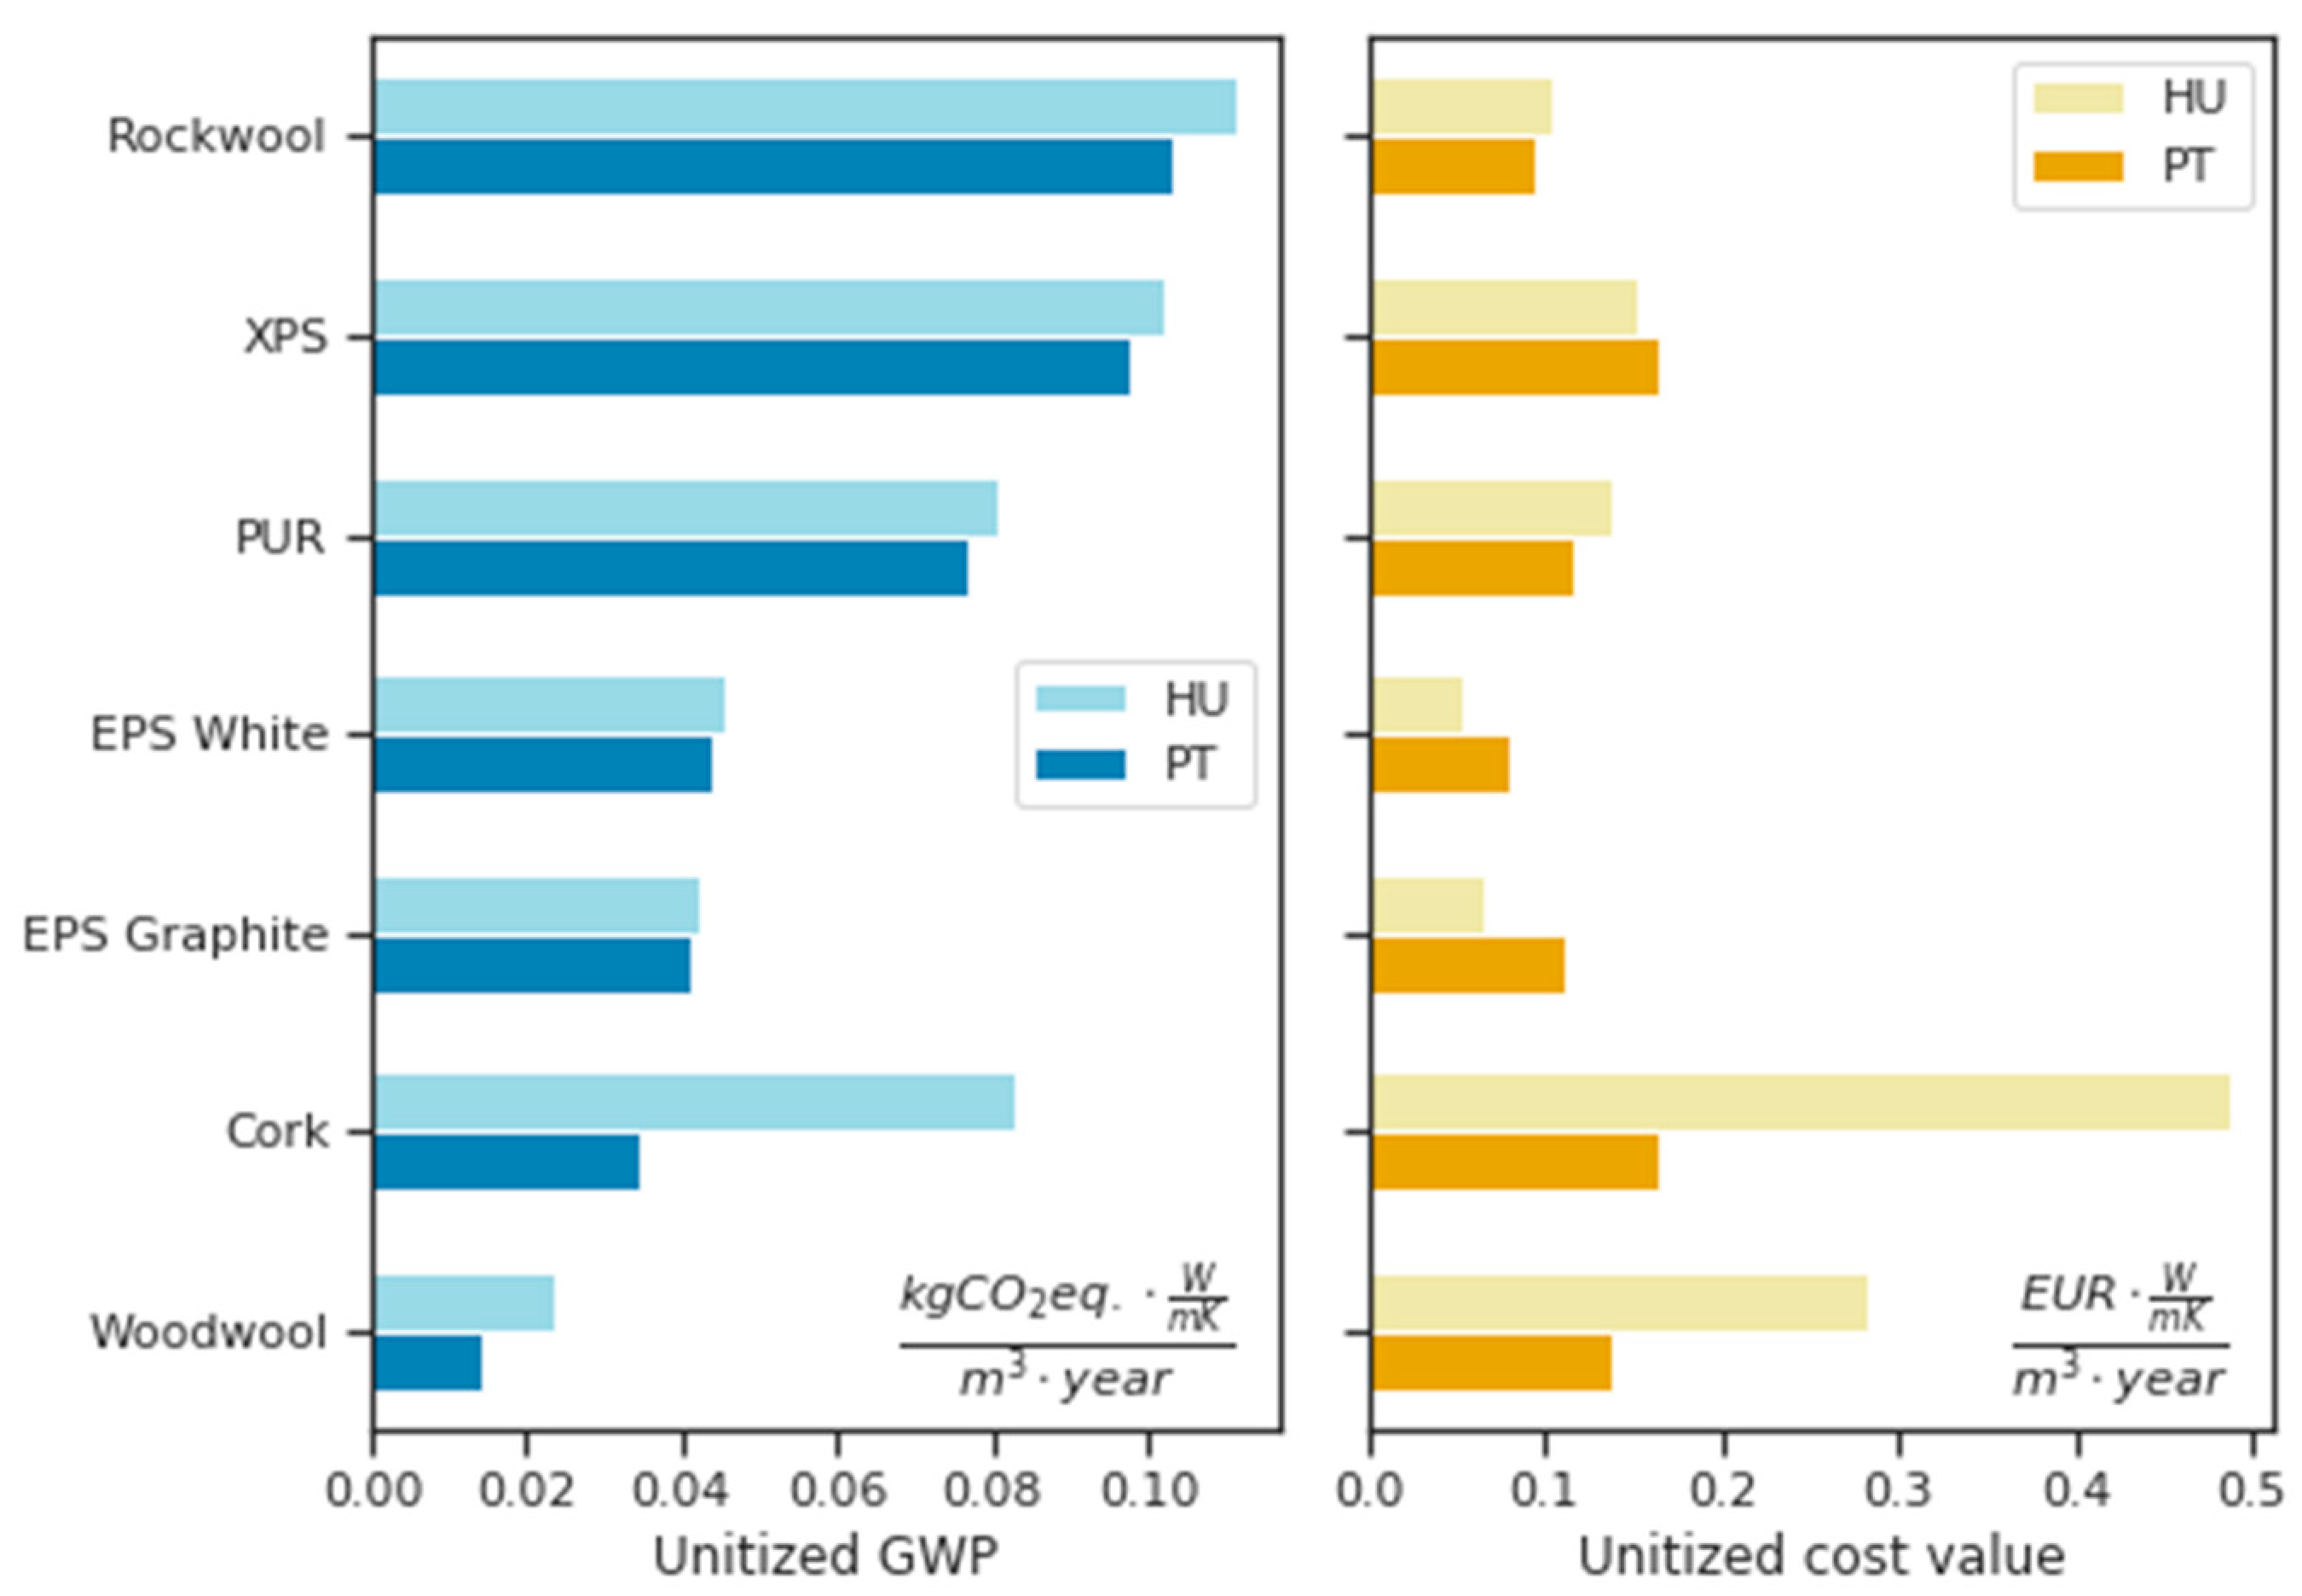
In a preliminary analysis, only the environmental impact and cost of wall insulation materials in the ETICS were compared for the two locations to check whether any material is expected to dominate the other materials in one or both objectives (Figure 3). The unitised GWP and cost have been calculated for a functional unit of 1 m2 of wall surface, with a thermal resistance of 1 m2K/W, for one year.
Figure 3.
Comparison of unitised GWP and material cost values of wall insulation material options in Hungary and Portugal.
Most of the materials have very similar GWP values, although they are somewhat lower in the Portuguese case. This can be explained by the lower emission rates of the energy used in Portugal to produce these materials. The only exception is cork (insulation corkboard or ICB) that has a very low impact in Portugal but the third-highest impact in Hungary (biogenic carbon is considered with a 0–0 approach, whereas carbon uptake and the release of bio-based materials are included with a 0 value) [56]. Although the production of this insulation material is very environmental-friendly, it is only produced in Portugal. Therefore, transport distances make the impacts of this material much less reasonable in Hungary. Due to the same reason, the cost of ICB is also extremely high in Hungary compared to other insulation materials, and it is expected that this material will dominate in the optimisation. The same problem occurs in the case of wood wool, but as the transport distances are much lower (the materials are produced, for example, in Austria), the final GWP value still keeps it as the best performing material, although at a relatively high cost. The cost of the other insulation materials is similar in Portugal and Hungary. White and graphite EPS seem to be a good trade-off between GWP and cost since they have relatively low values in terms of both indicators.
3.2. Description of the Pareto Front
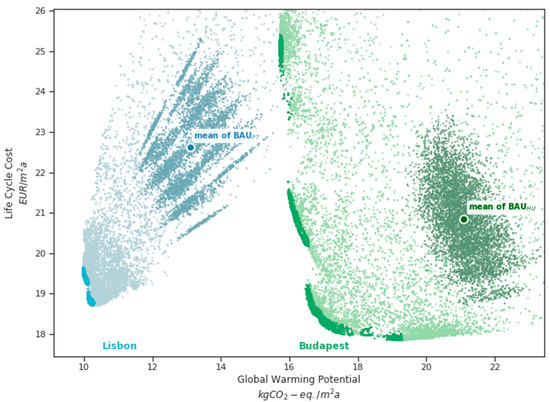
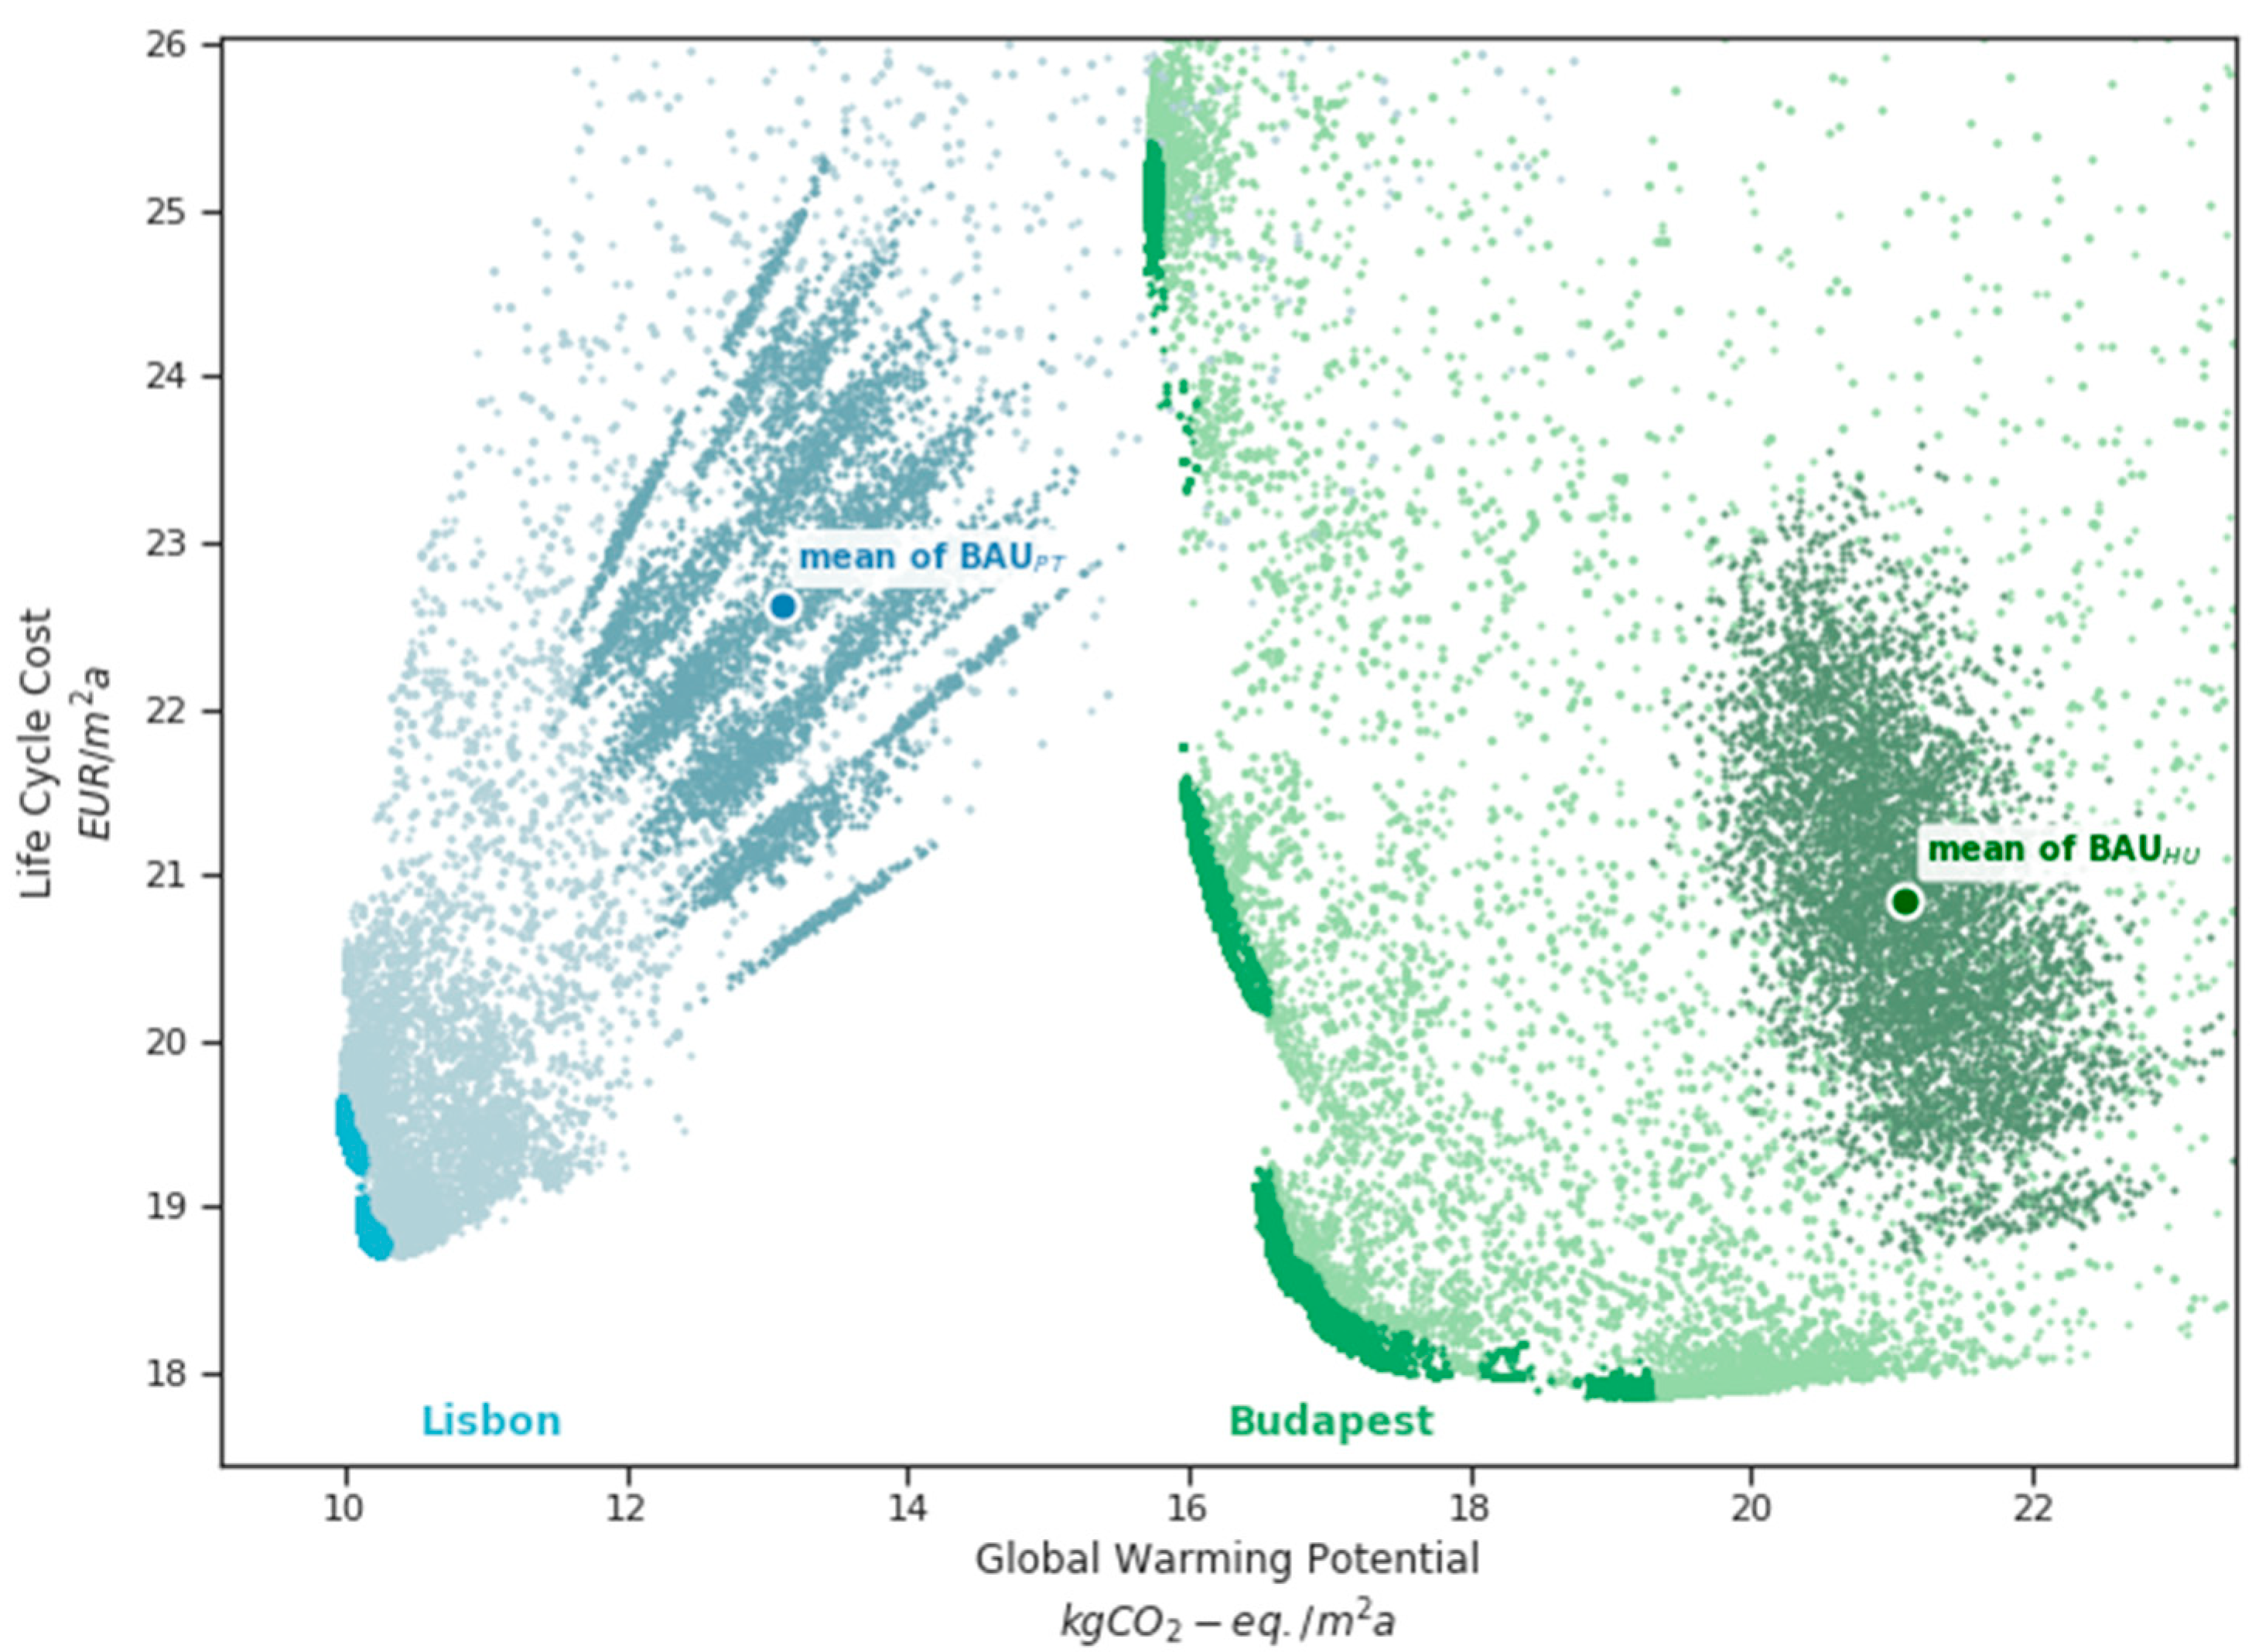
Figure 4 shows the results of the two sets of optimisations in the objective space, with quasi-optimal solutions emphasised by saturated colour and the BAU cases by a darker colour in both locations. Comparing the mean of the BAU cases, LCC is 8.5% higher, while GWP is 37.8% lower in Portugal than in Hungary. Portugal’s mean GWP is even lower than the value that can be achieved with optimisation in the Hungarian context. This difference may be explained by the operational final energy demand being almost half in Lisbon (19.3 kWh/m2a) of what it is in Budapest (39.8 kWh/m2a), on average. On the contrary, the costs of energy and installation are higher in Portugal, which increases the LCC.
Figure 4.
Results of the optimisation as well as the BAU cases in the Hungarian and Portuguese contexts (Pareto front and near-optimal solutions depicted by saturated colours).
Almost the same difference can be observed within the optimised solutions in terms of GWP, where the mean of the quasi-optimal solutions is 40% lower in Portugal than in Hungary. The mean LCC, on the other hand, is 6.1% lower in the Portuguese case than in the Hungarian case, contrary to the BAU case.
We have invented some new matrices for describing the Pareto front (Table 3). The Improvement Potential (IP) describes how much the objective values improve with the optimisation compared to a reference, which is defined here as the mean of the BAU cases. The relative Improvement Potential (rIP) is expressed in a percentage of the reference. The maximum improvement potential is very similar in both cases (26% and 24% for GWP and 14% and 17% for LCC, for Budapest and Lisbon, respectively). The minimum improvement potential is much closer to the maximum in Lisbon (21% for GWP and 13% for LCC). In terms of the absolute improvement values, in the Hungarian context, more can be achieved in GWP (5.39 kg CO2-eq./m2a against 3.15 kg CO2-eq./m2a in Portugal) but less in LCC (2.98 against 3.90 EUR/m2a) than in the Portuguese context.
Table 3.
Most important indicators of optimisation in the two cases.
For describing the extent of the Pareto front, we introduce the Pareto Spread Indicator (PSI). The PSI can be calculated by the difference between the maximum and minimum objective values of the Pareto front, divided by the maximum improvement potential for the objective. As seen from Figure 4 and Table 3, the PSI of the quasi-optimal solutions is much higher in Hungary (253% for LCC and 67% for GWP) than in Portugal (11% for GWP and 24% for LCC).
Finally, we define the distance-to-ideal point and the trade-off solution. The Ideal Point is the point with an abscissa of GWPmin and an ordinate of LCCmin. The Distance to Ideal point (DI) is the Euclidean distance between any point and the ideal point. A normalisation of the objective values for the calculation of the distance is necessary because the unit of the two objectives is different. Here, is selected for normalisation. The solution with the lowest DI is called the trade-off solution. The trade-off solution has a much lower DImin value in Lisbon, which indicates that it is much closer to the ideal point. This is also reflected in its improvement potential being almost equal to the maximum improvement potential for both GWP and LCC (23% and 17%).
3.3. Optimal Solutions
The optimised solutions have different design parameters, as summarised in Table 4. Variables have been classified into three groups by adapting the naming conventions of [57,58]:
Table 4.
Values taken by the variables within the optimal solutions for the two locations or the indication of neutral/trade-off classification of the variable.
- synergy variables take similar values within all optimal solutions for both objectives. For numerical variables, <5% in standard deviation, and for categorical variables, >80% in occurrence within the optimal solutions, was used as a limit to be classified as a synergy variable;
- trade-off variables take different values depending on the preference between the objectives;
- neutral variables have no effect on the optimal results.
The optimised solutions have a minimal-as-possible fenestration ratio towards the north, west, and east in both Budapest and Lisbon. Therefore, glazing type and shading to these cardinal directions are classified as neutral. The fenestration ratio is an important trade-off variable in the Hungarian case, but an optimal value of 22 ± 2% was found to fit both objectives in the Portuguese case. For glazing, triple glazing is preferred in Budapest, while it is a trade-off variable in Lisbon. Shading is a trade-off variable in Budapest, and it turned out to be unfavourable in Lisbon for both objectives (Table 4, Table 5 and Table 6).
Table 5.
Characteristics of the clusters in the Portuguese case.
Table 6.
Characteristics of the clusters in the Hungarian case.
In Portugal, optimal insulation thickness values were found regardless of the preference between the objectives. An insulation thickness of 13 ± 2 cm on flat roofs and 5 ± 2 cm on external walls were found to be optimal, while floor insulation is not required. Please note that, here, the thickness of the insulation was used as a variable, but later, the U-values will also be calculated. The wood wool insulation material turned out to be optimal for external walls, while roof insulation and window frames are trade-off variables. The minimised floor insulation thickness makes the floor insulation material variable irrelevant; therefore, it is classified as neutral. In the Hungarian case, all the insulation variables are classified as trade-off variables as their value depends on the objective preference.
In Portugal, the material used in the building determines the position of the optimal solution on the Pareto front. The optimal solutions are divided into two clusters depending on the frame type and on the roof insulation material (Table 5). If there is a high emphasis on GWP in the design process, then wooden frames and cork insulation should be selected, while plastic frames and EPS are favourable for LCC.
In the Hungarian case, the optimal solutions were classified into five clusters depending on the material use and insulation thickness (Table 6). Towards the GWP-optimal end, the insulation thickness is getting extreme (37–64 cm), and materials with a lower environmental impact are preferred (wood wool, wooden frame). The fenestration ratio is large on the southern façade (up to 75%) with shading to reduce the cooling demand. Towards the cost-optimal end, smaller, double-glazed windows are applied without shading and with plastic frames. Insulation thickness is reduced to more conventional values (16–20 cm).
Regarding the share of the life cycle stages in GWP, embodied impacts have the largest contribution in Portugal (81%), which is in accordance with previous studies [59], but they are also significant, although lower, in the Hungarian case (42–60%). In terms of the LCC, installation costs have the highest share (45–46%), followed by production costs (35–36%) in Portugal, while replacement costs have a share of 15%, and operation costs are as low as 4%. In Hungary, the share of production cost is higher (43–57%), especially at the GWP-optimal end due to the increased insulation thickness. On the contrary, installation accounts for only 26–37% as labour is cheaper in Hungary. Operational energy cost only contributes to a small extent (3–8%) to the LCC as the energy price is relatively low in this country.
3.4. Comparison of Energy Performance Characteristics
Most of the design parameters influence the energy performance of the building. As seen in the previous section, the share of operational impact is significantly lower in the Portuguese context. To better understand the relation between the optimal variables and energy performance, energy demand is further evaluated and compared in the two cases. Table 7 summarises the heating, cooling, and lighting energy as well as the U-values of three selected solutions: the GWP-optimal, trade-off, and cost-optimal solutions.
Table 7.
Net heating, cooling, and lighting energy demand and U-values of the GWP-optimal, trade-off, and LCC-optimal solutions for the two cases.
The cost-optimal solutions are the least-insulated ones in both cases. The U-values in the Hungarian case are close to the current practice (roof: 0.20 W/m2K, wall: 0.19 W/m2K, floor: 0.64 W/m2K), however the floor and roof do not comply with the requirements (roof: 0.17 W/m2K, wall: 0.24 W/m2K, floor: 0.3 W/m2K). Thanks to the mild winters in Portugal, the cost-optimal solution has a lower insulation level even though the energy price is about twice as much as in Hungary. The insulation thicknesses correspond to the U-values of 0.31 W/m2K for the roof, 0.39 W/m2K for the wall and 0.96 W/m2K for the floor, which comply with the local requirements of 0.4 W/m2K for horizontal elements and 0.5 W/m2K for vertical elements.
Much larger differences are observed for the trade-off and GWP-optimal solutions. While in Hungary, extreme low U-values are optimal in terms of GWP (0.06 W/m2K for the roof, 0.05 W/m2K for the wall and 0.10 W/m2K for the floor), in the Portuguese case, only a small improvement is observed at the GWP-optimal end of the Pareto front compared to the cost-optimal end (U-values are 0.25 W/m2K for the roof, and 0.29 W/m2K for the wall). In all solutions, floor insulation is not necessary in the Portuguese context.
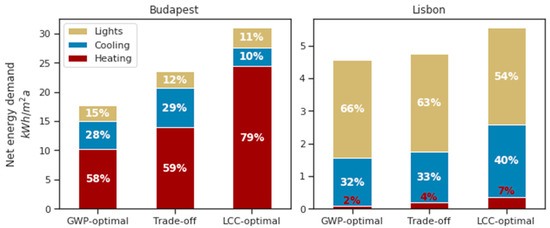
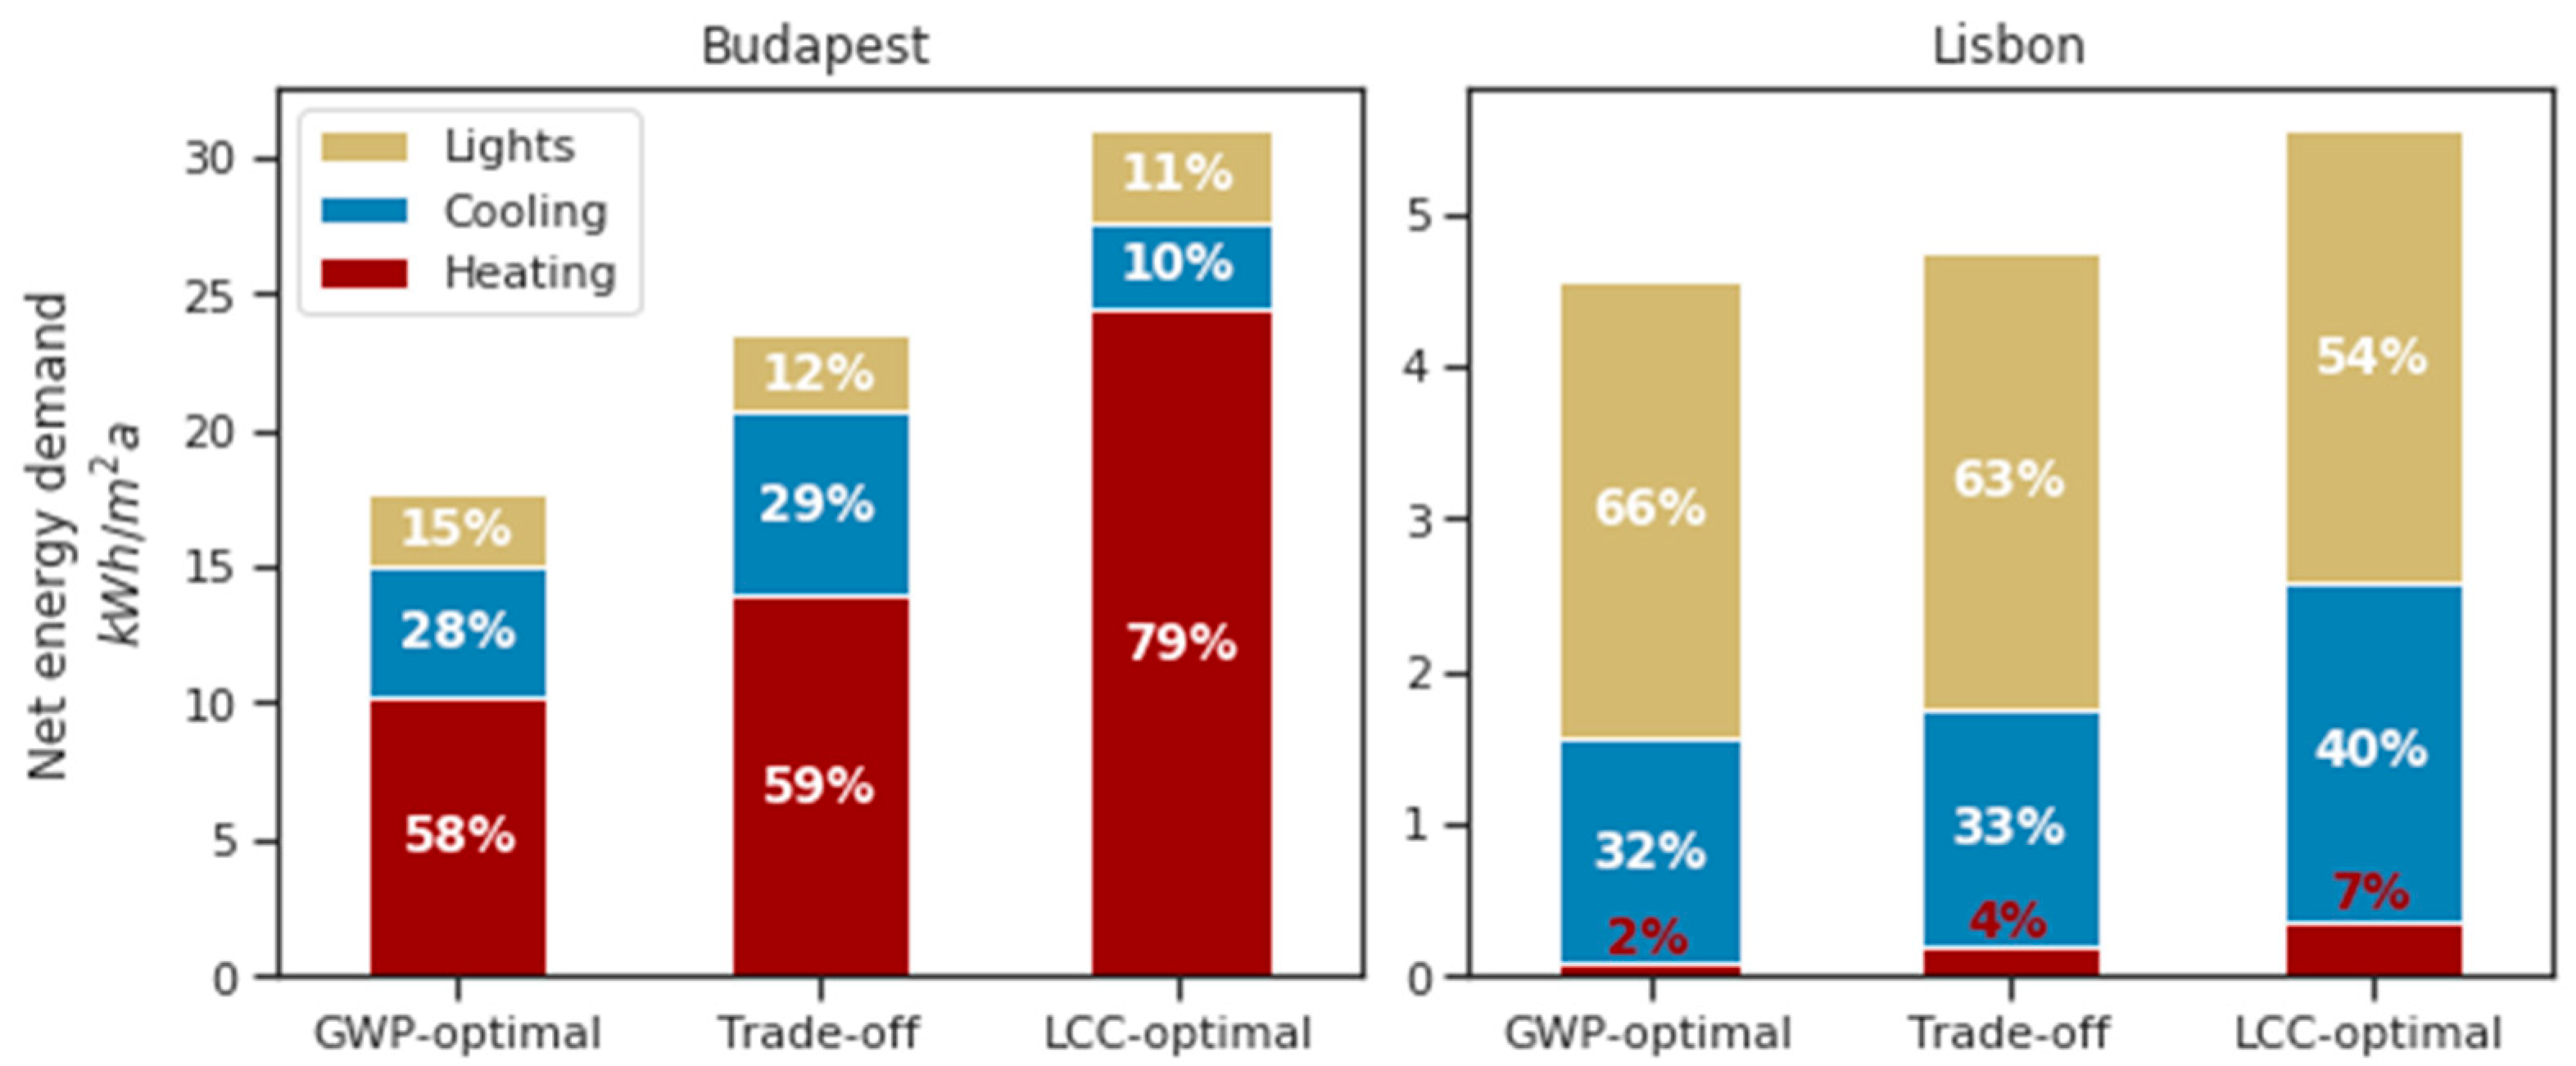
The decomposition of energy demand is significantly different in the two cases. Figure 5 shows the net energy demand by end-uses in the selected solutions, together with their share within the total. Most importantly, the total net energy demand of the optimal solutions is about one magnitude lower in the Portuguese case. While in Budapest, the heating energy demand is dominant, it is almost negligible in Lisbon; the latter was expected since a dynamic energy simulation method was used for a building in Lisbon [60], with fenestration higher than 20% [59]. The share of cooling energy is higher in Lisbon (32–40%) than in Budapest (10–29%), but the absolute values are low in all cases (1.48–2.20 kWh/m2a in Lisbon and 3.20–6.71 kWh/m2a in Budapest).
Figure 5.
Share of end-uses within the net energy demand of the GWP-optimal, trade-off, and LCC-optimal solutions for the two cases. The two figures use different scales on the y-axis because of the large difference between the cases.
Finally, lighting accounts for the highest share of energy demand in the Portuguese case (54–66%), while it has a low share in Hungary (11–15%). Lighting energy demand is less influenced by climatic conditions than the size of the windows. The absolute values are similar and rather low (2.98–3.01 kWh/m2a in Portugal and 2.6–3.39 kWh/m2a in Hungary), but the low cooling and heating energy demand in Portugal makes lighting energy dominant within the optimal solutions.
4. Discussion and Conclusions
In this paper, environmental and economic optimum solutions were sought for two locations with different climatic and economic conditions, Portugal and Hungary. Portugal has mild winters with fewer heating degree days than Hungary and a cleaner electricity mix but higher labour and energy costs. An innovative framework that is capable of automatic building optimisation was developed and applied, with the objective of minimising the environmental impact and costs over the whole life cycle. The variables of the optimisation were the main architectural parameters influencing the energy performance of the building: insulation thickness and type, window ratio and type, and shading.
GWP and LCC were determined for a reference set of typical new buildings (business-as-usual) in the two countries with the help of a Monte Carlo simulation. The geometric and insulation parameters were varied in ranges that are considered to be typical. This innovative approach was proposed by [62] and has the advantage that not only one fixed case study building is considered but a range of solutions. The comparison of the BAU cases showed that, on average, the building-related life cycle GWP is 37.8% lower, while the LCC is 8.5% higher in Portugal than in Hungary.
With the optimisation algorithm, the GWP could be reduced by up to 24% and the LCC by up to 17% in Portugal, with up to 26% and 14% in Hungary, respectively, compared to the BAU set. An important difference between the two locations is that the optimised solutions have a much larger spread in the objective space in the Hungarian case. This means that the trade-off between the objectives is much stronger and the optimised parameters significantly differ, depending on the preference between GWP or LCC. In Portugal, the decision is much more straightforward as the GWP and LCC are less conflicting objectives, and the optimal solutions are similar in terms of design parameters.
Comparing the two locations, we can conclude that, in Lisbon, lower insulation thickness is optimal (Uflat roof = 0.25–0.31 W/m2K, Uwall = 0.29–0.39 W/m2K) than in Budapest (Uflat roof = 0.06–0.2 W/m2K, Uwall = 0.06–0.19 W/m2K, depending on the preference between GWP and LCC). The share of operational impact is lower in the Portuguese case (19%) compared to the Hungarian case (40–58%), which gives an explanation to the lower insulation thickness, as less GWP can be saved with additional insulation thickness by reducing the energy demand on the burden of adding more materials, hence increasing the embodied GWP.
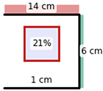
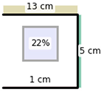
A significant difference is observed in the fenestration ratio on the south-facing façade. While very large windows (75% fenestration ratio) are optimal in Hungary in the case of GWP-preference and smaller ones in the case of LCC (23%), in Portugal, a relatively low 21–22% fenestration ratio is optimal regardless of the preference between GWP and LCC. Window glazing material and the application of shading also varies in the Hungarian case; however, in Portugal, glazing type has less impact on the objective values (due to the small fenestration ratio), and unshaded windows are optimal in any case. Additionally, the cost-optimal fenestration ratio is very similar in the two cases (22% in Budapest and 21% in Lisbon), and the material used is the same (double glazing with plastic frames). In neither case is shading optimal because the small fenestration ratio does not increase the cooling demand too much.
Optimal solutions differ in the material used in both cases depending on the preference between GWP and LCC. LCC-optimal solutions use cheap materials such as white or graphite EPS and plastic window frames, while GWP-optimal solutions use bio-based materials such as wooden window frames and wood wool insulation. In the Portuguese context, the use of cork insulation (ICB) can also be justified in the case of a higher preference of GWP against LCC, but in Hungary, this material is not selected due to the high transport distance and cost.
The share of operational GWP against embodied GWP within the optimised solutions in the Portuguese case is much lower (19%) than in the Hungarian case (40–58%). The very low energy demand explains the dominance of the embodied impact. While in Hungary, heating is the major contributor (with 58–79%) for the net energy demand of the optimised buildings, in Portugal, the lighting energy takes the highest share (54–66%) as heating and cooling demands are negligible.
The analysis of the two cases shows that the total life cycle GWP and costs as well as the optimal parameter values highly depend on the local climatic and economic conditions. Due to the higher heating degree days in Hungary, the reduction of heating energy demand is a more pressing issue, and the optimised insulation thickness is much higher. There is also a large difference in the costs of energy and labour affecting the optimum solutions. The optimisation algorithm successfully tackled regional differences and reached different optimised solutions.
The optimisation resulted in solutions with very low insulation levels for Portugal. In the case of floor construction, even the limit of the parameter was reached, and wall construction also has very thin insulation. This means that even a simple wall solution (e.g., insulating a brick or concrete block without additional ETICS) would be adequate in this climate, but this falls outside the optimisation space. This assumption is further supported by the very low share of heating energy within the total energy demand of the optimised solutions. The high share of lighting energy might require further evaluation and proposes that a daylighting optimisation might be the subject of further research to reduce the environmental impacts of the building.
Future work would focus on the further refinement of the model (for example, a detailed model of lighting) and the extension of the scope of research to other building types and climates.
Author Contributions
Conceptualisation, Z.S. and J.D.S.; methodology, B.K., R.A.S., Z.S. and J.D.S.; software, B.K.; validation, J.D.S. and Z.S.; formal analysis, B.K. and Z.S.; investigation, B.K. and R.A.S.; resources, Z.S. and J.D.S.; data curation, B.K., R.A.S. and J.D.S.; writing—original draft preparation, B.K. and Z.S.; writing—review and editing, J.D.S. and Z.S.; visualisation, B.K.; supervision, Z.S. and J.D.S.; project administration, J.D.S. and Z.S.; funding acquisition, Z.S. and J.D.S. All authors have read and agreed to the published version of the manuscript.
Funding
MooB-Multi-objective life cycle optimisation of sustainable and innovative construction materials and buildings (Project 2018-2.1.15-TÉT-PT-2018-00005) was implemented with the support provided from NRDI (National Research, Development and Innovation) Fund of Hungary and from FCT (Fundação para a Ciência e Tecnologia) Portugal. The research was supported by Project FK 128663, implemented with the support provided from NRDI, financed under the FK_18 funding scheme. The research is part of project no. BME-NVA-02, implemented with the support provided by the Ministry of Innovation and Technology of Hungary from NRDI, financed under the TKP2021 funding scheme. The third author was also financial supported by FCT Portugal, through the PhD scholarship no. PD/BD/135215/2017 in the scope of EcoCoRe Doctoral Programme. This paper relates to ongoing research within the international project of IEA EBC Annex 72.
Institutional Review Board Statement
Not applicable.
Informed Consent Statement
Not applicable.
Data Availability Statement
Not applicable.
Conflicts of Interest
The authors declare no conflict of interest. The funders had no role in the design of the study; in the collection, analyses, or interpretation of data; in the writing of the manuscript, or in the decision to publish the results.
Appendix A
Table A1.
Thermal conductivity, density and specific heat capacity of the applied materials.
Table A2.
Window properties.
Table A3.
Investment costs of the materials and technical systems and energy costs in Hungary and Portugal.
References
- EC. Communication from the European Commission: The European Green Deal. COM (2019) 640; EC: Brussels, Belgium, 2019. [Google Scholar]
- EC. Energy Efficiency—Revision of the Energy Performance of Buildings Directive. 2020. Available online: https://ec.europa.eu/info/law/better-regulation/have-your-say/initiatives/12910-Revision-of-the-Energy-Performance-of-Buildings-Directive-2010-31-EU (accessed on 11 March 2020).
- Dolezal, F.; Dornigg, I.; Wurm, M.; Figl, H. Overview and Main Findings for the Austrian Case Study. Sustainability 2021, 13, 7584. [Google Scholar] [CrossRef] [Scilit]
- Blengini, G.A.; Di Carlo, T. The changing role of life cycle phases, subsystems and materials in the LCA of low energy buildings. Energy Build. 2010, 42, 869–880. [Google Scholar] [CrossRef] [Scilit]
- Evins, R. A review of computational optimisation methods applied to sustainable building design. Renew. Sustain. Energy Rev. 2013, 22, 230–245. [Google Scholar] [CrossRef] [Scilit]
- Kheiri, F. A review on optimization methods applied in energy-efficient building geometry and envelope design. Renew. Sustain. Energy Rev. 2018, 92, 897–920. [Google Scholar] [CrossRef] [Scilit]
- Hashempour, N.; Taherkhani, R.; Mahdikhani, M. Energy performance optimization of existing buildings: A literature review. Sustain. Cities Soc. 2020, 54, 101967. [Google Scholar] [CrossRef] [Scilit]
- Bre, F.; Fachinotti, V.D. A computational multi-objective optimization method to improve energy efficiency and thermal comfort in dwellings. Energy Build. 2017, 154, 283–294. [Google Scholar] [CrossRef] [Scilit]
- Ghaderian, M.; Veysi, F. Multi-objective optimization of energy efficiency and thermal comfort in an existing office building using NSGA-II with fitness approximation: A case study. J. Build. Eng. 2021, 41, 102440. [Google Scholar] [CrossRef] [Scilit]
- Ascione, F.; Bianco, N.; Maria Mauro, G.; Napolitano, D.F. Building envelope design: Multi-objective optimization to minimize energy consumption, global cost and thermal discomfort. Application to different Italian climatic zones. Energy 2019, 174, 359–374. [Google Scholar]
- Marzouk, M.; Azab, S.; Metawie, M. BIM-based approach for optimizing life cycle costs of sustainable buildings. J. Clean. Prod. 2018, 188, 217–226. [Google Scholar] [CrossRef] [Scilit]
- Abdou, N.; Mghouchi, Y.E.L.; Hamdaoui, S.; Asri, N.E.L.; Mouqallid, M. Multi-objective optimization of passive energy efficiency measures for net-zero energy building in Morocco. Build. Environ. 2021, 204, 108141. [Google Scholar] [CrossRef] [Scilit]
- Zhu, N.; Liu, X.; Dong, Q.; Rodriguez, D. Optimization of zero-energy building by multi-criteria optimization method: A case study. J. Build. Eng. 2021, 44, 102969. [Google Scholar] [CrossRef] [Scilit]
- Longo, S.; Montana, F.; Riva Sanseverino, E. A review on optimization and cost-optimal methodologies in low-energy buildings design and environmental considerations. Sustain. Cities Soc. 2019, 45, 87–104. [Google Scholar] [CrossRef] [Scilit]
- Najjar, M.; Figueiredo, K.; Hammad, A.W.A.; Haddad, A. Integrated optimization with building information modeling and life cycle assessment for generating energy efficient buildings. Appl. Energy 2019, 250, 1366–1382. [Google Scholar] [CrossRef] [Scilit]
- Mayer, M.J.; Szilágyi, A.; Gróf, G. Environmental and economic multi-objective optimization of a household level hybrid renewable energy system by genetic algorithm. Appl. Energy 2020, 269, 115058. [Google Scholar] [CrossRef] [Scilit]
- Röck, M.; Ruschi Mendes Saade, M.; Balouktsi, M.; Nygaard, F.; Birgisdottir, H.; Frischknecht, R.; Habert, G.; Lützkendorf, T. Embodied GHG emissions of buildings—The hidden challenge for effective climate change mitigation. Appl. Energy 2019, 258, 114107. [Google Scholar] [CrossRef] [Scilit]
- Eurostat. Labour Costs in the EU; Eurostat: Brussels, Belgium, 2019. [Google Scholar]
- Lavagna, M.; Baldassarri, C.; Campioli, A.; Giorgi, S.; Dalla Valle, A.; Castellani, V.; Sala, S. Benchmarks for environmental impact of housing in Europe: Definition of archetypes and LCA of the residential building stock. Build. Environ. 2018, 145, 260–275. [Google Scholar] [CrossRef] [Scilit]
- Eurostat. Real GDP Per Capita; Eurostat: Brussels, Belgium, 2019. [Google Scholar]
- Eurostat. Share of Energy from Renewable Sources; Eurostat: Brussels, Belgium, 2019. [Google Scholar]
- IEA. Electricity Generation by Source, Portugal 1990–2019; IEA: Amsterdam, The Netherlands, 2019. [Google Scholar]
- IEA. Electricity Generation by Source, Hungary 1990–2019; IEA: Amsterdam, The Netherlands, 2019. [Google Scholar]
- Kiss, B.; Szalay, Z. Modular approach to multi-objective environmental optimization of buildings. Autom. Constr. 2020, 111, 103044. [Google Scholar] [CrossRef] [Scilit]
- DesignBuilder Software Ltd. DesignBuilder; DesignBuilder Software Ltd.: Stroud, UK, 2019. [Google Scholar]
- National Renewable Energy Laboratory. EnergyPlus; National Renewable Energy Laboratory: Golden, CO, USA, 2018.
- GreenDelta GmbH. openLCA; GreenDelta GmbH: Berlin, Germany, 2019. [Google Scholar]
- Project Jupyter. Jupyter. 2020. Available online: https://jupyter.org/ (accessed on 1 March 2021).
- The Pandas Development Team. Pandas-Dev/Pandas: Pandas. 2019. Available online: https://doi.org/10.5281/zenodo.3524604 (accessed on 1 March 2021).
- Hunter, J.D. Matplotlib: A 2D graphics environment. Comput. Sci. Eng. 2007, 9, 90–95. [Google Scholar] [CrossRef] [Scilit]
- Van Rossum, G.; Drake, F.L. Python 3 Reference Manual; CreateSpace: Scotts Valley, CA, USA, 2009; ISBN 1441412697. [Google Scholar]
- Deb, K.; Pratap, A.; Agarwal, S.; Meyarivan, T. A fast and elitist multiobjective genetic algorithm: NSGA-II. IEEE Trans. Evol. Comput. 2002, 6, 182–197. [Google Scholar] [CrossRef] [Scilit]
- Nguyen, A.T.; Reiter, S.; Rigo, P. A review on simulation-based optimization methods applied to building performance analysis. Appl. Energy 2014, 113, 1043–1058. [Google Scholar] [CrossRef] [Scilit]
- Zöld, A.; Csoknyai, T.; Kalmár, F.; Szalay, Z.; Talamon, A. Requirement System of Nearly Zero Energy Buildings Using Renewable Energy; University of Debrecen: Debrecen, Hungary, 2012. (In Hungarian) [Google Scholar]
- TNM TNM 7/2006. (V.24) Hungarian Government Decree on the Energy Performance of Buildings (in Hungarian). 2006. Available online: http://njt.hu/cgi_bin/njt_doc.cgi?docid=101820.352718 (accessed on 1 March 2021).
- Ministério da Economia e do Emprego. Decreto-Lei n.o 118/2013, de 20 de agosto (desempenho energético dos edifícios). Diário Da República 2013, 159, 4988–5005. [Google Scholar]
- Ministério do Ambiente, Ordenamento do Território e Energia, Portaria n.o 379-A/2015 de 22 de outubro. Diário Da República 2015, 207, 1840–1844.
- Joint Research Centre. JRC Photovoltaic Geographical Information System (PVGIS); European Commission: Brussels, Belgium, 2019. [Google Scholar]
- Zöld, A.; Szalay, Z. What is missing from the concept of the new European Building Directive ? Build. Environ. 2007, 42, 1761–1769. [Google Scholar]
- Lützkendorf, T.; Foliente, G.; Balouktsi, M.; Wiberg, A.H. Net-zero buildings: Incorporating embodied impacts. Build. Res. Inf. 2015, 43, 62–81. [Google Scholar] [CrossRef] [Scilit]
- ISO 14040. ISO 14040: 2006 Environmental Management-Life Cycle Assessment-Principles and Framework; ISO: Geneva, Switzerland, 2006. [Google Scholar]
- ISO 14044. ISO 14044: 2006 Environmental Management-Life Cycle Assessment-Requirements and Guidelines; ISO: Geneva, Switzerland, 2006. [Google Scholar]
- EN 15978. Sustainability of Construction Works—Assessment of Environmental Performance of Buildings—Calculation Method; CEN: Brussels, Belgium, 2011. [Google Scholar]
- Gomes, R. Life Cycle Assessment “From Cradle to Cradle” of Building Assemblies-Application to Flat Roofs; Lisbon University: Lisbon, Portugal, 2019. (In Portuguese) [Google Scholar]
- Gomes, R.; Silvestre, J.D.; De Brito, J. Environmental Life Cycle Assessment of Thermal Insulation Tiles for Flat Roofs. Materials 2019, 12, 2595. [Google Scholar] [CrossRef] [Scilit] [PubMed]
- Silvestre, J.D.; Castelo, A.; Silva, J.J.B.C.; Brito, J.; Pinheiro, M.D. Retrofitting a Building’s Envelope: Sustainability Performance of ETICS with ICB or EPS. J. Appl. Sci. 2019, 9, 1285. [Google Scholar] [CrossRef] [Scilit]
- Silvestre, J.D.; Pargana, N.; De Brito, J.; Pinheiro, M.D.; Durão, V. Insulation Cork Boards—Environmental Life Cycle Assessment of an Organic Construction Material. Materials 2016, 9, 394. [Google Scholar] [CrossRef] [Scilit] [PubMed]
- Heijungs, R.; Guinée, J.; Huppes, G.; Lankreijer, R.M.; Haes, H.A.; Wegener Sleeswijk, A.; Ansems, A.M.M.; Eggels, P.G.; van Duin, R.; Goede, H.P. Environmental Life Cycle Assessment of Products—Backgrounds; Centrum voor Milieukunde: Leiden, The Netherlands, 1992; ISBN 90-5191-064-9. [Google Scholar]
- EC Commission Delegated Regulation (EU). No. 244/2012 of 16 January 2012 supplementing Directive 2010/31/EU of the European Parliament and of the Council on the energy performance of buildings by establishing a comparative methodology framework for calculating. Off. J. Eur. Union 2012, 28, 18. [Google Scholar]
- Építésügyi Tájékoztatási Központ Kft. Építőipari Költségbecslési Segédlet 2019; Építésügyi Tájékoztatási Központ Kft: Budapest, Hungary, 2019; ISBN 2081-7186. [Google Scholar]
- Marrana, T.; Silvestre, J.D.; de Brito, J.; Gomes, R. Life cycle cost analysis of flat roofs of buildings. J. Constr. Eng. Manag. 2017, 143, 04017014. [Google Scholar] [CrossRef] [Scilit]
- Manso, A.; Fonseca, M.; Espada, L. Information about Costs—Productivity Sheets; Laboratório Nacional de Engenharia Civil: Lisbon, Portugal, 2010. (In Portuguese) [Google Scholar]
- CYPE Ingenieros, S.A. Gerador de Preços Para Construção Civil; CYPE Ingenieros, S.A.: Lisbon, Portugal, 2020. [Google Scholar]
- Eurostat. Gas Prices for Household Consumers—bi-Annual Data (From 2007 Onwards); Eurostat: Brussels, Belgium, 2019. [Google Scholar]
- Eurostat. Electricity Prices for Household Consumers—bi-Annual Data (From 2007 Onwards); Eurostat: Brussels, Belgium, 2019. [Google Scholar]
- Hoxha, E.; Passer, A.; Saade, M.R.M.; Trigaux, D.; Shuttleworth, A.; Pittau, F.; Allacker, K.; Habert, G. Biogenic carbon in buildings: A critical overview of LCA methods. Build. Cities 2020, 1, 504–524. [Google Scholar] [CrossRef] [Scilit]
- Vallet, A.; Locatelli, B.; Levrel, H.; Wunder, S.; Seppelt, R.; Scholes, R.J.; Oszwald, J. Relationships Between Ecosystem Services: Comparing Methods for Assessing Tradeoffs and Synergies. Ecol. Econ. 2018, 150, 96–106. [Google Scholar] [CrossRef] [Scilit]
- Luukkanen, J.; Vehmas, J.; Panula-Ontto, J.; Allievi, F.; Kaivo-oja, J.; Pasanen, T.; Auffermann, B. Synergies or Trade-offs? A New Method to Quantify Synergy Between Different Dimensions of Sustainability. Environ. Policy Gov. 2012, 22, 337–349. [Google Scholar]
- Monteiro, H.; Freire, F.; Soares, N. Life cycle assessment of a south European house addressing building design options for orientation, window sizing and building shape. J. Build. Eng. 2021, 39, 102276. [Google Scholar] [CrossRef] [Scilit]
- Resende, J.; Corvacho, H. The nZEB requirements for residential buildings: An analysis of thermal comfort and actual energy needs in portuguese climate. Sustainability 2021, 13, 8277. [Google Scholar] [CrossRef] [Scilit]
- MSZ EN ISO 13370. MSZ EN ISO 13370:2017 Thermal Performance of Buildings. Heat Transfer via the Ground. Calculation Methods; ISO: Geneva, Switzerland, 2017. [Google Scholar]
- Szalay, Z. Modelling building stock geometry for energy, emission and mass calculations. Build. Res. Inf. 2008, 36, 557–567. [Google Scholar] [CrossRef] [Scilit]






















Publisher’s Note: MDPI stays neutral with regard to jurisdictional claims in published maps and institutional affiliations. |
© 2021 by the authors. Licensee MDPI, Basel, Switzerland. This article is an open access article distributed under the terms and conditions of the Creative Commons Attribution (CC BY) license (https://creativecommons.org/licenses/by/4.0/).