
Environmental and Economic Optimisation of Buildings in Portugal and Hungary


Abstract
:1. Introduction
- -
- How much do the total life cycle CO2 emissions, expressed as global warming potential (GWP), and LCC, depend on local economic and climatic conditions?
- -
- How much is the improvement potential in terms of GWP and LCC in a different climate and for different construction practices?
- -
- To what extent does the trade-off between GWP and LCC change in another local context?
2. Materials and Methods
2.1. Optimisation Framework
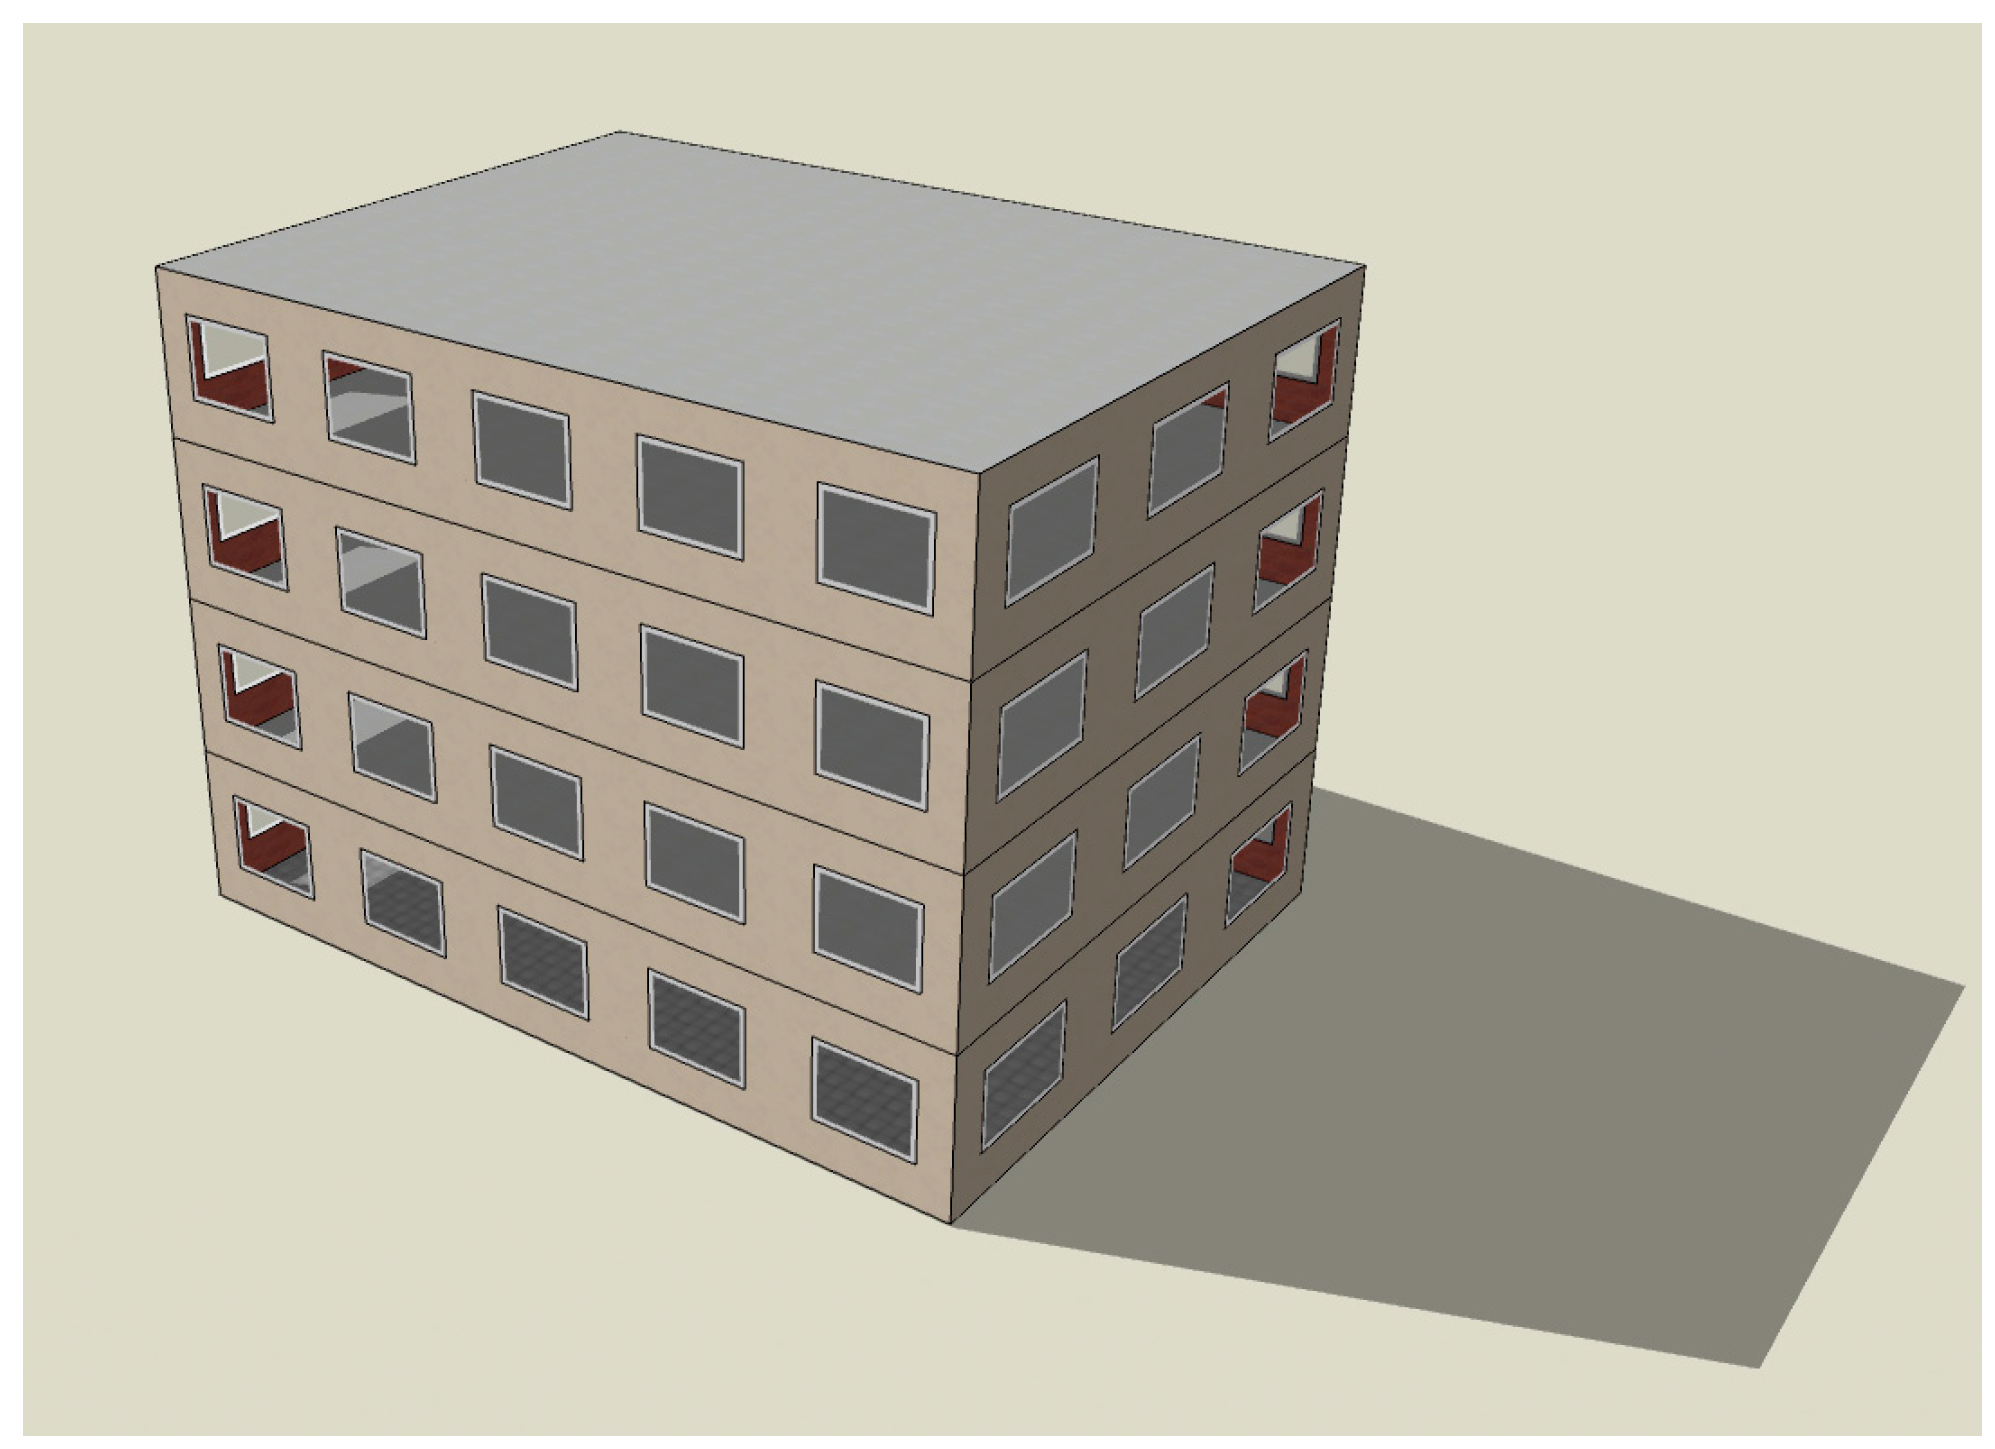
2.2. Case Study Building
- Internal partitions: 1 cm plaster + 10 cm ceramic hollow block + 1 cm plaster;
- Internal slabs: 1 cm plaster + 20 cm reinforced concrete + 4 cm sound insulation + PE foil + 6 cm screed + adhesive + ceramic tiles;
- Flat roof: 1 cm plaster + 20 cm reinforced concrete slab + vapour barrier + insulation with variable thickness + bituminous waterproofing membrane;
- Slab-on-ground: 15 cm hardcore + 10 cm concrete + bituminous waterproofing + insulation + PE foil + 6 cm screed + adhesive + ceramic tiles.
2.3. Optimisation Parameters
- Population size: 100;
- Max. population number: 30 in the single-objective and 50 in the multi-objective optimisation;
- Crossover probability: 0.6;
- Mutation probability: 0.2;
- Number of evaluations: 6000 in the single-objective and 10,000 in the multi-objective optimisation.
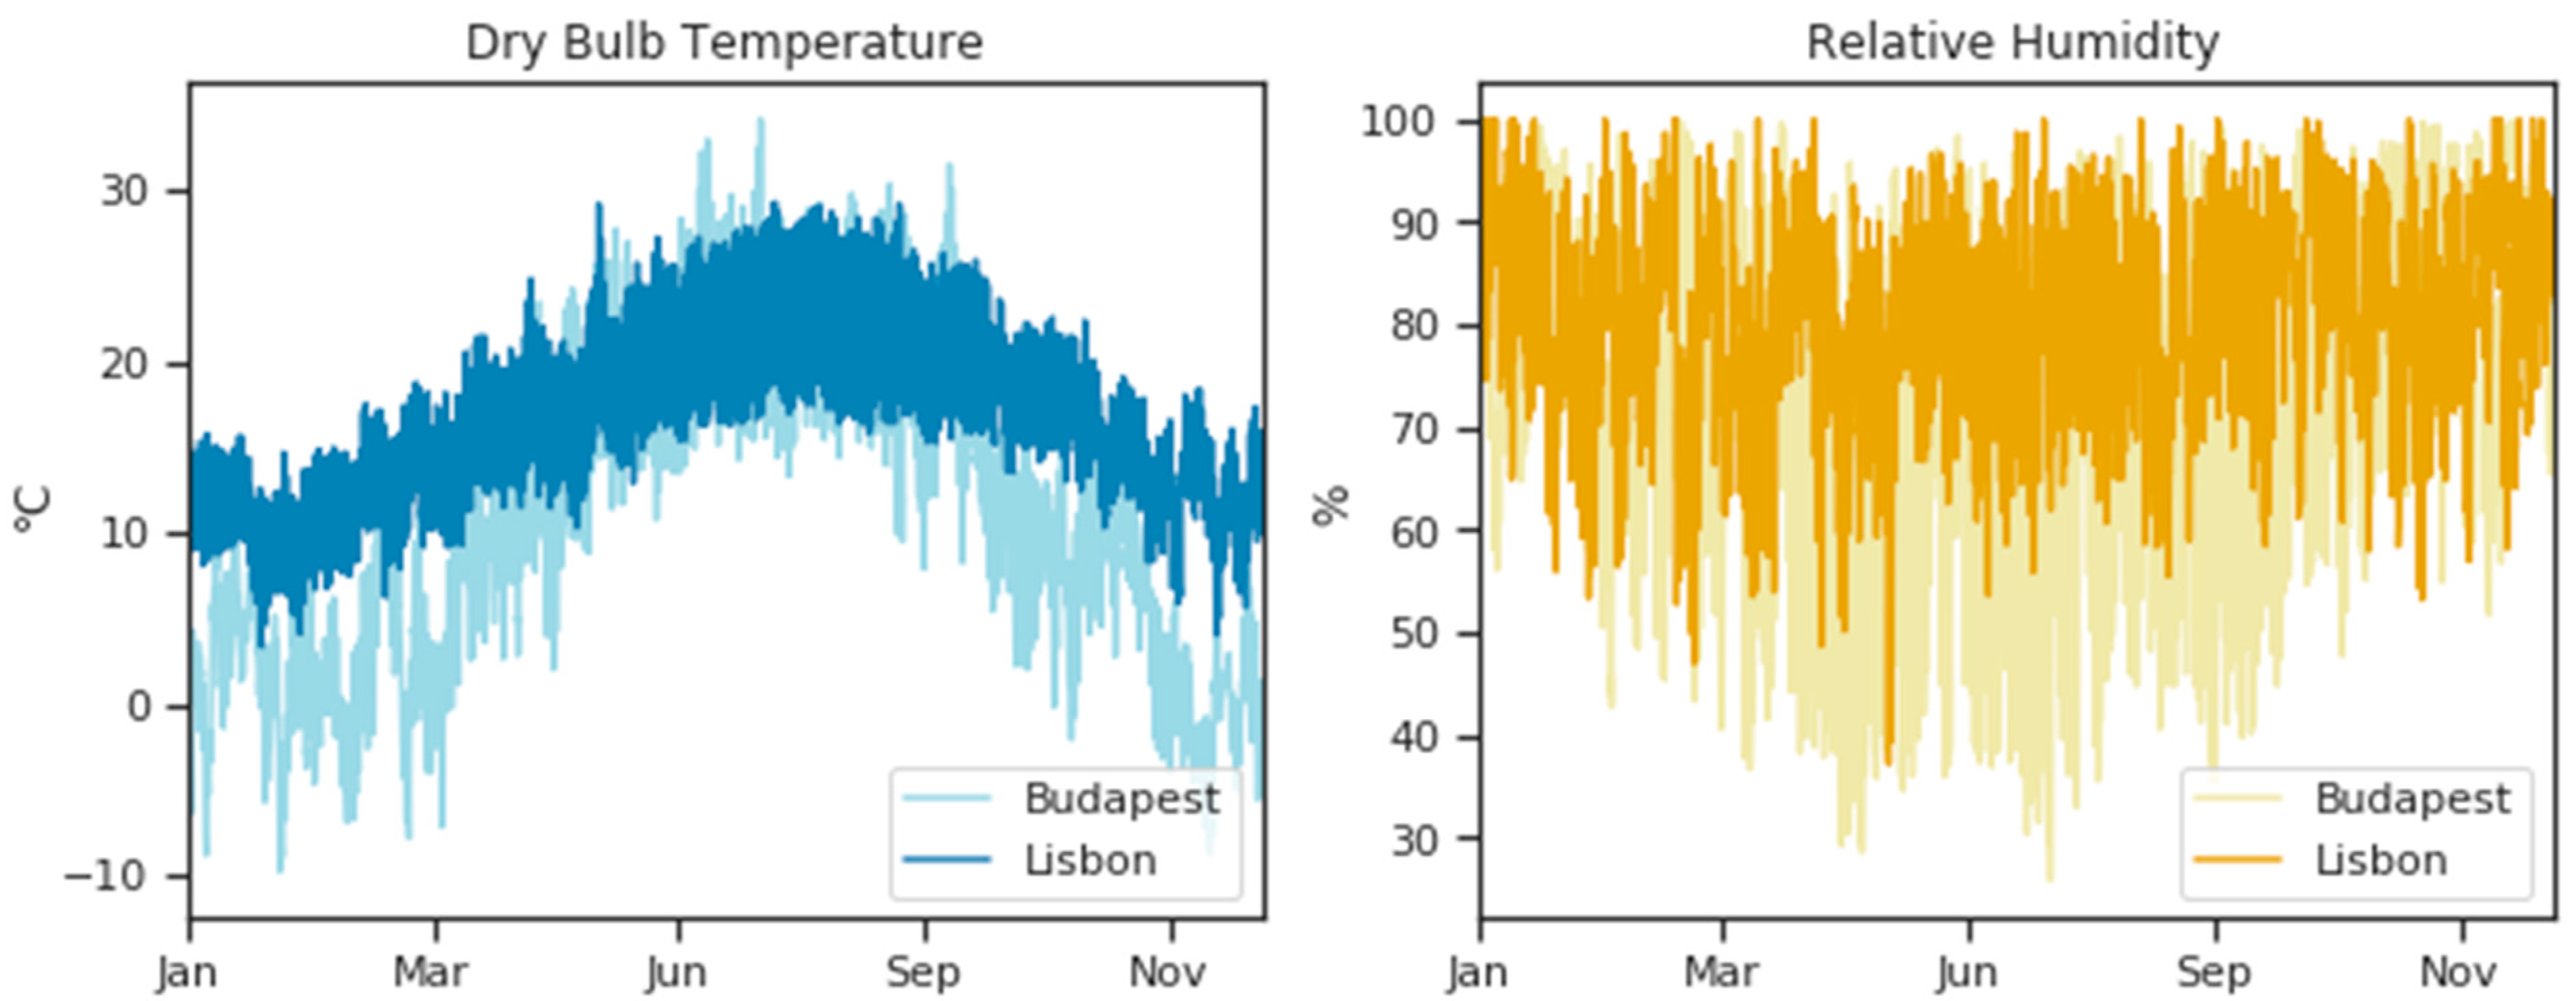
2.4. Climate Scenarios—Budapest and Lisbon
2.5. Energy Calculation Method
2.6. Environmental Assessment
2.7. Cost Assessment
3. Results
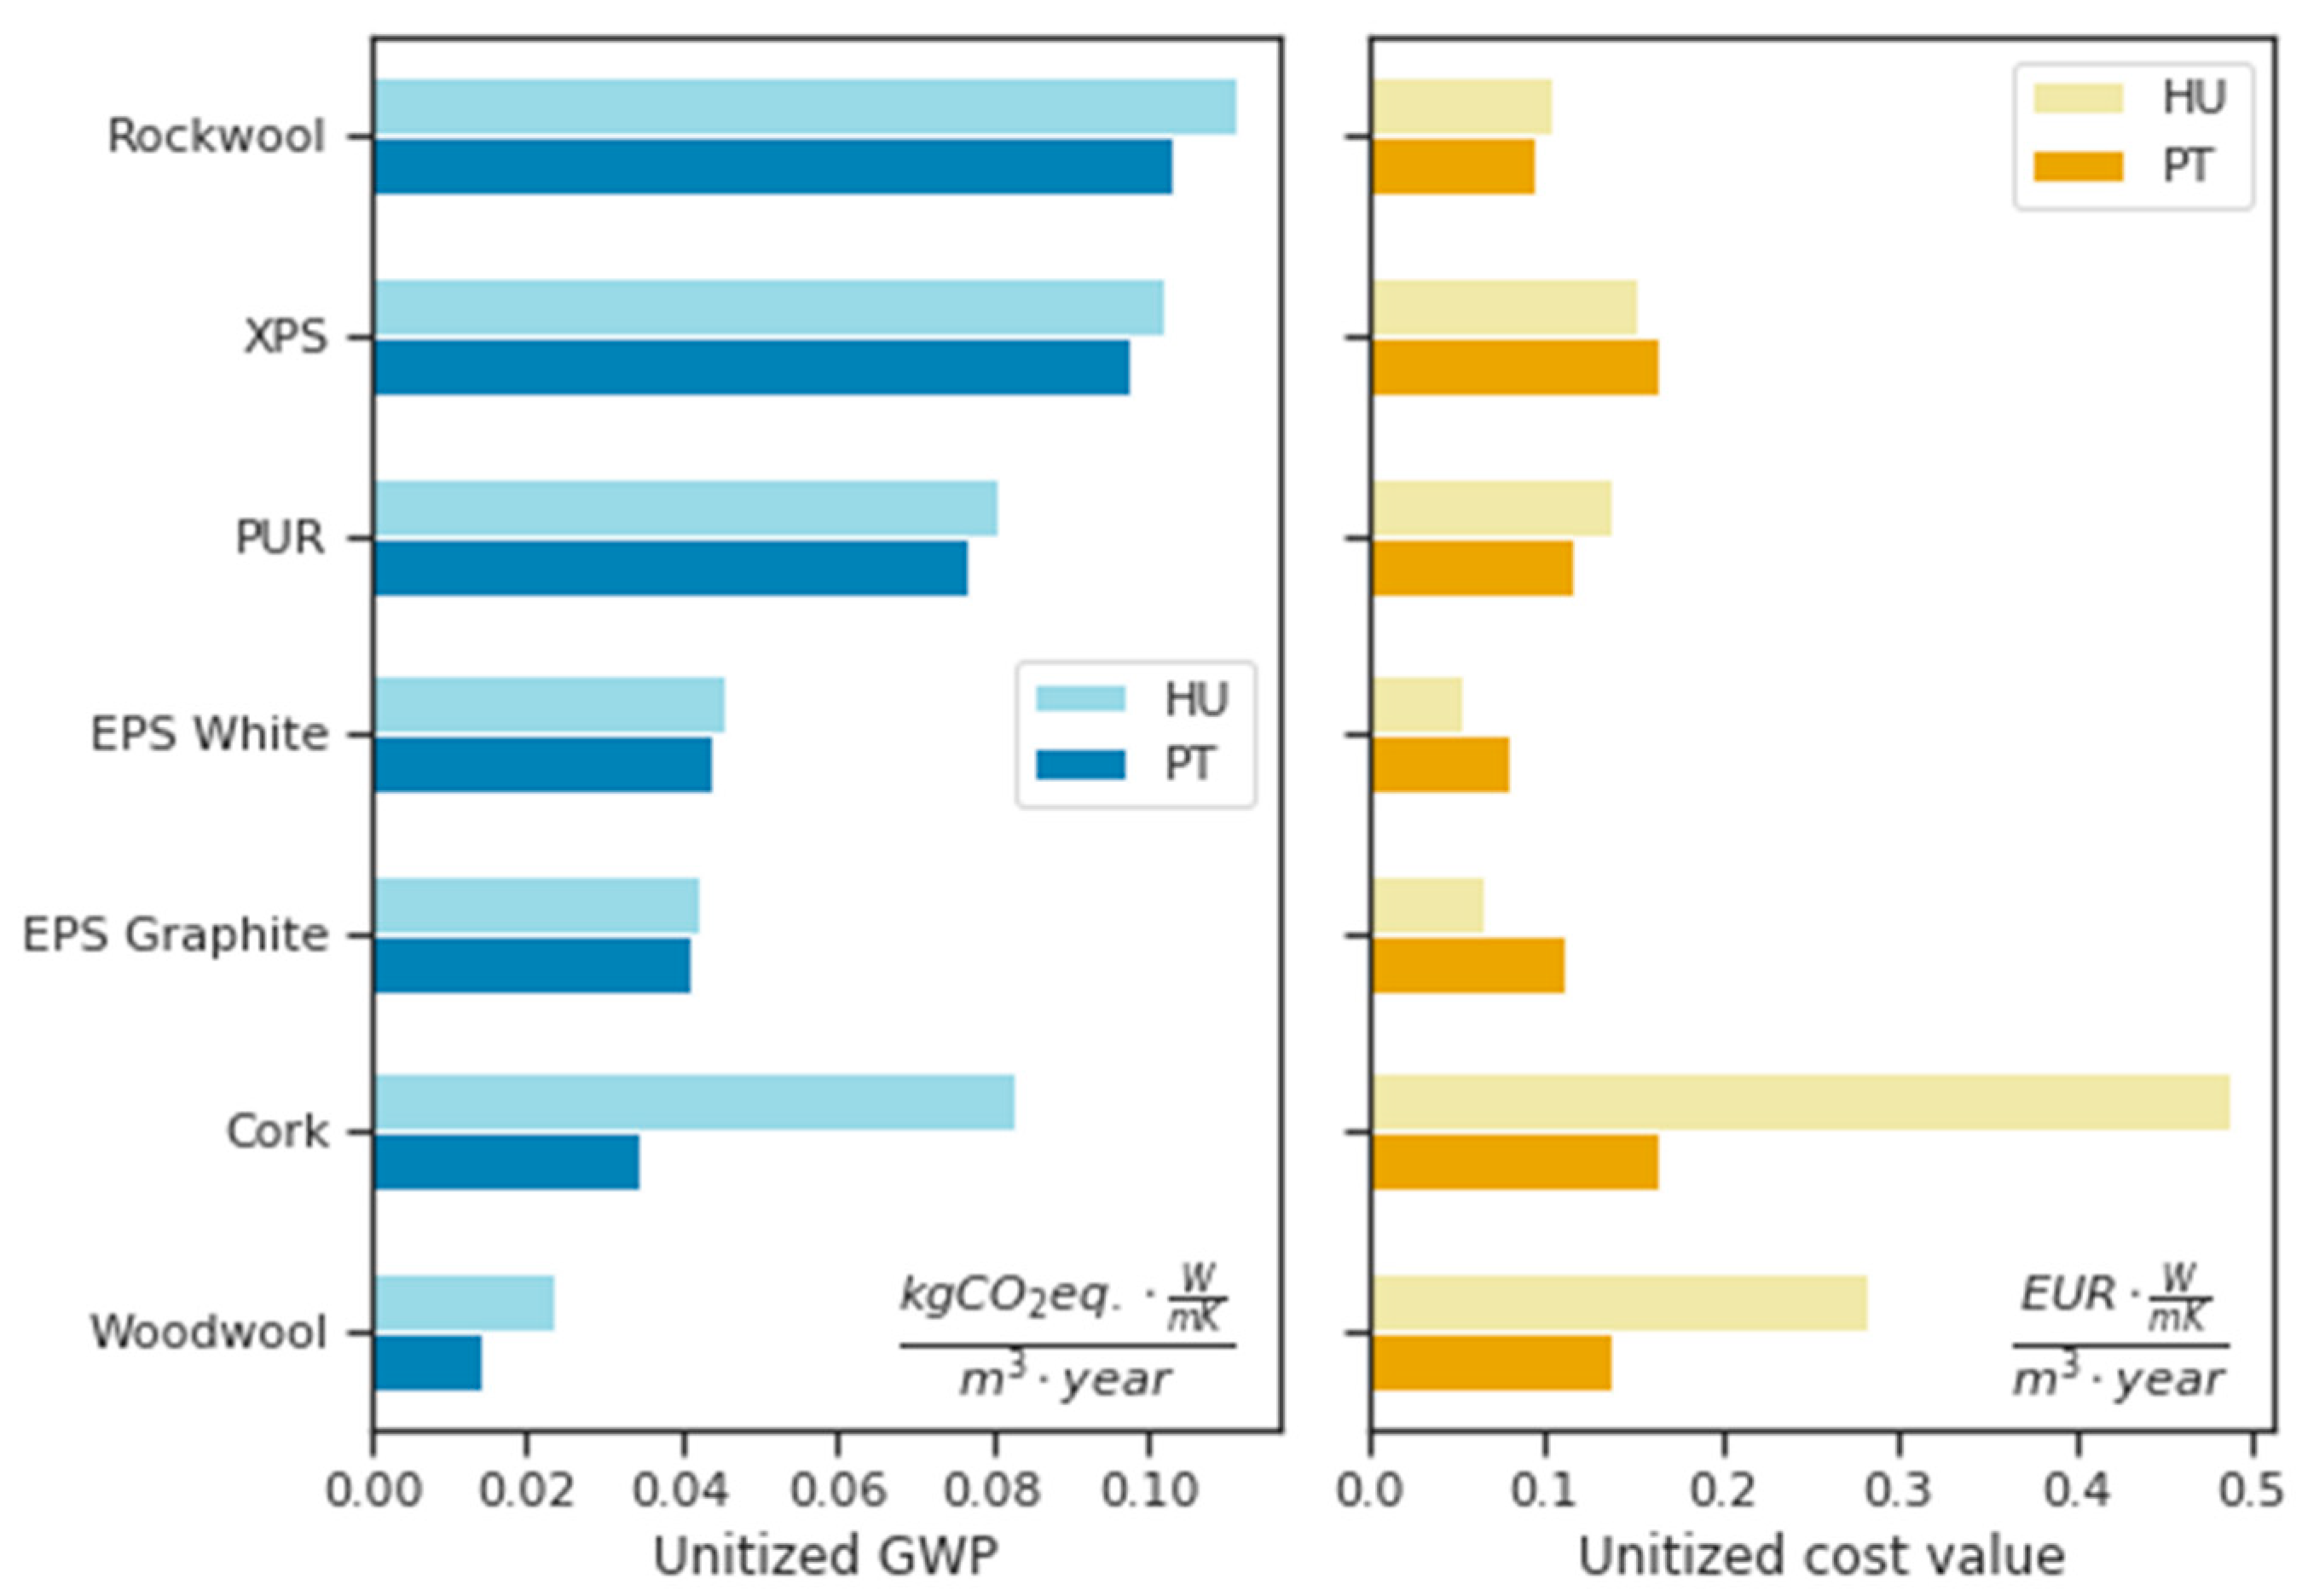
3.1. Comparison of the Environmental and Cost Data of Insulation Materials
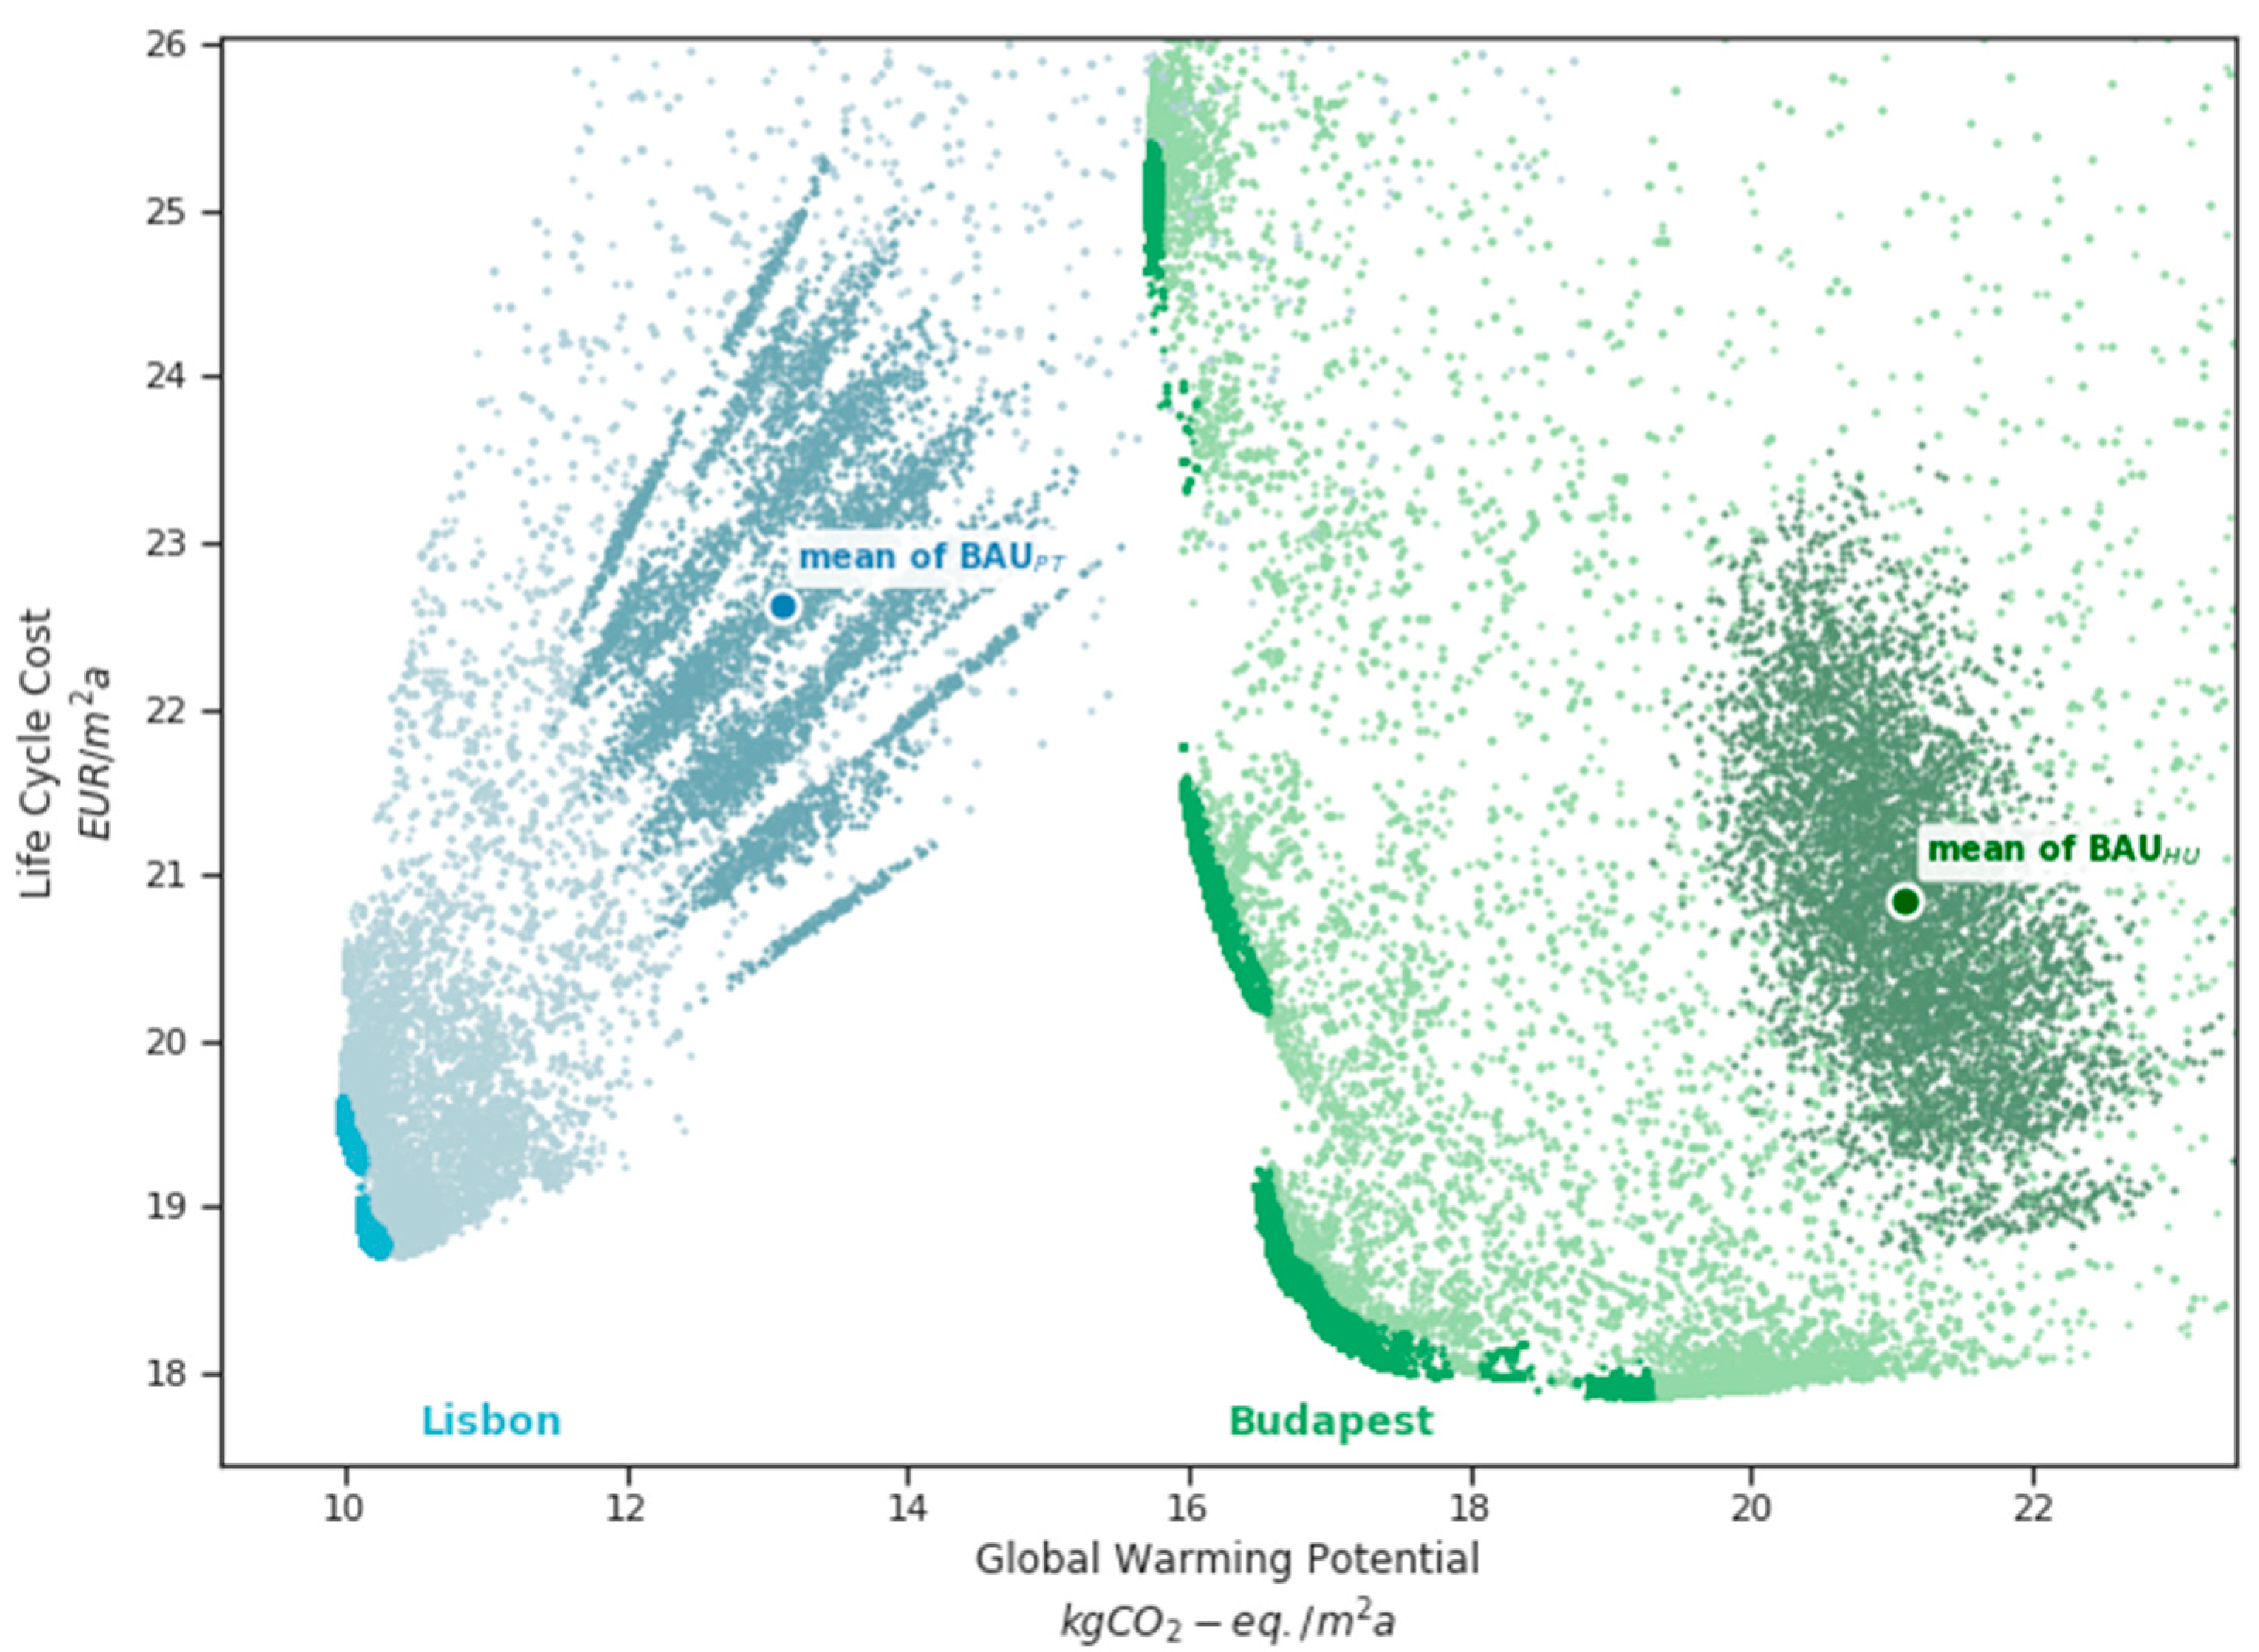
3.2. Description of the Pareto Front
3.3. Optimal Solutions
- synergy variables take similar values within all optimal solutions for both objectives. For numerical variables, <5% in standard deviation, and for categorical variables, >80% in occurrence within the optimal solutions, was used as a limit to be classified as a synergy variable;
- trade-off variables take different values depending on the preference between the objectives;
- neutral variables have no effect on the optimal results.
3.4. Comparison of Energy Performance Characteristics
4. Discussion and Conclusions
Author Contributions
Funding
Institutional Review Board Statement
Informed Consent Statement
Data Availability Statement
Conflicts of Interest
Appendix A

| Conductivity | Density | Specific Heat | |||
|---|---|---|---|---|---|
| Material | Application | W/mK | kg/m3 | J/kgK | |
| Insulation | Insulating Cork Board (ICB) | floor | 0.038 | 115 | 1500 |
| flat roof | 0.038 | 115 | 1500 | ||
| wall | 0.038 | 115 | 1500 | ||
| Expanded Polystyrene (EPS)—graphite | floor | 0.03 | 20 | 1460 | |
| flat roof | 0.03 | 20 | 1460 | ||
| wall | 0.031 | 17.5 | 1460 | ||
| Expanded Polystyrene (EPS)—white | floor | 0.038 | 17.5 | 1460 | |
| flat roof | 0.038 | 17.5 | 1460 | ||
| wall | 0.039 | 15 | 1460 | ||
| Polyurethane (PUR) | floor | 0.022 | 30 | 1420 | |
| flat roof | 0.022 | 30 | 1420 | ||
| wall | 0.022 | 30 | 1420 | ||
| Rock Wool | floor | 0.037 | 140 | 840 | |
| flat roof | 0.038 | 130 | 840 | ||
| sound insulation | 0.037 | 120 | 840 | ||
| wall | 0.037 | 110 | 840 | ||
| Wood Wool | floor | 0.043 | 180 | 2100 | |
| flat roof | 0.043 | 180 | 2100 | ||
| wall | 0.04 | 110 | 2100 | ||
| Extruded Polystyrene (XPS) | floor | 0.035 | 35 | 1400 | |
| flat roof | 0.035 | 35 | 1400 | ||
| wall | 0.036 | 35 | 1400 | ||
| Other materials | Adhesive for insulation | 0.85 | 1020 | 1230 | |
| Adhesive for ceramic tiles | 0.9 | 1500 | 1230 | ||
| Bituminous waterproof membrane | 0.3 | 1000 | 1000 | ||
| Ceramic tiles | 1.0 | 2000 | 1000 | ||
| Clay hollow brick | 0.2 | 720 | 1000 | ||
| Reinforced concrete | 2.0 | 2400 | 1000 | ||
| Cover coat (ETICS) | 0.99 | 1800 | 880 | ||
| Gravel | 0.35 | 1800 | 840 | ||
| Gypsum plaster | 0.29 | 800 | 840 | ||
| PE foil | 0.17 | 0.09 | 100 | ||
| Plaster | 0.87 | 1700 | 920 | ||
| Screed | 1.4 | 2000 | 840 | ||
| Vapor barrier | 0.1 | 0.09 | 100 |
| U Value | g Value | |
|---|---|---|
| Glazing | W/m2K | - |
| double | 1.825 | 0.719 |
| triple | 1.287 | 0.624 |
| Material Cost | Installation Cost | ||||||
|---|---|---|---|---|---|---|---|
| HU | PT | HU | PT | ||||
| Contruction Material Name | (EUR) | (EUR) | Ref. Unit | (EUR) | (EUR) | Ref. Unit | |
| Opaque materials | Adhesive for insulation | 0.00 | 0.00 | m2 | 0.00 | 0.00 | m2 |
| Bituminous waterproof membrane | 31.67 | 36.16 | m2 | 10.27 | 13.26 | m2 | |
| Ceramic tiles + adhesive | 26.07 | 16.90 | m2 | 26.75 | 34.54 | m2 | |
| Clay hollow brick | 102.78 | 70.11 | m3 | 21.06 | 27.19 | m2 | |
| Cork (ICB) slab insulation (flat roof and floor) | 623.45 | 210.76 | m3 | 7.44 | 9.60 | m2 | |
| Cork (ICB) wall insulation | 623.45 | 210.76 | m3 | 34.31 | 44.31 | m2 | |
| Cover coat (ETICS) | 7.70 | 43.74 | m2 | 5.77 | 7.45 | m2 | |
| EPS (graphite) slab insulation (flat roof and floor) | 142.06 | 203.07 | m3 | 7.44 | 9.60 | m2 | |
| EPS (graphite) wall insulation | 101.72 | 174.06 | m3 | 34.31 | 44.31 | m2 | |
| EPS (white) slab insulation (flat roof and floor) | 92.71 | 114.73 | m3 | 7.44 | 9.60 | m2 | |
| EPS (white) wall insulation | 66.38 | 98.34 | m3 | 34.31 | 52.96 | m2 | |
| XPS slab insulation (flat roof and floor) | 203.64 | 220.17 | m3 | 7.44 | 9.60 | m2 | |
| XPS wall insulation | 203.64 | 220.17 | m3 | 34.31 | 52.96 | m2 | |
| Gravel | 14.97 | 6.44 | m3 | 32.61 | 42.11 | m3 | |
| Gypsum plaster | 384.85 | 369.00 | m3 | 13.85 | 17.89 | m2 | |
| PE foil | 5.12 | 1.91 | m2 | 1.42 | 1.83 | m2 | |
| Plaster | 200.12 | 104.55 | m3 | 14.78 | 19.08 | m2 | |
| PUR slab insulation (flat roof and floor) | 318.01 | 257.01 | m3 | 7.44 | 9.60 | m2 | |
| PUR wall insulation | 302.95 | 257.01 | m3 | 34.31 | 44.31 | m2 | |
| Reinforced concrete | 450.96 | 218.00 | m3 | 125.73 | 162.35 | m3 | |
| Rockwool slab insulation (flat roof and floor) | 178.63 | 138.68 | m3 | 7.44 | 9.60 | m2 | |
| Rockwool sound insulation | 106.55 | 81.38 | m3 | 17.70 | 22.86 | m2 | |
| Rockwool wall insulation | 135.35 | 122.39 | m3 | 34.31 | 44.31 | m2 | |
| Screed | 85.22 | 139.01 | m3 | 66.69 | 86.11 | m3 | |
| Vapor barrier | 7.62 | 1.91 | m3 | 1.42 | 1.83 | m2 | |
| Woodwool slab insulation (flat roof and floor) | 268.98 | 165.74 | m3 | 7.44 | 9.60 | m2 | |
| Woodwool wall insulation | 343.00 | 165.74 | m3 | 34.31 | 44.31 | m2 | |
| Window materials | Window with triple glazing and wooden frame | 294.32 | 596.07 | m2 | 32.22 | 41.61 | m2 |
| Window with triple glazing and plastic frame | 222.07 | 259.26 | m2 | 32.22 | 41.61 | m2 | |
| Window with triple glazing and aluminium frame | 503.84 | 483.73 | m2 | 32.22 | 41.61 | m2 | |
| Window with double glazing and wooden frame | 273.44 | 569.97 | m2 | 32.22 | 41.61 | m2 | |
| Window with double glazing and plastic frame | 201.19 | 233.17 | m2 | 32.22 | 41.61 | m2 | |
| Window with double glazing and aluminium frame | 482.97 | 457.63 | m2 | 32.22 | 41.61 | m2 | |
| Blinds with aluminium slats | 357.21 | 338.25 | m2 | 11.66 | 15.06 | m2 | |
| Energy carriers | Electricity | 0.11 | 0.22 | kWh | |||
| Natural gas | 0.03 | 0.08 | kWh | ||||
| Wood pellet | 0.05 | 0.00 | kWh | ||||
| Electricity for heat pump | 0.11 | 0.22 | kWh | ||||
| HVAC systems | Heat pump (heating system) | 62,060.61 | 101,647.20 | pcs | 15,515.15 | 20,035.31 | pcs |
| Gas boiler (heating system) | 23,272.73 | 14,661.60 | pcs | 5818.18 | 7513.24 | pcs | |
| Pellet boiler (heating system) | 31,030.30 | 81,040.00 | pcs | 7757.58 | 10,017.66 | pcs | |
| Air conditioning system | 18,424.24 | 30,176.51 | pcs | 4606.06 | 5947.98 | pcs | |
| Electric lights | 50.91 | 83.38 | pcs | 12.73 | 16.44 | pcs | |
References
- EC. Communication from the European Commission: The European Green Deal. COM (2019) 640; EC: Brussels, Belgium, 2019. [Google Scholar]
- EC. Energy Efficiency—Revision of the Energy Performance of Buildings Directive. 2020. Available online: https://ec.europa.eu/info/law/better-regulation/have-your-say/initiatives/12910-Revision-of-the-Energy-Performance-of-Buildings-Directive-2010-31-EU (accessed on 11 March 2020).
- Dolezal, F.; Dornigg, I.; Wurm, M.; Figl, H. Overview and Main Findings for the Austrian Case Study. Sustainability 2021, 13, 7584. [Google Scholar] [CrossRef]
- Blengini, G.A.; Di Carlo, T. The changing role of life cycle phases, subsystems and materials in the LCA of low energy buildings. Energy Build. 2010, 42, 869–880. [Google Scholar] [CrossRef]
- Evins, R. A review of computational optimisation methods applied to sustainable building design. Renew. Sustain. Energy Rev. 2013, 22, 230–245. [Google Scholar] [CrossRef]
- Kheiri, F. A review on optimization methods applied in energy-efficient building geometry and envelope design. Renew. Sustain. Energy Rev. 2018, 92, 897–920. [Google Scholar] [CrossRef]
- Hashempour, N.; Taherkhani, R.; Mahdikhani, M. Energy performance optimization of existing buildings: A literature review. Sustain. Cities Soc. 2020, 54, 101967. [Google Scholar] [CrossRef]
- Bre, F.; Fachinotti, V.D. A computational multi-objective optimization method to improve energy efficiency and thermal comfort in dwellings. Energy Build. 2017, 154, 283–294. [Google Scholar] [CrossRef] [Green Version]
- Ghaderian, M.; Veysi, F. Multi-objective optimization of energy efficiency and thermal comfort in an existing office building using NSGA-II with fitness approximation: A case study. J. Build. Eng. 2021, 41, 102440. [Google Scholar] [CrossRef]
- Ascione, F.; Bianco, N.; Maria Mauro, G.; Napolitano, D.F. Building envelope design: Multi-objective optimization to minimize energy consumption, global cost and thermal discomfort. Application to different Italian climatic zones. Energy 2019, 174, 359–374. [Google Scholar]
- Marzouk, M.; Azab, S.; Metawie, M. BIM-based approach for optimizing life cycle costs of sustainable buildings. J. Clean. Prod. 2018, 188, 217–226. [Google Scholar] [CrossRef]
- Abdou, N.; Mghouchi, Y.E.L.; Hamdaoui, S.; Asri, N.E.L.; Mouqallid, M. Multi-objective optimization of passive energy efficiency measures for net-zero energy building in Morocco. Build. Environ. 2021, 204, 108141. [Google Scholar] [CrossRef]
- Zhu, N.; Liu, X.; Dong, Q.; Rodriguez, D. Optimization of zero-energy building by multi-criteria optimization method: A case study. J. Build. Eng. 2021, 44, 102969. [Google Scholar] [CrossRef]
- Longo, S.; Montana, F.; Riva Sanseverino, E. A review on optimization and cost-optimal methodologies in low-energy buildings design and environmental considerations. Sustain. Cities Soc. 2019, 45, 87–104. [Google Scholar] [CrossRef]
- Najjar, M.; Figueiredo, K.; Hammad, A.W.A.; Haddad, A. Integrated optimization with building information modeling and life cycle assessment for generating energy efficient buildings. Appl. Energy 2019, 250, 1366–1382. [Google Scholar] [CrossRef]
- Mayer, M.J.; Szilágyi, A.; Gróf, G. Environmental and economic multi-objective optimization of a household level hybrid renewable energy system by genetic algorithm. Appl. Energy 2020, 269, 115058. [Google Scholar] [CrossRef]
- Röck, M.; Ruschi Mendes Saade, M.; Balouktsi, M.; Nygaard, F.; Birgisdottir, H.; Frischknecht, R.; Habert, G.; Lützkendorf, T. Embodied GHG emissions of buildings—The hidden challenge for effective climate change mitigation. Appl. Energy 2019, 258, 114107. [Google Scholar] [CrossRef]
- Eurostat. Labour Costs in the EU; Eurostat: Brussels, Belgium, 2019. [Google Scholar]
- Lavagna, M.; Baldassarri, C.; Campioli, A.; Giorgi, S.; Dalla Valle, A.; Castellani, V.; Sala, S. Benchmarks for environmental impact of housing in Europe: Definition of archetypes and LCA of the residential building stock. Build. Environ. 2018, 145, 260–275. [Google Scholar] [CrossRef]
- Eurostat. Real GDP Per Capita; Eurostat: Brussels, Belgium, 2019. [Google Scholar]
- Eurostat. Share of Energy from Renewable Sources; Eurostat: Brussels, Belgium, 2019. [Google Scholar]
- IEA. Electricity Generation by Source, Portugal 1990–2019; IEA: Amsterdam, The Netherlands, 2019. [Google Scholar]
- IEA. Electricity Generation by Source, Hungary 1990–2019; IEA: Amsterdam, The Netherlands, 2019. [Google Scholar]
- Kiss, B.; Szalay, Z. Modular approach to multi-objective environmental optimization of buildings. Autom. Constr. 2020, 111, 103044. [Google Scholar] [CrossRef]
- DesignBuilder Software Ltd. DesignBuilder; DesignBuilder Software Ltd.: Stroud, UK, 2019. [Google Scholar]
- National Renewable Energy Laboratory. EnergyPlus; National Renewable Energy Laboratory: Golden, CO, USA, 2018.
- GreenDelta GmbH. openLCA; GreenDelta GmbH: Berlin, Germany, 2019. [Google Scholar]
- Project Jupyter. Jupyter. 2020. Available online: https://jupyter.org/ (accessed on 1 March 2021).
- The Pandas Development Team. Pandas-Dev/Pandas: Pandas. 2019. Available online: https://doi.org/10.5281/zenodo.3524604 (accessed on 1 March 2021).
- Hunter, J.D. Matplotlib: A 2D graphics environment. Comput. Sci. Eng. 2007, 9, 90–95. [Google Scholar] [CrossRef]
- Van Rossum, G.; Drake, F.L. Python 3 Reference Manual; CreateSpace: Scotts Valley, CA, USA, 2009; ISBN 1441412697. [Google Scholar]
- Deb, K.; Pratap, A.; Agarwal, S.; Meyarivan, T. A fast and elitist multiobjective genetic algorithm: NSGA-II. IEEE Trans. Evol. Comput. 2002, 6, 182–197. [Google Scholar] [CrossRef] [Green Version]
- Nguyen, A.T.; Reiter, S.; Rigo, P. A review on simulation-based optimization methods applied to building performance analysis. Appl. Energy 2014, 113, 1043–1058. [Google Scholar] [CrossRef]
- Zöld, A.; Csoknyai, T.; Kalmár, F.; Szalay, Z.; Talamon, A. Requirement System of Nearly Zero Energy Buildings Using Renewable Energy; University of Debrecen: Debrecen, Hungary, 2012. (In Hungarian) [Google Scholar]
- TNM TNM 7/2006. (V.24) Hungarian Government Decree on the Energy Performance of Buildings (in Hungarian). 2006. Available online: http://njt.hu/cgi_bin/njt_doc.cgi?docid=101820.352718 (accessed on 1 March 2021).
- Ministério da Economia e do Emprego. Decreto-Lei n.o 118/2013, de 20 de agosto (desempenho energético dos edifícios). Diário Da República 2013, 159, 4988–5005. [Google Scholar]
- Ministério do Ambiente, Ordenamento do Território e Energia, Portaria n.o 379-A/2015 de 22 de outubro. Diário Da República 2015, 207, 1840–1844.
- Joint Research Centre. JRC Photovoltaic Geographical Information System (PVGIS); European Commission: Brussels, Belgium, 2019. [Google Scholar]
- Zöld, A.; Szalay, Z. What is missing from the concept of the new European Building Directive ? Build. Environ. 2007, 42, 1761–1769. [Google Scholar]
- Lützkendorf, T.; Foliente, G.; Balouktsi, M.; Wiberg, A.H. Net-zero buildings: Incorporating embodied impacts. Build. Res. Inf. 2015, 43, 62–81. [Google Scholar] [CrossRef]
- ISO 14040. ISO 14040: 2006 Environmental Management-Life Cycle Assessment-Principles and Framework; ISO: Geneva, Switzerland, 2006. [Google Scholar]
- ISO 14044. ISO 14044: 2006 Environmental Management-Life Cycle Assessment-Requirements and Guidelines; ISO: Geneva, Switzerland, 2006. [Google Scholar]
- EN 15978. Sustainability of Construction Works—Assessment of Environmental Performance of Buildings—Calculation Method; CEN: Brussels, Belgium, 2011. [Google Scholar]
- Gomes, R. Life Cycle Assessment “From Cradle to Cradle” of Building Assemblies-Application to Flat Roofs; Lisbon University: Lisbon, Portugal, 2019. (In Portuguese) [Google Scholar]
- Gomes, R.; Silvestre, J.D.; De Brito, J. Environmental Life Cycle Assessment of Thermal Insulation Tiles for Flat Roofs. Materials 2019, 12, 2595. [Google Scholar] [CrossRef] [PubMed] [Green Version]
- Silvestre, J.D.; Castelo, A.; Silva, J.J.B.C.; Brito, J.; Pinheiro, M.D. Retrofitting a Building’s Envelope: Sustainability Performance of ETICS with ICB or EPS. J. Appl. Sci. 2019, 9, 1285. [Google Scholar] [CrossRef] [Green Version]
- Silvestre, J.D.; Pargana, N.; De Brito, J.; Pinheiro, M.D.; Durão, V. Insulation Cork Boards—Environmental Life Cycle Assessment of an Organic Construction Material. Materials 2016, 9, 394. [Google Scholar] [CrossRef] [PubMed] [Green Version]
- Heijungs, R.; Guinée, J.; Huppes, G.; Lankreijer, R.M.; Haes, H.A.; Wegener Sleeswijk, A.; Ansems, A.M.M.; Eggels, P.G.; van Duin, R.; Goede, H.P. Environmental Life Cycle Assessment of Products—Backgrounds; Centrum voor Milieukunde: Leiden, The Netherlands, 1992; ISBN 90-5191-064-9. [Google Scholar]
- EC Commission Delegated Regulation (EU). No. 244/2012 of 16 January 2012 supplementing Directive 2010/31/EU of the European Parliament and of the Council on the energy performance of buildings by establishing a comparative methodology framework for calculating. Off. J. Eur. Union 2012, 28, 18. [Google Scholar]
- Építésügyi Tájékoztatási Központ Kft. Építőipari Költségbecslési Segédlet 2019; Építésügyi Tájékoztatási Központ Kft: Budapest, Hungary, 2019; ISBN 2081-7186. [Google Scholar]
- Marrana, T.; Silvestre, J.D.; de Brito, J.; Gomes, R. Life cycle cost analysis of flat roofs of buildings. J. Constr. Eng. Manag. 2017, 143, 04017014. [Google Scholar] [CrossRef]
- Manso, A.; Fonseca, M.; Espada, L. Information about Costs—Productivity Sheets; Laboratório Nacional de Engenharia Civil: Lisbon, Portugal, 2010. (In Portuguese) [Google Scholar]
- CYPE Ingenieros, S.A. Gerador de Preços Para Construção Civil; CYPE Ingenieros, S.A.: Lisbon, Portugal, 2020. [Google Scholar]
- Eurostat. Gas Prices for Household Consumers—bi-Annual Data (From 2007 Onwards); Eurostat: Brussels, Belgium, 2019. [Google Scholar]
- Eurostat. Electricity Prices for Household Consumers—bi-Annual Data (From 2007 Onwards); Eurostat: Brussels, Belgium, 2019. [Google Scholar]
- Hoxha, E.; Passer, A.; Saade, M.R.M.; Trigaux, D.; Shuttleworth, A.; Pittau, F.; Allacker, K.; Habert, G. Biogenic carbon in buildings: A critical overview of LCA methods. Build. Cities 2020, 1, 504–524. [Google Scholar] [CrossRef]
- Vallet, A.; Locatelli, B.; Levrel, H.; Wunder, S.; Seppelt, R.; Scholes, R.J.; Oszwald, J. Relationships Between Ecosystem Services: Comparing Methods for Assessing Tradeoffs and Synergies. Ecol. Econ. 2018, 150, 96–106. [Google Scholar] [CrossRef]
- Luukkanen, J.; Vehmas, J.; Panula-Ontto, J.; Allievi, F.; Kaivo-oja, J.; Pasanen, T.; Auffermann, B. Synergies or Trade-offs? A New Method to Quantify Synergy Between Different Dimensions of Sustainability. Environ. Policy Gov. 2012, 22, 337–349. [Google Scholar]
- Monteiro, H.; Freire, F.; Soares, N. Life cycle assessment of a south European house addressing building design options for orientation, window sizing and building shape. J. Build. Eng. 2021, 39, 102276. [Google Scholar] [CrossRef]
- Resende, J.; Corvacho, H. The nZEB requirements for residential buildings: An analysis of thermal comfort and actual energy needs in portuguese climate. Sustainability 2021, 13, 8277. [Google Scholar] [CrossRef]
- MSZ EN ISO 13370. MSZ EN ISO 13370:2017 Thermal Performance of Buildings. Heat Transfer via the Ground. Calculation Methods; ISO: Geneva, Switzerland, 2017. [Google Scholar]
- Szalay, Z. Modelling building stock geometry for energy, emission and mass calculations. Build. Res. Inf. 2008, 36, 557–567. [Google Scholar] [CrossRef]


| Design Parameter | Value Limits/Options (Optimisation) | Business As Usual Values (HU) | Business As Usual Values (PT) | |
|---|---|---|---|---|
| Fenestration ratio | N | 1–80% | 13–24% | 13–24% |
| W | 1–80% | 23–34% | 23–34% | |
| S | 1–80% | 33–44% | 33–44% | |
| E | 1–80% | 23–34% | 23–34% | |
| Glazing type | N | double/triple | double/triple | double |
| W | ||||
| S | ||||
| E | ||||
| Shading | N | yes/no | yes/no | yes/no |
| W | ||||
| S | ||||
| E | ||||
| Frame type | plastic/wooden | plastic/wooden | plastic/aluminium | |
| Roof insulation | material | EPS white/EPS graphite/PUR/rock wool/wood wool/ICB | EPS white/EPS graphite/PUR/rock wool | EPS white/XPS |
| thickness | 20–25 cm | 9–12 cm | ||
| Wall insulation | material | EPS white/EPS graphite | EPS white | |
| thickness | 1–80 cm | 10–15 cm | 2–5 cm | |
| Floor insulation | material | EPS white/EPS graphite/rock wool | EPS white/XPS | |
| thickness | 4–10 cm | 1–5 cm | ||
| Portugal | Hungary | ||
|---|---|---|---|
| Hourly labour cost in the construction sector | EUR | 10.0 | 7.5 |
| Natural gas price for household customers | EUR/kWh | 0.078 | 0.033 |
| Electricity price for household customers | EUR/kWh | 0.218 | 0.110 |
| Budapest | Lisbon | ||||
|---|---|---|---|---|---|
| GWP | LCC | GWP | LCC | ||
| Maximum improvement potential | rIPmax | 26% | 14% | 24% | 17% |
| Mininum improvement potential | rIPmin | 9% | −22% | 21% | 13% |
| Absolute improvement potential | IPmax | 5.39 | 2.98 | 3.15 | 3.90 |
| kg CO2-eq./m2a | EUR/m2a | kg CO2-eq./m2a | EUR/m2a | ||
| Pareto spread indicator | PSIIP_max | 0.67 | 2.53 | 0.11 | 0.24 |
| Improvement potential of the trade-off solution | rIPDI_min | 20% | 12% | 23% | 17% |
| Minimum distance to ideal point | DImin | 0.26 | 0.06 | ||
| Design Parameter | Budapest | Lisbon | |
|---|---|---|---|
| Fenestration ratio | N | 0.01 ± 0.00 | 0.01 ± 0.01 |
| W | 0.01 ± 0.01 | 0.01 ± 0.00 | |
| S | trade-off | 0.22 ± 0.02 | |
| E | 0.01 ± 0.00 | 0.01 ± 0.00 | |
| Glazing type | N | neutral | neutral |
| W | neutral | neutral | |
| S | triple (88%) | trade-off | |
| E | neutral | neutral | |
| Shading | N | neutral | neutral |
| W | neutral | neutral | |
| S | trade-off | no (100%) | |
| E | neutral | neutral | |
| Frame type | trade-off | trade-off | |
| Roof insulation | material | trade-off | trade-off |
| thickness | trade-off | 0.13 ± 0.02 | |
| Wall insulation | material | trade-off | wood wool (97%) |
| thickness | trade-off | 0.05 ± 0.02 | |
| Floor insulation | material | trade-off | neutral |
| thickness | trade-off | 0.01 ± 0.01 | |
| Graphical Representation | Parameters | Cluster | GWP Share and Improvement Potential | LCC Share and Improvement Potential | ||
|---|---|---|---|---|---|---|
 | Roof | 14 ± 2 cm | cork (51%) |  |  |  |
| Wall | 06 ± 1 cm | wood wool (97%) | ||||
| Floor | 01 ± 1 cm | - neutral - | ||||
| Fenestr. | 21 ± 2% | wooden frame | ||||
| Glazing | triple (67%) | not shaded |  |  | ||
 | Roof | 13 ± 1 cm | EPS white (60%) |  |  |  |
| Wall | 05 ± 2 cm | wood wool (97%) | ||||
| Floor | 01 ± 1 cm | - neutral - | ||||
| Fenestr. | 22 ± 2% | plastic frame | ||||
| Glazing | triple (56%) | not shaded |  |  | ||
 |  |  | ||||
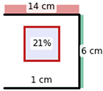
| Graphical Representation | Parameters | Cluster and Pareto Position | GWP Share andImprovement Potential | LCC Share and Improvement Potential | ||
|---|---|---|---|---|---|---|
 | Roof | 47 ± 4 cm | EPS graphite (94%) |  |  |  |
| Wall | 64 ± 5 cm | wood wool (100%) | ||||
| Floor | 37 ± 5 cm | wood wool (76%) | ||||
| Fenestr. | 75 ± 3% | wooden frame | ||||
| Glazing | triple | shaded |  |  | ||
 | Roof | 40 ± 5 cm | EPS white (58%) |  |  |  |
| Wall | 39 ± 6 cm | EPS graphite (54%) | ||||
| Floor | 28 ± 7 cm | EPS white (87%) | ||||
| Fenestr. | 60 ± 6% | wooden frame | ||||
| Glazing | triple | shaded |  |  | ||
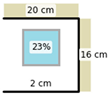
 | Roof | 41 ± 5 cm | EPS white (71%) |  |  |  |
| Wall | 38 ± 6 cm | EPS white (60%) | ||||
| Floor | 24 ± 8 cm | EPS white (83%) | ||||
| Fenestr. | 50 ± 8% | wooden frame | ||||
| Glazing | triple | not shaded |  |  | ||
 | Roof | 36 ± 7 cm | EPS white (97%) |  |  |  |
| Wall | 28 ± 9 cm | EPS white (71%) | ||||
| Floor | 17 ± 6 cm | EPS white (85%) | ||||
| Fenestr. | 41 ± 7% | plastic frame | ||||
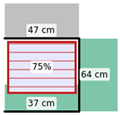
| Glazing | triple | not shaded |  |  | ||
 | Roof | 20 ± 4 cm | EPS white (99%) |  |  |  |
| Wall | 16 ± 2 cm | EPS white (98%) | ||||
| Floor | 2 ± 2 cm | EPS graphite (89%) | ||||
| Fenestr. | 23 ± 3% | plastic frame | ||||
| Glazing | double | not shaded |  |  | ||
 |  |  | ||||
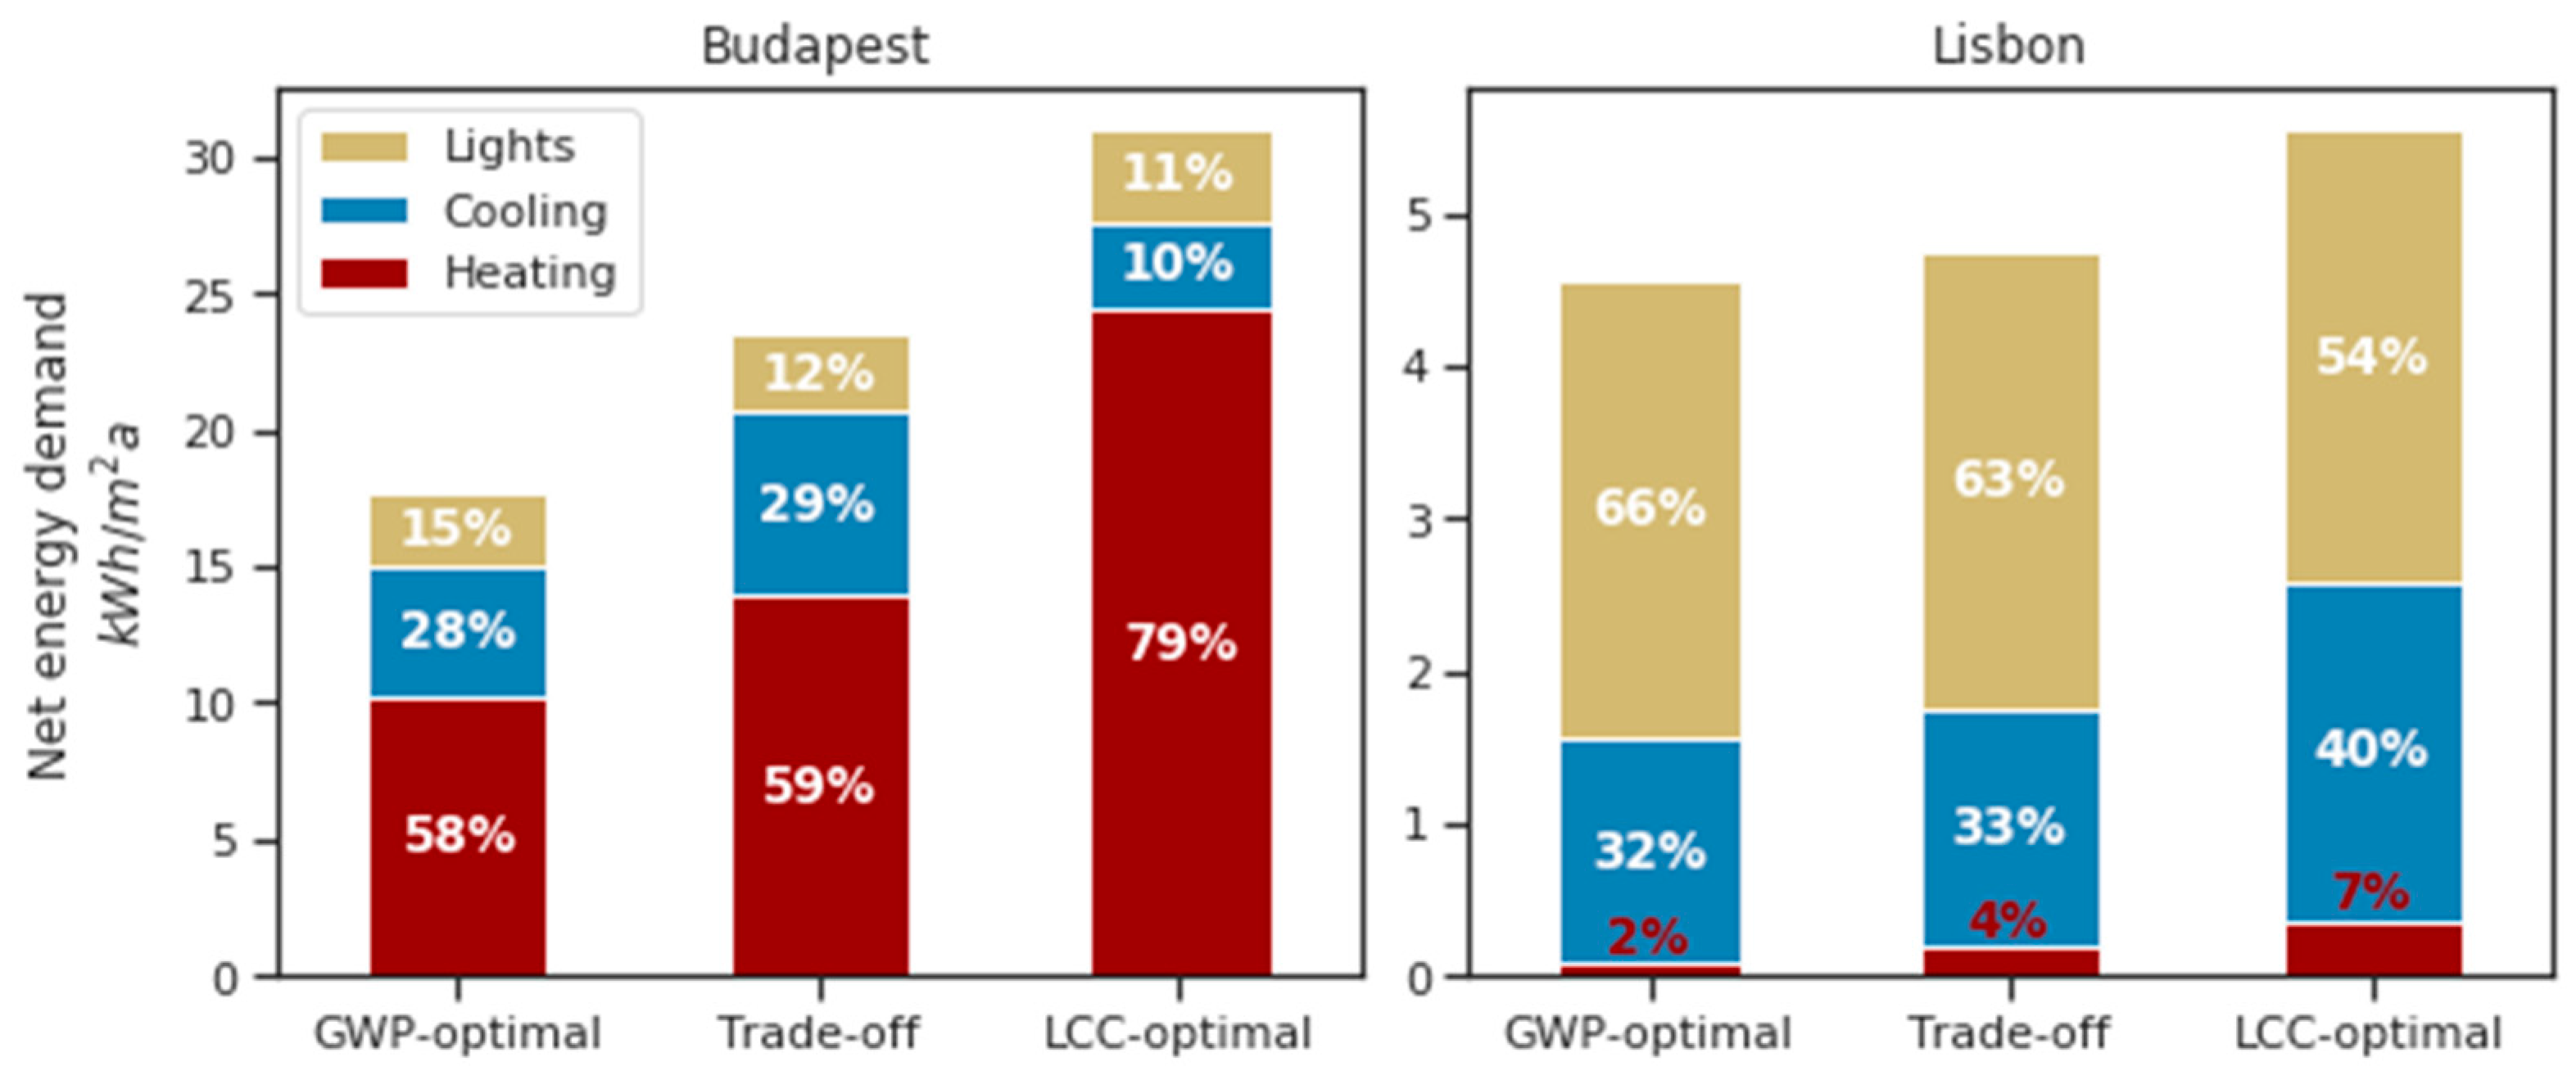
| Budapest | Lisbon | |||||||||||||
| GWP-optimal |  | Qheating | 10.17 | kWh/m2a | Uflat roof | 0.064 | W/m2K | 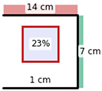 | Qheating | 0.08 | kWh/m2a | Uflat roof | 0.249 | W/m2K |
| QCooling | 4.87 | Uwall | 0.055 | QCooling | 1.48 | Uwall | 0.287 | |||||||
| Qlights | 2.60 | Ufloor | 0.099 | Qlights | 3.01 | Ufloor | 0.999 | |||||||
| rIPGWP | 25.6% | Ufloor * | 0.082 | rIPGWP | 24.1% | Ufloor * | 0.384 | |||||||
| rIPLCC | −20.9% | rIPLCC | 13.6% | |||||||||||
| Trade-off | 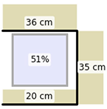 | Qheating | 13.91 | kWh/m2a | Uflat roof | 0.102 | W/m2K | 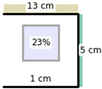 | Qheating | 0.18 | kWh/m2a | Uflat roof | 0.267 | W/m2K |
| QCooling | 6.71 | Uwall | 0.093 | QCooling | 1.57 | Uwall | 0.335 | |||||||
| Qlights | 2.86 | Ufloor | 0.166 | Qlights | 3.00 | Ufloor | 0.999 | |||||||
| rIPGWP | 19.6% | Ufloor * | 0.126 | rIPGWP | 22.8% | Ufloor * | 0.385 | |||||||
| rIPLCC | 12.5% | rIPLCC | 16.8% | |||||||||||
| Cost-optimal |  | Qheating | 24.39 | kWh/m2a | Uflat roof | 0.198 | W/m2K |  | Qheating | 0.37 | kWh/m2a | Uflat roof | 0.310 | W/m2K |
| QCooling | 3.20 | Uwall | 0.188 | QCooling | 2.20 | Uwall | 0.393 | |||||||
| Qlights | 3.39 | Ufloor | 0.642 | Qlights | 2.98 | Ufloor | 0.963 | |||||||
| rIPGWP | 9.0% | Ufloor * | 0.310 | rIPGWP | 21.8% | Ufloor * | 0.381 | |||||||
| rIPLCC | 14.3% | rIPLCC | 17.2% | |||||||||||
 | ||||||||||||||
Publisher’s Note: MDPI stays neutral with regard to jurisdictional claims in published maps and institutional affiliations. |
© 2021 by the authors. Licensee MDPI, Basel, Switzerland. This article is an open access article distributed under the terms and conditions of the Creative Commons Attribution (CC BY) license (https://creativecommons.org/licenses/by/4.0/).
Share and Cite
Kiss, B.; Silvestre, J.D.; Andrade Santos, R.; Szalay, Z. Environmental and Economic Optimisation of Buildings in Portugal and Hungary. Sustainability 2021, 13, 13531. https://doi.org/10.3390/su132413531
Kiss B, Silvestre JD, Andrade Santos R, Szalay Z. Environmental and Economic Optimisation of Buildings in Portugal and Hungary. Sustainability. 2021; 13(24):13531. https://doi.org/10.3390/su132413531
Chicago/Turabian StyleKiss, Benedek, Jose Dinis Silvestre, Rita Andrade Santos, and Zsuzsa Szalay. 2021. "Environmental and Economic Optimisation of Buildings in Portugal and Hungary" Sustainability 13, no. 24: 13531. https://doi.org/10.3390/su132413531
APA StyleKiss, B., Silvestre, J. D., Andrade Santos, R., & Szalay, Z. (2021). Environmental and Economic Optimisation of Buildings in Portugal and Hungary. Sustainability, 13(24), 13531. https://doi.org/10.3390/su132413531