


Abstract
Since bicycles and bike-sharing systems are becoming increasingly important in modern transportation contexts, we suggest in this paper an alternative method to incorporate cycling among the freight transport alternatives within urban areas. We propose pursuing a sustainable initiative of crowdsourced delivery where some of the urban good deliveries may be voluntarily undertaken by users of the free-floating bike-sharing systems while following their prefixed route in exchange for some kind of reward. We believe that a network design model that allows properly allocating the resources of the bike-shared mobility service could improve the potential of crowdshipping, making it a viable support and supplement for the local postal services, and more easily accepted and adopted in urban contexts. An application to a case study has been embodied to show the effectiveness and advantages of our proposal.
1. Introduction
We are living in an era where sustainability, mobility, and quality of life are guiding many actions/decisions taken within both theoretical and practical contexts [1,2]. In particular, in the urban freight transport framework, it becomes crucial to think about new solutions that could be able to improve the efficiency and overall sustainability of modern city logistics [3,4]—especially those of the last mile, which it is often considered one of the most expensive elements of the supply chain [5].
Various measures and initiatives have been promoted with this goal [6,7], and one of them is represented by the transport of freight by bicycle [8], cargo cycles [9], or electric cargo bikes [10,11]. Bike messengers (or couriers) can carry post, letters, parcels, and anything with a low volume or weight [12]. Based on current research, more than 25% of all goods and 50% of all light goods in European cities can be handled by cycles [9]. In Europe, some bike courier markets are reasonably well developed, as they are proven to be fast and reliable within congested urban areas: usually, they work on a small scale, collecting packages and distributing them quickly throughout the city.
Another recent initiative that aims at reinventing the goods delivery process is crowdsourcing delivery [13,14,15]. An exhaustive and consistent definition of this has been given by [16]: “crowdsourcing is a type of participative online activity in which an individual, an institution, a non-profit organization, or company proposes to a group of individuals of varying knowledge, heterogeneity, and number, via a flexible open call, the voluntary undertaking of a task […] always entailing mutual benefit.” Crowdsourcing delivery is a special kind of crowdsourcing that is also known as crowdshipping. The crowdshipping concept entails the use of an available spare load capacity of vehicles on a journey that already takes place, in order to support delivery operations [17]. Crowdshipping represents an alternative to the traditional service providers, where the drivers are willing to take a parcel along their route, potentially earning some extra money and/or other benefits. The vehicles that carry on the service could be of any kind (trucks, cars, cycles, and so on): we can define crowdshipping as ‘sustainable’ if the deliveries take place using sustainable modes of transport (i.e., zero/low emissions or electric vehicles, public transport) [4].
The most significant contributions of crowdshipping are envisioned from an environmental perspective, as it has been proven to be one of the most effective ways (although with some exceptions, see for instance Buldeo Rai et al. [18]) to decrease resource use and environmental impacts in the transport sector in the short term [19] through using the loading space more efficiently, and hence reducing traffic, congestion, and polluting emissions [13,14,17,20,21].
Recently, some studies related to crowdshipping have been made about operational research approaches [17,22,23] (for a comprehensive review, see [24]) and about the determinants of shared mobility for last-mile home delivery services [25,26,27].
Furthermore, a crowdsourced delivery experimental attempt has been recently conducted in Finland [19] for the distribution of books to and from the city library by locals. The results show that it has attracted a large number of drivers, and most of them used a bike to perform the task.
According to our knowledge, it seems that neither in the literature nor in any city has the opportunity to link the crowdsourced shipping to the bike-sharing system (BSS) operating in the network already been considered. BSSs allow users to pick up a bike close to the starting point of their trip, and ride toward their destination without the costs and burdens associated with the ownership of a bike. Therefore, we want to propose that some of the users who choose to travel using the BSS (station-based or free-floating [28]) could voluntarily decide to deliver small packages within the urban area, following their prefixed route, or slightly deviating from it, in exchange for some kind of reward.
Looking at the framework described above, we suggest in this paper a sustainable initiative of crowdsourced delivery. It proposes that part of the urban good deliveries within urban contexts could be undertaken voluntarily by some users of the free-floating bike-sharing system (FFBSS), which has been opportunely designed in order to meet the needs of the users of the system, and support the local postal services delivering a certain share of their small/light good parcels.
In a free-floating shared system, the vehicles are dispersed in different demand areas (and not only available in predefined stations, such as in station-based systems). This means that each user can pick up the vehicle (in this case, the bicycle) located next to the starting point of his/her trip, and return it to the parking area closest to his/her destination.
In addition, the method that we are proposing assumes that a certain percentage of these users is willing to carry a small parcel along his/her journey, in order to perform an urban delivery and gain some kind of reward.
The free-floating option has been preferred to the station-based one, mainly due to the ease of parking near the customer address while delivering the parcels. Note that the main goal of our proposal is to find a valid way to foster the bike usage in the framework of FFBSS, and hence promote an environmentally friendly and more sustainable transport option (although, in addition, postmen/couriers may also experiment with a partial relief from user deliveries). An adequate network design of the bike shared mobility service could improve the potentiality of the crowdshipping, making it more easily accepted and adopted in urban contexts.
Ideally, the crowdshipping initiative may be suggested jointly by municipalities (that can be in charge of collecting volunteer participants who are available to perform the crowdshipping) and postal services, in order to avoid any conflict of interest among the involved stakeholders, and assuring that the process is carried out smoothly. The benefits of crowdshipping are not strictly related to easing delivery costs, as this initiative should stem from public investments that aim for more sustainable cities and the general promotion of cycling.
The remainder of the paper has been organized as follows. Section 2 describes the layout of the proposed free-floating bike-sharing crowdshipping system, together with the suggestion of some policies/measures that might help the successful implementation of the system. Then, a network design optimization model to properly allocate the resources of a free-floating bike-sharing crowdshipping system has been presented in Section 3, followed by an application of the proposed system in Section 4, and some concluding remarks and possible further research developments in Section 5. Appendix A describes in further detail the survey analysis that has been performed in the framework of the numerical application.
2. Layout of the Proposed Free-Floating Bike-Sharing Crowdshipping System and Related Policies
The purpose of this section is to provide an overview of the suggested system in order to better understand its underlying dynamics. We assume that a certain share of the total users of the system has subscribed to the crowdsourced delivery option. This means that some individuals (belonging to Ua) are willing to hand over post/small packages while traveling within the urban area by a free-floating bicycle before reaching their final destination. These users are supposed to have access to a smartphone app, in which they can add and state their general travel preferences (i.e., the usual origin and destination of their FFBSS trips, and the maximum deviation α from their path when performing crowdshipping) and receive updated information about the parcels they have to deliver. Every day, a confirmation from each user belonging to Ua should be sent to the system through this app regarding their availability for performing a delivery the next day. Given a certain number of deliveries to be performed during that day, it can be possible to schedule the crowdshipping in advance, matching each user with a parcel corresponding to his/her travel requirements.
Parcel assignments to users can take place through two possible ways. In case I, users are not inclined to lengthen their usual route in order to pick up or deliver a package. This implies that the crowdsourced delivery option is offered only to users who have their usual trip origins in areas located close to the post offices, with deliveries to be performed near their usual destinations. Note that this “proximity” of origins and destinations should be investigated on the territory, since it may vary according to the studied context. On the other hand (case II), if permitted by the individual preferences (that is, some of them are willing to extend their usual route), parcels can be assigned also to those users starting their trip in origins farther from post offices, with their usual destinations not necessarily located close to the delivery addresses. Generally, we expect at first to match those users living close to the post offices with their corresponding parcels, and then (only if we are in case II) proceeding with the remaining parcel assignment (prioritizing the package allocation from the minimum to the maximum deviation from the original user routes).
Then, each user is notified about the parcel assignment through an app message that indicates the post office from which the package has to be collected and its final delivery address. Once the parcel has been assigned to a user, he/she has also the responsibility of carrying out the delivery: this also takes into account different scenarios, such as the impossibility of delivery due to the absence of the recipient. In this case, the user should either try to perform the delivery later on or bring the parcel back to the post office where he/she picked it up. This procedure could be simplified by the presence of smart lockers distributed on the territory [29].
We expect only part of the total parcels to be distributed to the final customers by crowdshipping: this share is denoted by δ. According to the number of parcels to deliver, the users of the FFBSS to whom a delivery is assigned (Uap) may, or may not, coincide with the total pool of those who have expressed their availability to do it.
The postmen are those entitled to carry on all the remaining parcel deliveries (Ppd) scheduled for that day. In other words, Ppd corresponds to the number of parcels to be necessarily delivered by postmen during an operating day, because there are no users that day traveling between some origin–destination (OD) pairs or, alternatively, because the user bicycle requests of Uap are not sufficient to match the entire parcel demands between some OD pairs. To guarantee that all the post/small packages could arrive at their destinations by the end of the working day, a predetermined time of day has to be fixed (T): the couriers Uap have to hand over the parcels to their assigned customers by that time.
If all the users belonging to Uap have been able to find an available bicycle near their origin (within a walking radius w), then all the expected deliveries can be accomplished, and there is no need for the postmen to deliver additional packages after T. If this has not happened by T, the postmen are in charge of finalizing the distribution of the number of parcels left at the post office after this hour (Pp), in order to fulfill the provisions for the day in question. Basically, we can define Pp as the total number of parcels to be delivered by the postmen after the time T, which could have been delivered by the users belonging to Uap only if they had managed to find an available bike. Therefore, the total amount of packages to be handed over by postmen during each day is equal to Pptot = Pp + Ppd.
The flowchart in Figure 1 reports step by step what has been just explained above, clarifying what happens to each user that picks up a free-floating bike within every generic time interval t during a hypothetical operation day. The main symbols adopted in the summary flowchart (Figure 1) and throughout the paper have been listed and defined in the notation box.
Figure 1.
Flowchart of the proposed framework during a given operation day (from t = 0 to t = ttot).
To encourage a positive effect on the overall system (i.e., increasing the number of FFBSS users, or the share of those who participate in the crowdshipping), we propose to jointly apply some related policies in the system reality under analysis. For example, each performed delivery may correspond to an increase of the free bike-rental minutes for that user. The number of extra free minutes to assign can be predetermined by roughly estimating the average time needed to reach the post office, pick up the package, and divert from his/her primary route in order to stop by the delivery address and drop off the parcel. Furthermore, some rewards (such as a discounted or free annual subscription to the FFBSS, or postal service benefits) have to be pursued in order to promote the participation of more individuals to the crowdshipping initiative. However, in order to avoid an excess amount of rewards attributed to a single user, and not aiming at crowdshipping becoming some kind of extra job for some of them, we recommend setting a maximum number of daily deliveries for each user according to both the usual path followed by the individual and the maximum capacity of the bike basket. Furthermore, it might be also convenient not to assign registered or priority mail to the voluntary free-floating users, in order to provide secure delivery to the final customers.
To boost the FFBSS usage and promote the crowdshipping initiative, it is also essential to minimize the number of users who are not able to find an available bike within the average walking distance that they are willing to walk. We can call them ‘lost users’, as they become forced to travel using a different transportation mode and, over time, their dissatisfaction may lead them to unsubscribe from the system. In the following section, we illustrate how to design a FFBSS to minimize the total amount of lost users: those who were supposed to perform a delivery, and the remaining deliveries.
3. Design a Crowdshipping-Oriented Free-Floating Bike-Sharing System
As mentioned in the introduction, the primary goal of our method is the network design of a FFBSS, assessing the size of the system (i.e., determining the total number of free-floating bicycles) according to the available budget. Furthermore, regarding how to allocate the bicycles on the urban territory at the beginning of each operating day, we are essentially suggesting a possible static relocation to carry out at the end of the day.
In a FFBSS, it is not necessary to install racks or set up bike stations, since free-floating bicycles are provided with smart padlocks placed on the bike frames that allow users to lock/unlock one wheel, and then park the bicycle almost anywhere. However, it can be convenient to think in advance about the potential presence of parking areas on the territory in order to prevent bicycles being left in unsuitable places. More specifically, a crowdshipping-oriented FFBSS needs to ensure that the areas next to post offices have appropriate parking spaces.
At first, we have to divide the study area into zones/districts. Every delivery point within the zone should be reached on foot. We suggest that the size of each travel demand zone be related to the average walking distance w that a user is willing to walk to pick-up a free-floating bicycle [30]. Various kinds of distance formulations may be adopted (for instance, Euclidean or Manhattan distances/taxicab geometry): the most suitable one should be selected according to the road/cycling urban set-up.
Then, the two starting data sets that are needed as inputs of the suggested optimization are:
- the OD matrix related to the user request/demand for free-floating bicycles, and its trend during the hours of the day, and the days of the week;
- the OD matrix related to the urban delivery of post/small goods given by the postal service operating in the selected city; this demand fluctuates according to the days of the week. The assumption is that volunteer users are mainly performing these deliveries, and only the remaining part is carried out by postmen (using their own means of transportation).
The data necessary to build the first OD trend must be collected for a certain time interval (it could be equal to weeks or months). The calculation of this OD trend needs some further specifications; there are three feasible options that may arise in the case study under analysis:
- a FFBSS is already operating in the network: this implies that the OD trends can be based on the actual trends related to the system usage;
- a station-based BSS is already operating in the network: each bike-sharing station can be seen as the ideal centroid of a zone, and the number of available bicycles in the station corresponds to the number of free-floating bicycles spread in that zone at that moment of the day;
- there is no sharing system operating in the network: in this case, there may be different viable options:
- (a)
- Adopting an initiative to predict the functioning of the system. At first, a preliminary free-floating system can be implemented in the network, allocating resources (bicycles) according to the available budget. At this stage, the free-floating bicycles crowdshipping option will be disregarded, and a traditional FFBSS will be realized in the study area. Through allowing the FFBSS to operate in the network for a given amount of time, some preliminary data about its usage and expected demand can be collected and used to optimize the system (primarily rearranging the bike distribution on the territory) according to the proposed crowdshipping system.
- (b)
- If the initiative suggested in point a) proves to be not feasible, an alternative OD matrix can be obtained through analyzing the current cycling demand and patterns (via private bicycles) in the network.
- (c)
- A further alternative can be to start estimating the actual demand of the short-distance private transport in the network (e.g., less than 5-km trips) that could be shifted to a new FFBSS.
If the OD trends related to the user request/demand of free-floating bikes—according to the number of bicycles spread on the territory at the beginning of each day—are known, it can also be possible to perform a calculation of the number of lost users of the system (Lu and Lud). Here, lost users are those who cannot pick-up a free-floating bike, since they are not able to find one within an average walking distance.
This leads to the optimization: the main objective of the proposed network design model is to maximize the total user satisfaction. We consider this assumption to coincide with the minimization of the total lost users of the system (Equation (1)):
The objective function (Equation (1)) aims at the minimization of a weighted sum (having weights respectively γ1 and γ2) of two components. The first one coincides with the lost users of the system Lu, i.e., those who wanted to take a bicycle from the FFBSS to reach their desired destination without carrying on or delivering parcels on their way—and in addition, those who would have been willing to hand over those parcels while riding a free-floating bicycle, but to whom no delivery has been assigned. The second component is the number of lost users of the FFBSS (Lud) to whom, on the contrary, a delivery has been assigned. Both Lu and Lud depend on the number of bicycles bξ (decision variables of the problem) allocated in each district at the beginning of an operating day.
The main constraint (Equation (2)) is represented by the budget: the purchasing cost of the free-floating bicycles cannot exceed the total available money. Moreover, the number of bikes to allocate in each zone ξ (Equation (3)) has to be between certain bounds, according to the number of potential locations (for each district) in which it is possible to park free-floating bicycles. The upper bound bu,ξ for FFBSSs is usually a larger number if compared with the potential thresholds of station-based shared systems, given by the sum of the racks in the stations within the district. This happens given the inherent characteristic of a FFBSS that allows greater parking opportunities: bicycles can be parked almost everywhere; having a smart-lock does not require the bike to be locked in the racks of specific bike-sharing stations.
The goal of the optimization (Equation (1)) with its associated constraints (Equations (2) and (3)) is to calculate the total number of free-floating bikes b (sum of bicycles bξ) to distribute to the districts according to the demand, and their location at the beginning of each operation interval. It has to be specified that this total number of bicycles is composed by:
- a share of bicycles for the FFBSS users who have not adhered to the crowdshipping and are using the bikes only to perform their trips within the city;
- a share of free-floating bikes for those users who, while riding toward their final destinations, accept carrying and delivering small packages to the customers.
Before and after performing the optimization (from Equations (1)–(3)), we can respectively calculate Ppd and Pp. The value of Ppd is not affected by the optimization, as it depends merely on the total number of users Uap (which can be calculated day by day before the day unfolds, and is not related to the specific distribution of bicycles on the territory at the beginning of that day). On the other hand, the value of Pp can be calculated knowing the total number of lost users Lud, and it is equal to the total number of parcels that have not been delivered by them during the day. If each lost user Lud is supposed to hand over only one small package, then Pp is equal to Lud (this is the assumption that we make in the following case study in Section 4).
4. Case Study
In this section, the proposed approach has been applied to a case study. This numerical application aims to better clarify the implications of our crowdshipping proposal, but it does not claim to be a real case study (currently, no pilot project has started yet), although some of the parameters that have been used are based on real values of Bari.
The city of Bari, the capital city of the Metropolitan City of Bari and of the Apulia region (Southern Italy), has a population of about 326,800 inhabitants distributed over an area of 116 square kilometers. According to the European Platform of Mobility Management [31], the car is the transport mode used by the majority of its population (76% in 2013, with a strong growth trend in comparison to 2001 data). The remaining modal share is distributed among local public transport (20%), pedestrians (3%), and bicycles (1%). In the last year, municipality efforts have been addressed toward promoting novel strategies to encourage cycling, such as the implementation of new bike lanes, or economic incentives to purchase a new (pedal-assisted) bicycle or use them during the home–job journey (with mileage reimbursements ranging from 0.10 to 0.20 €/km for the first 1000 individuals who adhere to the initiative) [32]. Moreover, a new station-based bike-sharing system will open soon in the city, with 34 stations and 200 available bicycles [33].
To correctly calibrate some input values of the model, we first performed a survey, which is briefly presented in the following Section 4.1 and more extensively described in Appendix A. Then, once those values have been assessed, the general layout of the crowdshipping proposal and the FFBSS design have been applied to the center of the city (Section 4.2). Finally, Section 4.3 describes a series of sensitivity analyses carried out to better understand the behavior of the proposed model while varying some of its key parameters.
4.1. Investigation of FFBSS and Crowdshipping in Bari: A Survey
On the basis of our knowledge, only a few surveys have been conducted in the past years on matters related to vehicle shared-systems, and mainly with regard to car-sharing ones (see Herrmann et al. [34] regarding customer acceptance of smart relocation strategies; Kopp et al. [35] investigated the travel behavior of its members; Becker et al. [36] compared user groups and the usage patterns of free-floating and station-based services). Specific customer evaluations associated with FFBSSs have been limited to one European research paper by Reiss et al. [37], whose survey focused on the usage, experience, and performance of bike-sharing supply in Germany, and two Chinese studies [38,39] about the factors that may affect both people’s willingness to use the system and their related travel patterns.
To gain greater knowledge about the individual attitudes toward the service, and in an attempt to realistically calibrate our model, we have investigated the travel behavior and willingness of potential users to participate in the FFBSS—and, eventually, in the crowdsourced delivery—through performing a web survey.
The survey has been conducted in the metropolitan area of Bari (which includes the city of Bari itself and the surrounding urban area, totaling 1.3 million inhabitants), targeting individuals that either reside in the study area, or in which they are used to travel for other reasons (i.e., job-related, shopping related, etc.).
The questionnaire has been divided into three sections (Appendix A): general background information and travel behavior questions; attitudes toward the FFBSS; and opinions regarding the implementation of the crowdshipping initiative on the territory. From what preliminarily emerged (see Appendix A), crowdshipping seems to be a sustainable initiative that could increase the appeal of FFBSSs and that, if implemented on the territory, may incentivize more people to join and use the system. This questionnaire has merely local significance, and it only provides a first analysis/investigation about the potential individual preferences of the interviewees. Future surveys will involve a larger population sample to draw more solid and general conclusions.
4.2. Application of the Proposed Free-Floating Bike-Sharing Crowdshipping System and Design
Based on the parameters identified in Appendix A, we have applied our approach to the city center of Bari (about three square kilometers). The overall study area has been divided into 36 traffic zones (Figure 2), guaranteeing that every point within each zone could be reached on foot starting from its own centroid, covering a distance not greater than 300 m (as suggested by Kabra et al. [30]).
Figure 2.
Indication of zones (with numbered blue centroids) and post offices (orange squares).
Since the city center of Bari shows a grid configuration of its road/cycling network, we have defined the borders of every district, making sure that each one of them falls within the taxicab circle [40] centered in its own centroid with a radius of 300 m (equivalent to a square rotated by 45 degrees with a semi-diagonal of 300 m).
There are 11 post offices spread on the territory, which are depicted by orange squares and fall into the darker grey districts (Figure 2). Moreover, the inter-zonal travel distance matrix has been calculated; it reports the real minimum distances—considering the whole transportation network—between each pair of centroids.
The maximum extension of each district also reflects our survey findings. All the respondents who have stated their intention to join the crowdshipping have also confirmed their willingness to lengthen their average bike path by at least 600 m—both at the beginning of the trip to pick up the parcel, and before reaching their destination to accomplish the delivery, totaling 1200 m to add to their usual route (Appendix A.3).
Through assuring that each district falls within the taxicab circle with a maximum radius of 300 m, we are also guaranteeing that, in the worst-case scenario (origin/destination of the trip at one extremity of the district, with post office/delivery address located at the opposite edge of the area), every crowdshipping user should ride an additional 600 m at the beginning plus 600 m at the end of his/her usual bike path to perform the delivery.
Therefore, we can assert that:
- Case I: the crowdsourced delivery is allowed only to users who have their usual trip origins in the same areas where the post offices are located, with deliveries to be performed only in the same districts as their usual destinations;
- Case II: parcels can be assigned also to those users who have origins/destinations in the remaining districts of the network, regardless of the post offices and delivery addresses associated with the parcels.
The users have been divided into subsets (see Appendix A, Table A2) according to their willingness to stretch their usual bike path of a certain value α (both at the origin and destination).
We set η = 0.58 (following the outcomes of the survey, Appendix A.3), assuming that 58% of the total free-floating users participate in the crowdshipping proposal, and T = 16:00: this means that the users Uap are allowed to accomplish their daily crowdsourced deliveries up to this time (as previously mentioned, the remaining deliveries will be performed by postmen). Although a certain share of users might also be willing to use the FFBSS after 16:00, we want to ensure a sufficient time window to eventually allow postmen to perform the remaining deliveries during their working time.
Moreover, we suppose that each user is allowed to distribute daily a single load of parcels (withdrawing the packages from the post office only once), according to his/her OD travel path and the maximum capacity of the bike basket, which is considered equivalent to one parcel unit of measurement, with all the baskets having the same capacity. For the sake of simplicity, in this paper we refer to ‘one package/parcel’ as the number of goods that at most can be contained in a bike basket.
The time window to collect data associated with both free-floating bike requests (simulated using the free-floating bike-sharing demand simulator presented by Caggiani et al. [41]) and the daily parcel deliveries is equal to three months. We assume each day of the week to have different behaviors in terms of packages to deliver and bike usage.
More specifically, we consider four gradually increasing levels of user request/demand of free-floating bicycles, which are denoted respectively by B1, B2, B3, and B4 (OD bikes); and four randomly extracted parcel demand levels related to the post/small goods to be delivered by the FFBSS users, which are denoted by P1, P2, P3 and P4 (OD packages). The corresponding average daily values calculated during the selected time window are: B1 = 2507, B2 = 2974, B3 = 3417, and B4 = 4195; P1 = 228, P2 = 308, P3 = 456, and P4 = 697.
Table 1 shows the combination of demand levels (for bicycles and packages) set for each day of the week; the bike requests have been allocated on different days according to the outcomes of the survey (Appendix A.2). On Fridays, the two ODs show average levels of bike (B2) and parcel (P3) requests; on Tuesdays, they are at their minimum (B1, P1), and on Saturdays, they are almost at their maximum (B3, P4). During the remaining days of the week, other combinations of bicycle and package demands are assumed. On Sundays, no parcels are delivered, and the free-floating bike demand is considered maximum (B4).
Table 1.
Free-floating bicycle and parcel demand levels during the week. OD: origin–destination.
The following table (Table 2) displays, as an example, the number of outgoing packages from each post office on one of the Saturdays within the considered time window. The number of the traffic zone to which they belong (darker grey zones in Figure 2) has been reported.
Table 2.
Number of outgoing packages from each post office on one Saturday within the considered Δt (three months).
The remaining parameters set in the optimization model (Equations (1)–(3)) are: γ1 = 1, γ2 = 1, cb = 10, B = 10,000, bl,ξ = 0, and bu,ξ = 100. In this application, the lost users are those belonging to a given travel demand zone who are not able to find a free-floating bicycle to pick up at the desired time within the borders of their origin district.
We perform an optimization (from Equations (1)–(3)) for every set of days (12 Mondays, 12 Tuesdays... etc.) within three months, in order to find the number of bikes bξ to allocate in each zone at the beginning of the operating day.
Hence, we are presuming that a static bicycle relocation is operated during the night, in order to have a different bike distribution at the beginning of each day while keeping the total (the result from the optimization) number of free-floating bikes b in the network unchanged (calibrated according to the highest daily trend among those collected).
More specifically, since we choose the genetic algorithm to find a solution to our minimization problem, we have repeated the optimization 10 times for each set of days of the week. Table 3 shows the median values (of the 10 performed optimizations) of the main results obtained. Each reported median is equal to the sum of that set of values over 12 days (as 12 Mondays, 12 Tuesdays, and so on, falling within the considered time frame of three months).
Table 3.
Median values of the set of optimizations performed for each day of the week during Δt.
Looking at the achieved results, the number of free-floating bicycles to buy in order to guarantee a good system operation, according to the preset parameters, is equal to 1000—that is the highest achieved value. However, it seems that the allocated budget it is never enough to make the objective function (total lost users of the FFBSS) equal to zero: this happens not only during the weekend (resulting in the highest values of Lu and Lud), but even during those weekdays with lower bike requests (B1). Moreover, the largest amount of lost users can be observed among those who have not adhered to the crowdshipping, or to whom no parcels have been assigned (Lu).
In case II, a greater share of users performs the deliveries; consequently, although the sum of Lu and Lud remains substantially unchanged, there is a slight decrease in Lu and an increase in the lost users Lud (those who are willing to perform crowdshipping but do not manage to find an available bicycle within their district). The values of total lost users in cases I and II are not necessarily the same; those reported in the tables are the median values of different repetitions.
If we look at the package deliveries corresponding to case I, during all days (except on Sundays, when no deliveries take place), the number of parcels Ppd to be delivered by the end of each operating day is always greater than zero. This means that no user chooses to travel using the FFBSS between some origin–destination pairs, or that their share η is still not sufficient to match all the delivery requests.
On the contrary, this condition improves considerably in case II: a share of subscriptions equal to 58%, with the possibility for the users to stretch their usual route in order to perform the deliveries, seems to be enough to satisfy all the delivery requests, except on Wednesdays, where there is a strong discrepancy between the level of bike (B1) and parcel (P4) requests. This means that, with greater flexibility in the route selection of those users who adhered to the system, a better outcome can be achieved.
Moreover, as we have assumed for this application that each user can pass by the post office at most once a day and that the bike basket is completely full for each delivery, the number of parcels to be delivered by postmen after T due to the lost users of the system always matches Lud.
Table 4 reports the number of bicycles bξ (resulted from the optimization) to allocate in each zone at the beginning of the day. For each day of the week, these numbers correspond to those obtained at the end of that optimization, among the performed repetitions, which allows reaching the minimum value of the objective function (Equation (1)). The grey columns in Table 4 highlight those districts in which there is a post office.
Table 4.
Bicycle allocation at the beginning of each operating day for every district of the case study.
Regarding the bicycle distribution shown in Table 4, there are some districts without any free-floating bikes at the beginning of the day. These districts correspond to the central zones of the city, where offices and commercial activities are primarily located. This distribution can be explained as the morning trips moving mainly from the peripheral (residential) zones toward the center, which is going to be progressively filled by bikes during the morning hours. This implies that the crowdshipping from the central post offices (those located in districts 10, 18, 27, and 28), which cannot happen during the first operating hour of the day (having zero available bicycles in the corresponding zones), will take place later (late morning/early afternoon) when the trip trends start to show the opposite behavior (from the city center toward the periphery).
Aiming at verifying the achieved results, we have generated a hypothetical demand associated with bikes and parcels (OD bikes and OD packages) for different time windows, still corresponding to a time frame of three months, and potentially covering one year (4 × 3 months) of operation of the system.
These values differentiate from the previous dataset in the OD punctual values; however, their average still remains similar (B1 = 2517, B2 = 2978, B3 = 3423, and B4 = 4207; P1 = 227, P2 = 312, P3 = 459, and P4 = 691).
The free-floating bicycle distribution at the beginning of each day of the week is shown in Table 4; we have calculated the corresponding results in the four selected periods of three months each. The median values are reported in Table 5.
Table 5.
Median values of four time periods Δt of three months each, performed every day of the week.
4.3. Sensitivity Analysis
To investigate the applicability of our proposal to different contexts, the next goal of our research consists of performing a series of sensitivity analyses. These further evaluations are useful to properly set the values of some parameters involved in the optimization, and/or to gain more knowledge about the goals to achieve in the design and implementation phases of the FFBSS crowdshipping proposal.
The following analysis has been implemented on the set of 12 Saturdays within the three-month time frame described in the previous Section 4.2 (the bike/parcel levels of user requests of Table 1 applies here, too). In particular, Saturdays have been preferred to the other days of the week, as they are those with both the highest number of parcels to be delivered and the highest number of lost users in the system. On the basis of this dataset, three different analyses have been done: a preliminary one, by varying only the available budget; a second one, which also varies the available budget and the two weights γ1 e γ2 of the optimization problem at the same time (Equation (1)); and a final one, which varies the available budget together with the share η of the total users that participate in the crowdsourced deliveries.
The goal of the first sensitivity analysis is to verify the outcomes of the system while varying the available budget B (from 5000 to 20,000, with increasing steps of 5000); the remaining input parameters are unchanged. Table 6 shows the achieved results.
Table 6.
Median values obtained while varying the available budget B on a set of 12 Saturdays within a time period Δt of three months (η = 0.58).
On average, case II shows less Lu and more Lud in comparison with case I. Looking at the available budget, regardless of the case, its progressive increase leads to a gradual reduction of the lost users in the system. The amount of Lud becomes equal to zero for B = 15,000, while additional available budget is needed in order to also make Lu equal to zero.
On the other hand, the amount of Ppd is not affected by budget variations. This behavior can be easily justified, as this budget sensitivity analysis has been performed keeping the same levels of bike and parcel requests, and maintaining the number of users willing to support the crowdshipping initiative as unchanged.
A second sensitivity analysis is presented that aims at investigating any possible influence on the total number of lost users in the system due to different values of γ1 and γ2 in the objective function (Equation (1)), while varying the available budget. Having two different weights in the optimization, it is possible to give greater importance to one of the two classes of lost users rather than the other.
The output of the optimization (Equations (1)–(3)) is to calculate the number (and location) of free-floating bikes to distribute among the districts (according to the demand) at the beginning of each operation interval. Therefore, different weights involve arranging the bikes in order to facilitate one category of users over the other when it comes at finding an available bike near the origin of the trips.
In order to promote the crowdshipping among FFBSS users, it may be meaningful to investigate what happens if we assign a greater weight to Lud (i.e., the total lost users among those who would have performed the deliveries). Therefore, we set γ1 = 1, while varying γ2 between 10 and 60 (with increasing steps equal to 10) (Table 7).
Table 7.
Median values obtained while varying the objective function weights (γ1 and γ2) and the available budget B on a set of 12 Saturdays within a time period Δt of three months (η = 0.58).
The following example can improve the general understanding of this analysis: if γ1 = 1 and γ2 = 10, it means that one lost user belonging to Lud (i.e., that potentially could have been able to deliver a parcel if he/she had found an available bike) is considered equivalent to 10 lost users belonging to Lu (i.e., that have not joined the crowdshipping proposal or that have not received any parcel to deliver). The results are summarized in Table 7, for B = 5000 and B = 10,000. The analysis has not been done for the last two values of the budget, giving that for these remaining configurations, the Lud value is equal to zero (Table 6). We have also reported the results associated with a further option, with γ1 = 0 and γ2 = 1, that is, assuming minimizing Lud only, without taking Lu into account.
Looking at Table 7, the Lud values that are obtained when γ2 > γ1 are smaller than those achieved with γ1 = γ2 = 1 (see Table 6 for a comparison). Then, giving a greater importance/weight to Lud can be a possible approach to shrink its value when performing the optimizations.
However, a progressive increase in γ2 (in comparison with γ1) does not seem to imply a parallel reduction in Lud (the only exception is represented by case I, with B = 10,000). The general trend corresponds to a decrease in Lud at first, followed by a subsequent rise as the values assigned to γ2 increases.
This occurs when the FFBSS results are congested—that is, when the total number of available bikes is not sufficient to match the bicycle requests of those users who have to deliver a package. In these configurations, it may be useful to also partially facilitate those users who have not participated in the crowdshipping (Uap) or who do not have any parcel to deliver.
Indeed, their daily bike trips may affect the bicycle distribution on the territory, sometimes generating a sort of rebalance that may allow additional users Uap to find an available bicycle nearby. If we try to minimize only the Lud in the system (setting γ1 = 0 and γ2 = 1), we are not able to find the lowest value of Lud, which could be achievable with different weight combinations.
A final remark concerning this analysis: if the FFBSS is congested and the bikes on the network are not sufficient to fully satisfy the crowdshipping users’ demand, the value of γ2 for such configurations needs to be investigated. A methodology that could help with this issue will be the subject of future research.
One last sensitivity analysis—while varying the available budget together with the share of the total users that adhered to the crowdsourced delivery—has been carried out. In this framework, η varies from 10% to 100%, with increasing steps of 5%. The achieved results are depicted in Figure 3 and shown in Table 8.
Figure 3.
Median values of lost users Lu and Lud obtained while varying the available budget B and the share η on a set of 12 Saturdays within a time period Δt of three months.
Table 8.
Median Ppd values obtained while varying the share η of users willing to subscribe to the crowdshipping initiative, on a set of 12 Saturdays within a time period Δt of three months.
The Ppd values reported in Table 8 are not dependent on any budget variation. The bike and parcels requests are kept unchanged, while the percentage of FFBSS users willing to participate in the crowdshipping initiative is varied. Both in case I and II, the number of parcels Ppd decreases as the share η increases. In particular, lower values are achieved in case II, as the number of users that actually performs deliveries is higher (FFBSS users who are not living in a district where a post office is located are allowed to make parcel deliveries). Moreover, when more than 50% of users adhere to the crowdshipping, Ppd becomes equal to zero for case II. Then, this seems to be a fair share to reach in the network to actually reduce the deliveries that postmen have to carry out after T.
Figure 3 shows the median values of lost users in the system in both cases I and II, while varying the available budget and the share η.
Lu and Lud have mirrored trends; that is, under the same budget conditions, if Lu decreases, Lud increases. This happens since the minimization of the total lost users of the system—when the starting conditions are the same—is not affected by the variation of η. In Figure 3, the trends are not precisely mirrored, as they are depicting the median values.
For each budget condition (more clearly for B = 500), there is a difference between case I and case II trends: if in case I the increase in the value of Lu (and the decrease of Lud) remains stable for each span of η variation, this does not occur in case II, where the trends of Lud and Lu respectively go up and down more sharply (for η equal or less than 0.5). As a matter of fact, for each additional step of η, case II shows a bigger increase (compared with case I) in the number of users that are willing to do crowdsourced deliveries, due to the broader share of FFBSS users included in the crowdshipping of case I.
The lower values of Lud can be recorded at low values of η due to the reduced share of users who have adhered to the crowdshipping. However, lower values of η correspond to high values of Ppd, and as η increases, the Ppd values get smaller. In particular, looking at case II, when η is greater than 0.45, Ppd is equal to 0 (Table 8); then, the Lu and Lud trends are approximately stable. For these configurations of the system, for each OD pair, the number of Ua is greater than the number of parcels to delivery, and then the growth of η does not affect Lud.
As the available budget grows (B = 10,000), the number of lost users (in particular Lud) globally drops, given the greater availability of bicycles on the territory; additionally, the differences between case I and II become gradually smaller. The final results referred to B = 15,000 and B = 20,000 have not been reported in Figure 3, since each value of η basically overlaps with those in Table 6 (with η = 0.58). This means that, with an available budget of 15,000, it is possible in almost any case to make the values of Lud equal to zero (only in a few configurations of η is the median value of Lud equal to 1). This does not happen for Lu values that require a higher budget to become equal to zero as well, regardless of the share η considered.
To summarize, at the levels of bike and parcel requests on Saturdays, with a sufficiently high budget (look at those configurations in which B = 20,000), it becomes possible to have no lost users in the system, avoiding the postmen to deliver additional parcels after T (Pp = 0). This result can be achieved regardless of the share η considered, setting the two objective function weights equal to one. As the available budget decreases, the number of lost users increases, but the value of Lud can be cut down (although with a higher value of Lu) by setting γ2 values greater than γ1. If B is not too low (look at the configurations in which B = 10,000), the total lost users’ values remain low, and the differences between case I and case II are not too noticeable.
On the contrary, if the available budget is not sufficient to match the demand levels (look at the configurations in which B = 5000), the system becomes highly congested, and the differences between case I and II become more evident.
5. Conclusions
With the aim of defining a viable way to encourage more sustainable transportation alternatives, this paper suggests combining the crowdsourced delivery option with a free-floating bike-sharing system (that is, some users of the FFBSS voluntarily accept to distribute post/parcels within the urban territory during their trips). More specifically, it intends a certain share of free-floating users to be willing to hand over small packages while traveling along their OD route, or slightly deviating from it. This activity should not be considered as a second job, or an operation to be carried out systematically during the day, but simply as an alternative way to absorb some of the postal deliveries in exchange for some kind of reward, and as an incentive that may lead to a more intense usage of the FFBSS. The model to optimize and manage this environmentally friendly transport mode has been formally specified and described.
We have obtained promising results from calibrating our model by means of a local survey and applying the proposed free-floating bike-sharing crowdshipping system to a case study that aimed at the minimization of the total number of lost users of the system. Some of those individuals who initially seemed to be not interested in using the free-floating bike-sharing system as a bike rental service alone showed a change of mind if, jointly, they were allowed to perform crowdsourced deliveries with a reward for the accomplishment of these tasks. The FFBSS combined with the crowdshipping may represent an interesting and viable alternative that could take place in different urban realities, especially from the perspective of achieving more sustainable and livable cities.
On one hand, with the suggested approach, we can hope to more generally encourage bike usage by making the FFBSSs more attractive; on the other hand, some disadvantages may arise. Managing the parcel deliveries may become complicated, with some unresolved issues associated with those deliveries that for some reason cannot be completed by the FFBSS users. Furthermore, it would be necessary to regulate user responsibilities regarding parcel damages during the transport.
Our model can also be applied to systems in which parcels are collected from facilities other than post offices (i.e., those deliveries currently performed by private couriers, which are prevalent in e-commerce). However, quite often, the post offices are located within urban contexts, while other kinds of parcel depots are often located farther from more densely populated areas, so it can be difficult to take charge of such requests. Therefore, the model may be easily applied only in the following scenarios:
- if private couriers have access points on the territory, that is, business partners serving as consolidation delivery points for carriers [29] or proximity distribution points;
- if there are smart lockers distributed over the territory [29] that might be partially or entirely designated to be used by those users who are part of the crowdshipping initiative.
In this framework, a model that is able to design the location of urban deposits/smart lockers could help with a more capillary diffusion of the crowdshipping initiative. For instance, the user may drop the parcel in these lockers when it is not possible to perform the delivery due to the absence of the recipient. Further studies could merge our proposal with a network design of the location of the access points/smart lockers.
Another future research direction may consist of a dynamic parcel assignment: the ‘static’ assignment (the one proposed in this study) endows the user with his/her delivery task(s) in the morning and, if he/she does not find an available bike to ride or becomes unavailable during the day, shifts the delivery to a postman after a certain time of the day. A dynamic assignment, on the other hand, could involve a tentative redistribution of the undelivered packages during the day to other incoming users who are (still) available during that day.
This could be an additional possibility to enhance sustainable deliveries by bikes that may further alleviate the main externalities (congestion and pollution caused by urban deliveries) that are usually connected to these systems.
Author Contributions
Conceptualization, L.C.; methodology, L.C. and R.C.; software, L.C.; validation, M.B. and M.O.; formal analysis, L.C. and R.C.; investigation, L.C., R.C., and M.O.; resources, M.B. and M.O.; data curation, L.C. and R.C.; writing—original draft preparation, R.C.; writing—review and editing, L.C., R.C., and M.O.; visualization, R.C.; supervision, M.B. and M.O.; project administration, L.C.; funding acquisition, L.C.
Funding
This research was funded by “Fondo di Sviluppo e Coesione 2007-2013–APQ Ricerca Regione Puglia, Programma regionale a sostegno della specializzazione intelligente e della sostenibilità sociale ed ambientale–FutureInResearch”–Italy, project No. 3T23CY7.
Conflicts of Interest
The authors declare no conflict of interest. The funders had no role in the design of the study; in the collection, analyses, or interpretation of data; in the writing of the manuscript, or in the decision to publish the results.
Notations
| UTOT | total number of users of the FFBSS |
| η | share of the total number of users that have subscribed to the crowdsourced delivery |
| Una | users of the system that have not subscribed to the FFBSS crowdsourced delivery |
| Ua | users of the FFBSS that have subscribed to the crowdsourced delivery |
| Uap | users of the FFBSS to whom a delivery is assigned by T |
| DTOT | total number of daily deliveries |
| P | postmen (persons employed to deliver or collect letters and parcels) |
| δ | share of total daily deliveries expected to be performed by Ua |
| t | generic time interval of an operating day, t = {0, 1, …, ttot} |
| T | fixed time of the day, T < ttot (last hour for Uap to make their share of deliveries) |
| Du | deliveries that users Uap are expected to perform by T |
| Lu | total lost users (they cannot pick up a free-floating bike since they are not able to find one nearby) belonging to the users’ set Una, or to the difference between sets Ua and Uap calculated for each operating day (from t = 0 to t = ttot) |
| Lud | total lost users belonging to the users’ set Uap that could have been able to make a delivery, calculated in the time interval that goes from the beginning of each operating day (t = 0) to T |
| Pptot | total number of parcels to be delivered by P by the end of each operating day |
| Pp | number of parcels to be delivered by P after T due to the lost users Lud in the system |
| Ppd | number of parcels to be delivered by P by the end of each operating day because there has not been a sufficient number of Ua that day traveling between some origin–destination pairs |
| ur(t) | number of users of the FFBSS that pick up a bike within a generic time interval t |
| w | average distance that a user is willing to walk to pick up a free-floating bicycle |
| ξ | generic travel-demand zone/centroid, ξ = {1, 2, …, Γ} |
| Δt | time window in which to collect data associated with the functioning of the system |
| γ1, γ2 | weights of the objective function |
| cb | unitary cost of a free-floating bicycle |
| B | total available budget |
| bξ | total number of free-floating bicycles to allocate in zone ξ at the beginning of the day |
| b | total number of free-floating bicycles to allocate in the system at the beginning of the day |
| α | additional maximum distance (both at the origin and destination of a bike journey) that a user is willing to ride to perform a crowdsourced delivery |
Appendix A
In order to apply the proposed optimization model to the city of Bari, it has been necessary to set some parameters of the model—such as the weekly trends of the cycling mobility and the share of FFBSS users willing to adhere to the crowdshipping initiative. Rather than assume generic values unrelated to the sociocultural context of the Apulia region and, more specifically, of the metropolitan area of Bari, we have decided to ask a sample of people to answer to our questionnaire.
About 1% of the total population of the city, according to the statistics, use the bike as a mode of transport; however, we do not know exactly how these people can be divided according to their age groups. Consequently, we have dispensed our questionnaire mainly to the “youngest” segment of the population, i.e., the one that is probably more inclined (or curious) to use the relatively new technologies on which our proposal is based. In any case, this questionnaire has merely local significance, and it just provides a first analysis/investigation of the potential individual preferences of the interviewees.
Appendix A.1. Sample Description and Travel Behavior
The web-link to the questionnaire was sent to 452 voluntary participants. The sampling matched the characteristics of what seemed to be the core bike-sharing target group (i.e., spread among users in age groups from 18 to 65+, but with the most consistent number of respondents falling in the 25–44 age group [42,43]) (Table A1). Differences in the education and occupational level can be noticed: 76.8% of participants hold a university degree (or equivalent), and the share of unemployed and retired people is particularly small (respectively, 1.8% and 1.5% over the total).
The entire sample description is reported in Table A1.
Table A1.
Sample description.














First of all, respondents have been presented with a few travel behavioral questions, in order to explore their general propensity to use different modes of transport on a normal day. The car was selected by the majority of the respondents (86%) as the preferred travel mode (we gave the respondents the possibility of selecting more than one preferred modal alternative). Public transport is preferred by roughly 30% of them (bus (28.3%) and train (32.5%) were provided as possible alternatives), while bicycles were chosen as one of the favorite modes of transport by only 76 individuals, corresponding to 16.8% of the total share, which is higher than the 1% found in [31]. This might be due to the (younger) population sample that was selected.
Despite the favorable weather conditions and almost flat territory, traveling by bicycle is not common in the metropolitan area of Bari (there is a variety of reasons that may justify this trend, although they have not been investigated in the present study). With this survey, we wanted to ascertain the willingness of people to change their transportation habits if they were given a new opportunity to travel within the city, namely a FFBSS.
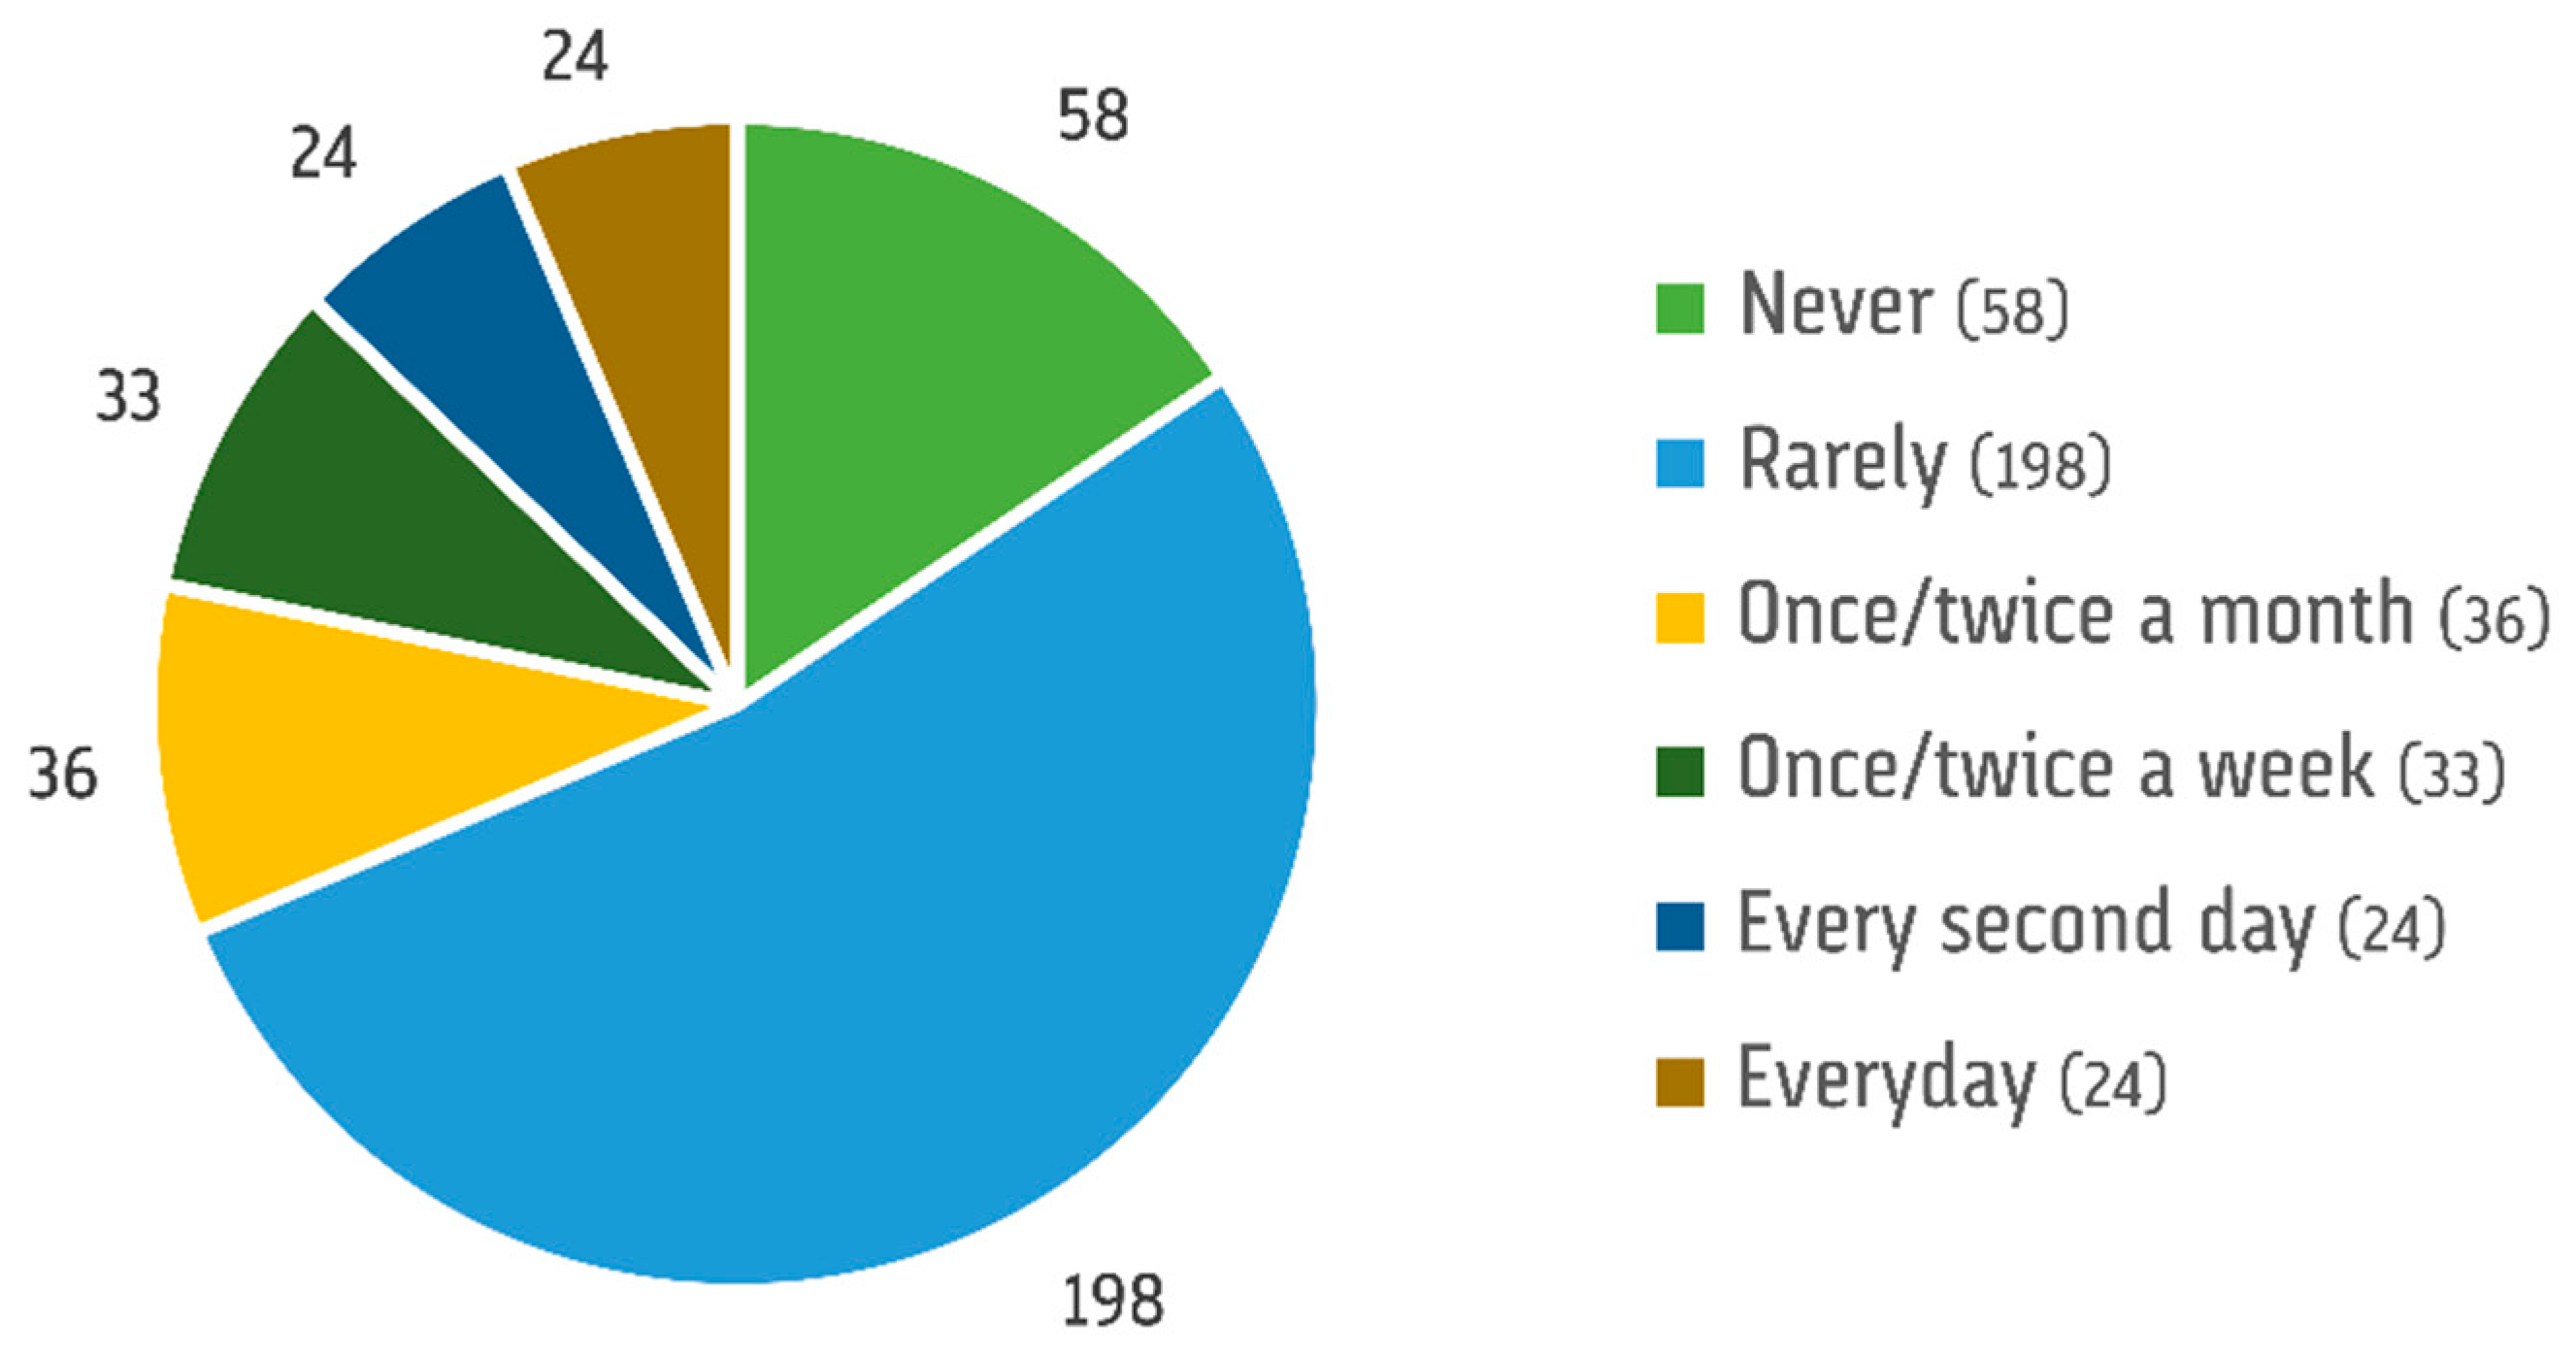
Regarding actual bike ownership, more than 80% of the respondents (373 of them) owned a bicycle or had the possibility of using one if required. Thus, the current frequency of bike usage for those who actually owned/had access to a bicycle is assessed and summarized in Figure A1. Only 31.4% of people, among the subgroup of 373 respondents, use the bike at least once/twice a month.
Figure A1.
Current bike usage in the case study under analysis (over 373 respondents owned/had access to a bicycle).
Appendix A.2. FFBSS-Related Attitudes
At the time the survey was conducted, no shared system was operating in the case study area. However, we have assured that all the respondents were well aware of its main features and functioning by providing a short description of FFBSSs.
Everyone has been invited to express their opinion regarding the general conditions that would lead him/her to use a free-floating bike-sharing system. Only 8.8% (40 individuals over 452) of the respondents declared a lack of interest in using the system, and therefore answering that they would be not willing to participate in it.
The remaining 91.2% of the interviewees can be divided into two groups showing a different attitude regarding adhesion to the FFBSS: 44.9% (over the total 452) would be willing to have an annual membership, while 46.2% of them would be more inclined not to pay an annual fee, and would rather pay hourly according to their actual usage of the system. Considering that most of them rarely ride their own bicycle currently (Figure A1), their willingness to pay only a small amount of money from time to time makes sense.
The next questions in the survey were addressed to gain better knowledge about the different usages of the system in relation to the time of day and day of the week. This last piece of information is important in order to properly set the daily level of bike requests in the case study that we are analyzing.
The FFBSS usage over the days appears well balanced during the week (Figure A2), with a progressive increase during the weekend (a peak is reached on Sundays). The gender differences regarding the weekly usage are not relevant (male and female components, as shown in Figure A2).
Regarding the hourly differences in the usage of the system, the final weekdays and weekend trends that resulted from the survey responses have been depicted in Figure A3. As expected, during the weekdays, the two peaks are related to the early morning and evening rush times (when people reach their job and then go back, in the evening, to their home); in contrast, the weekend trend is globally distributed between 09:00 and 20:00, with peaks in the middle of the morning and afternoon, and a general decrease around lunchtime.
Figure A2.
Potential free-floating bike-sharing system (FFBSS) usage during the different days of the week, divided into male and female components.
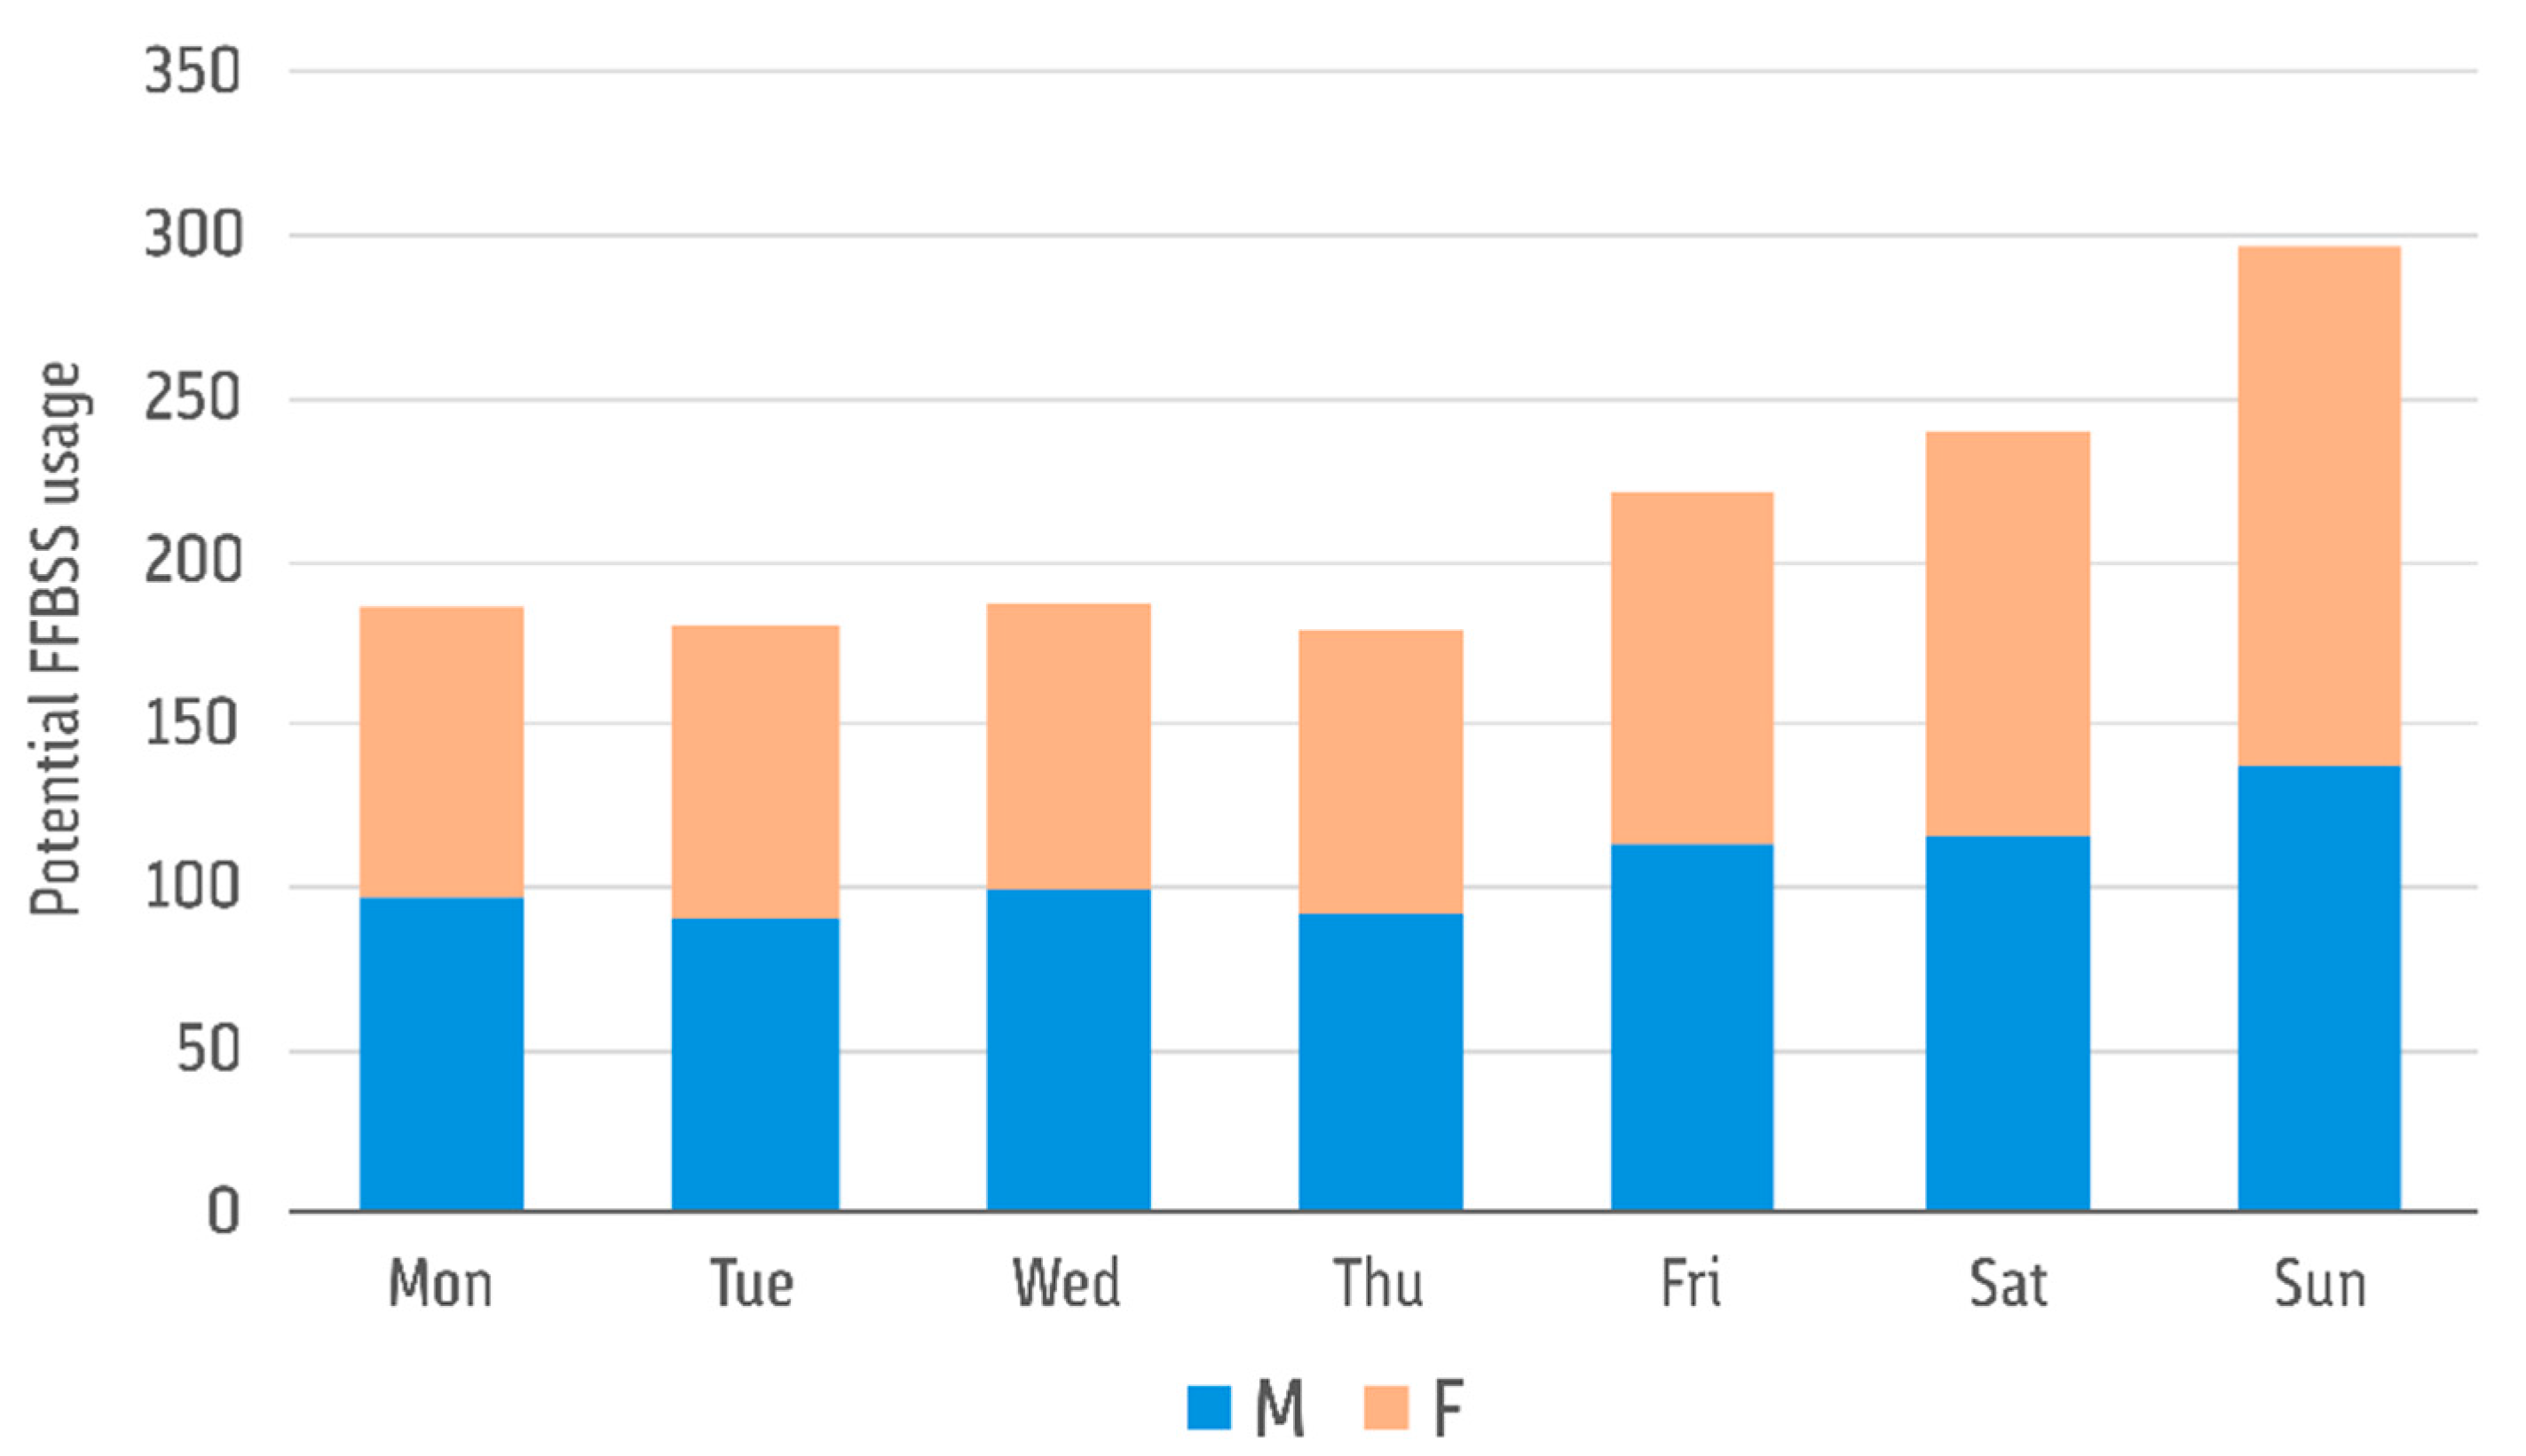
Figure A3.
Potential FFBSS usage during different time slots: weekdays and weekend trends.
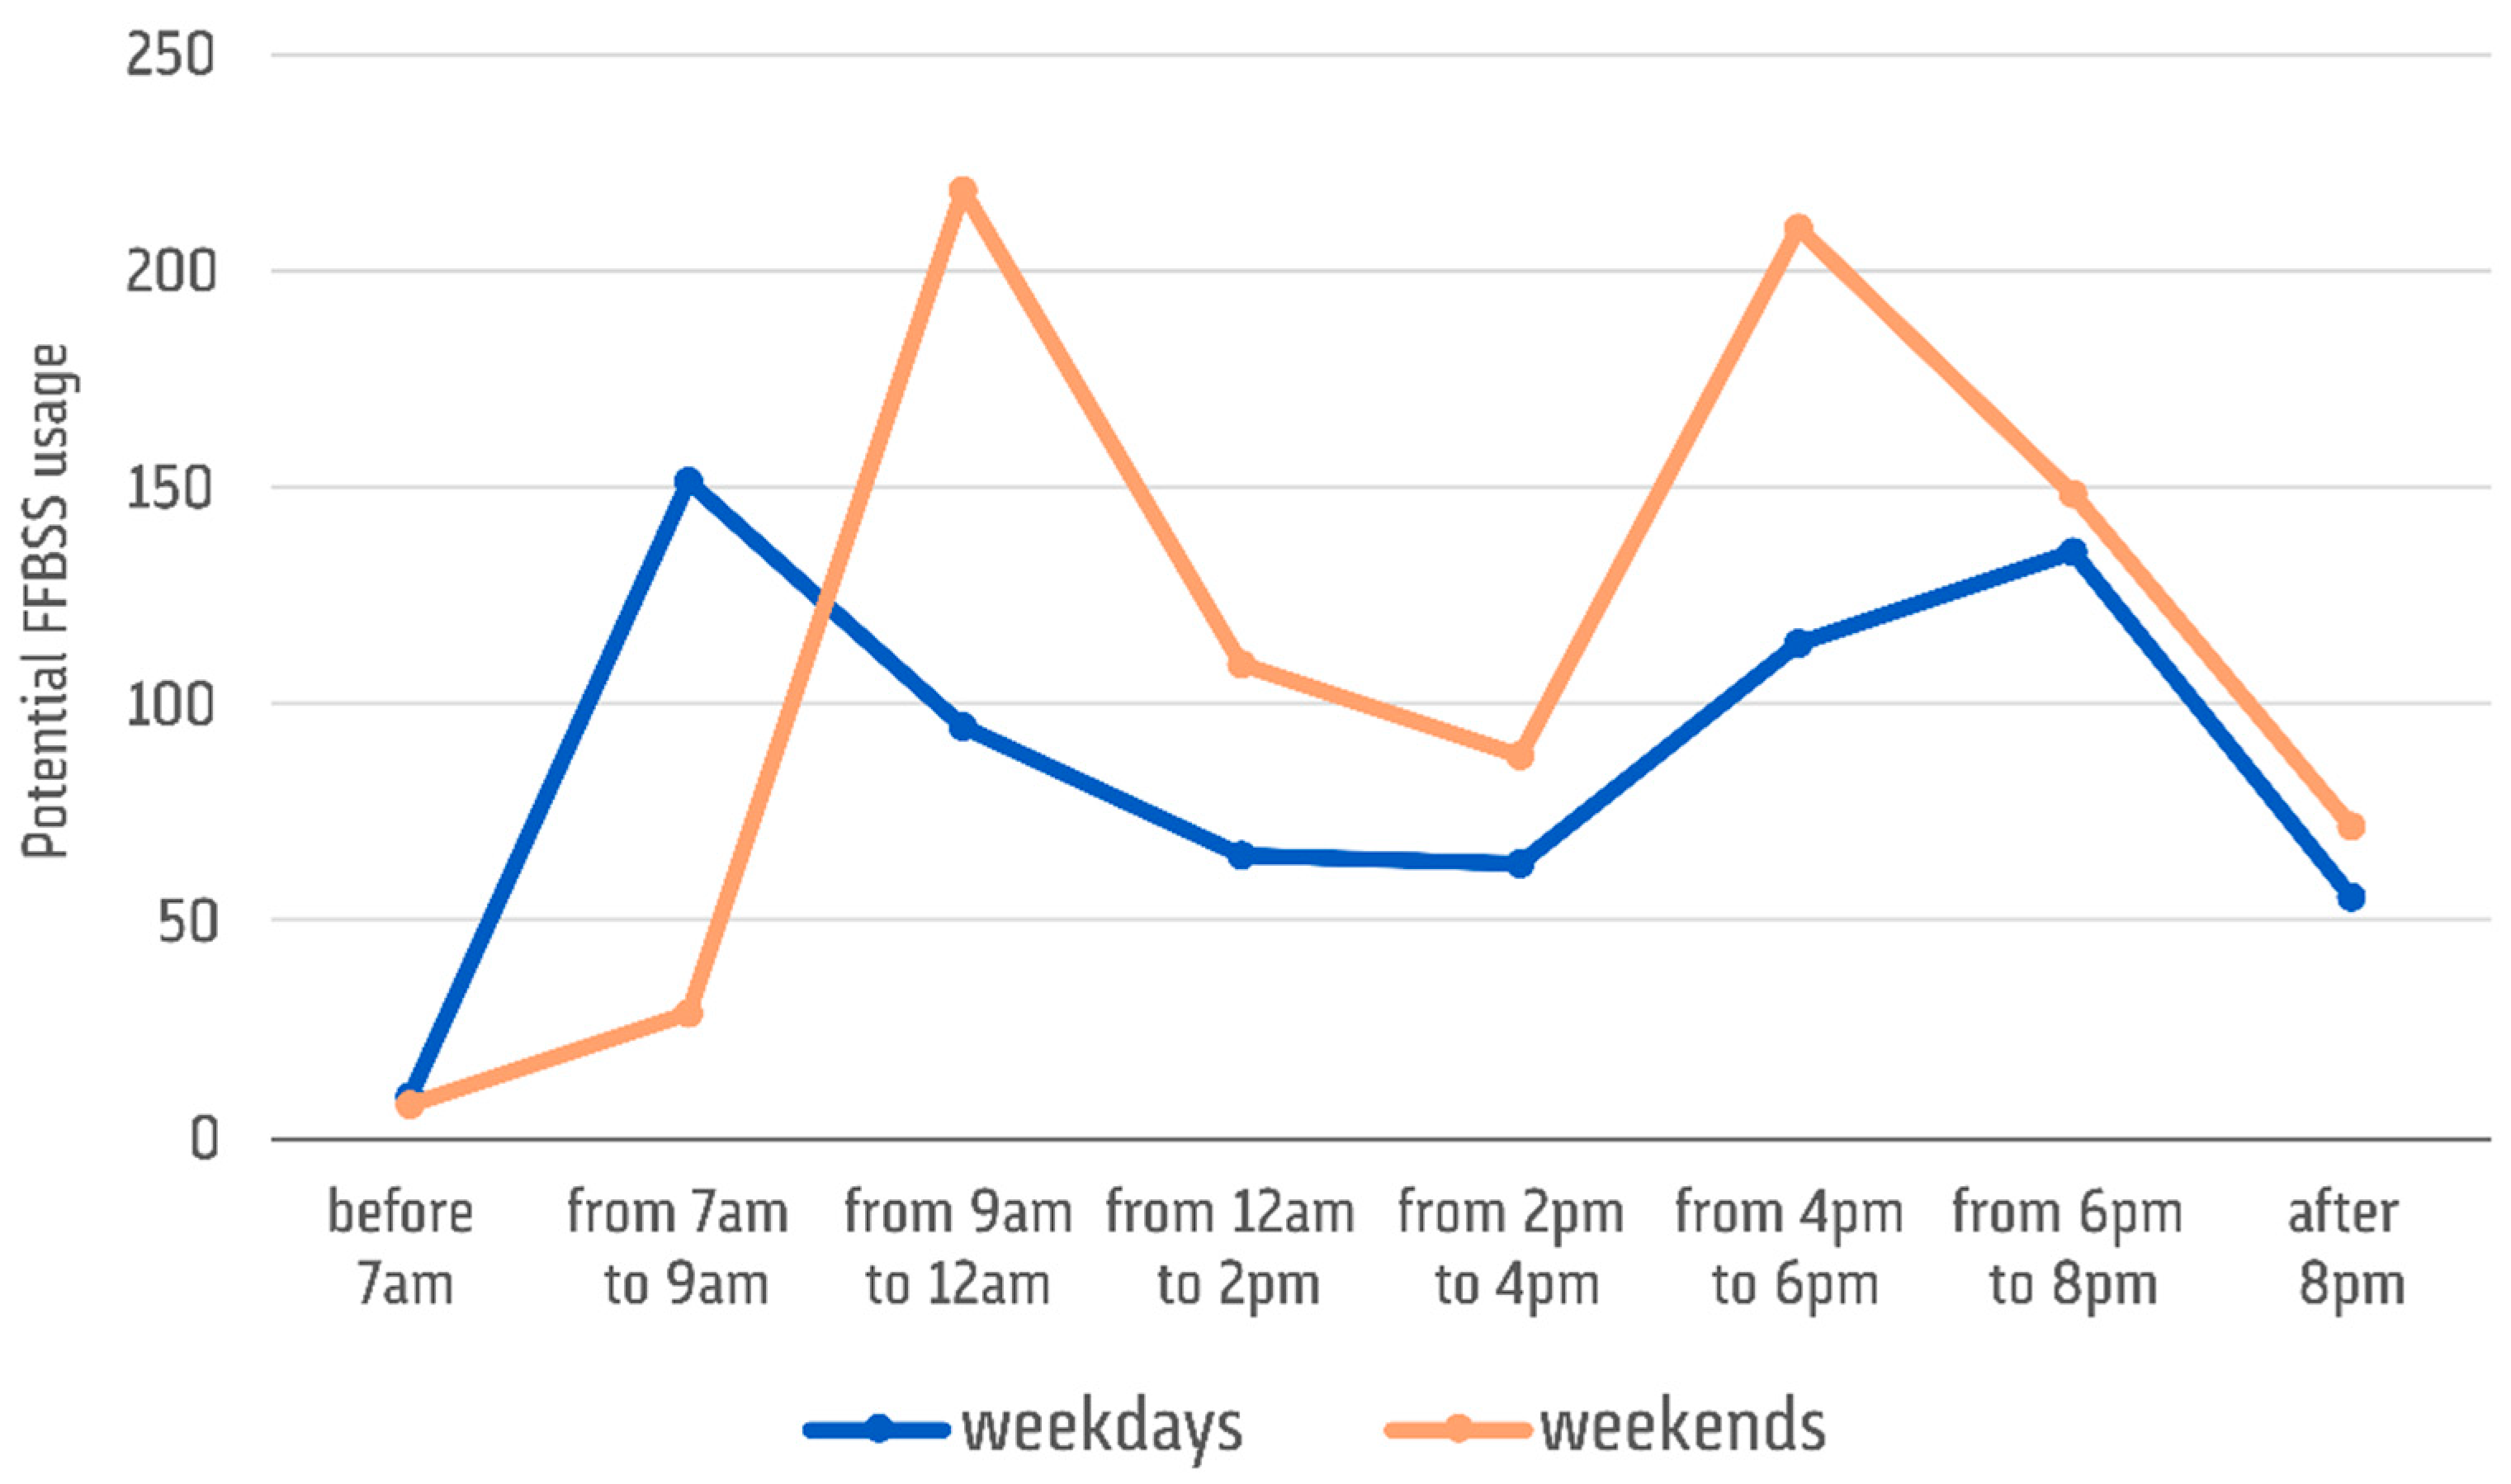
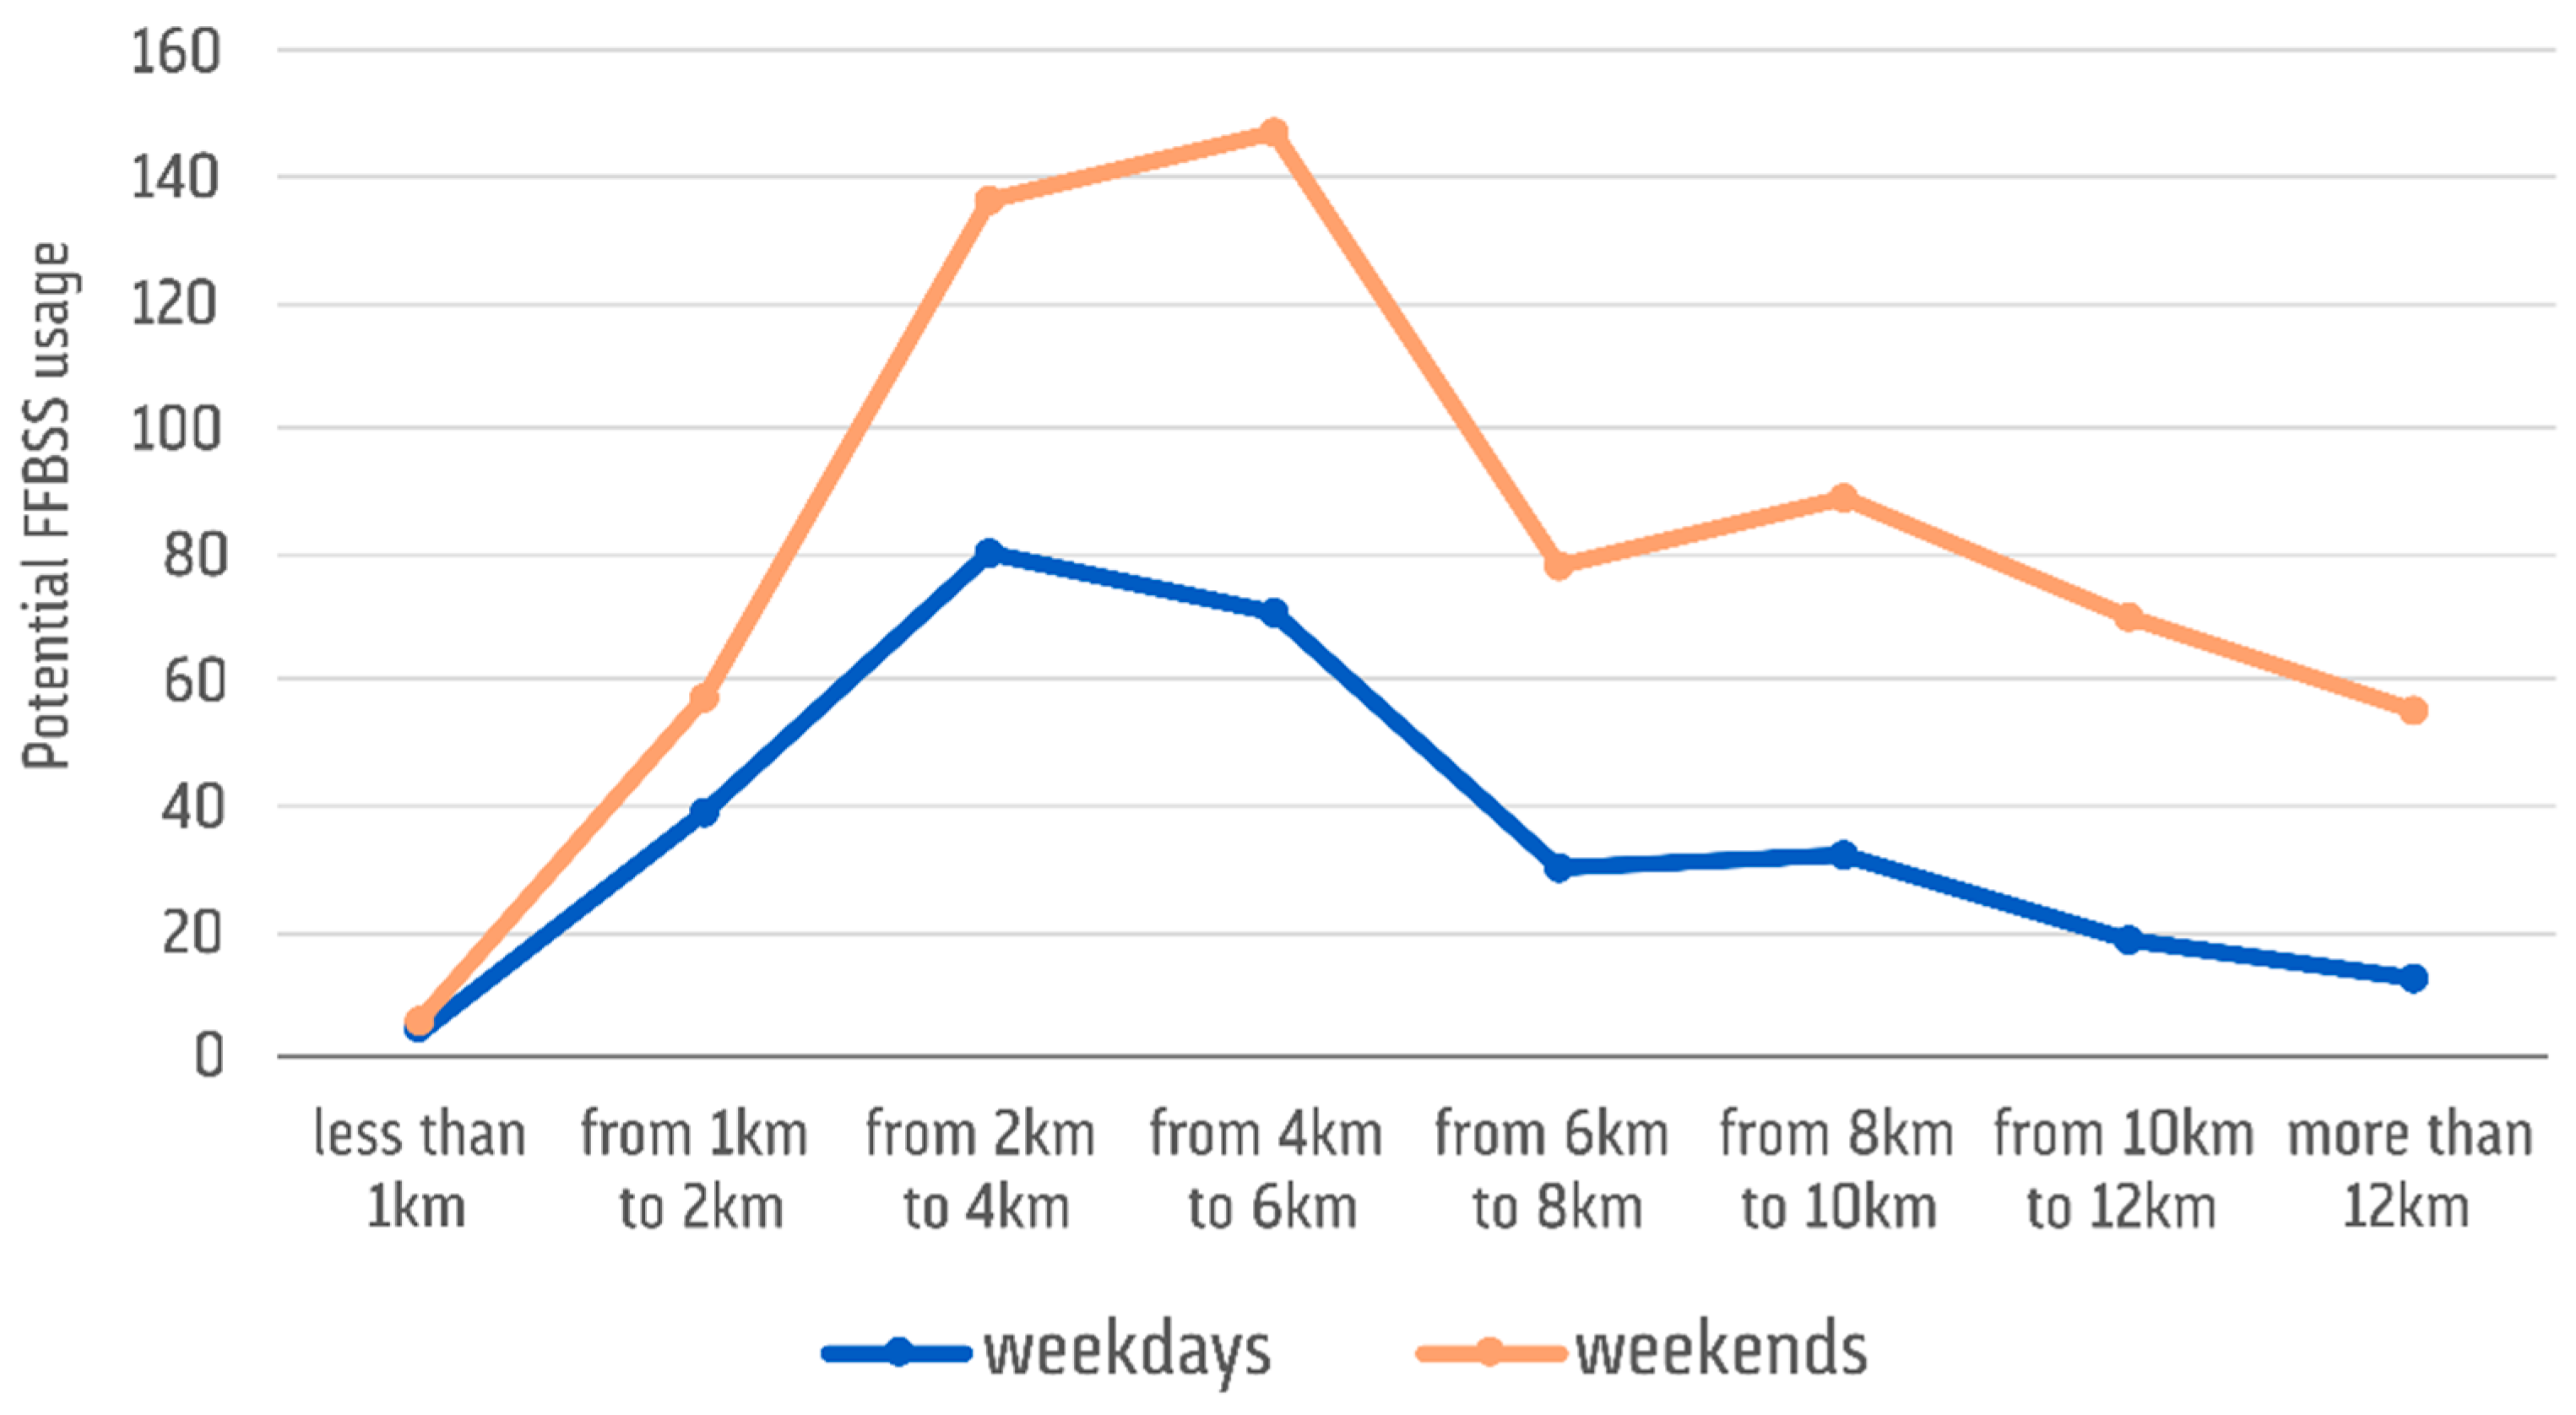
Figure A4 reports the average distances that the respondents are likely to cover while riding a free-floating bike (as mentioned before, the weather conditions in the case study area are usually favorable, and the territory is essentially flat). Almost all of them consider it reasonable to travel for at least a couple of kilometers, and most of them are available to travel (for a round trip) between 2–6 km. Globally, longer distances are expected to be covered during the weekends (orange trend, Figure A4).
Although the respondents are not currently using a FFBSS, on average, their attitude toward the system seems to be positive. We cannot have an exact knowledge of the actual frequency with which they would use the FFBSS if it was implemented on the territory. However, only 10 individuals out of those 58 who asserted to never use a bike right now (Figure A1) showed a lack of interest in the system; the remaining 48 declared to be willing to use it, either through paying an hourly fee or a yearly subscription. This means that the implementation of a FFBSS on the territory could actually encourage more people to use bikes, with all the associated benefits related to this decision in terms of health and traffic congestion, among other factors.
Figure A4.
Maximum distances (round-trip) that FFBSS users are willing to cover: weekdays and weekend trends.
Appendix A.3. Crowdshipping
The last group of survey questions focused on the crowdshipping initiative. As it has been done for the FFBSS attitudes (Appendix A.2), a brief explanation was provided to the respondents regarding the main characteristics of such a proposal. They were asked to state their willingness to carry out parcel deliveries while using a free-floating bike during their daily trips in exchange for small rewards or discounts on the FFBSS: 56.8% (234 individuals) of those who would adhere to the FFBSS (412 in total) agreed.
The rewards that have been mentioned in the survey are free rental minutes within the FFBSS and shopping vouchers for each parcel delivered. For most of the interviewees (170 respondent over 234), 20 free minutes of additional usage would be sufficient, while the remainder would be willing to use the system only with further free rental minutes or shopping vouchers.
Therefore, the issue of the additional distances to cover in order to perform the deliveries (pick up a parcel from the post office and bring it to the delivery address before reaching the final trip destination) has been raised. All of them (100%, see Table A2) were willing to lengthen their usual bike route of at least = 600 m, both at the beginning of their journey, in order to pick up the package, and before reaching their destination, to accomplish the delivery. In total, 1.2 additional kilometers was considered acceptable to be covered by each user while he/she was performing the crowdshipping.
Some of those who indicated interest in the crowdshipping initiative were available to stretch their usual bike route by more than 600 m. The following Table A2 summarizes the average values with the corresponding share of users Ua.
Table A2.
Willingness of Ua to lengthen their usual bike path.
This consideration has been relevant to properly calibrate the average width of each district of the study area and define the two possible scenarios (case I and II) that may occur in an actual implementation of the proposal on the network (see Section 4.2 for further details).
Regarding η (the share of total users who have indicated interest in the crowdsourced initiative): we have previously mentioned that 56.8% of the individuals who would subscribe to the FFBSS agreed to participate in the crowdshipping initiative. However, in addition to this share, we might potentially add two components:
- (a)
- those users who were not initially willing to subscribe to the FFBSS, but would change their mind if the FFBSS was combined with crowdshipping (14 respondents);
- (b)
- those users who were not initially willing to subscribe to the FFBSS combined with the crowdshipping, but would change their mind under particular conditions (Table A3) (42 respondents).
The electric bicycle option is not particularly appealing (Table A3), giving the flat land of the city of Bari. Considering all these considerations, we have summed up the 14 individuals who would change their mind (a) to the 412 users who would participate in the FFBSS from the outset (412 + 14 = 426). We have not considered the additional share (option b in the above list), as it would only occur only under some particular conditions. We can conclude that 248 out of 426 individuals is the total share of respondents who would participate in the crowdshipping; therefore, we can set η = 58%.
Table A3.
Reasons why respondents would change their mind and join the crowdshipping initiative while using the FFBSS.
Further research aims at extending this analysis to a larger population sample, achieving more robust and general results, and at adopting both online and paper questionnaires [44].
References
- Cirianni, F.; Monterosso, C.; Panuccio, P.; Rindone, C. A review methodology of sustainable urban mobility plans: Objectives and actions to promote cycling and pedestrian mobility. In Smart and Sustainable Planning for Cities and Regions. SSPCR 2017. Green Energy and Technology; Bisello, A., Vettorato, D., Laconte, P., Costa, S., Eds.; Springer: Cham, Switzerland, 2018; pp. 685–697. [Google Scholar]
- Ullo, S.; Gallo, M.; Palmieri, G.; Amenta, P.; Russo, M.; Romano, G.; Ferrucci, M.; De Angelis, M. Application of wireless sensor networks to environmental monitoring for sustainable mobility. In Proceedings of the 2018 IEEE International Conference on Environmental Engineering (EE), Milan, Italy, 12–14 March 2018; pp. 1–7. [Google Scholar]
- Carbone, V.; Rouquet, A.; Roussat, C. The Rise of Crowd Logistics: A New Way to Co-Create Logistics Value. J. Bus. Logist. 2017, 38, 238–252. [Google Scholar] [CrossRef] [Scilit]
- Buldeo Rai, H.; Verlinde, S.; Merckx, J.; Macharis, C. Crowd logistics: An opportunity for more sustainable urban freight transport? Eur. Transp. Res. Rev. 2017, 9, 39. [Google Scholar] [CrossRef] [Scilit]
- Gevaers, R.; Van de Voorde, E.; Vanelslander, T. Assessing characteristics of innovative concepts in last-mile logistics and urban distribution. In Proceedings of the 3rd National Urban Freight Conference—Metrans 2009, Long Beach, CA, USA, 21–23 October 2009. [Google Scholar]
- Melo, S.; Baptista, P.; Costa, Á. Comparing the use of small sized electric vehicles with diesel vans on city logistics. Procedia Soc. Behav. Sci. 2014, 111, 350–359. [Google Scholar] [CrossRef] [Scilit]
- de Oliveira, C.M.; Bandeira, R.A.D.M.; Goes, G.V.; Gonçalves, D.N.S.; Márcio De Almeida, D.A. Sustainable Vehicles-Based Alternatives in Last Mile Distribution of Urban Freight Transport: A Systematic Literature Review. Sustainability 2017, 9, 1324. [Google Scholar] [CrossRef] [Scilit]
- Wrighton, S.; Reiter, K. CycleLogistics–moving Europe forward! Transp. Res. Proc. 2016, 12, 950–958. [Google Scholar] [CrossRef] [Scilit]
- Choubassi, C. An Assessment of Cargo Cycles in Varying Urban Contexts. Master’s Thesis, The University of Texas, Austin, TX, USA, May 2015. [Google Scholar]
- Gruber, J.; Kihm, A. Reject or embrace? Messengers and electric cargo bikes. Transp. Res. Proc. 2016, 12, 900–910. [Google Scholar] [CrossRef] [Scilit]
- Melo, S.; Baptista, P. Evaluating the impacts of using cargo cycles on urban logistics: Integrating traffic, environmental and operational boundaries. Eur. Transp. Res. Rev. 2017, 9, 30. [Google Scholar] [CrossRef] [Scilit]
- Maes, J.; Vanelslander, T. The use of bicycle messengers in the logistics chain, concepts further revised. Procedia Soc. Behav. Sci. 2012, 39, 409–423. [Google Scholar] [CrossRef] [Scilit]
- Rougès, J.F.; Montreuil, B. Crowdsourcing delivery: New interconnected business models to reinvent delivery. In Proceedings of the 1st International Physical Internet Conference, Quebec City, QC, Canada, 28–30 May 2014. [Google Scholar]
- Chen, C.; Pan, S. Using the Crowd of Taxis to Last Mile Delivery in E-Commerce: A methodological research. In Service Orientation in Holonic and Multi-Agent Manufacturing. Studies in Computational Intelligence; Borangiu, T., Trentesaux, D., Thomas, A., McFarlane, D., Eds.; Springer: Cham, Switzerland, 2016; Volume 640, pp. 61–70. [Google Scholar]
- Kafle, N.; Zou, B.; Lin, J. Design and modeling of a crowdsource-enabled system for urban parcel relay and delivery. Transp. Res. Part B Methodol. 2017, 99, 62–82. [Google Scholar] [CrossRef] [Scilit]
- Estellés-Arolas, E.; González-Ladrón-De-Guevara, F. Towards an Integrated Crowdsourcing Definition. J. Inf. Sci. 2012, 38, 189–200. [Google Scholar] [CrossRef] [Scilit]
- Arslan, A.; Agatz, N.; Kroon, L.; Zuidwijk, R. Crowdsourced delivery—A dynamic pickup and delivery problem with ad hoc drivers. Transp. Sci. 2019, 53, 222–235. [Google Scholar] [CrossRef] [Scilit]
- Buldeo Rai, H.; Verlinde, S.; Macharis, C. Shipping outside the box. Environmental impact and stakeholder analysis of a crowd logistics platform in Belgium. J. Clean. Prod. 2018, 202, 806–816. [Google Scholar] [CrossRef] [Scilit]
- Paloheimo, H.; Lettenmeier, M.; Waris, H. Transport reduction by crowdsourced deliveries—A library case in Finland. J. Clean. Prod. 2016, 132, 240–251. [Google Scholar] [CrossRef] [Scilit]
- McKinnon, A.C. 3D printing, drones and crowdshipping: City logistics game-changers or over-hyped curiosities. In Proceedings of the Urban Freight and Behavior Change (URBE), Rome, Italy, 1–2 October 2015. [Google Scholar]
- Chen, W.; Mes, M.; Schutten, M. Multi-hop driver-parcel matching problem with time windows. Flex. Serv. Manuf. J. 2018, 30, 517–553. [Google Scholar] [CrossRef] [Scilit]
- Qi, W.; Li, L.; Liu, S.; Shen, Z.J.M. Shared Mobility for Last-Mile Delivery: Design, Operational Prescriptions, and Environmental Impact. Manuf. Serv. Oper. Manag. 2018, 20, 737–751. [Google Scholar] [CrossRef] [Scilit]
- Archetti, C.; Savelsbergh, M.; Speranza, M.G. The vehicle routing problem with occasional drivers. Eur. J. Oper. Res. 2016, 254, 472–480. [Google Scholar] [CrossRef] [Scilit]
- Cleophas, C.; Cottrill, C.; Ehmke, J.F.; Tierney, K. Collaborative urban transportation: Recent advances in theory and practice. Eur. J. Oper. Res. 2019, 273, 801–816. [Google Scholar] [CrossRef] [Scilit]
- Punel, A.; Ermagun, A.; Stathopoulos, A. Studying determinants of crowd-shipping use. Travel Behav. Soc. 2018, 12, 30–40. [Google Scholar] [CrossRef] [Scilit]
- Marcucci, E.; Le Pira, M.; Carrocci, C.S.; Gatta, V.; Pieralice, E. Connected shared mobility for passengers and freight: Investigating the potential of crowdshipping in urban areas. In Proceedings of the 2017 5th IEEE International Conference on Models and Technologies for Intelligent Transportation Systems (MT-ITS), Naples, Italy, 26–28 June 2017; pp. 839–843. [Google Scholar]
- Ermagun, A.; Stathopoulos, A. To bid or not to bid: An empirical study of the supply determinants of crowd-shipping. Transp. Res. Part A Policy Pract. 2018, 116, 468–483. [Google Scholar] [CrossRef] [Scilit]
- Pal, A.; Zhang, Y. Free-floating bike sharing: Solving real-life large-scale static rebalancing problems. Transp. Res. Part C Emerg. Technol. 2017, 80, 92–116. [Google Scholar] [CrossRef] [Scilit]
- Faugere, L.; Montreuil, B. Hyperconnected City Logistics: Smart Lockers Terminals & Last Mile Delivery Networks. In Proceedings of the 3rd International Physical Internet Conference, Atlanta, GA, USA, 29 June–1 July 2016. [Google Scholar]
- Kabra, A.; Belavina, E.; Girotra, K. Bike-Share Systems: Accessibility and Availability. Working Paper, Chicago Booth Research Paper No. 15-04. 2016. Available online: https://ssrn.com/abstract=2555671 (accessed on 3 May 2019).
- EPOMM. Available online: http://www.epomm.eu/tems/ (accessed on 3 May 2019).
- Comune di Bari. Available online: https://www.comune.bari.it/-/muvt-bando-contributi-per-l-acquisto-di-biciclette-489-domande-in-poco-piu-di-24-ore (accessed on 3 May 2019).
- La Repubblica. Available online: https://bari.repubblica.it/cronaca/2018/10/25/news/bari_bike-209969353/ (accessed on 3 May 2019).
- Herrmann, S.; Schulte, F.; Voß, S. Increasing acceptance of free-floating car sharing systems using smart relocation strategies: A survey based study of car2go Hamburg. In Computational Logistics. ICCL 2014. Lecture Notes in Computer Science; González-Ramírez, R.G., Schulte, F., Voß, S., Ceroni Díaz, J.A., Eds.; Springer: Cham, Switzerland, 2016; Volume 8760, pp. 151–162. [Google Scholar]
- Kopp, J.; Gerike, R.; Axhausen, K.W. Do sharing people behave differently? An empirical evaluation of the distinctive mobility patterns of free-floating car-sharing members. Transportation 2015, 42, 449–469. [Google Scholar] [CrossRef] [Scilit]
- Becker, H.; Ciari, F.; Axhausen, K.W. Comparing car-sharing schemes in Switzerland: User groups and usage patterns. Transp. Res. Part A Policy Pract. 2017, 97, 17–29. [Google Scholar] [CrossRef] [Scilit]
- Reiss, S.; Paul, F.; Bogenberger, K. Empirical analysis of Munich’s free-floating bike sharing system: GPS-booking data and customer survey among Bikesharing users. In Proceedings of the Transportation Research Board Annual Meeting, Washington, DC, USA, 11–15 September 2015. [Google Scholar]
- Du, M.; Cheng, L. Better Understanding the Characteristics and Influential Factors of Different Travel Patterns in Free-Floating Bike Sharing: Evidence from Nanjing, China. Sustainability 2018, 10, 1244. [Google Scholar] [CrossRef] [Scilit]
- Xin, F.; Chen, Y.; Wang, X.; Chen, X. Cyclist Satisfaction Evaluation Model for Free-Floating Bike-Sharing System: A Case Study of Shanghai. Transp. Res. Rec. 2018, 2672, 21–32. [Google Scholar] [CrossRef] [Scilit]
- Krause, E.F. Taxicab geometry. Math. Teach. 1973, 66, 695–706. [Google Scholar]
- Caggiani, L.; Camporeale, R.; Ottomanelli, M.; Szeto, W.Y. A modeling framework for the dynamic management of free-floating bike-sharing systems. Transp. Res. Part C Emerg. Technol. 2018, 87, 159–182. [Google Scholar] [CrossRef] [Scilit]
- Sener, I.N.; Eluru, N.; Bhat, C.R. Who are bicyclists? Why and how much are they bicycling? Transp. Res. Rec. 2009, 2134, 63–72. [Google Scholar] [CrossRef] [Scilit]
- CoMoUK. Available online: https://como.org.uk/wp-content/uploads/2018/06/Public-Bike-Share-User-Survey-2017-A4-WEB-1.pdf (accessed on 20 January 2019).
- Dillman, D.; Smyth, J.D.; Christian, M. Internet, Mail and Mixed-Mode Surveys: The Tailired Design Method, 3rd ed.; John Wiley & Sons, Inc.: New York, NY, USA, 2009. [Google Scholar]
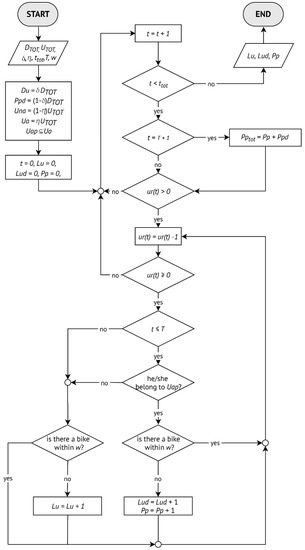
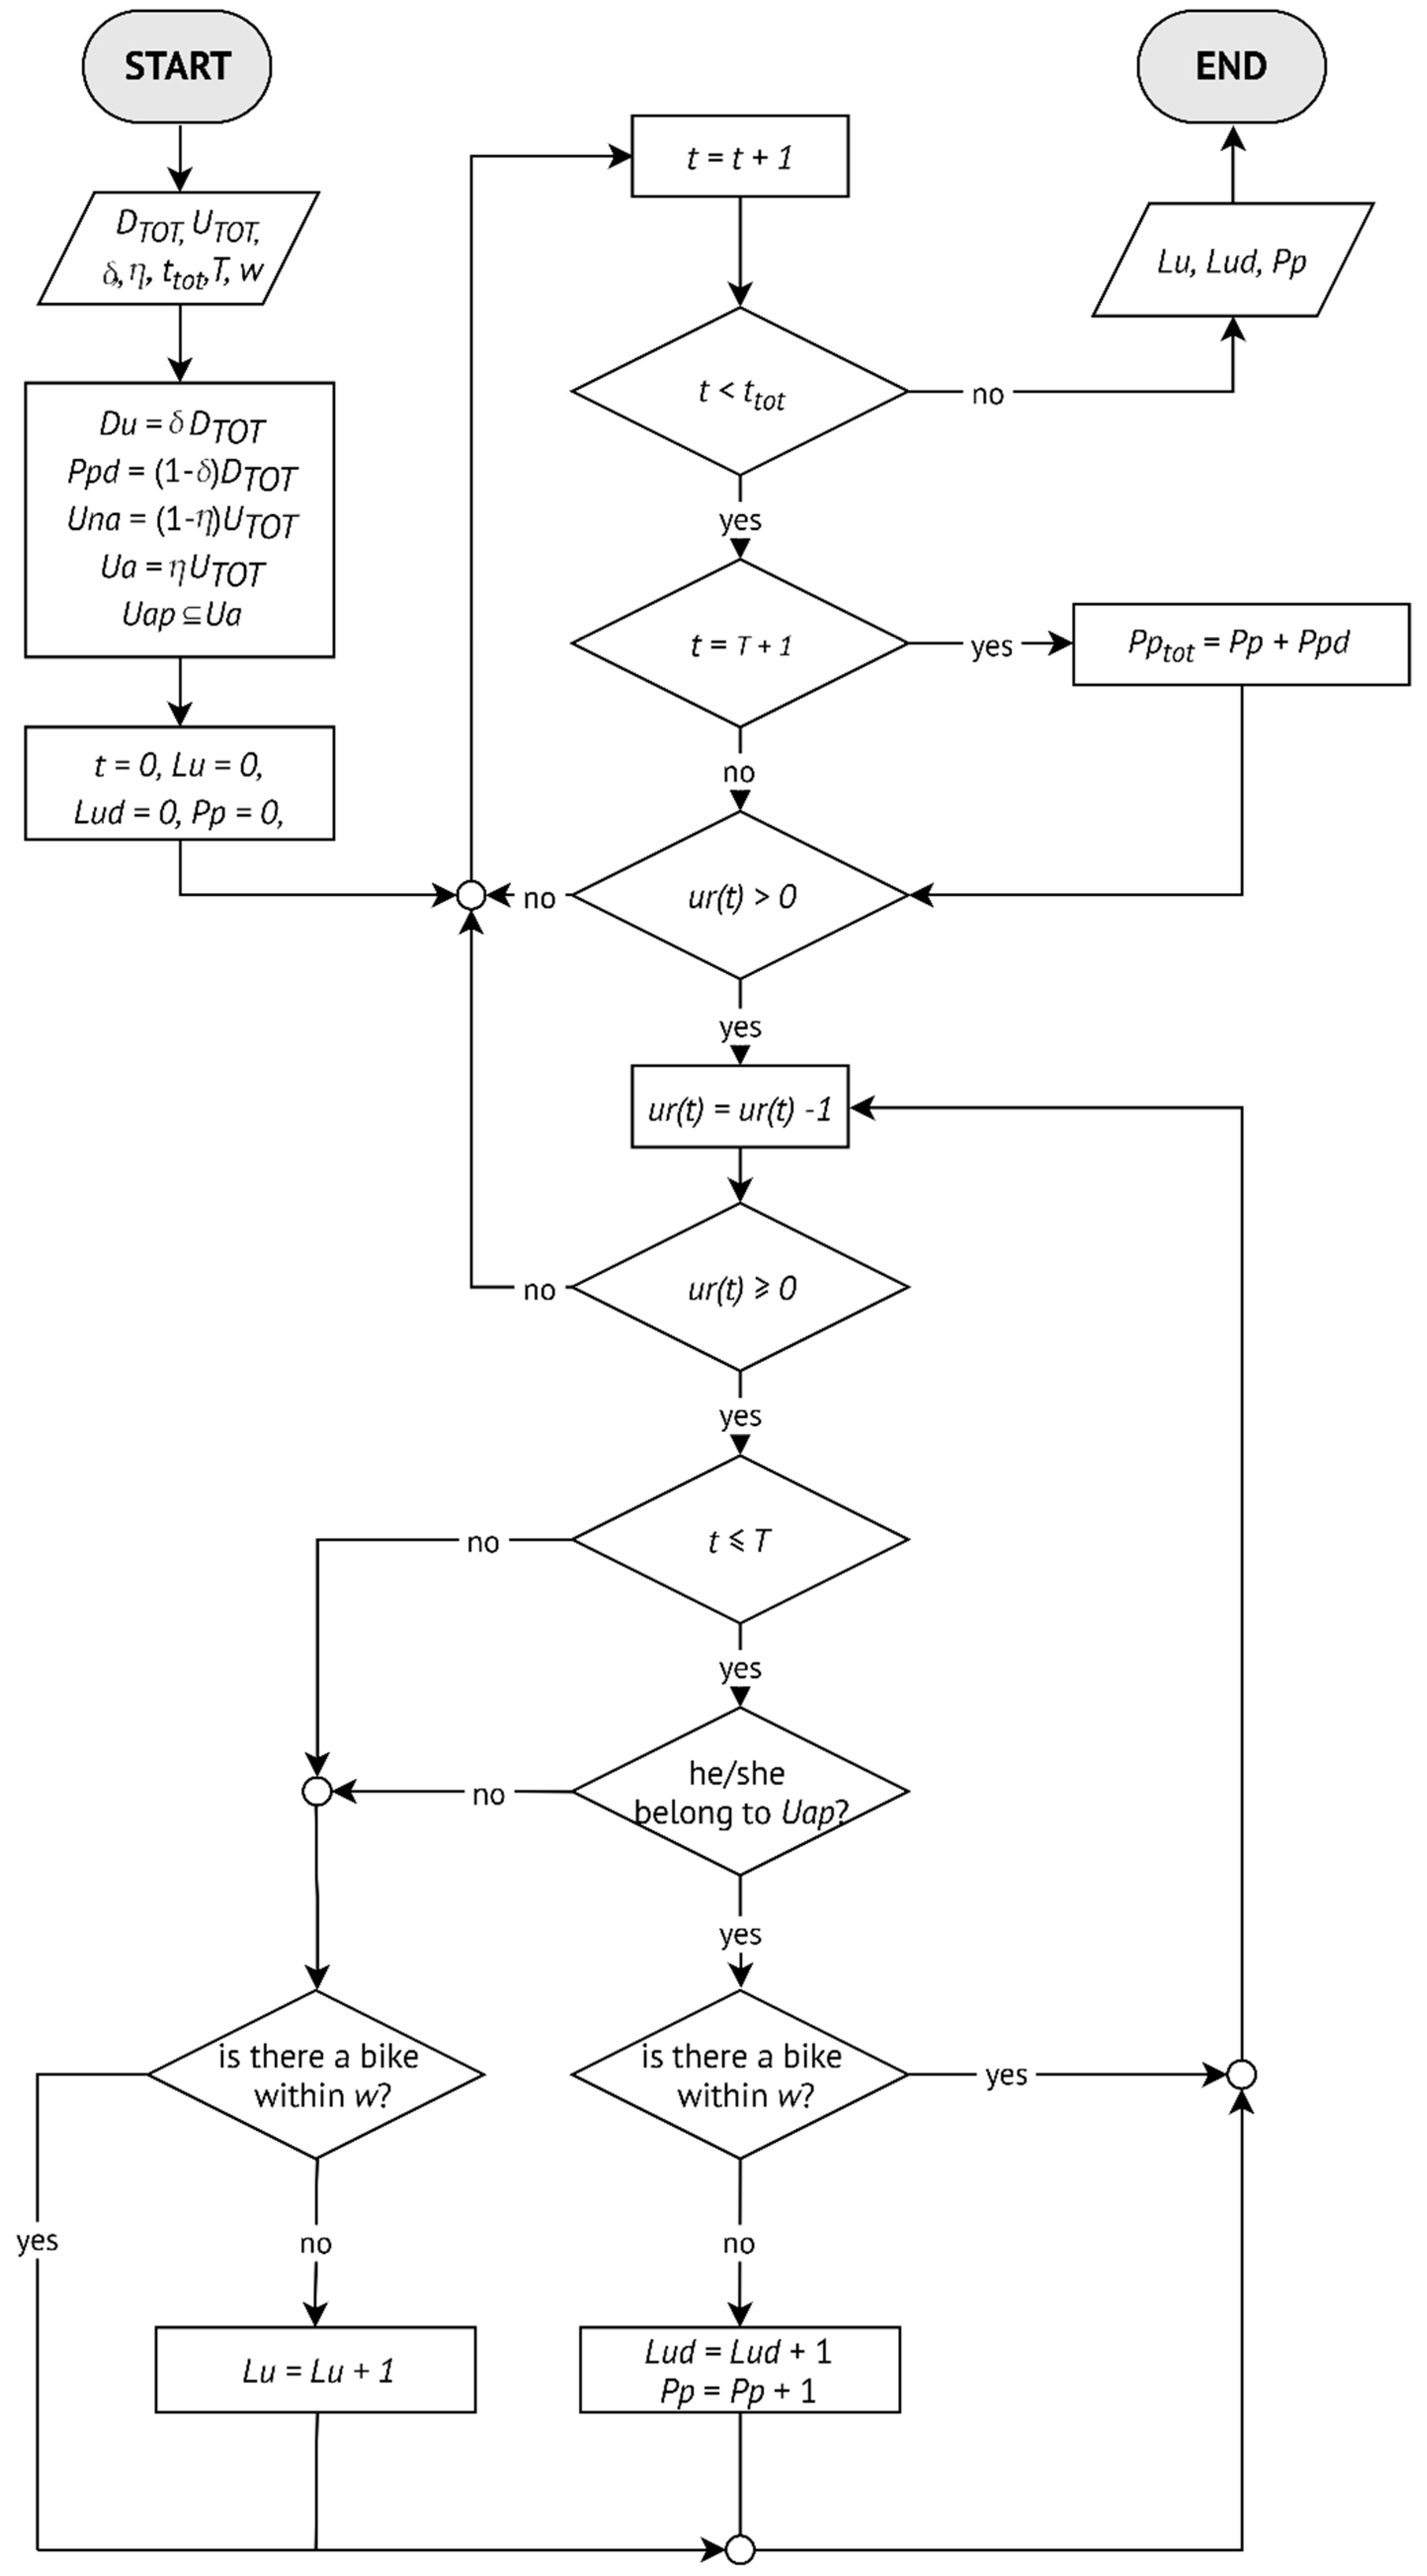
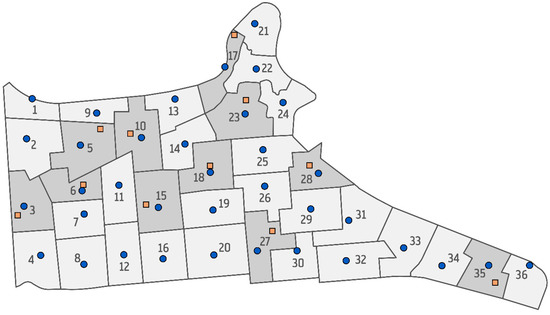
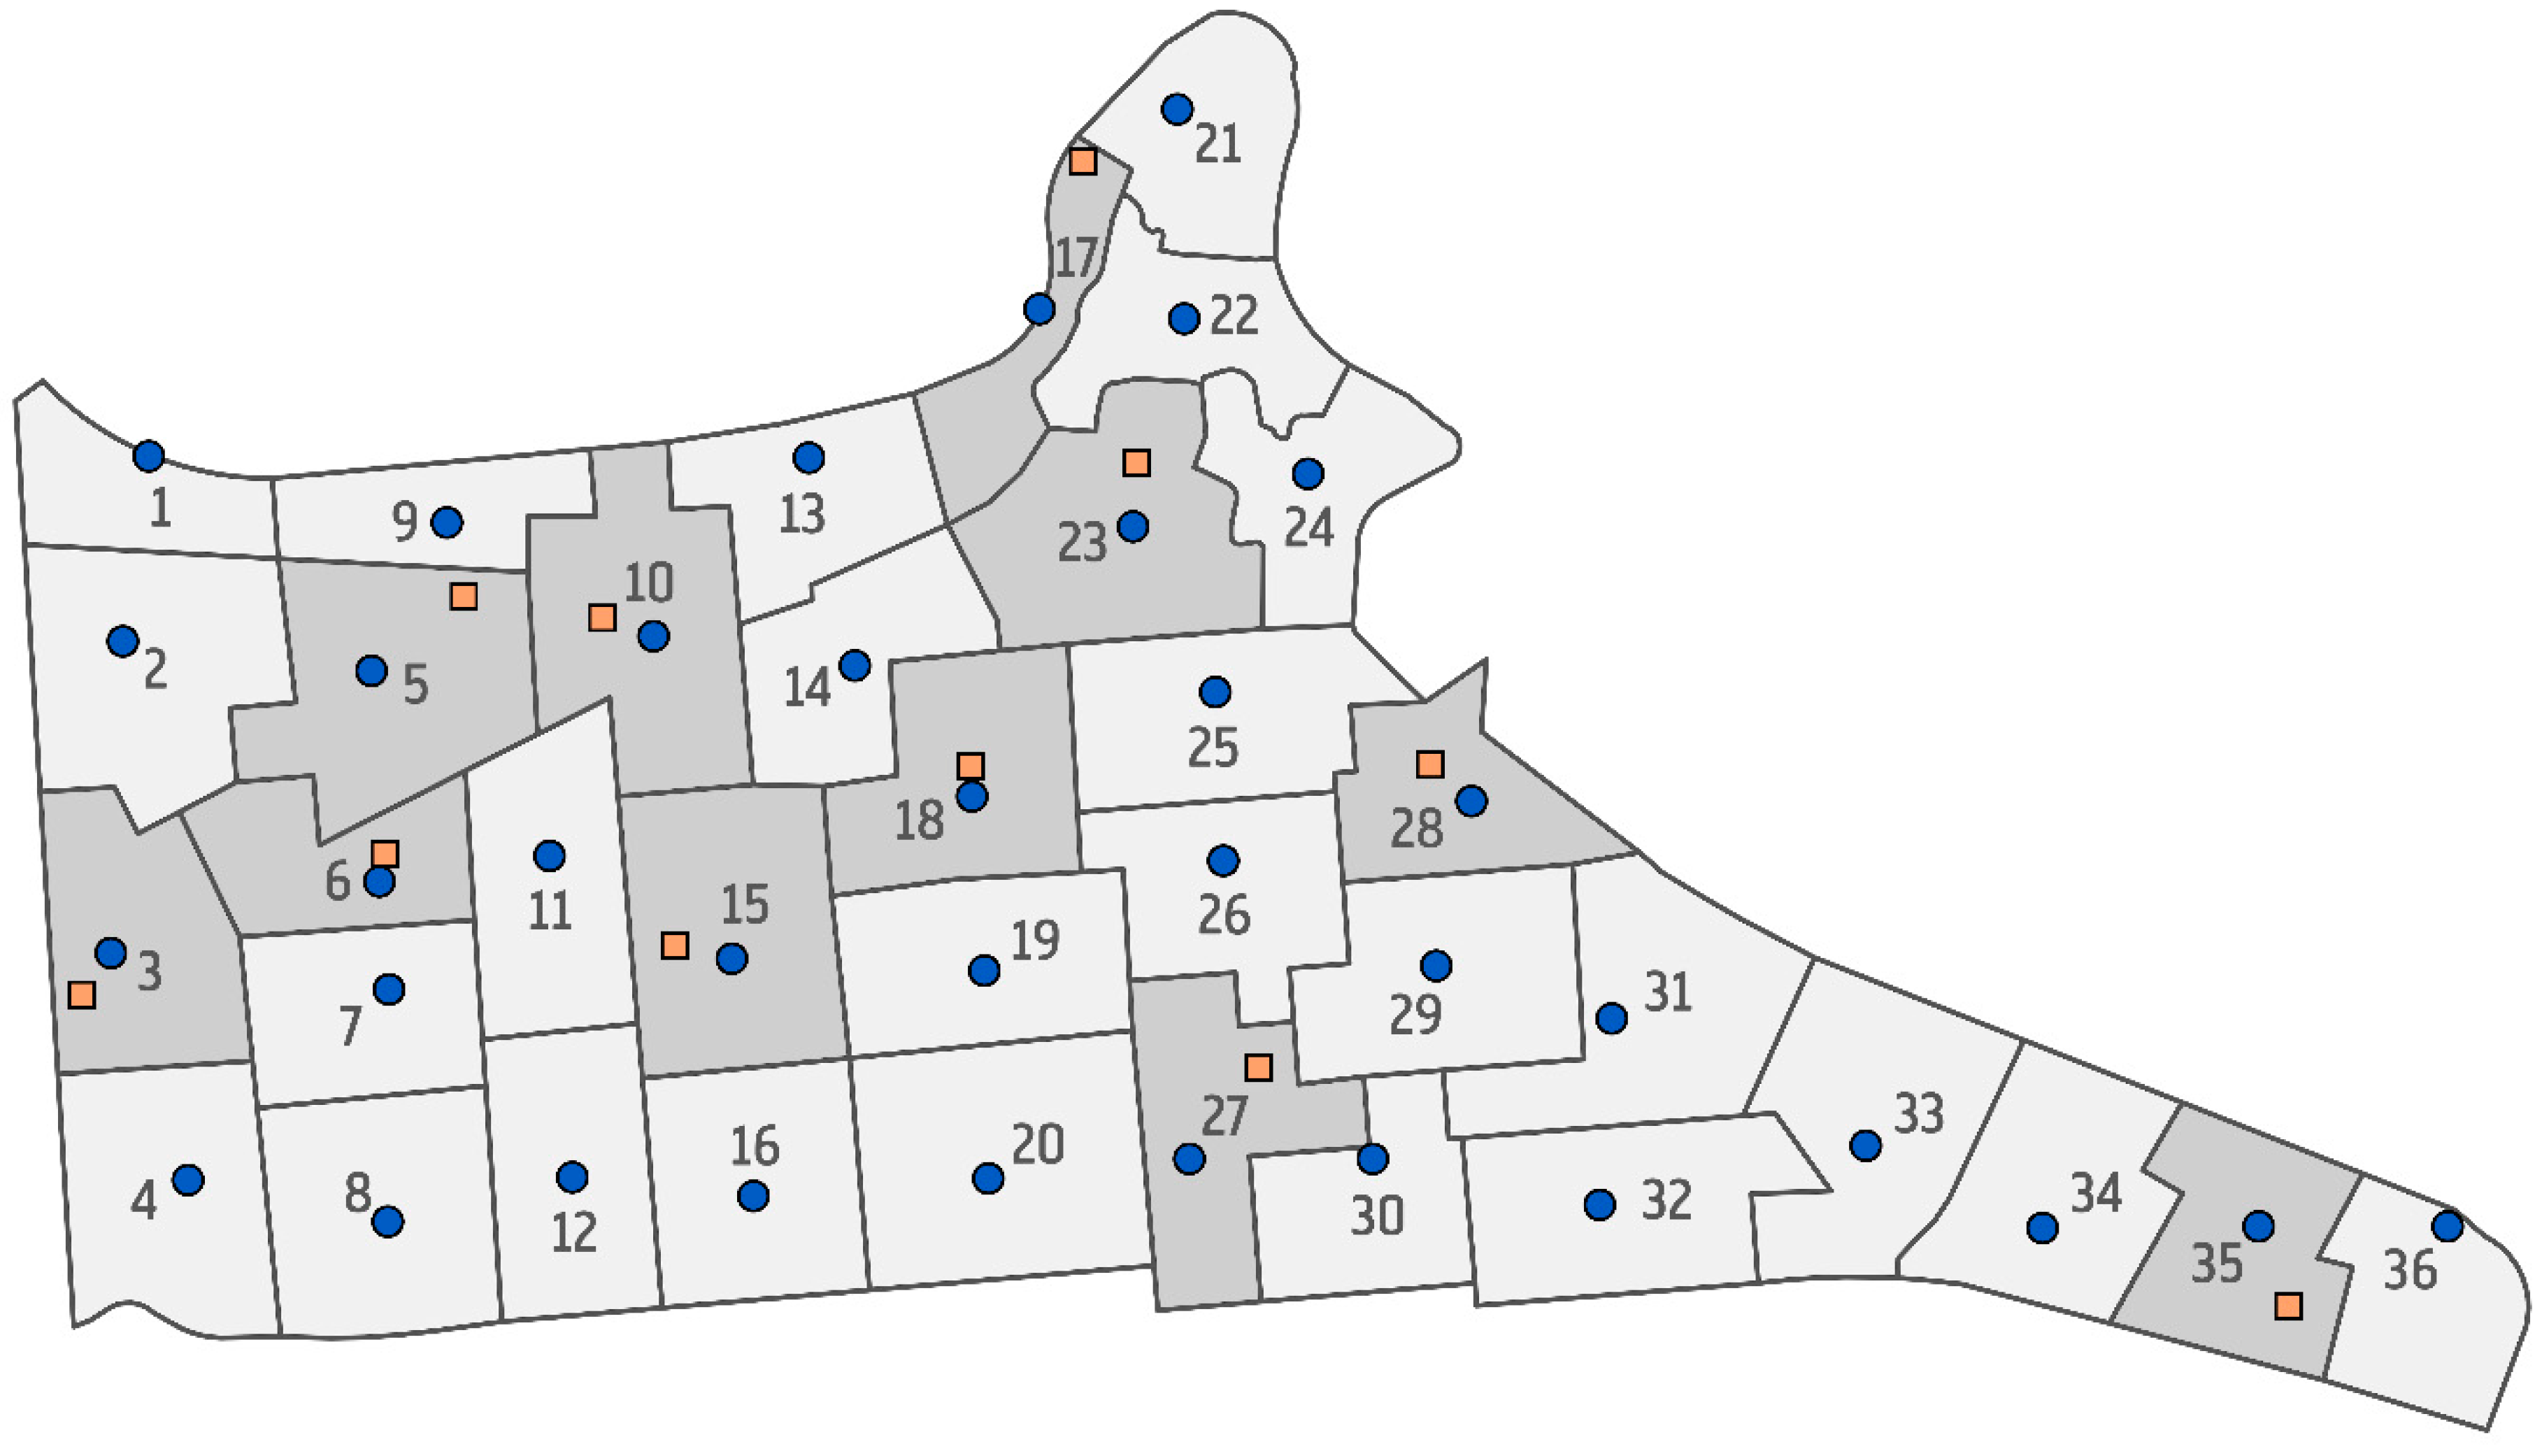
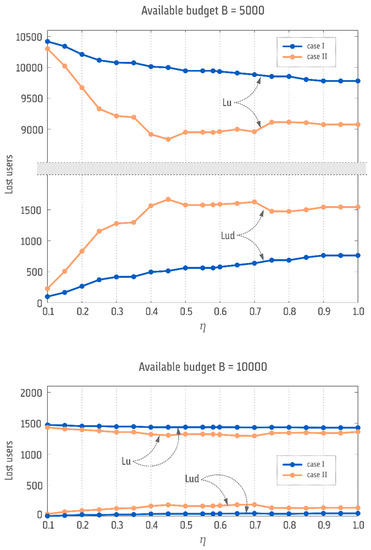
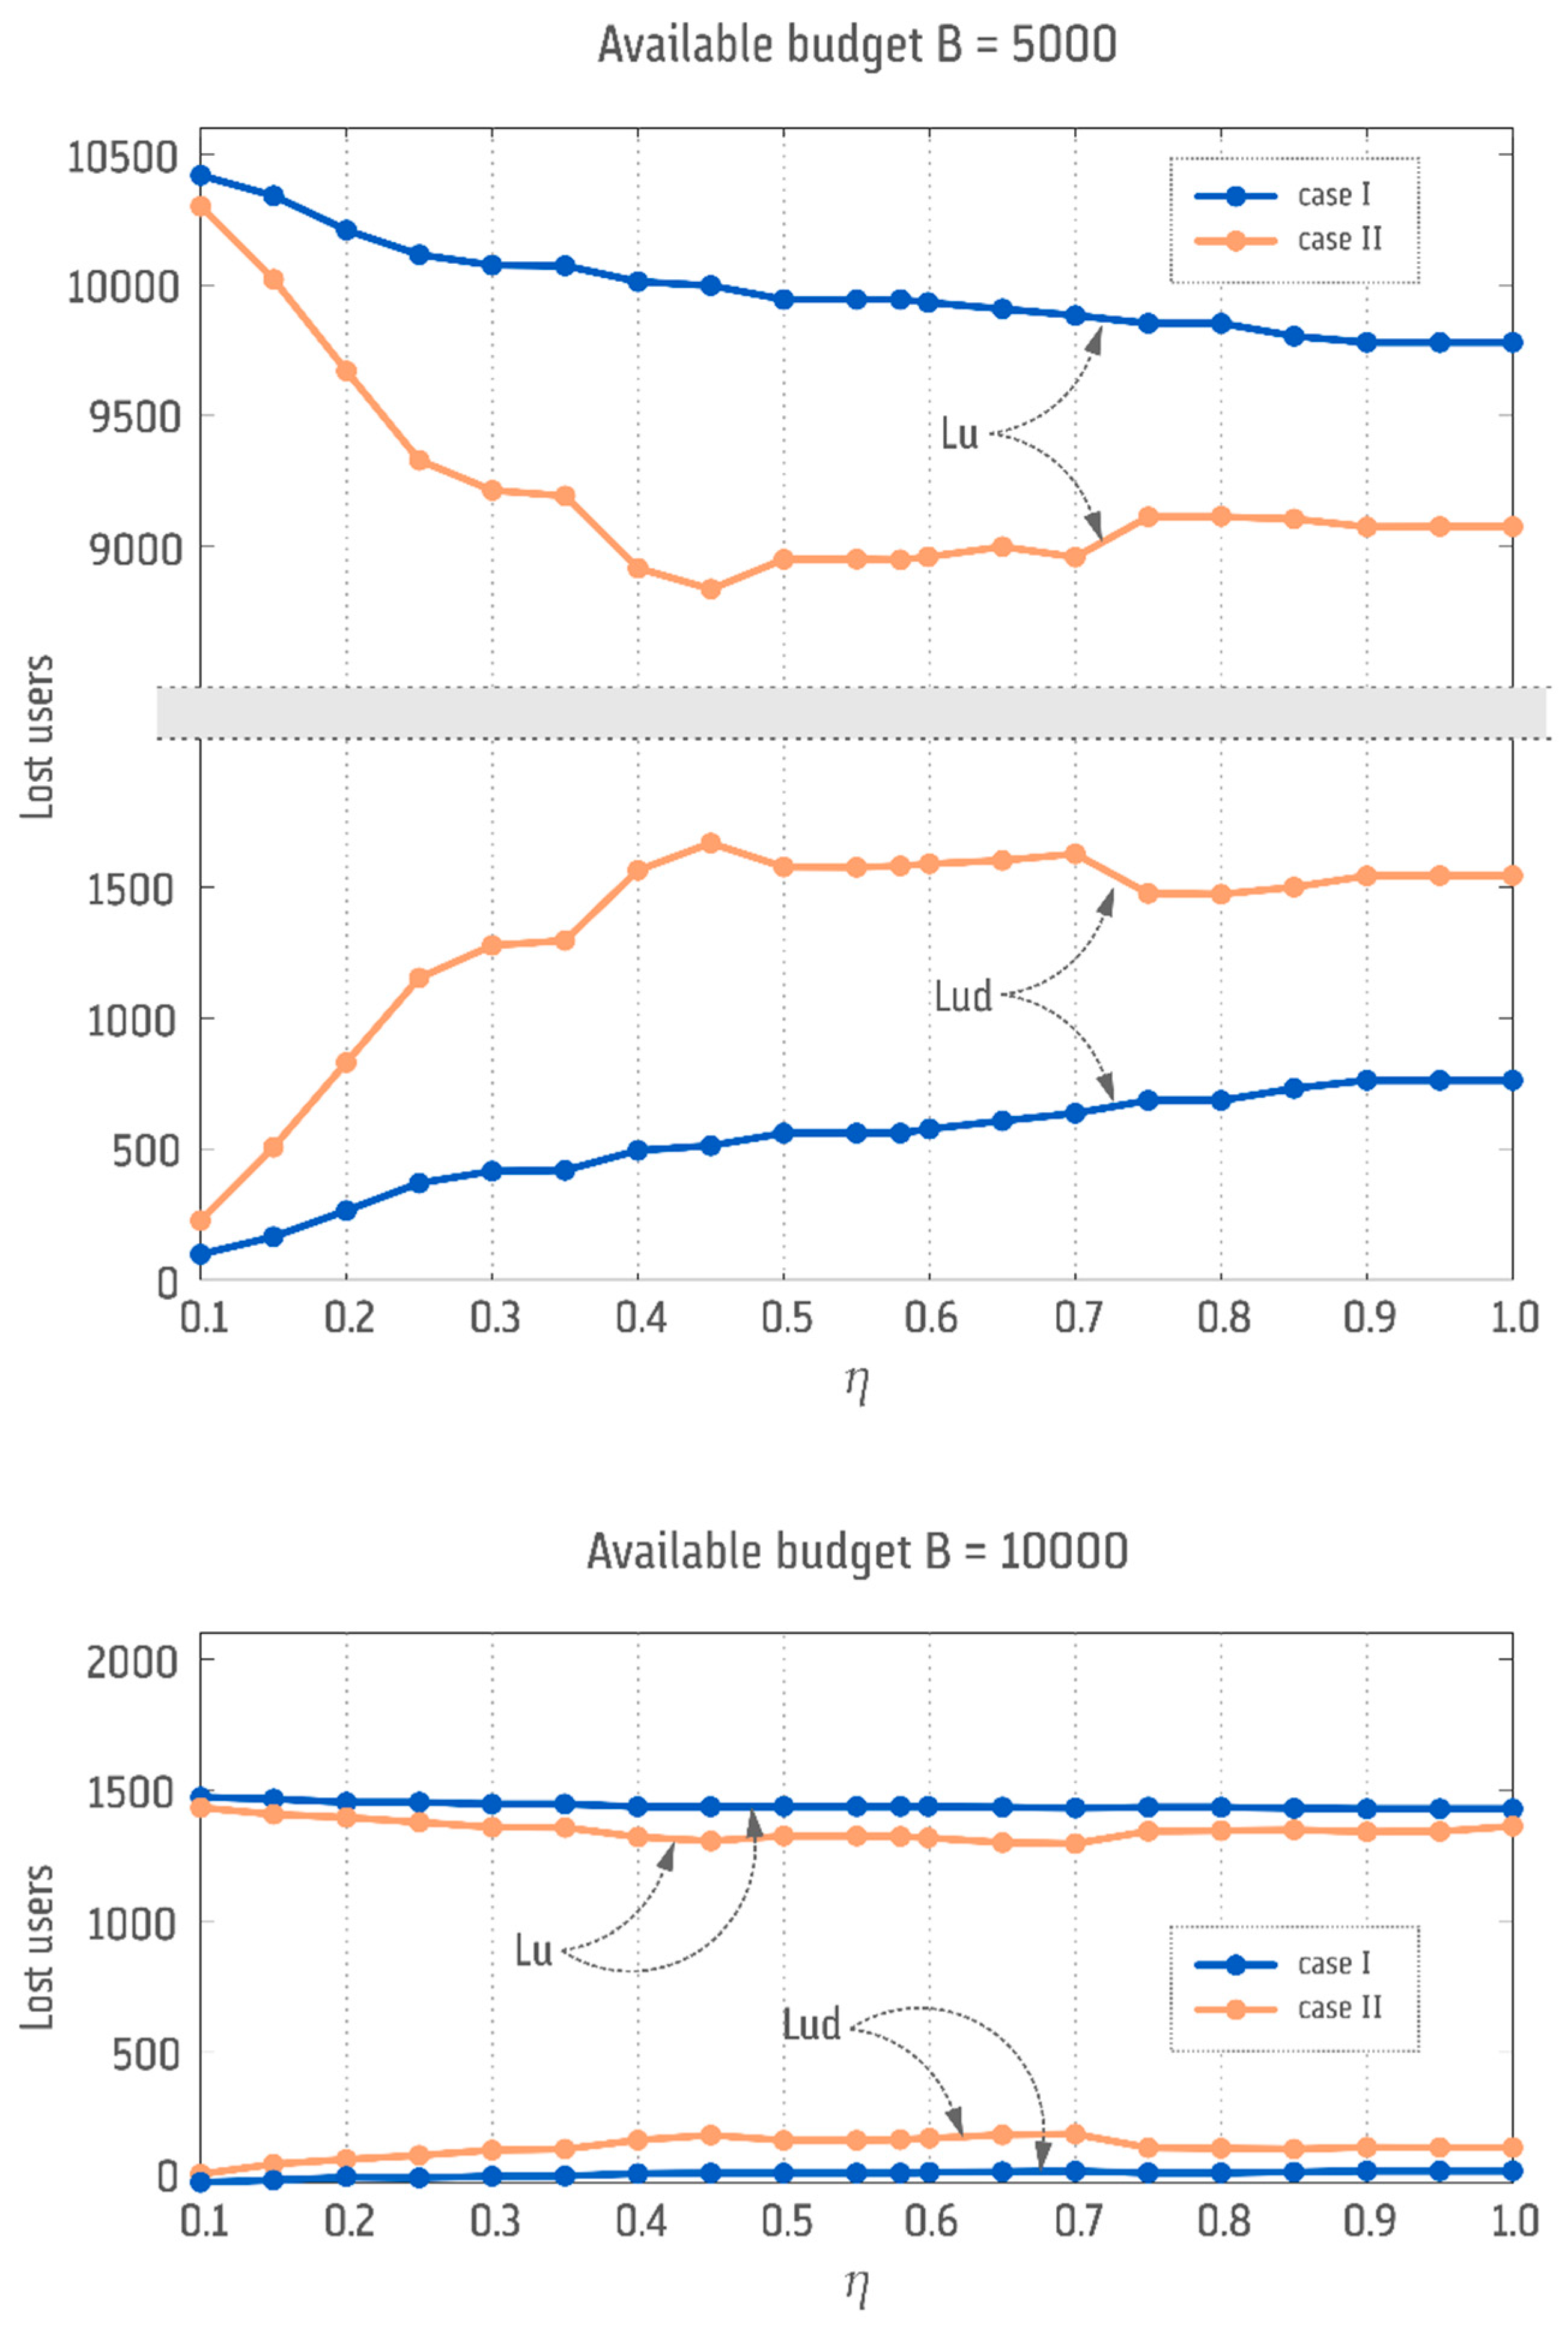

© 2019 by the authors. Licensee MDPI, Basel, Switzerland. This article is an open access article distributed under the terms and conditions of the Creative Commons Attribution (CC BY) license (http://creativecommons.org/licenses/by/4.0/).