


Abstract
Nitrogen (N) availability strongly influences tea growth and the accumulation of quality-related metabolites, but long-term responses to withdrawal of external N can vary among cultivars. In this study, we characterized phenotypic, spectral, biochemical, and transcriptomic responses of four Camellia sinensis accessions—‘Kolkhida’, ‘Karatum’, and γ-irradiation-derived mutant forms #582 and #619—during two, four, or six months of complete withdrawal of exogenous NH4NO3 in greenhouse sand culture. Phenotypic, spectral, and biochemical measurements included all four accessions at all three time points; RNA-seq data were available for all four accessions were represented at four and six months, whereas two-month point were available only for ‘Kolkhida’ and ‘Karatum’. Nitrogen withdrawal decreased L-theanine and caffeine and generally increased simple and gallated catechins, consistent with a change in carbon/nitrogen balance towards phenolic metabolism. The four cultivars exhibited markedly distinct responses. ‘Karatum’ showed the optimum resilience, with minimal phenotypic alteration and a neutral transcriptional response, while #582 demonstrated a stronger stress-associated phenotype and metabolic response. Within the available RNA-seq comparisons, DEG counts were lower at four months than at six months, while the two-month datasets for ‘Kolkhida’ and ‘Karatum’ contained the largest DEG sets for those two cultivars, suggesting a phased acclimation process. CsELIP1, CsSRG1, CsHHO2/4, CsNRT2.4, and CsTAT2 were identified as potential candidate genes associated with nitrogen limitation, flavonoid regulation, and amino acid metabolism. Our findings show that N-deficiency reactions in tea are highly cultivar- and time-dependent, making single-time-point evaluations insufficient. We propose ‘Karatum’ as a promising candidate for further evaluation in low-nitrogen dose–response and field trials based on our combined biochemical and transcriptional findings.
1. Introduction
The tea plant (Camellia sinensis (L.) O. Kuntze) is one of the most economically important perennial evergreen crops, cultivated widely for the production of green, black, oolong, white, and other tea types. The commercial value of tea depends not only on biomass productivity but also on the biochemical composition of young leaves and shoots, particularly the accumulation of catechins, free amino acids, caffeine, and other specialized metabolites that determine bitterness, astringency, umami taste, aroma potential, and health-promoting properties [1]. Unlike annual crops, tea is a long-lived woody perennial in which mineral nutrition affects both vegetative growth and leaf quality over extended periods. To reduce fertilizer use in tea cultivation, it is important to identify cultivars that are naturally more tolerant to low nitrogen.
Nitrogen is a key macronutrient required for the synthesis of proteins, nucleic acids, chlorophyll, phytohormones, and numerous primary and secondary metabolites. In tea plantations, nitrogen fertilization is commonly applied to stimulate shoot growth and improve the accumulation of quality-related compounds, especially free amino acids such as theanine [2,3]. However, nitrogen use efficiency in woody perennial crops is often limited by slow uptake, translocation, and remobilization through plant tissues. It may vary substantially depending on cultivar, fertilizer form, soil properties, and environmental conditions [4]. Excessive nitrogen fertilization in tea plantations not only increases costs but also acidifies the soil, disrupts microbial communities, and causes broader environmental harm [5,6,7]. The identification of tea cultivars capable of maintaining growth and leaf quality under reduced nitrogen availability is an important goal for sustainable tea production and breeding.
Nitrogen availability is closely associated with tea leaf quality. Theanine, a characteristic non-protein amino acid of tea, is synthesized mainly from glutamate and ethylamine and contributes strongly to umami taste and infusion quality [8,9,10]. Catechins, including epicatechin, epigallocatechin, epicatechin gallate, and epigallocatechin gallate, are derived from the phenylpropanoid and flavonoid pathways and are major determinants of astringency, bitterness, and antioxidant capacity [11,12]. Caffeine, a purine alkaloid, is another nitrogen-containing metabolite that contributes to the bitterness and physiological effects of tea infusion [13,14]. Because nitrogen limitation changes the carbon–nitrogen balance, it can shift the allocation of metabolic resources between nitrogen-rich compounds, such as amino acids and alkaloids, and carbon-rich phenolic compounds, such as catechins and other flavonoids [3,15,16]. These changes may substantially affect both the stress physiology of tea plants and the commercial quality of harvested leaves.
Plant responses to nitrogen deficiency involve coordinated changes in nitrogen uptake, transport, assimilation, remobilization, and signalling. In tea, genes encoding nitrate and ammonium transporters, including members of the NRT and AMT families, as well as genes involved in nitrogen assimilation, such as GS, GOGAT, GDH, and amino acid transporters, have been associated with nitrogen-deficiency responses [17,18,19,20]. Nitrogen deprivation also affects photosynthesis, carbohydrate metabolism, amino acid metabolism, antioxidant defence, lignin biosynthesis, hormone signaling, and transcription factor families such as MYB, bHLH, NAC, WRKY, bZIP, and AP2/ERF [16,20,21]. These regulatory systems may link nitrogen sensing with growth adjustment, stress acclimation, and secondary metabolite biosynthesis. However, the direction and magnitude of these responses are likely to depend on cultivar, tissue type, developmental stage, nitrogen form, and stress duration.
Recent findings demonstrate marked genotypic diversity in nitrogen use efficiency (NUE) of Camellia sinensis [22]. Different tea cultivars exhibit distinct abilities to absorb, assimilate, and utilize nitrogen, which is a key determinant of their growth performance and the quality of their leaves under varying nitrogen availability. For instance, some cultivars demonstrate superior growth and yield under low-N conditions, while others are more susceptible to stress [23]. This variation is attributed to genetic differences as well as to differential expression of genes related to nitrogen transporters, assimilation enzymes, and metabolic pathways. However, the comprehensive physiological, biochemical, and transcriptional mechanisms underpinning these cultivar-dependent responses to nitrogen deficiency remain largely uncharacterized.
Here, we compared four tea accessions for physiological, biochemical, and spectral responses to prolonged withdrawal of exogenous NH4NO3 in greenhouse sand culture. Transcriptomic comparisons were performed for ‘Kolkhida’ and ‘Karatum’ at two, four, and six months and for #582 and #619 at four and six months.
2. Materials and Methods
2.1. Plant Material and Experimental Design
The experiment was conducted using four Camellia sinensis accessions maintained in the tea germplasm collection of the Federal Research Centre “Subtropical Scientific Centre of the Russian Academy of Sciences” (Sochi, Russia): Camellia sinensis ‘Kolkhida’, a diploid cultivar; Camellia sinensis ‘Karatum’, previously characterized as an aneuploid cultivar; and mutant forms #582 and #619. The Russian collection includes mutant forms generated in the USSR during the 1970s–1980s by γ-irradiation of seeds, mainly from ‘Qimen’ and ‘Kolkhida’. Previous SSR-based population structure analysis placed #582 with accessions inferred to derive from ‘Qimen’ seed and #619 with the ‘Kolkhida’ genetic cluster, supporting different parental backgrounds for the two mutants. Flow cytometric characterization identified #619 as a tetraploid mutant form, although its chromosome number was not directly confirmed. These background data and the contrasting phenotypes of the accessions motivated their inclusion in the present experiment [24].
The in vivo experiment was performed using three-year-old vegetatively propagated plants. Before treatment, plants were transplanted into 6 L containers filled with inert river sand. After a seven-day adaptation period, plants were irrigated with a 50% nutrient solution adjusted to pH 5.0–5.1. The nutrient solution contained 0.5 mM Ca(H2PO4)2, 3 mM NH4NO3, 0.5 mM CaCl2, 1.0 mM K2SO4, 46 μM H3BO3, 0.6 mM MgSO4, 9 μM MnSO4, 2 μM CuSO4, 9 μM ZnSO4, 2.6 μM Na2MoO4, and 30 μM Fe-EDTA. Fourteen days after transplantation, plants of each accession were divided into nitrogen-sufficient control (N+) and N-withdrawal (N−) groups. Control plants were irrigated every two days with 250 mL of complete nutrient solution containing 3 mM NH4NO3, whereas nitrogen-deficient plants received 250 mL of the same nutrient solution without NH4NO3. Thus, the treatment represented complete withdrawal of exogenous NH4NO3 under the defined sand-culture conditions, following the previously described tea nitrogen deprivation system [25].
Plants were maintained under greenhouse conditions with natural light and shading at 24 ± 4 °C, relative air humidity of 85 ± 10%, light intensity of 3000 ± 200 lx (69 µmol m−2 s−1), and substrate moisture of 70 ± 10%. Sampling was conducted from October 2023 to June 2024. Plants were assigned to greenhouse positions in a randomized complete block design (RCBD). Mature leaves corresponding to the second to fourth positions from the shoot apex were collected after two, four, and six months of treatment. Mature leaves were selected to provide a developmentally comparable tissue across cultivars and time points and to align the tissue used for spectral, biochemical, and transcriptomic measurements, thereby reducing developmental variation associated with rapidly expanding young shoots. For phenotyping and biochemical analyses, three biological replicates per accession, treatment, and time point were evaluated, except at the two-month time point, for which five replicates were used. For transcriptomic analysis, three biological replicates were used for each cultivar, treatment, and time point, except where sample availability differed. The two-month RNA-seq dataset included only ‘Kolkhida’ and ‘Karatum’ and was previously published by our group, whereas the four- and six-month datasets included all four accessions [26]. Each biological replicate corresponded to an independent plant. Five plants of each accession were maintained in each treatment group (control and experimental), for a total of 40 tea plants. For biochemical analysis, five biological replicates were used at two months and three biological replicates at four and six months.
2.2. Leaf Phenotyping
Total nitrogen content in leaves was determined spectrophotometrically after acid digestion of plant material according to the classical acid mineralization approach [27]. Measurements were performed using a USF-01 spectrophotometer. Mineral nitrogen in the substrate, in the ammonium form, was extracted with 0.05 M NaCl and determined spectrophotometrically. Substrate pH in the KCl extract (pHKCl) was measured potentiometrically using a pH-121 ionometer (EcoCTAB, Kirov, Russia).
Leaf optical properties were measured using a portable leaf spectrometer Ci-710s (CID Bio-Science, Camas, WA, USA). Reflectance spectra were recorded in the wavelength range of 350–1000 nm. Based on their associations with pigment and nitrogen status and photosynthetic performance, five indices were selected for further analysis: Zarco–Tejada and Miller Index (ZMI), Vogelmann Red Edge Index 1 (VREI1/VOG1), Red Edge Normalized Difference Vegetation Index (RENDVI), Gitelson and Merzlyak Index 1 (GM1), and Carter Index 2 (Ctr2).
ZMI was used as an indicator related to chlorophyll content, whereas VREI1 and RENDVI were considered informative for pigment and water status assessment [28,29,30]. GM1 was used as an index associated with total chlorophyll content [31]. Ctr2 was used as a stress-sensitive pigment index, which generally increases with chlorophyll degradation [32] (Table 1).
Table 1.
Characteristics of the analyzed vegetation indices.
Caffeine, L-theanine, and catechins (catechin (C), gallocatechin (GC), epigallocatechin (EGC), epicatechin (EC), catechin gallate (CG), epicatechin gallate (ECG), gallocatechin gallate (GCG), and epigallocatechin gallate (EGCG)) (mg g−1 dry leaf mass) were evaluated by HPLC using the following extraction protocol: mature tea leaves (the third to fourth leaves from the top of the branch) were fixed by steam treatment at 100 °C for 20 min in a water bath and then dried. Then, 200 mg of dried tea leaf material was mixed with 4.0 mL of 80% aqueous methanol, hermetically sealed, and incubated for one week at +4 °C in the dark. The vessels containing the methanolic leaf extracts were placed in an ultrasonic bath for 30 min and then centrifuged at 13,000 rpm for 10 min. Next, 1 μL of supernatant was injected into the HPLC column. An Agilent Technologies 1100 HPLC system equipped with a flow-through vacuum degasser G1379A, 4-channel low-pressure gradient pump G1311A, autosampler G1313A, column thermostat G1316A, and diode array detector G1315A was used. A 2.1 × 150 mm ZORBAX XDB-C18 column packed with 3.5 µm octadecylsilyl sorbent was used. The mobile phase consisted of solvent A (0.1% orthophosphoric acid in water) and solvent B (90% acetonitrile in water). The gradient elution profile is presented in Table 2.
Table 2.
The gradient elution profile.
The flow rate was maintained at 0.30 mL/min and the column temperature at 40 °C. The wavelengths used for detection were 195 nm (for L-theanine) and 273 nm for caffeine and catechins. Identification of the substances was performed based on the retention times of the standards of the respective compounds.
In the analysis, catechin (C), gallocatechin (GC), epigallocatechin (EGC), epicatechin (EC) were grouped into ‘simple catechins’, and gallated forms (CG, GCG, EGCG, ECG) into ‘catechin gallates’.
Measurements were performed on mature leaves from each treatment group and time point, and the mean value per biological replicate was used for statistical analysis.
2.3. RNA Isolation and Quality Assessment
For transcriptome analysis, leaf samples were immediately frozen in liquid nitrogen and ground to a fine powder. Total RNA was extracted using the SKYprep RNA Pure Plant Plus Kit (Skygen, Moscow, Russia) according to the manufacturer’s protocol with minor modifications. During column purification, residual genomic DNA was removed by DNase I treatment (Skygen, Moscow, Russia). RNA was eluted in 30 μL of nuclease-free water (Thermo, Waltham, MA, USA) and stored at −80 °C until further use.
RNA integrity was initially checked by electrophoresis on a 1.5% agarose gel (Amresco, Solon, OH, USA) prepared in 1×TAE buffer (Evrogen, Moscow, Russia). Gels were stained with ethidium bromide (Amresco, Solon, OH, USA) and visualized under UV light. RNA samples were considered suitable for further analysis when clear ribosomal RNA bands were observed and no visible degradation was detected. RNA concentration and purity were assessed spectrophotometrically using a Nanophotometer N50 (Implen, Munich, Germany) and fluorometrically using a Qubit 4 Fluorometer with the Qubit RNA BR Assay Kit (Invitrogen, Waltham, MA, USA). Before library preparation, the RNA integrity number (RIN) was determined using High Sensitivity RNA ScreenTape on a TapeStation 4150 system (Agilent Technologies, Santa Clara, CA, USA). Samples with RIN ≥ 6 were used for RNA-seq library preparation.
2.4. RNA-seq Library Preparation and Sequencing
Directional mRNA libraries were prepared using the NEBNext Ultra II Directional RNA Library Prep Kit for Illumina (New England Biolabs, Ipswich, MA, USA) according to the manufacturer’s recommendations. For each sample, 1000 ng of total RNA was used as input. Polyadenylated mRNA was enriched using the NEBNext Poly(A) mRNA Magnetic Isolation Module (New England Biolabs, Ipswich, MA, USA). Purified mRNA was fragmented in the First Strand Synthesis Reaction Buffer with the Random Primer Mix at 94 °C for 7.5 min to obtain libraries with an insert size greater than 300 bp. First- and second-strand cDNA synthesis was then performed; dUTP-containing buffer was used during second-strand synthesis to preserve library strandedness.
The resulting cDNA was subjected to end repair, 3′ adenylation, and ligation of NEBNext adaptors. Libraries were indexed using NEBNext Multiplex Oligos for Illumina Unique Dual Index Primers (New England Biolabs, Ipswich, MA, USA) and amplified for eight PCR cycles. Library quality was assessed using High Sensitivity D1000 ScreenTape (Agilent Technologies, Santa Clara, CA, USA) reagents on a TapeStation 4150 system (Agilent Technologies, Santa Clara, CA, USA). Library molarity was determined by qPCR using the KAPA Library Quantification Kit (KAPA Biosystems, Wilmington, MA, USA) on a QuantStudio 3 Real-Time PCR System (Applied Biosystems, Santa Clara, CA, USA).
Sequencing was carried out at the Genomic Research Resource Centre of the Sirius University of Science and Technology on the Illumina NovaSeq 6000 platform (Illumina, San Diego, CA, USA) in paired-end mode with 151 + 151 bp reads.
Some biological samples, particularly within the ‘Karatum’ dataset, were represented by two technical libraries. As indicated in Appendix B, data from technical libraries belonging to the same biological sample were combined for differential expression analysis and were not treated as independent biological replicates. Library-level alignment and featureCounts assignment statistics are reported in Appendix B.
2.5. RNA-seq Data Processing and Differential Expression Analysis
Raw sequencing data were demultiplexed according to the index sequences introduced during library preparation using bcl2fastq v2.20.0.422 with default parameters. Initial read quality was assessed using FastQC v0.11.2 [33]. Adapter sequences and low-quality bases were removed using AdapterRemoval v2 with the following parameters: --trimqualities, --minquality 20 and --minlength 100 [34].
Filtered reads were aligned to the Camellia sinensis var. sinensis ‘Kolkhida’ reference genome (CNGBdb project CNP0005366) using HISAT2 v2.2.1 with strand-specific settings (--rna-strandness RF) [35]. Gene-level read counts were calculated using featureCounts with the following parameters: -s 2, -p, --countReadPairs, -B, -t CDS and -g gene [36]. The ‘Kolkhida’ genome annotation was used for read assignment and downstream functional interpretation for all accessions.
Differential gene expression analysis was performed using edgeR v4.4.2 [37]. For each accession and time point, N− samples were compared only with the corresponding accession- and time-matched N+ controls. Genes were considered differentially expressed when they met all of the following thresholds: |log2 fold change| ≥ 1, p-value ≤ 0.05, and false discovery rate (FDR) ≤ 0.1.
2.6. Functional Annotation and Enrichment Analysis
Functional enrichment analysis of differentially expressed genes was performed using clusterProfiler v4.14.6 [38]. Gene Ontology (GO) and Kyoto Encyclopedia of Genes and Genomes (KEGG) pathway enrichment analyses were conducted using functional annotations assigned to the Camellia sinensis reference. GO terms and KEGG pathways were considered significantly enriched at p-value ≤ 0.05 and q-value ≤ 0.1.
2.7. RT-qPCR Validation of RNA-seq Results
Selected differentially expressed genes were validated by reverse-transcription quantitative PCR (RT-qPCR). First-strand cDNA was synthesized from 200 ng of total RNA using the High-Capacity cDNA Reverse Transcription Kit (Applied Biosystems) according to the manufacturer’s protocol. Gene-specific primers were designed using Primer-BLAST (https://www.ncbi.nlm.nih.gov/tools/primer-blast/ (accessed on 1 September 2026)) and Primer3 v0.4.0 (Table 3). RT-qPCR reactions were performed using 5× qPCRmix-HS SYBR (Evrogen, Russia) in a final volume of 10 μL. Amplifications were carried out on QuantStudio 3 and QuantStudio 5 Real-Time PCR Systems (Applied Biosystems). The amplification program consisted of initial denaturation at 94 °C for 4 min, followed by 40 cycles of 94 °C for 30 s, the primer-specific annealing temperature for 30 s and 72 °C for 30 s. Fluorescence was detected at the elongation stage. Each reaction was performed in three technical replicates with negative controls. Primer validation was performed using melting curve analysis, followed by 1.5% agarose gel electrophoresis to confirm a single amplicon.
Table 3.
Genes and corresponding primers used for the RT-qPCR experiments.
2.8. Statistical Analysis
Statistical analyses were performed in R. For physiological, biochemical, and RT-qPCR data, nitrogen-deficient and nitrogen-sufficient groups were compared within each accession and time point. Differences between treatments were assessed using Student’s t-test, with p ≤ 0.05 considered statistically significant. For RT-qPCR data, statistical testing was performed using the rstatix package, and plots were generated using ggpubr. Where appropriate, data were visualized as means across biological replicates; error bars represent standard deviations. Correlation analysis among selected phenotypic, biochemical, and molecular traits was performed using Pearson correlation coefficients. Complete Pearson correlation coefficients and associated p-values for the three sampling times are provided in Appendix A.
3. Results
3.1. Phenotypic, Biochemical, and Spectral Responses to Nitrogen Withdrawal
3.1.1. Phenotypic Observations
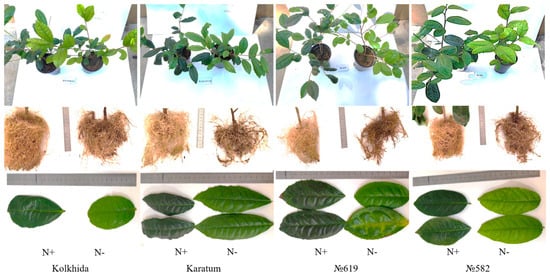
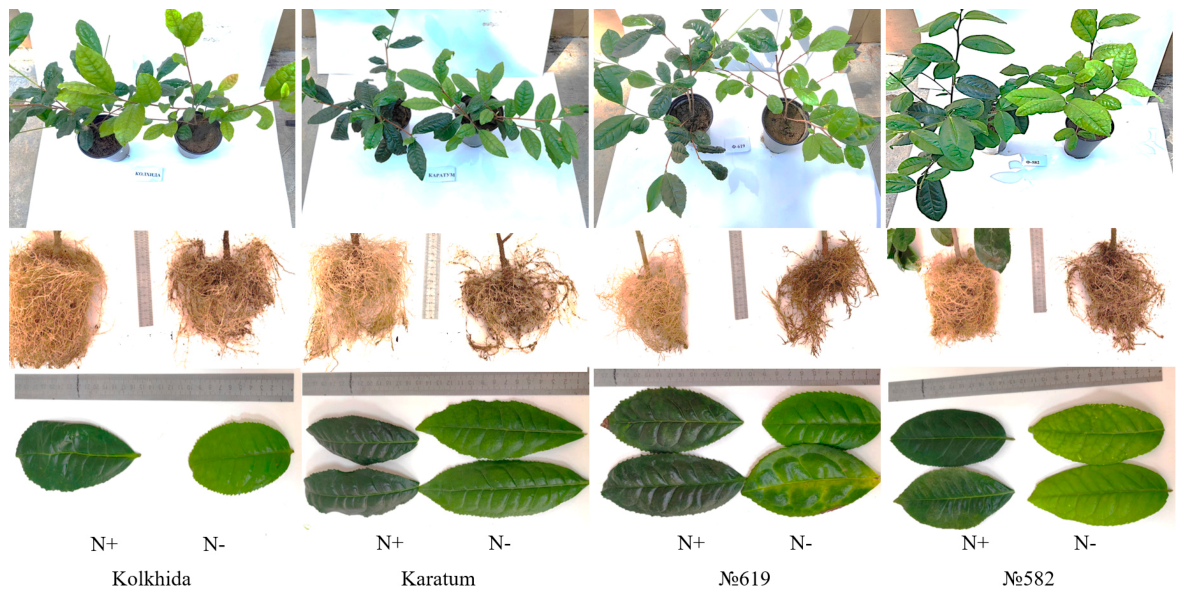
We first assessed visible symptoms to establish the overall phenotypic response to prolonged nitrogen withdrawal. During the first few months, symptoms were moderate, whereas after four to six months the N− plants developed visible changes in leaf color consistent with a decline in N-dependent pigment status. The intensity of the visible response differed among accessions. The weakest visual differences between N+ and N− plants, including leaf color and root system appearance, were observed in ‘Karatum’ and #619, whereas #582 showed a more pronounced response to N withdrawal (Figure 1).
Figure 1.
Visual phenotype of four Camellia sinensis cultivars after six months of nitrogen treatment under greenhouse conditions. For each cultivar, plants grown under nitrogen-sufficient conditions (N+) are compared with plants exposed to nitrogen deficiency (N−).
3.1.2. Correlation Analysis
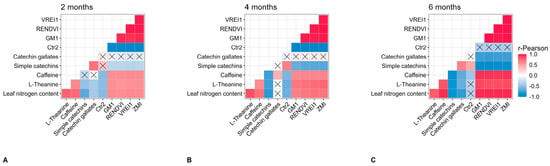
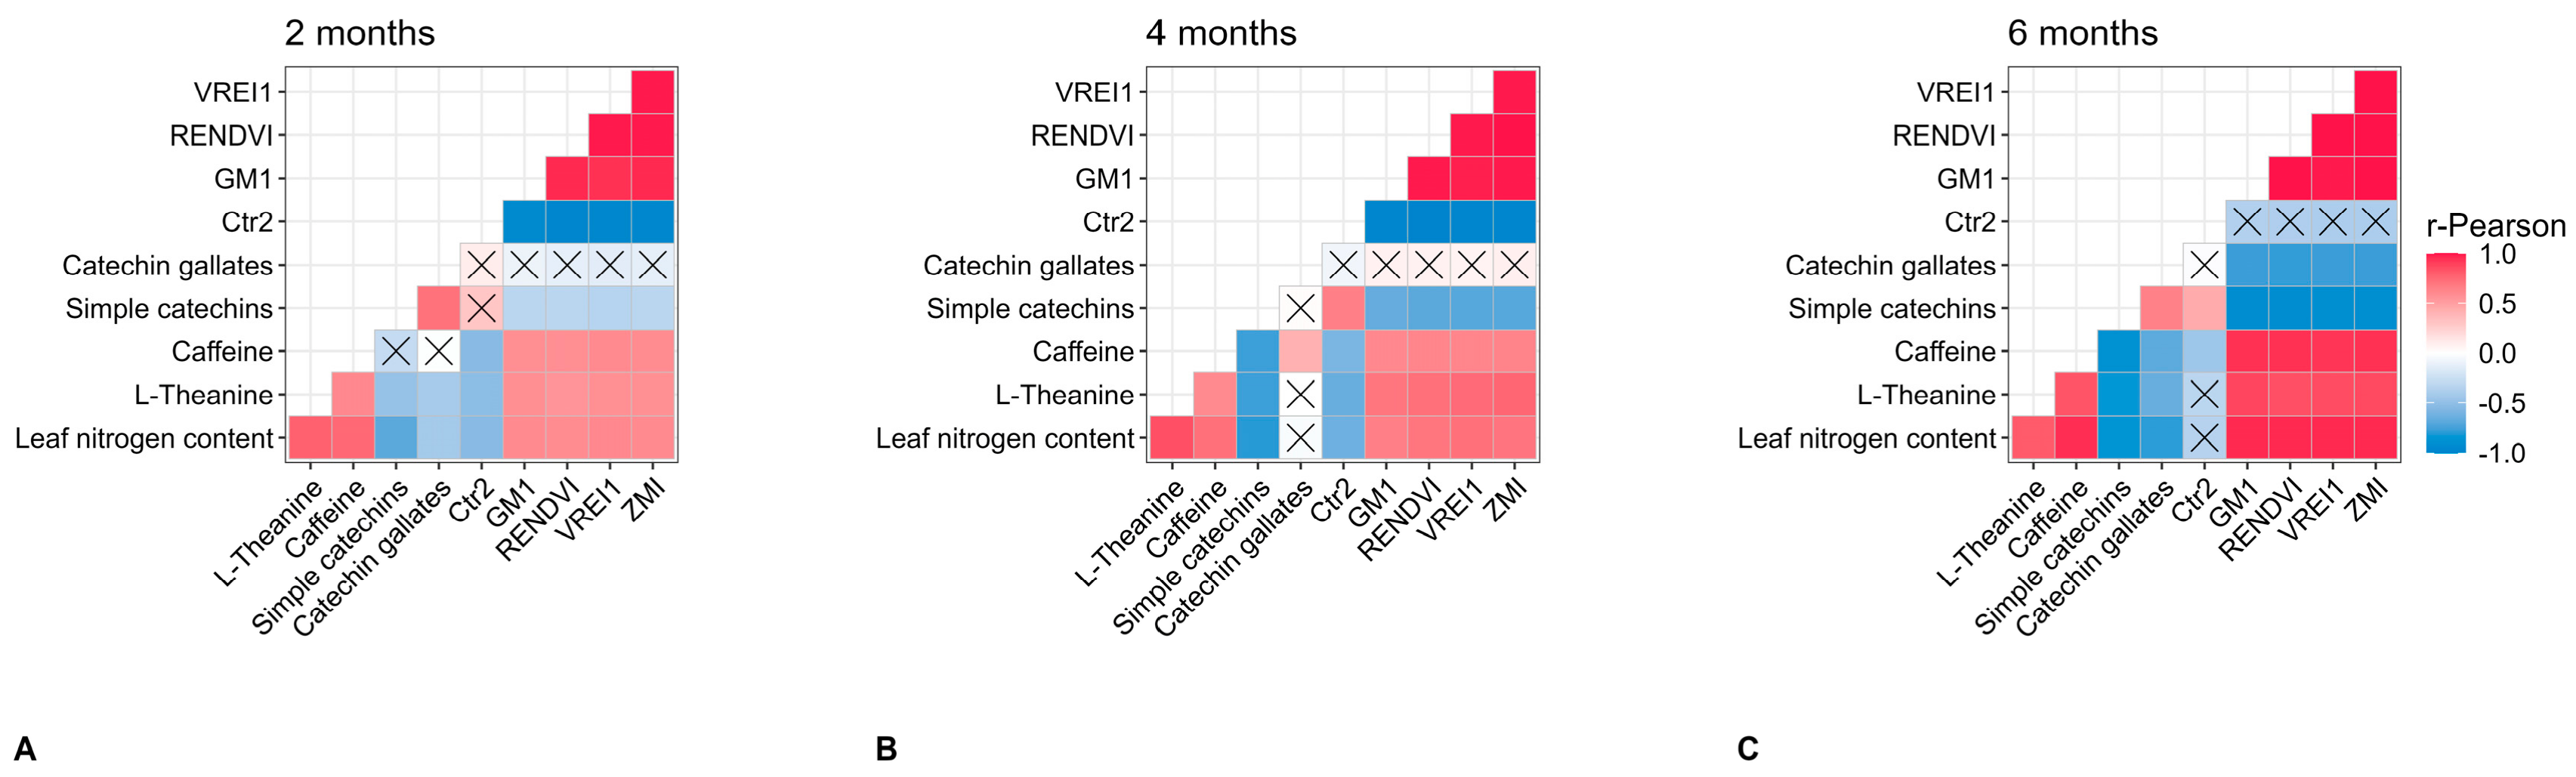
We next tested whether leaf N status covaried with quality-related metabolites and spectral indices. Pearson correlation analysis showed significant positive correlations (p < 0.05) between leaf N content and L-theanine, caffeine, and the chlorophyll-related indices ZMI, VREI1, RENDVI, and GM1. Leaf N was negatively correlated with simple catechins, gallated catechins, and the stress-related Carter index Ctr2. These relationships were generally observed at two, four, and six months, except that the association between leaf N and gallated catechins was not significant at four months (Figure 2). Full correlation coefficients and p-values are given in Appendix A, and Pearson correlation matrices for all possible experimental combinations in Supplementary S1.
Figure 2.
Pearson correlation maps between leaf nitrogen content, biochemical traits, and vegetation indices after two, four, and six months of N treatment. (A) Two months of treatment. (B) Four months of treatment. (C) Six months of treatment. Red tones indicate significant positive correlations, blue tones indicate significant negative correlations, and white cells indicate weak or absent correlations. Crosses indicate non-significant correlations (p > 0.05).
The correlation pattern suggests that leaf spectral traits may serve as rapid indicators of responses to N withdrawal in this controlled experiment. The inverse pattern of Ctr2 relative to the chlorophyll-related indices is consistent with declining pigment status and increasing stress-associated spectral signatures under nitrogen withdrawal.
3.1.3. Principal Component Analysis
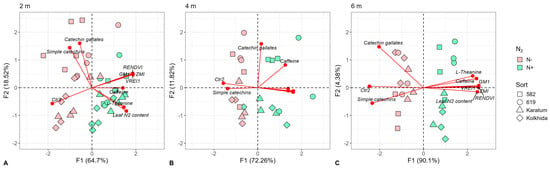
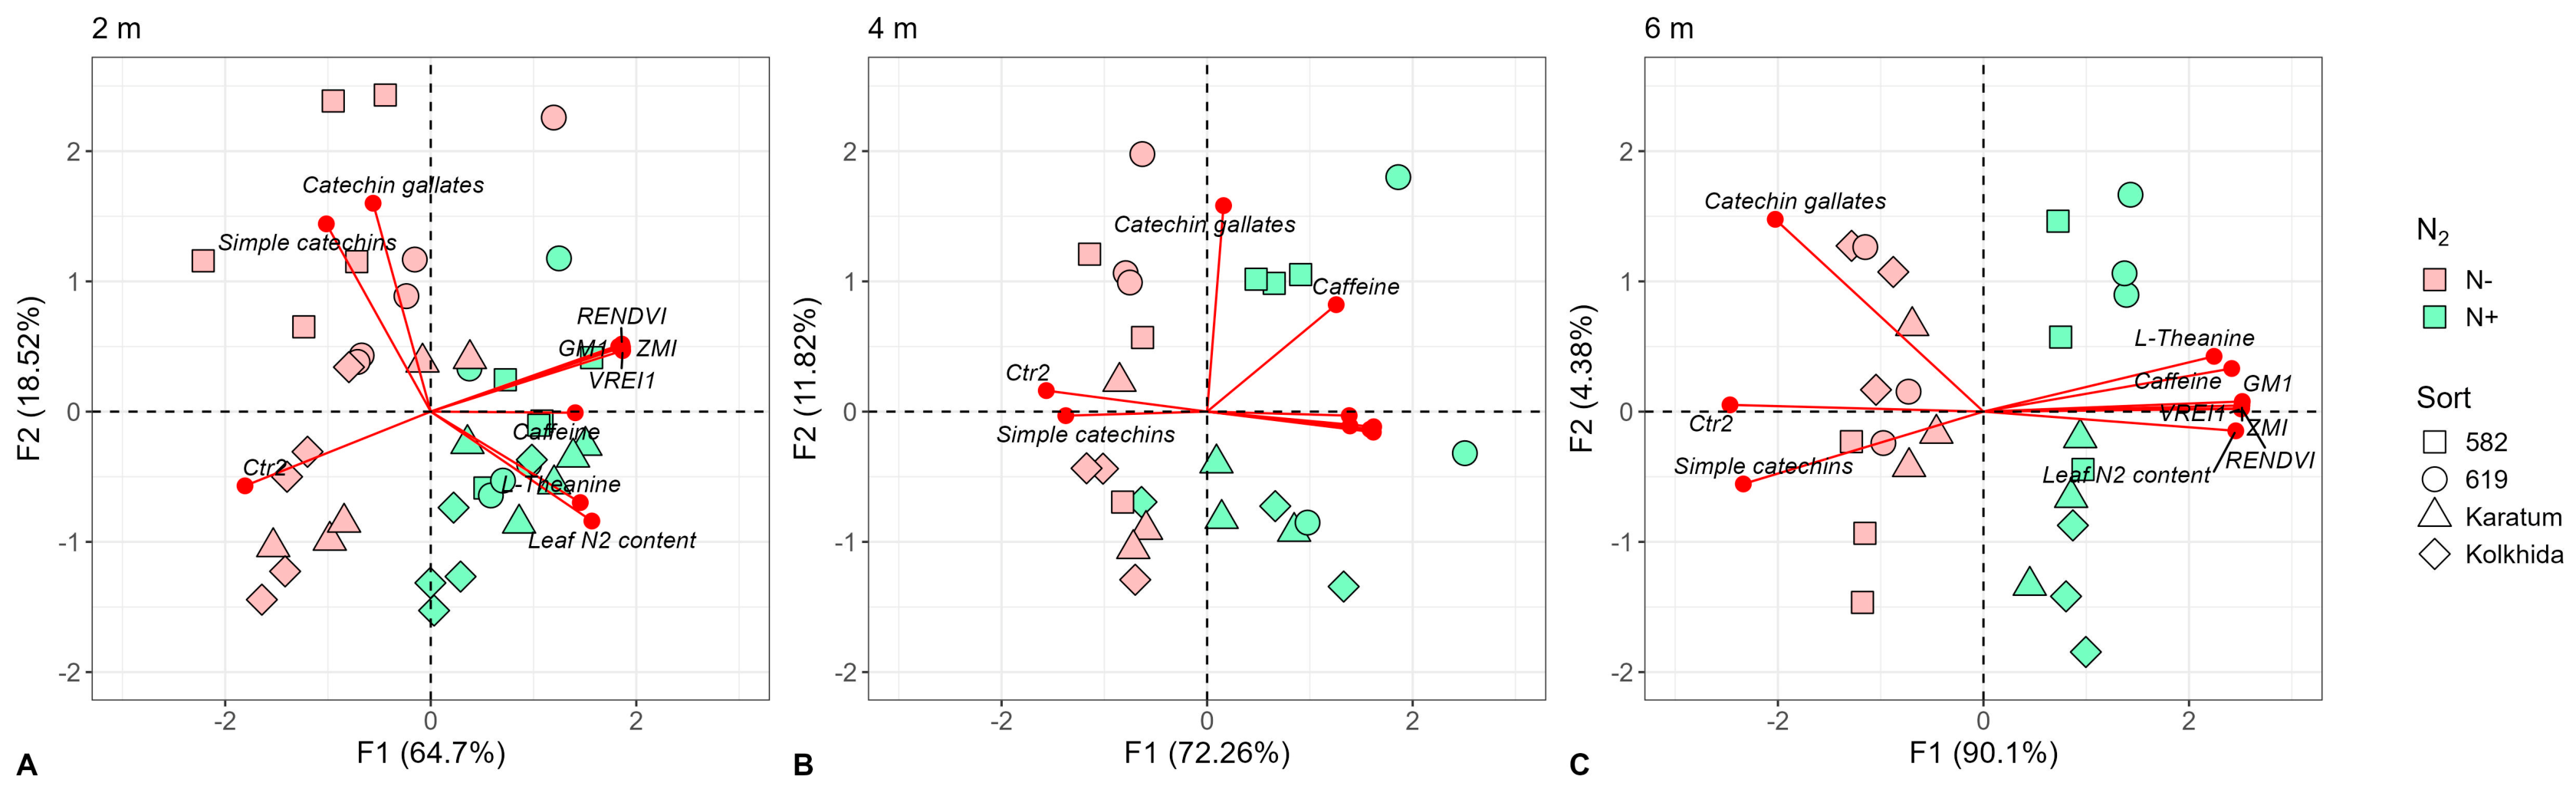
We then integrated the phenotypic, biochemical, and spectral variables using principal component analysis (PCA). N+ and N− samples were separated at all three sampling points (Figure 3). Separation was already evident after two months, before strong visual symptoms developed. The variance explained by principal component 1 increased from 64.70% at two months to 90.10% at six months, whereas the contribution of principal component 2 decreased from 18.52% to 4.38%, indicating that the treatment-associated axis became increasingly dominant over time.
Figure 3.
Principal component analysis of phenotypic, biochemical, and spectral traits in in vivo-grown tea plants under nitrogen-sufficient and nitrogen-deficient conditions. (A) Two months of treatment. (B) Four months of treatment. (C) Six months of treatment. N+ indicates the nitrogen-sufficient control; N− indicates nitrogen deficiency.
The sample distribution also indicated that accession contributed differently to the multivariate response over time. At two and four months, N-deficient #582 and #619 tended to cluster separately from N-deficient ‘Kolkhida’ and ‘Karatum’, whereas after six months the N− samples were less clearly separated by accession.
Trait vectors confirmed the positive association of leaf nitrogen with L-theanine, caffeine, and chlorophyll-related vegetation indices and the negative association of leaf nitrogen with simple and gallated catechins, and Ctr2 (Figure 3).
3.1.4. Biochemical Analysis
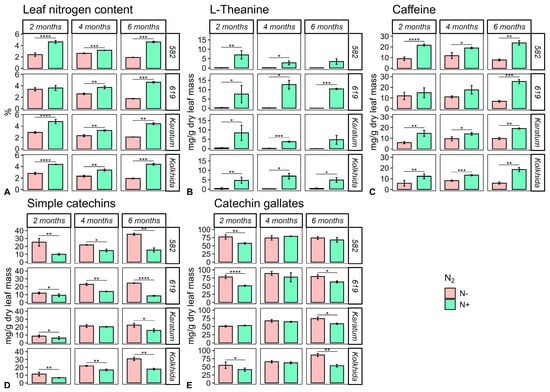
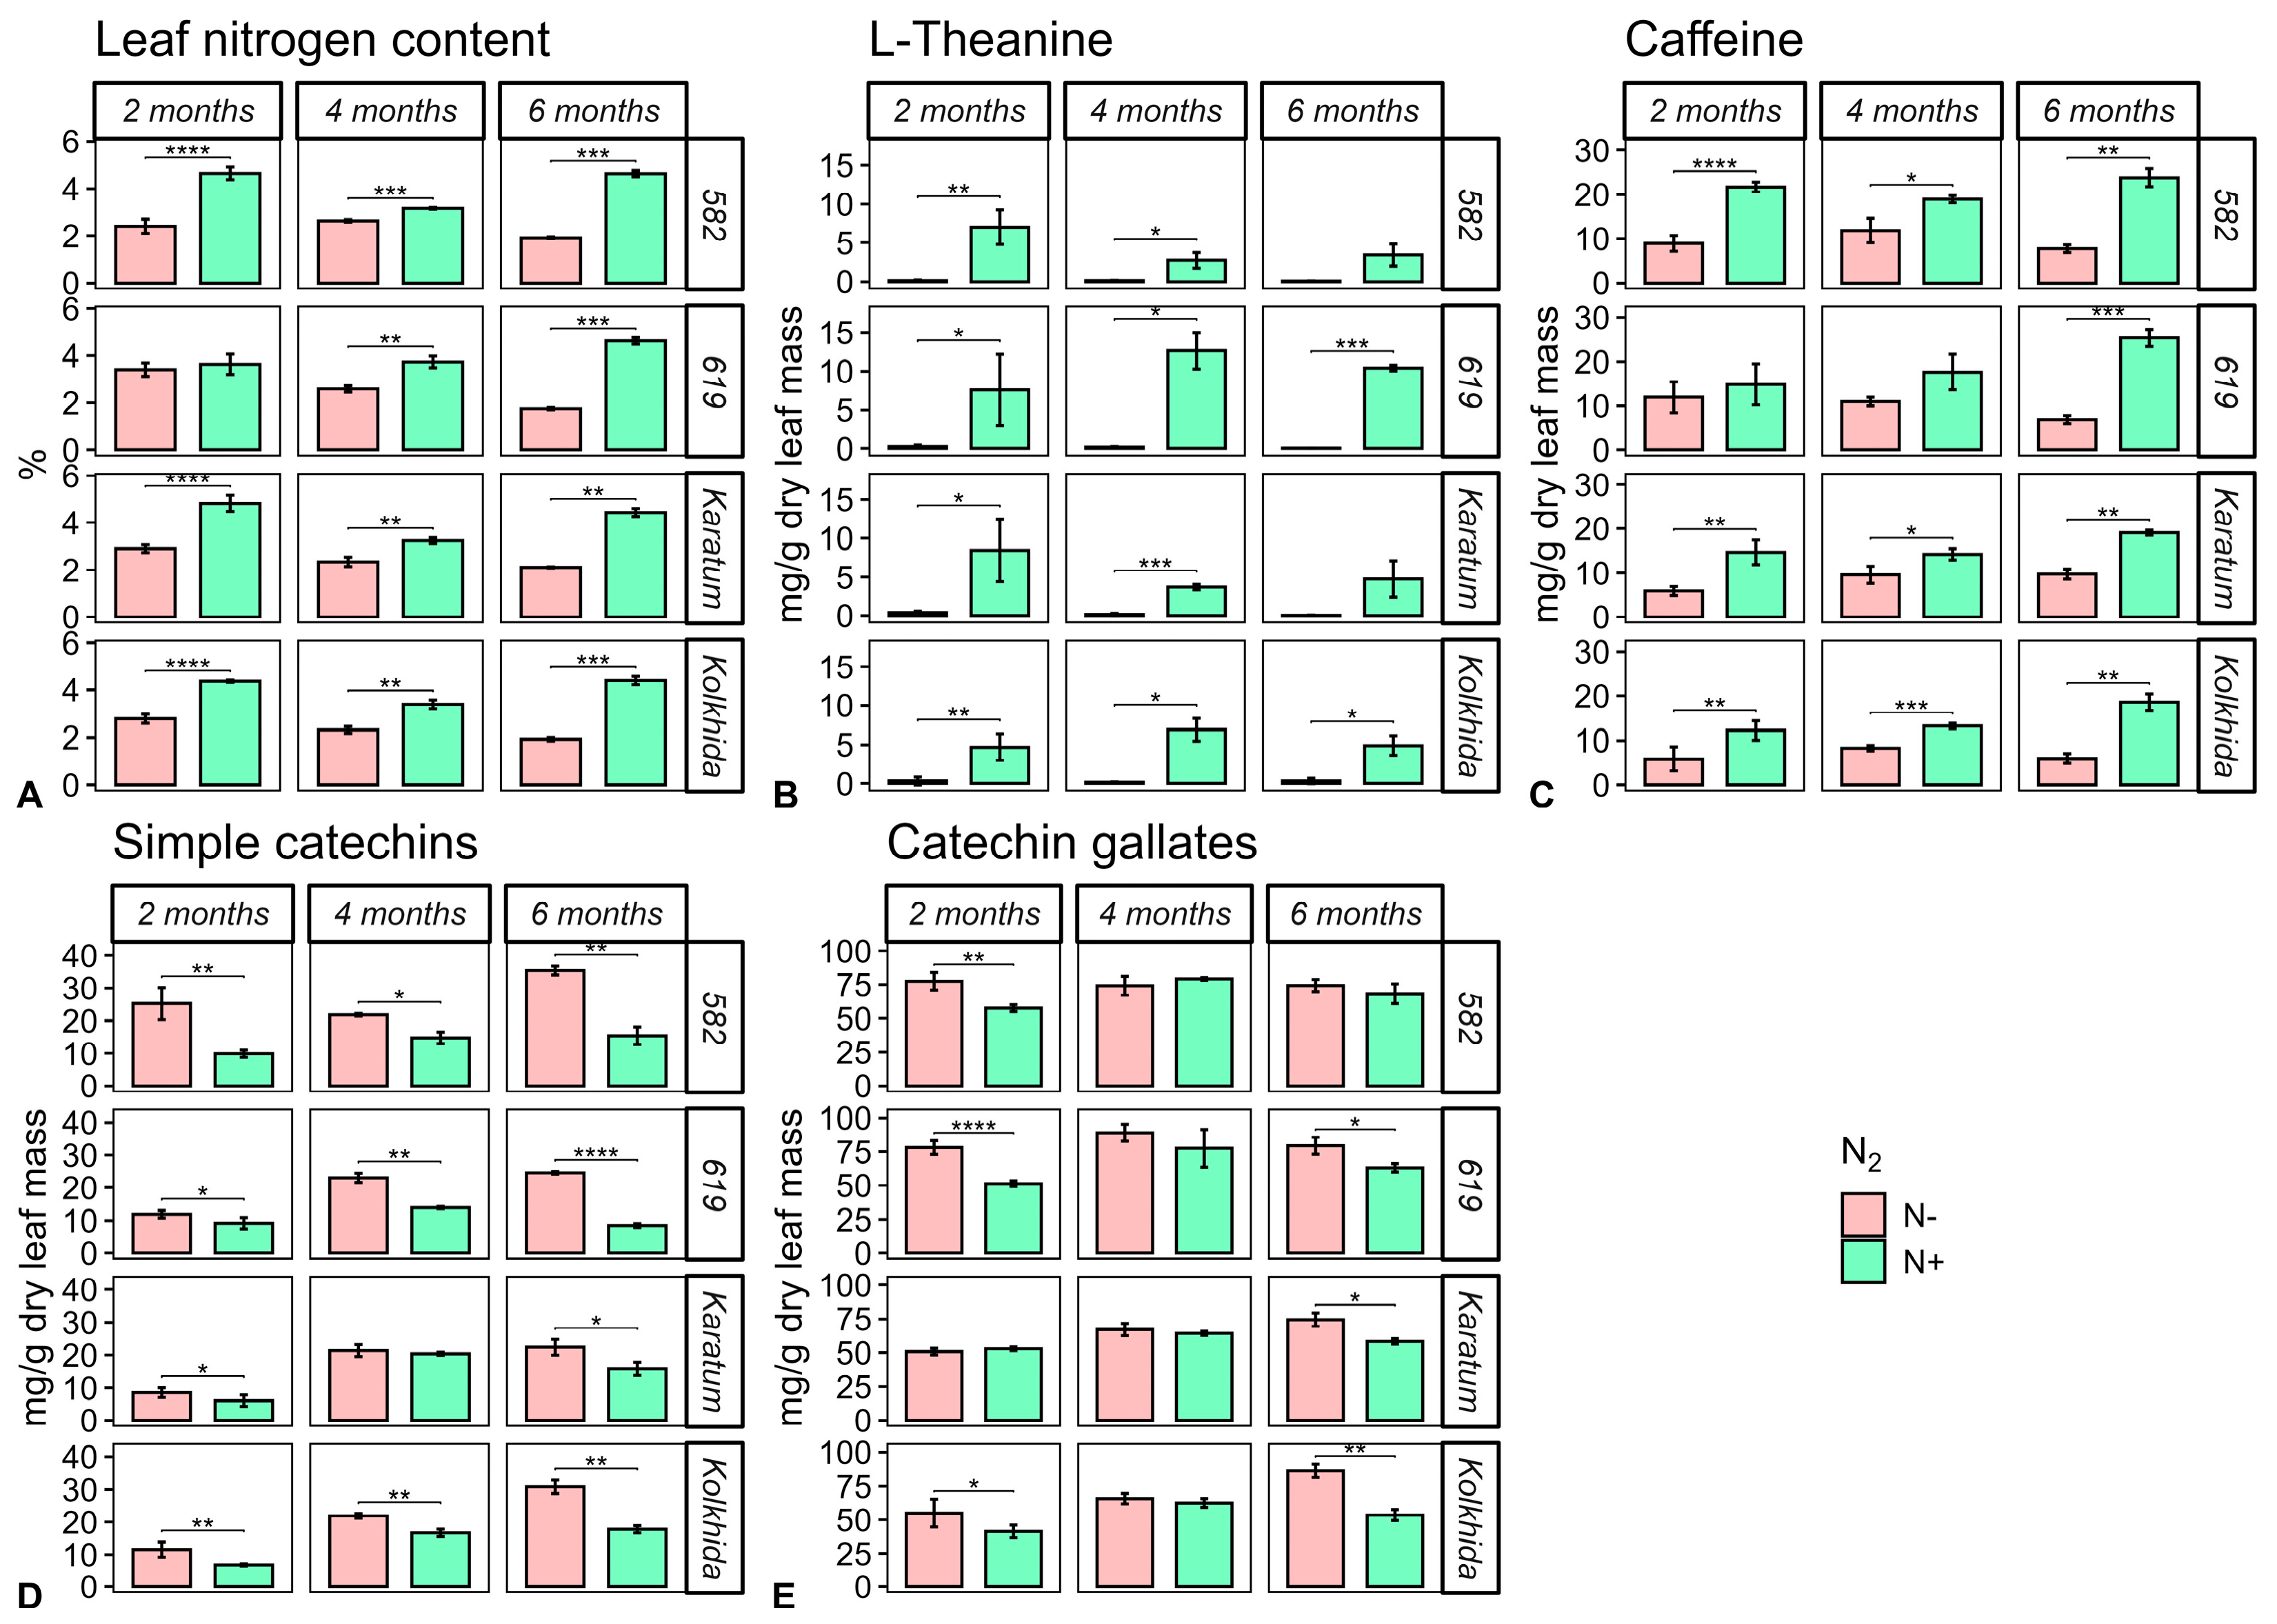
Direct biochemical measurements were next used to quantify treatment effects on leaf N and major tea-quality metabolites. Leaf N content was approximately 3.0–4.13% in N+ groups and 1.71–2.5% in N− groups. The highest L-theanine concentration (9.74 mg g−1 dry mass) occurred in #619, approximately 1.5-fold higher than in the other accessions, and nitrogen withdrawal reduced L-theanine in all accessions, particularly #619 and ‘Karatum’. The highest caffeine concentration (21.53 mg g−1 dry leaf mass) occurred in #582. Nitrogen withdrawal reduced caffeine by approximately 44–50.5% in #582, ‘Karatum’, and ‘Kolkhida’ and by approximately 55% in #619. Simple catechins increased by approximately 1.25-, 1.57-, 1.78-, and 2.12-fold in ‘Karatum’, ‘Kolkhida’, #619, and #582, respectively; catechin gallates increased by approximately 1.07–1.32-fold across accessions (Figure 4). The previously published cytometric characterization of #619 supports the putative tetraploidy of this accession [24].
Figure 4.
Comparison of the leaf biochemical composition of four tea cultivars in response to nitrogen deficiency at three time points (two, four, and six months). (A) Leaf nitrogen content. (B) L-theanine. (C) Caffeine. (D) Simple catechins. (E) Calechin gallates. Values are mean ± SE (n = 5 at the two-month point, n = 3 at the four- and six-month points). Asterisks indicate statistically significant differences by t-test (* p < 0.05; ** p < 0.01; *** p < 0.001; **** p < 0.0001). Error bars represent standard deviations.
3.1.5. Vegetation Index Analysis
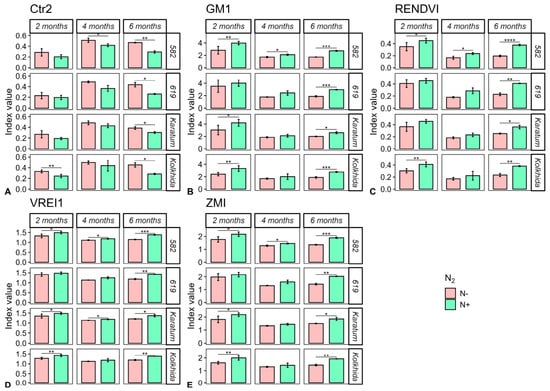
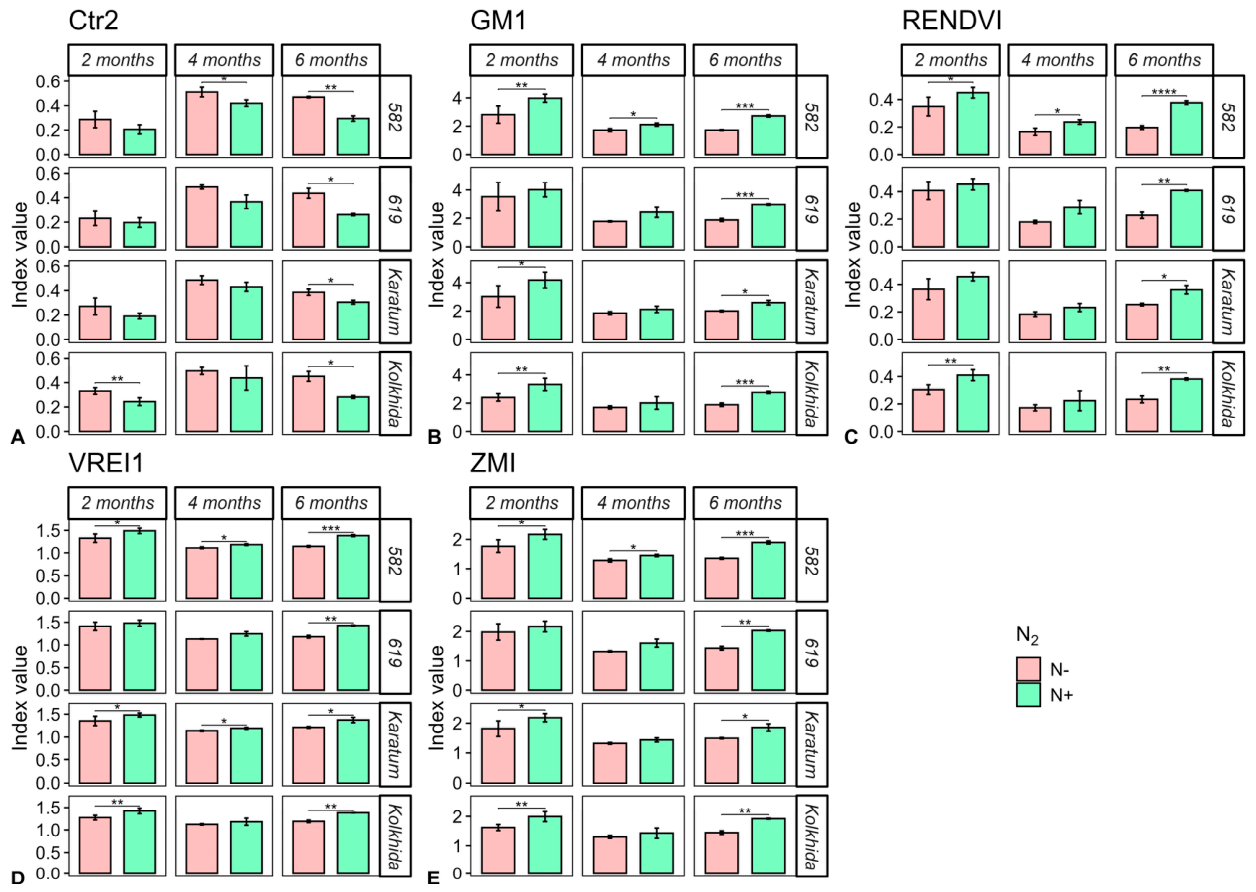
Finally, we compared individual vegetation indices to evaluate accession-specific spectral sensitivity to N withdrawal (Figure 5). In N+ plants, index ranges were 1.24–1.89 for ZMI, 1.09–1.37 for VREI1, 0.14–0.37 for RENDVI, 1.54–3.10 for GM1, and 0.13–0.28 for Ctr2. Under nitrogen deficiency, the corresponding ranges shifted to 1.22–1.56 for ZMI, 1.08–1.24 for VREI1, 0.13–0.27 for RENDVI, 1.59–2.32 for GM1, and 0.14–0.38 for Ctr2. #582 showed significant treatment differences for nearly all indices at all three time points, except Ctr2, which differed significantly after two and four months. ‘Kolkhida’ showed significant changes in all indices after two and six months, whereas #619 showed significant changes in all indices only after six months. ‘Karatum’ showed significant changes in ZMI and GM1 after two and six months, RENDVI and Ctr2 after six months, and VREI1 at all three time points.
Figure 5.
Comparison of vegetation indices of four tea accessions in response to N withdrawal after two, four, and six months. (A) Ctr2, Carter Index 2; (B) GM1, Gitelson and Merzlyak Index 1; (C) RENDVI, Red Edge Normalized Difference Vegetation Index; (D) VREI1 (VOG1), Vogelmann Red Edge Index 1; and (E) ZMI, Zarco–Tejada and Miller Index. N+ indicates the nitrogen-sufficient control, whereas N− indicates the nitrogen-deficient treatment. Values are mean ± SE (n = 5 at the two-month point, n = 3 at the four- and six-month points). Asterisks indicate statistically significant differences in the t-test (* p < 0.05; ** p < 0.01; *** p < 0.001; **** p < 0.0001). Error bars represent standard deviations.
Overall, #582 showed the strongest spectral response, whereas ‘Karatum’ showed the least pronounced spectral perturbation. This pattern was broadly consistent with the visible phenotype, although biochemical measurements detected marked metabolite changes even in accessions with relatively weak spectral responses. In particular, #619 showed substantial biochemical changes despite a weaker spectral response, indicating that photosynthetic and pigment-related traits in this cultivar may be less affected by nitrogen deprivation than quality-related metabolite levels.
3.2. DEG Dynamics at 2, 4, and 6 Months of Induction of Nitrogen Deficiency
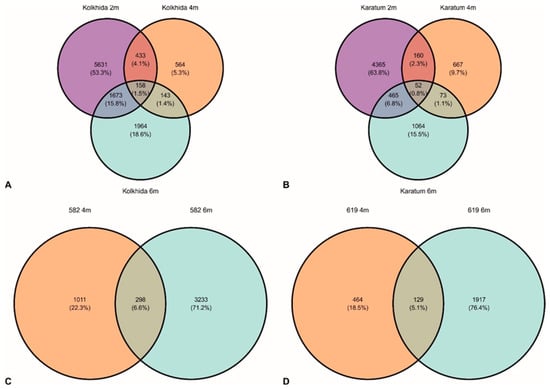
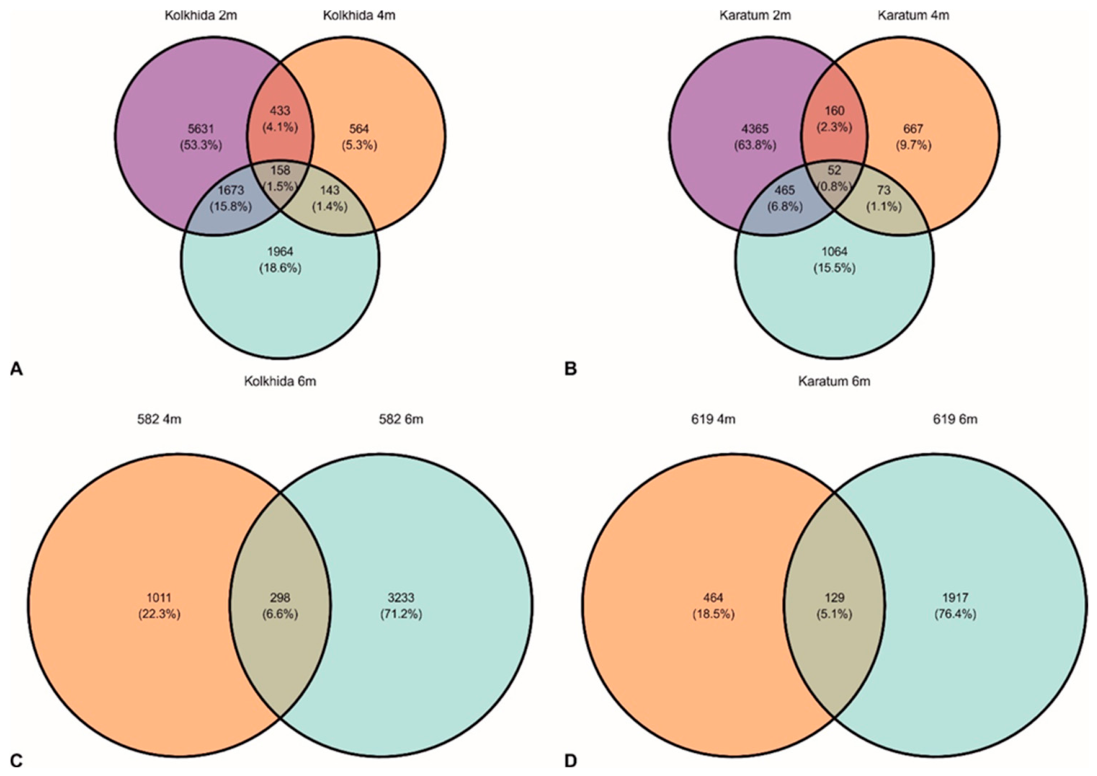
To characterize leaf transcriptional responses, RNA-seq data were analyzed after two months for ‘Kolkhida’ and ‘Karatum’ and after four and six months for all four accessions. DEGs were identified only by comparing N− samples with accession- and time-matched N+ controls. Two-month RNA-seq data were not available for #582 or #619; this is indicated as N/A in Table 3 and explicitly noted in Figure 6, Appendix B. Differential expression results are therefore interpreted within the available sample sets rather than as a fully balanced three-time-point comparison across all four accessions (Table 4). Additionally, unique and shared DEGs across the analyzed time points and accessions are shown in Figure 6.
Figure 6.
Temporal overlap of DEGs within each tea accession under nitrogen withdrawal. Venn diagrams show unique and shared DEGs across available time points. Panels (A,B) show ‘Kolkhida’ and ‘Karatum’ across two, four, and six months, respectively. Panels (C,D) show #582 and #619 across four and six months only; two-month RNA-seq data were not available for these two mutant forms. Numbers indicate DEG counts and percentages within each comparison.
Table 4.
Number of differentially expressed genes in tea leaves under nitrogen deficiency.
For ‘Kolkhida’ and ‘Karatum’, the two-month comparisons contained more DEGs than their respective four- or six-month comparisons. This early response to nitrogen deficiency was broader in ‘Kolkhida’ than in ‘Karatum’, featuring a predominance of downregulated transcripts in the former, whereas the latter exhibited a nearly balanced ratio of up- and downregulated genes. Because #582 and #619 were not sequenced at two months, an early transcriptomic comparison across all four accessions cannot be made. At four months, DEG counts were 1298, 952, 1309, and 593 for ‘Kolkhida’, ‘Karatum’, #582, and #619, respectively, and all four accessions showed larger DEG sets at six months than at four months. Such a reduction in the number of DEGs at the medium-term stage may suggest partial transcriptomic adjustment to nitrogen limitation, with the strongest attenuation observed in #619. At six months, all four accessions had more upregulated than downregulated DEGs. ‘Kolkhida’ and #582 had the largest six-month DEG sets, whereas ‘Karatum’ and #619 had smaller sets. Within the limitations of the RNA-seq design used, these observations indicate substantial accession-specific transcriptional responses and distinct molecular strategies under prolonged nitrogen withdrawal, probably reflecting long-term acclimation, remobilization processes, and activation of stress-associated regulatory pathways.
3.3. Cultivar-Specific and Shared Transcriptional Responses
Comparisons of enriched biological processes and pathway-level responses showed that N withdrawal did not elicit a uniform transcriptional program across the available RNA-seq datasets (three time points for ‘Kolkhida’ and ‘Karatum’; two time points for #582 and #619) (Figure A1, Figure A2 and Figure A3). Instead, enrichment patterns differed among accessions and sampling times.
At two months, only ‘Kolkhida’ and ‘Karatum’ were available for RNA-seq, and no biological process GO term was significantly enriched in both accessions (Figure A1). At four months, no biological process GO term was significantly enriched in all four accessions; however, response to karrikin (GO:0080167) was shared by ‘Kolkhida’, #582, and #619 (Figure A2), and CsELIP1 was upregulated in these three accessions.
Pairwise comparisons revealed a clearer pattern of similarity among accessions. #582 and #619 shared multiple enriched terms associated with secondary cell-wall biogenesis (GO:0009834), lignin biosynthesis and catabolism (GO:0009809, GO:0046274), response to chitin (GO:0010200), glucuronoxylan biosynthesis (GO:0010417), iron-ion transport (GO:0006826), and leaf senescence (GO:0010150). The common upregulated genes in this cultivar pair included Cs2ODD, CsBIC1, CsATL52, CsATL54, and CsOPT4, which increased approximately 3.7- to 8.4-fold under 4-month nitrogen deficiency. Conversely, ‘Kolkhida’ and ‘Karatum’ showed a much more restricted overlap in functions represented by the biological process term killing of cells of another organism (GO:0031640), indicating a more cultivar-specific response in these two cultivars.
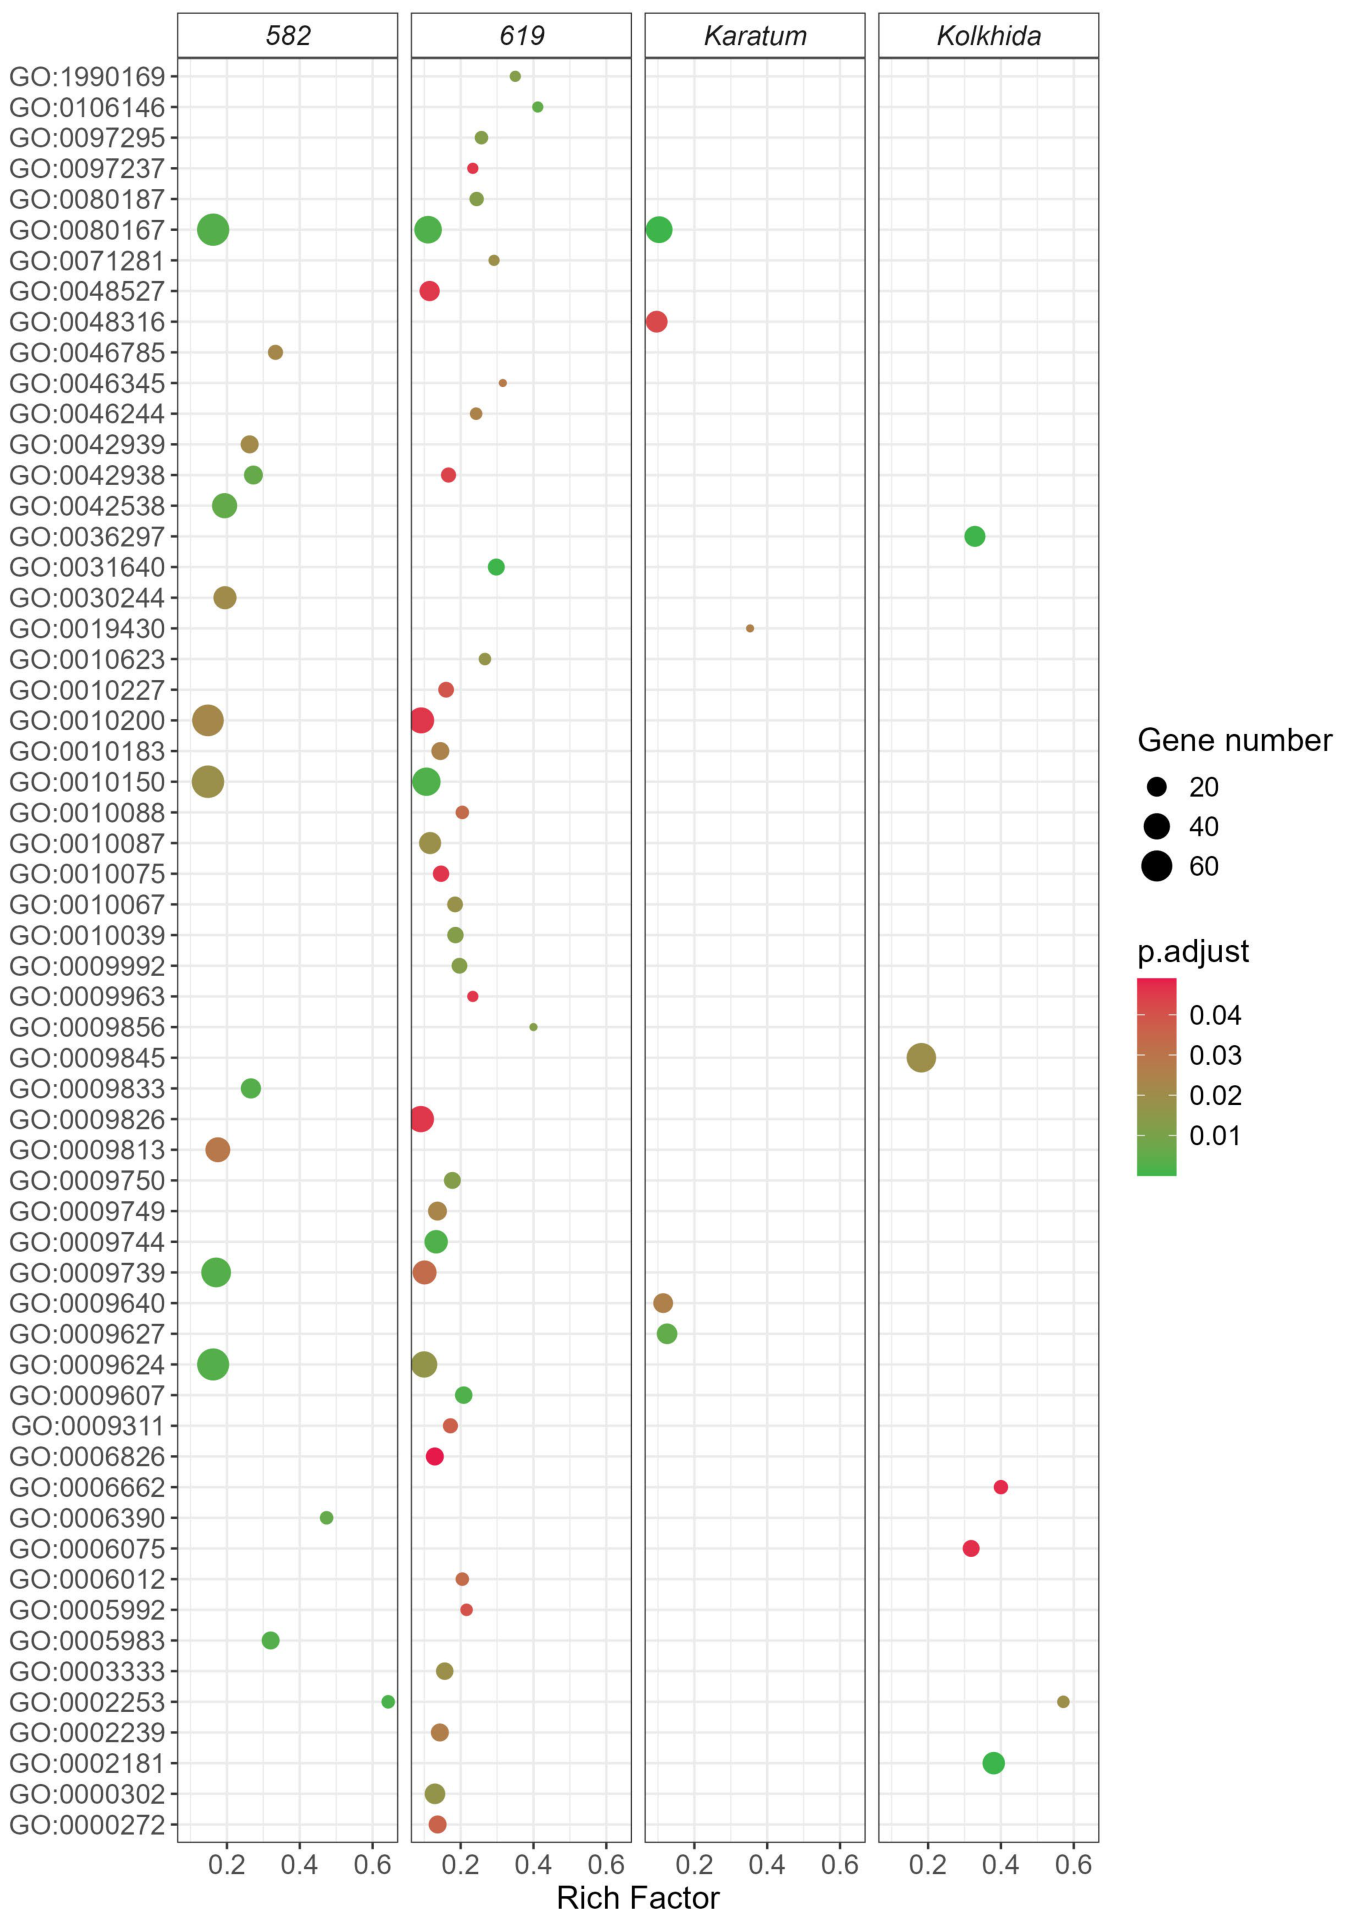
The 6-month response again lacked any biological process term common to all four cultivars, confirming that long-term nitrogen deficiency did not converge into a universal DEG-enriched GO signature (Figure A3). Nevertheless, several partial overlaps were detected. ‘Kolkhida’ and #582 shared enrichment of the immune response term (GO:0002253), represented by the common downregulated genes CsMLP31 and CsKL. ‘Karatum’, #582 and #619 shared response to karrikin (GO:0080167), with CsCWINV1, CsDLO2, CsABCG11, and CsECL1 as common DEGs.
Temporal comparison within each cultivar further demonstrated that the response was not linear. The early response in ‘Kolkhida’ was associated with cell-wall biogenesis, microtubule organization, vacuolar functions, and cell growth, whereas the 4-month response shifted toward abiotic and biotic stress terms, including responses to copper ions, gibberellin, karrikin, ethylene, fructose, and ultraviolet radiation. By six months, ‘Kolkhida’ showed enrichment of repair-, immune-activation-, RNA-processing-, and damage-response-related terms, indicating a transition from acute stress perception to recovery and acclimation.
‘Karatum’ displayed a different trajectory. No GO term was common to all three time points, and the only term shared between two and four months was response to brassinosteroid (GO:0009741). Early DEGs were associated with malate metabolism, tripeptidyl-peptidase activity, and cell expansion, whereas the 4-month involved response biosynthesis and metabolism of plant specialized metabolites, including gibberellins, anthocyanin-containing compounds, and flavonoids. After 6 months, ‘Karatum’ was enriched in processes related to karrikin response, superoxide radical removal, and systemic acquired resistance, indicating that this cultivar activated stress mitigation mechanisms later than ‘Kolkhida’ but maintained a comparatively stable global response.
For #582 and #619, transcriptome data were available only for four and six months. #582 shared six enriched categories between these time points, including response to karrikin, chitin and nematode, and cell-wall-related categories such as cellulose biosynthesis and cellulose synthase activity. #619 shared eleven categories, including response to gibberellin, chitin and karrikin, amino acid transmembrane transport, metal-ion transport, and leaf senescence. These findings describe medium- to long-term responses of the two mutant forms. Both mutant forms showed persistent activation of stress- and wall-related processes, but #619 displayed a broader set of transport- and senescence-related functions.
3.4. Pathway-Level Responses Associated with Tea Quality and Nitrogen Metabolism
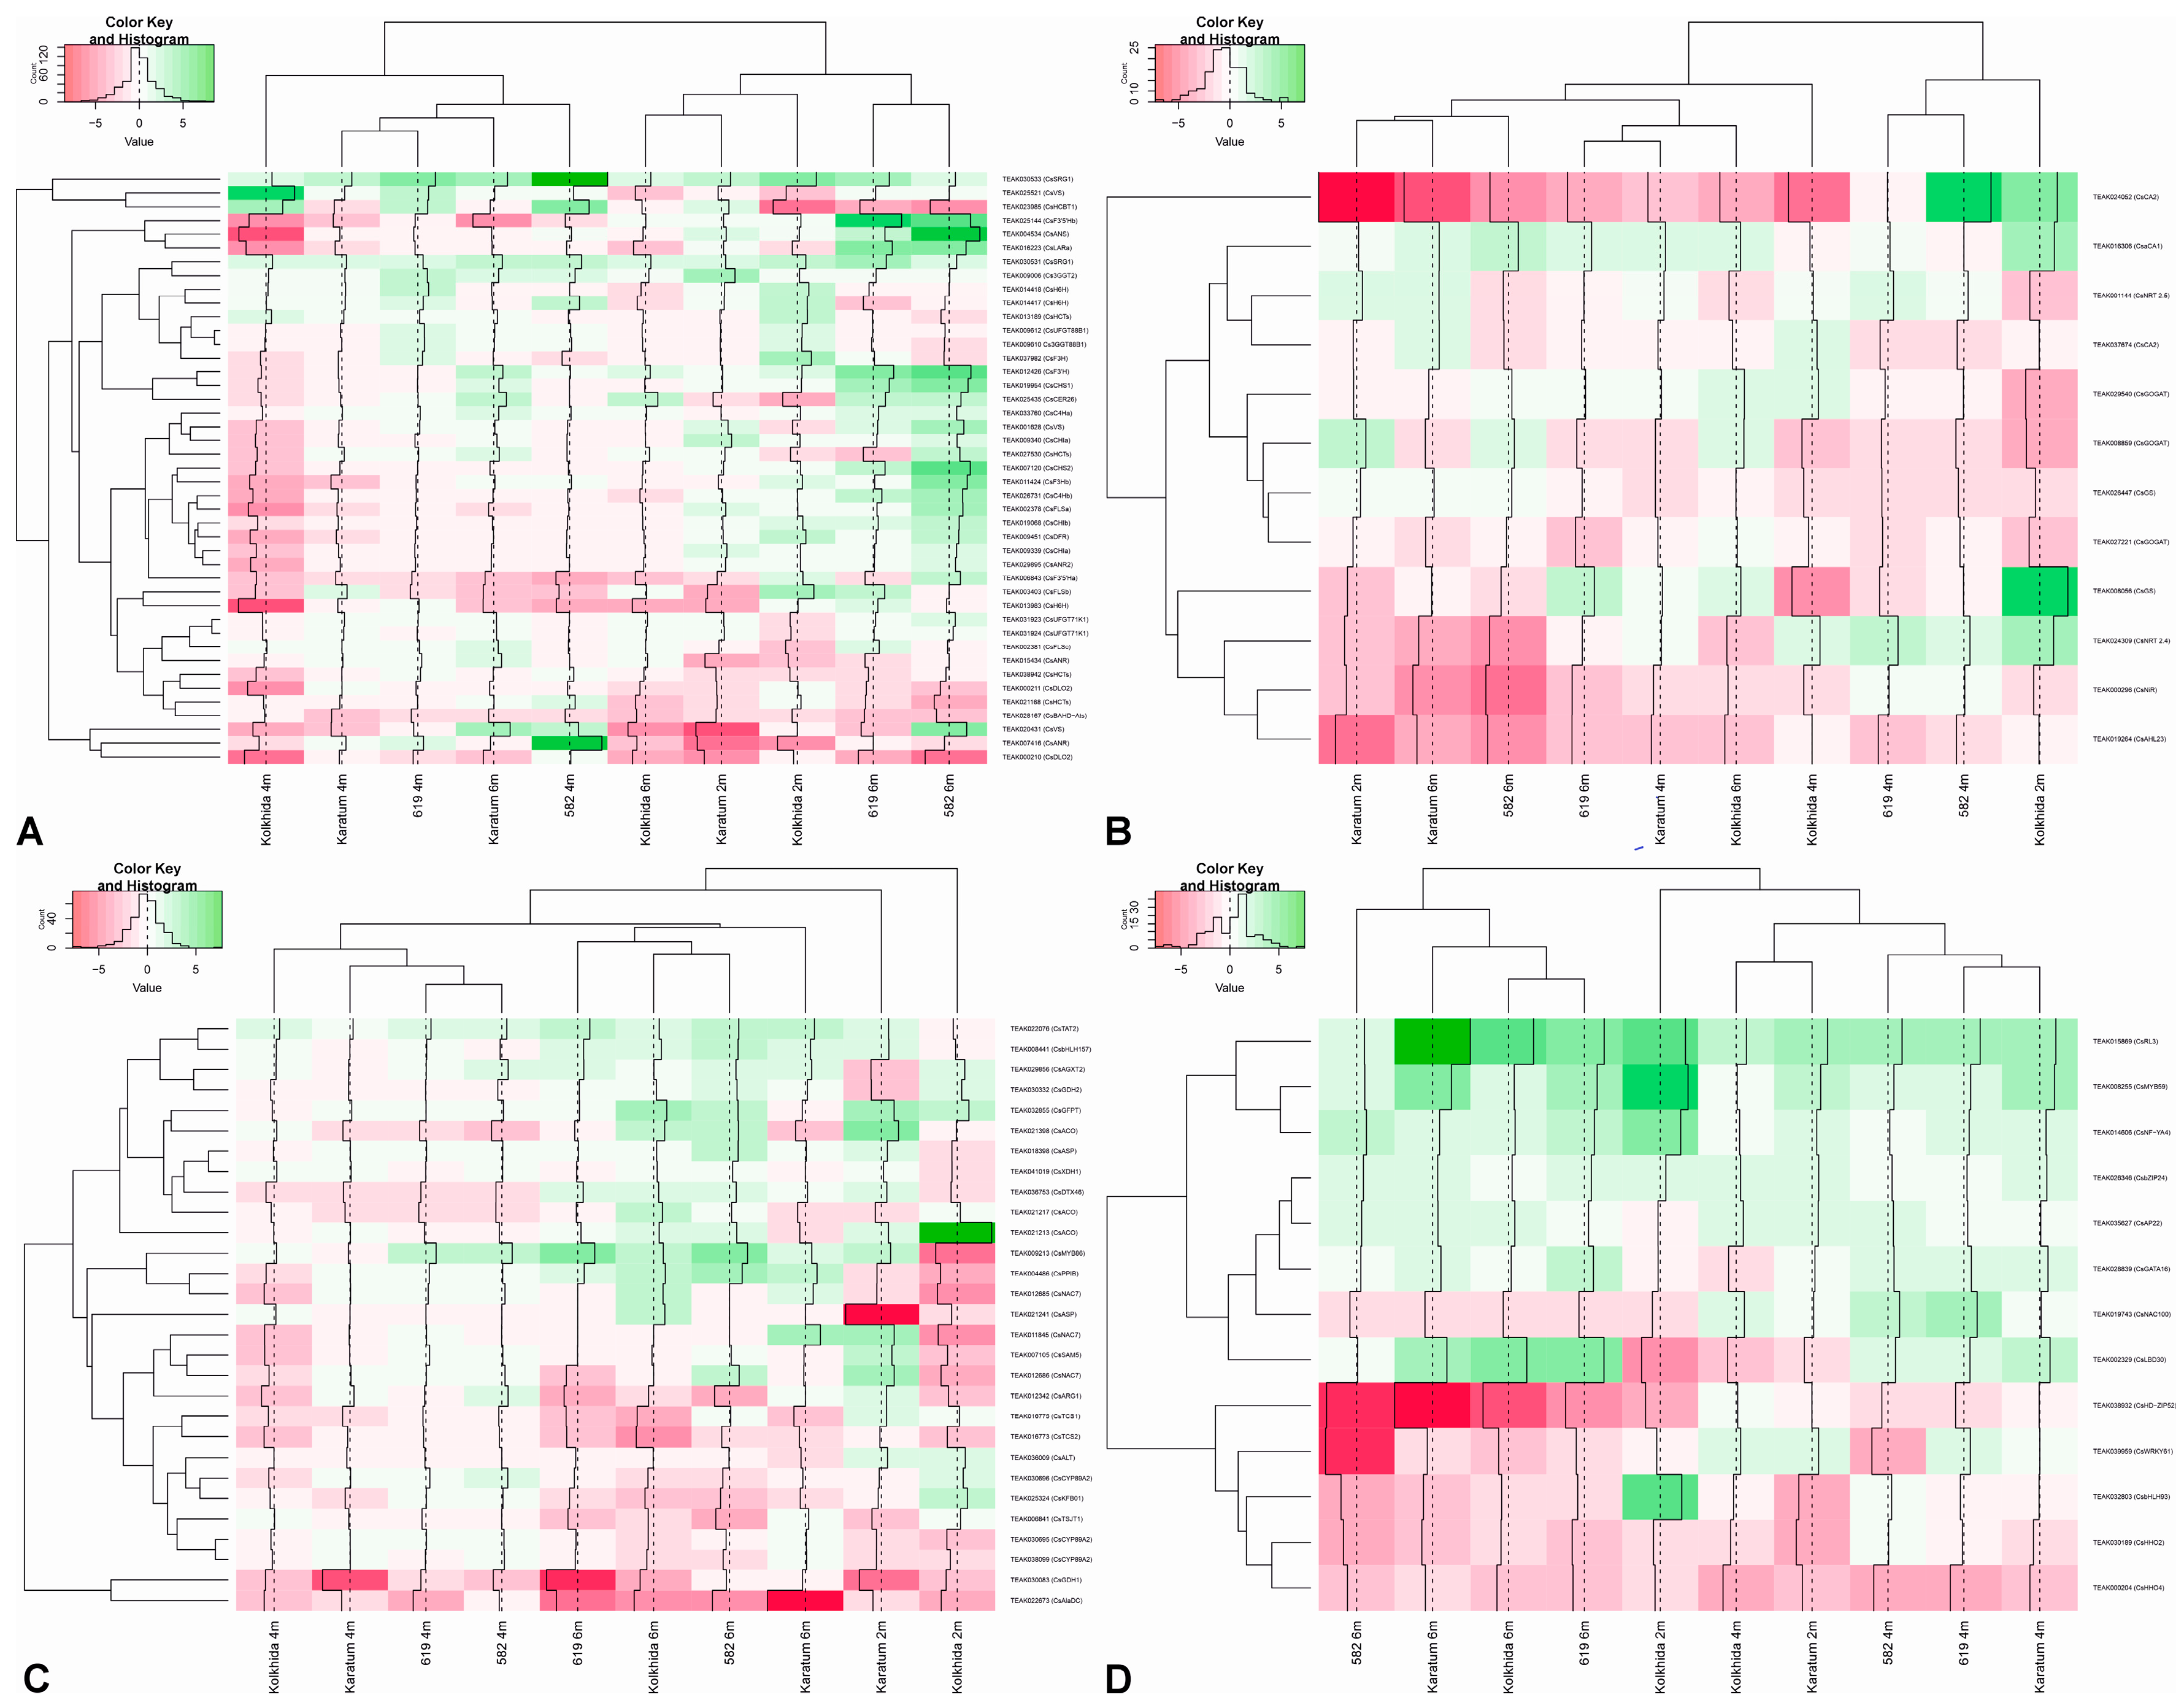
To connect nitrogen deficiency with tea-quality traits, DEGs were analyzed within selected functional pathways: flavonoid biosynthesis (ko00941), nitrogen metabolism (ko00910), caffeine metabolism (ko00232), and pathways associated with L-theanine precursor supply, including alanine, aspartate, and glutamate metabolism (ko00250), amino acid biosynthesis (ko01230), and arginine metabolism (ko00220) (Figure 7). These pathways captured the major metabolic changes detected by HPLC and spectral phenotyping and provided a framework for interpreting cultivar-specific regulation of leaf quality.
Figure 7.
Heatmap of selected nitrogen-deficiency-responsive genes in leaves of in vivo-grown tea plants. (A) Flavonoid and catechin-associated genes. (B) Nitrogen metabolism and photosynthesis-related genes. (C) Caffeine- and theanine-related genes. (D) Transcription factors. Rows correspond to selected candidate genes and pathway-associated genes, and columns correspond to cultivar-time point comparisons. The color scale represents log2 fold change under N− relative to the corresponding N+ control.
3.4.1. Flavonoid and Catechin-Associated Genes
The flavonoid/catechin pathway was among the most responsive modules. Detected DEGs included CsF3′5′H, CsSRG1, CsDLO2, CsCER26, CsDFR, CsH6H, CsCHI, CsC4H, CsANS, CsCHS, Cs3GGT, CsF3′H, CsLAR, BAHD acyltransferases, CsHCBT1, CsVS, and CsHCTs, with smaller changes in CsF3H, CsFLS, CsANR, and CsUFGT. ‘Kolkhida’ and ‘Karatum’ could be followed from two to six months, whereas #582 and #619 were evaluated transcriptionally only at four and six months. The greatest cultivar-specific differences were observed between ‘Kolkhida’/‘Karatum’ and #582/#619. In ‘Kolkhida’, several flavonoid genes increased at the early stage, decreased at four months, and tended to return toward control values by six months. ‘Karatum’ showed weaker changes, especially at four months. #582 and #619 showed pronounced upregulation of several upstream and branch-point genes at six months, including CsF3′H, CsCHS, CsCHI, CsANS, and CsLAR in a cultivar-dependent manner. Two genes were particularly informative within the flavonoid-associated response. CsSRG1, a putative FLS-related gene associated with flavonoid metabolism and senescence, was upregulated across cultivars and time points, with especially strong induction in #582 after four months. In contrast, CsDLO2 was sharply downregulated. The activity of the DMR6-like oxygenase 2 (CsDLO2) is associated with the suppression of plant immunity and the regulation of salicylic acid homeostasis. It has been shown that disruption of CsDLO2 function leads to elevated levels of endogenous salicylic acid and an enhanced response to biotic factors [40].
3.4.2. Nitrogen Metabolism and Photosynthesis-Related Genes
Nitrogen metabolism was represented by DEGs encoding CsGOGAT, CsGS, CsNiR, CsNRT2.4, CsNRT2.5, CsalphaCA1, CsCA2, and CsAHL23. Nitrogen withdrawal altered genes involved in nitrogen assimilation and transport, but the direction and magnitude differed among accessions and time points. In ‘Kolkhida’, several N-assimilation genes were strongly repressed at two months and showed partial recovery at later times. CsGS was reduced at four months in all accessions except ‘Karatum’, whereas CsNiR was reduced at six months in all accessions except ‘Kolkhida’. Nitrate-transporter genes also showed contrasting patterns: CsNRT2.4 was induced in ‘Kolkhida’ but repressed in ‘Karatum’ at two months, whereas CsNRT2.5 was reduced in ‘Kolkhida’ and increased in ‘Karatum’ at six months.
Photosynthesis-related responses were reflected by enrichment of photosynthesis-antenna protein-related genes in ‘Kolkhida’ at four months and by changes in carbonic anhydrase and ELIP-related genes. CsELIP1 was one of the few shared stress-responsive genes at the medium-term stage, and CsCA1/CsCA2 were among the candidate markers validated by RT-qPCR. Together with the spectral decrease in chlorophyll-related indices, these transcriptional changes indicate that nitrogen deficiency affected pigment status and maintenance of the photosynthetic apparatus.
3.4.3. Caffeine- and Theanine-Associated Responses
Caffeine-associated genes showed a predominantly suppressive response in the long-term comparisons. DEGs included CsCYP89A2s, CsXDH1, CsSAM5, CsTCS1, CsTCS2, and the caffeine-associated transcription factors CsNAC7 and CsMYB86. The caffeine-synthase genes CsTCS1 and CsTCS2 were downregulated in several long-term N− comparisons, consistent with the observed decline in caffeine content.
Because KEGG does not contain a dedicated L-theanine biosynthesis pathway, the theanine-related response was analyzed through pathways supplying glutamate and related amino-acid precursors. DEGs included CsGDH1, CsGDH2, CsALT, CsAlaDC, CsTSJT1, CsAGXT2, CsGFPT, CsPPIB, CsACOs, CsTAT2, CsKFB01, CsDTX46, CsbHLH157, CsARG1, and CsASPs. Expression of CsAlaDC, which contributes to ethylamine formation, was reduced in ‘Kolkhida’ at two months and in ‘Karatum’ and #619 at four and six months. CsTAT2 was induced in all cultivars throughout the experiment, whereas CsKFB01 decreased in most cultivars after six months.
3.4.4. Transcription Factors and Candidate Response-Associated Genes
The transcription factor response involved 57 TF families. The largest numbers of DEGs occurred in bHLH, bZIP, C2H2, G2-like, MYB, NAC, and WRKY families, while ARF family genes showed increased activity in all four accessions after six months. Among the 13 TFs selected for detailed inspection, CsHHO2 and CsHHO4 were consistently downregulated in the available comparisons. CsMYB59, CsRL3, CsNF-YA4, CsbZIP24, and CsAP22 showed strong induction in multiple accession–time comparisons, although the magnitude was not uniform across the dataset.
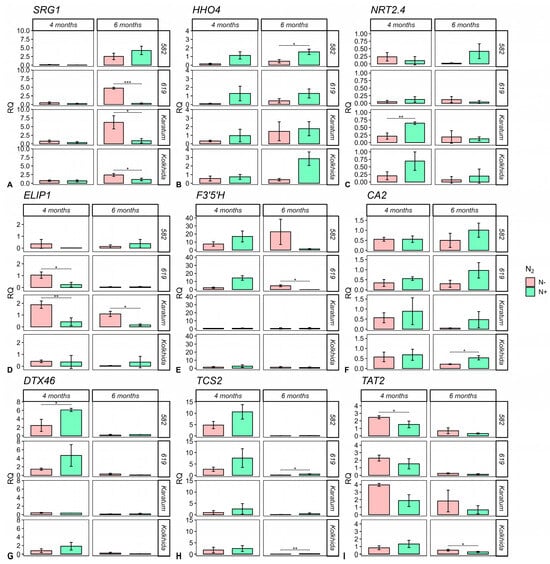
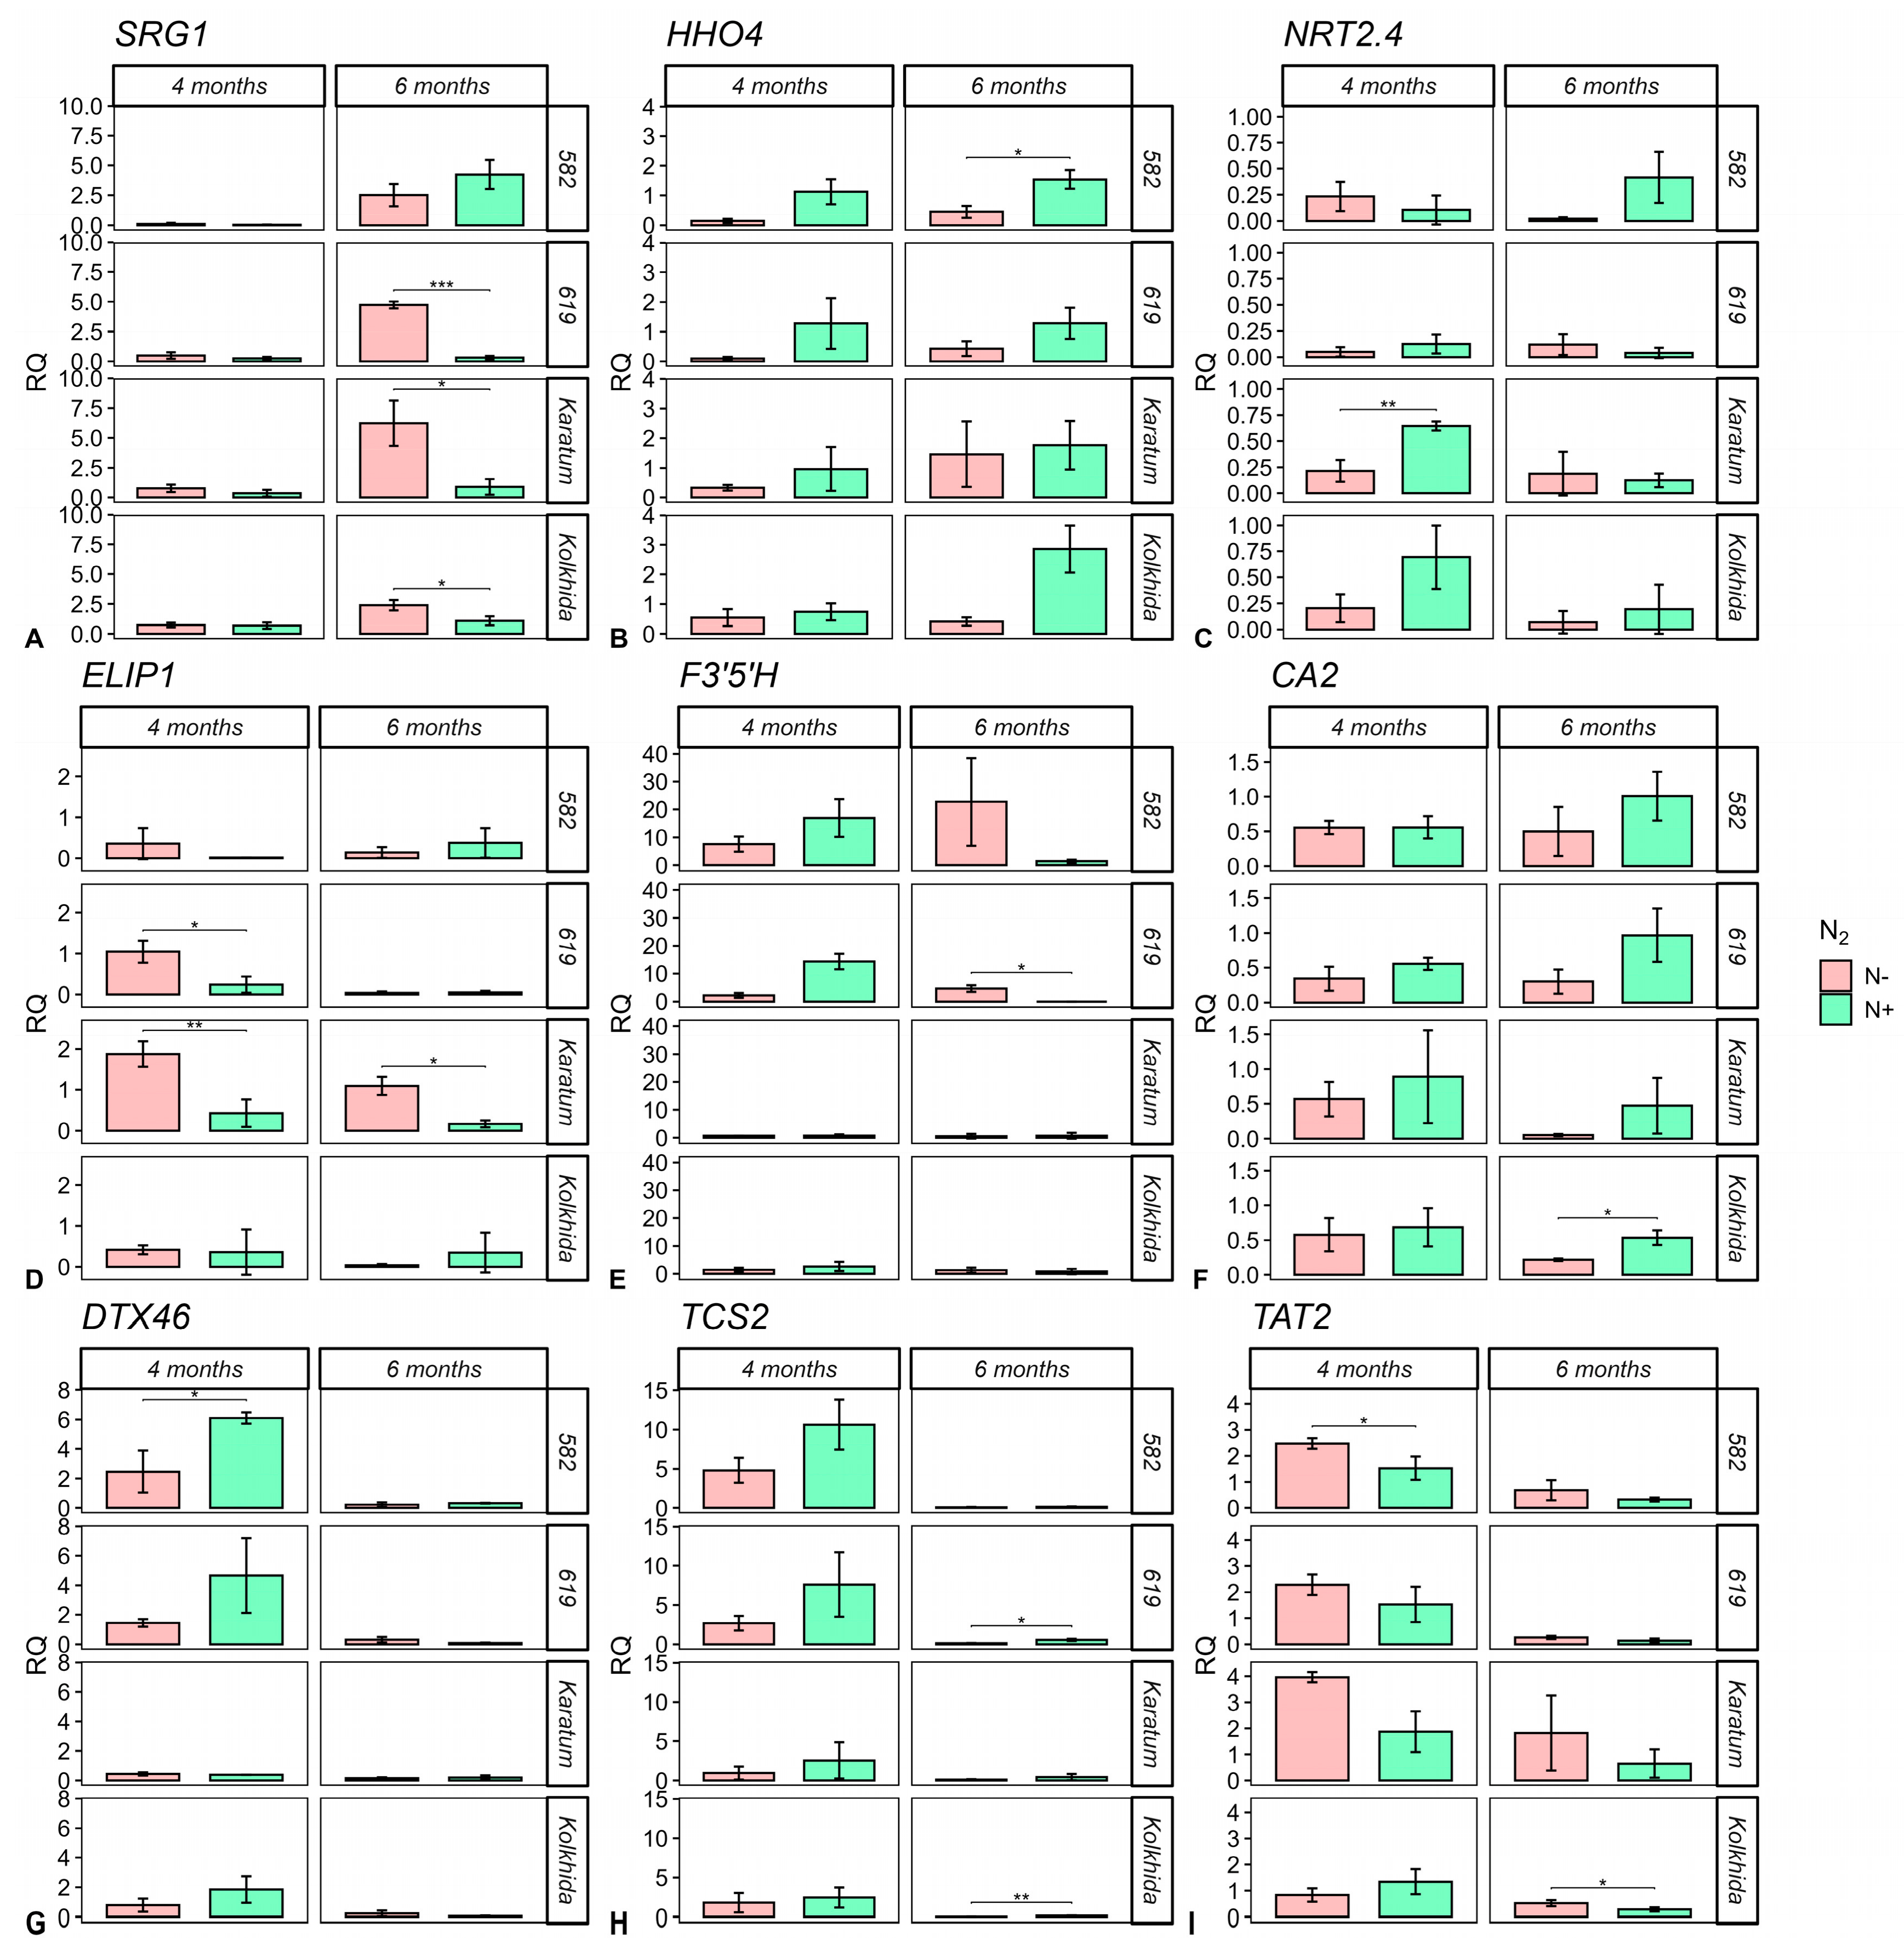
Several candidate genes associated with the nitrogen-deficiency response emerged from the integrated analysis. CsELIP1 and CsCA1/CsCA2 linked spectral evidence of altered pigment status to transcriptomic remodeling of photosynthesis-related processes. CsSRG1 linked flavonoid/catechin metabolism with senescence-associated reprogramming. CsDLO2 connected nitrogen deficiency with defense and salicylic acid-related regulation. CsTAT2 and CsDTX family genes indicated crosstalk between amino acid metabolism, detoxification transport, and abiotic stress tolerance. CsSAG12 reflected the involvement of senescence-associated proteolysis and possible nitrogen remobilization, while CsHHO2 and CsHHO4 represented transcriptional regulation of nitrogen balance. To validate the RNA-seq results, a set of differentially expressed and pathway-associated genes was selected for reverse-transcription quantitative PCR (RT-qPCR) (Figure 8). The genes selected represented major components of the nitrogen-deficiency response detected in leaves: nitrogen transport and signaling (CsNRT2.4 and CsHHO4), photosynthetic and chloroplast stress responses (CsELIP1 and CsCA2), flavonoid- and stress-associated regulation (CsF3′5′H and CsSRG1), membrane transport and detoxification-related processes (CsDTX46), caffeine biosynthesis (CsTCS2), and amino acid metabolism (CsTAT2). This set was chosen to cover both canonical nitrogen-response genes and candidate markers that emerged from the transcriptome analysis as cultivar- and time-dependent components of the tea response to nitrogen limitation.
Figure 8.
Relative expression of selected stress-responsive DEGs assessed by RT-qPCR. (A) SRG1. (B) HHO4. (C) NRT2.4. (D) ELIP1. (E) F3′5′H. (F) CA2. (G) DTX46. (H) TCS2. (I) TAT2. RQ denotes relative expression level after normalization to the internal reference gene CsActin. Values are mean ± SE (n = 3). Asterisks indicate statistically significant differences by t-test (* p < 0.05; ** p < 0.01; *** p < 0.001). Error bars represent standard deviations.
The RT-qPCR profiles were directionally concordant with the RNA-seq results for the tested genes and comparisons, supporting the selected expression patterns without implying validation of unmeasured two-month responses in #582 or #619.
4. Discussion
Nitrogen availability is a major determinant of growth, pigment status, and leaf quality in tea, but long-term responses to withdrawal of external N remain incompletely characterized. The present greenhouse sand-culture experiment characterizes responses to complete withdrawal of exogenous NH4NO3 across phenotypic traits, spectral indices, tea quality metabolites, and the available leaf RNA-seq datasets. The results show strong accession- and time-associated variation; however, because the RNA-seq design is unbalanced at two months and library assignment rates vary among samples, we interpreted the transcriptomic observations as dataset-specific response patterns rather than a single integrated acclimation mechanism.
Nitrogen availability is a major determinant of growth, photosynthetic activity, and leaf quality in tea plants, but the molecular basis of long-term nitrogen-deficiency responses is still not well understood. In the present study, nitrogen deprivation induced coordinated but strongly cultivar-dependent changes in leaf phenotype, spectral indices, tea quality metabolites, and transcriptomic profiles. According to our data, the response of Camellia sinensis to nitrogen deficiency is a dynamic acclimation process involving early transcriptional reprogramming, an intermediate phase of partial adjustment, and renewed long-term activation of stress, transport, senescence, and secondary metabolism pathways.
Leaf nitrogen content was positively associated with L-theanine, caffeine, and chlorophyll-related spectral indices, whereas it was negatively associated with simple and gallated catechins and the stress-sensitive Carter index. This pattern is consistent with the central biochemical role of nitrogen in chlorophyll, amino acid, and alkaloid metabolism [2,3,25]. The decrease in chlorophyll-related indices under nitrogen limitation is expected because nitrogen is required for chlorophyll biosynthesis and for the maintenance of photosynthetic proteins, including Rubisco and components of the electron transport chain. Similar inhibition of carbon dioxide assimilation and photosynthetic electron transport under nitrogen deficiency has previously been reported in tea leaves [25].
Nitrogen deficiency was associated with lower L-theanine and caffeine contents and higher catechin accumulation. This is biologically coherent because L-theanine and caffeine are nitrogen-containing quality metabolites, whereas catechins are carbon-rich phenolic compounds derived from the phenylpropanoid and flavonoid pathways. The shift toward catechin accumulation under nitrogen limitation, therefore, reflects a classical carbon/nitrogen balance response in which reduced nitrogen availability limits amino acid and alkaloid biosynthesis while favoring carbon allocation to phenolic metabolism [2,15,16].
The RNA-seq results varied strongly with sampling time and accession but the experimental design is not identical across all comparisons. Two-month transcriptomes were available only for ‘Kolkhida’ and ‘Karatum’, whereas all four accessions were represented at four and six months. In addition, some ‘Karatum’ biological samples were represented by multiple technical libraries and featureCounts assignment rates varied among libraries (Appendix B). We therefore do not interpret the DEG counts as a statistically demonstrated three-phase acclimation program. The transcriptomic data showed that the response to nitrogen deficiency was strongly time-dependent. For the two cultivars with three time points, the two-month datasets contained the largest DEG sets; for all four accessions, DEG counts were lower at four months than at six months. Such a non-linear pattern suggests that tea leaves undergo at least three phases of response. The early phase is interpreted as acute nitrogen perception coupled with extensive metabolic reprogramming, whereas the four-month time point likely reflects a state of partial acclimation, during which the transcriptome stabilizes under prolonged nitrogen deprivation. The six-month phase appears to represent long-term stress restructuring, involving senescence-related processes, secondary metabolism, transport, and stress-protective pathways. In perennial tea, such long-term dynamics are particularly important because field plants often experience chronic rather than short-term nutrient limitation. The DEG analysis revealed that cultivar was a major determinant of the nitrogen-deficiency response. ‘Kolkhida’ displayed a strong early transcriptional response and evidence of partial long-term recovery or acclimation. ‘Karatum’ showed the most moderate and stable response, with lower DEG numbers and weaker phenotypic perturbation. #582 showed the strongest sensitivity, combining pronounced spectral and biochemical changes with broad long-term transcriptional reprogramming. #619 also responded strongly but appeared to activate a more structured compensatory program, including transport, cell-wall, and senescence-related processes. These patterns indicate that nitrogen-deficiency tolerance in tea is not defined by a single response mechanism. Rather, each cultivar appears to use a distinct strategy involving different balances between stress avoidance, metabolic adjustment, nutrient remobilization, and secondary metabolite production.
The regulation of nitrogen metabolism genes provides insight into these cultivar-specific strategies. Differential expression of genes encoding GOGAT, GS, NiR, NRT2.4, NRT2.5, and carbonic anhydrases indicates that nitrogen deficiency altered both inorganic nitrogen assimilation and associated carbon metabolism. The present results suggest that long-term nitrogen deprivation remodels nitrogen metabolism in a cultivar- and time-dependent manner, probably reflecting differences in internal nitrogen remobilization capacity and metabolic demand.
Genes associated with the phenylpropanoid and flavonoid pathways, including CsCHS, CsCHI, CsF3′H, CsF3′5′H, CsDFR, CsANS, CsANR, CsLAR, and related acyltransferases, were differentially expressed under nitrogen deficiency, consistent with the observed accumulation of catechin pools across tissues, seasons, and stress conditions [8,41,42].
L-theanine biosynthesis depends on glutamate and ethylamine availability and is tightly connected to nitrogen assimilation, alanine metabolism, and amino acid transport [8,10]. Reduced nitrogen availability probably limits precursor supply and alters source–sink transport of nitrogenous compounds, leading to lower theanine accumulation. Because theanine strongly contributes to umami taste and high-grade green tea quality, its decline under nitrogen deficiency represents one of the most important agronomic consequences of long-term nitrogen limitation [10,43].
Caffeine biosynthesis depends on purine metabolism and successive methylation reactions, and its accumulation is influenced by developmental stage, cultivar, and nitrogen status [13,14,44]. The suppression of caffeine-related genes and the positive correlation between caffeine and leaf nitrogen indicate that caffeine metabolism in mature leaves is sensitive to long-term nitrogen supply because caffeine contains multiple nitrogen atoms and competes with other nitrogen sinks under deficiency.
The transcription factor patterns suggest that nitrogen deficiency activates an integrated regulatory network rather than isolated metabolic responses. Members of the MYB, bHLH, NAC, WRKY, bZIP, GATA, and LBD families are known to regulate nitrogen metabolism, flavonoid biosynthesis, senescence, hormone signaling, and stress adaptation [45,46]. In tea, MYB transcription factors are particularly important for flavonoid and catechin biosynthesis, whereas NAC factors have been associated with caffeine metabolism, senescence, and stress responses [14,47]. The observed changes in CsHHO2, CsHHO4, CsLBD30, CsGATA16, and other transcriptional regulators point to regulatory crosstalk between nitrogen sensing, photosynthesis, hormone pathways, and specialized metabolism. This regulatory layer may underlie cultivar-specific metabolic outcomes under the same nitrogen treatment.
From a practical perspective, these results suggest that cultivar selection could help maintain tea performance under reduced nitrogen input. ‘Kolkhida’ showed high early responsiveness and partial long-term acclimation, which may reflect flexible regulatory capacity. Over the medium and long term, #619 exhibited signs of compensation through transport, cell-wall- and senescence-related processes, whereas #582 appeared the most sensitive, with strong stress activation and pronounced metabolic shifts.
Of the four accessions, ‘Karatum’ had the most stable visible and spectral phenotype in the present treatment and smaller DEG sets than ‘Kolkhida’ at the matched RNA-seq time points. That combination makes ‘Karatum’ the strongest candidate in this dataset for follow-up evaluation under reduced nitrogen supply. Even so, nitrogen withdrawal still caused substantial changes in quality-related metabolites, including a marked decrease in L-theanine, and the present experiment used complete NH4NO3 withdrawal in greenhouse sand culture rather than a graded low-N regime or field fertilization treatment. Accordingly, ‘Karatum’ requires independent dose–response testing and field validation before its potential under reduced N supply can be established.
5. Conclusions
Together, the data show that complete withdrawal of exogenous NH4NO3 in greenhouse sand culture reduced leaf nitrogen, L-theanine, and caffeine, altered pigment-associated spectral traits, and increased catechin pools, with response magnitude differing among accessions and sampling times. Importantly, these responses are strongly cultivar-dependent and change over time. Therefore, nitrogen tolerance in tea cannot be assessed from a single time point or metric. ‘Karatum’ showed relative phenotypic and spectral stability in this experiment and warrants further validation under graded low-N supply and field conditions. Accordingly, future evaluation of tea germplasm under reduced nitrogen input should combine physiological indicators, quality-related metabolite profiling, and balanced molecular sampling across prolonged stress exposure.
Supplementary Materials
The following supporting information can be downloaded at https://www.mdpi.com/article/10.3390/ijpb17090086/s1, Supplementary S1: Pearson correlation maps between leaf nitrogen content, biochemical traits, and vegetation indices after two, four, and six months of N treatment for all possible experimental combinations.
Author Contributions
Conceptualization, K.A.M. and L.S.S.; methodology, K.A.M., L.S.S. and L.S.M.; software, K.A.M. and L.S.S.; validation, K.A.M.; investigation, K.A.M., L.S.S. and L.S.M.; resources, E.I.R. and A.V.R.; data curation, K.A.M. and L.S.S.; writing—original draft preparation, K.A.M.; writing—review and editing, K.A.M., L.S.S. and L.V.Z.; visualization, K.A.M.; supervision, E.I.R.; funding acquisition, E.I.R. and A.V.R. All authors have read and agreed to the published version of the manuscript.
Funding
This work was supported by the Ministry of Science and Higher Education of the Russian Federation agreement nos. 075-10-2025-017 (K.A.M., L.V.Z. and E.I.R., molecular genetic studies, sequencing, and data analysis), and Russian Science Foundation (project #22-16-00058) (L.S.S. and L.S.M., biochemical studies). Plant material for this study was provided by FRC SSC RAS supported by program #FGRW-2024-0003, nos. 124022000093-1 (A.V.R.).
Data Availability Statement
The datasets generated during the current study were deposited into the NCBI SRA database and are available under BioProject accession number PRJNA1504564 (https://www.ncbi.nlm.nih.gov/bioproject/PRJNA1504564 accessed on 1 September 2026).
Conflicts of Interest
The authors declare no conflicts of interest.
Abbreviations
| BP | Biological Process |
| DEGs | Differentially Expressed Genes |
| GO | Gene Ontology |
| HPLC | High-Performance Liquid Chromatography |
| KEGG | Kyoto Encyclopedia of Genes and Genomes |
| N | Nitrogen |
| N+ | Nitrogen-sufficient control |
| N− | Nitrogen-deficient treatment |
Appendix A
Pearson correlation coefficients.
Table A1.
Pearson correlation coefficients after two months of nitrogen deficiency.
Table A2.
p-values after two months of nitrogen deficiency.
Table A3.
Pearson correlation coefficients after four months of nitrogen deficiency.
Table A4.
p-values after four months of nitrogen deficiency.
Table A5.
Pearson correlation coefficients after six months of nitrogen deficiency.
Table A6.
p-values after six months of nitrogen deficiency.
Appendix B
Sequencing statistics.
Table A7.
Sequencing statistics.
Appendix C
Biological process GO enrichment in leaves after 2, 4, 6 months of nitrogen deficiency. Bubble plots show enriched biological process terms in each cultivar; dot size indicates the number of DEGs assigned to the term, and color indicates the adjusted p-value.
Figure A1.
BP GO enrichment in leaves after 2 months of nitrogen deficiency in ‘Karatum’ and ‘Kolkhida’.
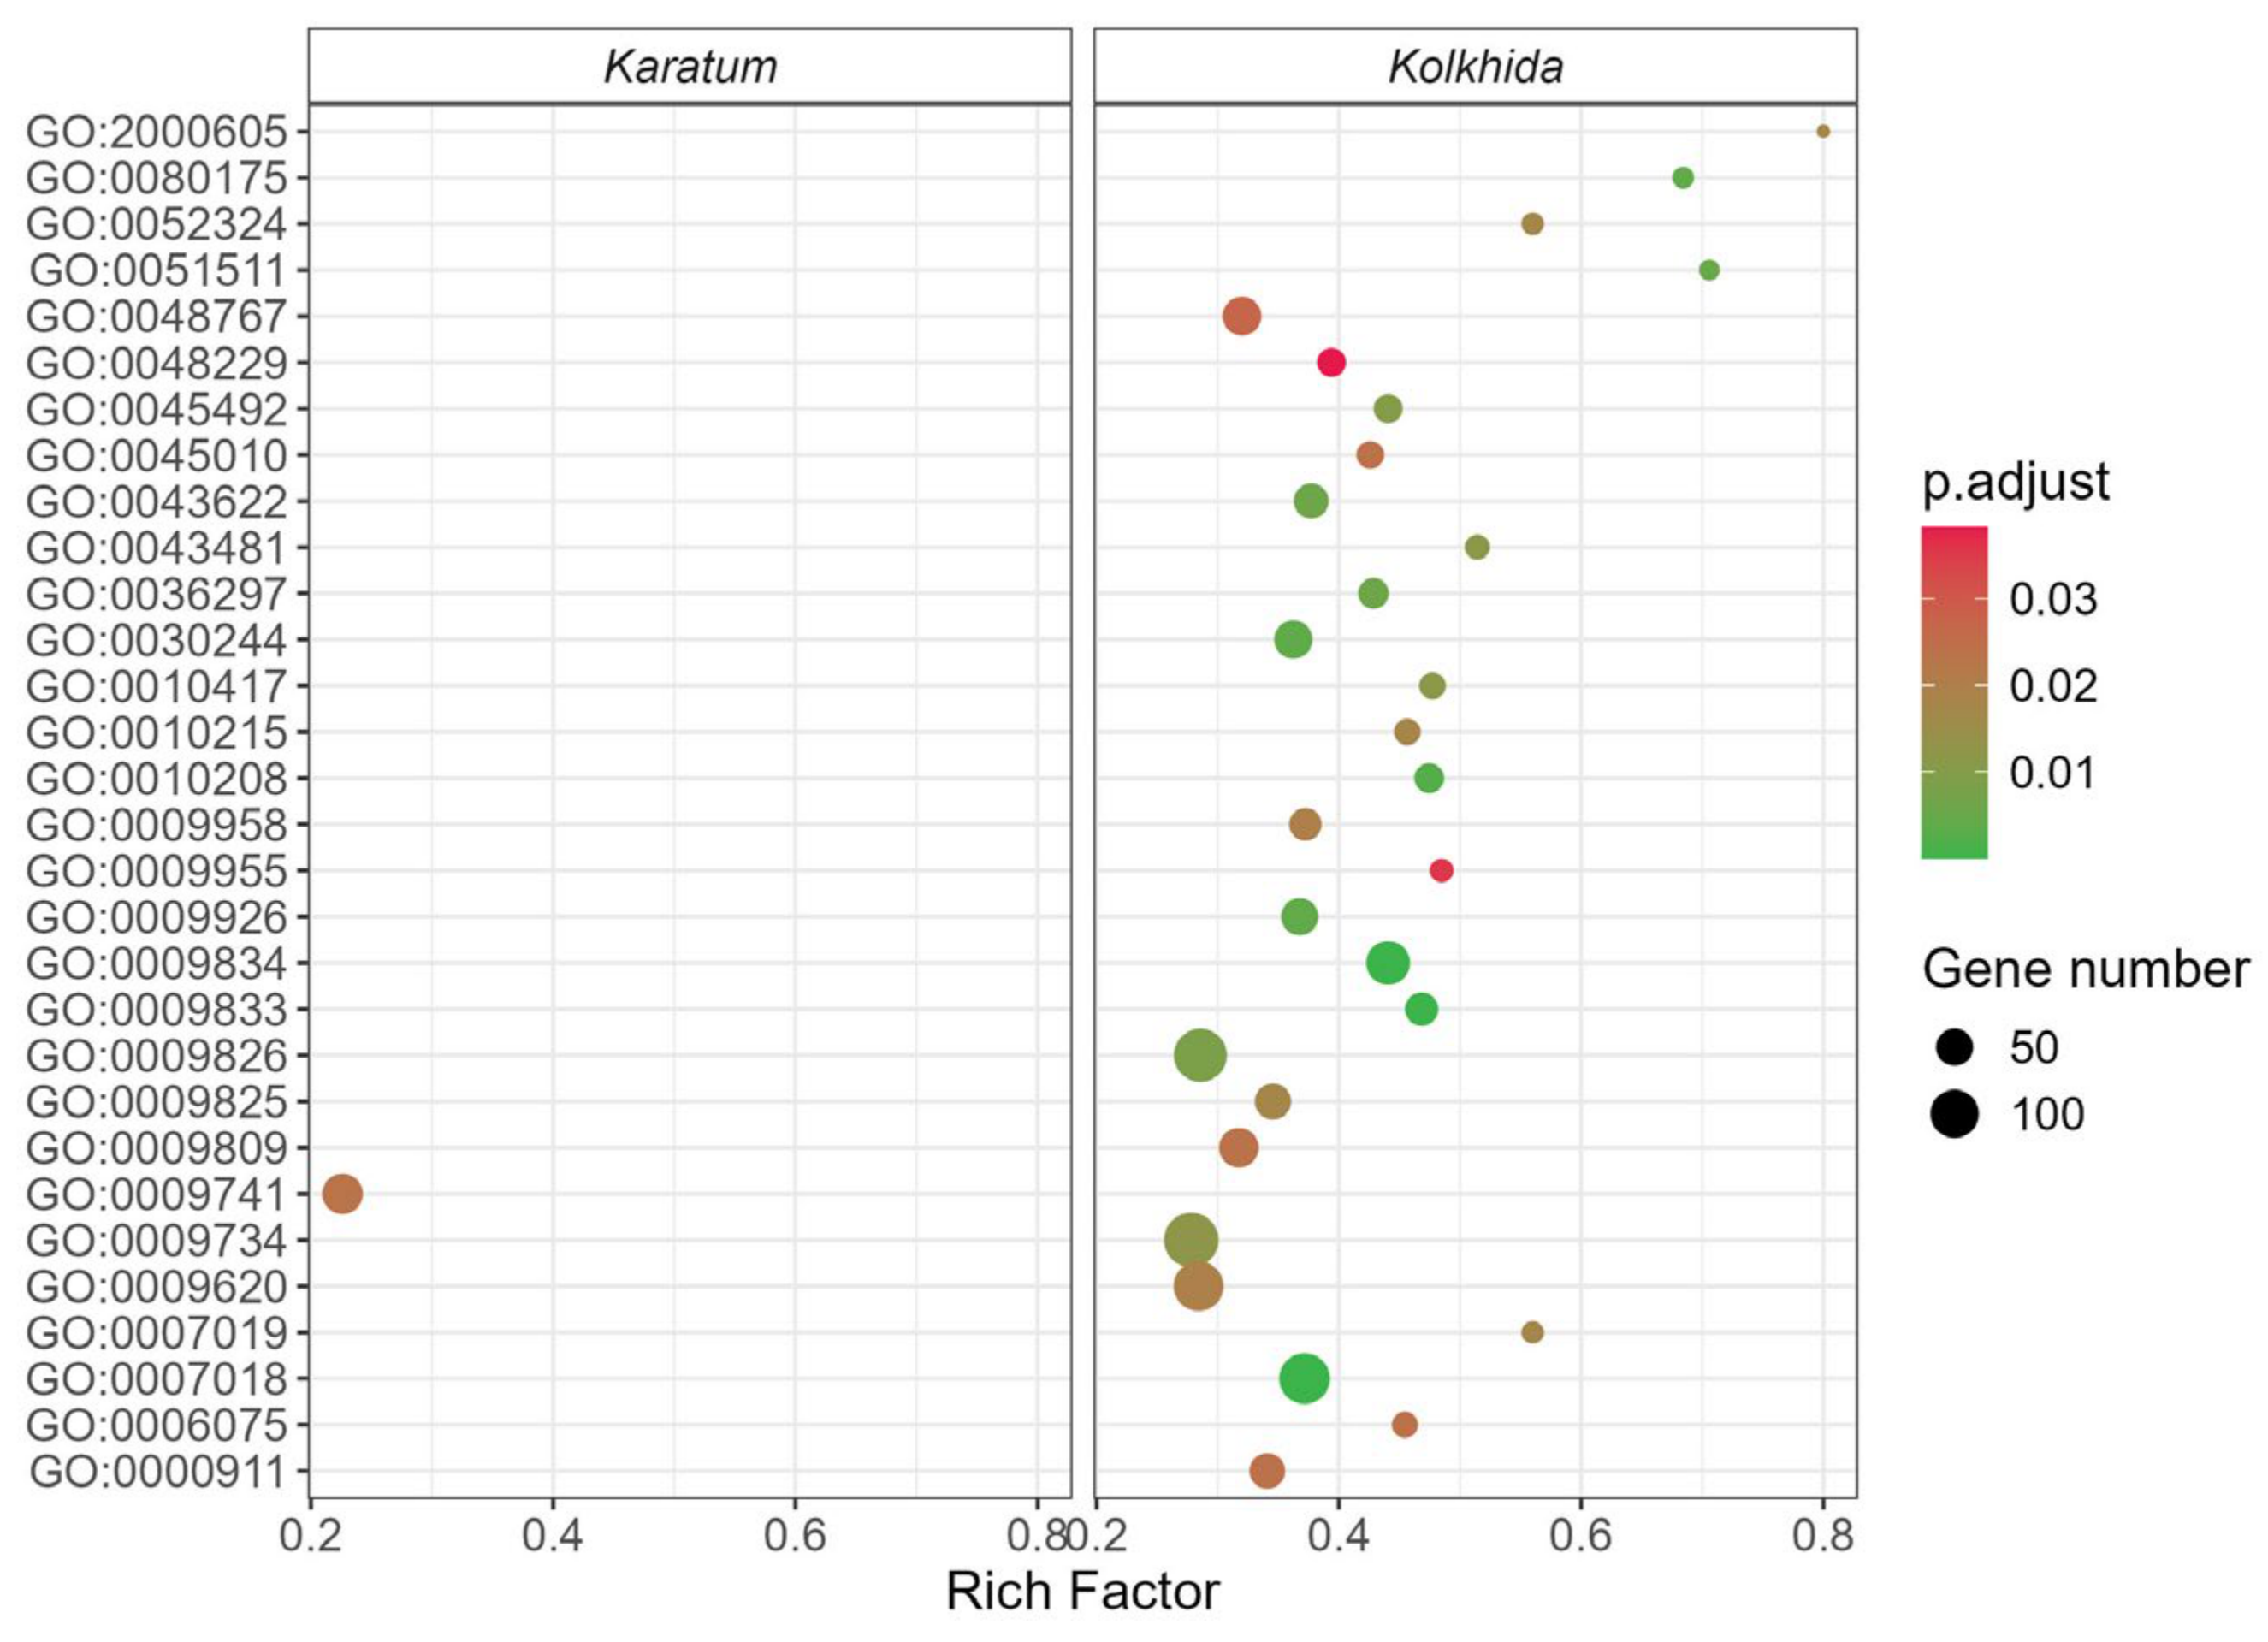
Figure A2.
BP GO enrichment in leaves after 4 months of nitrogen deficiency in each cultivar.
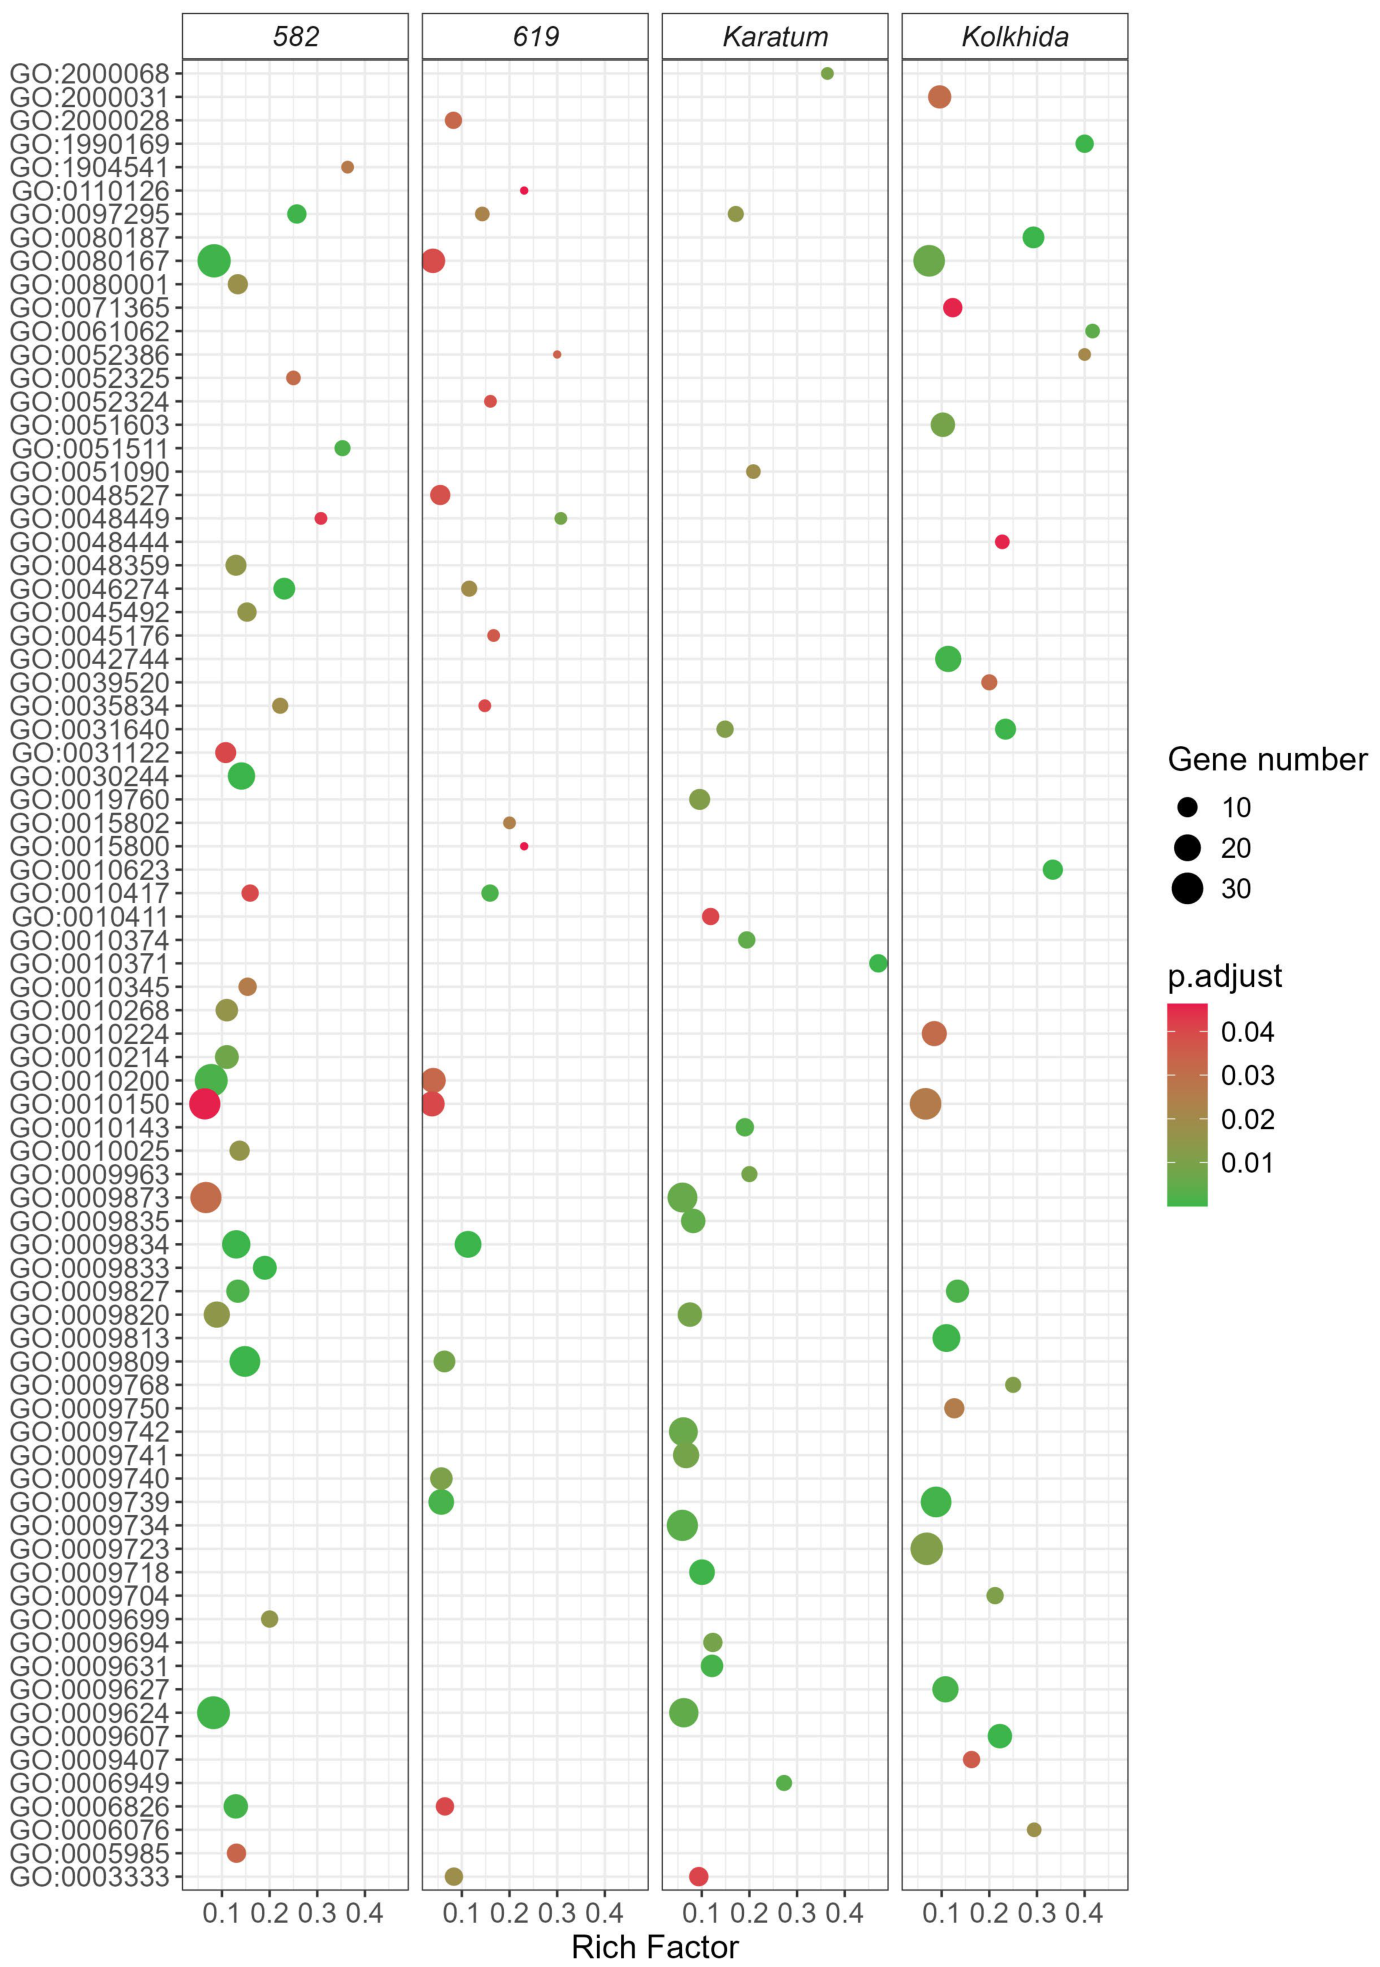
Figure A3.
BP GO enrichment in leaves after 6 months of nitrogen deficiency in each cultivar.
Appendix D
Biochemical test data.
Table A8.
Biochemical test data after two months of nitrogen deficiency.
Table A9.
Biochemical test data after four months of nitrogen deficiency.
Table A10.
Biochemical test data after six months of nitrogen deficiency.
Appendix E
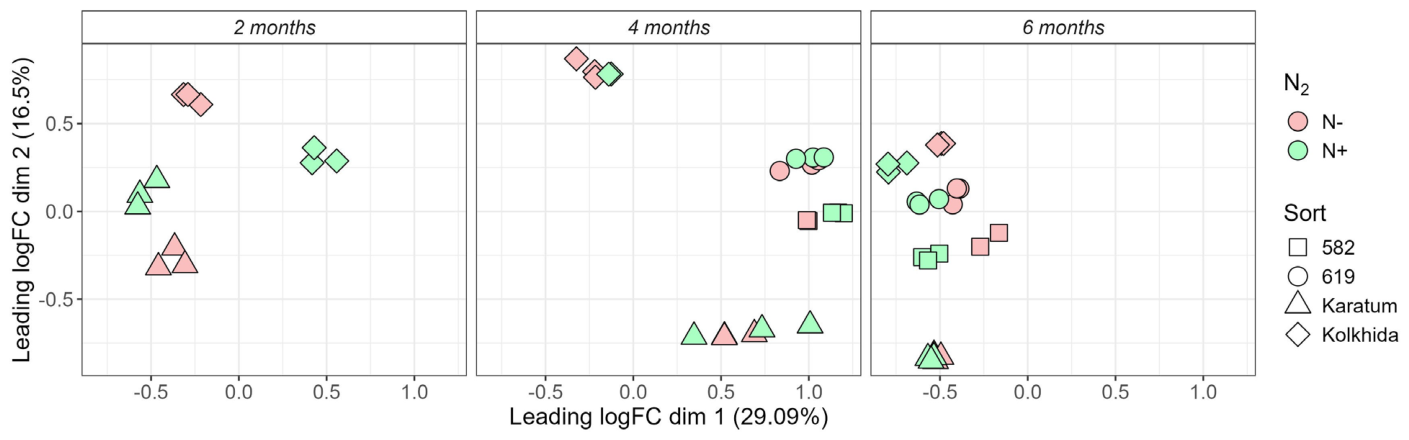
MDS plot based on transcriptome profiling of four tea plant (Camellia sinensis) cultivars at three temporal time points (2, 4, 6 months).
Figure A4.
MDS plot based on transcriptomic analysis of four tea cultivars across three time points.
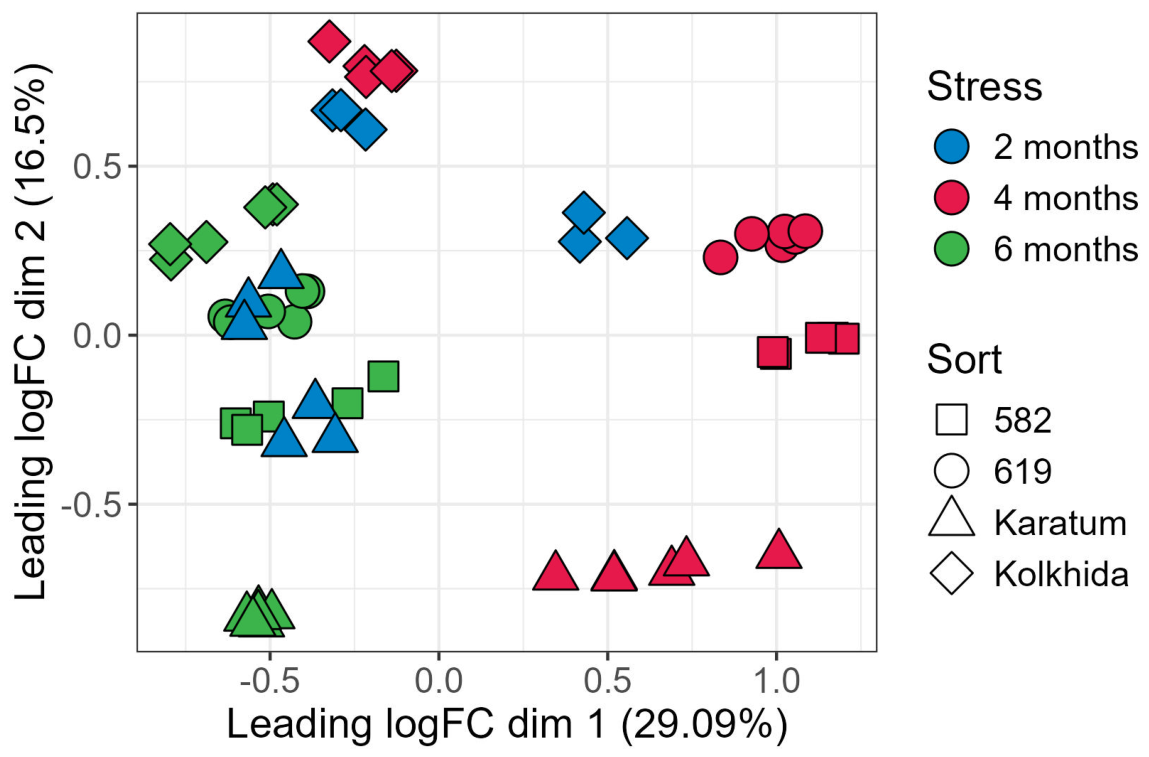
Figure A5.
MDS plot of transcriptome profiles from four tea plant cultivars, grouped by three time points for visualization. The analysis was performed using the same data as in Figure A4.
References
- Zeng, L.; Zhou, X.; Liao, Y.; Yang, Z. Roles of Specialized Metabolites in Biological Function and Environmental Adaptability of Tea Plant (Camellia sinensis) as a Metabolite Studying Model. J. Adv. Res. 2021, 34, 159–171. [Google Scholar] [CrossRef] [Scilit] [PubMed]
- Ruan, J.; Haerdter, R.; Gerendás, J. Impact of Nitrogen Supply on Carbon/Nitrogen Allocation: A Case Study on Amino Acids and Catechins in Green Tea [Camellia sinensis (L.) O. Kuntze] Plants*: N Supply Affects C/N Allocation in Green Tea. Plant Biol. 2010, 12, 724–734. [Google Scholar] [CrossRef] [Scilit] [PubMed]
- Lin, Z.-H.; Chen, C.-S.; Zhong, Q.-S.; Ruan, Q.-C.; Chen, Z.-H.; You, X.-M.; Shan, R.-Y.; Li, X.-L. The GC-TOF/MS-Based Metabolomic Analysis Reveals Altered Metabolic Profiles in Nitrogen-Deficient Leaves and Roots of Tea Plants (Camellia sinensis). BMC Plant Biol. 2021, 21, 506. [Google Scholar] [CrossRef] [Scilit] [PubMed]
- Elrys, A.S.; Elnahal, A.S.; Abdo, A.I.; Desoky, E.-S.M.; Selem, E.; Rady, M.M. Traditional, Modern, and Molecular Strategies for Improving the Efficiency of Nitrogen Use in Crops for Sustainable Agriculture: A Fresh Look at an Old Issue. J. Soil Sci. Plant Nutr. 2022, 22, 3130–3156. [Google Scholar] [CrossRef] [Scilit]
- Chen, C.-F.; Lin, J.-Y. Estimating the Gross Budget of Applied Nitrogen and Phosphorus in Tea Plantations. Sustain. Environ. Res. 2016, 26, 124–130. [Google Scholar] [CrossRef] [Scilit]
- Yan, P.; Shen, C.; Fan, L.; Li, X.; Zhang, L.; Zhang, L.; Han, W. Tea Planting Affects Soil Acidification and Nitrogen and Phosphorus Distribution in Soil. Agric. Ecosyst. Environ. 2018, 254, 20–25. [Google Scholar] [CrossRef] [Scilit]
- Yang, X.; Ma, L.; Ji, L.; Shi, Y.; Yi, X.; Yang, Q.; Ni, K.; Ruan, J. Long-Term Nitrogen Fertilization Indirectly Affects Soil Fungi Community Structure by Changing Soil and Pruned Litter in a Subtropical Tea (Camellia sinensis L.) Plantation in China. Plant Soil 2019, 444, 409–426. [Google Scholar] [CrossRef] [Scilit]
- Liu, M.; Tian, H.-L.; Wu, J.-H.; Cang, R.-R.; Wang, R.-X.; Qi, X.-H.; Xu, Q.; Chen, X.-H. Relationship between Gene Expression and the Accumulation of Catechin during Spring and Autumn in Tea Plants (Camellia sinensis L.). Hortic. Res. 2015, 2, 15011. [Google Scholar] [CrossRef] [Scilit] [PubMed]
- She, G.; Yu, S.; Li, Z.; Peng, A.; Li, P.; Li, Y.; Chang, M.; Liu, L.; Chen, Q.; Shi, C. Characterization of CsTSI in the Biosynthesis of Theanine in Tea Plants (Camellia sinensis). J. Agric. Food Chem. 2022, 70, 826–836. [Google Scholar] [CrossRef] [Scilit] [PubMed]
- Lin, S.; Chen, Z.; Chen, T.; Deng, W.; Wan, X.; Zhang, Z. Theanine Metabolism and Transport in Tea Plants (Camellia sinensis L.): Advances and Perspectives. Crit. Rev. Biotechnol. 2023, 43, 327–341. [Google Scholar] [CrossRef] [Scilit] [PubMed]
- Wang, Y.; Gao, L.; Wang, Z.; Liu, Y.; Sun, M.; Yang, D.; Wei, C.; Shan, Y.; Xia, T. Light-Induced Expression of Genes Involved in Phenylpropanoid Biosynthetic Pathways in Callus of Tea (Camellia sinensis (L.) O. Kuntze). Sci. Hortic. 2012, 133, 72–83. [Google Scholar] [CrossRef] [Scilit]
- Wei, C.; Yang, H.; Wang, S.; Zhao, J.; Liu, C.; Gao, L.; Xia, E.; Lu, Y.; Tai, Y.; She, G.; et al. Draft Genome Sequence of Camellia sinensis Var. Sinensis Provides Insights into the Evolution of the Tea Genome and Tea Quality. Proc. Natl. Acad. Sci. USA 2018, 115, E4151–E4158. [Google Scholar] [CrossRef] [Scilit] [PubMed]
- Sari, F.; Velioglu, Y.S. Changes in Theanine and Caffeine Contents of Black Tea with Different Rolling Methods and Processing Stages. Eur. Food Res. Technol. 2013, 237, 229–236. [Google Scholar] [CrossRef] [Scilit]
- Ma, W.; Kang, X.; Liu, P.; She, K.; Zhang, Y.; Lin, X.; Li, B.; Chen, Z. The NAC-like Transcription Factor CsNAC7 Positively Regulates the Caffeine Biosynthesis-Related Gene yhNMT1 in Camellia sinensis. Hortic. Res. 2022, 9, uhab046. [Google Scholar] [CrossRef] [Scilit] [PubMed]
- Lillo, C.; Lea, U.S.; Ruoff, P. Nutrient Depletion as a Key Factor for Manipulating Gene Expression and Product Formation in Different Branches of the Flavonoid Pathway. Plant Cell Environ. 2008, 31, 587–601. [Google Scholar] [CrossRef] [Scilit] [PubMed]
- Huang, H.; Yao, Q.; Xia, E.; Gao, L. Metabolomics and Transcriptomics Analyses Reveal Nitrogen Influences on the Accumulation of Flavonoids and Amino Acids in Young Shoots of Tea Plant (Camellia sinensis L.) Associated with Tea Flavor. J. Agric. Food Chem. 2018, 66, 9828–9838. [Google Scholar] [CrossRef] [Scilit] [PubMed]
- Fan, K.; Zhang, Q.; Tang, D.; Shi, Y.; Ma, L.; Liu, M.; Ruan, J. Dynamics of Nitrogen Translocation from Mature Leaves to New Shoots and Related Gene Expression during Spring Shoots Development in Tea Plants (Camellia sinensis L.). J. Plant Nutr. Soil Sci. 2020, 183, 180–191. [Google Scholar] [CrossRef] [Scilit]
- Wang, Y.; Cheng, X.; Yang, T.; Su, Y.; Lin, S.; Zhang, S.; Zhang, Z. Nitrogen-Regulated Theanine and Flavonoid Biosynthesis in Tea Plant Roots: Protein-Level Regulation Revealed by Multiomics Analyses. J. Agric. Food Chem. 2021, 69, 10002–10016. [Google Scholar] [CrossRef] [Scilit] [PubMed]
- Wang, Y.; Xuan, Y.; Wang, S.; Fan, D.; Wang, X.; Zheng, X. Genome-wide Identification, Characterization, and Expression Analysis of the Ammonium Transporter Gene Family in Tea Plants (Camellia sinensis L.). Physiol. Plant. 2022, 174, e13646. [Google Scholar] [CrossRef] [Scilit] [PubMed]
- Lin, Z.-H.; Chen, C.-S.; Zhao, S.-Q.; Liu, Y.; Zhong, Q.-S.; Ruan, Q.-C.; Chen, Z.-H.; You, X.-M.; Shan, R.-Y.; Li, X.-L.; et al. Molecular and Physiological Mechanisms of Tea (Camellia sinensis (L.) O. Kuntze) Leaf and Root in Response to Nitrogen Deficiency. BMC Genom. 2023, 24, 27. [Google Scholar] [CrossRef] [Scilit] [PubMed]
- Wang, Y.; Ouyang, J.-X.; Fan, D.-M.; Wang, S.-M.; Xuan, Y.-M.; Wang, X.-C.; Zheng, X.-Q. Transcriptome Analysis of Tea (Camellia sinensis) Leaves in Response to Ammonium Starvation and Recovery. Front. Plant Sci. 2022, 13, 963269. [Google Scholar] [CrossRef] [Scilit] [PubMed]
- Malyukova, L.S. Genetic Mechanisms of the Biosynthesis of Catechins, Caffeine and L-Theanine in the Tea Plant Camellia sinensis (L.) Kuntze (Review). Agric. Biol. 2022, 57, 882–896. [Google Scholar] [CrossRef] [Scilit]
- Li, W.; Xiang, F.; Zhong, M.; Zhou, L.; Liu, H.; Li, S.; Wang, X. Transcriptome and Metabolite Analysis Identifies Nitrogen Utilization Genes in Tea Plant (Camellia sinensis). Sci. Rep. 2017, 7, 1693. [Google Scholar] [CrossRef] [Scilit] [PubMed]
- Samarina, L.S.; Matskiv, A.O.; Shkhalakhova, R.M.; Koninskaya, N.G.; Hanke, M.-V.; Flachowsky, H.; Shumeev, A.N.; Manakhova, K.A.; Malyukova, L.S.; Liu, S.; et al. Genetic Diversity and Genome Size Variability in the Russian Genebank Collection of Tea Plant [Camellia sinensis (L). O. Kuntze]. Front. Plant Sci. 2022, 12, 800141. [Google Scholar] [CrossRef] [Scilit] [PubMed]
- Lin, Z.; Zhong, Q.; Chen, C.; Ruan, Q.; Chen, Z.; You, X. Carbon Dioxide Assimilation and Photosynthetic Electron Transport of Tea Leaves under Nitrogen Deficiency. Bot. Stud. 2016, 57, 37. [Google Scholar] [CrossRef] [Scilit] [PubMed]
- Samarina, L.; Malyukova, L.; Wang, S.; Bobrovskikh, A.; Doroshkov, A.; Shkhalakhova, R.; Manakhova, K.; Koninskaya, N.; Matskiv, A.; Ryndin, A.; et al. In Vitro vs. In Vivo Transcriptomic Approach Revealed Core Pathways of Nitrogen Deficiency Response in Tea Plant (Camellia sinensis (L.) Kuntze). Int. J. Mol. Sci. 2024, 25, 11726. [Google Scholar] [CrossRef] [Scilit] [PubMed]
- Ginzburg, K.; Shcheglova, G.; Vulfius, E. Accelerated method of burning soils and plants. Soil Sci. 1963, 5, 89–96. [Google Scholar]
- Zarco-Tejada, P.J.; Miller, J.R.; Noland, T.L.; Mohammed, G.H.; Sampson, P.H. Scaling-up and Model Inversion Methods with Narrowband Optical Indices for Chlorophyll Content Estimation in Closed Forest Canopies with Hyperspectral Data. IEEE Trans. Geosci. Remote Sens. 2001, 39, 1491–1507. [Google Scholar] [CrossRef] [Scilit]
- Vogelmann, J.E.; Rock, B.N.; Moss, D.M. Red Edge Spectral Measurements from Sugar Maple Leaves. Int. J. Remote Sens. 1993, 14, 1563–1575. [Google Scholar] [CrossRef] [Scilit]
- Sims, D.A.; Gamon, J.A. Relationships between Leaf Pigment Content and Spectral Reflectance across a Wide Range of Species, Leaf Structures and Developmental Stages. Remote Sens. Environ. 2002, 81, 337–354. [Google Scholar] [CrossRef] [Scilit]
- Gitelson, A.A.; Merzlyak, M.N. Remote Estimation of Chlorophyll Content in Higher Plant Leaves. Int. J. Remote Sens. 1997, 18, 2691–2697. [Google Scholar] [CrossRef] [Scilit]
- Carter, G.A. Ratios of Leaf Reflectances in Narrow Wavebands as Indicators of Plant Stress. Int. J. Remote Sens. 1994, 15, 697–703. [Google Scholar] [CrossRef] [Scilit]
- Andrews, S. FastQC: A Quality Control Tool for High Throughput Sequence Data, Version 0.11.9; Babraham Bioinformatics: Cambridge, UK, 2010. Available online: https://www.bioinformatics.babraham.ac.uk/projects/fastqc/ (accessed on 1 September 2026).
- Schubert, M.; Lindgreen, S.; Orlando, L. AdapterRemoval v2: Rapid Adapter Trimming, Identification, and Read Merging. BMC Res. Notes 2016, 9, 88. [Google Scholar] [CrossRef] [Scilit] [PubMed]
- Kim, D.; Paggi, J.M.; Park, C.; Bennett, C.; Salzberg, S.L. Graph-Based Genome Alignment and Genotyping with HISAT2 and HISAT-Genotype. Nat. Biotechnol. 2019, 37, 907–915. [Google Scholar] [CrossRef] [Scilit] [PubMed]
- Liao, Y.; Smyth, G.K.; Shi, W. featureCounts: An Efficient General Purpose Program for Assigning Sequence Reads to Genomic Features. Bioinformatics 2014, 30, 923–930. [Google Scholar] [CrossRef] [Scilit] [PubMed]
- Chen, Y.; Chen, L.; Lun, A.T.L.; Baldoni, P.L.; Smyth, G.K. edgeR v4: Powerful Differential Analysis of Sequencing Data with Expanded Functionality and Improved Support for Small Counts and Larger Datasets. Nucleic Acids Res. 2024, 53, gkaf018. [Google Scholar] [CrossRef] [Scilit] [PubMed]
- Yu, G.; Wang, L.-G.; Han, Y.; He, Q.-Y. clusterProfiler: An R Package for Comparing Biological Themes Among Gene Clusters. OMICS J. Integr. Biol. 2012, 16, 284–287. [Google Scholar] [CrossRef] [Scilit] [PubMed]
- Livak, K.J.; Schmittgen, T.D. Analysis of Relative Gene Expression Data Using Real-Time Quantitative PCR and the 2−ΔΔCT Method. Methods 2001, 25, 402–408. [Google Scholar] [CrossRef] [Scilit] [PubMed]
- Giacomelli, L.; Zeilmaker, T.; Giovannini, O.; Salvagnin, U.; Masuero, D.; Franceschi, P.; Vrhovsek, U.; Scintilla, S.; Rouppe Van Der Voort, J.; Moser, C. Simultaneous Editing of Two DMR6 Genes in Grapevine Results in Reduced Susceptibility to Downy Mildew. Front. Plant Sci. 2023, 14, 1242240. [Google Scholar] [CrossRef] [Scilit] [PubMed]
- Rani, A.; Singh, K.; Ahuja, P.S.; Kumar, S. Molecular Regulation of Catechins Biosynthesis in Tea [Camellia sinensis (L.) O. Kuntze]. Gene 2012, 495, 205–210. [Google Scholar] [CrossRef] [Scilit] [PubMed]
- Gong, A.-D.; Lian, S.-B.; Wu, N.-N.; Zhou, Y.-J.; Zhao, S.-Q.; Zhang, L.-M.; Cheng, L.; Yuan, H.-Y. Integrated Transcriptomics and Metabolomics Analysis of Catechins, Caffeine and Theanine Biosynthesis in Tea Plant (Camellia sinensis) over the Course of Seasons. BMC Plant Biol. 2020, 20, 294. [Google Scholar] [CrossRef] [Scilit] [PubMed]
- Mu, W.; Zhang, T.; Jiang, B. An Overview of Biological Production of L-Theanine. Biotechnol. Adv. 2015, 33, 335–342. [Google Scholar] [CrossRef] [Scilit] [PubMed]
- Mohanpuria, P.; Kumar, V.; Yadav, S.K. Tea Caffeine: Metabolism, Functions, and Reduction Strategies. Food Sci. Biotechnol. 2010, 19, 275–287. [Google Scholar] [CrossRef] [Scilit]
- Xu, W.; Dubos, C.; Lepiniec, L. Transcriptional Control of Flavonoid Biosynthesis by MYB–bHLH–WDR Complexes. Trends Plant Sci. 2015, 20, 176–185. [Google Scholar] [CrossRef] [Scilit] [PubMed]
- Li, P.; Xia, E.; Fu, J.; Xu, Y.; Zhao, X.; Tong, W.; Tang, Q.; Tadege, M.; Fernie, A.R.; Zhao, J. Diverse Roles of MYB Transcription Factors in Regulating Secondary Metabolite Biosynthesis, Shoot Development, and Stress Responses in Tea Plants (Camellia sinensis). Plant J. 2022, 110, 1144–1165. [Google Scholar] [CrossRef] [Scilit] [PubMed]
- Jiang, X.; Huang, K.; Zheng, G.; Hou, H.; Wang, P.; Jiang, H.; Zhao, X.; Li, M.; Zhang, S.; Liu, Y. CsMYB5a and CsMYB5e from Camellia sinensis Differentially Regulate Anthocyanin and Proanthocyanidin Biosynthesis. Plant Sci. 2018, 270, 209–220. [Google Scholar] [CrossRef] [Scilit] [PubMed]

Disclaimer/Publisher’s Note: The statements, opinions and data contained in all publications are solely those of the individual author(s) and contributor(s) and not of MDPI and/or the editor(s). MDPI and/or the editor(s) disclaim responsibility for any injury to people or property resulting from any ideas, methods, instructions or products referred to in the content. |
© 2026 by the authors. Licensee MDPI, Basel, Switzerland. This article is an open access article distributed under the terms and conditions of the Creative Commons Attribution (CC BY) license.