


Abstract
Commercial seaweed extracts (SWEs) are widely used as plant biostimulants; however, information on formulation-specific optimum dosages for greenhouse-grown Capsicum annuum seedlings is limited. This study evaluated the effects of five commercial SWE formulations applied at five dosages (1–5 mL L−1) on seedling growth, biomass accumulation, and root growth under greenhouse conditions. Morphological traits, biomass characteristics, and growth efficiency indices were assessed using univariate and multivariate statistical approaches to identify formulation-specific optimum application rates. Commercial SWE application significantly (p < 0.05) increased chlorophyll content, shoot and root growth, and fresh biomass, although the magnitude of the response varied among the formulations and application rates. The optimum dosages identified by the Technique for Order Preference by Similarity to Ideal Solution (TOPSIS) were ASCO at 2 mL L−1, AQUA at 3 mL L−1, BIO at 2 mL L−1, KAT at 3 mL L−1, and SAGA at 3 mL L−1. Principal component and Pearson correlation analyses further demonstrated coordinated improvements across multiple growth traits. These findings demonstrate that optimum seedling performance depends on formulation-specific rather than universal application rates. The identified optimum dosages provide practical guidance for selecting commercial seaweed biostimulant application rates in greenhouse C. annuum nurseries.
1. Introduction
Capsicum annuum L. is one of the most widely cultivated vegetable crops worldwide and is valued for its economic importance, nutritional quality, and extensive use in the fresh consumption, processing, and spice industries [1,2]. In greenhouse production, successful crop establishment largely depends on the quality of nursery-grown seedlings, as vigorous transplants establish rapidly and support subsequent vegetative and reproductive development [3,4]. High-quality seedlings are characterized by vigorous shoot and root development, which are essential for successful transplantation and productivity [5].
Despite advances in protected cultivation, producing vigorous C. annuum seedlings remains challenging because their early growth is highly sensitive to environmental and nutritional conditions [6,7]. Commercial nurseries rely heavily on mineral fertilizers to promote rapid growth in seedlings. However, intensive fertilizer use may reduce nutrient-use efficiency, increase production costs, and contribute to environmental concerns [8,9]. Consequently, sustainable approaches that improve early seedling vigor while reducing fertilizer dependence are required.
Plant biostimulants, including plant growth-promoting microorganisms (e.g., beneficial bacteria and fungi) and microalgae-based products, have gained increasing attention as sustainable agricultural inputs because of their ability to enhance germination, seedling growth, stress tolerance, and crop establishment across diverse environmental conditions [10,11,12,13,14,15,16]. Among these, seaweed extracts (SWEs) have gained considerable interest as sustainable tools for improving crop growth and resilience [17,18]. SWEs are commonly produced from several brown and red seaweed species, including Ascophyllum nodosum, Sargassum spp., Ecklonia maxima, and Kappaphycus alvarezii, providing a diverse range of commercial biostimulant products for horticultural applications [17,19]. The reported benefits of SWEs, including improvements in chlorophyll (CHL) content, nutrient uptake, root development, biomass accumulation, and stress tolerance in diverse horticultural crops, including Capsicum, have contributed to their increasing adoption as sustainable biostimulants in horticultural production [20,21]. Consequently, SWEs have been increasingly adopted in sustainable horticultural production.
Despite the growing adoption of seaweed biostimulants in horticulture, our previous work highlighted important knowledge gaps regarding formulation-specific performance and optimum dosage, particularly because commercial formulations differ in their reported composition and recommended application rates [22]. Consistent with this observation, most previous studies have evaluated individual commercial products, one or two dosage levels, or a limited number of growth variables, thereby limiting direct comparisons among the evaluated formulations [23,24]. Because commercial SWE formulations differ in their reported composition and production characteristics, their agronomic performance and optimum application rates are unlikely to be identical across all products [22,25]. Furthermore, integrated assessments combining morphology, biomass, biomass allocation, and multivariate analyses remain uncommon in greenhouse-grown C. annuum seedlings [21,26]. Therefore, formulation-specific optimum dosages remain poorly understood, providing a strong rationale for evaluating each commercial SWE formulation.
To our knowledge, few studies have systematically compared multiple commercial SWE formulations across a broad dosage range under identical greenhouse conditions while integrating morphological traits, biomass accumulation, growth indices, principal component analysis (PCA), Pearson correlation analysis, and the Technique for Order Preference by Similarity to Ideal Solution (TOPSIS) to identify formulation-specific optimum dosages in C. annuum seedlings. This integrated approach provides a comprehensive evaluation of formulation-specific performance and supports evidence-based dosage optimization of commercial seaweed biostimulants.
We hypothesized that commercial SWE formulations would improve early seedling growth, but that the optimum dosage would differ among formulations because of differences in their manufacturer-reported composition and formulation characteristics. Accordingly, the objectives of this study were to (i) evaluate the dosage-dependent responses of five commercial SWE formulations under greenhouse conditions; (ii) assess their effects on seedling morphology, biomass accumulation, and growth efficiency indices; (iii) investigate the relationships among the measured growth traits using PCA and Pearson correlation analysis; and (iv) identify formulation-specific optimum dosages using the TOPSIS.
2. Materials and Methods
2.1. Commercial Seaweed Extracts
Five commercially available SWE formulations, representing widely used liquid biostimulants in the Indian agricultural sector, were evaluated. The products included Asco-Zyme (ASCO; Hifield Organics Pvt. Ltd., Chhatrapati Sambhajinagar, India), Aquamarine (AQUA; ICL Group, Pune, India), Biovita (BIO; PI Industries Ltd., Gurugram, India), Katyayani Seaweed Extract (KAT; Katyayani Organics, Bhopal, India), and Sagarika (SAGA; Indian Farmers Fertiliser Cooperative Limited, New Delhi, India). These products differ in their reported seaweed sources, nutrient compositions, and recommended application rates.
The physicochemical characteristics, declared nutrient composition, manufacturer-reported bioactive constituents, and manufacturer-recommended application guidelines for each commercial SWE formulation were compiled from the respective product labels, technical bulletins, and manufacturers’ documentation. Complete product labels, batch information, manufacturer-reported product specifications, and supporting technical documentation for SAGA, AQUA, BIO, KAT, and ASCO are shown in Supplementary Figures S1–S5. The manufacturer-reported compositional information was included solely to describe the evaluated formulations and was not independently verified by chemical analyses.
To determine the formulation-specific dosage responses, each commercial SWE formulation was evaluated at five dosage levels (1, 2, 3, 4, and 5 mL L−1). This range encompassed the manufacturer-recommended dosage for all evaluated products while extending beyond the recommended limits where appropriate, thereby enabling the characterization of dose–response relationships and identification of the optimum dosage for each commercial SWE formulation. The selected dosage range encompassed the manufacturer-recommended application rate for each product, while also including lower and/or higher dosages, enabling direct comparisons among formulations and the identification of formulation-specific optimum application rates under uniform experimental conditions.
2.2. Plant Material and Greenhouse Experimental Design
Certified seeds of C. annuum L. cv. CO 1 were obtained from the Seed Distribution Center, Department of Horticulture and Plantation Crops, Government of Tamil Nadu, India. Before sowing, the seeds were surface-sterilized with 1% (v/v) sodium hypochlorite for 3 min and subsequently rinsed three times with sterile distilled water. Seedlings were initially germinated under nursery conditions, and healthy, uniformly developed seedlings were selected for transplantation into vermiculite-filled container.
The experiment was conducted under greenhouse conditions using a completely randomized design (CRD). Individual seedlings grown in separate containers were considered as independent experimental units. A total of 27 treatments were evaluated, comprising a negative control supplied with distilled water (CON), a positive control supplied with a full-strength Hoagland nutrient solution (HG), and five evaluated formulations (ASCO, AQUA, BIO, KAT, and SAGA), each at five dosage levels (1, 2, 3, 4, and 5 mL L−1). Each treatment consisted of five independent experimental units (n = 5), resulting in a total of 135 units. Following treatment application, all seedlings were irrigated with distilled water as required to maintain adequate moisture in the vermiculite, and no additional SWE or nutrient solution was applied during the experimental period.
The seedlings were transplanted into containers filled with horticultural-grade vermiculite and maintained under greenhouse conditions for 15 days after transplantation (DAT). During the experimental period, greenhouse air temperature ranged from 25 to 30 °C, relative humidity ranged from 60 to 80%, and seedlings were grown under cool-white LED lighting (100 ± 10 µmol photons m−2 s−1). All experimental units were randomly arranged within the greenhouse, and their positions were periodically rearranged throughout the experimental period to minimize the potential positional effects associated with light interception and microenvironmental variation.
2.3. Preparation and Application of Commercial Seaweed Extract Treatments
Fresh working solutions of each commercial SWE formulation were prepared immediately before application by diluting the respective commercial products with distilled water to the designated dosage levels (1, 2, 3, 4, and 5 mL L−1). All treatment solutions were prepared separately using distilled water immediately before application to ensure the consistency.
The positive control received full-strength HG prepared according to the standard Hoagland formulation. The nutrient solution contained the essential macronutrients potassium nitrate (KNO3), calcium nitrate [Ca(NO3)2·4H2O], magnesium sulfate (MgSO4·7H2O), and monopotassium phosphate (KH2PO4), along with a complete micronutrient mixture supplemented with Fe-EDTA as an iron source. Macronutrients were prepared separately to prevent precipitation, diluted with deionized water to the required working concentration, and adjusted to a pH of 5.8–6.2 before application. The CON received an equal volume of distilled water throughout the experiment.
Treatments were applied once on the 1 DAT by carefully dispensing 20 mL of the respective treatment solution directly onto the vermiculite near the root zone of each seedling to facilitate root uptake, while minimizing disturbance to the growth medium. A single application was selected to evaluate the immediate dosage-dependent effects of the evaluated formulations during early seedling establishment, while avoiding cumulative responses associated with repeated applications. The same application volume (20 mL per experimental unit) was used for all treatments, including commercial SWE formulations, HG, and CON, to ensure a consistent treatment application across all experimental units.
2.4. Growth Measurements
Morphological growth measurements were performed at 15 DAT, immediately before the biomass determination. CHL was estimated non-destructively using an SPAD-502 Plus chlorophyll meter (Konica Minolta, Inc., Tokyo, Japan). To minimize measurement variability, SPAD readings were recorded from the first fully expanded true leaf of each seedling and expressed in SPAD units.
Following CHL measurements, the seedlings were carefully removed from the vermiculite, and the root systems were gently washed with distilled water to remove adhering substrate particles without damaging the roots. Shoot length (SL) was measured from the root–shoot junction (collar) to the shoot apex, and root length (RL) was measured from the collar to the root-tip. Leaf length (LL) and leaf width (LW) were measured on the first fully expanded true leaf using a digital vernier caliper, and the total number of fully expanded leaves (TL) was determined by direct counting [27].
Each seedling represented an independent experimental unit, and all morphological measurements were recorded individually, using a standardized measurement protocol. All measurements were performed by the same evaluator throughout the experiment to ensure consistency in the data collection.
2.5. Biomass Measurements
Following morphological assessments, the seedlings were gently blotted dry using absorbent paper to remove excess surface moisture before determining biomass. Shoots and roots were separated at the root–shoot junction using a stainless-steel scalpel. Shoot fresh weight (SFW) and root fresh weight (RFW) were determined immediately after separation using an analytical balance with a readability of 0.0001 g (0.1 mg).
Following fresh weight determination, shoot and root samples were dried in a forced-air oven at 70 °C for 48 h, cooled to room temperature in a desiccator, and weighed to determine the shoot dry weight (SDW) and root dry weight (RDW) [27]. The total fresh weight (TFW) and total dry weight (TDW) were calculated as the sum of the corresponding shoot and root fresh weights and dry weights, respectively.
2.6. Derived Growth Indices
Several derived growth indices were calculated from the measured morphological and biomass traits to further characterize the biomass accumulation, allocation and growth efficiency of C. annuum seedlings.
TFW and TDW were calculated as follows:
where SFW and RFW represent the shoot and root fresh weights, and SDW and RDW represent the shoot and root dry weights, respectively.
The shoot-to-root ratio (SR) [28], moisture content (MC), and dry matter (DM) were calculated as follows:
where MC and DM are expressed on a fresh-mass basis (%) using the total fresh weight (TFW) as the reference.
The leaf elongation index (LEI), biomass productivity (BP), biomass per shoot length (BSL), and specific root length (SRL) [29] were calculated as follows:
where LL and LW represent leaf length and leaf width (cm), SL and RL represent shoot and root length (cm), TDW is expressed in g plant−1, BP is expressed as mg plant−1 day−1, BSL as mg cm−1, and SRL as cm g−1 dry weight. BP was calculated as the average daily dry biomass accumulation over a 15-day experimental period. BSL was calculated as a derived index representing the dry biomass accumulated per unit of SL. LEI was calculated as the ratio of LL to LW to describe leaf shape.
2.7. Statistical Analysis
All statistical analyses were performed using Python (version 3.14.6) in the Jupyter Notebook environment. Data processing and statistical analyses were conducted using the Pandas, NumPy, SciPy, Statsmodels, Scikit-learn, Matplotlib, and Seaborn libraries. Individual seedlings were considered independent experimental units. All statistical analyses were performed using measurements from five independent biological replicates for each of the treatments. The descriptive statistics for all the measured variables are provided in Supplementary Data S1.
Prior to statistical analysis, the data were evaluated for compliance with the assumptions required for parametric analyses. The normality of the residuals was assessed using the Shapiro–Wilk test, and the homogeneity of the variances among the treatments was evaluated using Levene’s test. Residual diagnostic plots were examined to verify the model assumptions. The results of the assumption tests are presented in Supplementary Table S1, and representative diagnostic plots are shown in Supplementary Figure S6.
The treatment effects on all measured and calculated variables were evaluated using one-way analysis of variance (ANOVA). When significant treatment effects were detected (p < 0.05), mean separation was performed using Tukey’s honestly significant difference (HSD) test at the 5% significance level. The complete ANOVA outputs and Tukey HSD pairwise comparisons are provided in Supplementary Tables S2 and S3, respectively, and a summary of the ANOVA results, including η2 (eta squared) effect sizes, is presented in Table 1. Results are reported as mean ± standard error (SE). The response index values calculated for all treatments are listed in Supplementary Data S2.
Table 1.
Summary of one-way analysis of variance (ANOVA) for the effects of five SWE formulations applied at different dosages (1, 2, 3, 4, and 5 mL L−1) on the measured growth traits of C. annuum grown under greenhouse conditions for 15 DAT. F-values, degrees of freedom (df), p-values, and effect sizes (η2) are presented for each trait. Statistical significance was set at p < 0.05.
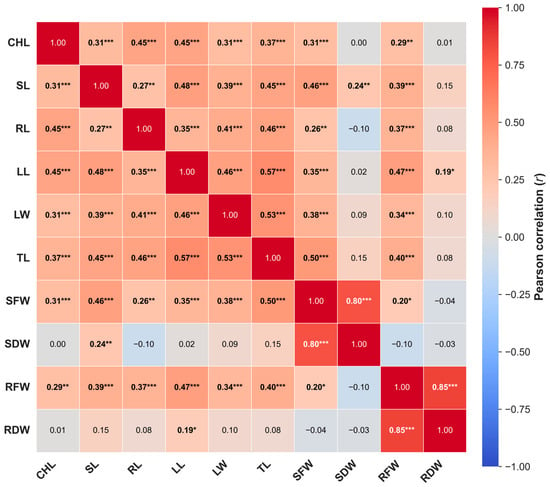
Pearson’s correlation analysis was performed to evaluate the relationships among plant growth traits using only the directly measured variables (CHL, SL, RL, LL, LW, TL, SFW, RFW, SDW, and RDW). Variables derived mathematically from these measurements were excluded from the correlation analysis to avoid redundancy due to shared components. To account for multiple tests, the Benjamini–Hochberg false discovery rate (FDR) correction was applied, and adjusted significance levels were used for interpretation. The complete correlation coefficients and adjusted significance values are provided in Supplementary Data S3.
PCA was conducted using the same set of directly measured variables after standardization using z-score transformation. PCA was used as an exploratory multivariate technique to summarize the relationships among treatments and variables and was not intended to be an inferential statistical test. Variables derived from mathematical combinations of the measured traits were excluded to prevent the artificial inflation of correlations and component loadings. The complete PCA outputs, including the explained variance, variable loadings, and treatment scores, are provided in Supplementary Data S4A–C.
To provide an integrated assessment of treatment performance, TOPSIS was applied using the ten plant-growth traits. All variables were treated as beneficial criteria and assigned equal weights (0.10). Equal weighting was selected because all measured traits were considered equally important indicators of early seedling quality, and no prior biological evidence justified the differential weighting. TOPSIS scores were used to rank the treatments and identify the optimum dosage for each commercial SWE formulation tested. The complete TOPSIS calculations are provided in Supplementary Data S5.
3. Results
3.1. Commercial SWEs Promoted Seedling Growth in a Formulation-Specific, Dosage-Dependent Manner
Commercial SWE treatments significantly influenced all measured morphological traits, including CHL, SL, RL, LL, LW, and total leaf number (TL) (Table 1). The largest treatment effects were observed for CHL (η2 = 0.614), TL (η2 = 0.495), and RL (η2 = 0.490), indicating that SWE application accounted for a substantial proportion of the variation in early seedling growth.
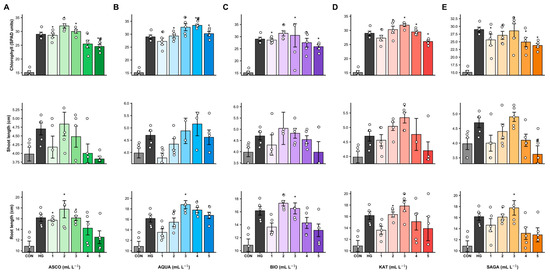
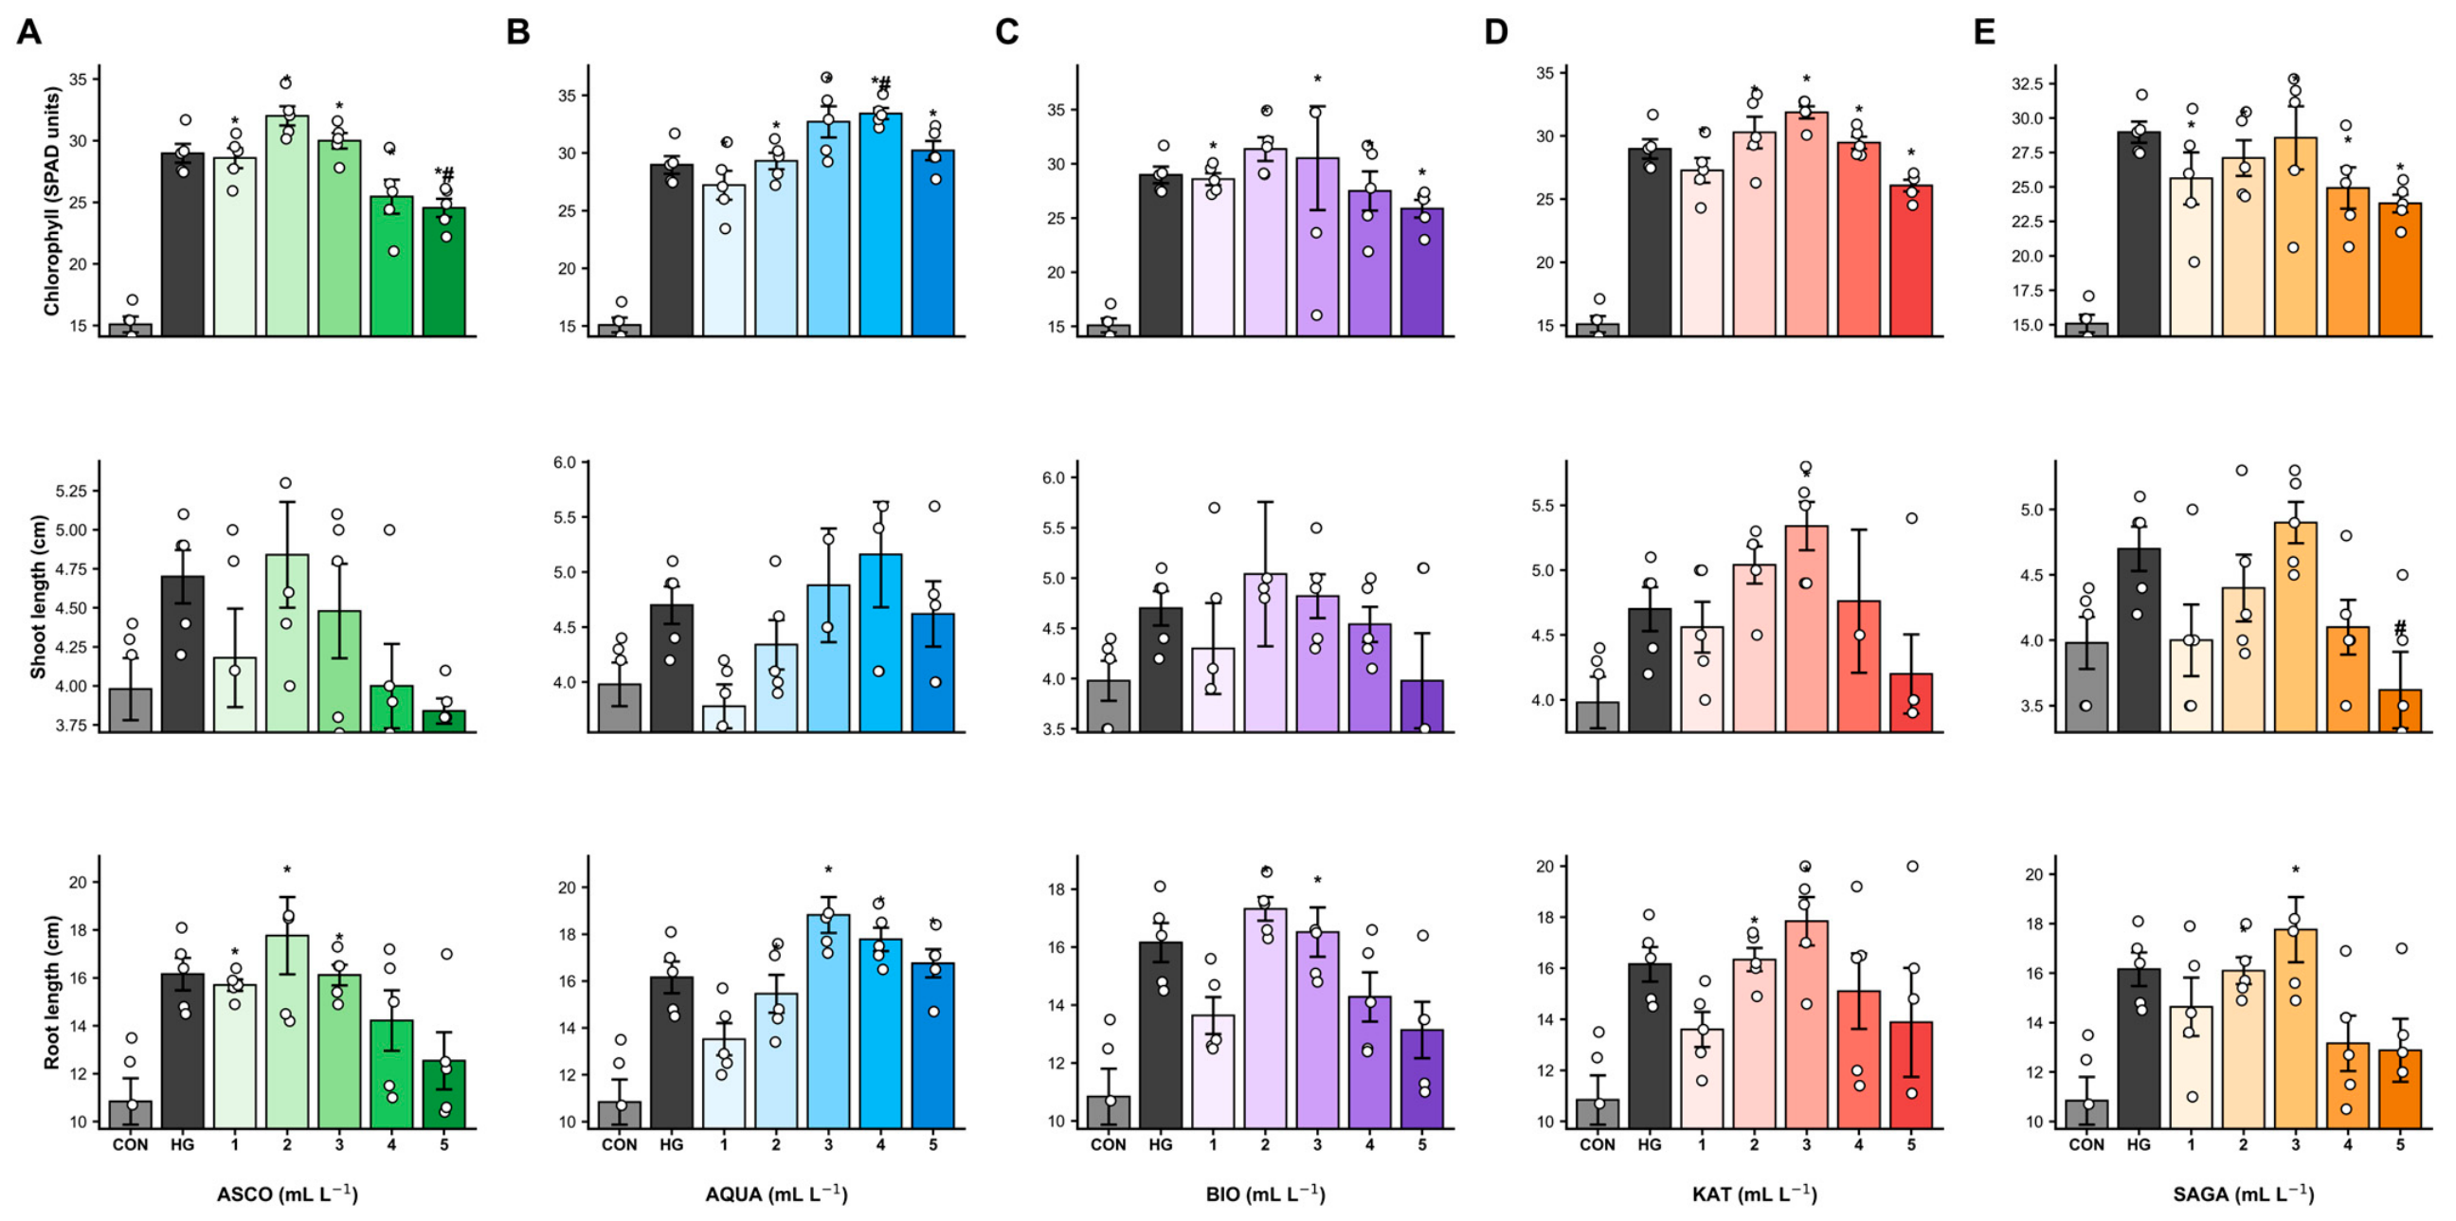
CHL responded significantly to SWE application, although the magnitude of the response differed between formulations (Figure 1). ASCO produced the highest CHL at 2 mL L−1, whereas AQUA, BIO, KAT, and SAGA reached their maximum values at 3 mL L−1. CHL generally declined at 4–5 mL L−1, indicating that dosages above the optimum concentration provided no further improvement. Several intermediate SWE treatments produced chlorophyll values that were statistically comparable to those of the HG, indicating that these formulation-specific dosages achieved a similar enhancement of leaf greenness under the experimental conditions. In contrast, the CON treatment consistently exhibited the lowest chlorophyll content.
Figure 1.
Effects of five SWE formulations applied at different dosages (1, 2, 3, 4, and 5 mL L−1) on chlorophyll content and seedling growth of C. annuum grown under greenhouse conditions for 15 DAT. CON and HG denote distilled water (negative) and a full-strength Hoagland nutrient solution (positive) control, respectively. The panels represent (A) ASCO, (B) AQUA, (C) BIO, (D) KAT, and (E) SAGA, respectively. The measured parameters included chlorophyll content (CHL; SPAD units), shoot length (SL; cm), and root length (RL; cm). Data are presented as mean ± standard error (SE) (n = 5), with individual replicate values shown as open circles. Asterisks (*) and hash symbols (#) indicate treatments that differed significantly from the negative (CON) and positive (HG) controls, respectively (p < 0.05).
Seedling elongation followed a formulation-specific dose–response pattern (Figure 1). Shoot length increased with SWE dosage until the optimum level was reached, after which the values plateaued or declined. The maximum SL was achieved at 2 mL L−1 for ASCO and BIO, 4 mL L−1 for AQUA, and 3 mL L−1 for KAT and SAGA. Root elongation showed a more consistent response, with high RL observed at 2 mL L−1 for ASCO and BIO and at 3 mL L−1 for AQUA, KAT, and SAGA. Across all formulations, seedlings treated with the highest dosage (5 mL L−1) generally exhibited shorter shoots and roots than those treated with the optimum dosage.
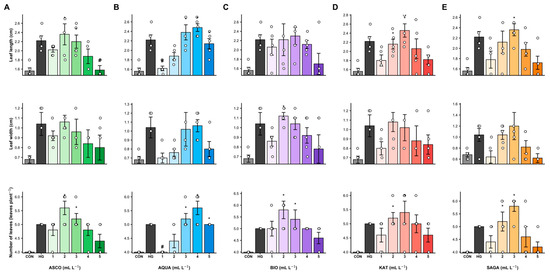
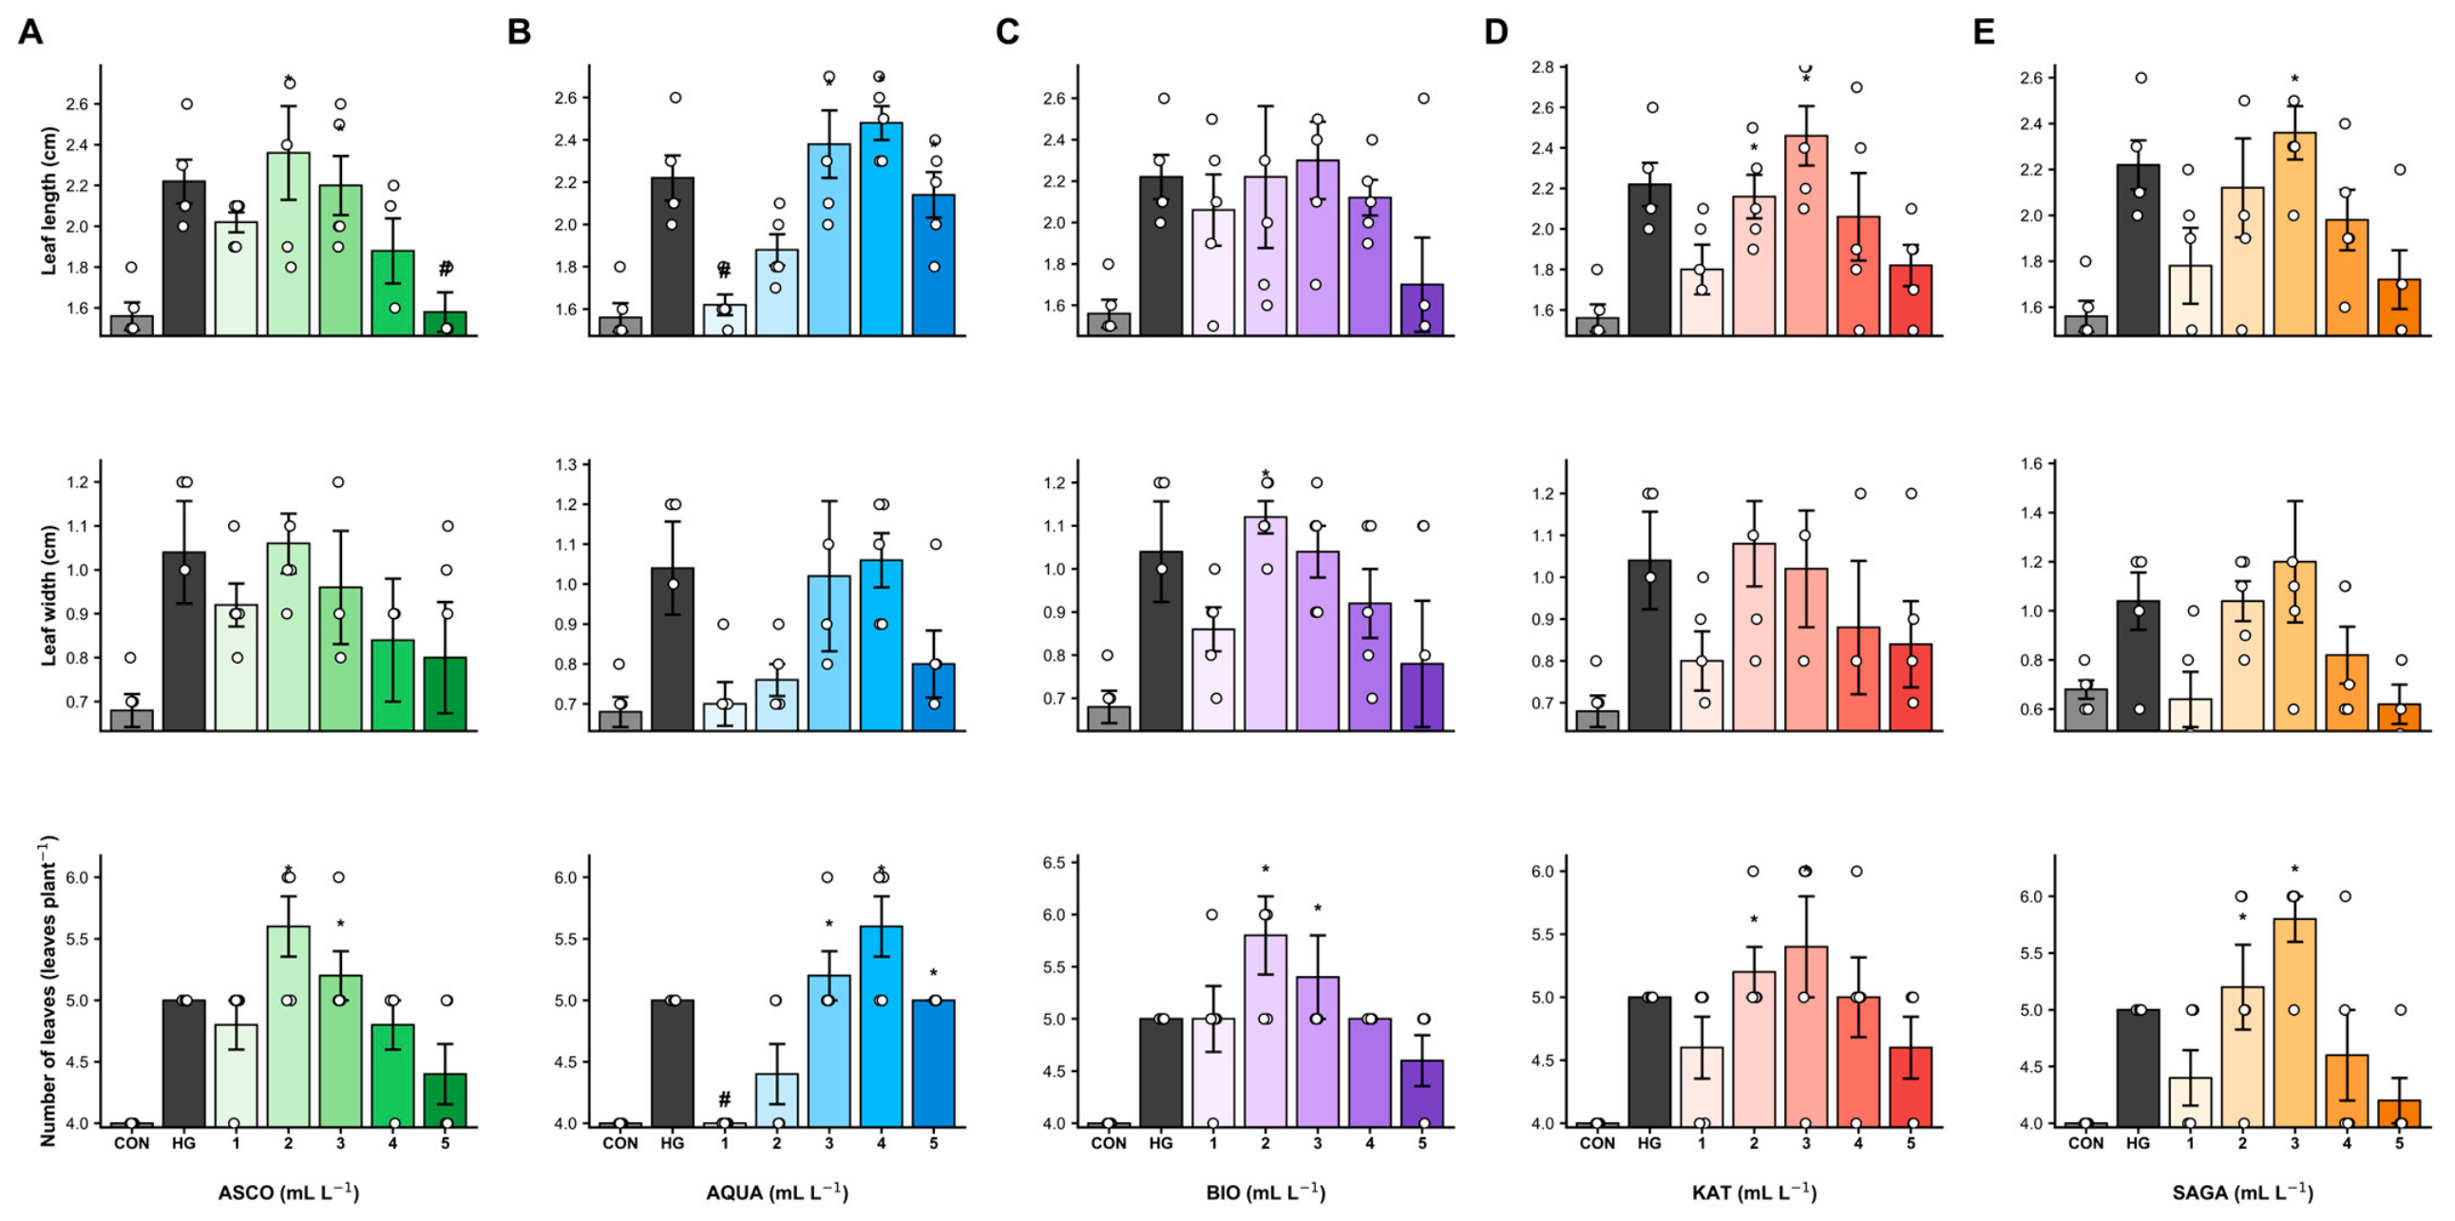
Leaf development was also improved by SWE application (Figure 2). Intermediate dosages generally increased LL, LW, and TL, whereas higher dosages produced little additional improvement or slightly reduced these effects. The highest TL was recorded at 2 mL L−1 for ASCO and BIO, 4 mL L−1 for AQUA, and 3 mL L−1 for KAT and SAGA treatments. Several intermediate SWE treatments produced leaf size and leaf number statistically comparable to those of the HG treatment, suggesting that these dosage levels were equally effective in promoting early leaf development. All SWE treatments consistently outperformed the CON treatment.
Figure 2.
Effects of five SWE formulations applied at different dosages (1, 2, 3, 4, and 5 mL L−1) on the leaf morphological traits of C. annuum grown under greenhouse conditions for 15 DAT. CON and HG denote distilled water (negative) and full-strength Hoagland nutrient solution (positive) controls, respectively. Panels represent (A) ASCO, (B) AQUA, (C) BIO, (D) KAT, and (E) SAGA. The measured parameters included leaf length (LL; cm), leaf width (LW; cm), and total number of leaves (TL; leaves plant−1). Data are presented as mean ± standard error (SE) (n = 5), with individual replicate values shown as open circles. Asterisks (*) and hash symbols (#) indicate treatments that differed significantly from the negative (CON) and positive (HG) controls, respectively (p < 0.05).
Despite the differences among the formulations, a common response pattern was observed. Morphological traits generally improved from the lowest to intermediate dosages and subsequently stabilized or declined at the highest dose. These results demonstrate that increasing the SWE dosage beyond the optimum did not necessarily enhance early seedling growth.
3.2. Intermediate SWE Dosages Enhanced Biomass Accumulation
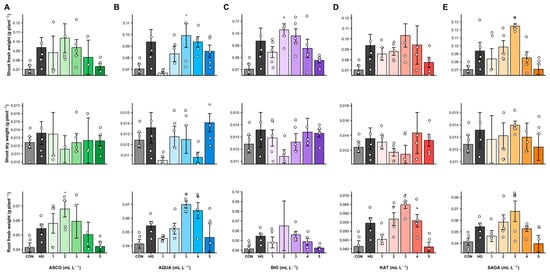
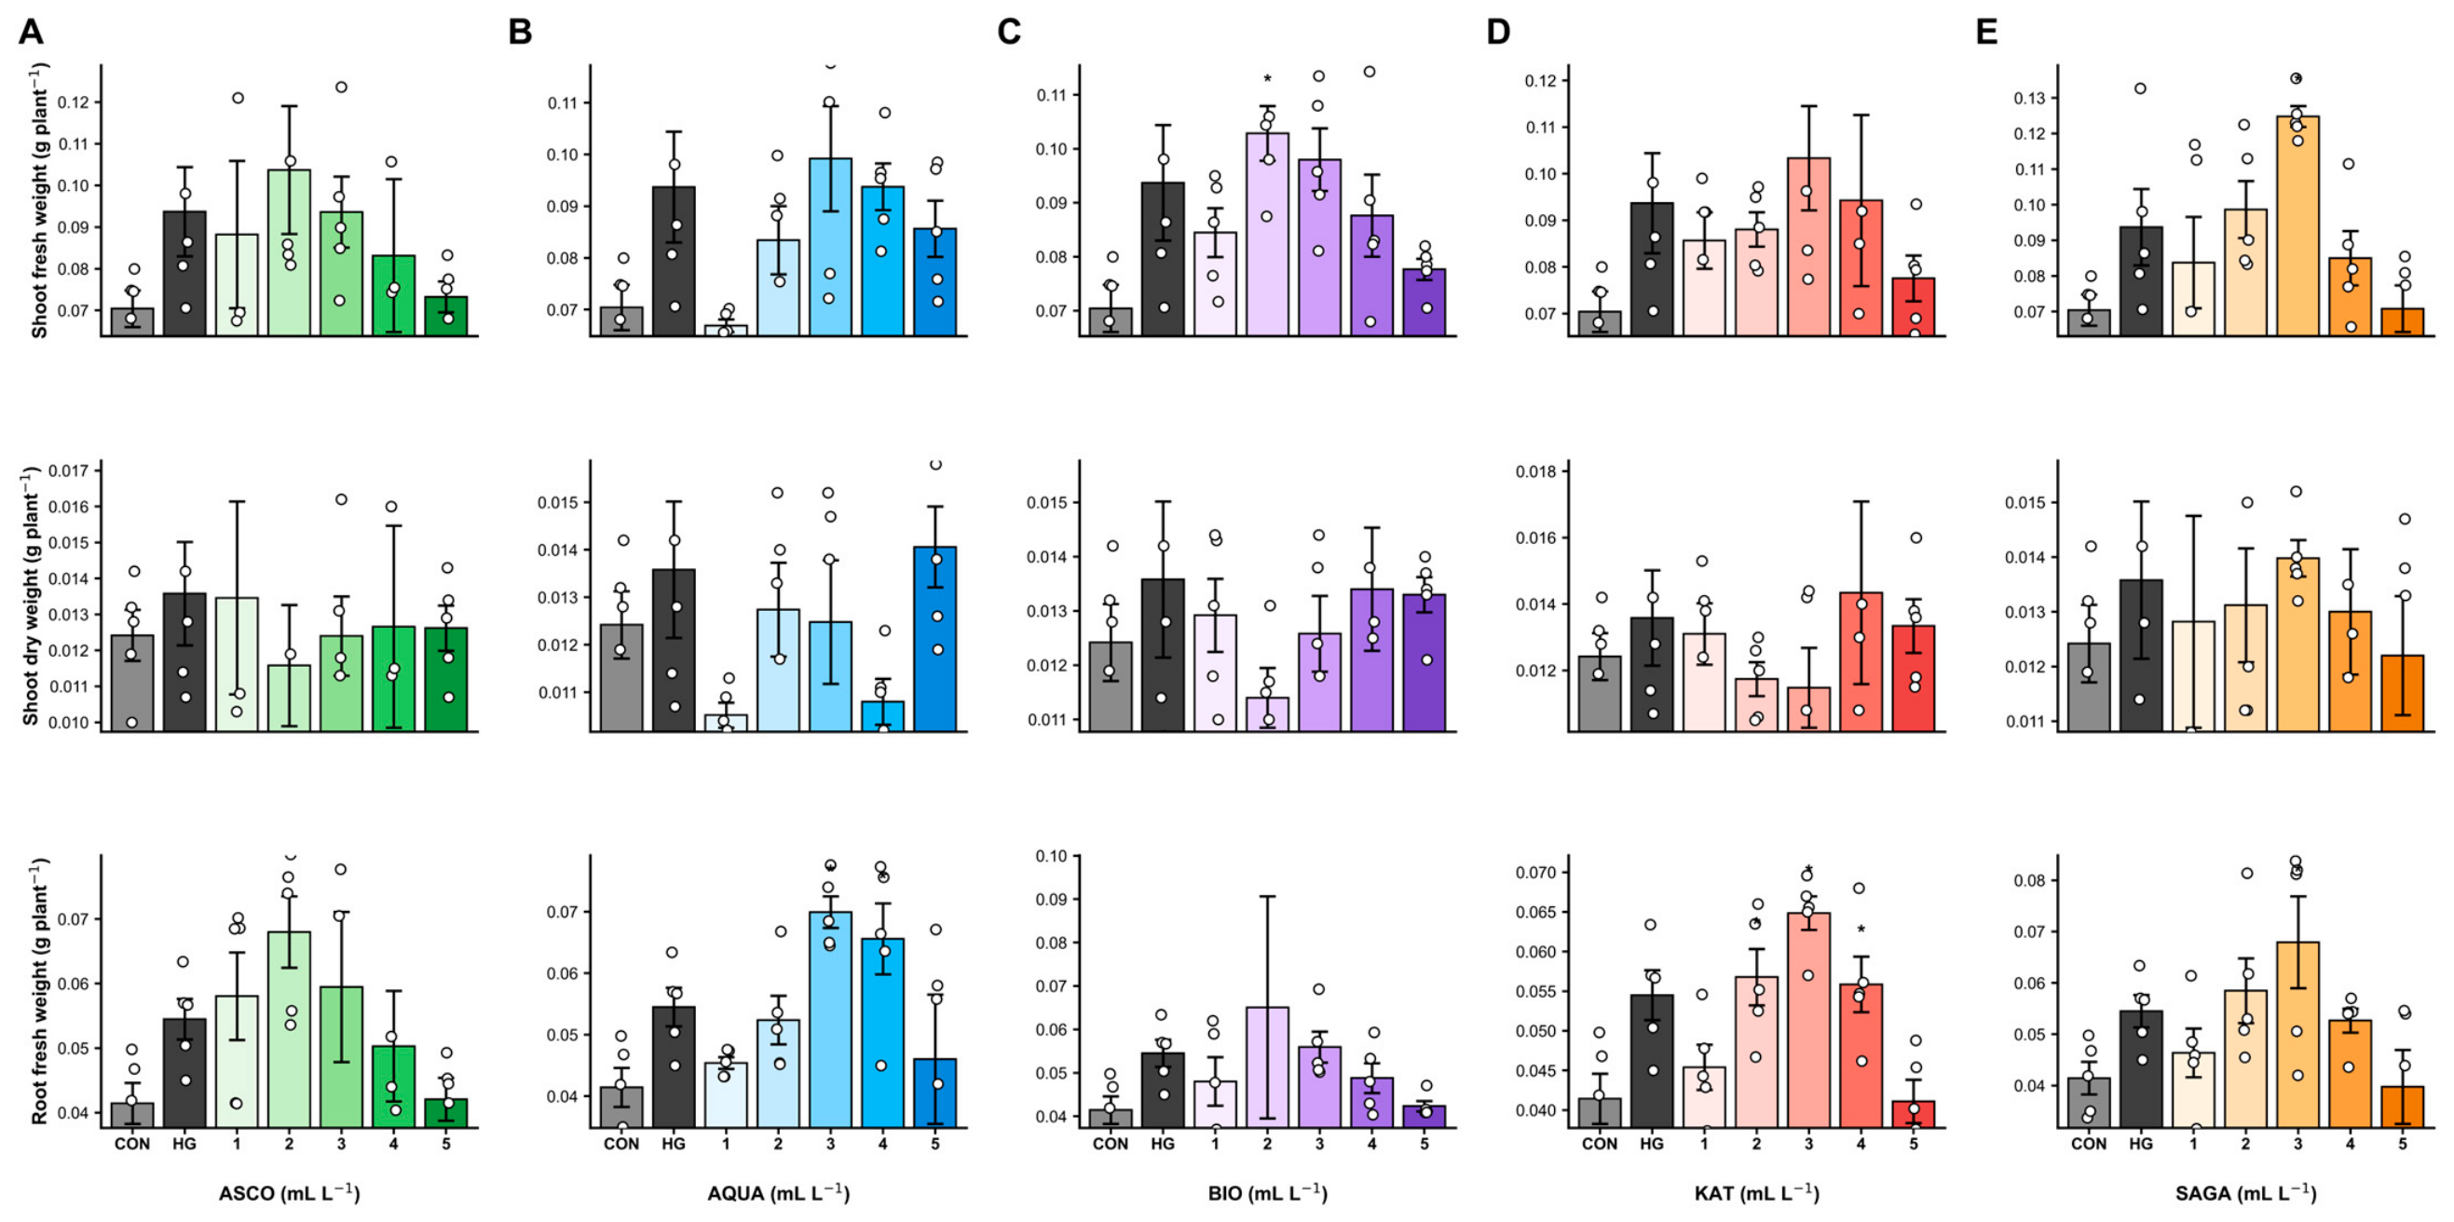
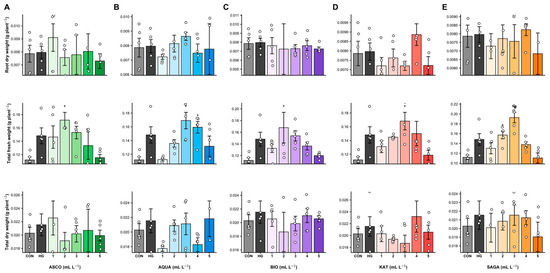
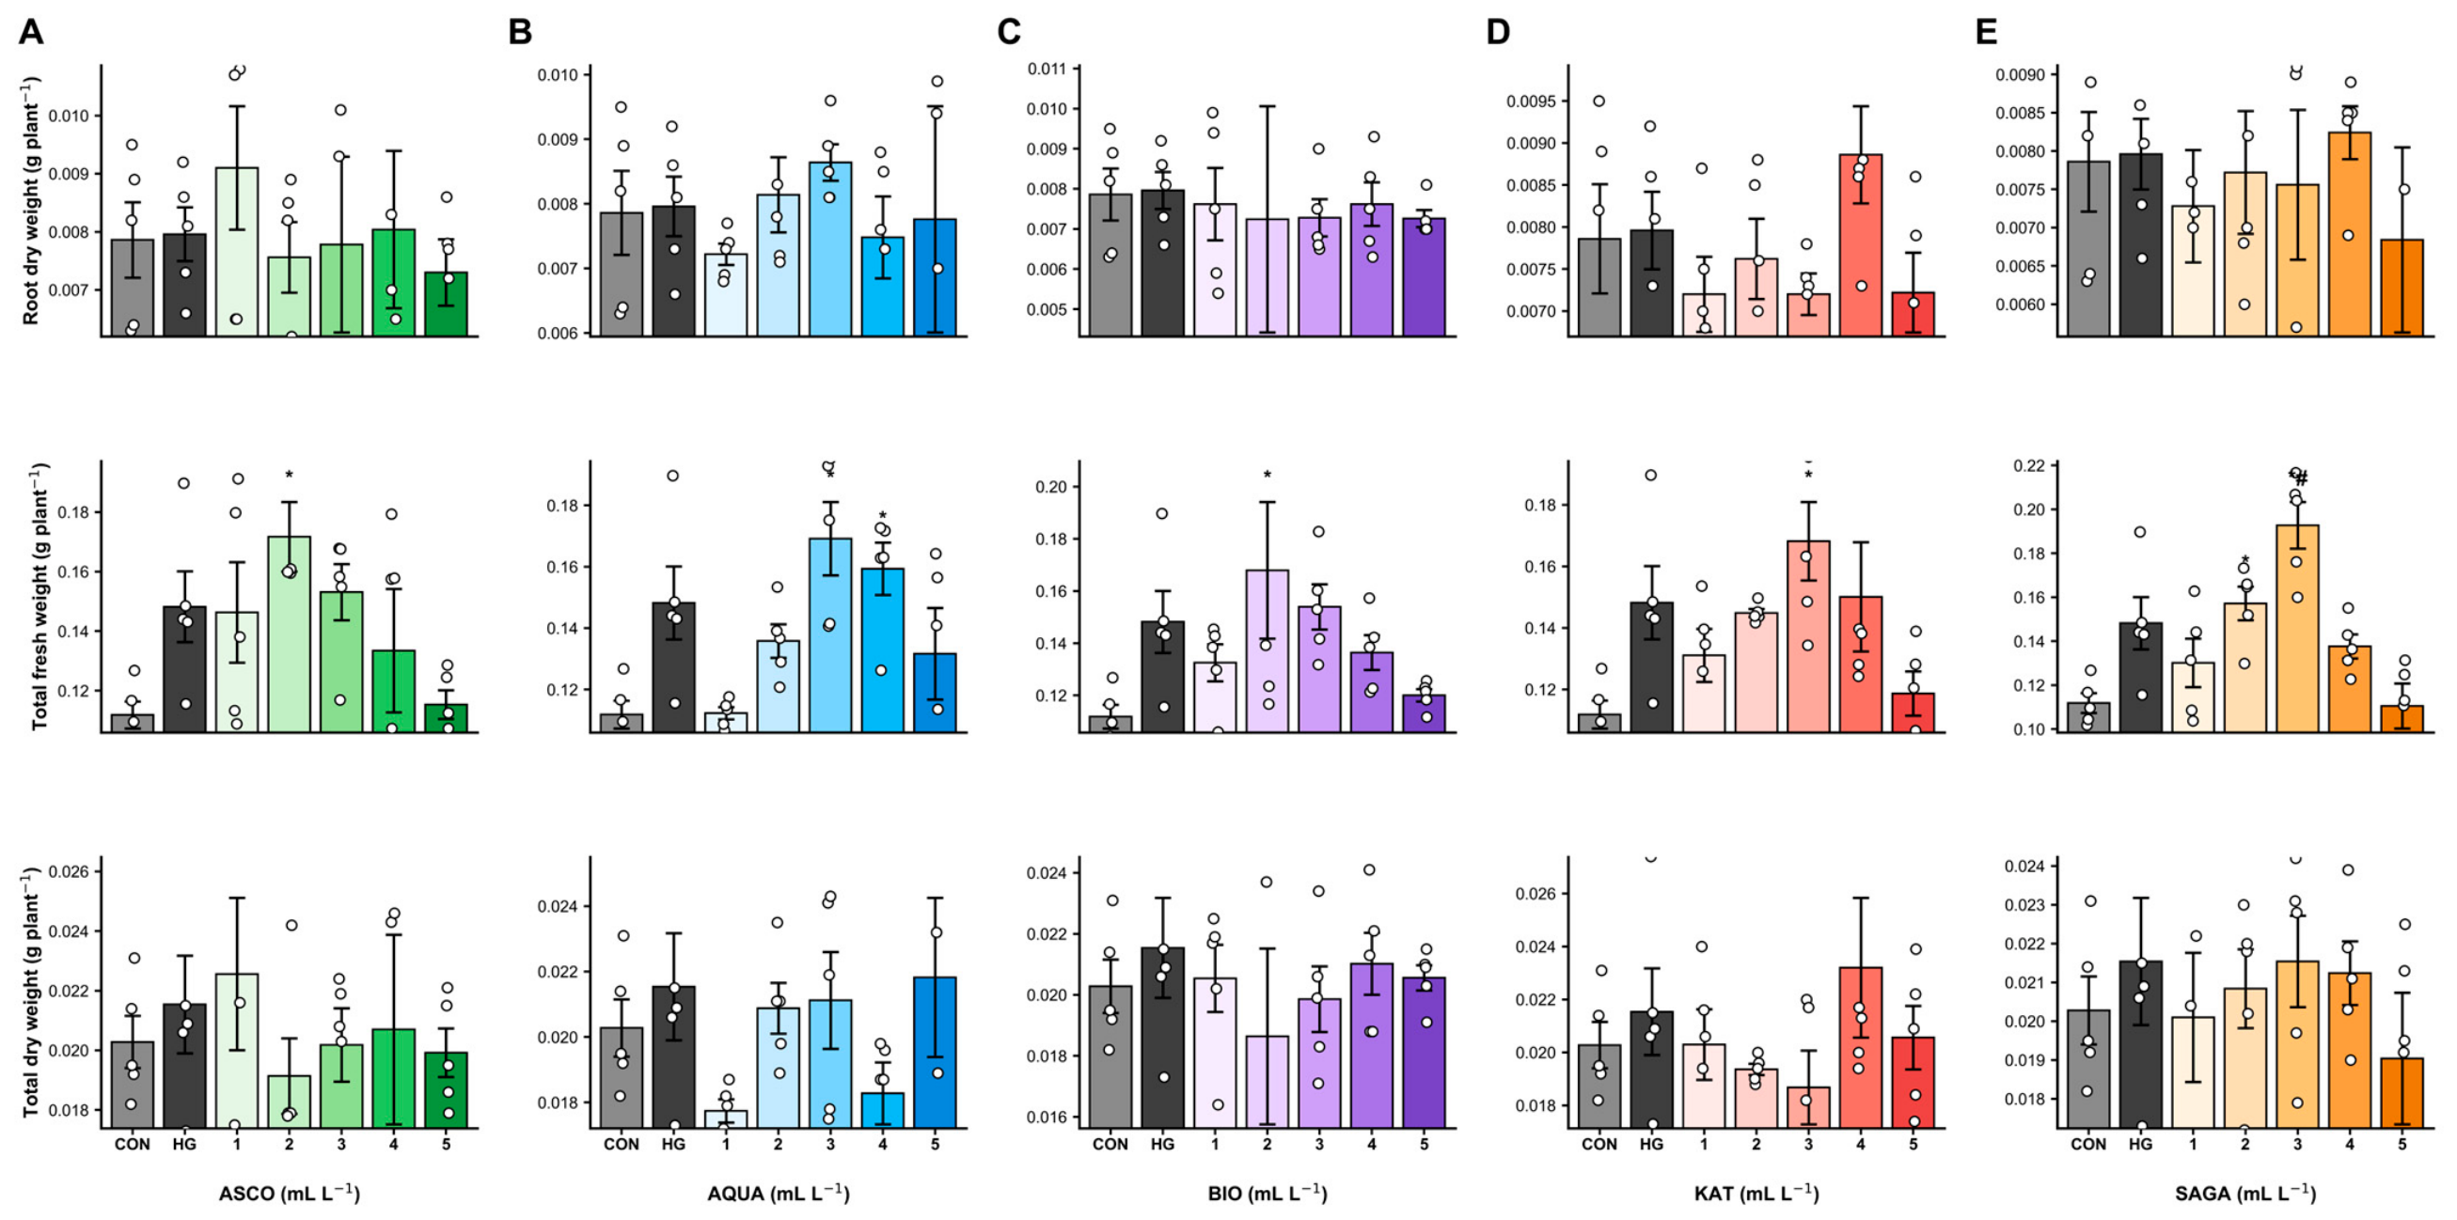
The improvements in seedling morphology following SWE application were accompanied by corresponding changes in biomass accumulation (Figure 3 and Figure 4). Commercial SWE treatments significantly affected SFW, RFW, and TFW, whereas the treatment effects on SDW, RDW, and TDW were comparatively small (Table 1). Fresh biomass was most responsive to SWE, with the treatment explaining 45.4% of the variation in TFW (η2 = 0.454).
Figure 3.
Effects of five SWE formulations applied at different dosages (1, 2, 3, 4, and 5 mL L−1) on biomass accumulation of C. annuum grown under greenhouse conditions for 15 DAT. CON and HG denote distilled water (negative) and full-strength Hoagland nutrient solution (positive) controls, respectively. The panels represent (A) ASCO, (B) AQUA, (C) BIO, (D) KAT, and (E) SAGA. The measured parameters included shoot fresh weight (SFW; g plant−1), shoot dry weight (SDW; g plant−1), and root fresh weight (RFW; g plant−1). Data are presented as mean ± standard error (SE) (n = 5), with individual replicate values shown as open circles. Asterisks (*) indicate treatments that differed significantly from the negative (CON) and positive (HG) controls, respectively (p < 0.05).
Figure 4.
Effects of five SWE formulations applied at different dosages (1, 2, 3, 4, and 5 mL L−1) on root and total biomass accumulation of C. annuum grown under greenhouse conditions for 15 DAT. CON and HG denote the distilled water (negative) and full-strength Hoagland nutrient solution (positive) controls, respectively. Panels represent (A) ASCO, (B) AQUA, (C) BIO, (D) KAT, and (E) SAGA. The measured parameters included root dry weight (RDW; g plant−1), total fresh weight (TFW; g plant−1), and total dry weight (TDW; g plant−1). Data are presented as mean ± standard error (SE) (n = 5), with individual replicate values shown as open circles. Asterisks (*) and hash symbols (#) indicate treatments that differed significantly from the negative (CON) and positive (HG) controls, respectively (p < 0.05).
SFW exhibited a clear dose-dependent response across the evaluated formulations (Figure 3). Intermediate SWE dosages produced higher shoot biomass than the lowest and highest dosage levels. ASCO and BIO reached the maximum SFW at 2 mL L−1, whereas AQUA, KAT, and SAGA achieved the highest SFW at 3 mL L−1. SFW generally declined at 4–5 mL L−1 levels. Several intermediate SWE treatments produced shoot fresh weights that were statistically comparable to those of the HG treatment, whereas all SWE formulations produced greater fresh biomass than the CON treatment. These comparisons indicate that optimum SWE dosages can achieve biomass accumulation comparable to that obtained with a complete nutrient solution.
SDW varied less than SFW among the different treatments (Figure 3). Although numerical differences were observed within individual formulations, treatment effects were limited, and no consistent dose–response pattern was evident across all products, consistent with the non-significant ANOVA results (Table 1). No consistent dosage-dependent pattern was observed for the SDW during the experimental period.
Root biomass responded similarly to the shoot biomass (Figure 3). RFW increased progressively with SWE dosage until the optimum dosage was reached, after which the values decreased. High RFW occurred at 2 mL L−1 for ASCO and BIO and at 3 mL L−1 for AQUA, KAT, and SAGA, consistent with the patterns observed for RL (Section 3.1). In contrast, RDW showed only limited variation among the treatments (Figure 4), consistent with the absence of a significant treatment effect in ANOVA (Table 1).
The combined response of shoot and root biomass was reflected in the TFW (Figure 4). Across all formulations, TFW reached its maximum at intermediate SWE dosages, with ASCO and BIO performing best at 2 mL L−1 and AQUA, KAT, and SAGA performing best at 3 mL L−1. Notably, several intermediate SWE dosages produced total fresh weights statistically comparable to those of the Hoagland control, whereas higher dosages did not provide any additional benefits. TDW showed minor differences among the treatments and remained statistically similar across the different treatment formulations (Table 1).
Biomass accumulation closely paralleled the morphological responses described in Section 3.1. Fresh biomass increased at intermediate SWE dosages, whereas the dry biomass remained relatively stable throughout the experimental period.
3.3. Biomass Allocation and Growth Efficiency Varied Among Formulations
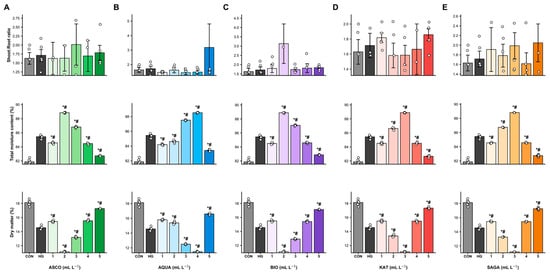
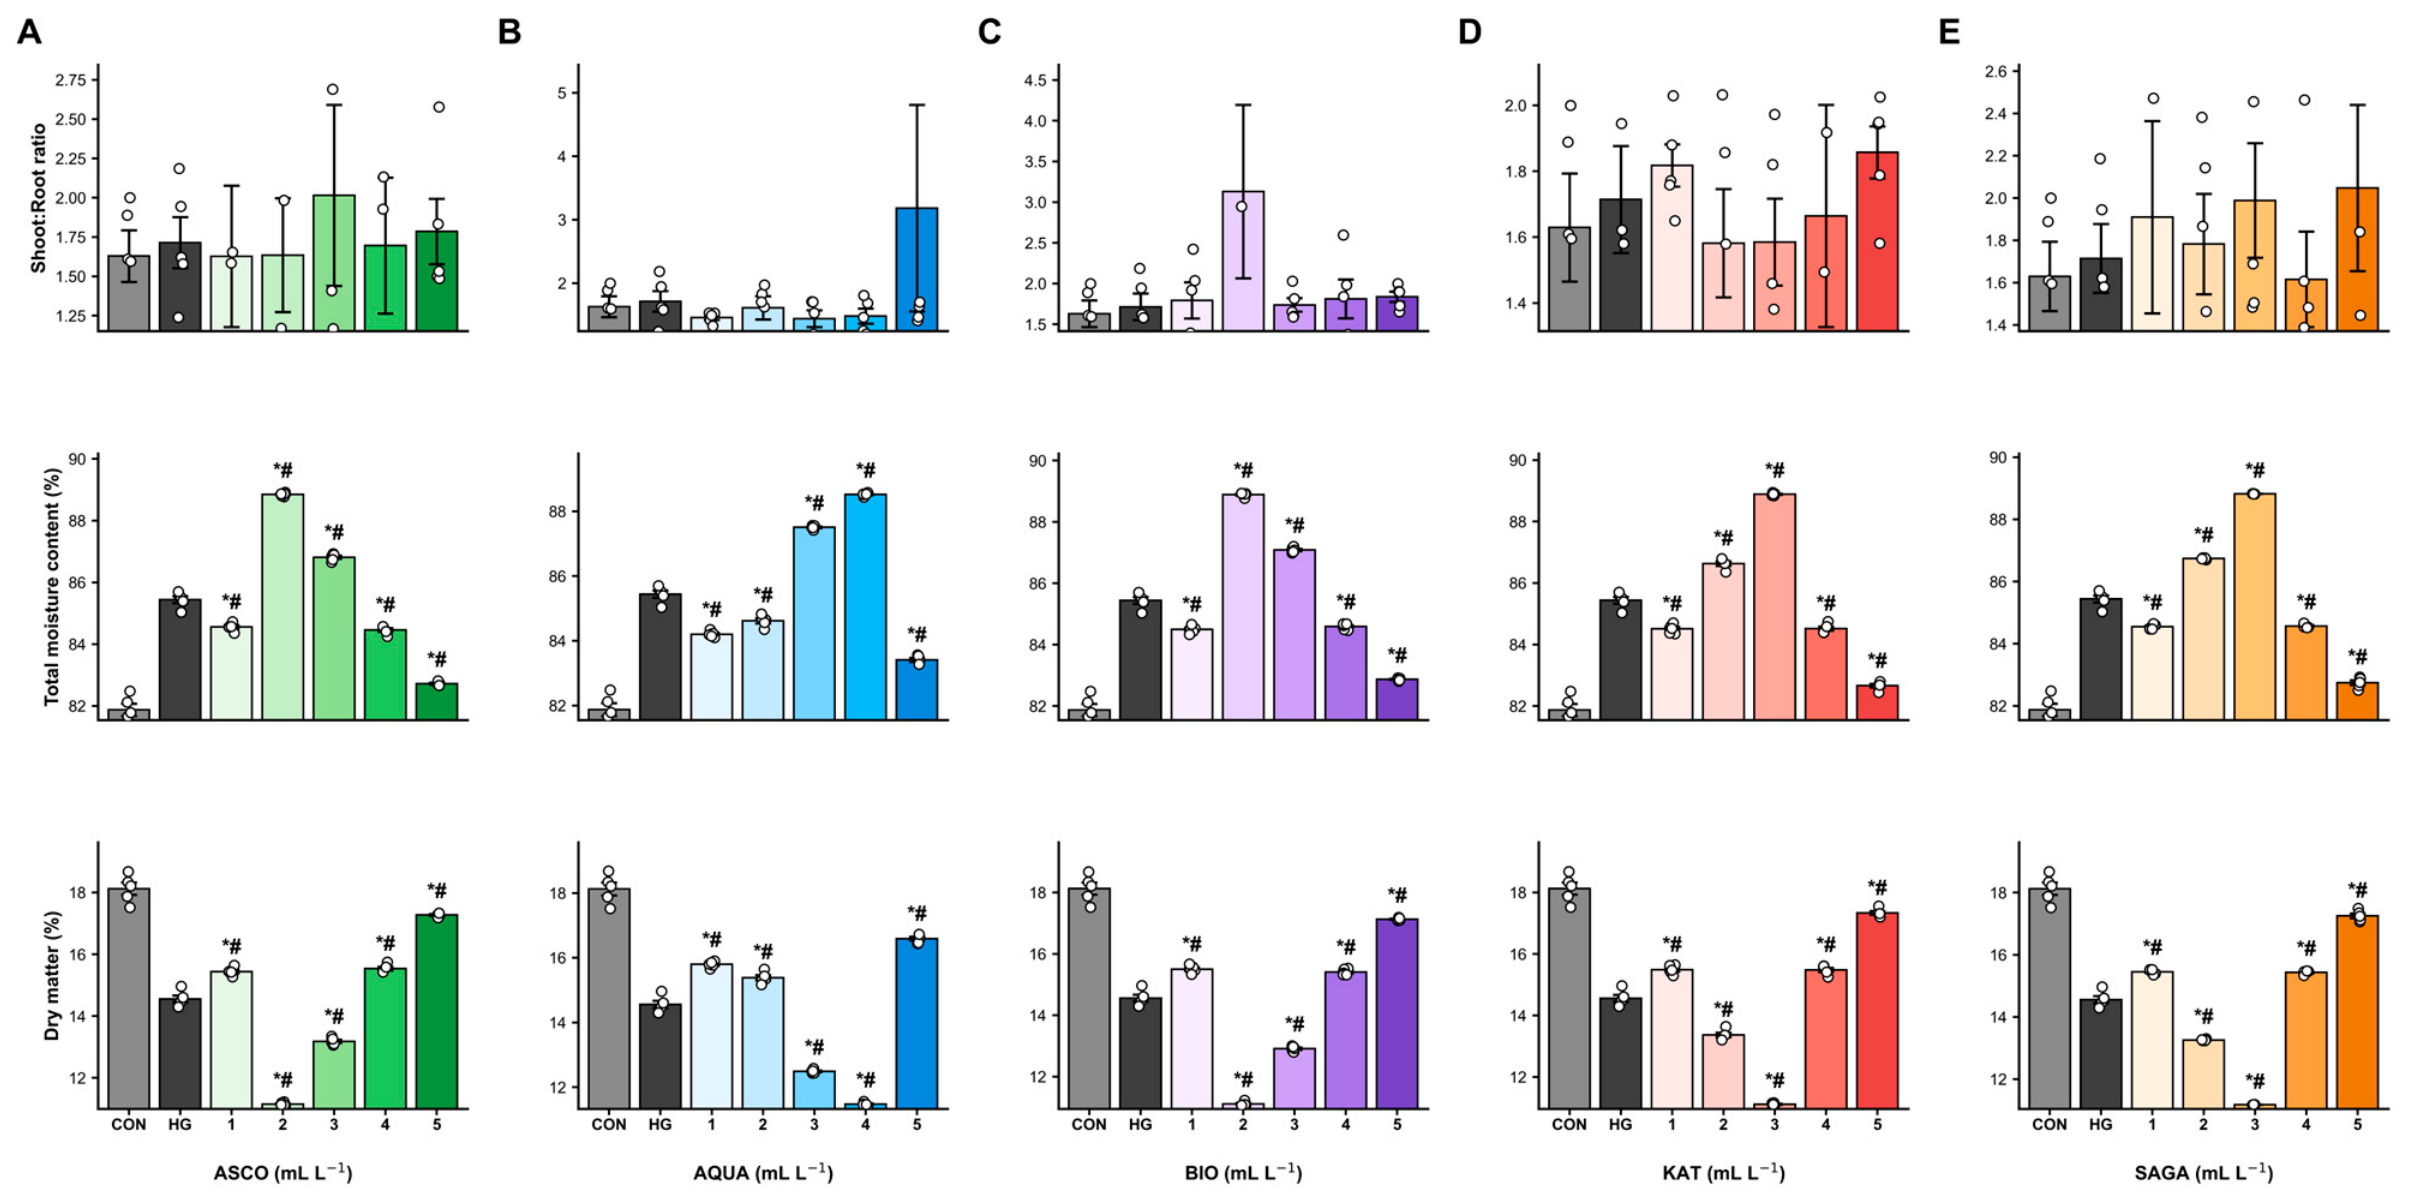
Changes in biomass accumulation were accompanied by corresponding differences in biomass allocation and growth efficiency (Figure 5; Table 1). Among the calculated traits, MC and DM exhibited the strongest treatment effects (η2 = 0.996), whereas SR, LEI, BP, and SRL showed limited variation among the treatments. BSL was the only growth efficiency index that differed significantly among the SWE treatments (Table 1).
Figure 5.
Effects of five SWE formulations applied at different dosages (1, 2, 3, 4, and 5 mL L−1) on the derived growth indices of C. annuum grown under greenhouse conditions for 15 DAT. CON and HG denote distilled water (negative) and full-strength Hoagland nutrient solution (positive) controls, respectively. The panels represent (A) ASCO, (B) AQUA, (C) BIO, (D) KAT, and (E) SAGA. The derived growth indices included the shoot-to-root ratio (SR), total moisture content (MC; %), and dry matter (DM; %). Data are presented as mean ± standard error (SE) (n = 5), with individual replicate values shown as open circles. Asterisks (*) and hash symbols (#) indicate treatments that differed significantly from the negative (CON) and positive (HG) controls, respectively (p < 0.05).
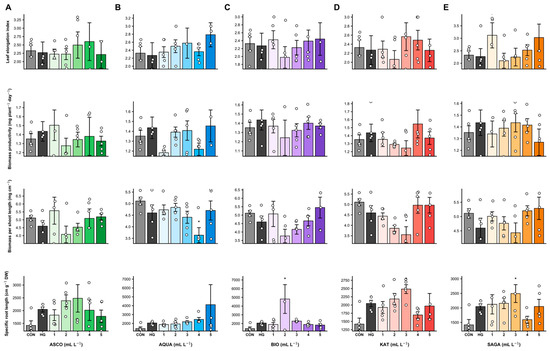
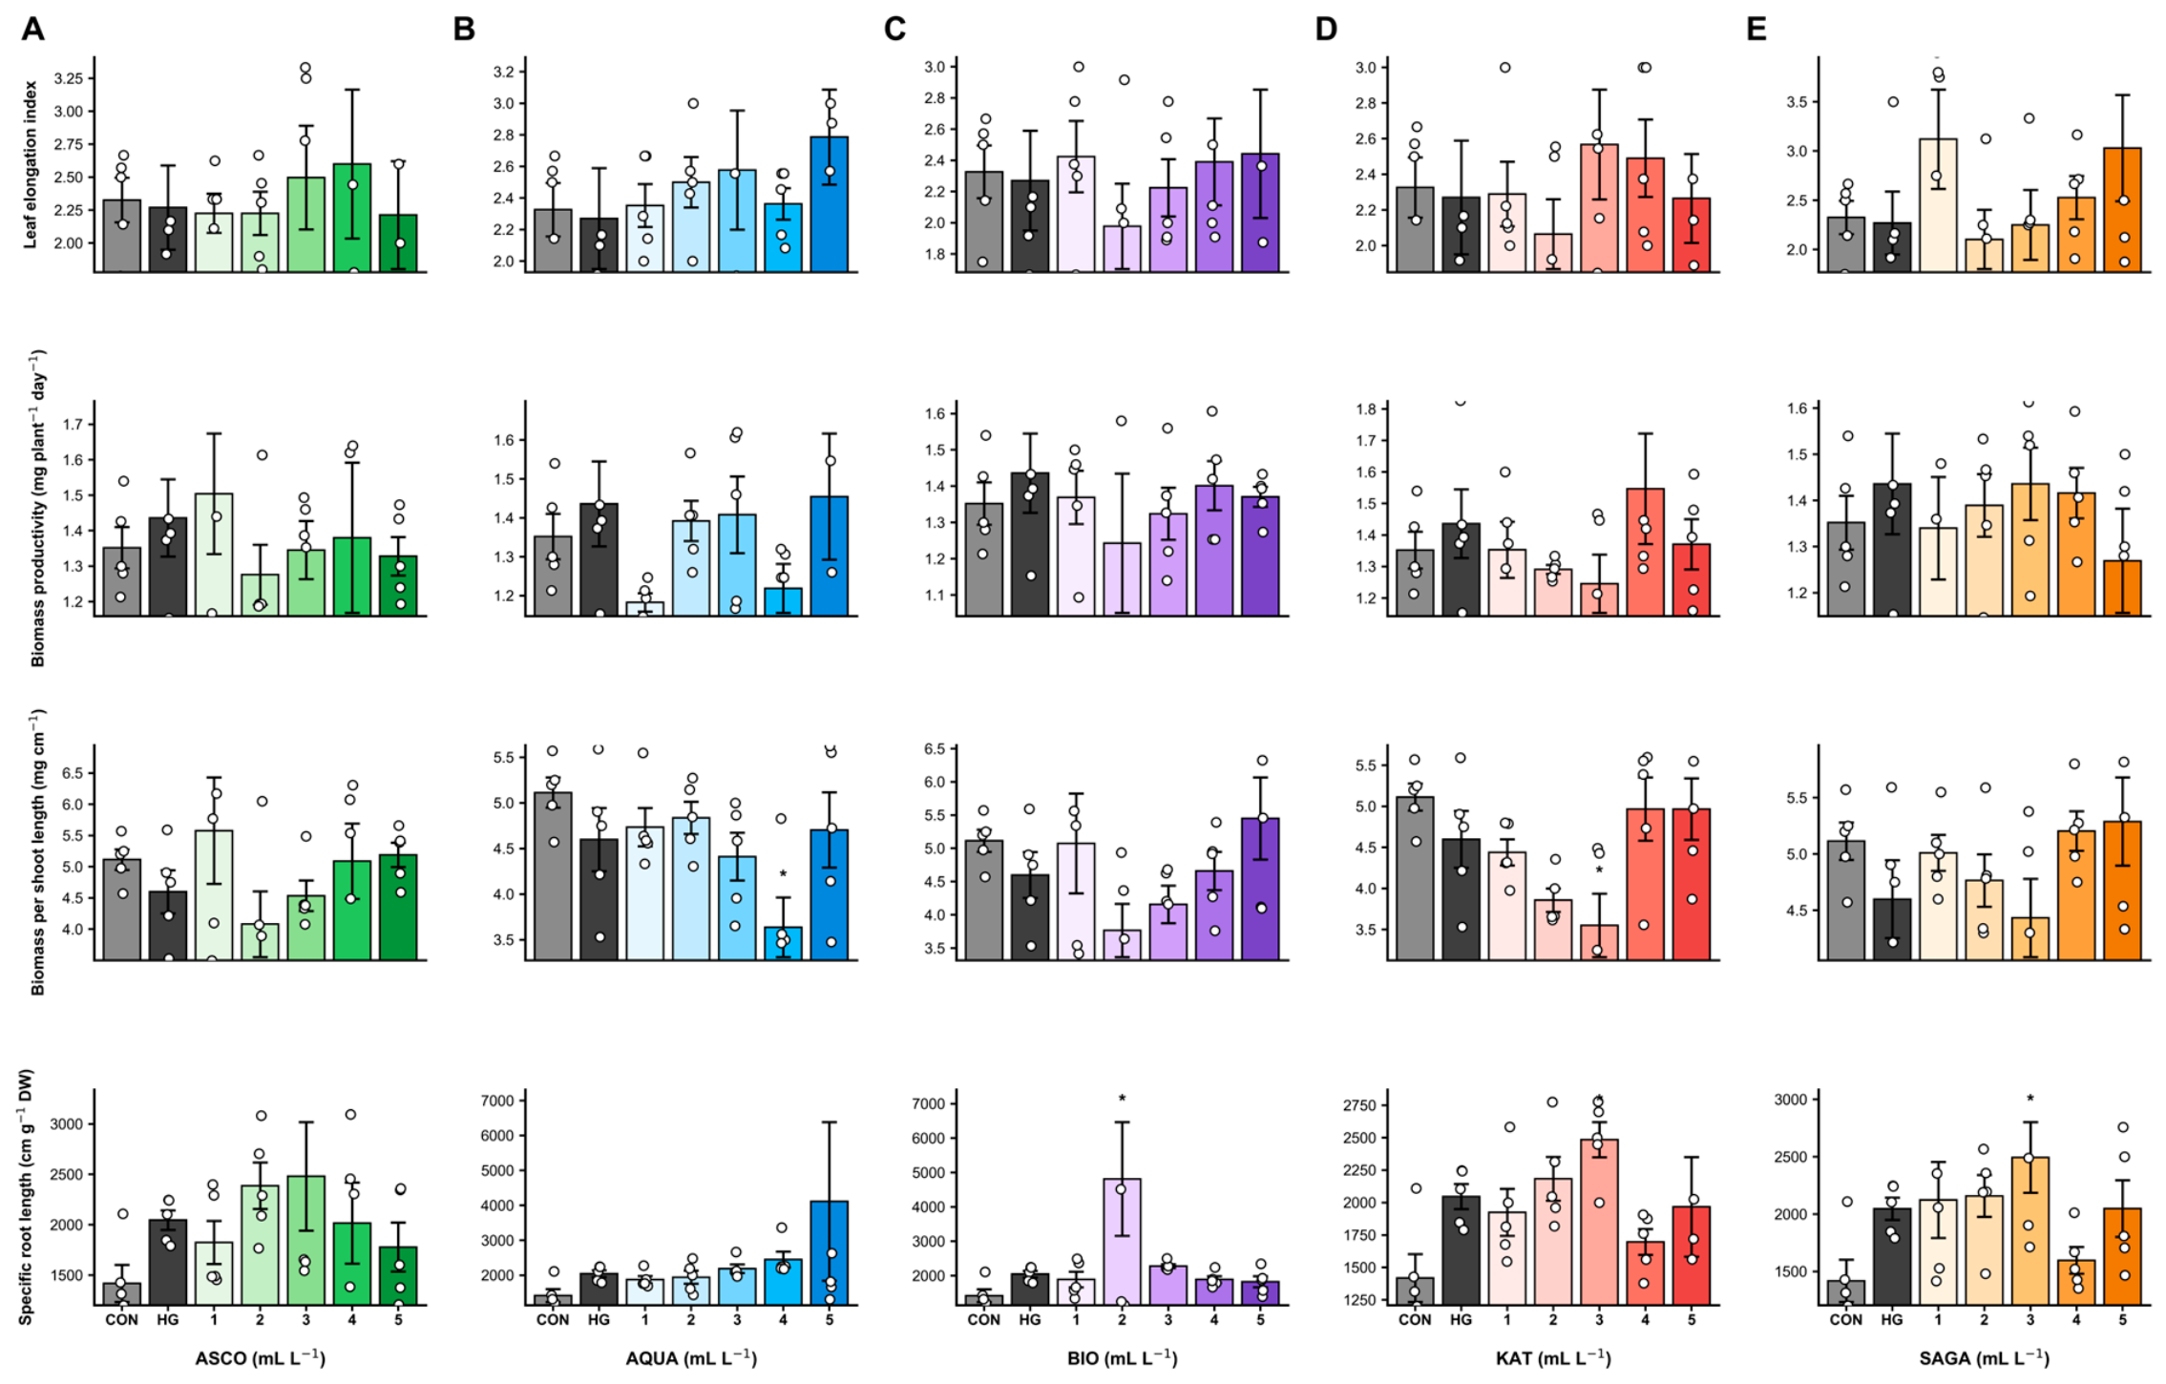
SR remained stable across all the treatments (Figure 5). Although numerical variations were observed within individual formulations, no consistent dosage-dependent trend was evident. Similarly, the LEI exhibited only minor fluctuations among the treatments, with values remaining broadly comparable across the formulations (Figure 6).
Figure 6.
Effects of five SWE formulations applied at different dosages (1, 2, 3, 4, and 5 mL L−1) on derived growth efficiency indices of C. annuum grown under greenhouse conditions for 15 DAT. CON and HG denote the distilled water (negative) and full-strength Hoagland nutrient solution (positive) controls, respectively. The panels represent (A) ASCO, (B) AQUA, (C) BIO, (D) KAT, and (E) SAGA. The derived growth efficiency indices included the leaf elongation index (LEI), biomass productivity (BP; mg plant−1 day−1), biomass per shoot length (BSL; mg cm−1), and specific root length (SRL; cm g−1 DW). Data are presented as mean ± standard error (SE) (n = 5), with individual replicate values shown as open circles. Asterisks (*) and indicate treatments that differed significantly from the negative (CON) and positive (HG) controls, respectively (p < 0.05).
In contrast, moisture-related indices responded to the SWE application (Figure 5). MC increased progressively with intermediate SWE dosages and reached maximum values at 2 mL L−1 for ASCO and BIO and at 3 mL L−1 for AQUA, KAT, and SAGA. Correspondingly, the DM percentage decreased at these optimum dosage levels and increased at the highest dosage. A reciprocal relationship between MC and DM was observed for all the formulations.
The growth efficiency indices exhibited variable responses among the treatments (Figure 6). BP and SRL showed numerical differences, but no significant treatment effects (Table 1). In contrast, BSL differed significantly among the SWE treatments, with the highest values generally occurring at intermediate dosages.
The calculated biomass traits showed that MC and DM responded strongly to SWE, whereas SR and most growth efficiency indices exhibited comparatively little variation among treatments. Overall, intermediate SWE dosage produced the highest MC values, whereas biomass allocation traits remained relatively stable throughout the experimental period.
3.4. Multivariate Analyses Revealed Consistent Relationships Among Measured Growth Traits
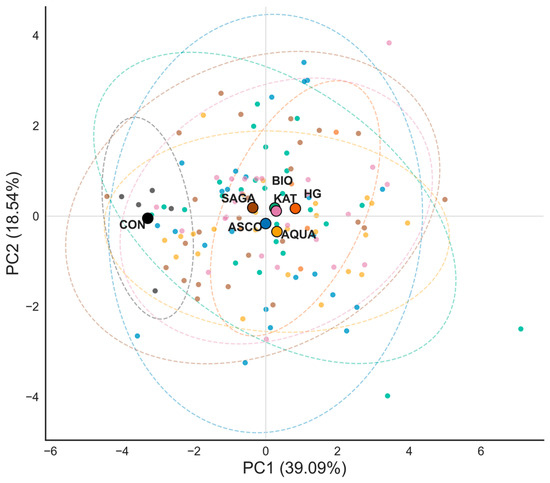
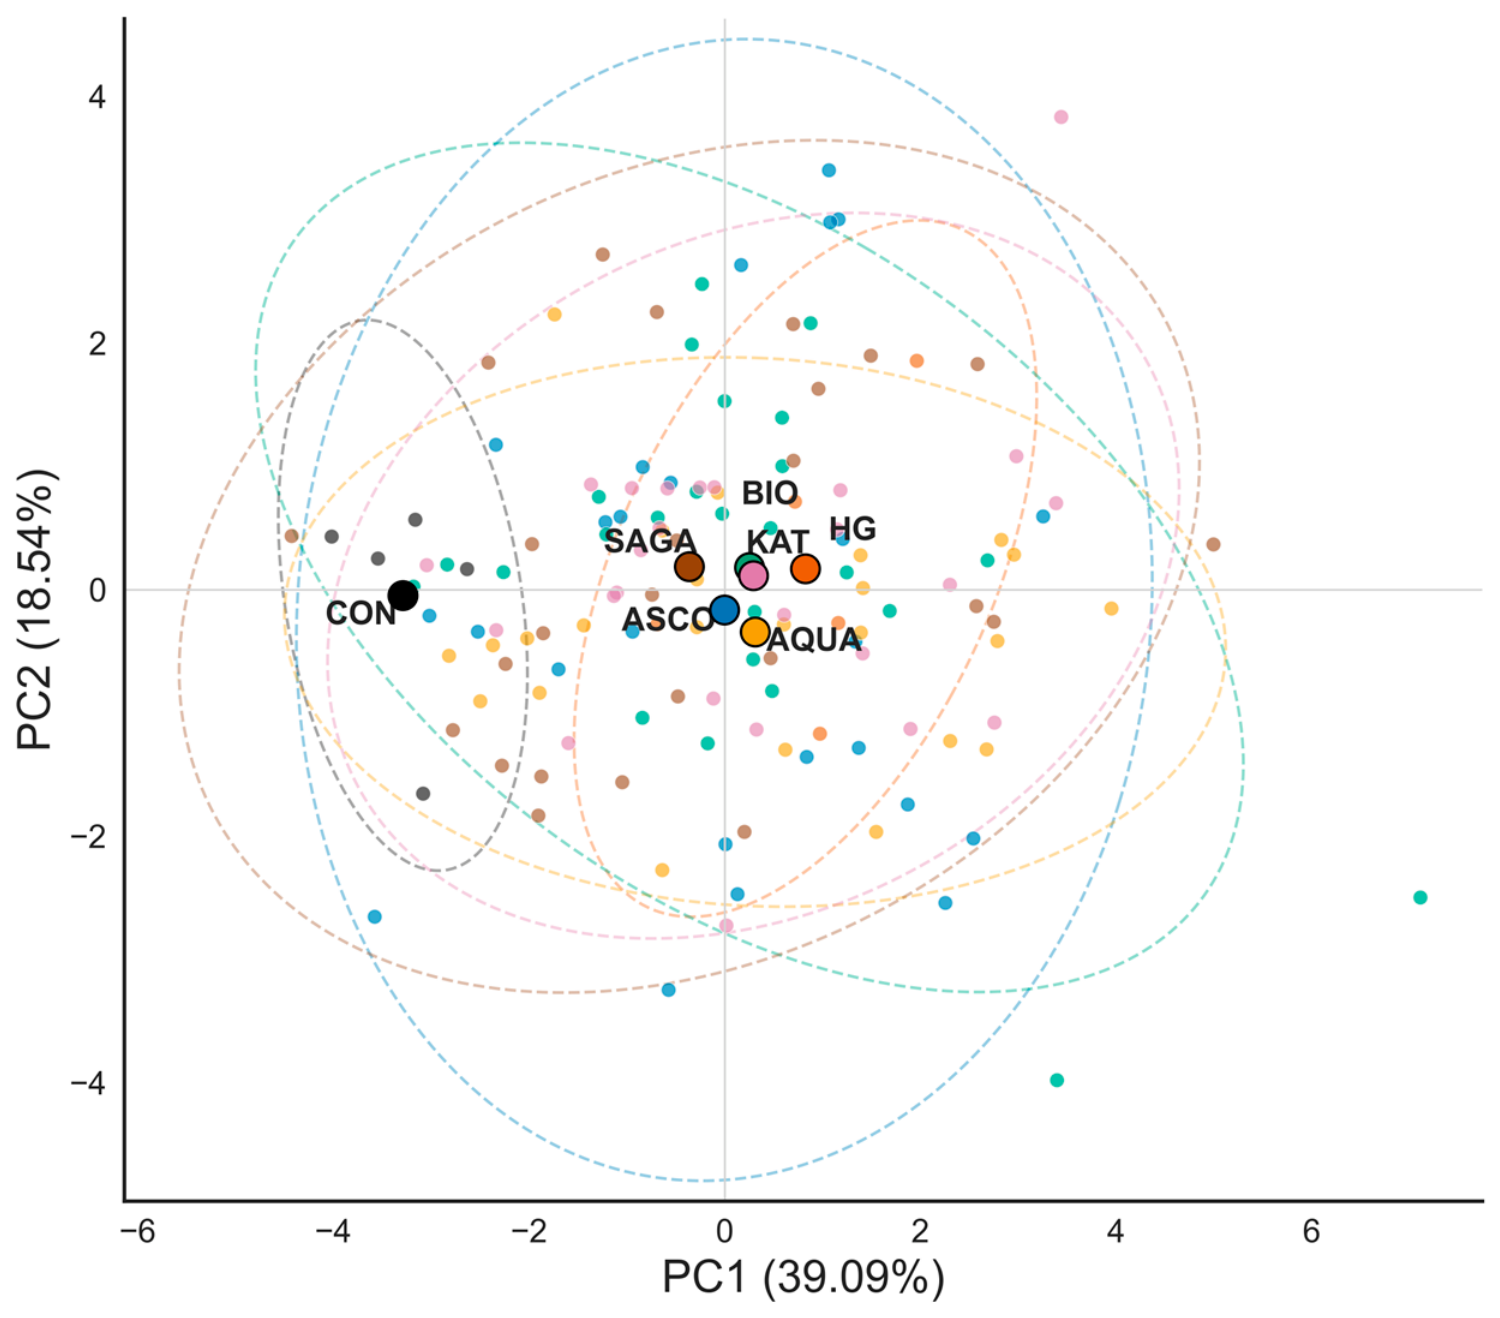
Multivariate analyses were performed using the ten independently measured traits to evaluate the overall relationship between growth variables and treatment responses. PCA reduced the multidimensional dataset to two principal components that together explained 57.63% of the total variation, with PC1 accounting for 39.09% and PC2 accounting for 18.54% (Figure 7; Supplementary Data S4A–C).
Figure 7.
Principal component analysis (PCA) score plot showing the multivariate responses of C. annuum seedlings to five SWE formulations applied at different dosages (1, 2, 3, 4, and 5 mL L−1) under greenhouse conditions for 15 DAT. PCA was performed using ten directly measured growth traits, including chlorophyll content (CHL), shoot length (SL), root length (RL), leaf length (LL), leaf width (LW), total leaves (TL), shoot fresh weight (SFW), shoot dry weight (SDW), root fresh weight (RFW), and root dry weight (RDW). Each small colored point represents an individual replicate (n = 5 per treatment), whereas the larger labeled symbols represent the treatment centroids for each formulation (ASCO, AQUA, BIO, KAT, and SAGA) and controls (CON and HG). Dashed ellipses represent the dispersion of observations within each treatment group and are presented for the visualization of group variability. Principal components 1 (PC1) and 2 (PC2) explained 39.09% and 18.54% of the total variation, respectively (57.63% cumulative variance).
The PCA score plot showed a clear separation between the CON and SWE-treated seedlings, primarily along the PC1 axis (Figure 7). The CON centroid was positioned on the negative side of PC1, whereas the HG and all evaluated formulations were clustered closer to the positive side of the axis. The HG- and SWE-treated seedlings were predominantly positioned on the positive side of PC1. Although considerable overlap occurred among the five commercial SWE formulations, their centroids occupied a similar region of the ordination space, suggesting that the formulations elicited broadly comparable growth responses despite differences in optimal dosage.
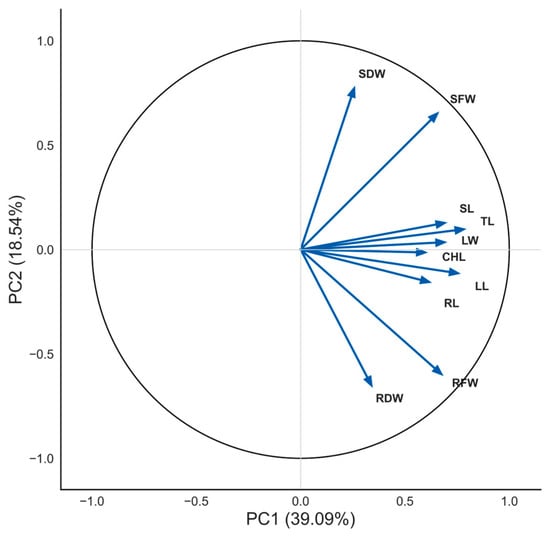
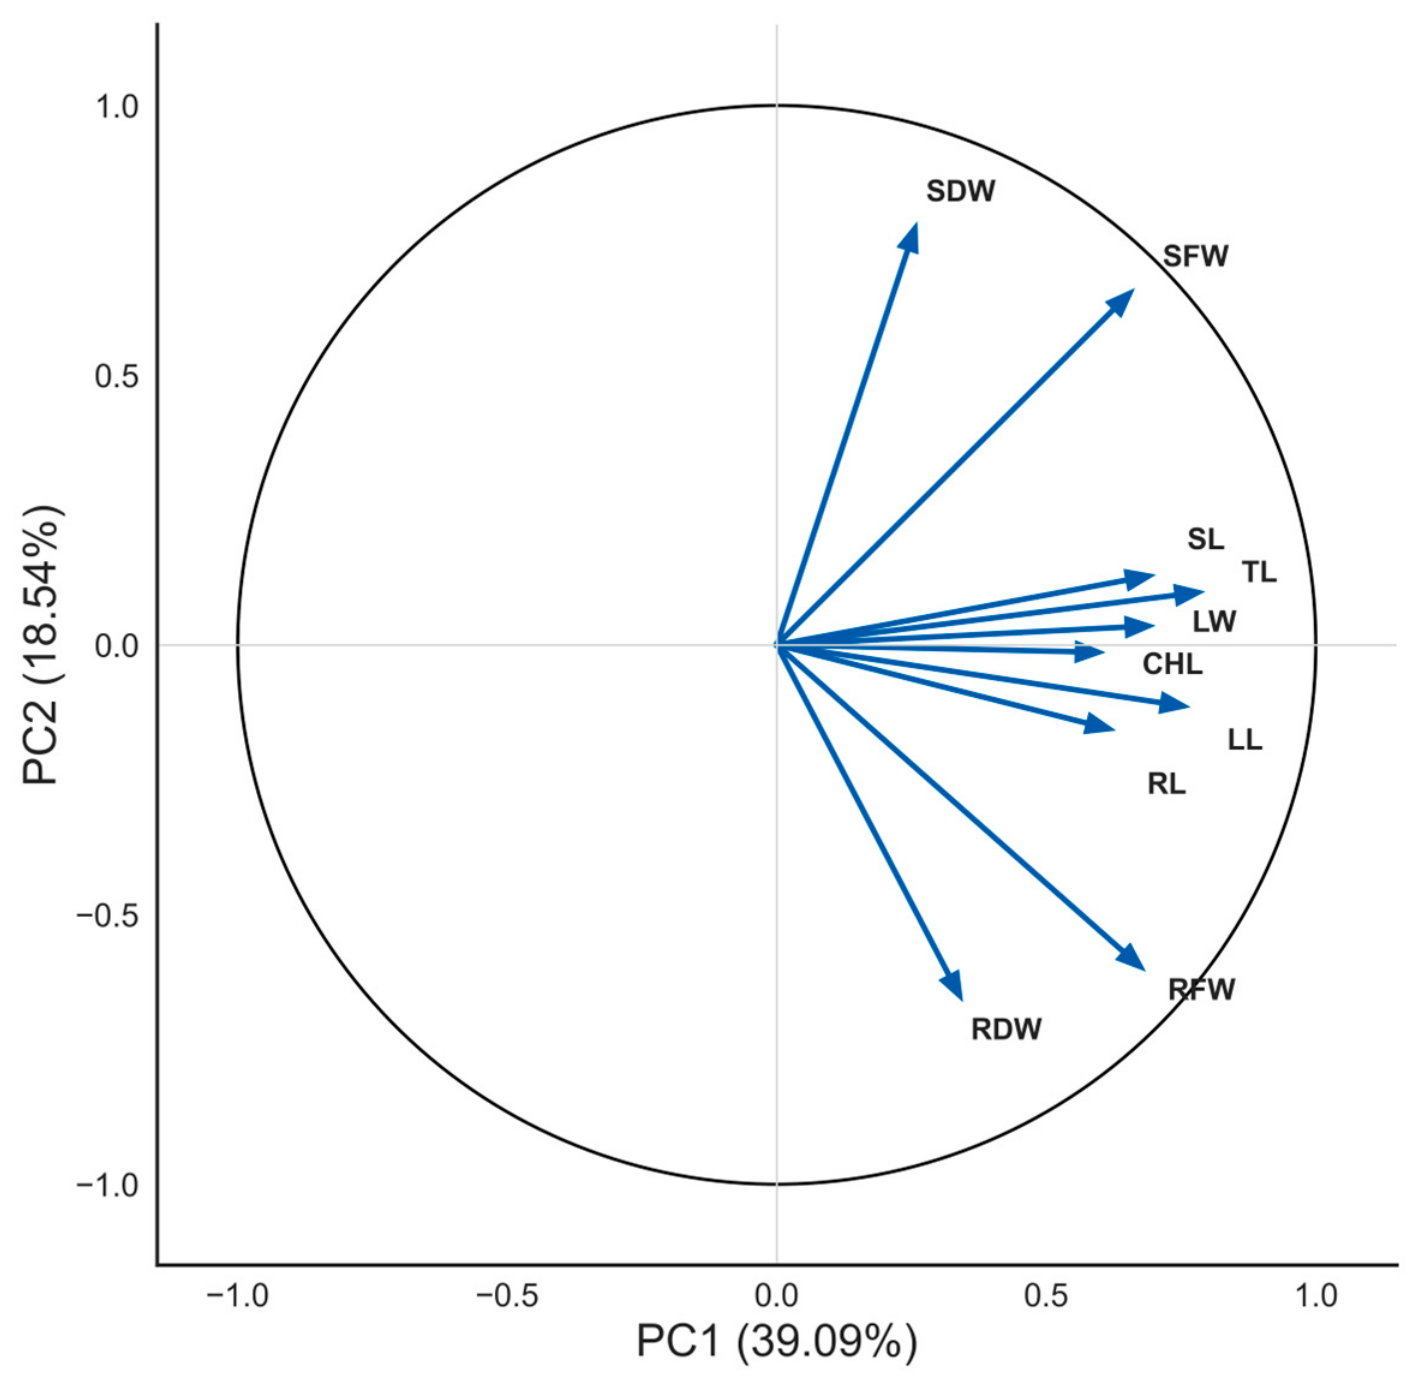
The PCA loading plot demonstrated that all the measured traits contributed positively to PC1 (Figure 8). Variables associated with vegetative growth, including TL, LL, SL, LW, RFW, SFW, RL, and CHL, exhibited high positive loadings, indicating that these traits collectively contributed to the primary variation represented by PC1. In contrast, SDW and RDW contributed more strongly to PC2, whereas SDW and RDW exhibited stronger loadings on PC2.
Figure 8.
Principal component analysis (PCA) correlation circle illustrating the relationships between ten directly measured growth traits of C. annuum seedlings following application of five SWE formulations at different dosages (1, 2, 3, 4, and 5 mL L−1) under greenhouse conditions for 15 DAT. The variables included chlorophyll content (CHL), shoot length (SL), root length (RL), leaf length (LL), leaf width (LW), total leaves (TL), shoot fresh weight (SFW), shoot dry weight (SDW), root fresh weight (RFW), and root dry weight (RDW). Arrows represent variable loadings on the first two principal components, with arrow length indicating the strength of each variable’s contribution, and the angle between arrows reflects the degree of correlation among the variables. Principal components 1 (PC1) and 2 (PC2) explained 39.09% and 18.54% of the total variation, respectively (57.63% cumulative variance).
Pearson’s correlation analysis further demonstrated consistent positive relationships among most measured traits (Figure 9; Supplementary Data S3). Moderate to strong positive correlations were observed among the vegetative growth variables, particularly between LL and TL (r = 0.57), LW and TL (r = 0.53), and SL and SFW (r = 0.46). Fresh biomass variables were also strongly associated with their corresponding dry biomass components, with SFW showing a strong positive correlation with SDW (r = 0.80) and RFW showing a stronger positive correlation with RDW (r = 0.85). CHL was positively correlated with most morphological traits, although its association with dry biomass was weak.
Figure 9.
Pearson correlation heatmap showing the relationships among ten directly measured growth traits of C. annuum grown under greenhouse conditions for 15 DAT following application of five SWE formulations at different dosages (1, 2, 3, 4, and 5 mL L−1). The analyzed traits included chlorophyll content (CHL), shoot length (SL), root length (RL), leaf length (LL), leaf width (LW), total leaves (TL), shoot fresh weight (SFW), shoot dry weight (SDW), root fresh weight (RFW), and root dry weight (RDW). The cell values represent Pearson’s correlation coefficients (r), with the color intensity indicating the strength and direction of the correlation. Asterisks indicate statistically significant correlations after Benjamini–Hochberg false discovery rate (FDR) correction, where *, **, and *** represent q < 0.05, q < 0.01, and q < 0.001, respectively.
The multivariate analyses were consistent with the univariate observations. PCA distinguished CON from SWE-treated seedlings along PC1, whereas Pearson’s correlation analysis revealed predominantly positive relationships among the measured growth traits.
3.5. Integrated Trait Analysis Identified Formulation-Specific Optimum Dosages
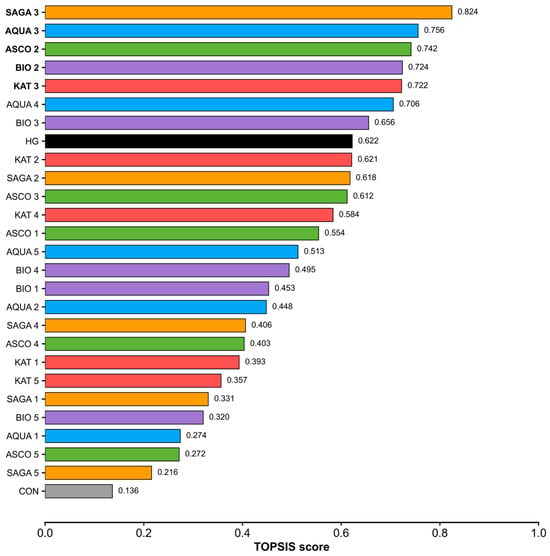
To integrate the responses of all measured growth traits into a single performance index, ten independent variables were subjected to TOPSIS analysis using equal weights (Supplementary Data S5). TOPSIS scores ranged from 0.136 (CON) to 0.824 (SAGA 3) (Figure 10).
Figure 10.
TOPSIS-based ranking of C. annuum treatments following application of five SWE formulations at different dosages (1, 2, 3, 4, and 5 mL L−1) under greenhouse conditions for 15 DAT. TOPSIS scores were calculated using ten directly measured growth traits, including chlorophyll content (CHL), shoot length (SL), root length (RL), leaf length (LL), leaf width (LW), total leaves (TL), shoot fresh weight (SFW), shoot dry weight (SDW), root fresh weight (RFW), and root dry weight (RDW). Higher TOPSIS scores indicate greater overall growth performance than the ideal solution. Bars are arranged in descending order of TOPSIS score, with CON and HG representing distilled water (negative) and full-strength Hoagland nutrient solution (positive) controls, respectively.
The integrated ranking clearly distinguished the highest-performing SWE treatments from the controls (Figure 10). Among all treatments, SAGA 3 achieved the highest TOPSIS score (0.824), followed by AQUA 3 (0.756), ASCO 2 (0.742), BIO 2 (0.724), and KAT 3 (0.722) (Supplementary Data S5; Figure 10). These treatments ranked above the HG (0.622), whereas the CON recorded the lowest overall score (0.136). The remaining SWE treatments showed intermediate rankings, whereas lower and higher dosages generally produced lower scores.
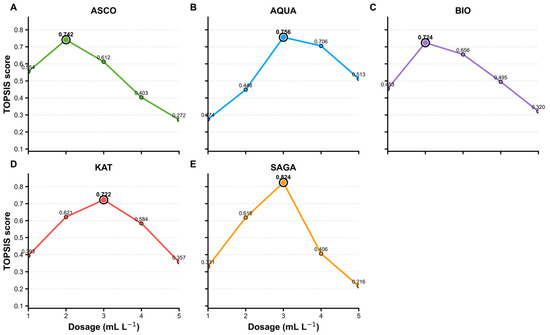
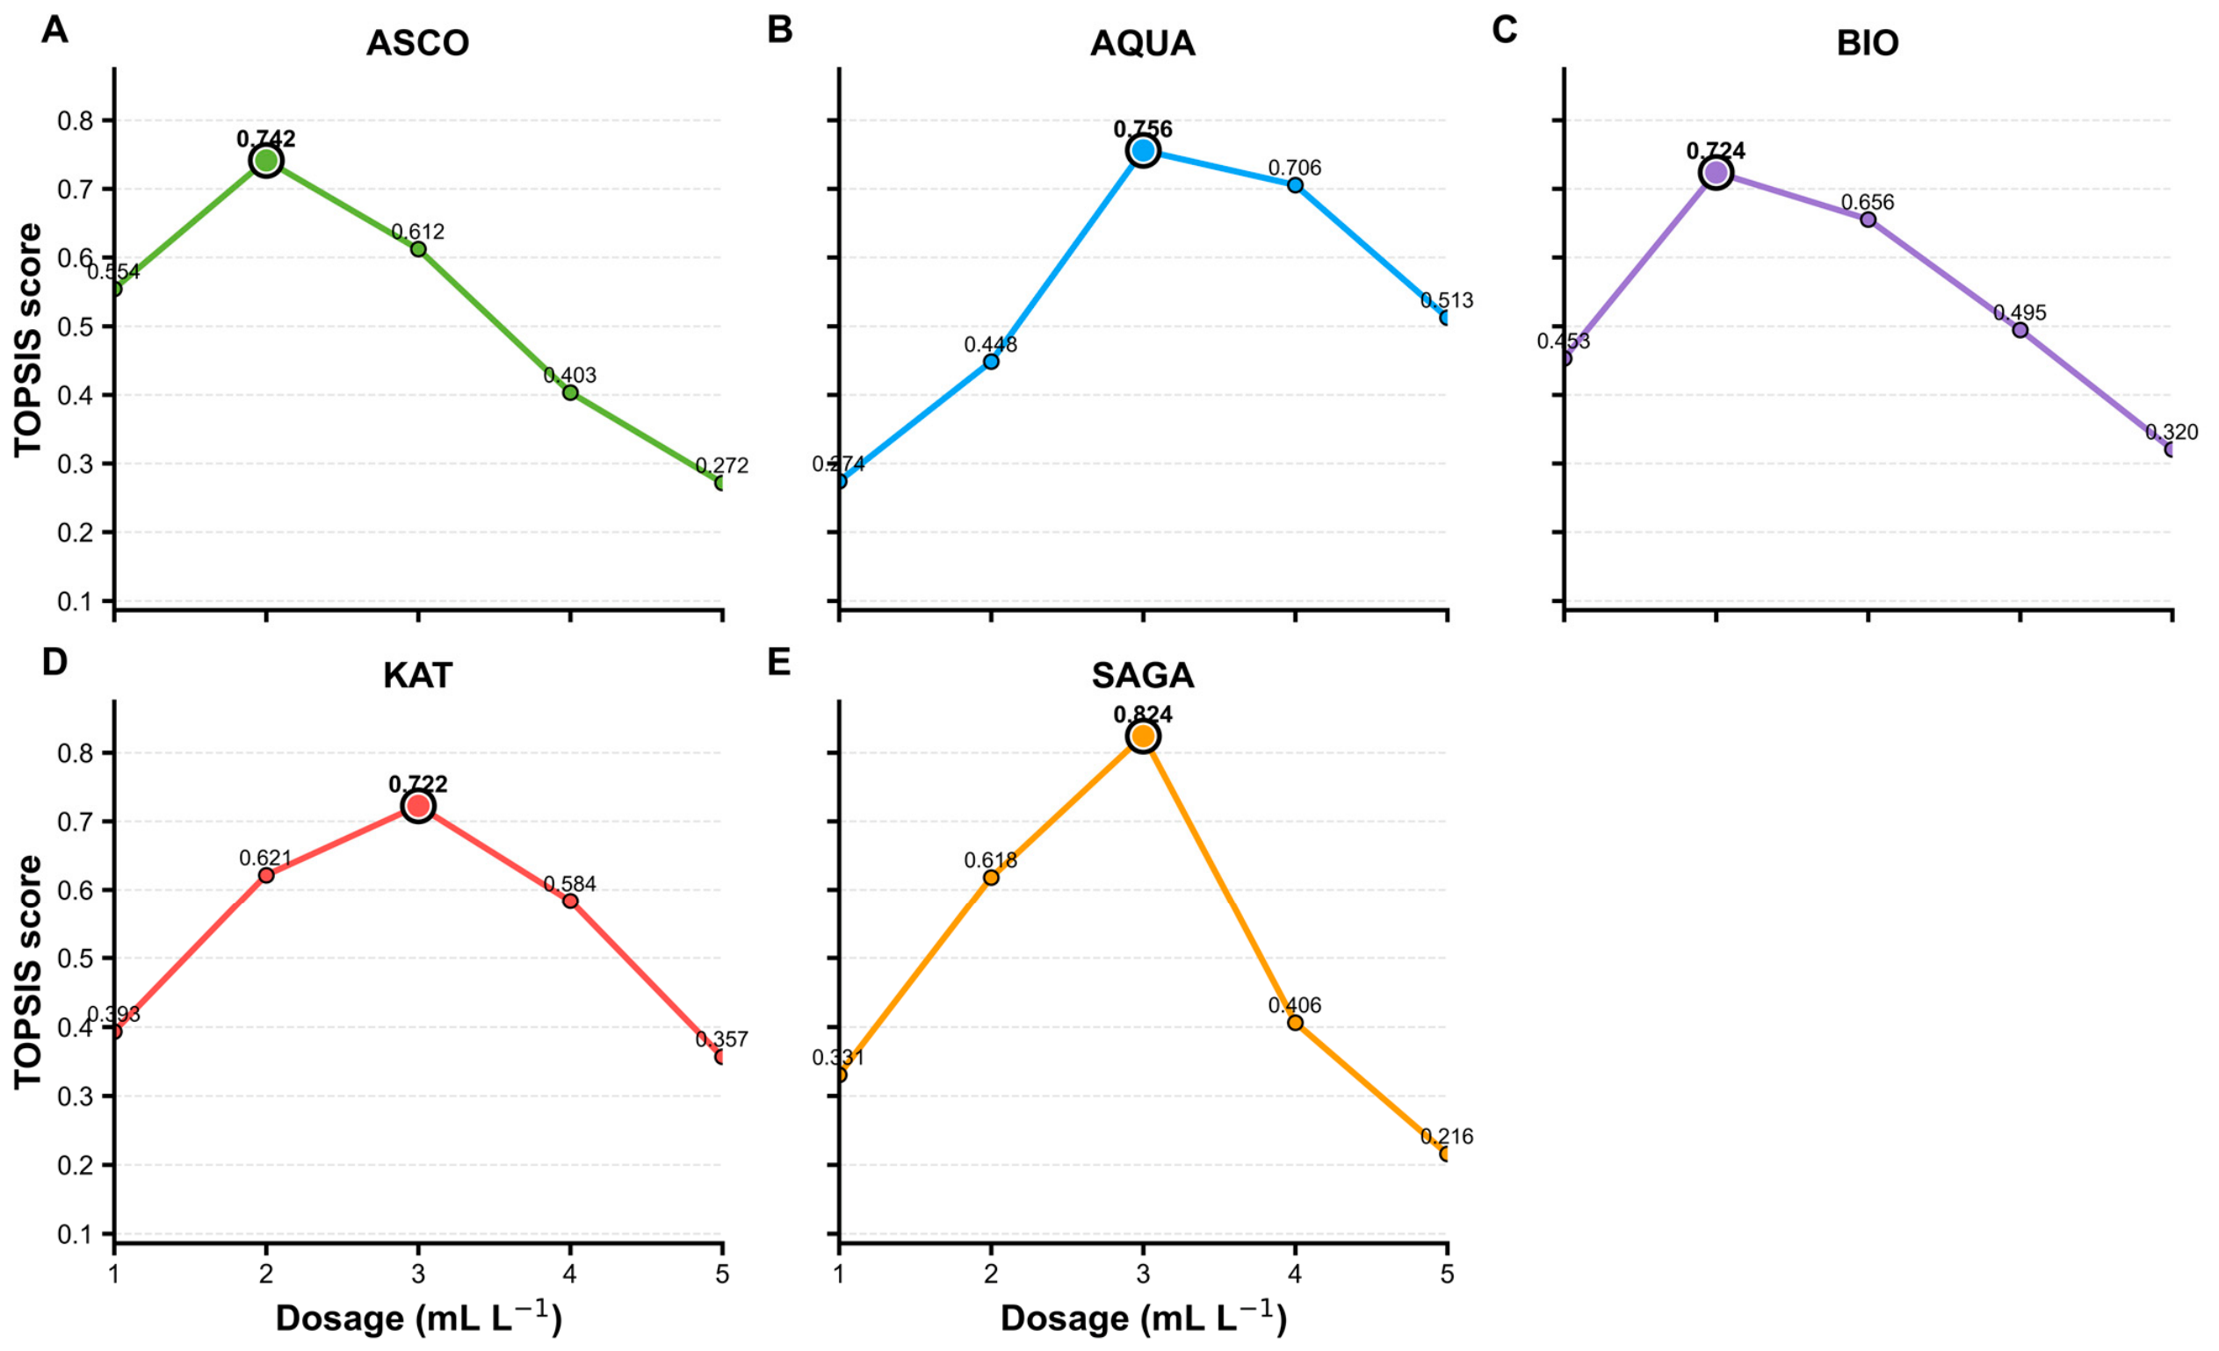
The dose–response profiles further demonstrated that each commercial SWE formulation exhibited a distinct optimal dose (Figure 11). ASCO and BIO achieved their maximum TOPSIS scores at 2 mL L−1, whereas AQUA, KAT, and SAGA reached high performance at 3 mL L−1. The TOPSIS scores decreased at higher dosages for all formulations. This response closely reflected the dose-dependent patterns observed for morphological traits, biomass accumulation, and growth indices in the preceding sections.
Figure 11.
Dosage-dependent variation in TOPSIS scores of C. annuum seedlings treated with five commercial SWE formulations under greenhouse conditions for 15 DAT. The panels represent (A) ASCO, (B) AQUA, (C) BIO, (D) KAT, and (E) SAGA. TOPSIS scores were calculated using ten directly measured growth traits, including chlorophyll content, shoot length, root length, leaf length, leaf width, total leaves, shoot fresh weight, shoot dry weight, root fresh weight, and root dry weight. The x-axis represents the applied SWE dosage (1–5 mL L−1), and the y-axis represents the corresponding TOPSIS score. Higher TOPSIS scores indicate greater overall growth performance compared to the ideal solution. The highlighted marker in each panel denotes the optimum dosage corresponding to the highest TOPSIS score for each commercial SWE formulation.
Across all formulations, intermediate dosages produced the highest TOPSIS scores, whereas lower and higher dosages ranked lower. This ranking pattern was consistent with the responses observed for individual growth traits. TOPSIS identified ASCO 2, AQUA 3, BIO 2, KAT 3, and SAGA 3 as the highest-ranked treatments for their respective commercial SWE formulations.
4. Discussion
4.1. Formulation-Specific Dosage Responses Enhanced Early Seedling Growth
The application of commercial SWE formulations improved the early vegetative growth of C. annuum seedlings, although the magnitude of the response depended on both the formulation and dosage. Across all five commercial formulations, CHL, SL, RL, LL, and LW increased from the lowest to intermediate dosages before stabilizing or declining at the highest dosages. This bell-shaped response indicates that the growth-promoting effects of SWEs were dose-dependent.
The superior performance observed at intermediate dosages is consistent with the reported biostimulatory activities of seaweed-based product. Unlike conventional fertilizers, commercial SWE formulations are generally considered to influence plant physiological processes rather than primarily serving as sources of mineral nutrients [30]. At appropriate dosages, these products improve photosynthetic activity, nutrient acquisition, and root development, thereby supporting coordinated shoot and leaf expansion [17]. However, increasing the dosage beyond the optimum level did not enhance these processes. Consequently, the reduced performance observed at 4–5 mL L−1 in several formulations likely reflects the saturation of the biostimulant response, rather than nutrient limitations.
Our findings are consistent with those of previous studies on C. annuum. Ozbay and Demirkiran [31] reported that an A. nodosum-based commercial biostimulant significantly increased CHL, plant height, leaf development, and root biomass of Capsicum, with moderate dosage resulting in the greatest improvements. Ali et al. [21] demonstrated that SWEs stimulated the shoot and root growth of Capsicum plants while simultaneously modifying the rhizosphere microbial community associated with improved plant performance. Similar dosage-dependent responses have been reported for numerous horticultural crops treated with A. nodosum extracts, where intermediate dosages maximized early vegetative growth [32].
Although all five commercial formulations promoted seedling growth, differences in their optimum dosages likely reflected differences in the formulation. According to the manufacturers, the evaluated products differed in their reported compositions. SAGA contains plant growth regulators together with macro- and micronutrients; KAT contains amino acids, alginic acid, betaines, and phenolic compounds; BIO contains auxins, cytokinins, and amino acids; and AQUA and ASCO are based primarily on Ascophyllum nodosum extracts enriched with alginates, fucoidans, mannitol, and potassium (Supplementary Figures S1–S5). These differences may partly explain the variation in the optimum dosage among formulations. However, because the product composition was not independently analyzed, the contribution of individual constituents could not be determined, and any mechanistic interpretation remained tentative.
Applying SWE above the optimum dosage did not improve seedling performance and reduced growth responses in several formulations. Therefore, selecting an appropriate dosage for each commercial SWE formulation is more important than simply increasing its dosage. Optimizing application rates can improve seedling establishment while avoiding unnecessary product use in greenhouse Capsicum production.
4.2. Biomass Accumulation Reflected Improved Early Seedling Performance at Optimum Swe Dosages
The increase in biomass observed in the present study indicates that improvements in seedling morphology were accompanied by greater tissue accumulation during early development. Fresh biomass responded more strongly than dry biomass across all evaluated formulations, suggesting that the optimum SWE dosage primarily promoted rapid seedling growth rather than the deposition of structural biomass. As seedlings were evaluated only 15 DAT, tissue expansion and water accumulation were expected to contribute more to biomass than to structural dry matter deposition.
The greater response of fresh biomass may reflect improved physiological activity during early growth, rather than increased structural carbon deposition. Seaweed-based biostimulants have been reported to enhance cell expansion, nutrient acquisition, and water balance, all of which contribute to rapid increases in fresh tissue mass during the seedling stage [17,18]. Variations among formulations may also reflect differences in their reported compositions (Supplementary Figures S1–S5). However, because these formulations were not chemically characterized in the present study, the contributions of individual constituents remain uncertain.
These findings are consistent with recent studies demonstrating that seaweed biostimulants enhance biomass accumulation during early crop development. Sharmin et al. [24] reported significantly greater fresh and dry biomass in chilies treated with SWEs, with fresh biomass showing strong responses under optimum dosage. Similarly, recent studies have shown that intermediate application rates of commercial seaweed biostimulants promote greater early biomass accumulation, whereas higher application rates provide minimal additional benefits [33]. Reviews of seaweed-derived biostimulants have also concluded that improvements in biomass are closely associated with enhanced physiological performance during early vegetative growth, although the magnitude of the response depends on the crop species, formulation, and dosage [17,18].
Higher fresh biomass during the nursery stage is likely to improve transplant quality because vigorous seedlings generally establish more rapidly after transplanting and tolerate subsequent environmental fluctuations better than smaller seedlings [3]. Although the present study did not evaluate post-transplant performance or final yield, the consistent increase in fresh biomass at the optimum dosage indicates that appropriate SWE application can improve seedling quality. Although post-transplant performance and final yield were not evaluated, the consistent increase in fresh biomass at the optimum dosage suggests that appropriate SWE application can improve seedling quality during nursery production.
4.3. Growth Efficiency Responses Indicated Improved Seedling Vigor Without Major Changes in Biomass Allocation
Our results showed that commercial SWE application improved early seedling vigor primarily through enhanced tissue hydration and fresh biomass accumulation, rather than changes in biomass partitioning between shoots and roots. Although moisture-related traits responded strongly to SWE application, SR and most growth efficiency indices remained stable across all the treatments. This suggests that the evaluated formulations promoted coordinated shoot and root development during early establishment rather than the preferential growth of one organ over the other. Balanced shoot and root development is generally considered desirable because it supports the successful establishment of transplants [34,35].
The limited changes observed in biomass allocation were consistent with the developmental stages evaluated in this study. At 15 DAT, rapid cell expansion and water accumulation generally contributed more to seedling growth than to structural DM deposition. Accordingly, increases in fresh biomass are expected to precede the measurable shifts in biomass partitioning. As the commercial formulations were not chemically characterized in this study, the contribution of individual constituents to these responses remains uncertain.
These observations are consistent with recent studies showing that seaweed-based biostimulants frequently improve seedling vigor without modifying biomass allocation during the initial stages of plant development [22]. Lam et al. [36] reported that optimized seaweed biostimulant dosages enhanced vegetative growth, photosynthetic performance, and water relations, whereas improvements in biomass partitioning were modest during early growth. Similarly, Renganathan et al. [22] demonstrated that commercial seaweed formulations promote balanced shoot and root development in C. annuum seedlings during early seedling growth. Recent work by Ali et al. [21] showed that C. annuum plants treated with Sargassum and A. nodosum extracts exhibited improved vegetative performance while maintaining coordinated root development, supporting the view that seaweed biostimulants primarily strengthen overall seedling vigor rather than substantially altering biomass allocation.
Maintaining a stable SR while increasing tissue hydration and biomass accumulation is desirable for greenhouse transplant production because balanced seedlings generally establish more successfully after transplanting. These findings indicate that optimum SWE application can enhance seedling vigor while maintaining a balanced biomass allocation, supporting the production of vigorous and uniform C. annuum seedlings.
4.4. Coordinated Responses Among Growth Traits Supported the Integrated Effects of Commercial Seaweed Extracts
Multivariate analyses complemented the univariate results by showing that improvements in seedling performance occurred across multiple measured traits rather than individual growth parameters. PCA distinguished CON from SWE-treated seedlings, whereas the five commercial formulations occupied similar regions of the ordination space despite differences in their optimum dosages. Similarly, the predominantly positive Pearson correlations among morphological traits, CHL, and biomass measurements indicated coordinated responses to the SWE application. As exploratory analyses, PCA and correlation do not establish causal relationships, but they provide useful evidence that several independent indicators of seedling performance change in a coordinated manner after treatment.
As the commercial formulations were not chemically characterized, the contribution of individual constituents to these responses remains uncertain. The multivariate analyses should be interpreted as describing patterns of covariation among measured variables rather than demonstrating physiological coordination or mechanistic interactions (Supplementary Figures S1–S5).
The coordinated improvements observed in chlorophyll content, morphological traits, and biomass accumulation are consistent with the multifunctional mode of action proposed for seaweed-derived biostimulants. Previous studies have shown that commercial SWEs contain diverse bioactive constituents, including polysaccharides, betaines, amino acids, phenolic compounds, vitamins, minerals, and hormone-like substances, which may collectively enhance nutrient uptake, stimulate cell division and expansion, improve photosynthetic performance, and promote root growth [14,16,18,22]. These complementary physiological responses can collectively increase seedling vigor and biomass accumulation during the early stages of plant development [14,18,37]. Therefore, these mechanisms should be regarded as plausible explanations based on the previous literature rather than direct evidence derived from the present experiment.
These findings are consistent with those of recent studies that have used multivariate approaches to evaluate the integrated effects of seaweed biostimulants on crop performance. In a two-year field study on C. annuum, Staykov et al. [37] demonstrated that PCA effectively summarized multiple yield-related variables and confirmed that seaweed-treated plants exhibited superior performance compared with untreated controls. Similarly, Navarro-Zapata et al. [38] applied PCA and Pearson correlation analysis to assess algal extract responses and showed that multivariate methods successfully integrated morphological and physiological measurements into a common response pattern. A recent evaluation of commercial seaweed formulations also employed PCA to compare treatment performance and reported that multivariate analyses provided a more comprehensive assessment of formulation efficacy than individual traits considered separately [22]. Collectively, these studies support the use of multivariate analyses to integrate multiple plant growth responses into a comprehensive assessment of commercial biostimulant performance.
Integrating multiple growth measurements using conventional univariate and multivariate analyses provides a comprehensive framework for evaluating the efficacy of commercial seaweed formulations. The coordinated responses observed across chlorophyll content, vegetative growth, and biomass further demonstrate the value of this approach in identifying biologically consistent treatment responses [39,40].
4.5. Integrated Trait Analysis Supports Formulation-Specific Dosage Optimization for Greenhouse C. annuum Seedlings
The integrated evaluation of multiple growth traits demonstrated that each commercial SWE formulation exhibited a distinct optimum dosage for promoting early Capsicum-seedling performance. Although the individual formulations differed in their overall rankings, the integrated analysis identified an intermediate dosage level as the most effective for each product. Consistent with the study objectives, TOPSIS identified the optimum dosage for each formulation under uniform greenhouse conditions.
Differences among the formulations may reflect variations in their reported compositions (Supplementary Figures S1–S5). However, because these products were not chemically characterized, the contributions of individual constituents could not be determined.
Recent studies increasingly support the use of integrated evaluation methods for assessing plant biostimulants, as individual growth parameters often respond differently to different treatments. A recent two-year field investigation on Capsicum and eggplant demonstrated that seaweed biostimulants improved overall crop performance through the simultaneous enhancement of multiple agronomic traits rather than isolated responses, supporting the value of integrated assessment when evaluating commercial products [37]. Similarly, a comprehensive evaluation of a commercial seaweed liquid extract showed that the overall effectiveness of biostimulants is better interpreted by considering multiple growth and physiological indicators together, instead of relying on a single measurement [23]. Recent studies have emphasized that the diverse chemical compositions of seaweed-derived biostimulants can generate crop- and product-specific responses, highlighting the importance of optimizing application strategies for individual formulations, rather than assuming universal recommendations [30]. Collectively, these studies support the use of integrated trait analyses to identify formulation-specific optimum application rates for commercial biostimulants.
The results of this study provide practical guidance for greenhouse seedling production. Growers should apply each commercial SWE formulation at its optimum dosage, as higher application rates did not further improve seedling performance. TOPSIS complements conventional statistical analyses by integrating multiple growth traits into a single performance index. Although shoot and root dry weights exhibited relatively limited variation among treatments at 15 DAT, these variables were retained in the TOPSIS analysis because they represent essential components of biomass accumulation and overall seedling quality. At this early developmental stage, seedling growth is predominantly driven by rapid tissue expansion and water accumulation, resulting in greater treatment-related differences in fresh biomass than in dry matter accumulation. Consequently, fresh biomass, moisture content, chlorophyll content, and morphological traits are more sensitive indicators of early seedling vigor, whereas dry biomass provides complementary information.
From a practical perspective, several formulation-specific SWE dosages produced seedling growth responses that were statistically comparable to those of the full-strength HG nutrient solution across multiple measured traits. These findings indicate that optimum SWE application rates can promote early seedling growth comparable to that achieved with a complete nutrient solution under greenhouse conditions. However, further validation under nursery production systems and field conditions is required.
4.6. Study Limitations
The present study was conducted under controlled greenhouse conditions using seedlings harvested 15 DAT. Therefore, the formulation-specific optimum dosages identified in this study should be validated under field conditions and during later developmental stages before broad recommendations are made. Future research should determine whether these optimum application rates are maintained following transplantation and translate into improved field establishment, plant growth, and yield under commercial production systems. In addition, the chemical compositions of the evaluated commercial seaweed extracts were not independently characterized. The compositional information discussed in this study was based solely on manufacturer-reported product specifications and was included to provide context for the formulations evaluated. Consequently, the proposed relationships between the formulation composition and the observed biological responses should be regarded as plausible interpretations rather than direct mechanistic evidence. Future studies integrating the independent chemical characterization of commercial formulations with physiological, biochemical, and molecular analyses would provide a more comprehensive understanding of the mechanisms underlying formulation-specific responses.
5. Conclusions
Commercial SWE formulations significantly enhanced the early growth and biomass accumulation of C. annuum seedlings under greenhouse conditions. The magnitude of the response depended on both the formulation and dosage. Each commercial formulation exhibited a distinct optimum dosage, with ASCO and BIO performing best at 2 mL L−1 and AQUA, KAT, and SAGA performing best at 3 mL L−1. These findings demonstrate that formulation-specific dosage optimization is more appropriate than applying a universal dosage recommendation across different commercial seaweed biostimulants.
From a practical perspective, the results provide evidence-based guidance for greenhouse Capsicum seedling production by demonstrating that appropriate dosage selection can improve seedling quality while avoiding unnecessary product use. Future studies should validate these dosage recommendations under field conditions and evaluate their effects on transplant establishment, flowering, fruit yield, fruit quality, and physiological mechanisms underlying formulation-specific responses.
Supplementary Materials
The following supporting information can be downloaded at https://www.mdpi.com/article/10.3390/ijpb17080070/s1, Figure S1. Product label and technical information for Asco-Zyme (ASCO; Hifield Organics Pvt. Ltd., Chhatrapati Sambhajinagar, India); Figure S2. Product label and technical information for Aquamarine (AQUA; ICL Group, Pune, India); Figure S3. Product label and technical information for Biovita (BIO; PI Industries Ltd., Gurugram, India); Figure S4. Product label and technical information for Katyayani Seaweed Extract (KAT; Katyayani Organics, New Delhi, India); Figure S5. Product label and technical information for Sagarika (SAGA; Indian Farmers Fertiliser Cooperative Limited (IFFCO), New Delhi, India); Figure S6. Diagnostic plots for assessment of one-way ANOVA assumptions, including quantile–quantile (Q–Q) plots and residual-versus-fitted plots for representative growth traits; Table S1. Results of normality (Shapiro–Wilk) and homogeneity of variance (Levene’s) tests for all measured growth traits; Table S2. Complete one-way ANOVA results for all measured and derived growth traits of C. annuum seedlings; Table S3. Complete Tukey’s honestly significant difference (HSD) pairwise comparisons for all measured and derived growth traits; Data S1. Descriptive statistics (mean, standard deviation, standard error, coefficient of variation, minimum, maximum, and sample size) for all measured and derived growth traits; Data S2. Response index (RI) values relative to the distilled water (CON) and full-strength Hoagland nutrient solution (HG) controls for all measured and derived growth traits; Data S3. Pearson correlation analysis, including correlation coefficients (r), raw p-values, and Benjamini–Hochberg false discovery rate (FDR)-adjusted q-values for the ten directly measured growth traits; Data S4A. Principal component analysis (PCA) explained variance, eigenvalues, and percentage variance explained by each principal component; Data S4B. PCA variable loadings for the ten directly measured growth traits; Data S4C. PCA treatment scores for all experimental treatments; Data S5. Complete TOPSIS calculations, including the decision matrix, normalized decision matrix, weighted normalized matrix, positive and negative ideal solutions, separation distances, relative closeness coefficients, and final treatment rankings.
Author Contributions
Conceptualization, P.R. and L.A.G.; methodology, P.R. and K.B.U.; software, P.R.; validation, P.R. and L.A.G.; formal analysis, P.R., K.B.U., M.A. and I.I.V.E.; investigation, P.R.; resources, L.A.G.; data curation, P.R.; writing—original draft preparation, P.R.; writing—review and editing, P.R. and L.A.G.; visualization, P.R.; supervision, L.A.G.; project administration, P.R. All authors have read and agreed to the published version of the manuscript.
Funding
This research did not receive any external funding.
Data Availability Statement
The original contributions presented in this study are included in this article/supplementary material. Further inquiries should be directed to the corresponding authors.
Acknowledgments
The authors used Paperpal (Version 2025.3; Cactus Communications, Mumbai, India), an AI-assisted language editing tool, to improve the grammar, language, and clarity of this manuscript. The authors reviewed and edited all suggested changes and took full responsibility for the final content of the manuscript. All scientific analyses, interpretations, conclusions, and intellectual contributions were performed by the authors.
Conflicts of Interest
The authors declare no conflicts of interest.
References
- Renganathan, P.R.; Ruíz-Alvarado, C.; Hernández-Montiel, L.G.; Rueda-Puente, E.O. Evaluation of genetic diversity in germplasm of paprika (Capsicum spp.) using random amplified polymorphic DNA (RAPD) markers. J. Plant Sci. Phytopathol. 2017, 1, 080–086. [Google Scholar] [CrossRef] [Scilit]
- Hernández-Hernández, B.N.; Delgado-Alvarado, A.; Tornero-Campante, M.A.; Herrera-Cabrera, B.E.; Jaramillo-Villanueva, J.L.; Lagunes-Espinoza, L.D. Capsicum annuum L.: Phenological and yield performance of native and commercial genotypes under open-field and low-technology greenhouse hydroponic systems. Horticulturae 2026, 12, 655. [Google Scholar] [CrossRef] [Scilit]
- Gallegos-Cedillo, V.M.; Nájera, C.; Gruda, N.S.; Signore, A.; Gallegos, J.; Rodríguez, R.; Ochoa, J.; Egea-Gilabert, C.; Fernandez, J.A. An in-depth analysis of sustainable practices in vegetable seedling nurseries: A review. Sci. Hortic. 2024, 334, 113342. [Google Scholar] [CrossRef] [Scilit]
- Jankauskienė, J.; Laužikė, K. Effect of sweet pepper (Capsicum annuum L.) seedling age and cultivation method on seedling quality, photosynthetic parameters and productivity. Agronomy 2023, 13, 2255. [Google Scholar] [CrossRef] [Scilit]
- Daryabari, R.; Movahedi, Z.; Moieni, A. Chemical and biological fertilizers affect the seedling development of bell pepper. J. Plant Physiol. Breed. 2025, 15, 93–113. [Google Scholar] [CrossRef]
- Tahmasebi, A.; Mirzaalian Dastjerdi, A.; Jamali, B. Microbial-based biological treatments improved the nutritional, nutraceutical and functional properties of greenhouse sweet pepper (Capsicum annuum L.). Front. Sustain. Food Syst. 2023, 7, 1145972. [Google Scholar] [CrossRef] [Scilit]
- Kim, H.N.; Seok, Y.J.; Park, G.M.; Vyavahare, G.; Park, J.H. Monitoring of plant-induced electrical signals of pepper plants (Capsicum annuum L.) according to urea fertilizer application. Sci. Rep. 2023, 13, 291. [Google Scholar] [CrossRef] [Scilit] [PubMed]
- Pimentel-Pujols, Á.R.; García, J.M.; Borrás, F.; Fernández-López, J. Effects of fertigation programs and substrates on growth, fruit quality, and yield of bell pepper (Capsicum annuum) under greenhouse conditions. Foods 2026, 15, 505. [Google Scholar] [CrossRef] [Scilit] [PubMed]
- Sini, H.N.; Barzegar, R.; Mashaee, S.S.; Ghahsare, M.G.; Mousavi-Fard, S.; Mozafarian, M. Effects of biofertilizer on the production of bell pepper (Capsicum annuum L.) in greenhouse. J. Agric. Food Res. 2024, 16, 101060. [Google Scholar] [CrossRef] [Scilit]
- Renganathan, P.; Gaysina, L.A.; Sainz-Hernández, J.C.; Puente, E.O.R. Molecular Basis and Mechanistic Insights into Ascophyllum nodosum Extract-Mediated Regulation of Plant Growth, Nutrient Acquisition, and Stress Responses. Plants 2026, 15, 1913. [Google Scholar] [CrossRef] [Scilit] [PubMed]
- Renganathan, P.; Bustamante, G.A.; Ruíz, F.E.; Puente, E.O. Microbial diversity and functional profiles of three commercial biofertilizers and impacts on the bacterial communities of avocado rhizosphere soil. Cienc. Tecnol. Agropecu. 2024, 25, 2. [Google Scholar] [CrossRef] [Scilit]
- Prabhaharan, R.; Borboa-Flores, J.; Rosas-Burgos, E.C.; Cárdenas-López, J.L.; Ortega-García, J.; Rueda-Puente, E.O. Phaseolus acutifolius associated with Bacillus amyloliquefaciens and Azospirillum halopraeferens under salinity conditions. Biotecnia 2019, 21, 127–132. [Google Scholar] [CrossRef] [Scilit]
- Renganathan, P.; Gaysina, L.A.; Rueda-Puente, E.O. Microbial biofertilizers for salinity stress mitigation in hydroponic systems. Curr. Issues Mol. Biol. 2025, 47, 1029. [Google Scholar] [CrossRef] [Scilit] [PubMed]
- Gehlot, P.; Yadav, J.; Jain, T. Synergistic role of plant growth-promoting rhizobacteria and fungi in biofertilizer development for chilli (Capsicum annuum L.): Mechanistic and functional insights. Front. Plant Sci. 2026, 17, 1844723. [Google Scholar] [CrossRef] [Scilit] [PubMed]
- Ajeethan, N.; Abbey, L.; Yurgel, S.N. Role of plant growth-promoting microbes in plant growth and development. Appl. Microbiol. 2026, 6, 34. [Google Scholar] [CrossRef] [Scilit]
- Sakthivel, A.; Balasubramaniam, S.; Eswaran, S.P.; Ganeshan, S.; Jesudass, J.S.; Gnanajothi, K.; Yin, C.; Chiuta, N.E.; Chang, S.W.; Balasubramani, R.; et al. Implication of plant growth-promoting microorganisms and nanofertilizer in millets: A review on growth promotion and crop improvement. Cogent Food Agric. 2026, 12, 2617645. [Google Scholar] [CrossRef] [Scilit]
- Ali, O.; Ramsubhag, A.; Jayaraman, J. Biostimulant properties of seaweed extracts in plants: Implications towards sustainable crop production. Plants 2021, 10, 531. [Google Scholar] [CrossRef] [Scilit] [PubMed]
- Rabhi, M.L.; Derbak, L.; Bendif, H.; Boufahja, F.; Abu-Elsaoud, A.M.; Garzoli, S. Seaweed-derived biostimulants for sustainable crop production: A review. J. Biotechnol. 2025, 408, 201–216. [Google Scholar] [CrossRef] [Scilit] [PubMed]
- Shukla, P.S.; Mantin, E.G.; Adil, M.; Bajpai, S.; Critchley, A.T.; Prithiviraj, B. Ascophyllum nodosum-based biostimulants: Sustainable applications in agriculture for the stimulation of plant growth, stress tolerance, and disease management. Front. Plant Sci. 2019, 10, 655. [Google Scholar] [CrossRef] [Scilit] [PubMed]
- Ramdin, T.M.; Ali, O.; Ramsubhag, A.; Jayaraman, J. Sargassum spp. and Ascophyllum nodosum seaweed extract formulations improve plant growth and alter the bacterial dynamics in hydroponically cultivated lettuce. J. Appl. Phycol. 2024, 36, 3769–3782. [Google Scholar] [CrossRef] [Scilit]
- Ali, O.; Ramsubhag, A.; Ramnarine, S.D., Jr.; Farrell, A.D.; Jayaraman, J. Capsicum annuum L. plants treated with seaweed extracts (Sargassum spp. and Ascophyllum nodosum) show changes in the root and rhizosphere bacterial microbiome and improved performance under drought conditions. J. Appl. Phycol. 2025, 37, 4631–4654. [Google Scholar] [CrossRef] [Scilit]
- Renganathan, P.; Borisovna, U.K.; Isidorovich, V.E.; Mufazalova, A.; Sukhanova, N.V.; Gaysina, L.A. Comparative evaluation of commercial seaweed extract formulations on germination, biomass accumulation and early seedling growth in Capsicum annuum. Horticulturae 2026, 12, 799. [Google Scholar] [CrossRef] [Scilit]
- Ashour, M.; Hassan, S.M.; Elshobary, M.E.; Ammar, G.A.; Gaber, A.; Alsanie, W.F.; Mansour, A.T.; El-Shenody, R. Impact of commercial seaweed liquid extract (TAM®) biostimulant and its bioactive molecules on growth and antioxidant activities of hot pepper (Capsicum annuum). Plants 2021, 10, 1045. [Google Scholar] [CrossRef] [Scilit] [PubMed]
- Sharmin, S.; Islam, L.; Al Kafi, A.; Miah, M.S.; Chakma, M. Efficacy of humic acid and seaweed extracts on the growth, yield and biochemical properties of chilli. Adv. Hortic. Sci. 2025, 39, 305–316. [Google Scholar] [CrossRef] [Scilit]
- Valverde, S.; Williams, P.L.; Mayans, B.; Lucena, J.J.; Hernández-Apaolaza, L. Comparative study of the chemical composition and antifungal activity of commercial brown seaweed extracts. Front. Plant Sci. 2022, 13, 1017925. [Google Scholar] [CrossRef] [Scilit] [PubMed]
- Pérez-Oñate, C.J.; Nicolau, M.C.; Ferreira, T.C.; Broetto, F.; Bossolani, J.W.; Montes de Oca, M.; Heitmann, W.; Alves, C.J.; Bettini, M.D.; Moreno-Poveda, G.A.; et al. Crop yield responses to seaweed extract-based biostimulants depend on application strategy, formulation, and extraction methods: A meta-analysis. Front. Plant Sci. 2026, 17, 1803269. [Google Scholar] [CrossRef] [Scilit] [PubMed]
- Renganathan, P.; Yakupova, A.; Filippov, A.; Larionova, I.; Sushchenko, R.; Mufazalova, A.; Khilazhetdinova, L.; Gaysina, K.; Gaysina, L.A. Strain-specific microalgal and cyanobacterial suspensions modulate germination kinetics and early seedling vigor in cucumber. Horticulturae 2026, 12, 414. [Google Scholar] [CrossRef] [Scilit]
- Poorter, H.; Nagel, O. The role of biomass allocation in the growth response of plants to different levels of light, CO2, nutrients and water: A quantitative review. Aust. J. Plant Physiol. 2000, 27, 595–607. [Google Scholar] [CrossRef] [Scilit]
- Pérez-Harguindeguy, N.; Díaz, S.; Garnier, E.; Lavorel, S.; Poorter, H.; Jaureguiberry, P.; Bret-Harte, M.S.; Cornwell, W.K.; Craine, J.M.; Gurvich, D.E.; et al. New handbook for standardised measurement of plant functional traits worldwide. Aust. J. Bot. 2013, 61, 167–234. [Google Scholar] [CrossRef] [Scilit]
- Deolu-Ajayi, A.O.; van der Meer, I.M.; van der Werf, A.; Karlova, R. The power of seaweeds as plant biostimulants to boost crop production under abiotic stress. Plant Cell Environ. 2022, 45, 2537–2553. [Google Scholar] [CrossRef] [Scilit] [PubMed]
- Özbay, N.; Demirkiran, A.R. Enhancement of growth in ornamental pepper (Capsicum annuum L.) plants with application of a commercial seaweed product, Stimplex®. Appl. Ecol. Environ. Res. 2019, 17, 4023–4035. [Google Scholar] [CrossRef] [Scilit]
- Kumari, S.; Sehrawat, K.D.; Phogat, D.; Sehrawat, A.R.; Chaudhary, R.; Sushkova, S.N.; Voloshina, M.S.; Rajput, V.D.; Shmaraeva, A.N.; Marc, R.A.; et al. Ascophyllum nodosum (L.) Le Jolis, a pivotal biostimulant toward sustainable agriculture: A comprehensive review. Agriculture 2023, 13, 1179. [Google Scholar] [CrossRef] [Scilit]
- Akter, Z.; Jannat, S.A.; Shibly, S.M.; Sultana, A.; Amran, A.H.; Faria, J.H.; Yeasmin, S.; Anwar, M.P. Biostimulatory influence of commercial seaweed extract on seed emergence, seedling growth, and vigor of winter rice. Phyton 2026, 95, 1–16. [Google Scholar] [CrossRef] [Scilit]
- Davis, A.S.; Jacobs, D.F. Quantifying root system quality of nursery seedlings and relationship to outplanting performance. New For. 2005, 30, 295–311. [Google Scholar] [CrossRef] [Scilit]
- Poorter, H.; Niklas, K.J.; Reich, P.B.; Oleksyn, J.; Poot, P.; Mommer, L. Biomass allocation to leaves, stems and roots: Meta-analyses of interspecific variation and environmental control. New Phytol. 2012, 193, 30–50. [Google Scholar] [CrossRef] [Scilit] [PubMed]
- Lam, V.P.; Bok, G.; Loi, D.N.; Do, M.C.; Park, J. Seaweed foliar biostimulants improve growth and phytochemicals of Thai basil (Ocimum basilicum L.) in a plant factory. Plants 2025, 14, 3271. [Google Scholar] [CrossRef] [Scilit] [PubMed]
- Staykov, N.; Kanojia, A.; Lyall, R.; Ivanova, V.; Alseekh, S.; Petrov, V.; Gechev, T. Sustainable agriculture through seaweed biostimulants: A two-year study demonstrates yield enhancement in pepper and eggplant. Front. Plant Sci. 2025, 16, 1655340. [Google Scholar] [CrossRef] [Scilit] [PubMed]
- Navarro-Zapata, U.; Navarro-Pérez, V.; Ahmad, I.; Perez-Millan, R.; García-Sánchez, F.; Simón-Grao, S. Foliar application of aqueous extracts from the algal biomass of Laminaria digitata and Phaeodactylum tricornutum as a strategy to mitigate boron toxicity in tomato (Solanum lycopersicum L.). Horticulturae 2025, 11, 1398. [Google Scholar] [CrossRef] [Scilit]
- Grossnickle, S.C.; MacDonald, J.E. Seedling quality: History, application, and plant attributes. Forests 2018, 9, 283. [Google Scholar] [CrossRef] [Scilit]
- Guimaraes, Z.T.; da Silva, D.C.; Ferreira, M.J. Seedling quality and short-term field performance of three Amazonian forest species as affected by site conditions. iForest 2024, 17, 80–86. [Google Scholar] [CrossRef] [Scilit]

Disclaimer/Publisher’s Note: The statements, opinions and data contained in all publications are solely those of the individual author(s) and contributor(s) and not of MDPI and/or the editor(s). MDPI and/or the editor(s) disclaim responsibility for any injury to people or property resulting from any ideas, methods, instructions or products referred to in the content. |
© 2026 by the authors. Licensee MDPI, Basel, Switzerland. This article is an open access article distributed under the terms and conditions of the Creative Commons Attribution (CC BY) license.