


Abstract
Antimicrobial resistance (AMR) is accelerating and driven by antimicrobial use. Hospital consumption and resistance data remain scarce in Serbia. This retrospective study assessed the prevalence of infectious agents among hospitalized patients (2019–2022), distribution and AMR rates of Escherichia coli and Klebsiella pneumoniae, antimicrobial consumption, and associations between AMR and antibiotic use (Spearman’s correlation). All bacterial isolates were included for species-frequency analyses. For AMR and specimen distribution, repeat isolates of E. coli and K. pneumoniae per patient were excluded. Among 10,780 isolates, E. coli remained most frequent (24.7% in 2019; 24.3% in 2022), whereas K. pneumoniae increased from 7.7% to 16.9% (p < 0.001). E. coli resistance to cephalosporins, fluoroquinolones, and piperacillin/tazobactam increased significantly from 2019 to 2022 (p < 0.05). K. pneumoniae resistance increased to most agents (p < 0.001), with meropenem resistance rising from 11.7% to 52.0%. Multidrug resistance rose from 27.3% to 35.4% for E. coli (2020–2022; p = 0.006) and from 62.4% to 82.9% for K. pneumoniae (2019–2022; p < 0.001). Total hospital antibiotic consumption nearly doubled from 57 to 111.8 Defined Daily Doses per 100 bed days (2019–2021) and decreased to 52.0 (2022). Temporal concurrence of increased antimicrobial use during COVID-19 and escalating resistance underscores the need for strengthened surveillance and stewardship.
1. Introduction
Antimicrobial resistance (AMR) is no longer a distant concern—it is already having a serious impact on global health [1]. According to the European Centre for Disease Prevention and Control (ECDC), in 2020 alone, bacterial AMR accounted for over 38,000 deaths within the European Union/European Economic Area (EU/EEA) [2]. In 2021, bacterial AMR was linked to 4.71 million deaths worldwide, with 1.14 million of those directly caused by resistant infections [3]. If current trends continue, projections suggest that by 2050, AMR could be directly responsible for 1.91 million deaths and associated with a total of 8.22 million deaths globally, highlighting the urgent need for a unified global response [3]. The rapid rise of AMR has largely been fueled by the excessive and inappropriate use of antimicrobials in human medicine, veterinary sectors, agriculture, and the environment [4].
Resistance to last-resort antimicrobials is projected to rise substantially by 2035, with second-line antimicrobial resistance increasing by nearly 45% and third-line resistance, such as to carbapenems, potentially tripling compared to 2005 levels [5]. According to the Organization for Economic Co-operation and Development’s (OECD) 2023 analysis, AMR in the EU/EEA countries imposes an estimated EUR 11.7 billion annual burden (approximately EUR 24 per capita) [5]. In the EU/EEA, AMR-related infections are estimated to result in approximately 9.5 million additional hospital bed–days annually, placing significant strain on hospital resources [5].
The World Health Organization (WHO) has classified carbapenem-resistant and third-generation cephalosporin-resistant Enterobacterales as critical priority pathogens [6]. An ECDC analysis of the AMR-attributable health burden in the EU/EEA during 2016–2020 identified third-generation cephalosporin-resistant E. coli and K. pneumoniae as two of the three leading pathogen–drug combinations [2]. Notably, E. coli and K. pneumoniae are among the most common causative agents of healthcare-associated infections overall across EU/EEA countries, underscoring their relevance in regional surveillance and infection-prevention strategies [7]. According to ECDC data for 2022, K. pneumoniae ranks third among the causes of bloodstream infections, while E. coli occupies the first position [8]. In addition to their recognized public health importance, E. coli and K. pneumoniae were selected because they are the most common clinically significant Enterobacterales isolated from hospitalized patients [7] and key targets for empirical therapy and antimicrobial stewardship.
The use of antimicrobials represents one of the most important modifiable drivers of AMR [9]. In 2019, antimicrobial consumption in Serbia was already among the highest in Europe, reaching 26.6 Defined Daily Doses (DDD) per 1000 inhabitants per day [10]. However, the Coronavirus Disease 2019 (COVID-19) pandemic hindered efforts to promote rational antimicrobial prescribing. Up to three-quarters of patients with COVID-19 received antimicrobials, even though coinfections occurred in only a small proportion of cases [11]. This global pattern reflects the broader challenge of antimicrobial overuse and underscores the importance of robust national surveillance, particularly as pandemic-related shifts in antimicrobial consumption may have influenced subsequent resistance trends.
At the national level in Serbia, systematic monitoring of antimicrobial consumption in the hospital sector remains unavailable, as does systematic and continuous surveillance of resistance among non-invasive isolates. Moreover, most published hospital AMR data in Serbia originate from tertiary-care centers [12,13], whereas secondary-care hospitals remain underrepresented despite their important role in inpatient care and antibiotic use.
The aims of this study were to evaluate the following: (i) the prevalence of causative bacterial agents of infections among hospitalized patients; (ii) the frequency and distribution of first isolates of E. coli and K. pneumoniae and their distribution by specimen type (invasive and non-invasive) and hospital ward; (iii) antimicrobial resistance rates and multidrug resistance trends in E. coli and K. pneumoniae; (iv) hospital antimicrobial consumption during 2019–2022; and (v) the association between antimicrobial consumption and resistance in E. coli and K. pneumoniae.
Hypothesis 1.
We hypothesized that antimicrobial resistance rates in E. coli and K. pneumoniae increased over the study period (2019–2022) and were correlated with annual hospital antimicrobial consumption.
2. Materials and Methods
2.1. Study Design and Bacterial Isolates
This retrospective observational study covered the period from 1 January 2019 to 31 December 2022 and included all bacterial isolates from hospitalized patients recorded in the microbiology database of General Hospital Užice. No a priori sample size calculation was performed, as all available isolates were included. The study period (2019–2022) was selected to include a pre-pandemic baseline year (2019), the pandemic years (2020–2021), and the subsequent year (2022), enabling assessment of temporal changes in antimicrobial consumption and resistance trends as routine microbiology and stewardship monitoring indicated notable changes in resistance patterns and antimicrobial consumption during these years. The hospital is a secondary-level healthcare facility in western Serbia with 728 beds, including 38 intensive care unit (ICU) beds. During the COVID-19 pandemic, the hospital capacity was temporarily expanded by 152 beds in an auxiliary facility (COVID hospital) from July 2020. Hospital workflows were reorganized to accommodate COVID-19 care, including the establishment of dedicated COVID-19 wards and partial reallocation of ICU, surgical, and maternity capacities. These structural changes may have influenced patient case-mix and microbiological sampling patterns during the study period. Only isolates deemed clinically significant and likely causative agents of infection, according to routine clinical microbiological assessment, were included. Isolates representing expected physiological microbiota at the sampling site and/or recovered in non-significant quantities were excluded. For non-invasive specimens, the distinction between infection and colonization was determined using routine clinical microbiology criteria, taking into account relevant factors for each specimen type, including species identity, number of isolates, leukocyte presence, and dominance of the isolate in culture. Isolates interpreted as colonizers were excluded. Formal clinical diagnostic criteria were not applied. Bacterial species frequencies were determined for the full dataset, while antimicrobial susceptibility data and specimen-type distribution were analyzed specifically for E. coli and K. pneumoniae, for which only the first isolate per patient was considered. The isolate selection process is presented in Appendix A, Figure A1.
Species identification was carried out using a combination of conventional bacteriological methods—Gram staining, colony morphology assessment, and biochemical testing—and automated analysis with the VITEK 2 system (bioMérieux, Marcy-l’Étoile, France), according to the manufacturer’s instructions. Antimicrobial susceptibility testing was conducted with disk diffusion and VITEK 2 (AST GN76, GN204) in accordance with European Committee on Antimicrobial Susceptibility Testing (EUCAST) guidelines [14]. Colistin susceptibility was determined by broth microdilution (Liofilchem, Roseto degli Abruzzi, Italy). Due to limited resources, colistin testing was not performed routinely for all isolates; it was conducted primarily for isolates resistant to all other tested agents and/or isolates recovered from critically ill patients where colistin was considered a potential therapeutic option. Test availability improved in 2021–2022, resulting in a higher number of isolates tested in these years. Therefore, colistin results were interpreted descriptively and were not used for temporal trend inference. Multidrug resistance (MDR) was defined according to Magiorakos et al. [15] as resistance to ≥1 agent in ≥3 antimicrobial categories.
In accordance with the methodology of the European Antimicrobial Resistance Surveillance Network (EARS-Net), invasive isolates were defined as those obtained normally sterile sites (e.g., blood, cerebrospinal fluid), while bacteria derived from colonized specimens were classified as non-invasive [16]. Invasive vs. non-invasive stratification was prespecified and applied to specimen-type distribution analyses. Antimicrobial resistance rates were analysed using the overall E. coli and K. pneumoniae first-isolate-per-patient datasets (invasive and non-invasive isolates), because the number of invasive isolates per year was low and would limit the robustness of stratified analyses.
All patient data were de-identified and re-coded before data evaluation.
2.2. Antimicrobial Consumption
Hospital-level data on antimicrobials for systemic use (Anatomical Therapeutic Chemical (ATC) group J01) were obtained from the pharmacy’s electronic database for 2019–2022. The number of hospital bed–days was obtained from the hospital’s administrative records. Consumption was classified according to the WHO ATC classification and the DDD methodology, with consumption expressed as DDDs per 100 bed–days (DDD/100BD) [17]. Pharmacy consumption data were available only as aggregated annual hospital-level totals (without ward- or patient-level stratification).
Broad-spectrum antimicrobial use (glycopeptides, 3rd–4th generation cephalosporins, monobactams, carbapenems, fluoroquinolones, polymyxins, piperacillin–tazobactam, linezolid) was analysed as a secondary indicator according to the European Surveillance of Antimicrobial Consumption Network (ESAC-Net) methodology [18], with a modification applied in calculating antimicrobial consumption. While ESAC reports consumption as DDDs per 1000 inhabitants per day, in this study, it was expressed as DDD/100BD. Given that both metrics represent relative measures of consumption, this modification was considered appropriate for the hospital setting.
The Drug Utilization 75% (DU75%) metric was applied to identify the antimicrobials accounting for 75% of total consumption and to describe prescribing concentration, thereby supporting stewardship prioritization [10]. DU75% was not intended as a direct measure of resistance drivers.
This study was approved by the Ethics Committee of the Healthcare Center Užice, General Hospital Užice (Number 1131/6, Date 10 February 2025).
2.3. Study Outcomes
The co-primary outcomes of this study were (i) antimicrobial resistance patterns and temporal trends among E. coli and K. pneumoniae isolates and (ii) hospital antimicrobial consumption, expressed as DDD/100BD and DU75%. Secondary outcomes included specimen-type distribution (invasive vs. non-invasive), ward-level distribution, prevalence of multidrug resistance, and associations between antimicrobial consumption and resistance.
2.4. Statistical Analysis
Descriptive statistics were used to summarize categorical variables as absolute and relative frequencies, n (%). Differences in proportions across study years were assessed using Pearson’s chi-squared test (overall 2019–2022 and selected pairwise year-to-year comparisons where relevant). Associations between antimicrobial consumption and resistance rates were assessed using Spearman’s rank correlation coefficient. Pairwise comparisons of column proportions for year-to-year resistance proportions were adjusted for multiple testing using the Bonferroni correction. Statistical analysis was performed using IBM SPSS Statistics for Windows, version 23.0 (IBM Corp., Armonk, NY, USA). The significance level was set at α = 0.05.
3. Results
The total number of hospitalized patients was 27,067 in 2019, 24,503 in 2020, 28,946 in 2021, and 27,760 in 2022. The number of COVID-19-positive hospitalized patients was 0 in 2019, 3263 in 2020, 7278 in 2021, and 1988 in 2022. Total hospital bed–days were 150,756, 133,332, 177,217, and 138,652, respectively. The lowest number of patients was recorded in 2020, representing a 9.5% decrease (2020) and a 6.9% increase (2021), respectively, compared with 2019.
The microbiology dataset did not allow reliable linkage of all isolates to unique patient identifiers across the full study period; therefore, patient counts are reported at the hospital level.
3.1. Comparative Distribution of Escherichia coli and Klebsiella pneumoniae Isolates
A total of 10,780 clinically significant isolates were identified during the study period, distributed as follows: 3331 in 2019, 2305 in 2020, 2440 in 2021, and 2704 in 2022.
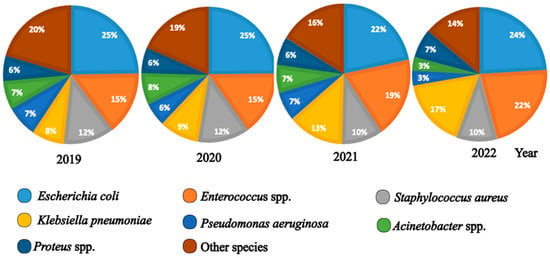
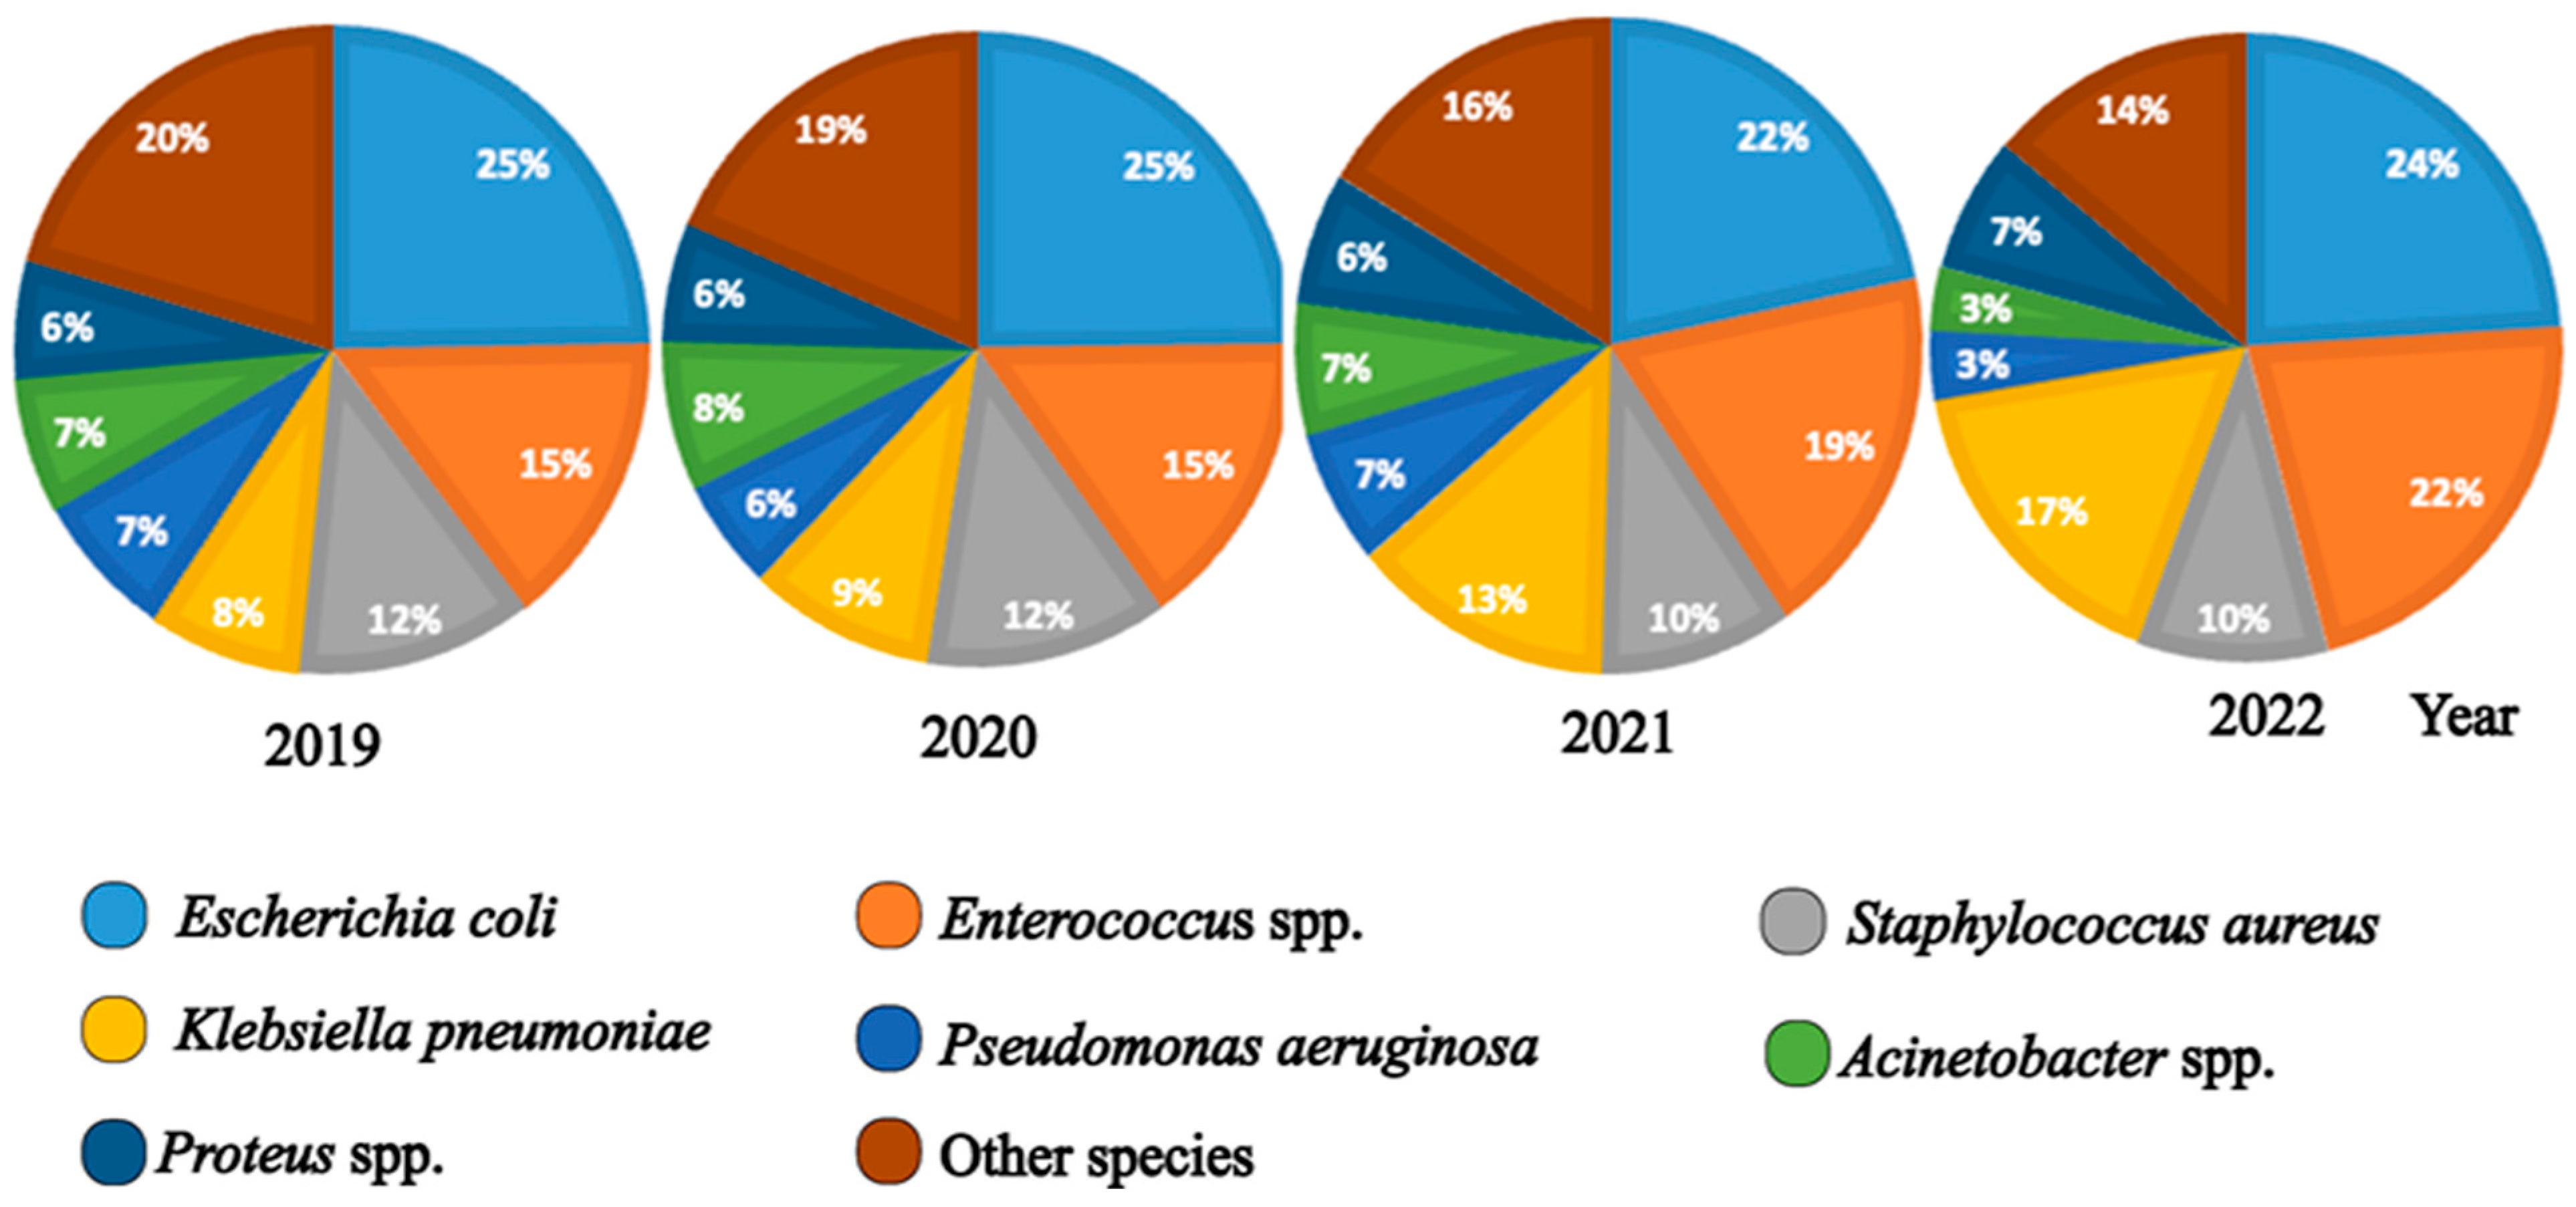
Each pie chart represents the annual distribution of the most frequently isolated bacterial species as a proportion of the total number of isolates. Colours indicate different bacterial taxa: Escherichia coli, Klebsiella pneumoniae, Pseudomonas aeruginosa, Enterococcus spp., Staphylococcus aureus, Acinetobacter spp., Proteus spp., and other species. The “other species” category includes taxa representing <5% of all isolates. In the final chart, Acinetobacter spp. and P. aeruginosa were also <5% but were retained to illustrate their temporal trends relative to previous years.
E. coli remained the most frequently isolated species throughout all years. The proportion of E. coli among total isolates differed significantly across the study period (2019–2022) (p = 0.019). Its proportion declined from 24.7% (n = 824) in 2019 to 21.6% (n = 526) in 2021 (p = 0.005), while no significant differences were observed when comparing 2020 (24.8%, n = 572; p = 0.972) or 2022 (24.3%, n = 656; p = 0.690) with the baseline year.
In contrast, K. pneumoniae showed a steady and statistically significant increase, rising from 7.7% (n = 258) in 2019 to 16.9% (n = 457) in 2022 (p < 0.001), showing a marked increase in its annual proportion (Figure 1, Table A1).
Figure 1.
Distribution of the most frequently isolated bacterial species among all isolates, 2019–2022.
Among all isolates, 2578 E. coli and 1245 K. pneumoniae isolates were identified. After excluding repeated isolates from the same patient, 2217 E. coli and 935 K. pneumoniae first isolates were included in the susceptibility and specimen distribution analyses (Figure A1).
3.2. Specimen Distribution of Escherichia coli and Klebsiella pneumoniae
Subsequent resistance analyses were performed on the overall first-isolate-per-patient datasets for each species (combined invasive and non-invasive isolates).
For E. coli, invasive isolates accounted for 3.4% (n = 24) in 2019, 5.5% (n = 26) in 2020, 5.9% (n = 27) in 2021, and 5.4% (n = 31) in 2022, with no significant differences observed across study years (p = 0.155). Among non-invasive isolates, urine specimens predominated throughout the study period (68.2–69.2%), followed by skin and soft tissue samples (14.1–16.1%). The distribution of other specimen types is presented in Table 1. The proportions of urinary isolates (p = 0.170) and isolates from skin and soft tissue samples (p = 0.835) did not differ significantly between years.
Table 1.
Distribution of clinical isolates of Escherichia coli and Klebsiella pneumoniae by specimen type, 2019–2022.
For K. pneumoniae, invasive isolates increased from 6.1% (n = 12) in 2019 to 9.3% (n = 31) in 2022; however, this trend was not statistically significant over the study period (p = 0.40). Among non-invasive isolates, urine specimens were the most frequent source, increasing from 42.1% (n = 83) in 2019 to 56.9% (n = 190) in 2022, with a statistically significant difference between years (p = 0.012). Skin and soft tissue samples represented the second most common source (19.8–28.9%), without significant variation over time (p = 0.088). Isolates from the lower respiratory tract accounted for 6.1–11.7% of cases, with no significant differences observed over the entire study period (p = 0.101). However, a significant increase was noted between 2021 and 2022, from 6.1% (n = 15) to 10.2% (n = 34) (p = 0.045) (Table 1).
3.3. Ward Distribution of Escherichia coli and Klebsiella pneumoniae
Escherichia coli was most frequently recovered from the Internal Medicine department across all years (22.0–26.3%; p = 0.411), followed by Neurology (15.0–18.7%; p = 0.278). Substantial proportions were also observed in Surgery (12.4–19.1%), where the distribution differed significantly over time (p = 0.019), increasing in 2019–2020 and slightly decreasing in 2021–2022. Obstetrics and Gynecology accounted for 8.4–12.3% of noted isolates (p = 0.128). In the ICU and Infectious Diseases, smaller yet consistent proportions were noted (approximately 3–6%), with isolates in ICU exhibiting significant variation throughout the study period (p = 0.013), declining from 4.9% in 2019 to 3.1% and 2.2% in 2020–2021, followed by an increase in 2022 (5.9%). In the Infectious Diseases Department, proportions remained consistent without significant variation (p = 0.913) (Table 2).
Table 2.
Distribution of clinical isolates of Escherichia coli and Klebsiella pneumoniae by ward type, 2019–2022.
K. pneumoniae isolates were most frequently recovered from Surgery (14.1–18.4%, p = 0.490) and the ICU (10.6–13.5%, p = 0.659) across the study period, with a marked increase in the contribution of Infectious Diseases in 2021–2022 (16.4%, n = 40 and 16.2%, n = 54, respectively) compared with 2019–2020 (6.1%, n = 12 and 3.8%, n = 6, respectively), which was statistically significant (p < 0.001). Neurology also increased over time (2019: 7.6%, n = 15 to 2022: 16.5%, n = 55), also marked as statistically significant (p = 0.026). However, Internal Medicine (2019: 13.2%, n = 26; 2020: 15.6%, n = 25; 2021: 13.5%, n = 33; 2022: 10.2%, n = 34, p = 0.340) and Urology (2019: 13.2%, n = 26; 2020: 10.6%, n = 17; 2021: 5.7%, n = 14; 2022: 10.2%, n = 34, p = 0.062) consistently accounted for a substantial proportion of isolates, consistently accounted for substantial proportions of isolates without statisticaly significant variation.
Across 2019–2022, K. pneumoniae was proportionally more frequent in the ICU than E. coli (12.2% vs. 4.2%), showing a borderline difference that did not meet the predefined threshold for statistical significance (p = 0.051).
3.4. Resistance of Escherichia coli Isolates to Antimicrobials
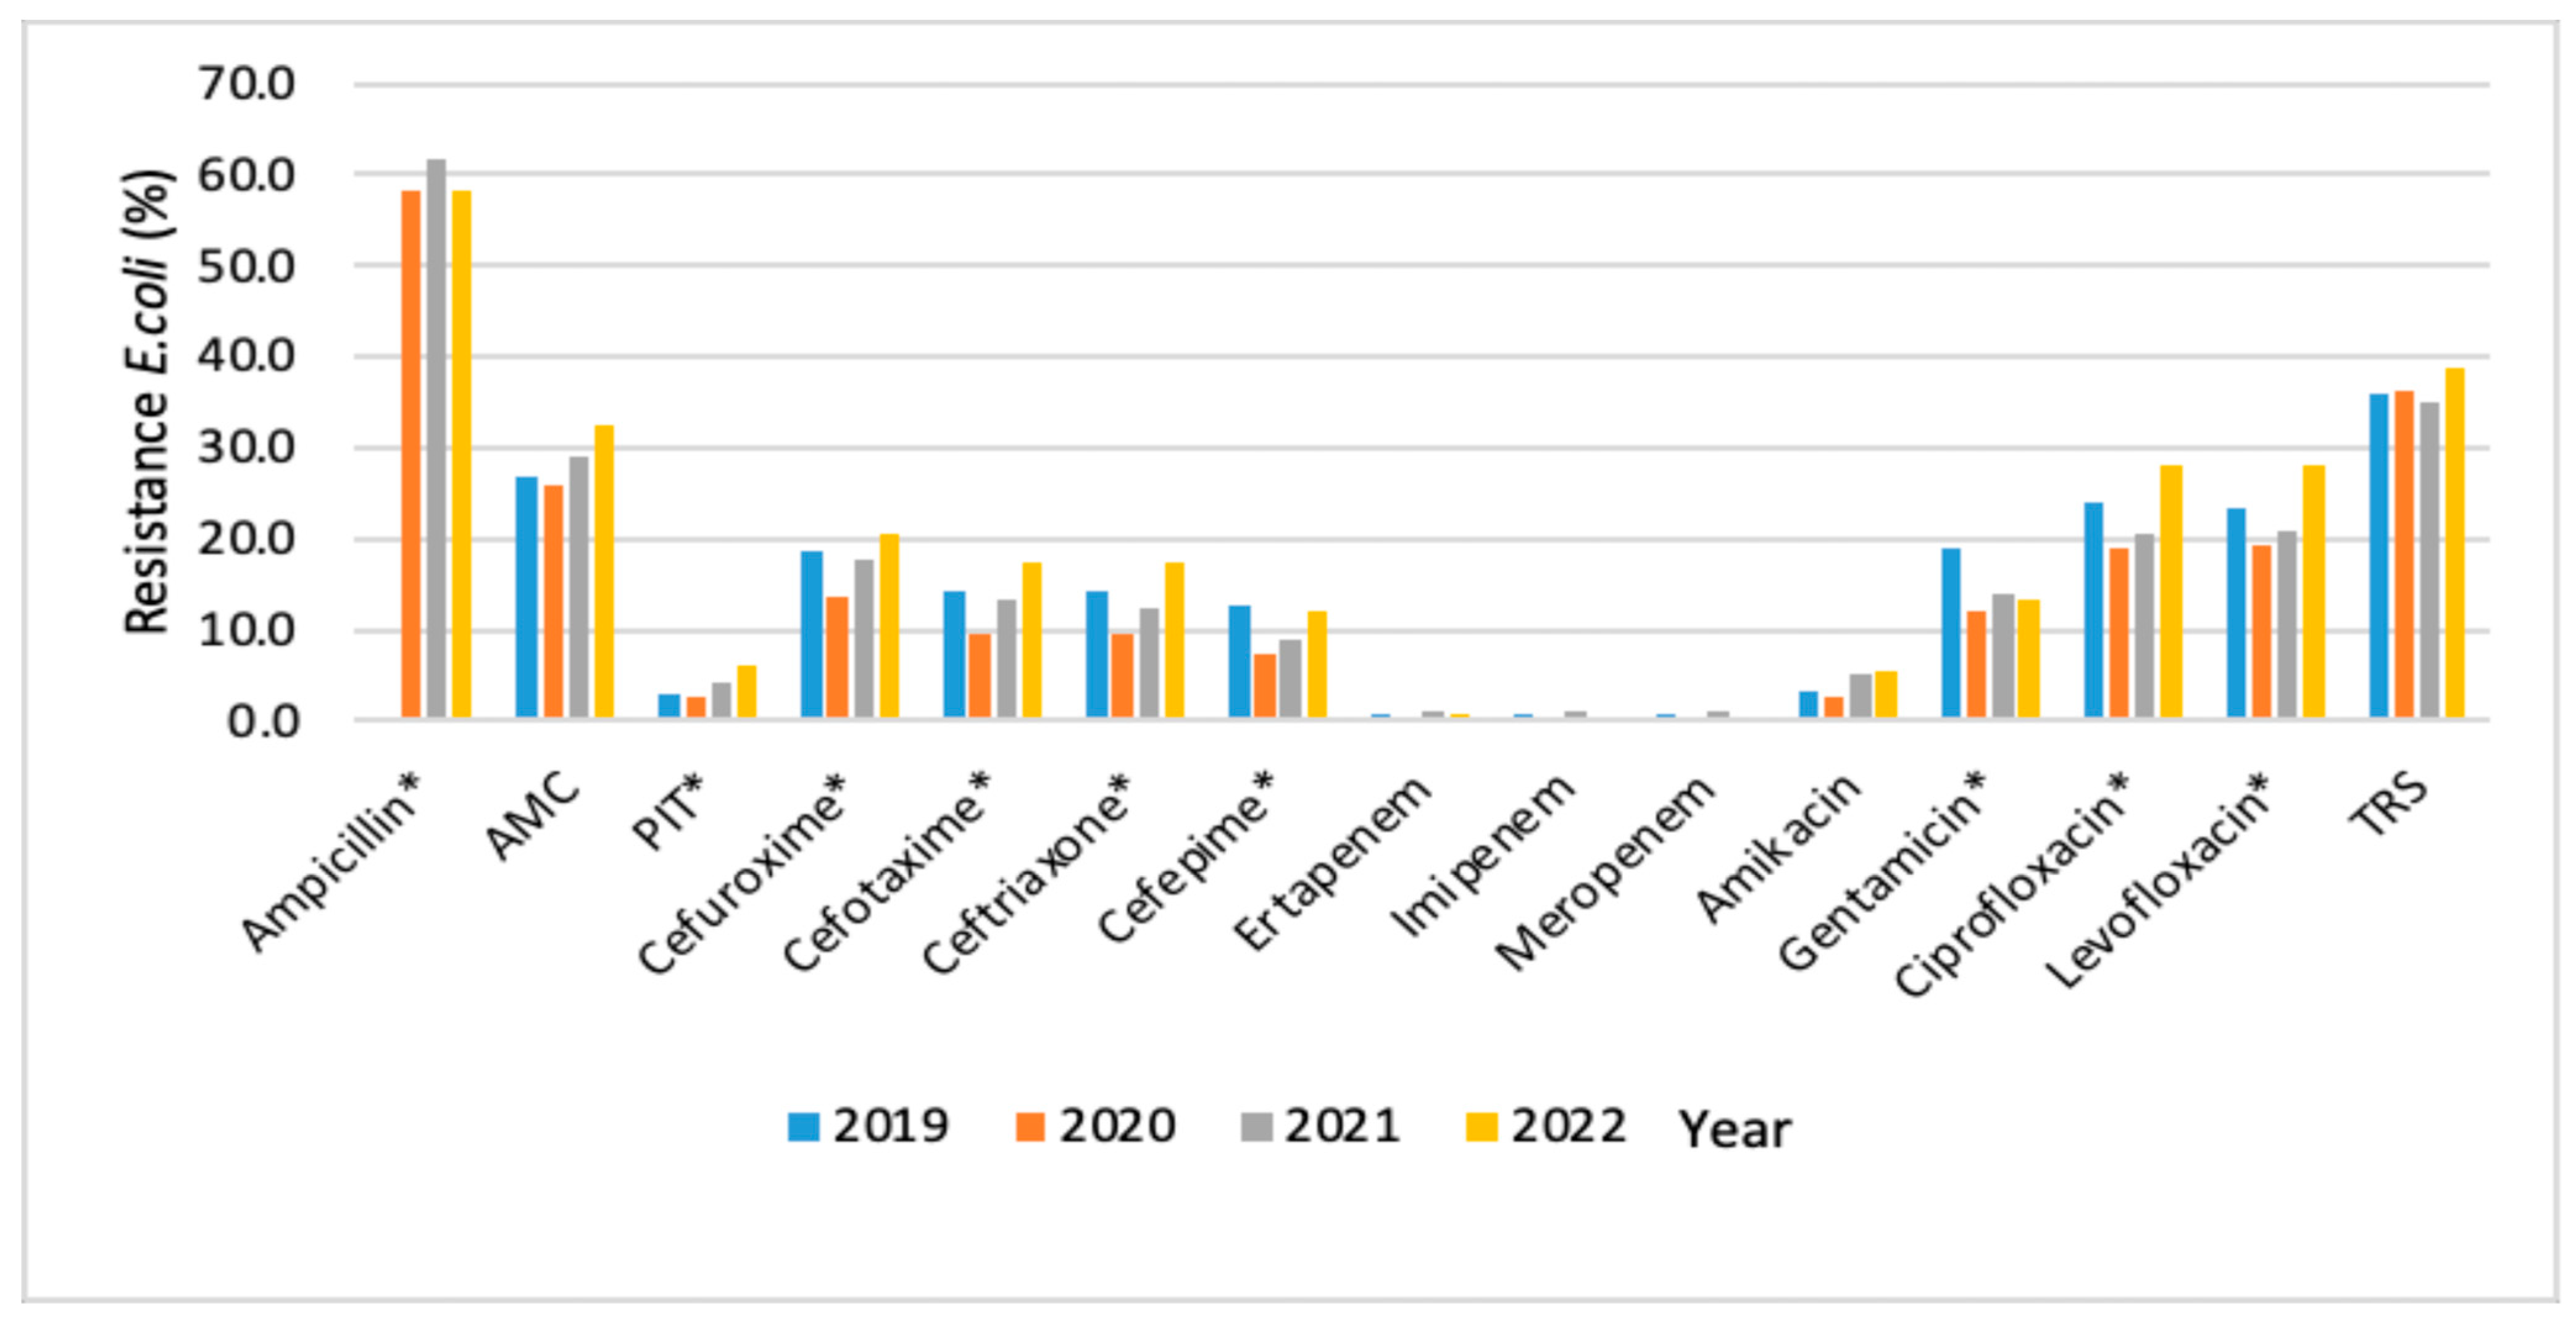
Overall, the lowest E. coli resistance rates to all tested antimicrobials, except trimethoprim/sulfamethoxazole (TRS), were recorded in 2020. Thereafter, resistance increased across most antimicrobial classes, as shown in (Figure 2; Table A2).
Figure 2.
Resistance rates of Escherichia coli isolates to antimicrobials, 2019–2022. * Chi-square test for the overall comparison of resistance rates during 2019–2022, significant at p < 0.05; AMC—Amoxicillin/Clavulanic acid; PIT—Piperacillin/Tazobactam; Imipenem—imipenem/cilastatin; TRS—Trimethoprim/Sulfamethoxazole.
Resistance to cephalosporins differed significantly across the study period (2019–2022), including cefuroxime (p = 0.028), cefotaxime (p = 0.004), ceftriaxone (p = 0.002), and cefepime (p = 0.009). For descriptive purposes, resistance to cefuroxime increased from 18.6% in 2019 to 20.6% in 2022, cefotaxime from 14.4% to 17.4%, and ceftriaxone from 14.2% to 17.3%. Cefepime resistance showed a U-shaped pattern, decreasing from 12.7% in 2019 to 7.3% in 2020 and increasing again in 2021 (8.8%) and 2022 (12.2%). Resistance to piperacillin/tazobactam (PIT), ciprofloxacin, and levofloxacin also differed significantly across 2019–2022 (p = 0.035, p = 0.003, and p = 0.004, respectively), with higher resistance observed in 2022 than in 2019 for PIT (6.2% vs. 3.1%), ciprofloxacin (28.2% vs. 23.9%), and levofloxacin (28.1% vs. 23.9%) (Figure 2; Table A2).
In E. coli isolates, notable year-to-year variations in resistance proportions (adjusted with Bonferroni correction, p < 0.05) were observed for gentamicin between 2019–2020 and 2019–2022; for ampicillin between 2019–2020, 2019–2022, and 2020–2022; for ciprofloxacin between 2020–2022 and 2021–2022; for levofloxacin, cefuroxime, ceftriaxone, and cefotaxime only between 2020 and 2022; and for cefepime between 2019 and 2020.
Although resistance to amoxicillin/clavulanic acid (AMC) and amikacin increased from 2020 (25.8% and 2.7%, respectively) to 2022 (32.3% and 5.4%, respectively), the differences did not reach statistical significance over the 2019–2022 period (p = 0.077 and p = 0.064, respectively). No significant changes in carbapenem resistance were observed over the study period. The lowest resistance rates to ertapenem, imipenem, and meropenem were recorded in 2019 (0.5%, 0.2%, and 0.2%, respectively), while the highest rates were observed in 2021 (1.0%, 1.0%, and 0.9%, respectively) (Figure 2; Table A2).
3.5. Resistance of Klebsiella pneumoniae Isolates to Antimicrobials
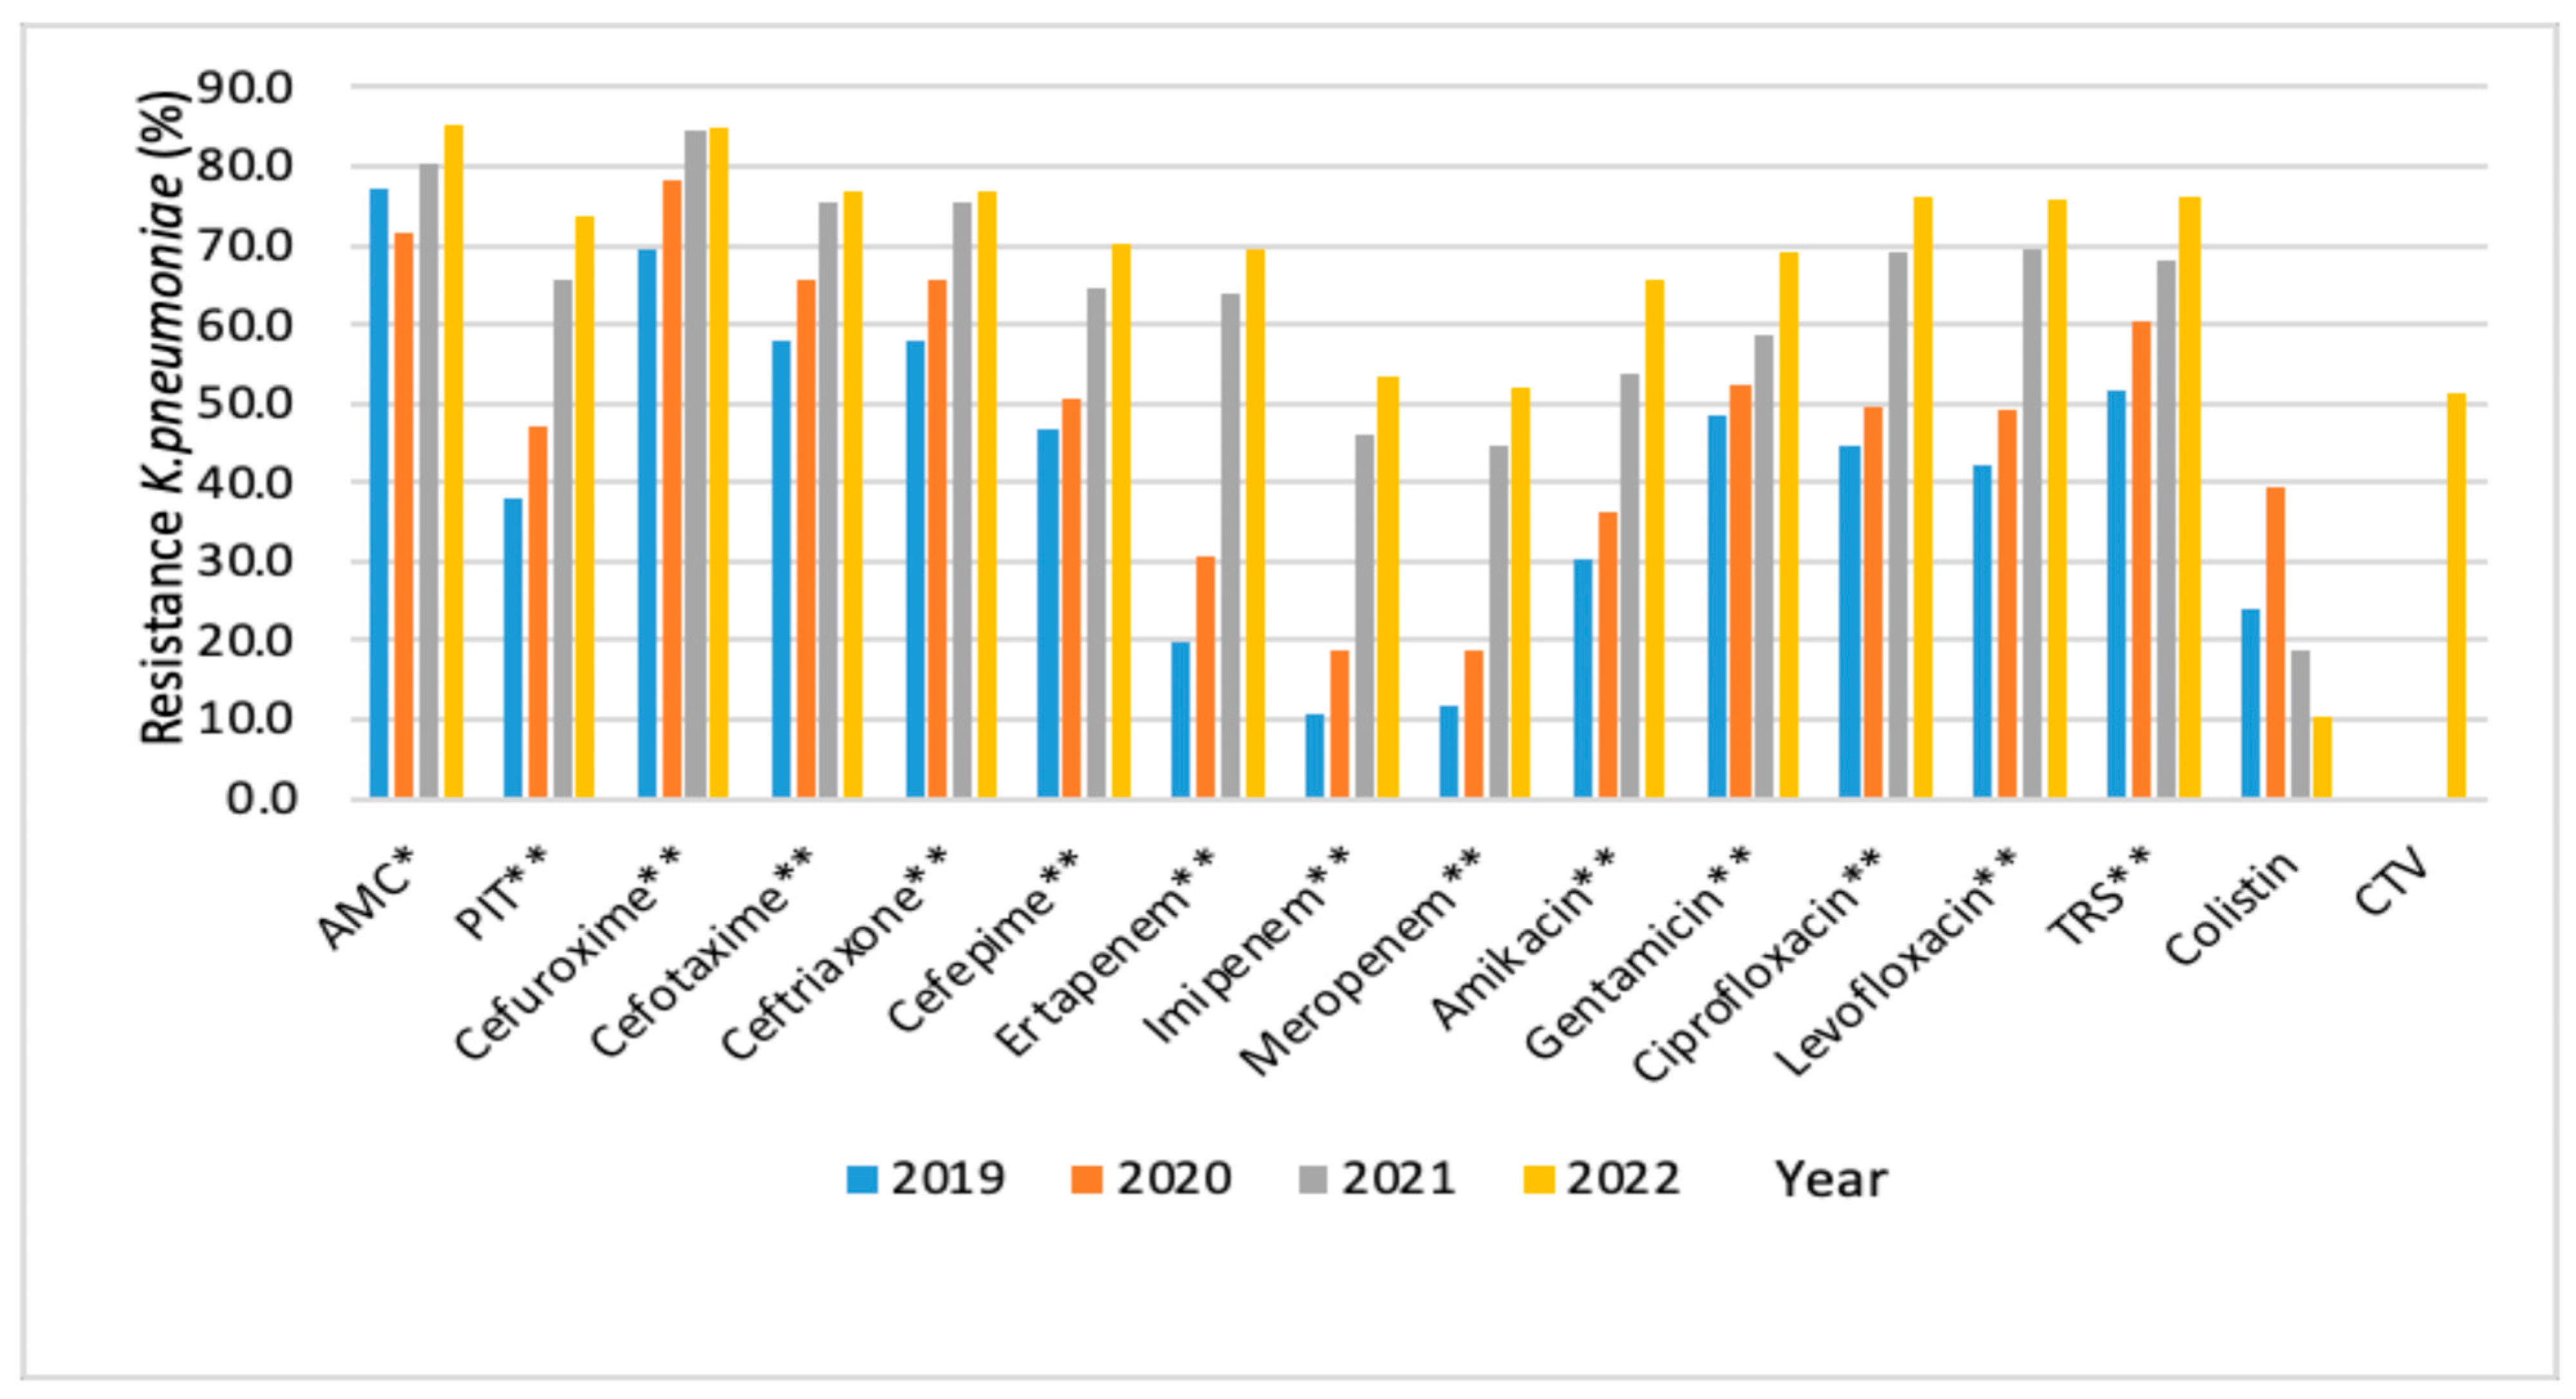
During 2019–2022, resistance rates among K. pneumoniae isolates showed a significant increase across years for most antimicrobials tested (p < 0.001), while the increase for AMC was smaller but still statistically significant (p < 0.05), likely due to high baseline resistance.
The most pronounced increase was observed for carbapenems, with resistance rates increasing from 19.7% (ertapenem; n = 23), 10.7% (imipenem; n = 19), and 11.7% (meropenem; n = 22) in 2019 to 69.4% (ertapenem; n = 170), 53.4% (imipenem; n = 172), and 52.0% (meropenem; n = 173) in 2022 (p < 0.001 for all).
In K. pneumoniae isolates, notable year-to-year variations in resistance proportions (adjusted using Bonferroni correction, p < 0.05) were seen for the years 2019–2021, 2019–2022, 2020–2021, and 2021–2022 concerning amikacin, ciprofloxacin, levofloxacin, cefepime, imipenem, meropenem, ertapenem, and PIT. The proportions for gentamicin significantly varied between 2019–2022 and 2020–2022, whereas for AMC, the variation occurred only between 2020 and 2022. For TRS and cefuroxime, the resistance proportion varied for 2019–2021 and 2019–2022, whereas for ceftriaxone and cefotaxime, the data varied for 2019–2021, 2019–2022, and 2020–2022, as well.
Colistin susceptibility was assessed in a targeted subset of isolates; among tested isolates, the highest resistance rate (39.3%) was observed in 2020 (Figure 3; Table A3).
Figure 3.
Resistance of Klebsiella pneumoniae isolates to antimicrobials 2019–2022. * Chi-square test for the overall comparison of resistance rates during 2019–2022, significant at p < 0.05; ** Chi-square test for the overall comparison of resistance rates during 2019–2022, significant at p < 0.001; AMC—Amoxicillin/Clavulanic acid; PIT—Piperacillin/Tazobactam; Imipenem—imipenem/cilastatin; TRS—Trimethoprim/Sulfamethoxazole; CTV—ceftazidime/avibactam.
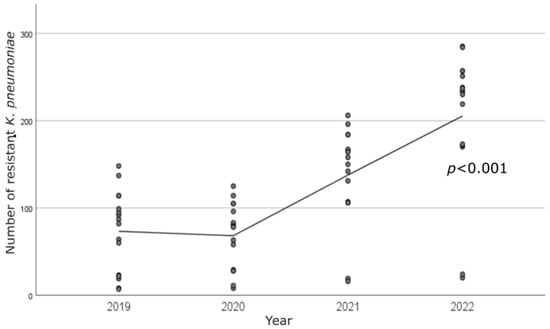
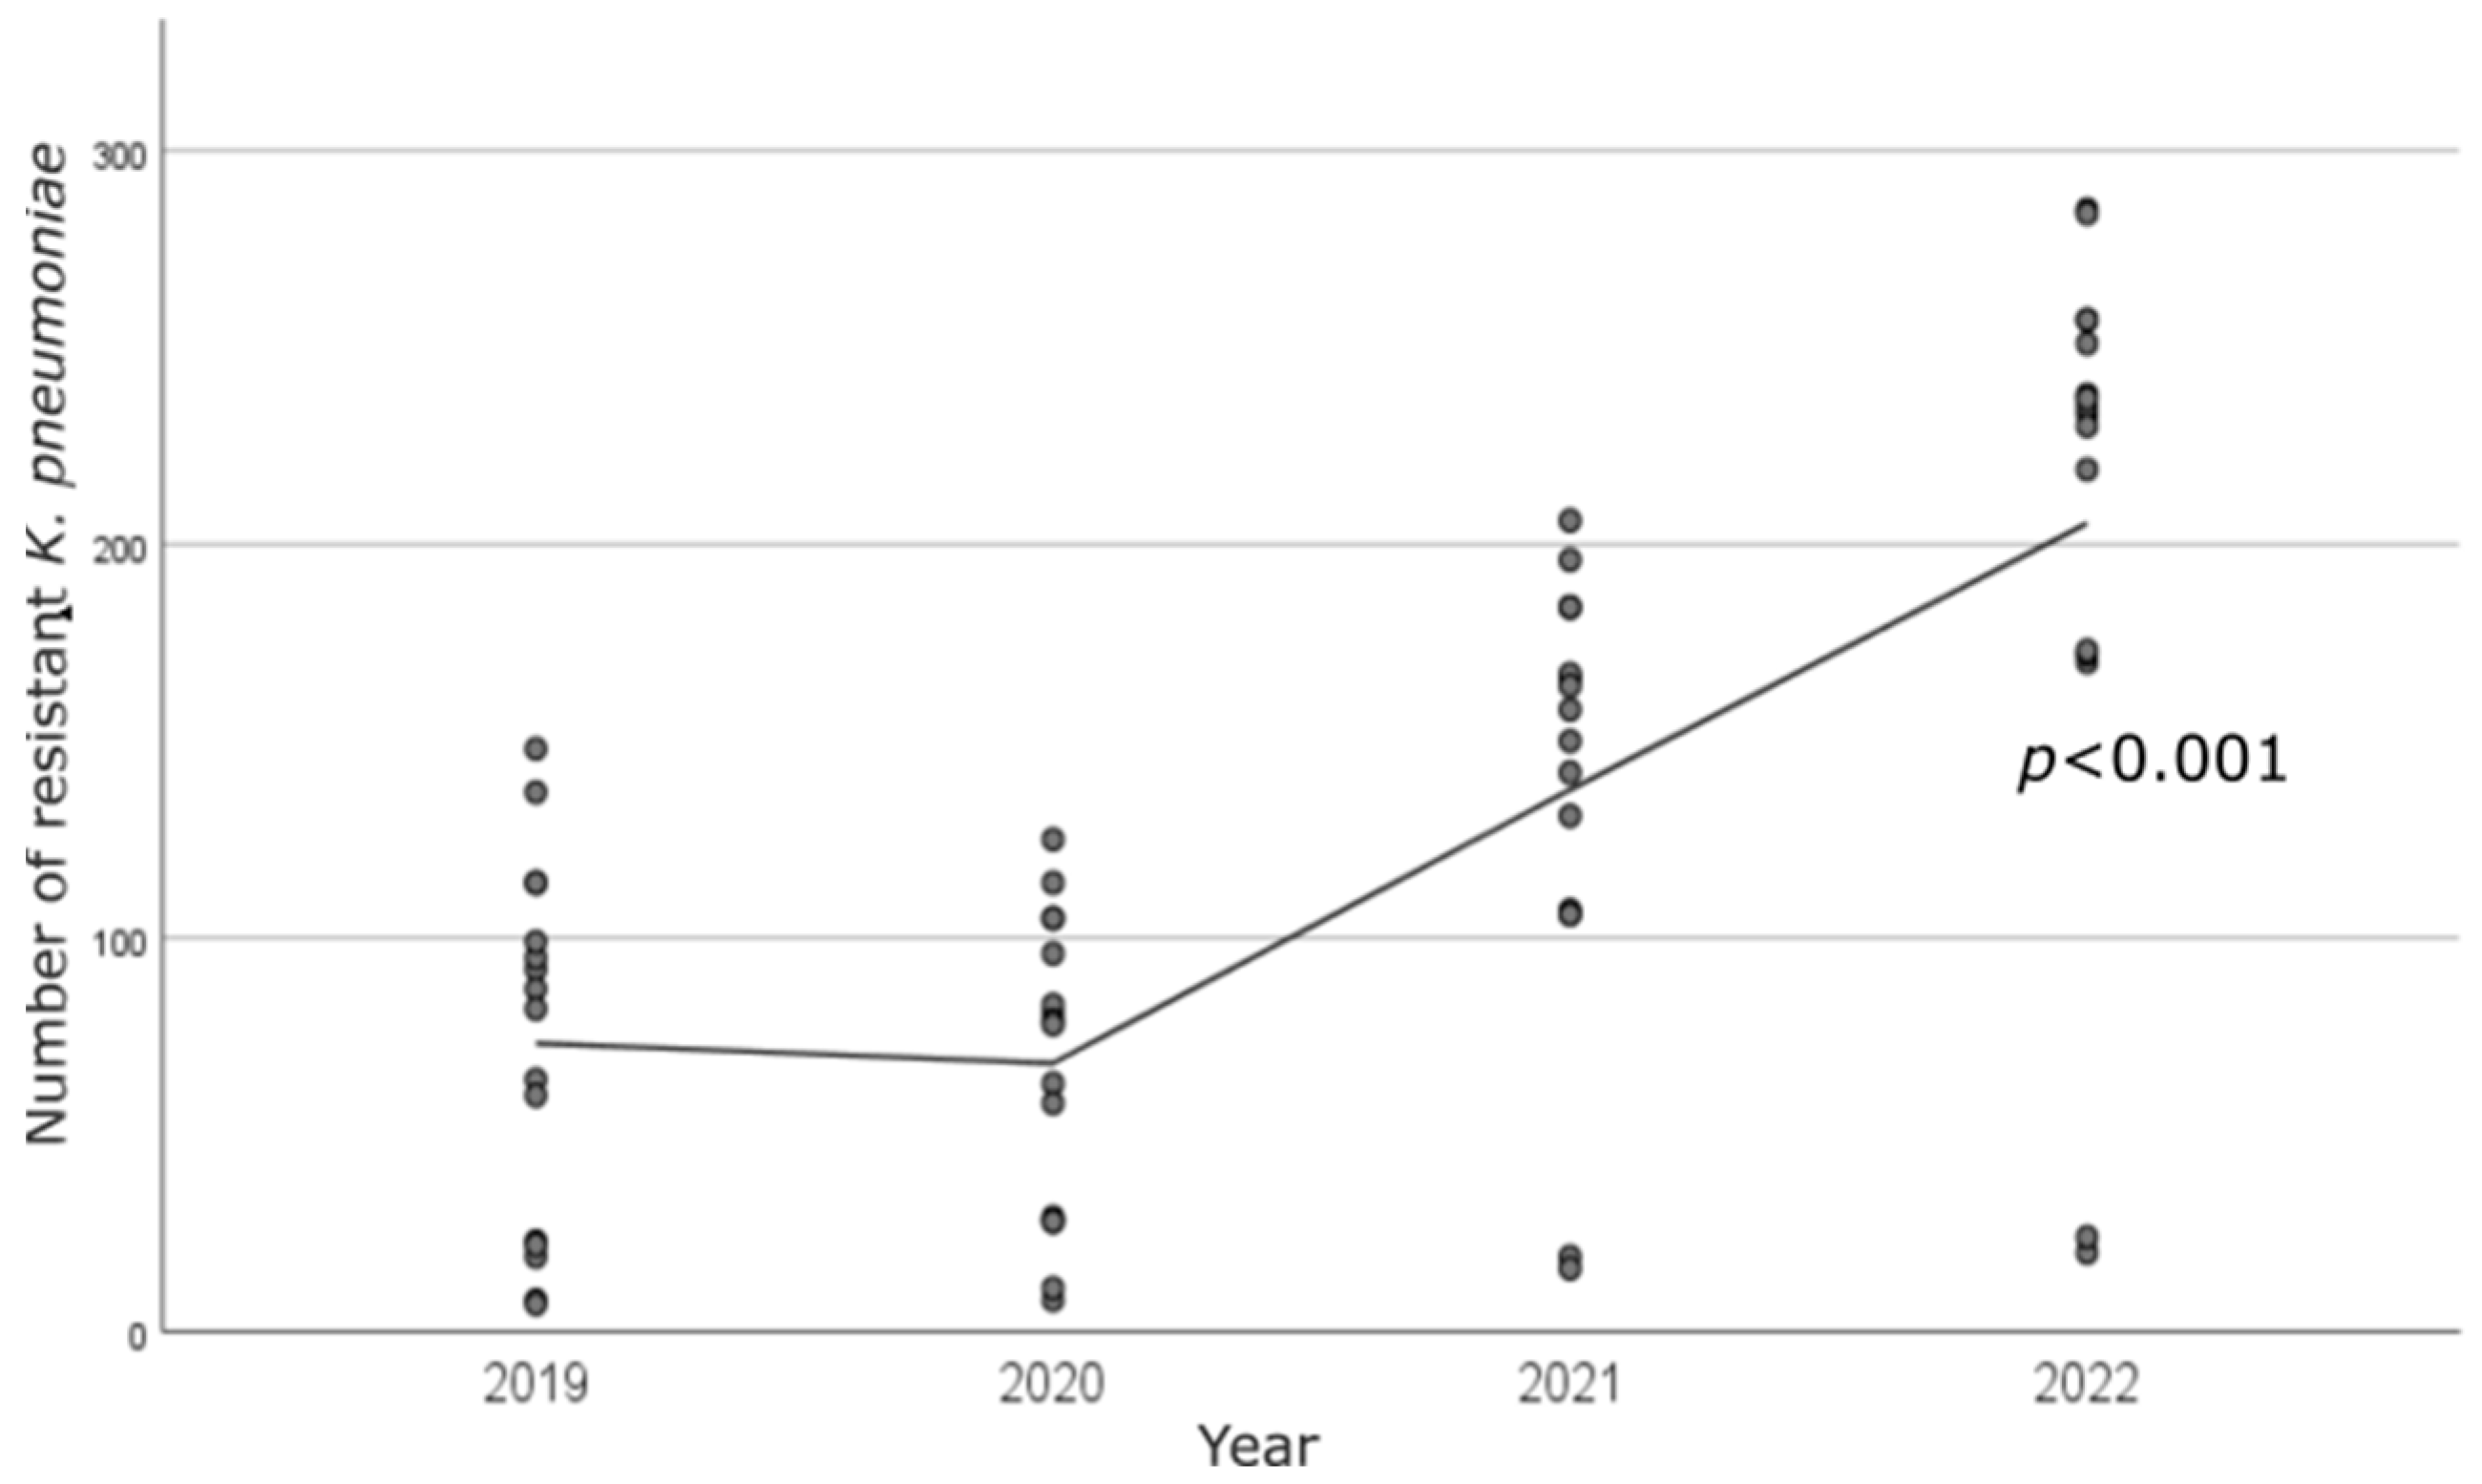
Unlike E. coli, during 2019–2022, K. pneumoniae resistance rates increased significantly across years (p < 0.001), and the number of resistant isolates for most antimicrobials showed an upward trend, peaking in 2022 (Figure 4).
Figure 4.
Correlation analysis of resistance in Klebsiella pneumoniae isolates to individual antimicrobials, 2019–2022.
3.6. Trend in the Proportion of MDR Escherichia coli and MDR Klebsiella pneumoniae
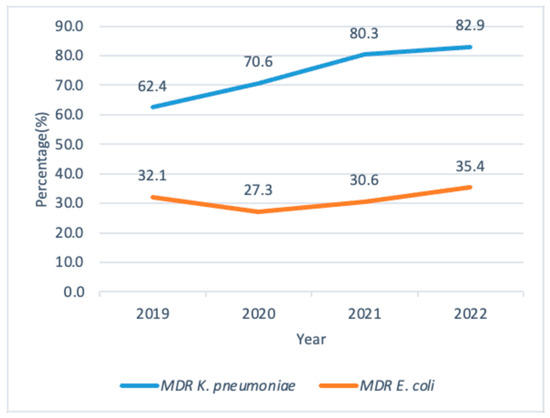
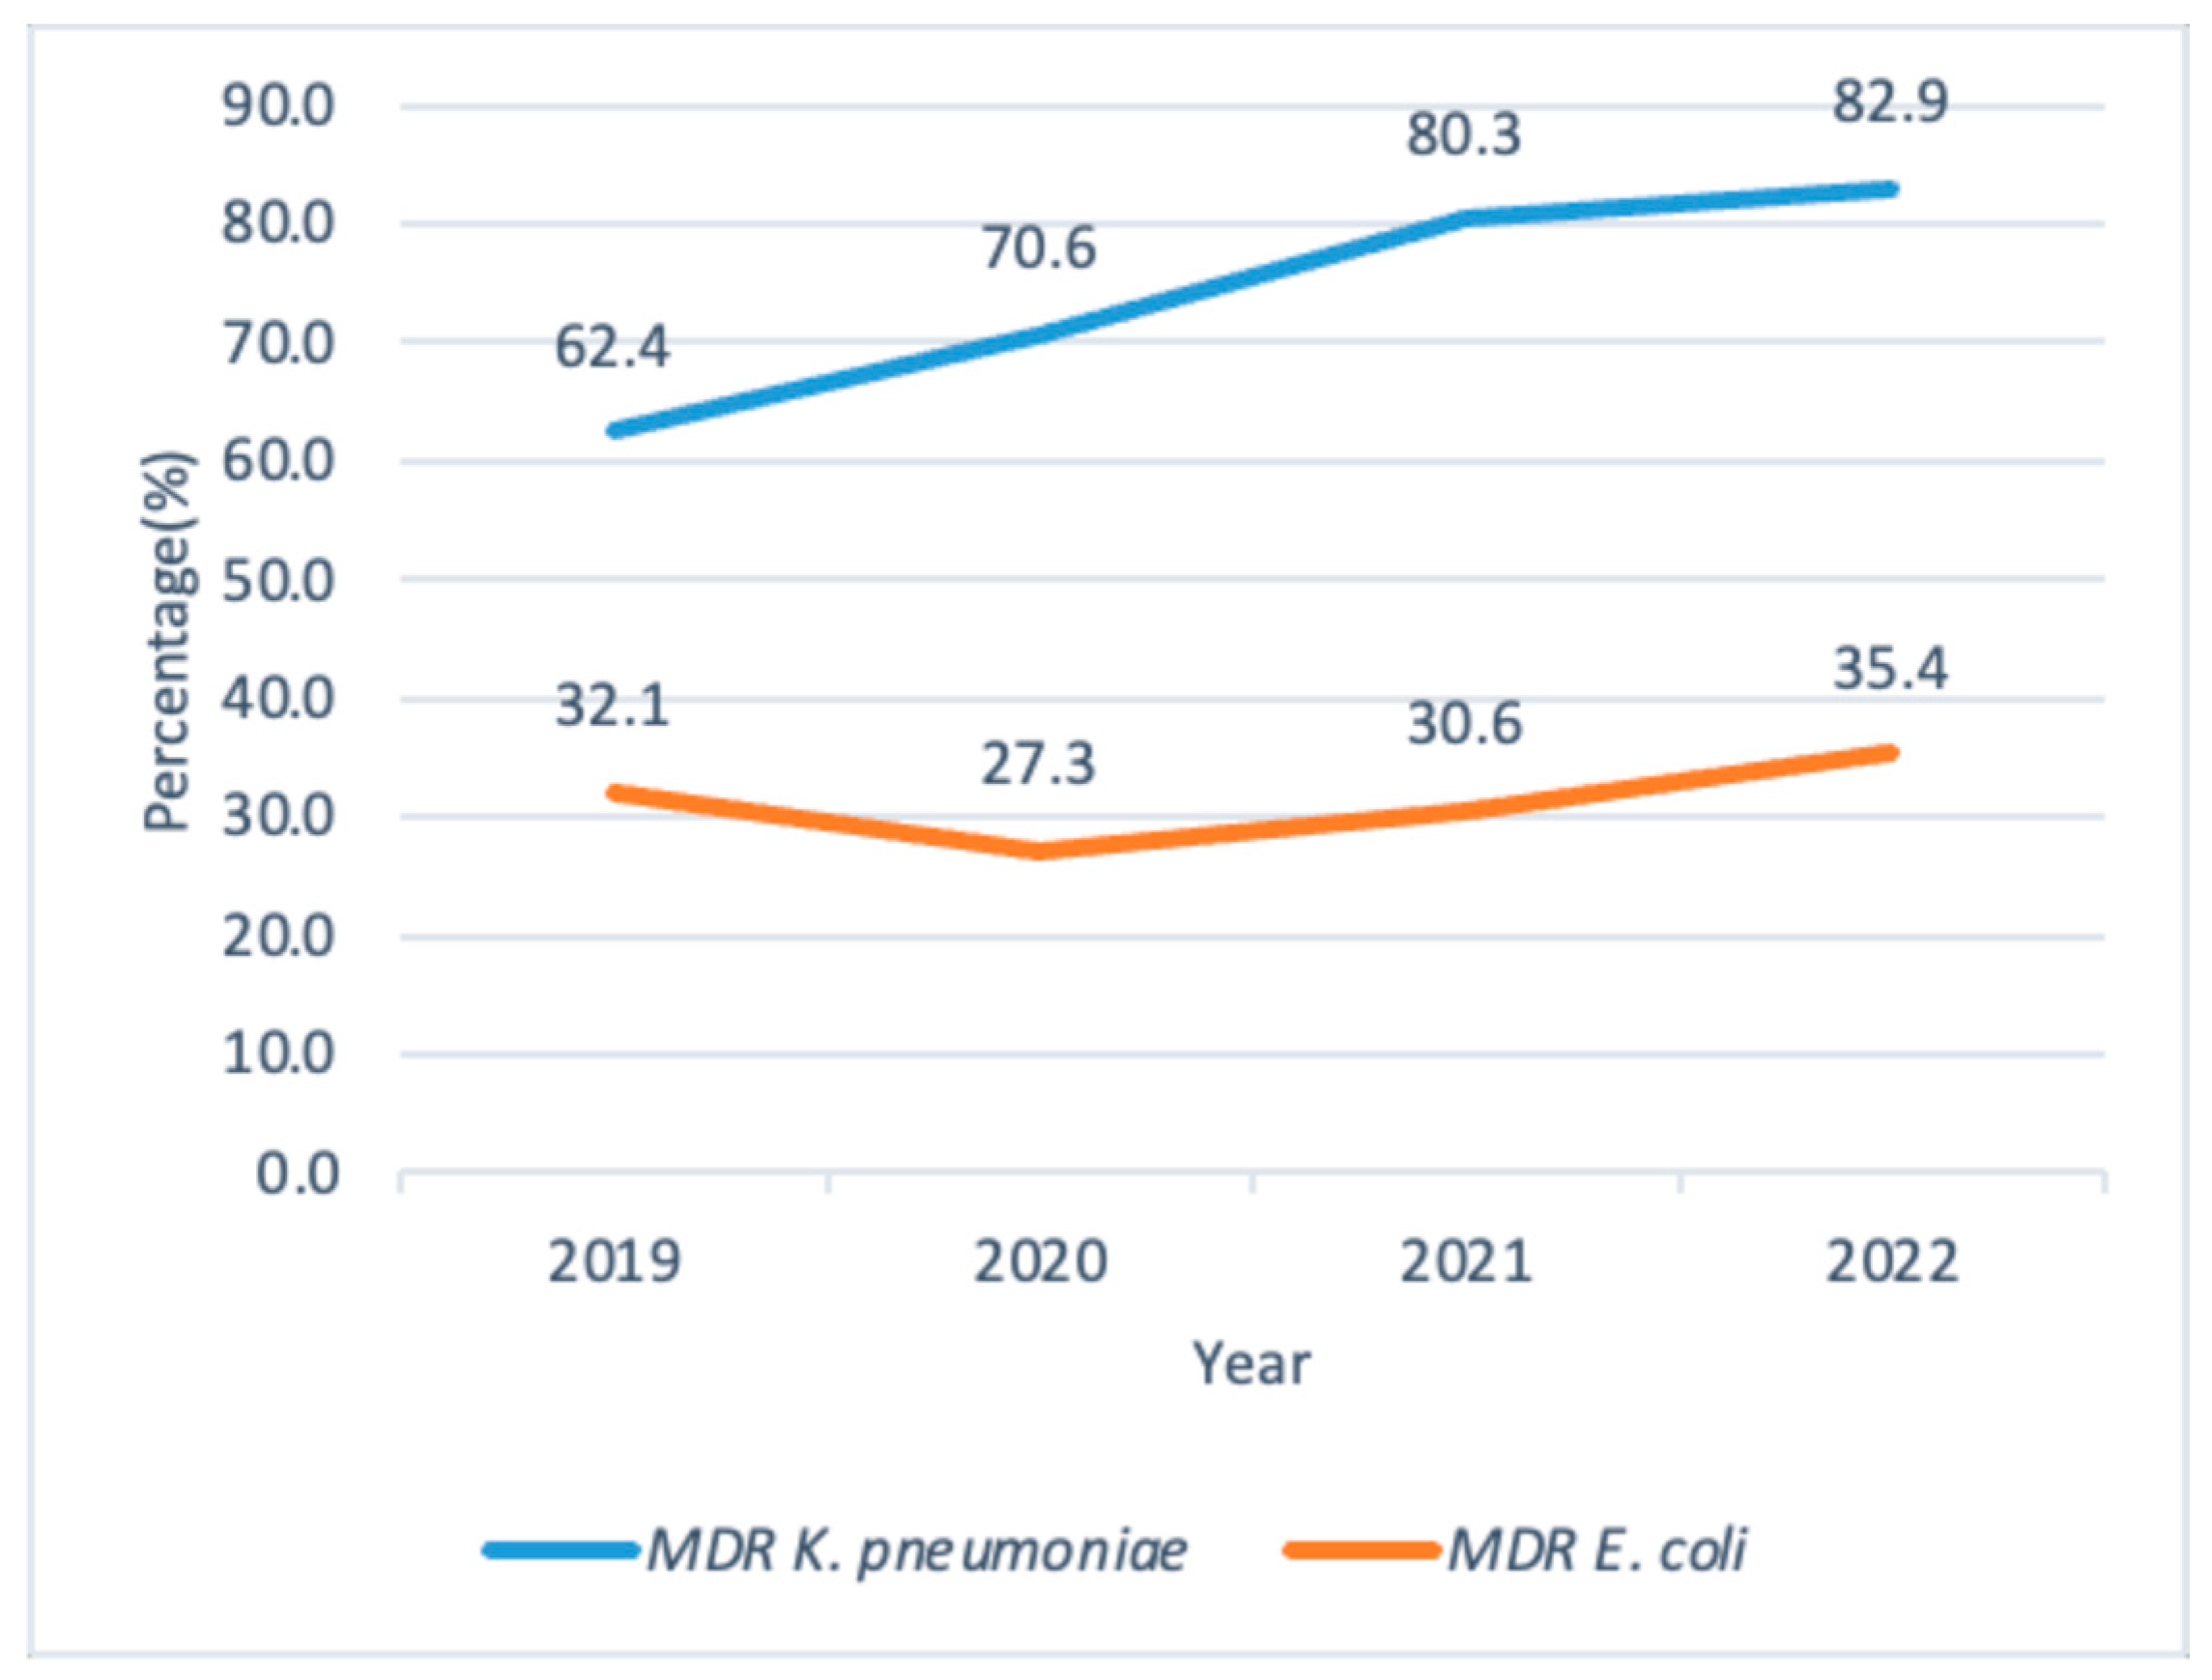
The proportion of MDR E. coli isolates differed significantly across the study period (2019–2022) (p = 0.041), rising from 32.1% (n = 228) in 2019 to 35.4% (n = 203) in 2022 (Figure 5). A detailed ward- and year-specific distribution of MDR E. coli isolates is provided in the Supplementary Material (Table S1).
Figure 5.
Trend in the proportion of multidrug-resistant (MDR) Klebsiella pneumoniae and MDR Escherichia coli isolates, 2019–2022. (%)—The proportion of MDR isolates relative to the total number of isolates of each species.
During the period 2019–2022, MDR K. pneumoniae isolates exhibited a clear and statistically significant increasing trend (p < 0.001), rising from 62.4% (n = 123) in 2019 to 82.9% (n = 277) in 2022 (Figure 5). A detailed ward- and year-specific distribution of MDR K. pneumoniae isolates is provided in the Supplementary Material (Table S2). In addition, the ward- and year-specific distribution of the three most common MDR phenotypes of K. pneumoniae is shown in Table S3 and Figure S1.
3.7. Antimicrobial Consumption
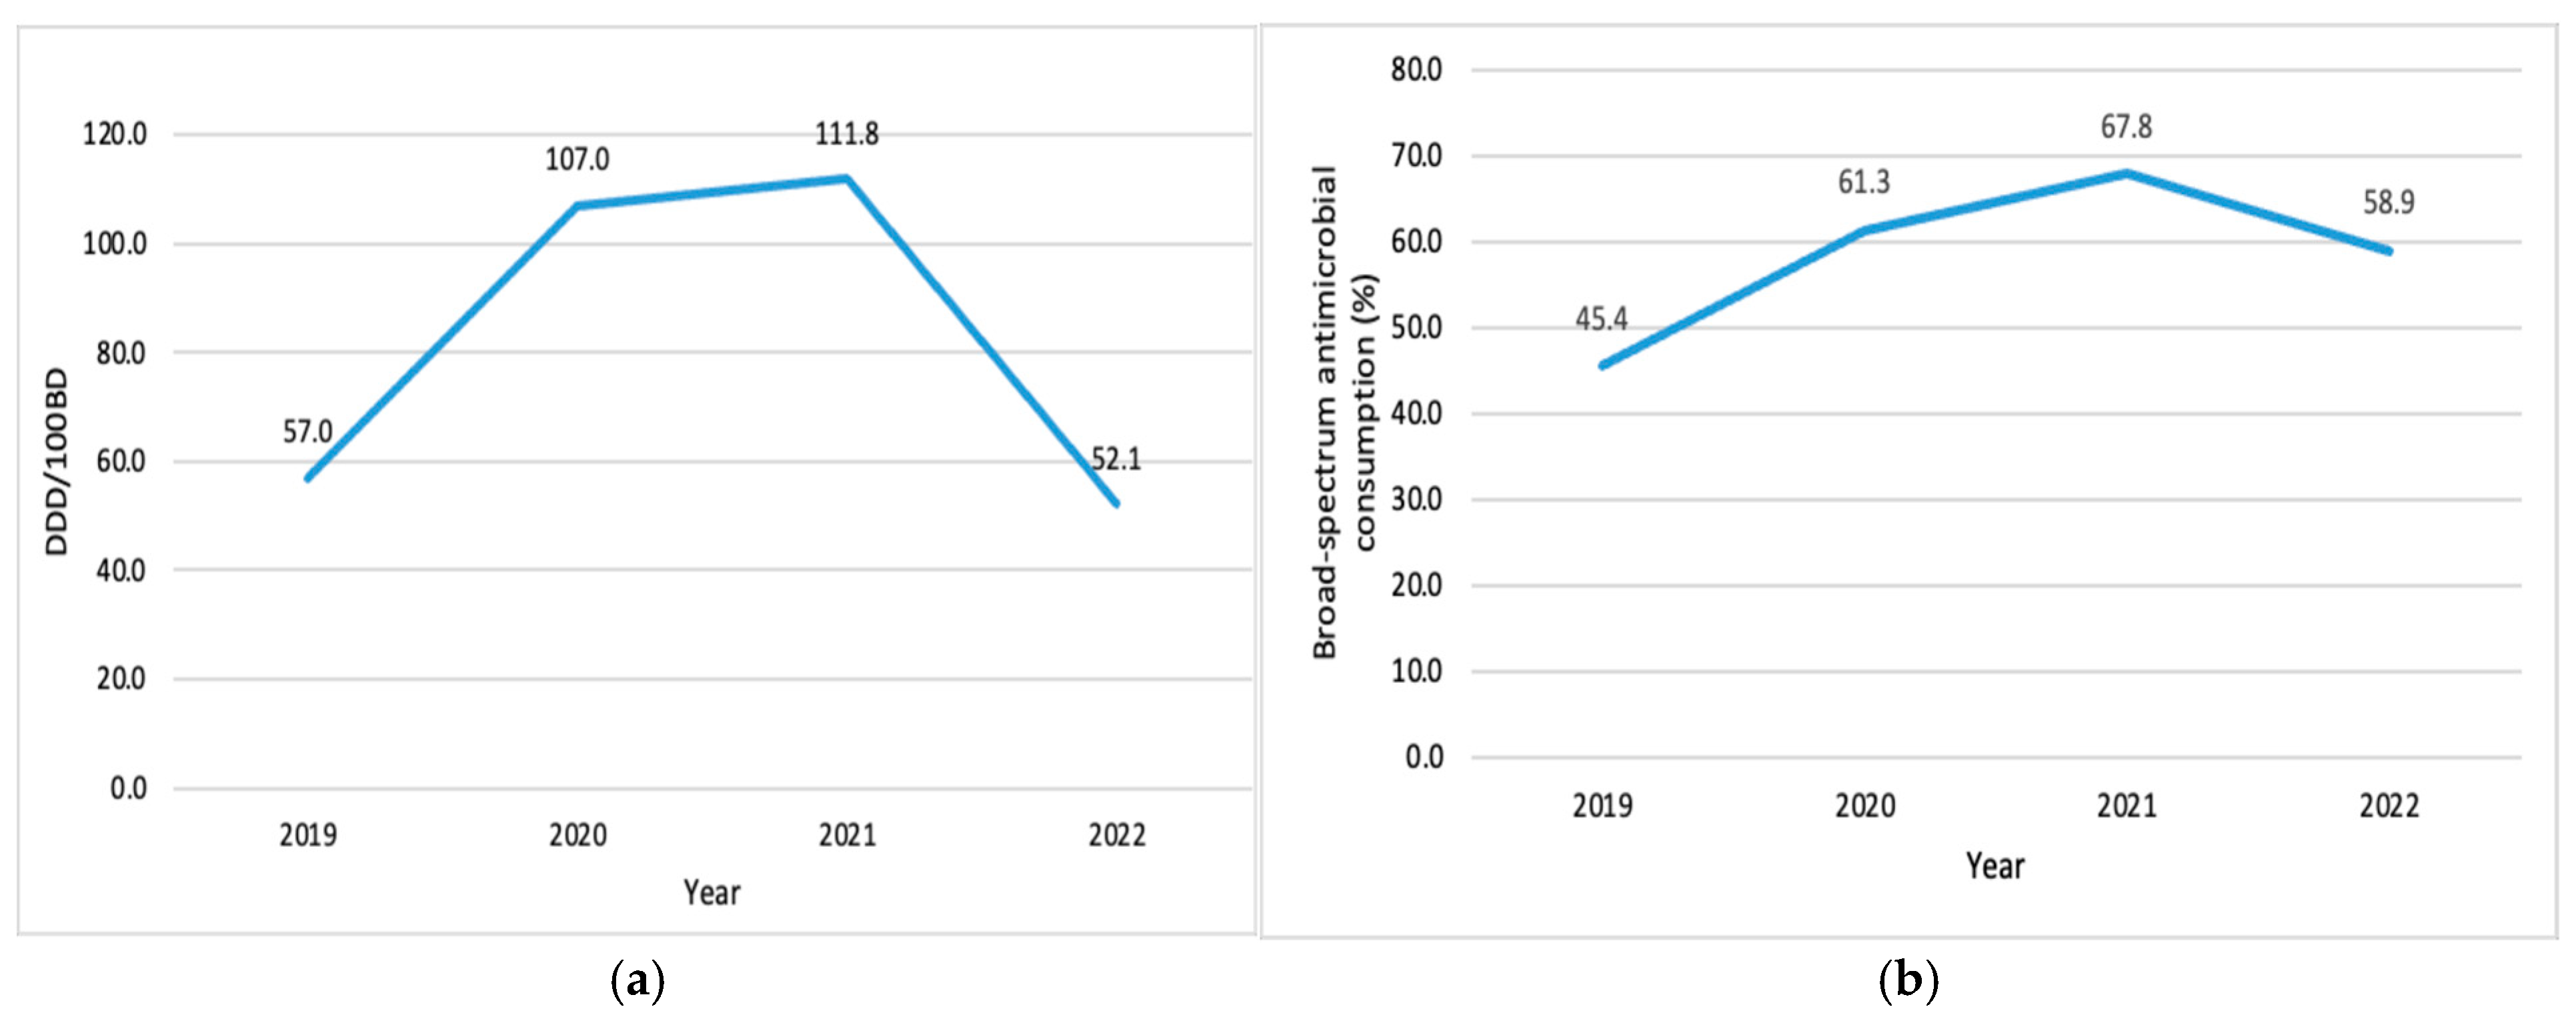
Annual antimicrobial consumption increased from 57.0 DDD/100BD in 2019 to 111.8 DDD/100BD in 2021, representing an increase of 96.1%. In 2022, annual consumption decreased to 52.0 DDD/100BD, corresponding to an 8.8% reduction compared with 2019 (Figure 6a).
Figure 6.
(a) Trend in annual total antimicrobial consumption expressed as defined daily doses per 100 bed–days (DDD/100 BD), 2019–2022; (b) The overall proportion of broad-spectrum antimicrobial consumption (glycopeptides, third- and fourth-generation cephalosporins, monobactams, carbapenems, fluoroquinolones, polymyxins, piperacillin with tazobactam, linezolid) among the total antimicrobial consumption expressed as percentages, 2019–2022.
The secondary indicator of hospital antimicrobial consumption, the proportion of ‘broad-spectrum antimicrobials’ consumption, showed the highest increase in 2020 (+16.7%), followed by a slightly slower increase in 2021 (+6.5%) and a slower decline in 2022 (−8.9%) (Figure 6b).
Antimicrobials Accounting for 75% (DU75) of Annual Hospital Consumption
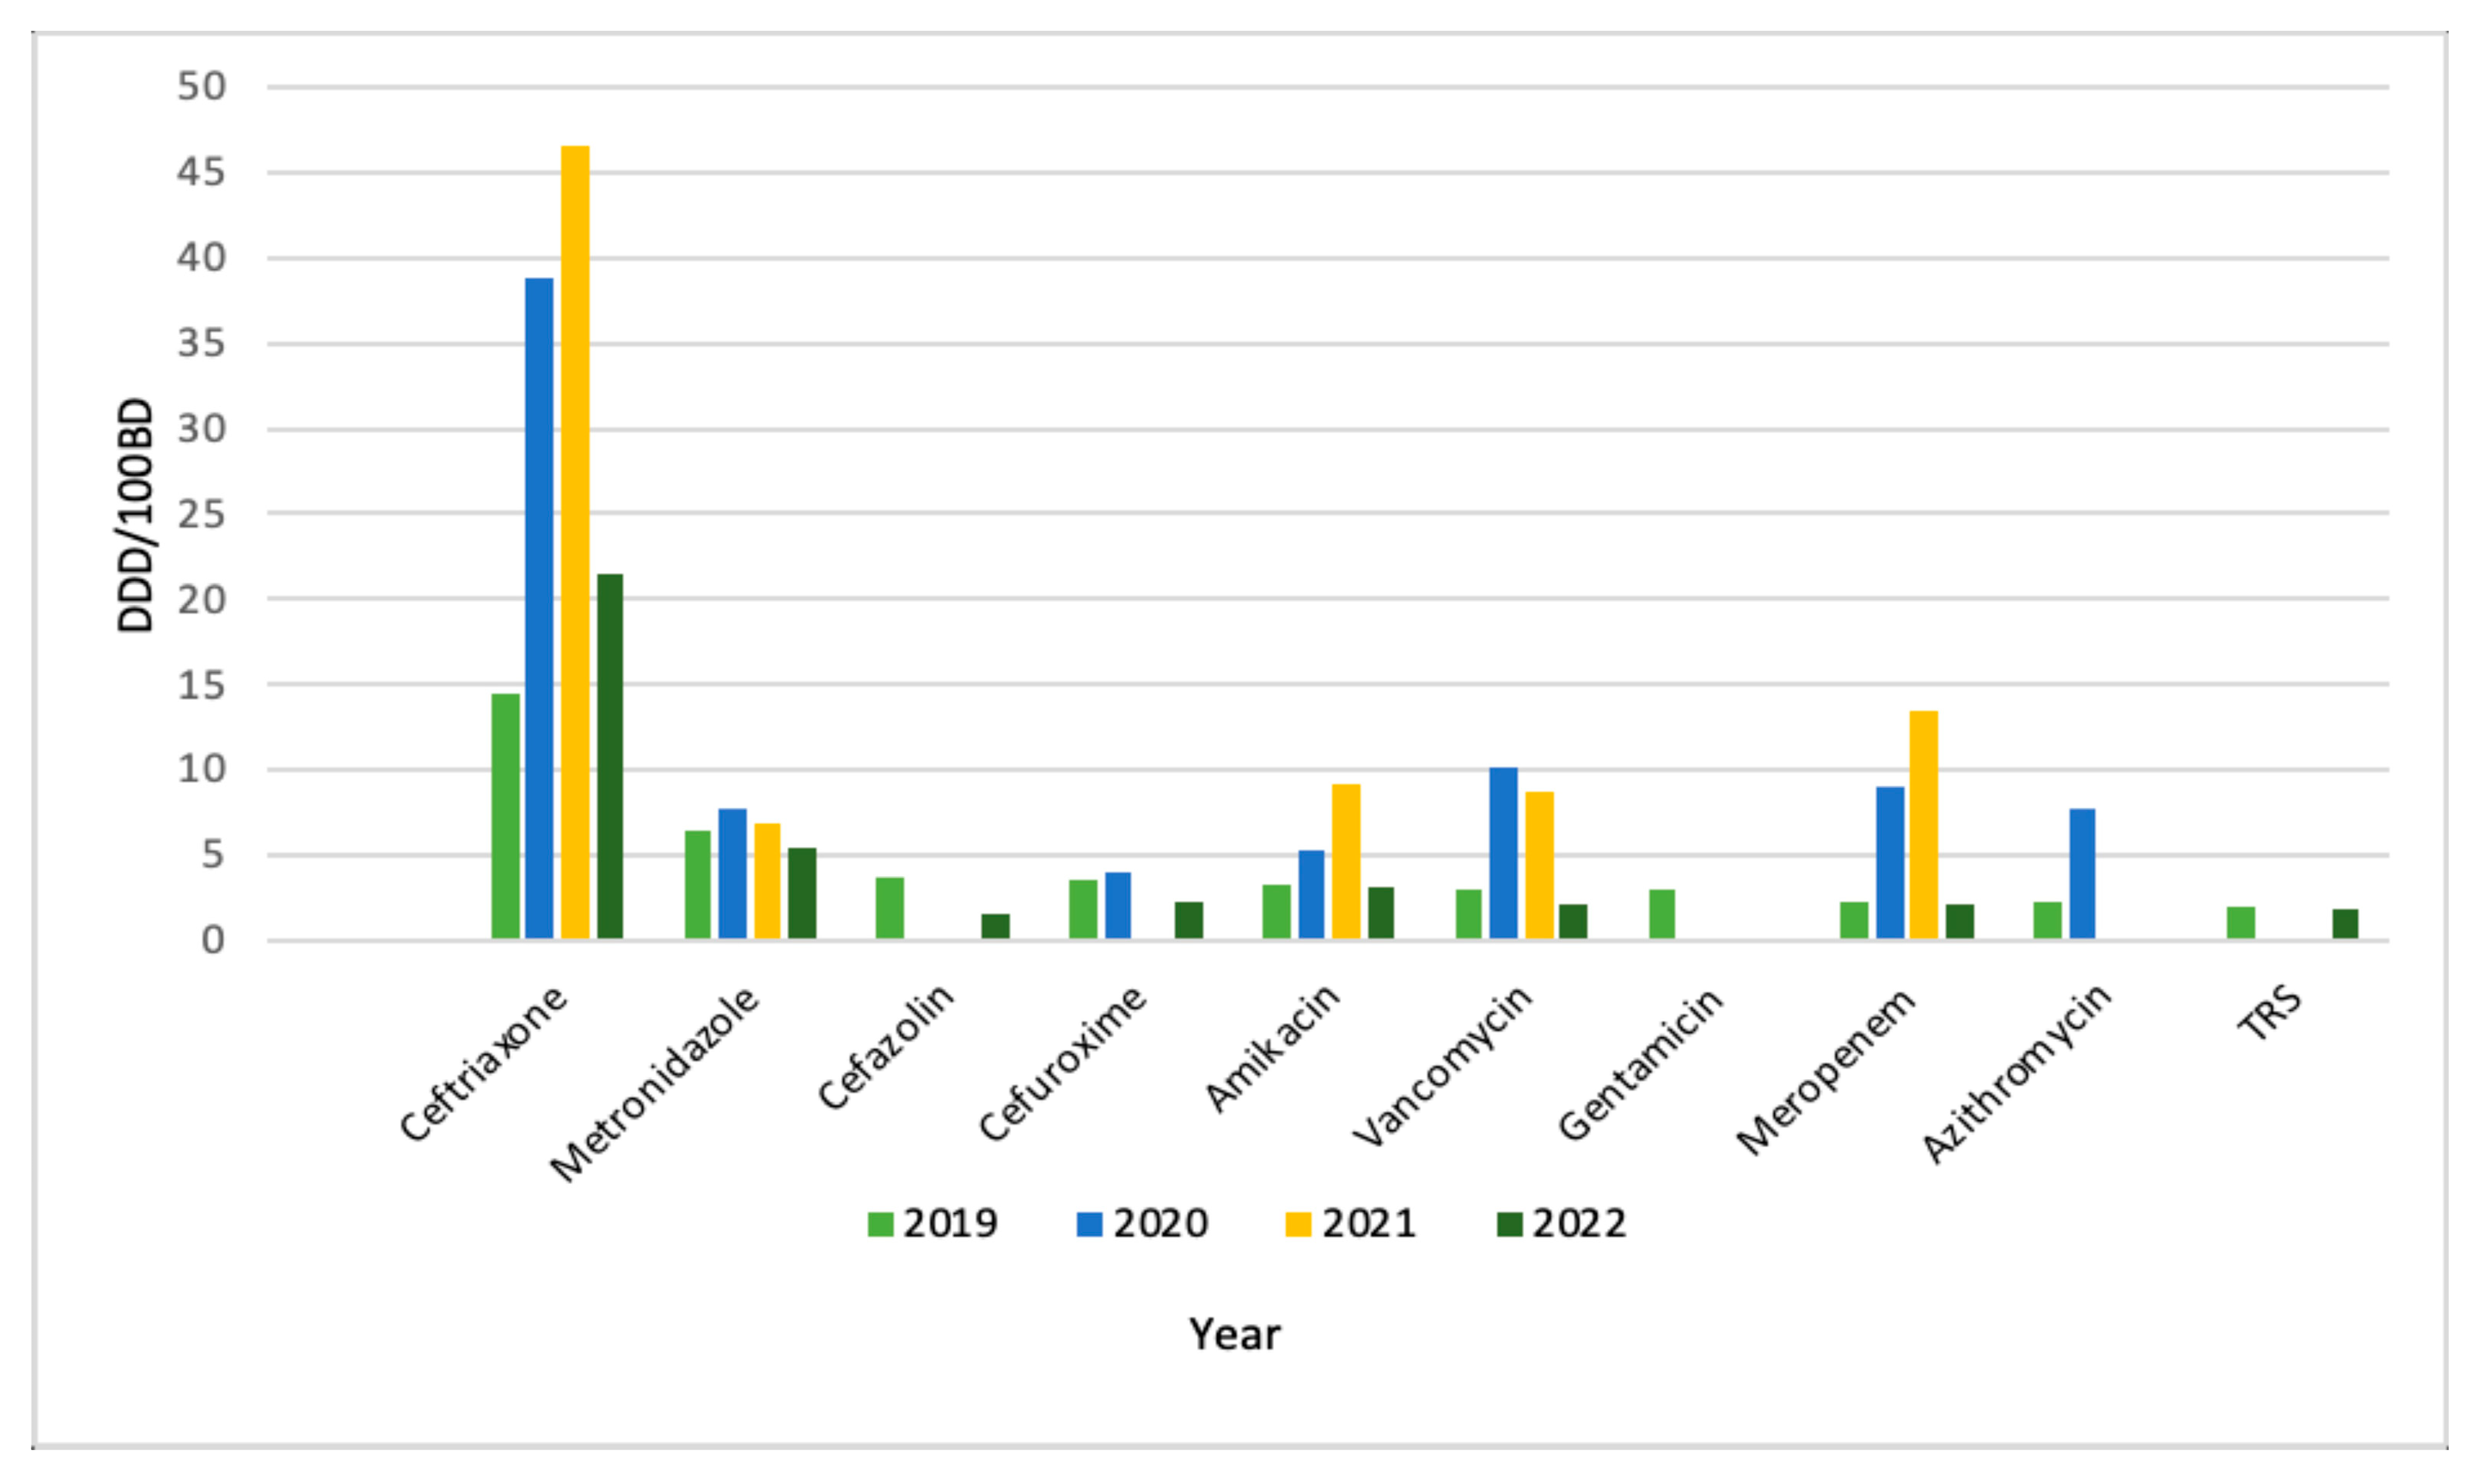
Detailed annual hospital consumption of antimicrobials is shown in Table 3. Ceftriaxone was the most frequently used antimicrobial across all years. During 2020–2021, particularly in 2021, antimicrobial consumption was largely dominated by a limited number of agents—ceftriaxone, meropenem, amikacin, vancomycin, and metronidazole—which together accounted for approximately 75% of total use (Table 3, Figure A2).
Table 3.
Antimicrobials accounting for 75% (DU75) of annual hospital consumption, expressed as defined daily doses per 100 bed–days (DDD/100 BD) and relative proportions, 2019–2022.
3.8. Correlation Between Antimicrobial Consumption and Bacterial Resistance
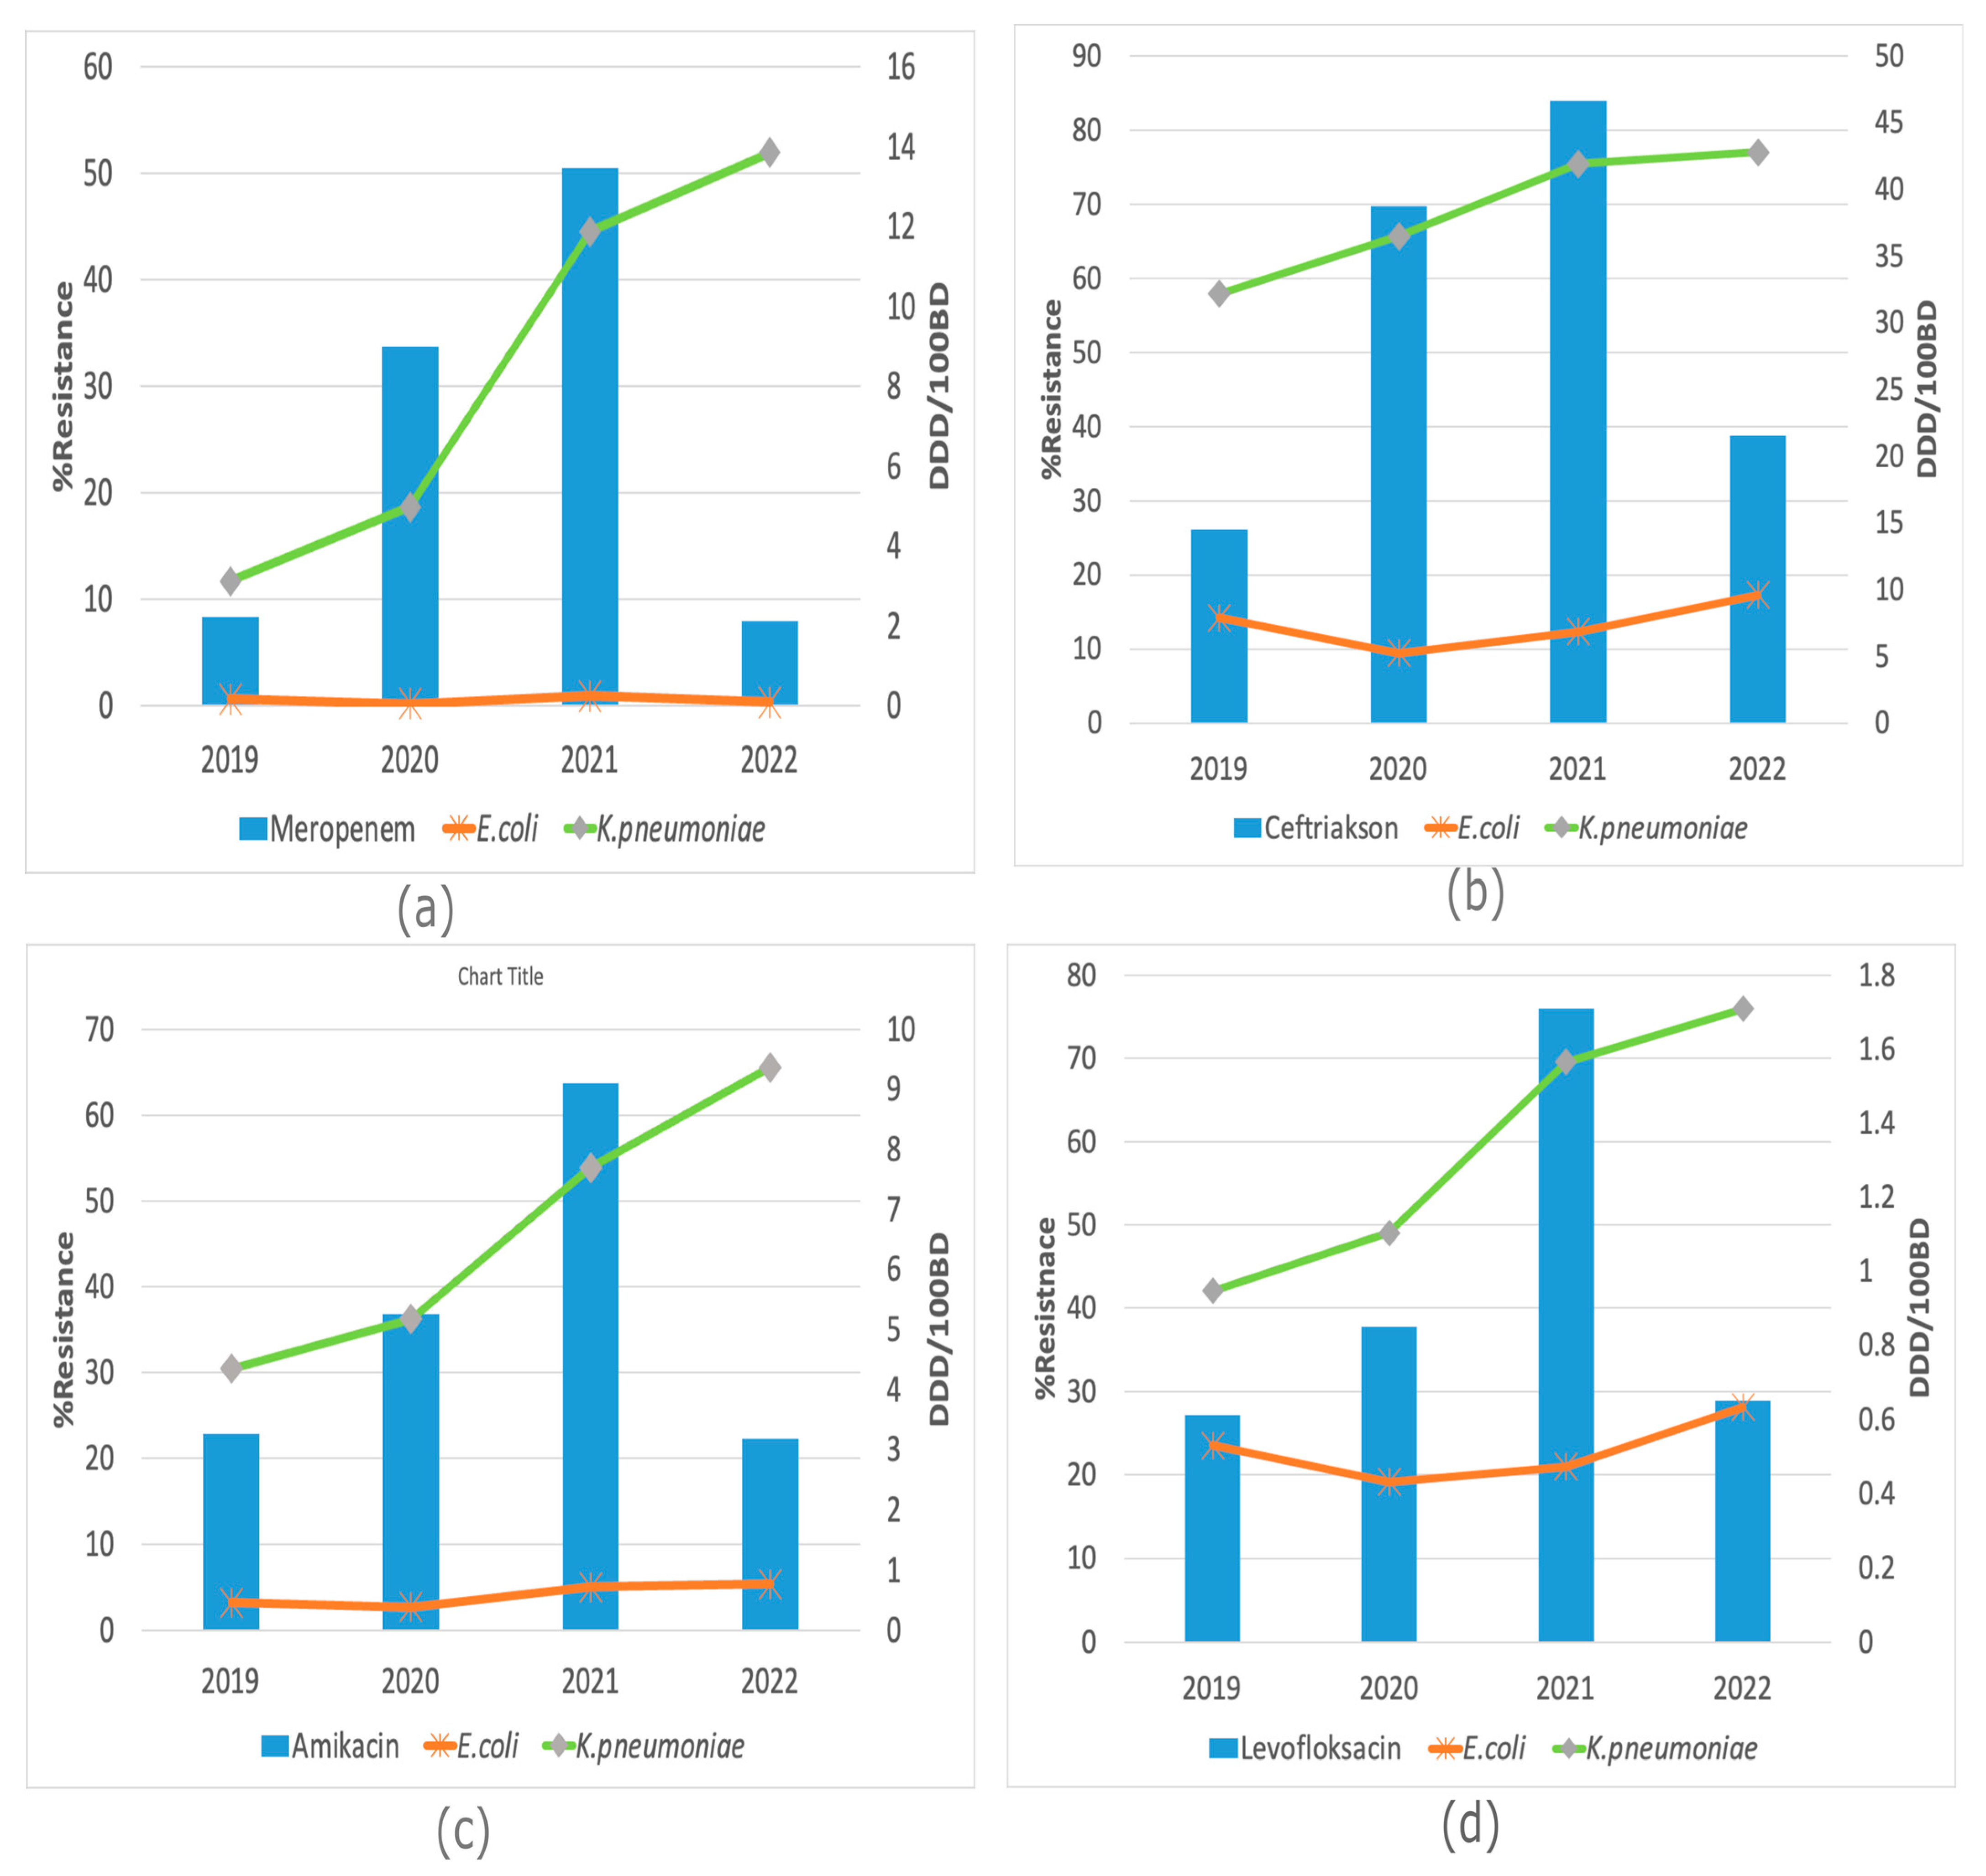
Despite the increase in antimicrobial consumption and the corresponding rise in K. pneumoniae resistance to antimicrobials over the study period, no statistically significant correlation was observed between antimicrobial use and resistance for both E. coli and K. pneumoniae (Figure 7).
Figure 7.
Relationship between antimicrobial consumption and resistance rates of E. coli and K. pneumoniae during the period 2019–2022 for each antimicrobial. (a) Meropenem; (b) Ceftriaxone; (c) Amikacin; (d) Levofloxacin.
Bars depict antimicrobial consumption for the respective antimicrobial expressed as defined daily doses per 100 bed–days (DDD/100 BD), while lines indicate bacterial resistance rates to the same antimicrobial, expressed as the percentage of resistant E. coli and K. pneumoniae isolates relative to the total number of isolates within each species.
The most notable changes were observed in the annual consumption of meropenem between 2019 and 2021 (2.2 and 13.5 DDD/100 BD, respectively), alongside an increase in K. pneumoniae resistance to meropenem (11.7% and 44.5%, respectively) (Figure 7).
4. Discussion
By examining four years of data, this study highlights the evolving relationship between antimicrobial resistance and antimicrobial consumption in two common bacterial pathogens. The impact of the COVID-19 pandemic on antimicrobial resistance varied across countries, with most studies reporting increased antimicrobial resistance [13,19,20,21,22]. Reorganization of hospital services, including suspension of elective procedures and limiting admissions to emergency and COVID-19 cases, was commonly reported in the literature [23,24] and was also implemented in our hospital, resulting in a temporary reduction in patient numbers and bed–days in 2020. Hospital activity subsequently peaked in 2021 before returning number of hospitalisations toward pre-pandemic levels in 2022.
4.1. Prevalence and Specimen Distribution of Escherichia coli and Klebsiella pneumoniae Isolates
As expected, E. coli remained the most frequently isolated species throughout the study period. The overall decrease in the total number of both bacterial isolates in 2020 is likely attributable to the reduced number of hospitalized patients during that period, coupled with the implementation of stricter hospital infection prevention measures in response to the epidemic. In contrast, the proportion of K. pneumoniae increased over time, which may be related to changes in case-mix and the higher burden of severe hospital-acquired infections during the COVID-19 period. This finding is supported by a national study from Serbia, which reported K. pneumoniae as one of the leading causative agents of bacterial infections among hospitalized patients with COVID-19 [12].
An expectedly low proportion of invasive isolates was observed for both bacterial species. Among non-invasive isolates, urine was the most frequent specimen type for E. coli as well as for K. pneumoniae, confirming their predominant role as uropathogens. This distribution is consistent with the findings of Drakul et al. [25], who reported E. coli as the most frequently isolated pathogen from urine samples, followed by K. pneumoniae. Notably, the proportion of urinary K. pneumoniae isolates increased significantly over the study period. In addition, the proportion of lower respiratory tract isolates increased between 2021 and 2022, which may be partly related to the high burden of severe COVID-19 cases during the later pandemic period and the increased use of invasive mechanical ventilation in hospitalized patients.
4.2. Prevalence and Ward Distribution of Escherichia coli and Klebsiella pneumoniae Isolates
Ward-level distribution provided additional clinical context for interpreting resistance dynamics during 2019–2022. E. coli was most frequently recovered from Internal Medicine and Neurology wards across all years, with relatively stable proportions, consistent with its predominant role as a uropathogen and a common cause of infections managed outside critical care settings. ICU contribution showed a U-shaped pattern, likely reflecting pandemic-related changes in hospital organization and sampling intensity rather than a true epidemiological shift.
In contrast, K. pneumoniae showed a ward distribution more typical of healthcare-associated pathogens, with persistently high proportions in Surgery and the ICU. A marked increase in isolates from the Infectious Diseases and Neurology ward in 2021–2022 may reflect changes in case-mix during the later pandemic period, including a higher burden of severely ill patients, longer hospital stays, and increased exposure to invasive procedures and broad-spectrum antimicrobials. However, ward-level transmission and outbreaks, or clonal spread of carbapenemase-producing lineages, cannot be excluded due to the lack of molecular typing data. Overall, these findings highlight that temporal resistance trends should be interpreted in light of shifting ward structure and patient populations, warranting cautious interpretation of consumption–resistance associations in the absence of patient-level covariates.
4.3. Resistance of Escherichia coli and Klebsiella pneumoniae to Antimicrobials
The decrease in overall E. coli resistance observed in 2020 may reflect changes in patient case-mix and hospital activity during the pandemic, including fewer elective procedures and strengthened infection prevention and control measures. In contrast, resistance of E. coli to most antimicrobial agents increased again during 2021–2022, a trend also reported in Mexico, where resistance rose across nearly all tested agents, including carbapenems [26]. Although the proportion of carbapenem-resistant E. coli increased fourfold in 2021 compared with 2020, the absolute number of such isolates remained very low, and no statistically significant difference in carbapenem resistance was detected across the entire study period. At the national level in Serbia, carbapenem-resistant invasive E. coli also remained rare, increasing from 0.4% in 2019 to 3.2% in 2021 and declining to 1.5% in 2022, a trend consistent with our findings [27].
Resistance of E. coli and K. pneumoniae to cephalosporins, aminoglycosides, and fluoroquinolones, as well as resistance of K. pneumoniae to carbapenems, was approximately 20% lower than the national data for Serbia for invasive isolates in 2022 [27]. This difference may be partly related to the secondary-care setting of our hospital, whereas national surveillance also includes tertiary-care centres, which typically report higher resistance burdens, and possibly also to the implementation of more effective infection control measures compared with other secondary-level facilities. Compared with K. pneumoniae, E. coli showed a more stable and less consistent resistance profile over time.
Resistance of K. pneumoniae to most tested antimicrobials steadily increased during the pandemic, with particularly high levels observed toward its end. A similar trend was reported in hospitals in Turkey [24]. In our study, the most pronounced rise—over fourfold—was observed for carbapenems. According to a report by the Centers for Disease Control and Prevention (CDC), hospital-onset carbapenem-resistant Enterobacterales in the United States increased by 35% during the COVID-19 pandemic [28]. Rises in carbapenem resistance have also been documented in studies from Serbia, Slovenia, Italy, Mexico, and India, highlighting that similar increases were reported internationally during the pandemic period, in parallel with our findings. [13,19,22,26,29,30].
However, by 2022, our isolates showed resistance rates comparable to those reported for general hospitals in Serbia for third-generation cephalosporins (76.9% vs. 75.5%) and carbapenems (53.4% vs. 55.9%) according to data from the Annual Report on Infectious Diseases in the Republic of Serbia for 2022 from the Institute of Public Health of Serbia “Dr Milan Jovanović Batut” [31].
Cross-country comparisons should be interpreted cautiously, as Serbia differs from many EU/EEA settings in terms of antimicrobial prescribing practices, availability of hospital-sector consumption surveillance, limited antimicrobial stewardship capacity, inconsistent infection prevention and control practices, and patient referral patterns. Therefore, although our findings are broadly consistent with international reports of increased broad-spectrum antibiotic use and rising resistance during the COVID-19 period, the magnitude and dynamics of these changes may not be directly comparable across countries.
The marked increase in K. pneumoniae resistance, particularly to carbapenems, should be interpreted cautiously. Besides changes in antimicrobial consumption, alternative explanations may include clonal spread of a successful hospital-adapted lineage, introduction and dissemination of carbapenemase-producing strains (e.g., OXA-48-like or NDM-producing isolates), or multiple parallel transmission events occurring across wards. In addition, the COVID-19 period was associated with major changes in hospital organization and case-mix, including increased ICU burden and intensive use of invasive devices, which may have contributed to a higher diagnostic intensity and altered microbiological sampling patterns. Because molecular typing and carbapenemase characterization were not available in this study, we cannot determine whether the observed rise reflects expansion of a single clone/outbreak or broader endemic transmission, which limits the epidemiological interpretation and the ability to propose targeted containment measures.
At the surveillance level, the prevalence of the MDR E. coli phenotype simultaneously resistant to third-generation cephalosporins, fluoroquinolones, and aminoglycosides is routinely monitored [8]. This was the most prevalent MDR E. coli phenotype identified in the present study, showing an almost threefold increase from 2020 to a peak in 2022 (5.9%), while remaining substantially lower than the prevalence reported among invasive E. coli isolates in Serbia (17%) in the same year [27]. No clear ward-level predominance of this MDR phenotype was observed, as its distribution across hospital wards remained heterogeneous without a consistent concentration in a specific department.
In 2019, the MDR phenotype of K. pneumoniae most commonly involved simultaneous resistance to third-generation cephalosporins, fluoroquinolones, and aminoglycosides (23.4%). Its frequency subsequently declined as resistance to carbapenems increased, giving rise to a broader MDR phenotype. Overall, the prevalence of MDR K. pneumoniae isolates increased by approximately one third, rising from 62.4% in 2019 to 82.9% in 2022. Although these values are high, they remained lower than those reported in the ICU of a tertiary-level institution in Serbia, where MDR K. pneumoniae accounted for 91.2% even before the pandemic [32].
Beyond overall MDR prevalence, ward-specific distribution of MDR phenotypes was also observed. In the Neonatology ward, MDR phenotype I—defined by resistance to amoxicillin/clavulanic acid, cephalosporins, aminoglycosides, and trimethoprim/sulfamethoxazole—was consistently detected in high numbers throughout the study period. This phenotype was uncommon in other wards and remained susceptible to fluoroquinolones and carbapenems. Given the ward-specific persistence of this resistance profile, it may reflect circulation of a hospital-adapted strain within Neonatology. This pattern could also be influenced by local prescribing practices, as fluoroquinolones are not used in neonatal care and carbapenems are rarely administered.
In 2019, the most frequent MDR phenotype overall was phenotype II, characterized by resistance to amoxicillin/clavulanic acid, narrow- and broad-spectrum cephalosporins, aminoglycosides, trimethoprim/sulfamethoxazole, fluoroquinolones, and piperacillin/tazobactam, while remaining susceptible to carbapenems and colistin. This phenotype was most frequently observed in Urology. Over the subsequent three years, the total number of MDR isolates increased, particularly those additionally resistant to carbapenems. Such isolates (phenotype III) were most frequently recovered from Infectious Diseases, Neurology, the ICU, Surgery, and Internal Medicine. Notably, the proportion of K. pneumoniae isolates recovered from the Infectious Diseases ward increased significantly in 2021–2022 compared with 2019–2020 (p < 0.001), coinciding with the higher frequency of MDR phenotype III in these years. Phenotype III was also consistently detected in Nephrology and Urology, which is expected given the role of K. pneumoniae as a frequent cause of catheter-associated urinary tract infections.
The increasing contribution of Surgery and, particularly, the marked rise in Infectious Diseases and Internal Medicine during 2021–2022 may reflect changes in patient case-mix and healthcare exposure during the later pandemic period. In 2022, a higher number of isolates resistant to all tested antimicrobial groups was observed, including isolates with additional resistance to colistin and ceftazidime/avibactam.
Overall, these ward-specific patterns should be interpreted cautiously, as they may reflect localized transmission dynamics and changes in patient case-mix during the COVID-19 period. The lack of molecular typing and carbapenemase characterization limits the epidemiological interpretation of these findings.
4.4. Antimicrobial Consumption
In our hospital, annual antimicrobial consumption increased markedly at the onset of the COVID-19 pandemic, reaching peak values in 2020–2021 that were almost twofold higher than pre-pandemic levels. This was followed by a decline in 2022, when consumption fell below 2019 values. This reduction occurred in 2022, in parallel with strengthened antimicrobial stewardship activities and infection control measures in our hospital.
Comparable trends have been reported in other settings. In Turkey, antimicrobial consumption increased from 72.58 DDD/100BD in the pre-pandemic period to 81.14 DDD/100BD during the early pandemic [24]; although baseline consumption in that hospital was higher than in our setting, the relative increase observed during the pandemic was greater in our hospital, with 2020 values exceeding those reported in Turkey.
Even more pronounced increases were documented elsewhere. In Spain, a 77% rise in hospital antimicrobial consumption during the first pandemic wave was reported, increasing from 79.94 to 141.10 DDD/100 BD [33]. Similar increases were observed in studies from the United States, Portugal, Spain, and Pakistan [34,35,36,37,38].
However, trends differed in some settings. Spanish hospitals reported a decline in antimicrobial consumption as early as the second quarter of 2020 [39], whereas in our study, a reduction was not observed until 2022.
Although direct comparison is limited by differences in measurement approaches, the observed increase in broad-spectrum antimicrobial consumption in our study, representing an approximately 50% relative increase (from 45.4% in 2019 to 67.8% in 2021), is consistent with the EU/EEA-reported shift toward broader-spectrum and last-line agents, particularly carbapenems, during the same period [40].
To complement DDD/100 bed–days, we used the Drug Utilization 75% (DU75%) metric to identify the antimicrobials accounting for 75% of total consumption, as an indicator of prescribing concentration and stewardship priorities, rather than a direct driver of resistance. During the study period, marked changes in antimicrobial consumption patterns were observed. Broad-spectrum agents, particularly ceftriaxone, meropenem, and vancomycin, exhibited marked increases during 2020–2021, whereas narrow-spectrum antimicrobials, including first- and second-generation cephalosporins, gentamicin, and trimethoprim/sulfamethoxazole, demonstrated a decline. The increased use of carbapenems may have been influenced by rising resistance to third-generation cephalosporins among Gram-negative pathogens and a shift toward broader-spectrum empirical therapy during the pandemic period. At the same time, cefazolin use declined, as it is primarily employed for surgical prophylaxis, and the number of surgical procedures decreased during the pandemic, a trend observed both in our hospital and worldwide [24].
In our study, ceftriaxone was the most frequently prescribed antimicrobial. This finding is consistent with reports from a Serbian tertiary-care hospital treating COVID-19 patients, where ceftriaxone also predominated, followed by fluoroquinolones and carbapenems [41]. In contrast, in our hospital, carbapenem use exceeded that of fluoroquinolones, which were restricted due to the risk of Clostridioides difficile infection. According to Gajić et al. [12], metronidazole, glycopeptides, and cephalosporins were most frequently prescribed in other Serbian tertiary-care centers treating COVID-19 patients, which contrasts with our findings, where ceftriaxone, vancomycin, and meropenem predominated. Increases in broad-spectrum antimicrobial use during the first pandemic waves have also been reported in hospitals in Switzerland and Turkey [23,24]. In contrast, studies from Israel highlight that strict adherence to antimicrobial stewardship guidelines during successive COVID-19 waves resulted in reduced consumption [42]. A decline following the same pattern was achieved in our hospital, although only in 2022, reflecting both accumulated knowledge about COVID-19 and renewed stewardship and infection control efforts.
4.5. Correlation Between Antimicrobial Resistance of Escherichia coli and Klebsiella pneumoniae and Antimicrobial Consumption
Changes in E. coli resistance did not mirror trends in the consumption of the corresponding antimicrobials, with resistance remaining relatively stable despite marked fluctuations in consumption. Notably, levofloxacin consumption increased in 2020–2021, whereas E. coli resistance decreased in 2020 before rising again in 2022, indicating a non-parallel (“U-shaped”) pattern. For K. pneumoniae, resistance increased during 2020–2021 in parallel with increased antimicrobial use; however, resistance did not decline in 2022 despite reduced consumption, showing only a slower rate of increase. Overall, no statistically significant correlations between antimicrobial consumption and resistance were observed. These findings should be interpreted cautiously, as consumption–resistance relationships may require longer observation periods to be reliably detected, as highlighted by Peñalva et al. [43]. In addition, resistance to one antimicrobial may be influenced by the use of another through co-selection mechanisms [43]; for example, broad-spectrum cephalosporins can co-select fluoroquinolone resistance when resistance determinants are carried on the same plasmid [44]. Moreover, changes in infection prevention and control practices can substantially shape resistance trends, particularly for K. pneumoniae, which is predominantly associated with healthcare-related infections [43]. Given the retrospective observational design and the lack of significant correlations, causal relationships cannot be inferred.
By contrast, Medic et al. [45] (2023) reported significant positive associations in Serbia, particularly between meropenem, ceftriaxone, and levofloxacin consumption and resistance of invasive K. pneumoniae, as well as between ertapenem use and resistance of invasive K. pneumoniae and E. coli. These discrepancies may reflect differences in study design, the inclusion of invasive versus non-invasive isolates, and the higher resistance burden typically observed in tertiary-care settings compared with secondary hospitals such as ours.
Beyond hospital practices, resistance levels in human isolates are also influenced by antimicrobial use in food-producing animals, highlighting the need for an integrated One Health approach to antimicrobial resistance.
Several limitations should be noted. First, this was a single-center study, which may limit the generalizability of the findings to other hospitals in Serbia, particularly tertiary-care institutions. Second, due to the retrospective design and limitations of the microbiology database, we were unable to assess molecular epidemiology and reliably link all isolates to patient-level clinical data (e.g., demographics, comorbidities, COVID-19 status, prior antibiotic exposure, or clinical outcomes). Therefore, multivariable analyses to control for confounding could not be performed. Consequently, temporal changes in resistance and antimicrobial consumption should be interpreted as ecological trends, with possible residual confounding, as the consumption–resistance correlation was based on aggregated annual hospital-level data and therefore has limited sensitivity to ecological bias and time-lagged effects. Third, prescribing appropriateness was not assessed; therefore, changes in antimicrobial consumption cannot be attributed to guideline-concordant empirical therapy, overtreatment, or shifts in disease severity. In addition, COVID-19-related changes in infection prevention and control practices and hospital reorganization may have influenced both sampling intensity and transmission dynamics, independently of antimicrobial use. Fourth, due to restricted material resources and national drug registration constraints, susceptibility testing was not available for all antimicrobials throughout the study period, precluding assessment of extensively drug-resistant (XDR) and pandrug-resistant (PDR) phenotypes. Colistin testing was performed selectively and not systematically across study years, which may introduce selection bias and limits interpretation of temporal changes. Susceptibility for newer β-lactam/β-lactamase inhibitor combinations was introduced after their clinical availability. Testing for ceftazidime/avibactam was introduced in 2022; therefore, resistance to these agents may therefore be underestimated.
Despite these limitations, the inclusion of both invasive and non-invasive isolates of E. coli and K. pneumoniae over a four-year period, combined with hospital antimicrobial consumption data, provides valuable insight into local resistance dynamics in a secondary-care hospital setting.
5. Conclusions
This study provides insight into antimicrobial resistance and antimicrobial consumption patterns in a secondary-care hospital in Serbia during 2019–2022. Resistance in K. pneumoniae, particularly to carbapenems, increased substantially over the study period, while hospital antimicrobial consumption peaked in 2020–2021 and declined in 2022. The findings support the need for sustained local surveillance and targeted stewardship efforts focusing on high-use agents (e.g., ceftriaxone and meropenem) and high-risk settings such as the ICU.
Supplementary Materials
The following supporting information can be downloaded at https://www.mdpi.com/article/10.3390/microbiolres17020040/s1. Figure S1: Dynamics of the number of MDR Klebsiella pneumoniae isolates resistant to eight antibiotic classes by ward; Table S1: Distribution of MDR Escherichia coli isolates by hospital ward, 2019–2022; Table S2: Distribution of MDR Klebsiella pneumoniae isolates by hospital ward, 2019–2022; Table S3: Distribution of a the three most common MDR phenotypes of K. pneumoniae by ward.
Author Contributions
Conceptualization, N.O. and I.G.; writing—original draft preparation, M.B., M.J.P. and A.T.; writing—review and editing, N.O. and I.G.; results visualization, M.J.P. and A.T.; supervision, I.G. and N.O. All authors have read and agreed to the published version of the manuscript.
Funding
This study was supported by the Science Fund of the Republic of Serbia, Grant No. 7042, Tracking antimicrobial resistance in diverse ecological niches—one health perspective-TRACE.
Institutional Review Board Statement
The study was conducted in accordance with the Declaration of Helsinki. The study was approved by the Ethics Committee of the Healthcare Center Užice, General Hospital Užice (protocol code 1131/6, 10 February 2025).
Informed Consent Statement
The bacterial isolates were obtained during routine microbiological diagnostics performed as part of standard clinical care. The study retrospectively evaluated relevant laboratory data and antimicrobial consumption data obtained from the hospital pharmacy, all of which were fully anonymised before analysis. No identifying patient or participant information (including personal details, images, or videos relating to any individual) was evaluated or used in the study. In accordance with local legislation, informed consent for participation is not required for non-interventional, retrospective studies based on anonymised data.
Data Availability Statement
The original contributions presented in this study are included in the article/supplementary material. Further inquiries can be directed to the corresponding authors.
Conflicts of Interest
The authors declare no conflicts of interest.
Abbreviations
The following abbreviations are used in this manuscript:
| AMR | Antimicrobial resistance |
| ECDC | European Centre for Disease Prevention and Control |
| EU/EEA | European Union/European Economic Area |
| OECD | Organisation for Economic Co-operation and Development |
| WHO | World Health Organization |
| COVID-19 | Coronavirus Disease 2019 |
| DDD | Defined Daily Dose |
| ICU | Intensive care unit |
| EUCAST | European Committee on Antimicrobial Susceptibility Testing |
| MDR | Multidrug resistance |
| EARS-Net | European Antimicrobial Resistance Surveillance Network |
| ATC | Anatomical Therapeutic Chemical |
| DDD/100BD | DDDs per 100 bed–days |
| ESAC-Net | European Surveillance of Antimicrobial Consumption Network |
| DU75% | Drug Utilization 75% |
| CDC | Centers for Disease Control and Prevention |
| AMC | Amoxicillin/Clavulanic acid |
| PIT | Piperacillin/tazobactam |
| TRS | Trimethoprim/Sulfamethoxazole |
| PDR | Pandrug-resistant |
| XDR | Extensively drug-resistant |
Appendix A
Figure A1.
Flow chart of isolate selection and inclusion.
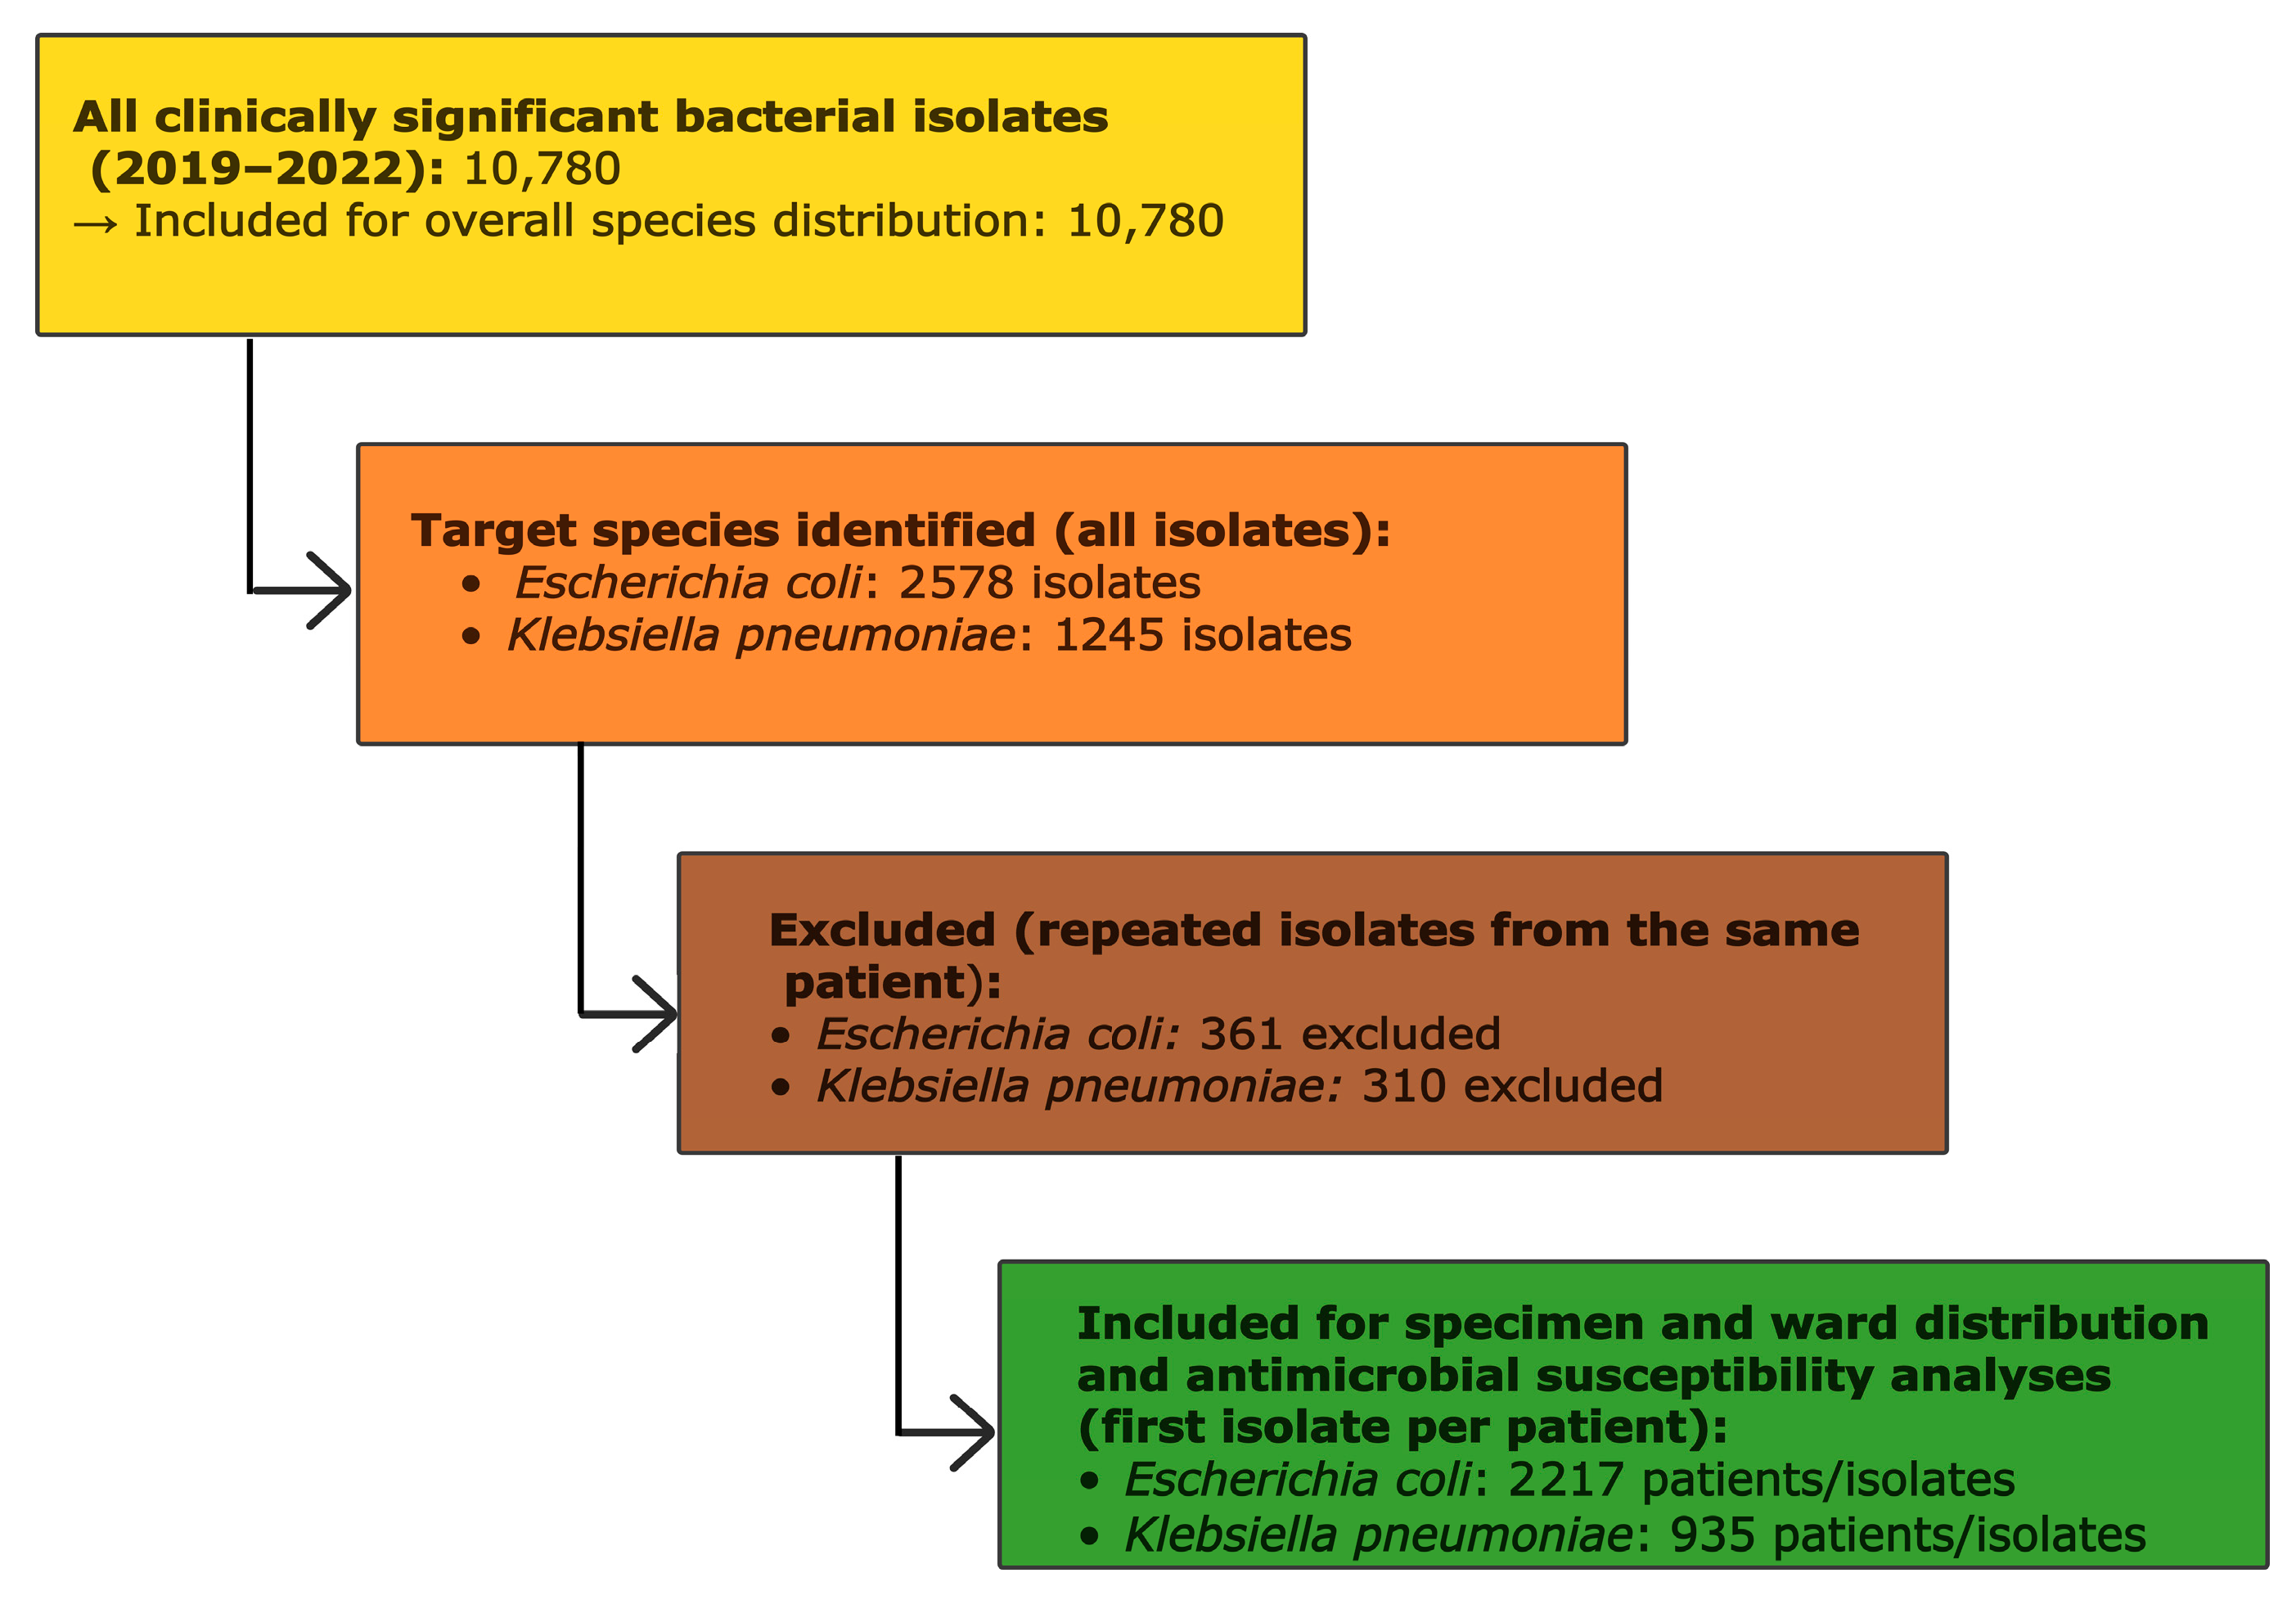
Table A1.
Distribution of the most frequently isolated bacterial species among all isolates, 2019–2022.
Table A2.
Resistance rates of Escherichia coli isolates to antimicrobials, 2019–2022.
Table A3.
Resistance of Klebsiella pneumoniae isolates to antimicrobials 2019–2022.
Figure A2.
Antimicrobials accounting for 75% (DU75) of annual hospital consumption, expressed as defined daily doses per 100 bed–days (DDD/100 BD) and relative proportions, 2019–2022.
References
- The Lancet. Antimicrobial Resistance: An Agenda for All. Lancet 2024, 403, 2349. [Google Scholar] [CrossRef] [Scilit]
- European Centre for Disease Prevention and Control. Assessing the Health Burden of Infections with Antibiotic-Resistant Bacteria in the EU/EEA, 2016–2020; ECDC: Stockholm, Sweden, 2022. [Google Scholar]
- Naghavi, M.; Vollset, S.E.; Ikuta, K.S.; Swetschinski, L.R.; Gray, A.P.; Wool, E.E.; Robles Aguilar, G.; Mestrovic, T.; Smith, G.; Han, C.; et al. Global Burden of Bacterial Antimicrobial Resistance 1990–2021: A Systematic Analysis with Forecasts to 2050. Lancet 2024, 404, 1199–1226. [Google Scholar] [CrossRef] [Scilit]
- World Health Organization. Antimicrobial Resistance. 2023. Available online: https://www.who.int/news-room/fact-sheets/detail/antimicrobial-resistance (accessed on 3 June 2025).
- OECD. Fighting Antimicrobial Resistance in EU and EEA Countries; OECD: Paris, France, 2023; Available online: https://www.oecd.org (accessed on 3 June 2025).
- World Health Organization. WHO Bacterial Priority Pathogens List 2024: Bacterial Pathogens of Public Health Importance, to Guide Research, Development, and Strategies to Prevent and Control Antimicrobial Resistance, 1st ed.; WHO: Geneva, Switzerland, 2024. [Google Scholar]
- European Centre for Disease Prevention and Control. Point Prevalence Survey of Healthcare-Associated Infections and Antimicrobial Use in European Acute Care Hospitals, 2022–2023; Publications Office of the European Union: Luxembourg, 2024. [Google Scholar] [CrossRef]
- European Centre for Disease Prevention and Control. Antimicrobial Resistance in the EU/EEA (EARS-Net)—Annual Epidemiological Report 2022; ECDC: Stockholm, Sweden, 2023. [Google Scholar]
- Tomas, A.; Pavlović, N.; Stilinović, N.; Horvat, O.; Paut-Kusturica, M.; Dugandžija, T.; Tomić, Z.; Sabo, A. Increase and Change in the Pattern of Antibiotic Use in Serbia (2010–2019). Antibiotics 2021, 10, 397. [Google Scholar] [CrossRef] [Scilit]
- WHO Regional Office for Europe. Antimicrobial Medicines Consumption (AMC) Network: AMC Data 2019; WHO Regional Office for Europe: Copenhagen, Denmark, 2022; Available online: https://www.who.int/europe/publications/i/item/9789289058278 (accessed on 5 June 2025).
- Langford, B.J.; So, M.; Raybardhan, S.; Leung, V.; Soucy, J.-P.R.; Westwood, D.; Daneman, N.; MacFadden, D.R. Antibiotic Prescribing in Patients with COVID-19: Rapid Review and Meta-Analysis. Clin. Microbiol. Infect. 2021, 27, 520–531. [Google Scholar] [CrossRef] [Scilit]
- Gajic, I.; Jovicevic, M.; Popadic, V.; Trudic, A.; Kabic, J.; Kekic, D.; Ilic, A.; Klasnja, S.; Hadnadjev, M.; Popadic, D.J.; et al. The Emergence of Multidrug-Resistant Bacteria Causing Healthcare-Associated Infections in COVID-19 Patients—A Retrospective Multi-Centre Study. J. Hosp. Infect. 2023, 137, 1–7. [Google Scholar] [CrossRef] [Scilit]
- Despotovic, A.; Milosevic, B.; Cirkovic, A.; Vujovic, A.; Cucanic, K.; Cucanic, T.; Stevanovic, G. The Impact of COVID-19 on the Profile of Hospital-Acquired Infections in Adult Intensive Care Units. Antibiotics 2021, 10, 1146. [Google Scholar] [CrossRef] [Scilit] [PubMed]
- The European Committee on Antimicrobial Susceptibility Testing. Breakpoint Tables for Interpretation of MICs and Zone Diameters, Version 15.0. 2025. Available online: https://www.eucast.org/bacteria/clinical-breakpoints-and-interpretation/clinical-breakpoint-tables/ (accessed on 3 December 2025).
- Magiorakos, A.-P.; Srinivasan, A.; Carey, R.B.; Carmeli, Y.; Falagas, M.E.; Giske, C.G.; Harbarth, S.; Hindler, J.F.; Kahlmeter, G.; Olsson-Liljequist, B.; et al. Multidrug-resistant, extensively drug-resistant and pandrug-resistant bacteria: An international expert proposal for interim standard definitions for acquired resistance. Clin. Microbiol. Infect. 2012, 18, 268–281. [Google Scholar] [CrossRef] [Scilit] [PubMed]
- European Centre for Disease Prevention and Control. Antimicrobial Resistance in the EU/EEA (EARS-Net)—Annual Epidemiological Report 2024; ECDC: Stockholm, Sweden, 2025. [Google Scholar]
- WHO Collaborating Centre for Drug Statistics Methodology. Use of ATC/DDD; WHO CC: Oslo, Norway, 2022; Available online: https://atcddd.fhi.no/use_of_atc_ddd/use_of_atc_ddd (accessed on 3 June 2025).
- European Centre for Disease Prevention and Control. Antimicrobial Consumption in the EU/EEA (ESAC-Net)—Annual Epidemiological Report 2022; ECDC: Stockholm, Sweden, 2023. [Google Scholar]
- Cerini, P.; Meduri, F.R.; Tomassetti, F.; Polidori, I.; Brugneti, M.; Nicolai, E.; Bernardini, S.; Pieri, M.; Broccolo, F. Trends in Antibiotic Resistance of Nosocomial and Community-Acquired Infections in Italy. Antibiotics 2023, 12, 651. [Google Scholar] [CrossRef] [Scilit] [PubMed]
- Lai, C.C.; Chen, S.Y.; Ko, W.C.; Hsueh, P.-R. Increased Antimicrobial Resistance during the COVID-19 Pandemic. Int. J. Antimicrob. Agents 2021, 57, 106324. [Google Scholar] [CrossRef] [Scilit]
- Nori, P.; Szymczak, W.; Puius, Y.; Sharma, A.; Cowman, K.; Gialanella, P.; Fleischner, Z.; Corpuz, M.; Torres-Isasiga, J.; Bartash, R.; et al. Emerging Co-Pathogens: New Delhi Metallo-Beta-Lactamase-Producing Enterobacterales Infections in New York City COVID-19 Patients. Int. J. Antimicrob. Agents 2020, 56, 106179. [Google Scholar] [CrossRef] [Scilit]
- Tiri, B.; Sensi, E.; Marsiliani, V.; Cantarini, M.; Priante, G.; Vernelli, C.; Martella, L.A.; Costantini, M.; Mariottini, A.; Andreani, P.; et al. Antimicrobial Stewardship Program, COVID-19, and Infection Control: Spread of Carbapenem-Resistant Klebsiella pneumoniae Colonization in ICU COVID-19 Patients—What Did Not Work? J. Clin. Med. 2020, 9, 2744. [Google Scholar] [CrossRef] [Scilit]
- Friedli, O.; Gasser, M.; Cusini, A.; Fulchini, R.; Vuichard-Gysin, D.; Halder Tobler, R.; Wassilew, N.; Pluess-Suard, C.; Kronenberg, A. Impact of the COVID-19 Pandemic on Inpatient Antibiotic Consumption in Switzerland. Antibiotics 2022, 11, 792. [Google Scholar] [CrossRef] [Scilit]
- HamiDi, A.A.; Yilmaz, S. Antibiotic Consumption in the Hospital during COVID-19 Pandemic, Distribution of Bacterial Agents and Antimicrobial Resistance: A Single-Center Study. J. Surg. Med. 2021, 5, 124–127. [Google Scholar] [CrossRef] [Scilit]
- Drakul, D.; Joksimović, B.; Pejčić, A.V.; Živković-Zarić, R.; Marić, S.; Mijović, B.; Ivanović, T.; Erbez, D.; Sokolović, D. Rising Prevalence of Multidrug-Resistant Klebsiella spp. in Urinary Tract Infections: A Study from Doboj Hospital. Antibiotics 2025, 14, 1234. [Google Scholar] [CrossRef] [Scilit] [PubMed]
- López-Jácome, L.E.; Fernández-Rodríguez, D.; Franco-Cendejas, R.; Camacho-Ortiz, A.; Morfin-Otero, M.D.R.; Rodríguez-Noriega, E.; Ponce-de-León, A.; Ortiz-Brizuela, E.; Rojas-Larios, F.; Velázquez-Acosta, M.D.C.; et al. Increment Antimicrobial Resistance during the COVID-19 Pandemic: Results from the INVIFAR Network. Microb. Drug Resist. 2022, 28, 338–345. [Google Scholar] [CrossRef] [Scilit] [PubMed]
- Institute of Public Health of Vojvodina. Report on Antimicrobial Resistance of Invasive Bacterial Isolates in 2022; Institute of Public Health of Vojvodina: Novi Sad, Serbia, 2023; Available online: https://izjzv.org.rs/?lng=lat&cir=0&link=4-22 (accessed on 2 April 2024).
- CDC. COVID-19: U.S. Impact on Antimicrobial Resistance, Special Report 2022; National Center for Emerging and Zoonotic Infectious Diseases: Atlanta, GA, USA, 2022. [CrossRef] [Scilit]
- Mrvič, T.; Stevanoska, S.; Beović, B.; Logar, M.; Gregorčič, S.; Žnidaršič, B.; Seme, K.; Velimirović, I.; Švent Kučina, N.; Maver Vodičar, P.; et al. The Impact of COVID-19 on Multidrug-Resistant Bacteria at a Slovenian Tertiary Medical Center. Antibiotics 2024, 13, 214. [Google Scholar] [CrossRef] [Scilit]
- Saini, V.; Jain, C.; Singh, N.P.; Alsulimani, A.; Gupta, C.; Dar, S.A.; Haque, S.; Das, S. Paradigm Shift in Antimicrobial Resistance Pattern of Bacterial Isolates during the COVID-19 Pandemic. Antibiotics 2021, 10, 954. [Google Scholar] [CrossRef] [Scilit] [PubMed]
- Institute of Public Health of Serbia “Dr Milan Jovanović Batut”. Report on Infectious Diseases in the Republic of Serbia for 2022; Institute of Public Health of Serbia: Belgrade, Serbia, 2023; Available online: https://www.batut.org.rs/download/izvestaji/GodisnjiIzvestajZarazneBolestiSrbija2022.pdf (accessed on 8 April 2024).
- Despotovic, A.; Milosevic, B.; Milosevic, I.; Mitrovic, N.; Cirkovic, A.; Jovanovic, S.; Stevanovic, G. Hospital-Acquired Infections in the Adult Intensive Care Unit—Epidemiology, Antimicrobial Resistance Patterns, and Risk Factors for Acquisition and Mortality. Am. J. Infect. Control 2020, 48, 1211–1215. [Google Scholar] [CrossRef] [Scilit]
- Prado, P.T.; Cebas, A.L.; Artola, B.S.; Herrejon, E.P.; Cano, E.; Ortiz, S.S.; Díaz, A.; Casado, S.E.; Garcia, E.I.; Alonso, E.Á.; et al. Coronavirus First Wave Effect on Antibiotic Consumption and Antimicrobial Resistance. Eur. J. Hosp. Pharm. 2021, 28, A38.1. [Google Scholar] [CrossRef] [Scilit]
- Bork, J.T.; Leekha, S.; Claeys, K.; Seung, H.; Tripoli, M.; Amoroso, A.; Heil, E.L. Change in Hospital Antibiotic Use and Acquisition of Multidrug-Resistant Gram-Negative Organisms after the Onset of Coronavirus Disease 2019. Infect. Control Hosp. Epidemiol. 2021, 42, 1115–1117. [Google Scholar] [CrossRef] [Scilit]
- Castro-Lopes, A.; Correia, S.; Leal, C.; Resende, I.; Soares, P.; Azevedo, A.; Paiva, J.-A. Increase of Antimicrobial Consumption in a Tertiary Care Hospital during the First Phase of the COVID-19 Pandemic. Antibiotics 2021, 10, 778. [Google Scholar] [CrossRef] [Scilit] [PubMed]
- Grau, S.; Echeverria-Esnal, D.; Gómez-Zorrilla, S.; Navarrete-Rouco, M.E.; Masclans, J.R.; Espona, M.; Gracia-Arnillas, M.P.; Duran, X.; Comas, M.; Horcajada, J.P. Evolution of Antimicrobial Consumption during the First Wave of COVID-19 Pandemic. Antibiotics 2021, 10, 132. [Google Scholar] [CrossRef] [Scilit] [PubMed]
- Ponce-Alonso, M.; Sáez de la Fuente, J.; Rincón-Carlavilla, A.; Moreno-Nunez, P.; Martínez-García, L.; Escudero-Sánchez, R.; Pintor, R.; García-Fernández, S.; Cobo, J. Impact of the Coronavirus Disease 2019 (COVID-19) Pandemic on Nosocomial Clostridioides difficile Infection. Infect. Control Hosp. Epidemiol. 2021, 42, 406–410. [Google Scholar] [CrossRef] [Scilit] [PubMed]
- Ul Mustafa, Z.; Salman, M.; Aldeyab, M.; Kow, C.S.; Hasan, S.S. Antimicrobial Consumption among Hospitalized Patients with COVID-19 in Pakistan. SN Compr. Clin. Med. 2021, 3, 1691–1695. [Google Scholar] [CrossRef] [Scilit] [PubMed]
- Guisado-Gil, A.B.; Infante-Domínguez, C.; Peñalva, G.; Praena, J.; Roca, C.; Navarro-Amuedo, M.D.; Aguilar-Guisado, M.; Espinosa-Aguilera, N.; Poyato-Borrego, M.; Romero-Rodríguez, N.; et al. Impact of the COVID-19 Pandemic on Antimicrobial Consumption and Hospital-Acquired Candidemia and Multidrug-Resistant Bloodstream Infections. Antibiotics 2020, 9, 816. [Google Scholar] [CrossRef] [Scilit]
- European Centre for Disease Prevention and Control. Antimicrobial Consumption in the EU/EEA (ESAC-Net)—Annual Epidemiological Report 2021; ECDC: Stockholm, Sweden, 2022. [Google Scholar]
- Despotović, A.; Barać, A.; Cucanić, T.; Cucanić, K.; Stevanović, G. Antibiotic (Mis)Use in COVID-19 Patients before and after Admission to a Tertiary Hospital in Serbia. Antibiotics 2022, 11, 847. [Google Scholar] [CrossRef] [Scilit] [PubMed]
- Henig, O.; Kehat, O.; Meijer, S.E.; Chikly, A.; Weiss-Meilik, A.; Egoz, E.; Ben-Ami, R.; Paran, Y. Antibiotic Use during the COVID-19 Pandemic in a Tertiary Hospital with an Ongoing Antibiotic Stewardship Program. Antibiotics 2021, 10, 1056. [Google Scholar] [CrossRef] [Scilit] [PubMed]
- Peñalva, G.; Högberg, L.D.; Weist, K.; Vlahović-Palčevski, V.; Heuer, O.; Monnet, D.L.; Vandael, E.; Ivanov, I.N.; Payerl-Pal, M.; Skjold Selle Pedersen, K.; et al. Decreasing and Stabilising Trends of Antimicrobial Consumption and Resistance in Escherichia coli and Klebsiella pneumoniae in Segmented Regression Analysis, European Union/European Economic Area, 2001 to 2018. Eurosurveillance 2019, 24, 1900656. [Google Scholar] [CrossRef] [Scilit] [PubMed]
- Ryu, S.; Klein, E.Y.; Chun, B.C. Temporal Association between Antibiotic Use and Resistance in Klebsiella pneumoniae at a Tertiary Care Hospital. Antimicrob. Resist. Infect. Control 2018, 7, 83. [Google Scholar] [CrossRef] [Scilit]
- Medic, D.; Bozic Cvijan, B.; Bajcetic, M. Impact of Antibiotic Consumption on Antimicrobial Resistance to Invasive Hospital Pathogens. Antibiotics 2023, 12, 259. [Google Scholar] [CrossRef] [Scilit]

Disclaimer/Publisher’s Note: The statements, opinions and data contained in all publications are solely those of the individual author(s) and contributor(s) and not of MDPI and/or the editor(s). MDPI and/or the editor(s) disclaim responsibility for any injury to people or property resulting from any ideas, methods, instructions or products referred to in the content. |
© 2026 by the authors. Licensee MDPI, Basel, Switzerland. This article is an open access article distributed under the terms and conditions of the Creative Commons Attribution (CC BY) license.