


Abstract
The growing adoption of electric vehicles (EVs) and the increasing need for coordinated charging and energy management have highlighted the importance of vehicle-to-everything (V2X) technologies within battery management systems (BMSs). However, existing studies often treat EVs as idealized storage systems, overlooking battery and BMS-related operational constraints, and typically analyze driving, charging, and bidirectional energy exchange in isolation, limiting realistic, end-to-end evaluation of daily operation scenarios. This paper addresses these gaps by analyzing how advanced, BMS-integrated V2X capabilities can be deployed in real-world EV operation, focusing on battery utilization, operational performance, and system-level energy interactions. A unified, scenario-based methodology combines mobility demand, AC/DC charging behavior, and bidirectional V2X services within a single daily operational framework. Representative use cases for both passenger EVs and electric light commercial vehicles (eLCVs) are developed to capture realistic driving patterns, environmental conditions, and energy exchange scenarios. The results indicate that V2X operation can provide substantial gross economic value in the investigated scenarios. For the eLCV cases, the estimated increase in equivalent full cycle (EFC) throughput rate ranges from approximately 14.3% to 30.3%, while combined summer–winter cumulative avoided electricity purchase cost reaches approximately EUR 4033 for the higher-power charging strategy, equivalent to 57.0% of the adopted battery cost reference. The analysis also highlights the strong influence of ambient temperature and usage patterns on energy consumption, charging strategies, and overall system performance. Overall, this work provides a holistic and practical evaluation framework for V2X-enabled BMS operation, demonstrating its potential to improve grid support, enhance energy efficiency, and support sustainable EV integration while balancing economic and battery-lifetime trade-offs.
1. Introduction
Vehicle-to-everything (V2X) is a bidirectional charging and/or communication technology that enables vehicles to communicate with other vehicles (V2V), infrastructure (V2I), pedestrians (V2P), and the electrical grid (V2G). Through such integration, road safety, traffic efficiency, and energy management can be enhanced by facilitating real-time data exchange. The growing adoption of electric vehicles (EVs) and the need for coordinated charging of an expanding EV fleet have highlighted the importance of V2X technologies [1,2,3,4,5,6].
In an electric vehicle (EV), V2X functions can be integrated into an advanced battery management system (BMS). V2X enables the BMS to communicate with the grid and other infrastructure, allowing for intelligent scheduling of charging and discharging cycles. This coordination ensures that vehicles charge during off-peak hours when electricity is cheaper and discharge during peak demand, benefiting both the grid and the vehicle owner [1,2,3,4,5,7,8]. By managing energy flows more effectively, a V2X-equipped BMS can shape battery cycling and, depending on the operating strategy, mitigate battery-aging impacts [9]. At the grid level, EVs can act as distributed energy resources, providing ancillary services such as frequency regulation and load balancing, which are crucial for grid stability, especially for intermittent renewable energy sources. By integrating V2X technology into BMSs, EVs become active participants in the energy ecosystem, contributing to a more resilient and efficient power grid [1,2,3,4,5,7,10].
Despite this progress, several gaps still constrain the translation of V2X concepts into robust, routine operational practice. First, many studies prioritize grid-side scheduling or service provision while modeling the EV as an idealized storage system, thereby under-representing battery- and BMS-related operational constraints, such as usable energy windows, mobility reserves, charging-power limitations, and allowable operating boundaries that are essential for safe and repeatable bidirectional operation. Second, driving energy demand, AC/DC charging behavior, and bidirectional V2X services are frequently examined in isolation, limiting the ability to evaluate end-to-end performance over realistic day-scale timelines. Third, resilience-oriented use cases (e.g., supplying critical household or facility loads during outages or peak-demand periods) are widely discussed, yet they are not consistently embedded within harmonized scenario definitions that simultaneously preserve mobility requirements. Finally, while passenger EVs dominate the literature, electric light commercial vehicles (eLCVs) remain comparatively underrepresented despite their distinctive duty cycles and potential suitability for structured charging and V2X service delivery.
Representative recent studies illustrate these complementary emphases. Table 1 positions the present framework against selected V2X studies with respect to operational representation, charging/V2X scope, and battery/economic treatment.
Table 1 shows that recent work typically focuses on a dominant problem such as real-world V2X deployment [4], charging/discharging optimization [8,11,12], battery-aging quantification [9,13], or industrial-fleet demand response [14]. Station-level battery-to-everything (B2X)/V2X formulations likewise emphasize infrastructure flexibility [6]. The present study does not seek to replace these specialized models. Instead, it addresses the complementary gap of integrating vehicle-specific mobility, seasonal energy demand, AC/DC charging feasibility, SoC and mobility reserves, and V2X operation across both passenger EV and eLCV daily duty cycles, followed by a common battery-throughput and economic assessment.
Table 1.
Positioning of the present framework relative to representative V2X studies. The comparison emphasizes methodological scope rather than direct performance ranking.
Against this background, the present work builds on the systematic identification and analysis of relevant V2X use cases within the InnoBMS project. This effort ensures that the scenarios considered in this study reflect practical requirements, stakeholder needs, and future deployment conditions. This work extends the previous study presented at the EVS 38 conference [15], where initial V2X scenario analyses were introduced.
Compared with the preliminary scenario analysis presented at EVS 38 [15], the present work extends the evaluation in three main ways. First, the passenger EV V2G analysis is updated using the publicly available NOVAREF residential load dataset, providing data-derived seasonal household demand profiles and revised V2G energy requirements. Second, a first-order battery-lifetime assessment is introduced for both passenger EV and eLCV scenarios using equivalent full cycle (EFC) throughput, with the cycle-life reference grounded in experimental battery degradation data. Third, the battery-throughput analysis is coupled with an economic assessment using electricity price and battery cost data to quantify daily avoided electricity purchase cost, cumulative avoided electricity purchase cost over the estimated operating lifetime, and its ratio to the adopted battery cost reference. Consequently, the present study extends the previous operational use-case definition toward a quantitative assessment of the trade-off between V2X utilization, battery aging, mobility requirements, and gross economic value.
In particular, the contributions of this work are: (1) a unified day-scale framework linking mobility demand, AC/DC charging, and bidirectional V2X operation under vehicle-specific operating constraints for both passenger EVs and eLCVs; (2) a data-grounded evaluation of residential V2G operation using season-dependent NOVAREF load profiles, together with corresponding updates to charging and energy-exchange requirements; (3) a first-order EFC-based assessment of the additional battery cycling imposed by V2X operation, supported by experimental battery degradation data; and (4) a coupled battery-lifetime and economic analysis quantifying the trade-off between V2X-induced battery throughput and cumulative avoided electricity purchase cost, with the latter also expressed relative to the adopted battery cost reference. The novelty of the present work therefore lies not in introducing V2X operation itself but in integrating vehicle-specific mobility, charging, and V2X schedules with data-grounded demand profiles and an explicit battery throughput/economic assessment within a common day-scale framework.
2. EV Use Cases
A use case is defined here as a scenario describing how an EV is used to meet specific objectives under environmental and operational constraints. The use cases were developed through an InnoBMS questionnaire, literature review, and external consultations. For the eLCV use case, representatives of courier companies were interviewed using a technical questionnaire on company-level fleet operations. The interviews concerned company operations rather than the representatives themselves. No personal data from the representatives were analyzed or reported. The participating companies are not identified to preserve commercial confidentiality. This approach ensured that the selected use cases reflect realistic, meaningful challenges and expectations for the next generation of BMSs.
In the context of European vehicle taxonomy, EVs are classified into specific segments that reflect their size, design, and intended use. This classification system helps standardize performance expectations and infrastructure planning across the EV market. The European Commission passenger car classification aligns with the traditional internal combustion engine (ICE) vehicle classifications and includes the following segments: (A) city cars, (B) small cars, (C) medium cars, (D) large cars, (E) executive cars, (F) luxury cars, (S) sport coupes, (J) sport utility cars, and (M) multipurpose cars or multipurpose vehicles (MPVs) [16].
Two EVs are considered: the e-Doblò and eDaily. Although the e-Doblò belongs to the M segment, it is treated as a passenger vehicle because the use case represents personal transport. The eDaily belongs to the LCV category and represents the more energy-demanding and operationally constrained vehicle segment [1]. The distinction is important, as the differing energy needs, driving patterns, and infrastructure requirements of these vehicle types influence the design and evaluation of battery management strategies, especially for V2X and bidirectional energy flow scenarios.
2.1. Passenger EV Base Use Case
The passenger EV base use case defines operational scenarios and load cycles that reflect anticipated usage patterns and demands. Key assumptions include daily driving distance, battery capacity, and energy costs [1]. These factors provide the basis for evaluating V2X feasibility and economic implications within the European market and assessing BMS operation in everyday urban and suburban driving.
The scenario assumes that a user commutes in an e-Doblò 22.8 km each way, from home to work in the morning and back in the evening, totaling approximately 45.6 km per day. Figure 1 shows the use case throughout the workday. The vehicle is active during two specific driving phases: 7:00–7:30 for the morning commute and 15:30–16:00 for the return home. Between these driving periods, the vehicle remains stationary and is typically parked at the workplace, but is not plugged into a charging station.
Figure 1.
Daily operational timeline of the passenger EV use case, including the morning commute, workplace parking, afternoon commute, preparatory charging, V2G operation, and overnight charging.
Upon arrival at home, the passenger EV is first charged from 16:00 to 17:00 in preparation for V2G operation from 17:00 to 23:00. During the V2G phase, the bidirectional charger manages energy exchange based on grid conditions and the battery state of charge (SoC). Bidirectional energy flow considers grid stability, energy demand, and renewable energy availability. Excess energy can be stored in the EV battery and discharged back to the grid when needed. During this phase, the battery SoC must remain above the specified limit to preserve energy for unplanned trips. From 23:00, the EV battery is recharged in preparation for the next day’s driving phase. A specific SoC threshold may be set to take advantage of off-peak charging conditions where applicable.
The one-way commute distance of 22.8 km follows the passenger EV use case defined within the InnoBMS project [1]. The passenger EV has a nominal battery capacity of 29 kWh, of which 26 kWh is usable. To represent mixed urban, suburban, rural, and higher-speed driving within this route, the driving phase is divided into low-, medium-, high-, and extra-high-speed segments adapted from the Worldwide Light-duty Test Cycle (WLTC) Class 3b [17]. The resulting segment distances used in the project-defined scenario are:
- 1.
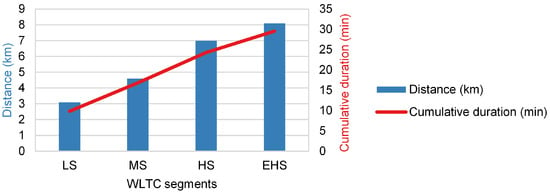
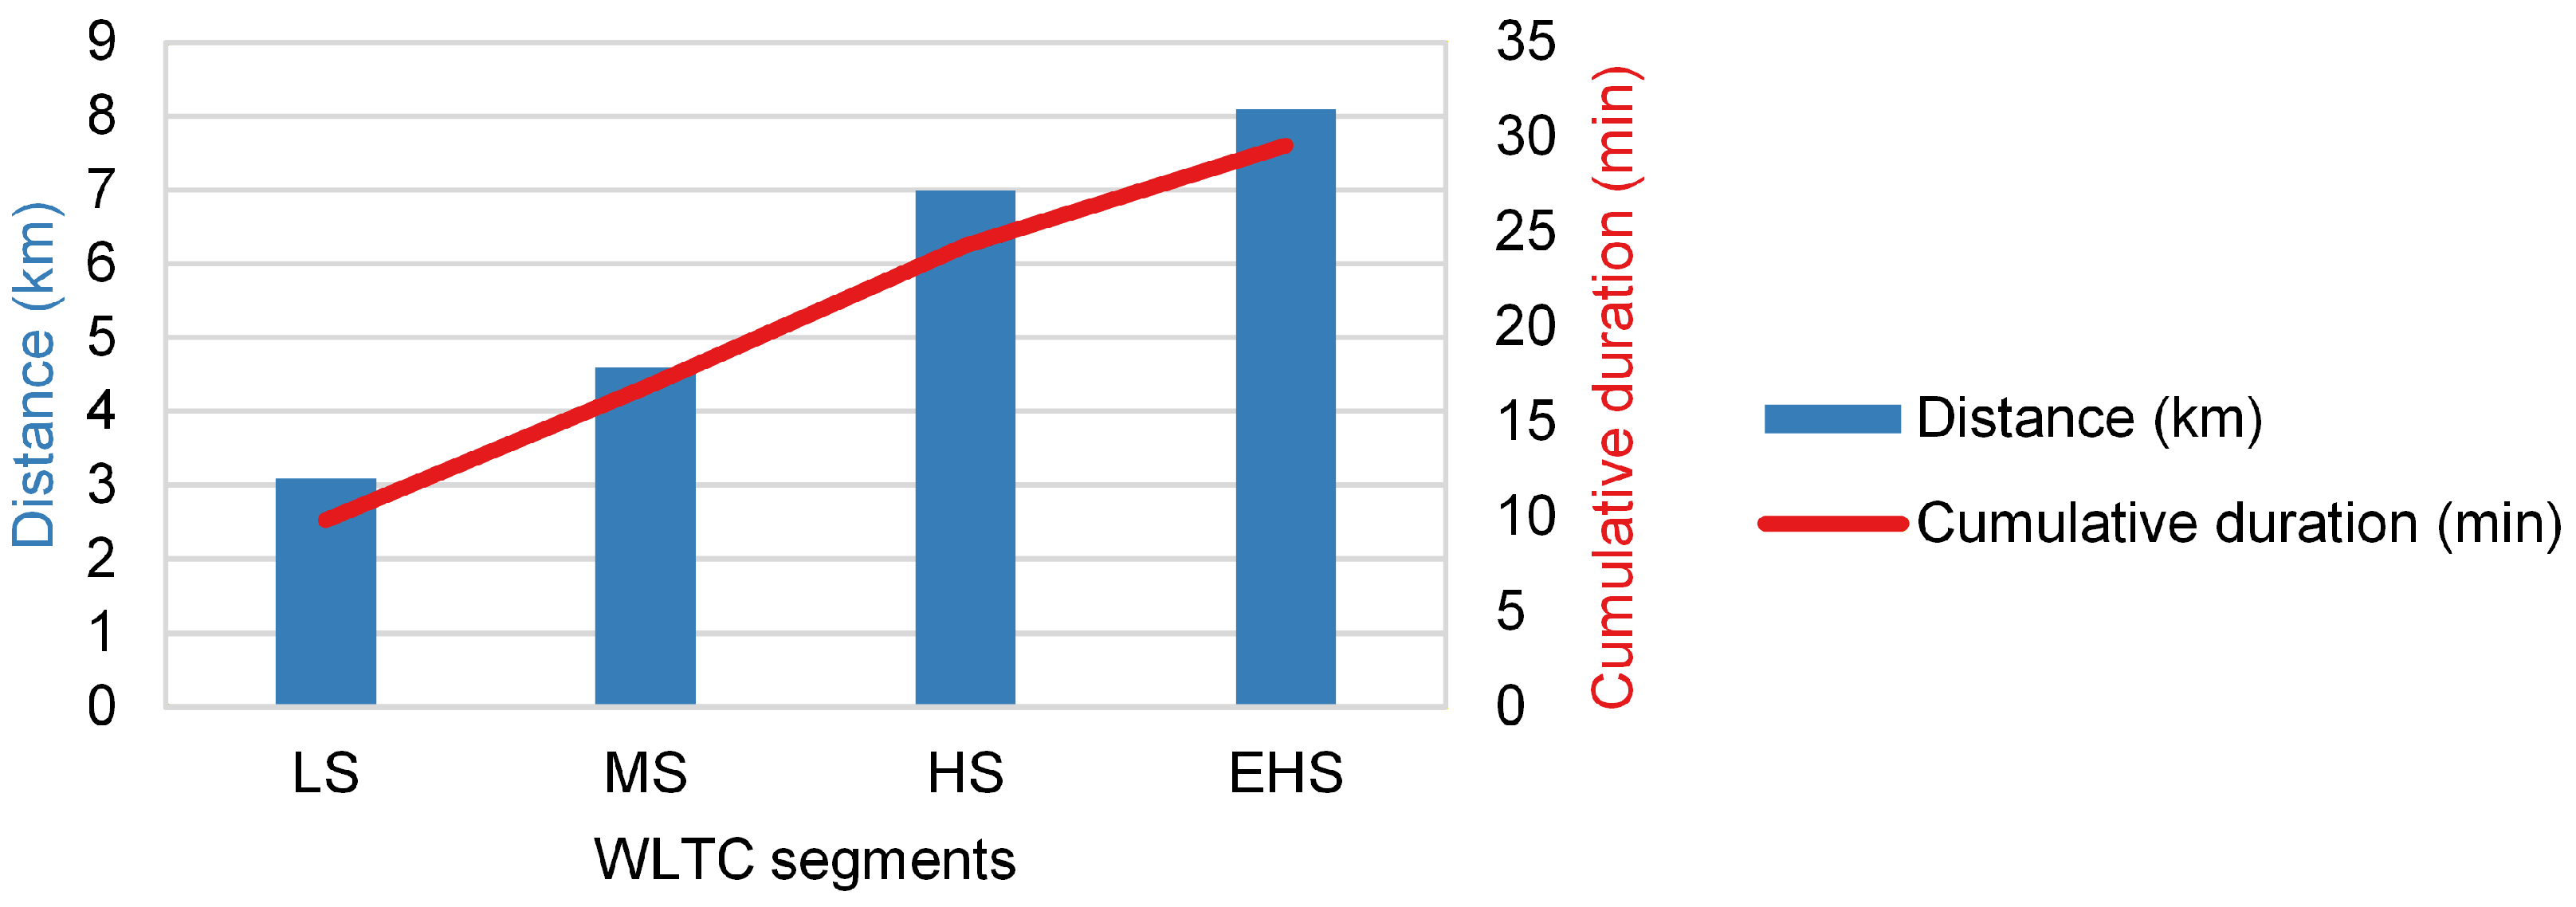
- Low speed (LS): 3.1 km on residential roads (13.6% of 22.8 km)
- 2.
- Medium speed (MS): 4.6 km on suburban roads (20.2% of 22.8 km)
- 3.
- High speed (HS): 7 km on rural roads with higher speed limits (30.7% of 22.8 km)
- 4.
- Extra-high speed (EHS): 8.1 km on occasional highways or expressways (35.5% of 22.8 km)
These distances represent the project-defined commute scenario and are not intended to reproduce the complete regulatory WLTC Class 3b cycle exactly. A maximum vehicle speed of 130 km/h is considered in the passenger EV use case [1], corresponding to the Class 3b speed classification defined in the Worldwide harmonized Light vehicles Test Procedure (WLTP) [17].
Figure 2 shows the commute time and distance for each cycle segment. To account for the influence of ambient temperature on vehicle energy consumption, two representative operating conditions defined in the InnoBMS use cases [1] are considered:
Figure 2.
Distribution of WLTC-based driving segments during the 22.8 km morning commute of the passenger EV use case, showing the segment distances and cumulative travel duration.
- 1.
- Summer use case (UC1): 25 °C
- 2.
- Winter use case (UC2): °C
These temperatures are scenario operating points representing contrasting warm and cold weather conditions rather than European seasonal average temperatures. Energy consumption for the same trip is assumed to be substantially higher in winter because of heating demand. Table 2 gives the e-Doblò energy consumption per 100 km for each WLTC segment and season.
Table 2.
Energy consumption of the passenger EV use case by WLTC segments and seasons.
Energy consumption for each WLTC segment is calculated as
where is the energy consumed (kWh), is the energy consumption per 100 km (kWh/100 km), and d is the distance traveled (km) in the segment. Since total energy consumption depends on ambient temperature and vehicle speed, (kWh) is the sum of over all WLTC segments:
where . The remaining battery energy is updated after each WLTC segment according to Equation (3), while Equation (2) provides the total energy consumed over the complete driving phase:
where is the initial SoC. The trajectories of SoC and consumed energy can be calculated over the distances of both the morning and afternoon driving phases during the summer and winter seasons using Equations (1)–(3).
Battery SoC (%) is defined as
where (Ah) is the current remaining battery capacity and (Ah) is the maximum available capacity.
2.2. eLCV Base Use Case
The eLCV base use case defines operational scenarios and load cycles that reflect realistic duty patterns and demands, supporting the development of future BMS solutions for V2X-enabled eLCVs.
This use case outlines the daily operation of an eDaily as an eLCV employed in courier delivery services [1]. The vehicle operates on a standard workday schedule from 8:00–17:00, incorporating a one-hour lunch break. Figure 3 shows the operating phases of the eLCV use case.
Figure 3.
Daily operational timeline of the eLCV use case, including morning deliveries, lunch-break charging, afternoon deliveries, V2X operation at the depot, and overnight charging.
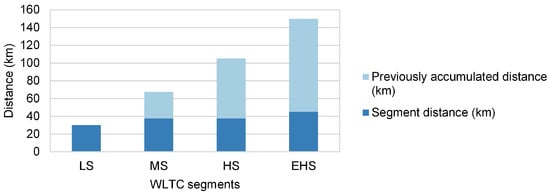
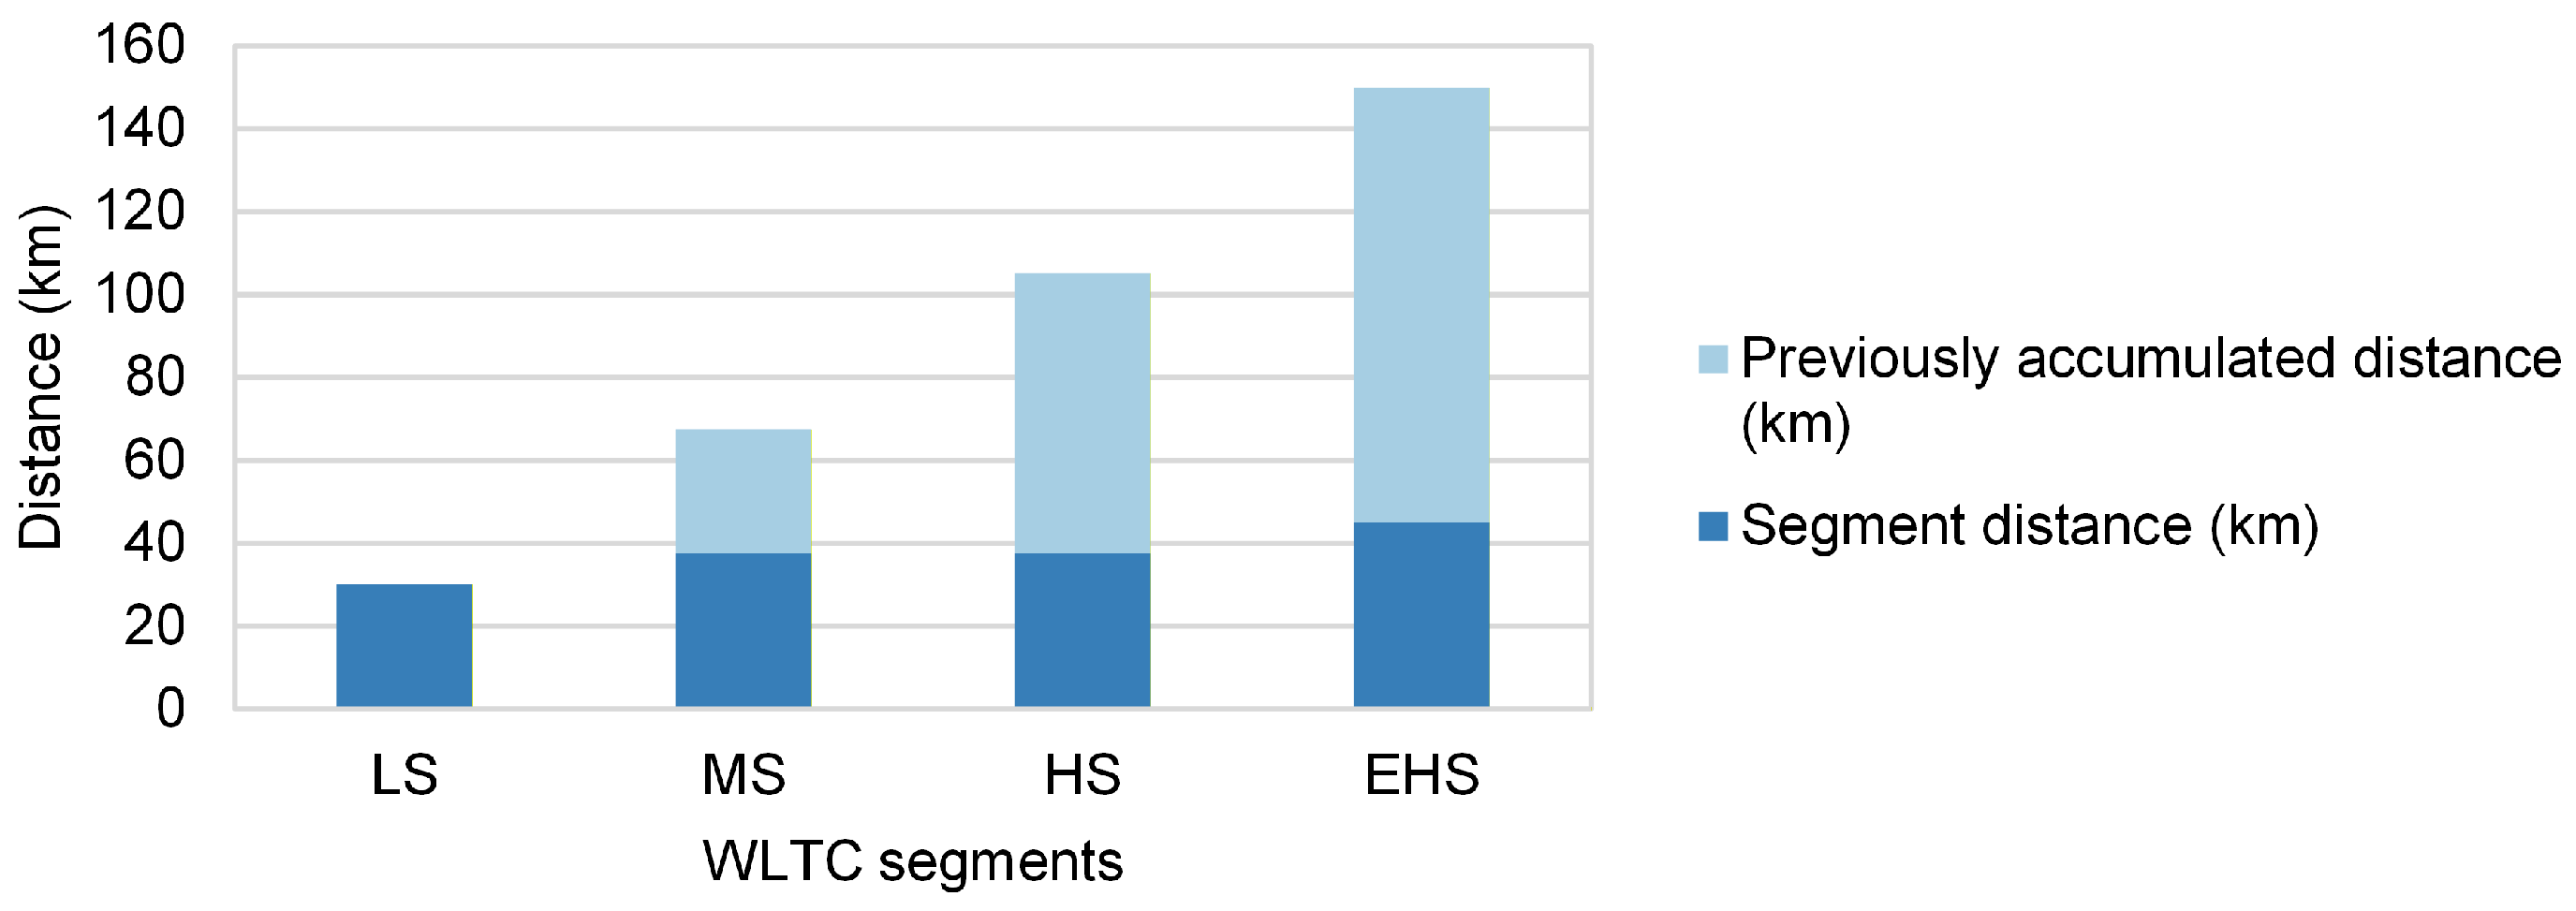
The eLCV scenario assumes a 74 kWh battery, of which 95% (70.3 kWh) is usable, together with defined driving conditions, charging strategies, and SoC management constraints. The eLCV carries only half its normal load with working hours from 8:00–17:00 and a one-hour lunch break in the middle. It covers a distance of 150 km in the morning drive phase and the same distance in the afternoon drive phase for a total distance of 300 km daily. The eLCV also goes through various WLTC segments with an operating-speed limit of 90 km/h for the courier delivery scenario during the drive phases:
- 1.
- Low speed (LS): 60 km on residential roads (20% of 300 km)
- 2.
- Medium speed (MS): 75 km on suburban roads (25% of 300 km)
- 3.
- High speed (HS): 75 km on rural roads with higher speed limits (25% of 300 km)
- 4.
- Extra-high speed (EHS): 90 km on occasional highways or expressways (30% of 300 km)
Figure 4 illustrates the distances covered by the different WLTC segments for the morning drive phase. The same representative warm and cold weather operating conditions are applied to the eLCV use case: (1) the summer use case (UC1) at 25 °C; and (2) the winter use case (UC2) at °C.
Figure 4.
Distribution of WLTC driving segments during the morning drive phase of the eLCV use case, showing the cumulative distance covered across the delivery route.
Table 3 gives the eLCV energy consumption for each WLTC segment and season. Based on the courier company interviews, the eLCV makes eight delivery stops per drive phase, distributed as follows:
Table 3.
Energy consumption of the eLCV use case by WLTC segments and seasons.
- Low speed (LS): Four stops
- Medium speed (MS): Two stops
- High speed (HS): Two stops
Each delivery stop lasts three minutes. As in the passenger EV case, the eLCV has morning and afternoon drive phases covering different WLTC segments under summer and winter conditions. The vehicle departs the warehouse at 8:00 with a full charge and covers a 150 km morning route with stops across urban, suburban, and rural areas. The three-minute stop includes the delivery process and interaction with the recipient.
2.3. Summary and Basis of Use Case Assumptions
The principal assumptions adopted for the passenger EV and eLCV scenarios are summarized in Table 4. These parameters originate from three complementary sources: standardized WLTC definitions [17], manufacturer specifications where applicable, and project-specific use case definitions established within InnoBMS [1]. The latter were developed through consortium and original equipment manufacturer (OEM) input, literature analysis, and external interviews with courier companies and define the operating conditions investigated in this work. Accordingly, project-specific values are treated as scenario parameters rather than as universal specifications of the corresponding production vehicles.
Table 4.
Summary and basis of the main parameters adopted for the passenger EV and eLCV use cases.
2.4. Model Scope and BMS-Related Constraints
The proposed framework is a scenario-level energy-management model intended to evaluate the feasibility and implications of daily driving, charging, and V2X operation rather than reproduce the detailed electrochemical or embedded-control behavior of a battery management system. The BMS-related constraints explicitly represented in the analysis include usable battery-energy limits, battery SoC evolution, operational SoC reserves, charging-power and charging-time constraints, mobility energy requirements, and predefined V2X operating windows. Ambient-temperature-dependent energy consumption is also considered through the warm and cold weather use cases. Charging and discharging conversion efficiencies are not explicitly parameterized in the present scenario-level calculations. Therefore, the reported energy exchanges and economic estimates do not include converter or charger losses. The cost of electricity subsequently required to replenish energy discharged through V2G is also not deducted, and no time-varying import tariff, V2G export/remuneration tariff, or price arbitrage model is represented. The electricity price reference is used as a common scenario-level valuation reference and is not intended to represent a specific warehouse electricity contract. Accordingly, the monetary metric is defined as gross avoided electricity purchase cost: the value of electricity purchases displaced by V2G at the adopted electricity price reference. It should not be interpreted as net V2G savings, revenue, or profit.
Cell- and pack-level voltage and current dynamics, individual-cell imbalance, internal battery temperature evolution, chemistry-specific charge acceptance limits, and protection functions such as overvoltage, undervoltage, overcurrent, and overtemperature protection are not explicitly modeled. Accordingly, the calculated charging and V2X trajectories should be interpreted as scenario-level energy management results subject to subsequent validation against the detailed electrical, thermal, and protection limits of the specific battery system and BMS.
2.5. Use of Generative AI Tools
During manuscript preparation and revision, ChatGPT (GPT-5.6, OpenAI) was used for editorial assistance, recommendations on figure aesthetics and readability, and secondary cross-checking of selected calculations and manuscript consistency. All dataset processing and final numerical calculations were performed by the authors using MATLAB 2024b (version 24.2) and Microsoft Excel (version 2607). All figures included in this manuscript were manually produced by the authors. Generative AI was not used to generate, edit, enhance, or otherwise manipulate any of the figures. All AI-assisted suggestions and cross-checks were reviewed and independently verified by the authors.
3. Results and Discussion
3.1. Passenger EV
3.1.1. Passenger EV Morning Drive Phase
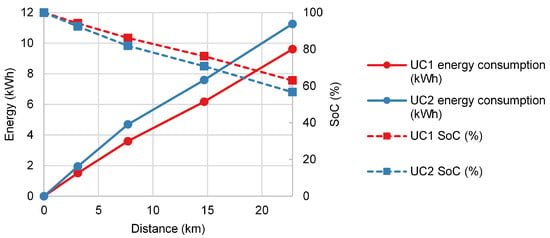
Using Equations (1)–(3), the passenger EV morning commute consumes 9.6 kWh in summer and 11.3 kWh in winter. Figure 5 shows the corresponding evolution of cumulative energy consumption and battery SoC.
Figure 5.
Evolution of battery SoC and cumulative energy consumption during the morning drive phase of the passenger EV use case under summer (UC1) and winter (UC2) conditions.
Upon arrival at the workplace, the passenger EV SoC is 63% in summer and 56.7% in winter. The subsequent eight-hour stationary interval could in principle support V2G through a bidirectional charger, provided that sufficient energy is retained for later mobility. To test this constraint, a candidate daytime V2G discharge of 8 kWh is considered following the InnoBMS passenger EV use case definition [1]. This value is treated as a scenario parameter rather than a fixed vehicle or BMS limit, and the resulting SoC is evaluated against the energy required for the afternoon commute and potential unplanned trips.
For the assumed 8 kWh V2G discharge, Table 5 gives the battery energy and SoC before and after V2G. The resulting SoC levels for both summer and winter use cases, following the morning drive and V2G phases, are 32.3% and 25.9%, respectively. This leaves insufficient energy for unplanned trips in the afternoon. The result shows that daytime V2G feasibility is governed not only by available battery capacity but also by the timing of the discharge relative to the next mobility requirement: discharging before the return commute erodes the operational reserve needed later in the day. Daytime V2G is therefore excluded from the passenger EV scenario, and the vehicle remains stationary until the afternoon drive phase.
Table 5.
Passenger EV battery energy and SoC before and after the candidate daytime V2G discharge.
3.1.2. Passenger EV Afternoon Drive Phase
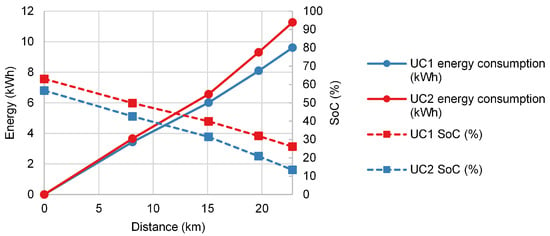
The afternoon commute follows the same WLTC segment distribution as the morning route in the opposite direction. Because daytime V2G was excluded in Section 3.1.1, the afternoon calculation starts from the end-of-morning SoC and again applies Equations (1)–(3). The resulting SoC and cumulative energy consumption are shown in Figure 6.
Figure 6.
Evolution of battery state of charge (SoC) and cumulative energy consumption during the afternoon drive phase of the passenger EV use case under summer (UC1) and winter (UC2) conditions.
At the end of the afternoon drive, the EV battery SoC is 26.1% in summer and 13.4% in winter. Upon arrival at home, the EV is parked and connected to a charger, after which V2G becomes feasible.
3.1.3. V2G Discharge Phase
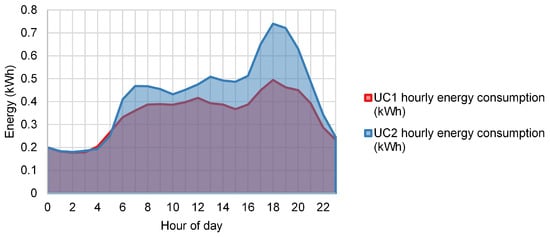
To evaluate residential V2G after the afternoon commute, Figure 7 presents the average hourly household electricity consumption for the summer and winter cases, obtained by processing the publicly available NOVAREF residential load dataset [18,19]. As expected, electricity consumption is consistently higher during winter than during summer, primarily due to increased heating-related electrical loads and greater lighting demand associated with shorter daylight hours. In contrast, the summer profile exhibits lower overall consumption but shows a noticeable increase during the late afternoon and evening, which may be attributed to cooling loads and typical residential occupancy patterns. The winter profile displays a more pronounced evening peak between approximately 17:00 and 20:00, whereas the summer profile reaches its maximum around 18:00–19:00. The representative daily household electricity consumption obtained from the dataset is approximately 8.2 kWh during summer and 10.2 kWh during winter.
Figure 7.
Average hourly household electricity demand for summer (UC1) and winter (UC2) derived from the NOVAREF residential load dataset. UC1 daily consumption totals 8.18 kWh, while UC2 totals 10.17 kWh.
Based on the seasonal electricity demand peaks, V2G is scheduled from 17:00 to 23:00 in both cases. Over this six-hour period, the average hourly household energy demand is approximately 0.42 kWh during summer and 0.60 kWh during winter, corresponding to total energy demands of approximately 2.53 kWh and 3.57 kWh, respectively.
Figure 6 shows that the low SoC levels upon arrival at home are insufficient for significant V2G operation. To prepare for V2G, the passenger EV is charged between 16:00 and 17:00 using the 10 kW AC charging level adopted in the InnoBMS passenger EV scenario [1]. Table 6 details the resulting change in SoC in preparation for V2G.
Table 6.
Passenger EV SoC before and after the 16:00–17:00 preparatory charge.
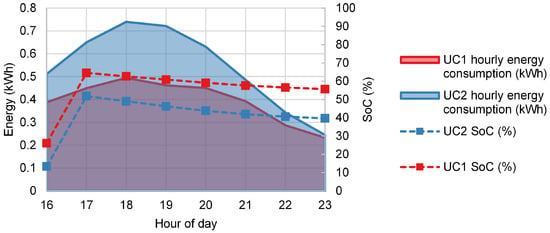
During V2G from 17:00–23:00, the EV battery supplies the household electricity demand. Figure 8 shows the corresponding battery SoC for summer and winter. In summer, the battery fully supplies the household demand. From a level of 64.5%, the SoC decreases throughout the period until it reaches 54.8% at the end to supply the total household demand of 2.53 kWh. In winter, the battery also fully supplies the household demand, with SoC decreasing from 51.9% to approximately 38.1% while supplying 3.57 kWh.
Figure 8.
Passenger EV battery SoC during the 16:00–17:00 preparatory charge and 17:00–23:00 V2G operation under summer (UC1) and winter (UC2) conditions, together with the corresponding household electricity demand.
Unlike the daytime case, evening V2G is feasible because the day’s scheduled mobility has already been completed and the preparatory charge restores sufficient energy headroom before discharge. The winter case nevertheless ends at a lower SoC because both driving energy consumption and household demand are higher, showing that cold-weather operation reduces V2G flexibility through multiple parts of the daily energy balance. The remaining overnight charging window is still sufficient to restore the battery for the next morning commute.
3.1.4. Charging Phase
The eight-hour charging phase runs from 23:00 to 7:00 the next day. To balance charging duration and battery longevity, the following charging strategies are proposed based on seasonal conditions and SoC:
- 1.
- Summer (UC1): From 54.8% SoC at the end of the V2G phase, a minimum charging power of 1.5 kW is needed to reach full charge by the end of the charging phase. However, to provide an operational margin for conversion losses while avoiding unnecessarily high charging rates, a charging power of 2–3 kW is recommended.
- 2.
- Winter (UC2): From 38.1% SoC, at least 2 kW is needed to reach full charge by the end of the charging phase. For the same reasons as in summer, 2–3 kW is recommended.
3.1.5. Impact of V2G on Passenger EV Battery Life
Another important battery indicator is state of health (SoH), defined as
where (Ah) is the current maximum battery capacity and (Ah) is the original nominal or rated capacity. Degradation can be tracked throughout the battery’s lifetime through Equation (5). A battery’s end of life (EoL) is usually specified to be the time when it has lost 20–30% of its or when its internal resistance has reached double its original value [22,23]. Past this point, battery health degrades exponentially.
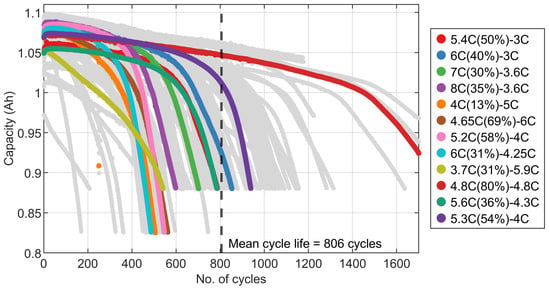
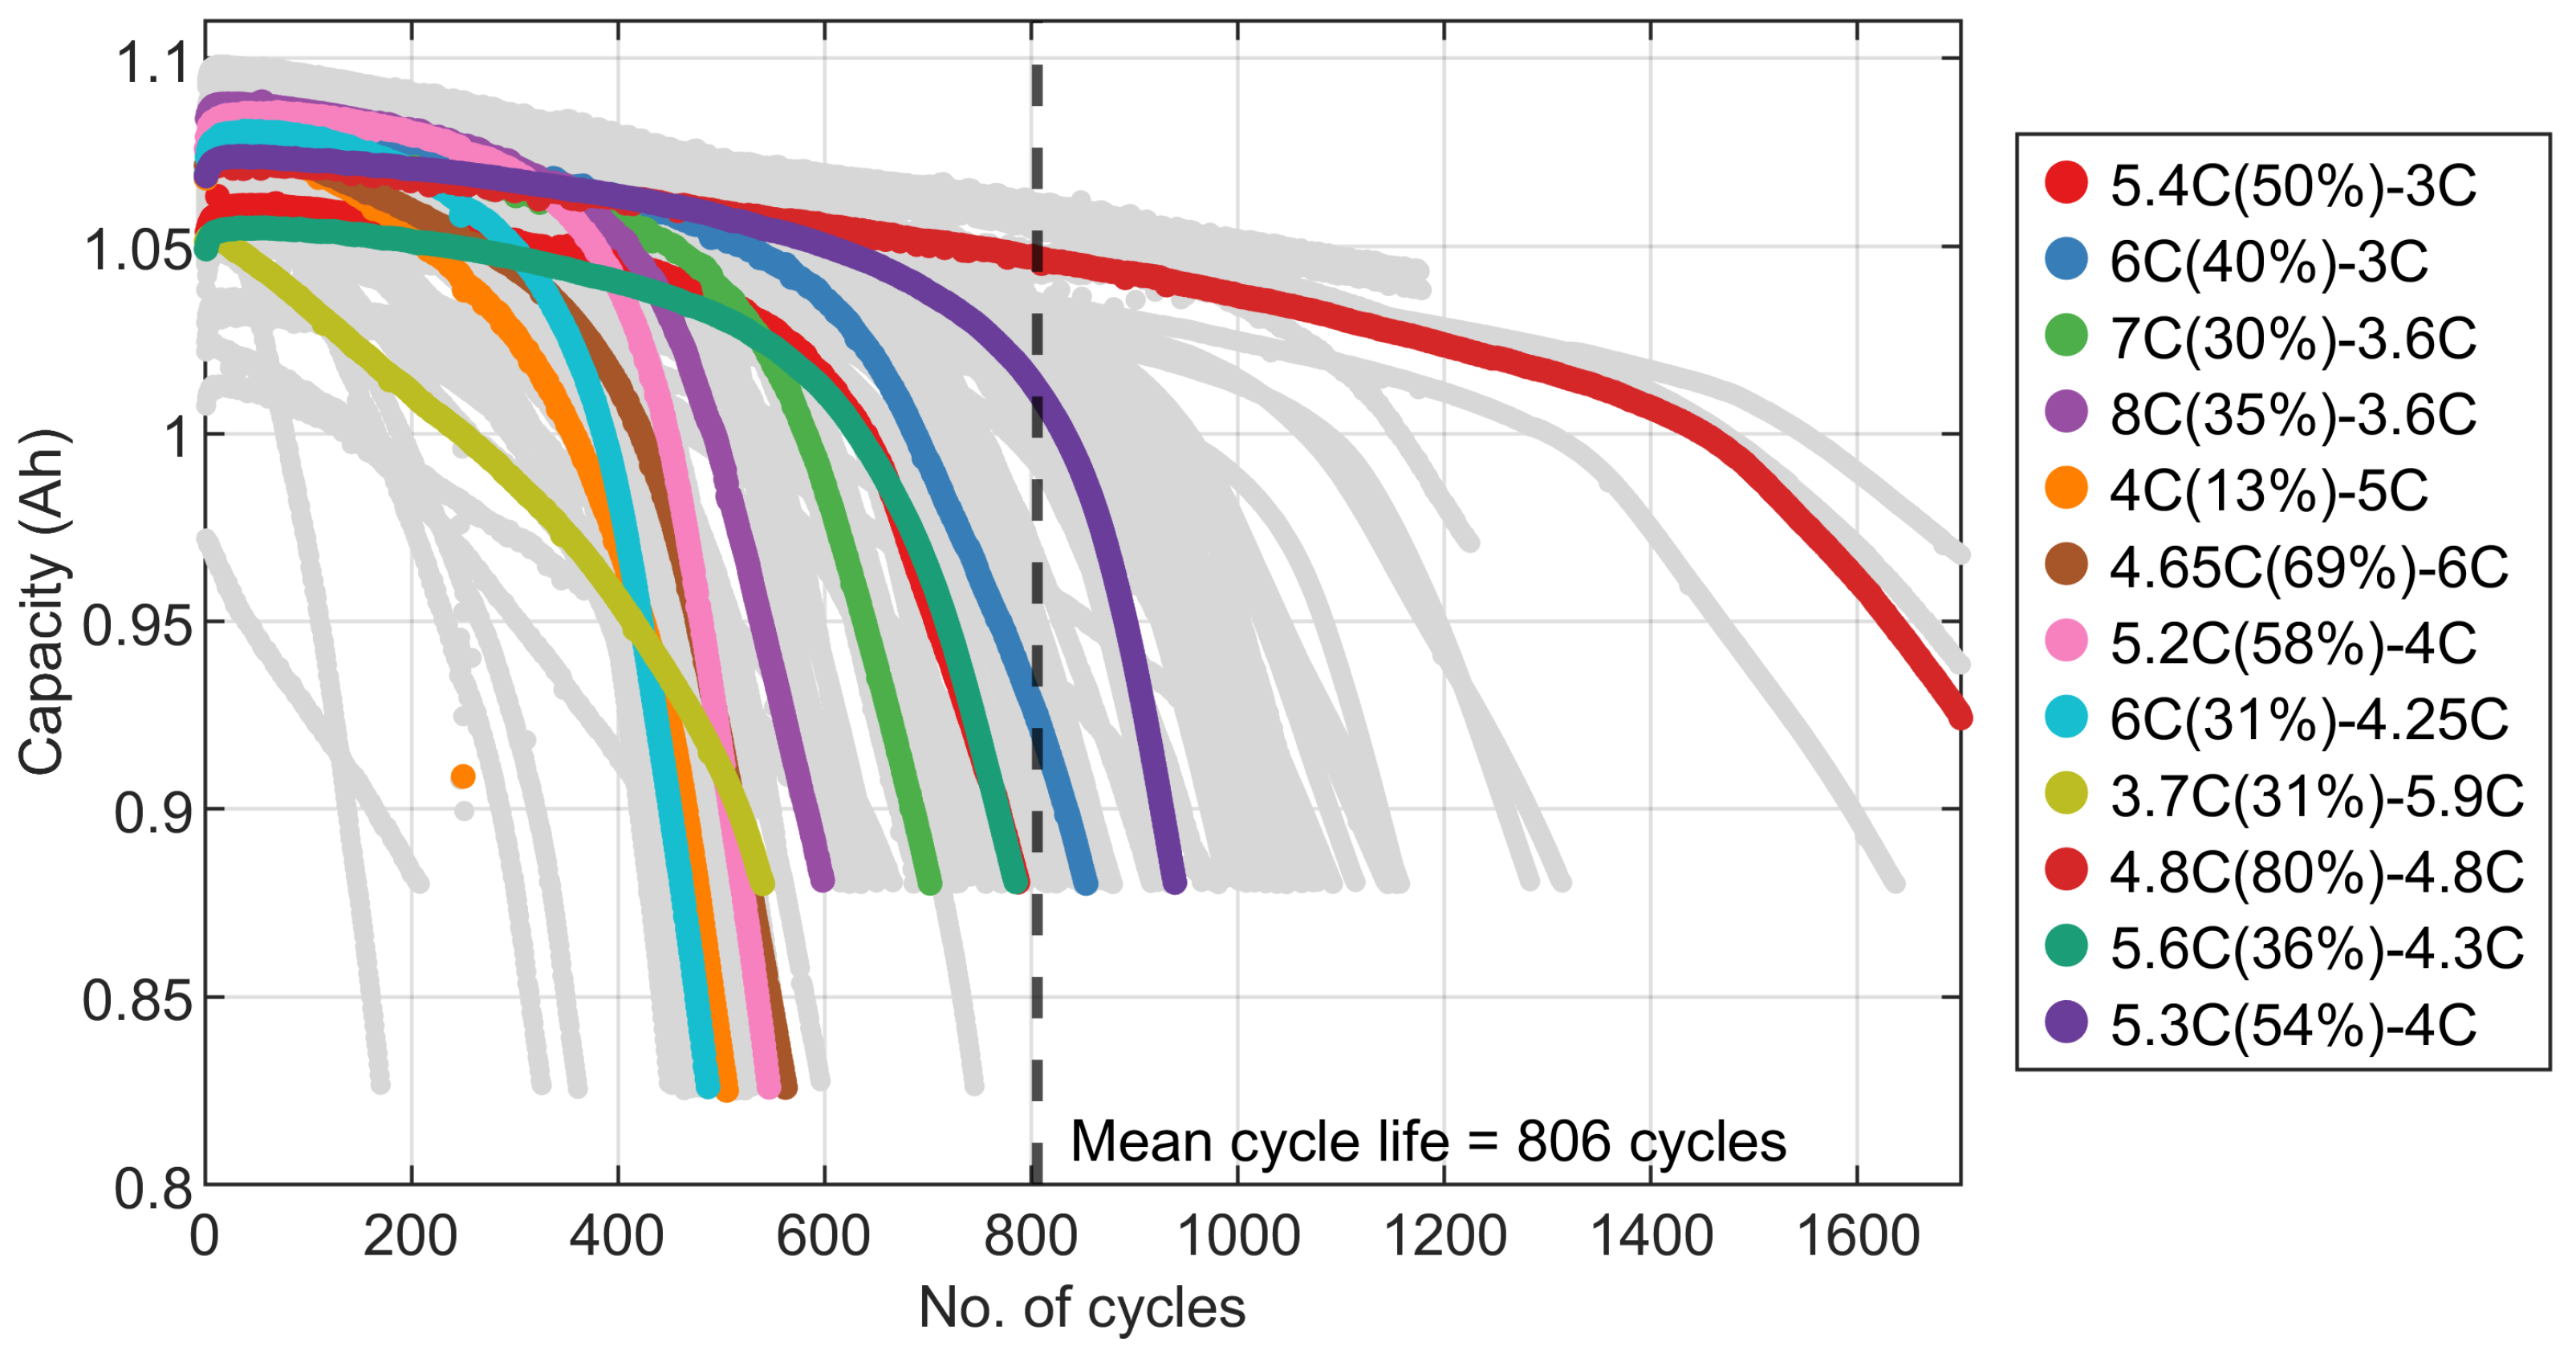
Battery capacity degradation depends on many factors, so battery health estimation remains an active research topic. Measured cycle life varies substantially with chemistry, charge-discharge protocol, temperature, and other operating conditions. Recent studies use neural-network-based algorithms to predict battery life [24,25,26]. Open-source datasets on battery properties, performance, and degradation are frequently used for model and algorithm validation [27]. To establish a representative cycle-life reference for the first-order EFC-based analysis, experimental cycling data from the MIT-Stanford dataset are considered [24,28]. Figure 9 illustrates the capacity degradation of cells subjected to different cycling conditions and shows that EoL can occur after several hundred to more than a thousand cycles, depending on the cell and test protocol. The Center for Advanced Life Cycle Engineering (CALCE) dataset similarly shows capacity degradation over several hundred cycles under a different chemistry and cycling protocol [29,30,31,32], further illustrating that cycle life depends strongly on experimental conditions.
Figure 9.
Capacity degradation of LiFePO4 cells from the MIT-Stanford battery cycling dataset under different fast-charging policies [24,28]. The notation denotes charging at until % SoC, followed by charging at . All cells were discharged at 4C. Selected policies are highlighted, while the remaining cells are shown in gray.
The dataset in Figure 9 was used to provide an empirical reference for the cycle-life assumption employed in the subsequent scenario analysis rather than construct a chemistry-specific degradation model. The MIT-Stanford dataset comprises 124 nominally identical LiFePO4 (LFP)/graphite cells tested under 72 different fast-charging conditions, with average charging rates ranging from approximately 3.6C to 6C and cycle lives ranging from approximately 150 to 2300 cycles [24]. Although the chamber temperature and discharge protocol were controlled, the different charging policies produced substantially different degradation trajectories and associated cell temperature responses. The reported mean cycle life is approximately 806 cycles, with a standard deviation of 377 cycles [24]. Accordingly, a representative reference of 800 EFCs is adopted here for the first-order throughput-based comparison. This reference therefore reflects the experimentally observed variability associated with different fast-charging policies, but it should not be interpreted as a chemistry- and operating-condition-specific prediction of the lifetime of the passenger EV or eLCV battery packs.
For EV owners, a key concern is the impact of V2X operation on battery life. At the system level, widespread V2X participation can also introduce grid frequency and voltage fluctuations. Numerous algorithms and approaches have been proposed to mitigate these effects [7,9,33,34].
To assess the additional battery cycling imposed by V2X, applying Equation (2) to the two 22.8 km passenger EV driving phases gives a total summer driving-energy consumption of approximately 19.2 kWh/day, equivalent to a distance-weighted consumption of 42.15 kWh/100 km. At the end of the afternoon drive, 26.1% SoC remains (Table 6), corresponding to a consumed charge of /day or cycles/day without V2X. For winter, the corresponding total driving-energy consumption is approximately 22.5 kWh/day, equivalent to 49.38 kWh/100 km, while /day and cycles/day. In both seasons, a full charge therefore lasts more than one day. Table 7 summarizes the calculated values for the battery pack.
Table 7.
Battery throughput and economic effects of V2G for the passenger EV scenarios.
Based on the experimental cycling data discussed above, an EoL reference of EFCs is adopted for the first-order lifetime comparison. At a hypothetical throughput of one EFC per day, this corresponds to 800 days, or approximately 2.19 years. For each use-case scenario, however, the estimated lifetime is determined from its calculated daily EFC rate rather than assuming one full cycle per day. The estimated EoL (days) is
To assess the effects of V2X on battery lifetime, the SoC differences pre- and post-V2G in Section 3.1.3 are computed as for summer and 13.73% for winter. The corresponding V2G cycle count is added to as
Considering the summer case, Equation (7) gives cycles/day, corresponding to a 13.2% increase in daily EFC throughput due to V2G. Under the adopted fixed-EFC EoL assumption, this corresponds to an equivalent reduction in cycling-based lifetime. For winter, cycles/day, corresponding to a 15.9% increase in daily EFC throughput. From an EV owner’s perspective, the additional battery throughput should therefore be considered together with the gross value of V2G-supplied energy.
For the scenario-level economic comparison, the Belgian household electricity price of 0.3571 EUR/kWh for the first half of 2025, reported by Eurostat [20], is adopted to value electricity purchases avoided when household demand is supplied through V2G rather than as a guaranteed V2G export tariff. Based on the 2.53 kWh household demand during the V2G period in summer, the corresponding daily avoided electricity purchase cost is EUR 0.91. For winter, the value is EUR 1.28 for an energy demand of 3.57 kWh.
For the present scenario-level economic comparison, the LiFePO4 cost reference of 108 USD/kWh reported in [21] is adopted. This corresponds to an estimated battery cost of USD 3132 for the 29 kWh passenger EV battery pack and USD 7992 for the 74 kWh eLCV battery pack. These values are used as cost reference assumptions rather than vehicle-specific replacement-pack prices. For context, average battery pack prices were 668 USD/kWh in 2013 and 137 USD/kWh in 2020 [35]. The cumulative avoided electricity purchase cost associated with V2G can be computed as
where is the battery pack lifetime with V2G (days) and is the daily avoided electricity purchase cost. As defined in Section 2.4, this is a gross valuation because recharge energy cost and charging/discharging conversion losses are not deducted. In Belgium, the estimated cumulative avoided electricity purchase cost is EUR 432.77 for summer and EUR 508.27 for winter (in both cases, in Equation (8) was halved to account for the seasons). These total EUR 941.05 (USD 1063.38 using the 2025 average conversion rate from the European Central Bank), equivalent to 34.0% of the adopted battery cost reference. This comparison provides a common scale for the gross value of V2G-supplied energy relative to the adopted battery cost reference rather than a prediction of net owner savings or battery cost recovery. The gross value should be interpreted together with the additional battery throughput and the limitations of the first-order EFC-based aging assessment. These figures are also summarized in Table 7.
3.2. eLCV
The same day-scale framework is next applied to the more energy-intensive eLCV duty cycle, with particular emphasis on lunch-break charging feasibility and depot V2X operation.
3.2.1. eLCV Morning Drive Phase
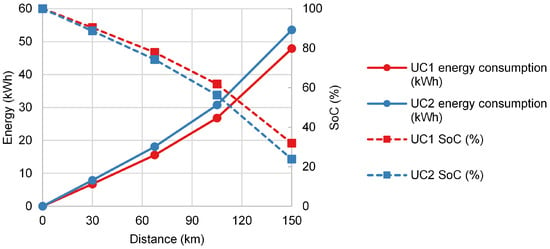
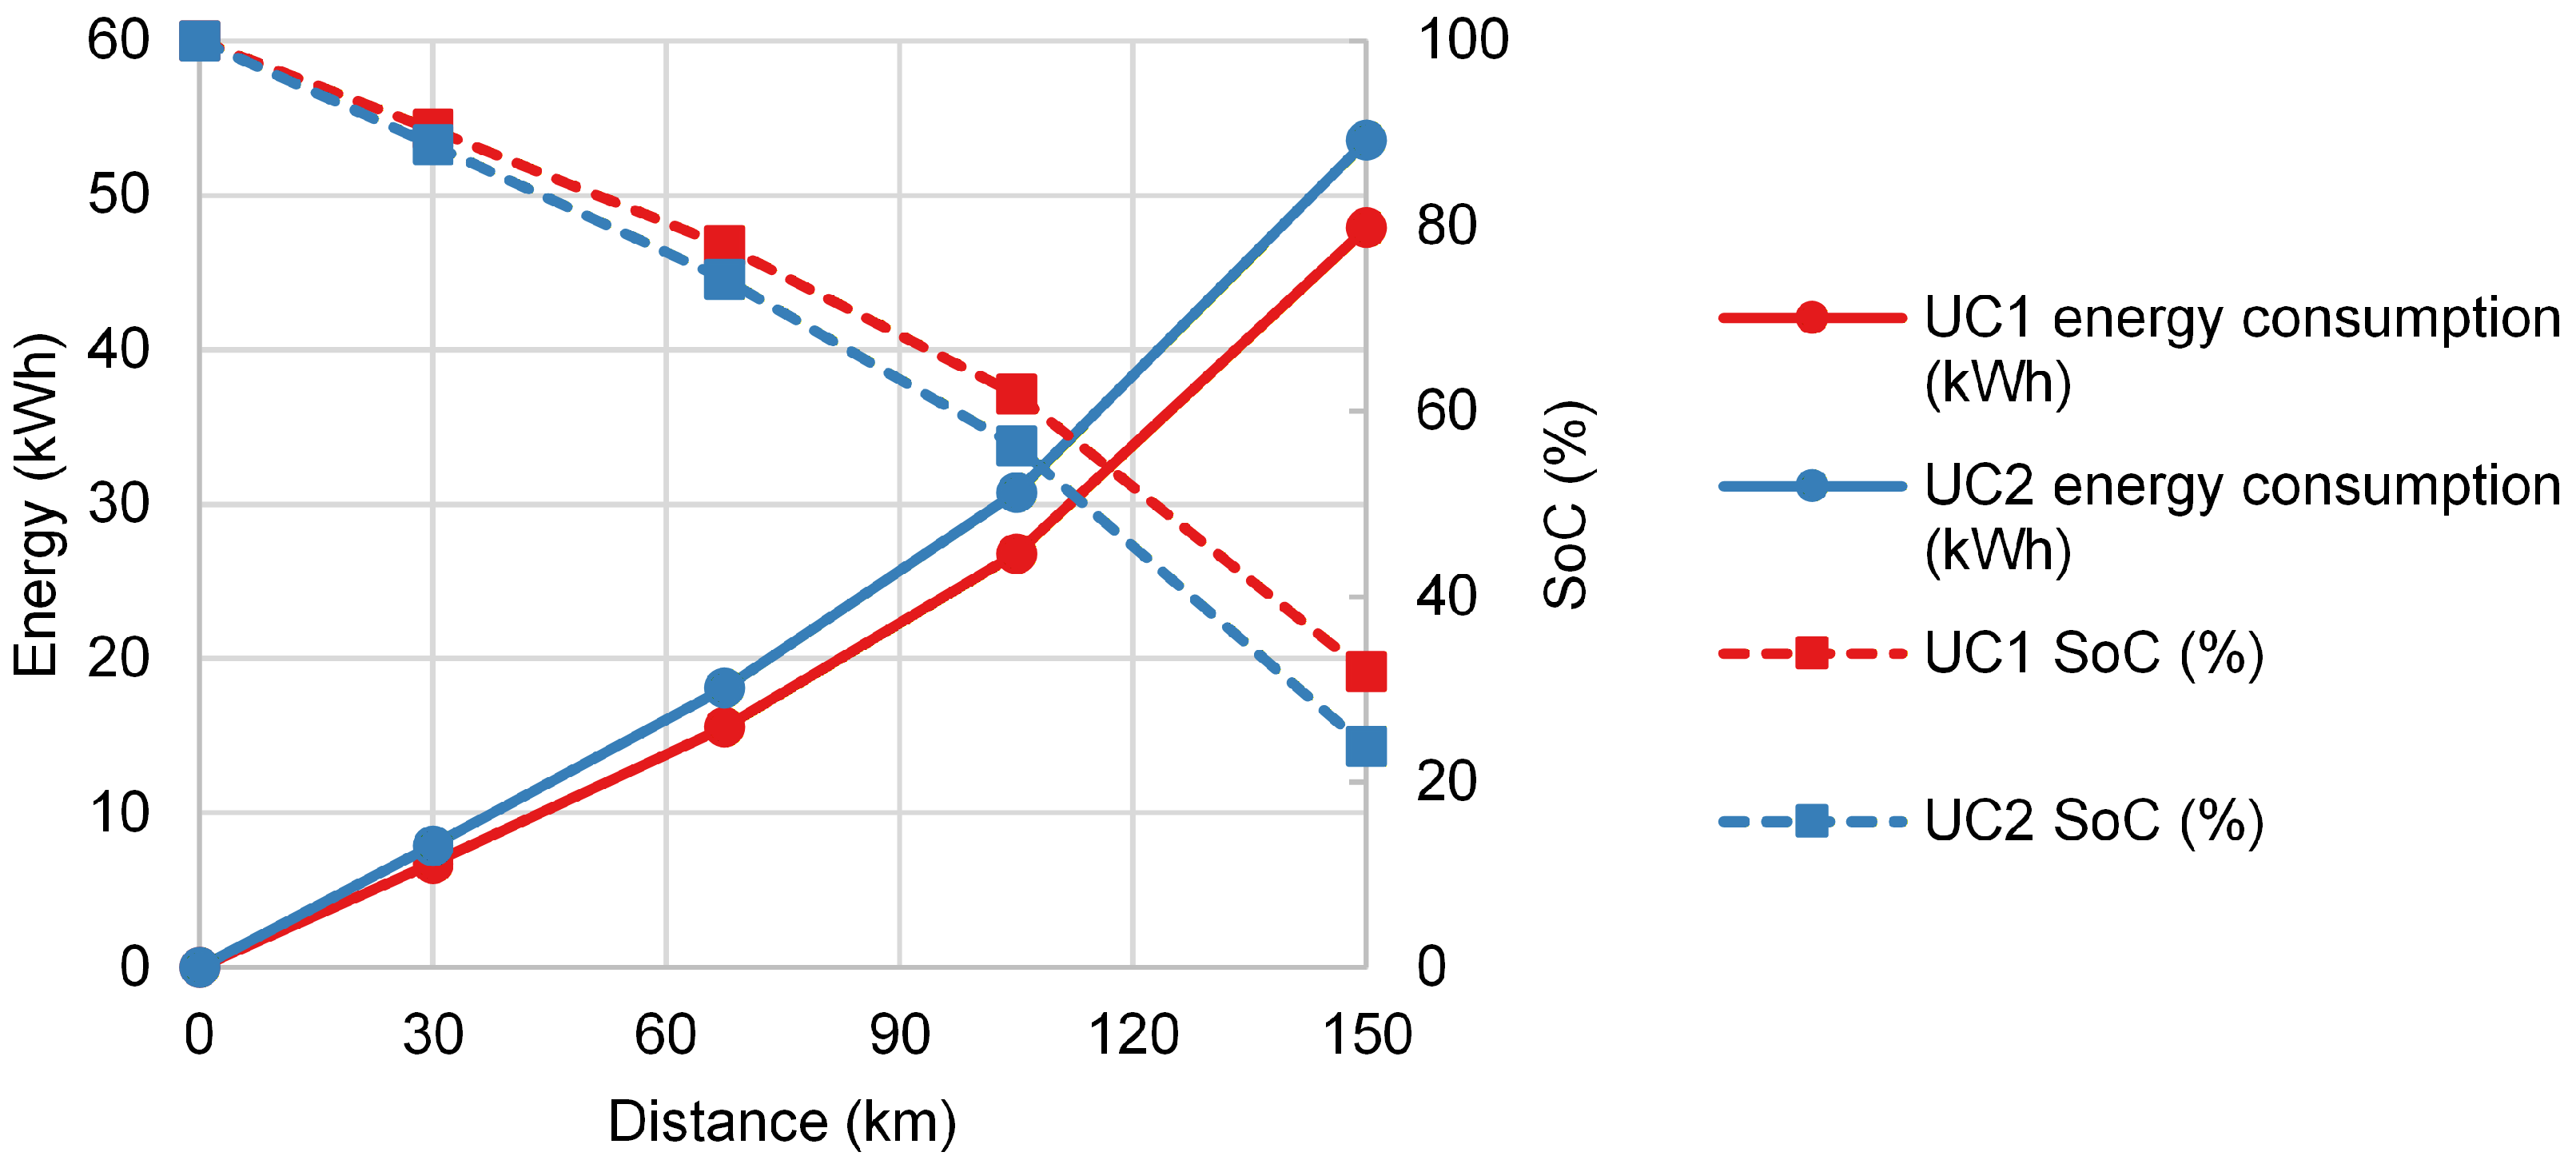
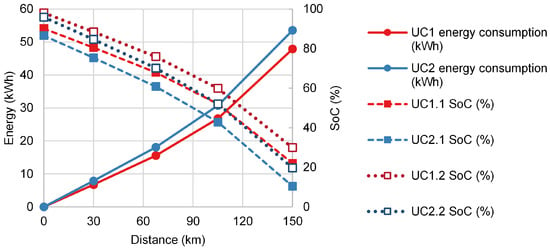
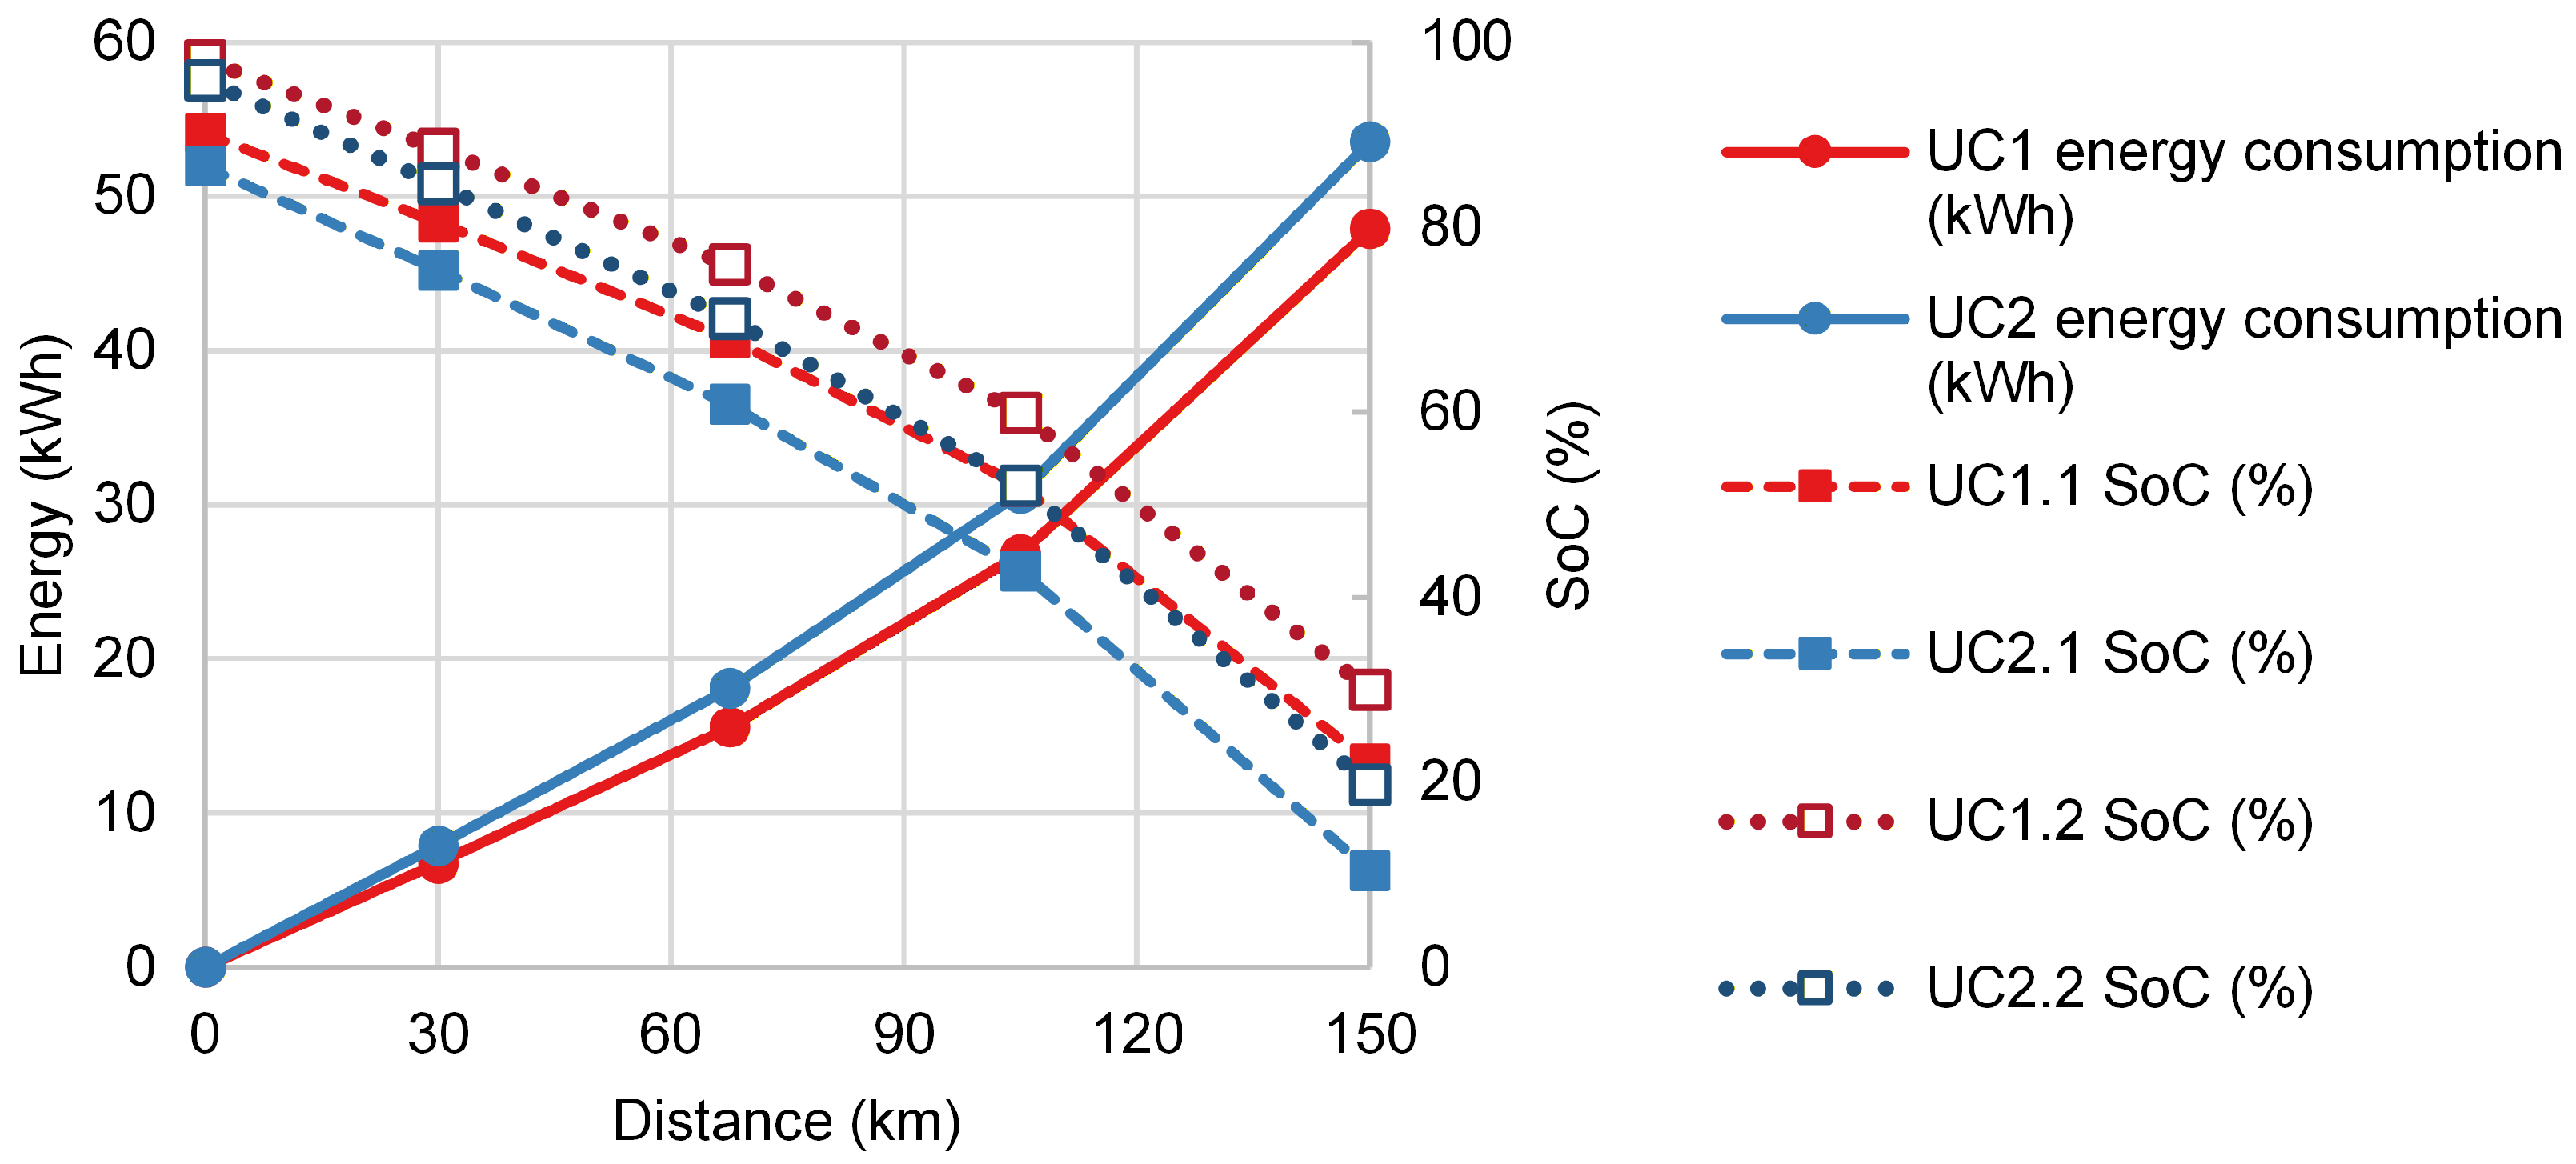
Equations (1)–(3) also apply to the eLCV use case. Equation (2) gives total morning-drive energy consumption of 47.9 kWh in summer and 53.5 kWh in winter. The higher winter consumption reflects the additional heating demand. Figure 10 shows the corresponding energy consumption and SoC evolution. The winter end-of-route SoC of 23.8% indicates the need for additional charging or route-planning adjustments.
Figure 10.
Evolution of battery SoC and cumulative energy consumption during the 150 km morning drive phase of the eLCV use case under summer (UC1) and winter (UC2) conditions.
3.2.2. Lunch-Break Charging
The courier completes the 150 km morning drive phase at 12:00. During the lunch break, the eLCV recharges at a charging station. The SoC at the start of the lunch-break charge corresponds to that at the end of the morning driving phase. A project-defined terminal SoC reserve of 10% [1] is retained at the end of the afternoon driving phase to provide an operational mobility margin. Accordingly, the required SoC after the lunch-break charge is determined from the energy needed for the 150 km afternoon route plus this reserve.
Because the afternoon drive covers the same 150 km and WLTC segments as the morning drive, it requires the same amount of battery energy: 68.1% of charge in summer and 76.2% in winter. Including the 10% operational reserve, the minimum required SoC after the lunch break is therefore 78.1% during summer and 86.2% during winter. The charging powers evaluated in Table 8 follow the alternatives defined in the InnoBMS eLCV use case [1]. The 7 kW and 22 kW cases represent AC charging alternatives, whereas 50 kW and 80 kW DC charging cases are evaluated as fast-charging cases. Their suitability is assessed against the requirement to restore sufficient battery energy within the one-hour lunch break.
Table 8.
Charging alternatives considered during the eLCV lunch break.
Table 8 summarizes the charging alternatives considered during the one-hour lunch break. Workplace charging is excluded because the vehicle is en route, and neither 7 kW nor 22 kW AC charging restores the required SoC within the available hour. With 22 kW AC charging, the summer target of 78.1% SoC is reached at 13:29 and the winter target of 86.2% at 14:00, requiring an unacceptable extension of the delivery schedule.
The remaining analysis therefore focuses on combined DC and AC charging. Fast charging at 50 kW or 80 kW is applied up to 80% SoC, which serves as the minimum summer charging target, followed by 22 kW AC charging for the remainder of the one-hour lunch break. This combination restores the required SoC within the one-hour lunch break. In summer, reaching 80% SoC already satisfies the mobility requirement. The subsequent AC charging is therefore used during the remaining lunch-break charging time to increase the afternoon starting SoC. The comparison indicates that lunch-break charging power is not only an operational scheduling parameter: it also determines the afternoon starting SoC and therefore the energy headroom available for subsequent depot V2X operation.
3.2.3. eLCV Afternoon Drive Phase
The afternoon drive covers the same WLTC segments over a distance of 150 km in the opposite direction. Table 9 gives the initial afternoon-drive SoC for the 50 kW DC + 22 kW AC and 80 kW DC + 22 kW AC charging strategies in summer and winter. Pure AC charging is excluded because it cannot reach the required SoC within the lunch break.
Table 9.
Initial eLCV SoC for the afternoon drive phase under the evaluated lunch-break charging strategies.
Figure 11 shows the battery SoC and energy consumption for the different charging strategies in summer and winter. The lowest post-drive SoC, 10.4%, occurs in winter with the lower-power strategy (50 kW DC + 22 kW AC). The highest SoC occurs in summer with the higher-power strategy (80 kW DC + 22 kW AC), when heating demand is absent.
Figure 11.
Evolution of battery SoC and cumulative energy consumption during the 150 km afternoon drive phase of the eLCV use case for the 50 kW DC + 22 kW AC and 80 kW DC + 22 kW AC lunch-break charging strategies under summer and winter conditions.
3.2.4. V2X Discharge and Charging Phase
After completing the afternoon route, the eLCV returns to the warehouse at 17:00 and remains there until the next morning. This extended stationary interval is used for V2X operation through a bidirectional warehouse charger, subject to the defined SoC limits.
At departure the following morning, the SoC must be restored to 100% in preparation for the next drive phase. During the connected period, a minimum SoC of 20% is imposed as a project-defined operating reserve for V2X [1]. This threshold limits the battery energy available for V2X while retaining an operational energy margin and should be interpreted as a scenario-level energy-management constraint rather than a chemistry-specific BMS protection limit. The eLCV remains connected to the warehouse charger from 17:00 until 8:00 the following day, providing a 15 h connection window. Two nominal peak-demand periods are considered: the first from 18:00 to 00:00 (six hours) and the second from 6:00 to 8:00 (two hours). In the investigated schedule, however, V2X discharge is applied only from 18:00–23:00, after which the battery is recharged.
The warehouse-demand range adopted in the InnoBMS eLCV use case is 1391–5276 kWh/day [1]. To obtain a single representative operating point for the present scenario analysis, a demand of approximately 3333 kWh/day is adopted from the project use case. Assuming this demand to be constant over 24 h corresponds to an average power of approximately 139 kW. This constant-load representation is a scenario simplification and is not intended to reproduce the time-varying demand profile of a specific warehouse. Peak-load shaving, with charging during off-peak hours and discharging during peak periods, is adopted for the eLCV use case. Discharge during the second peak is excluded to ensure that the eLCV starts the next drive phase fully charged.
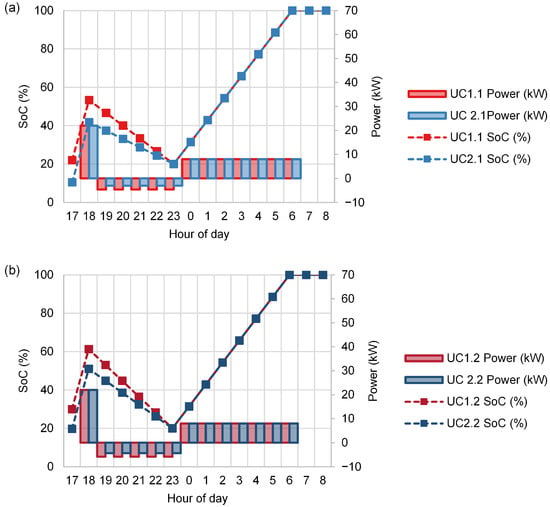
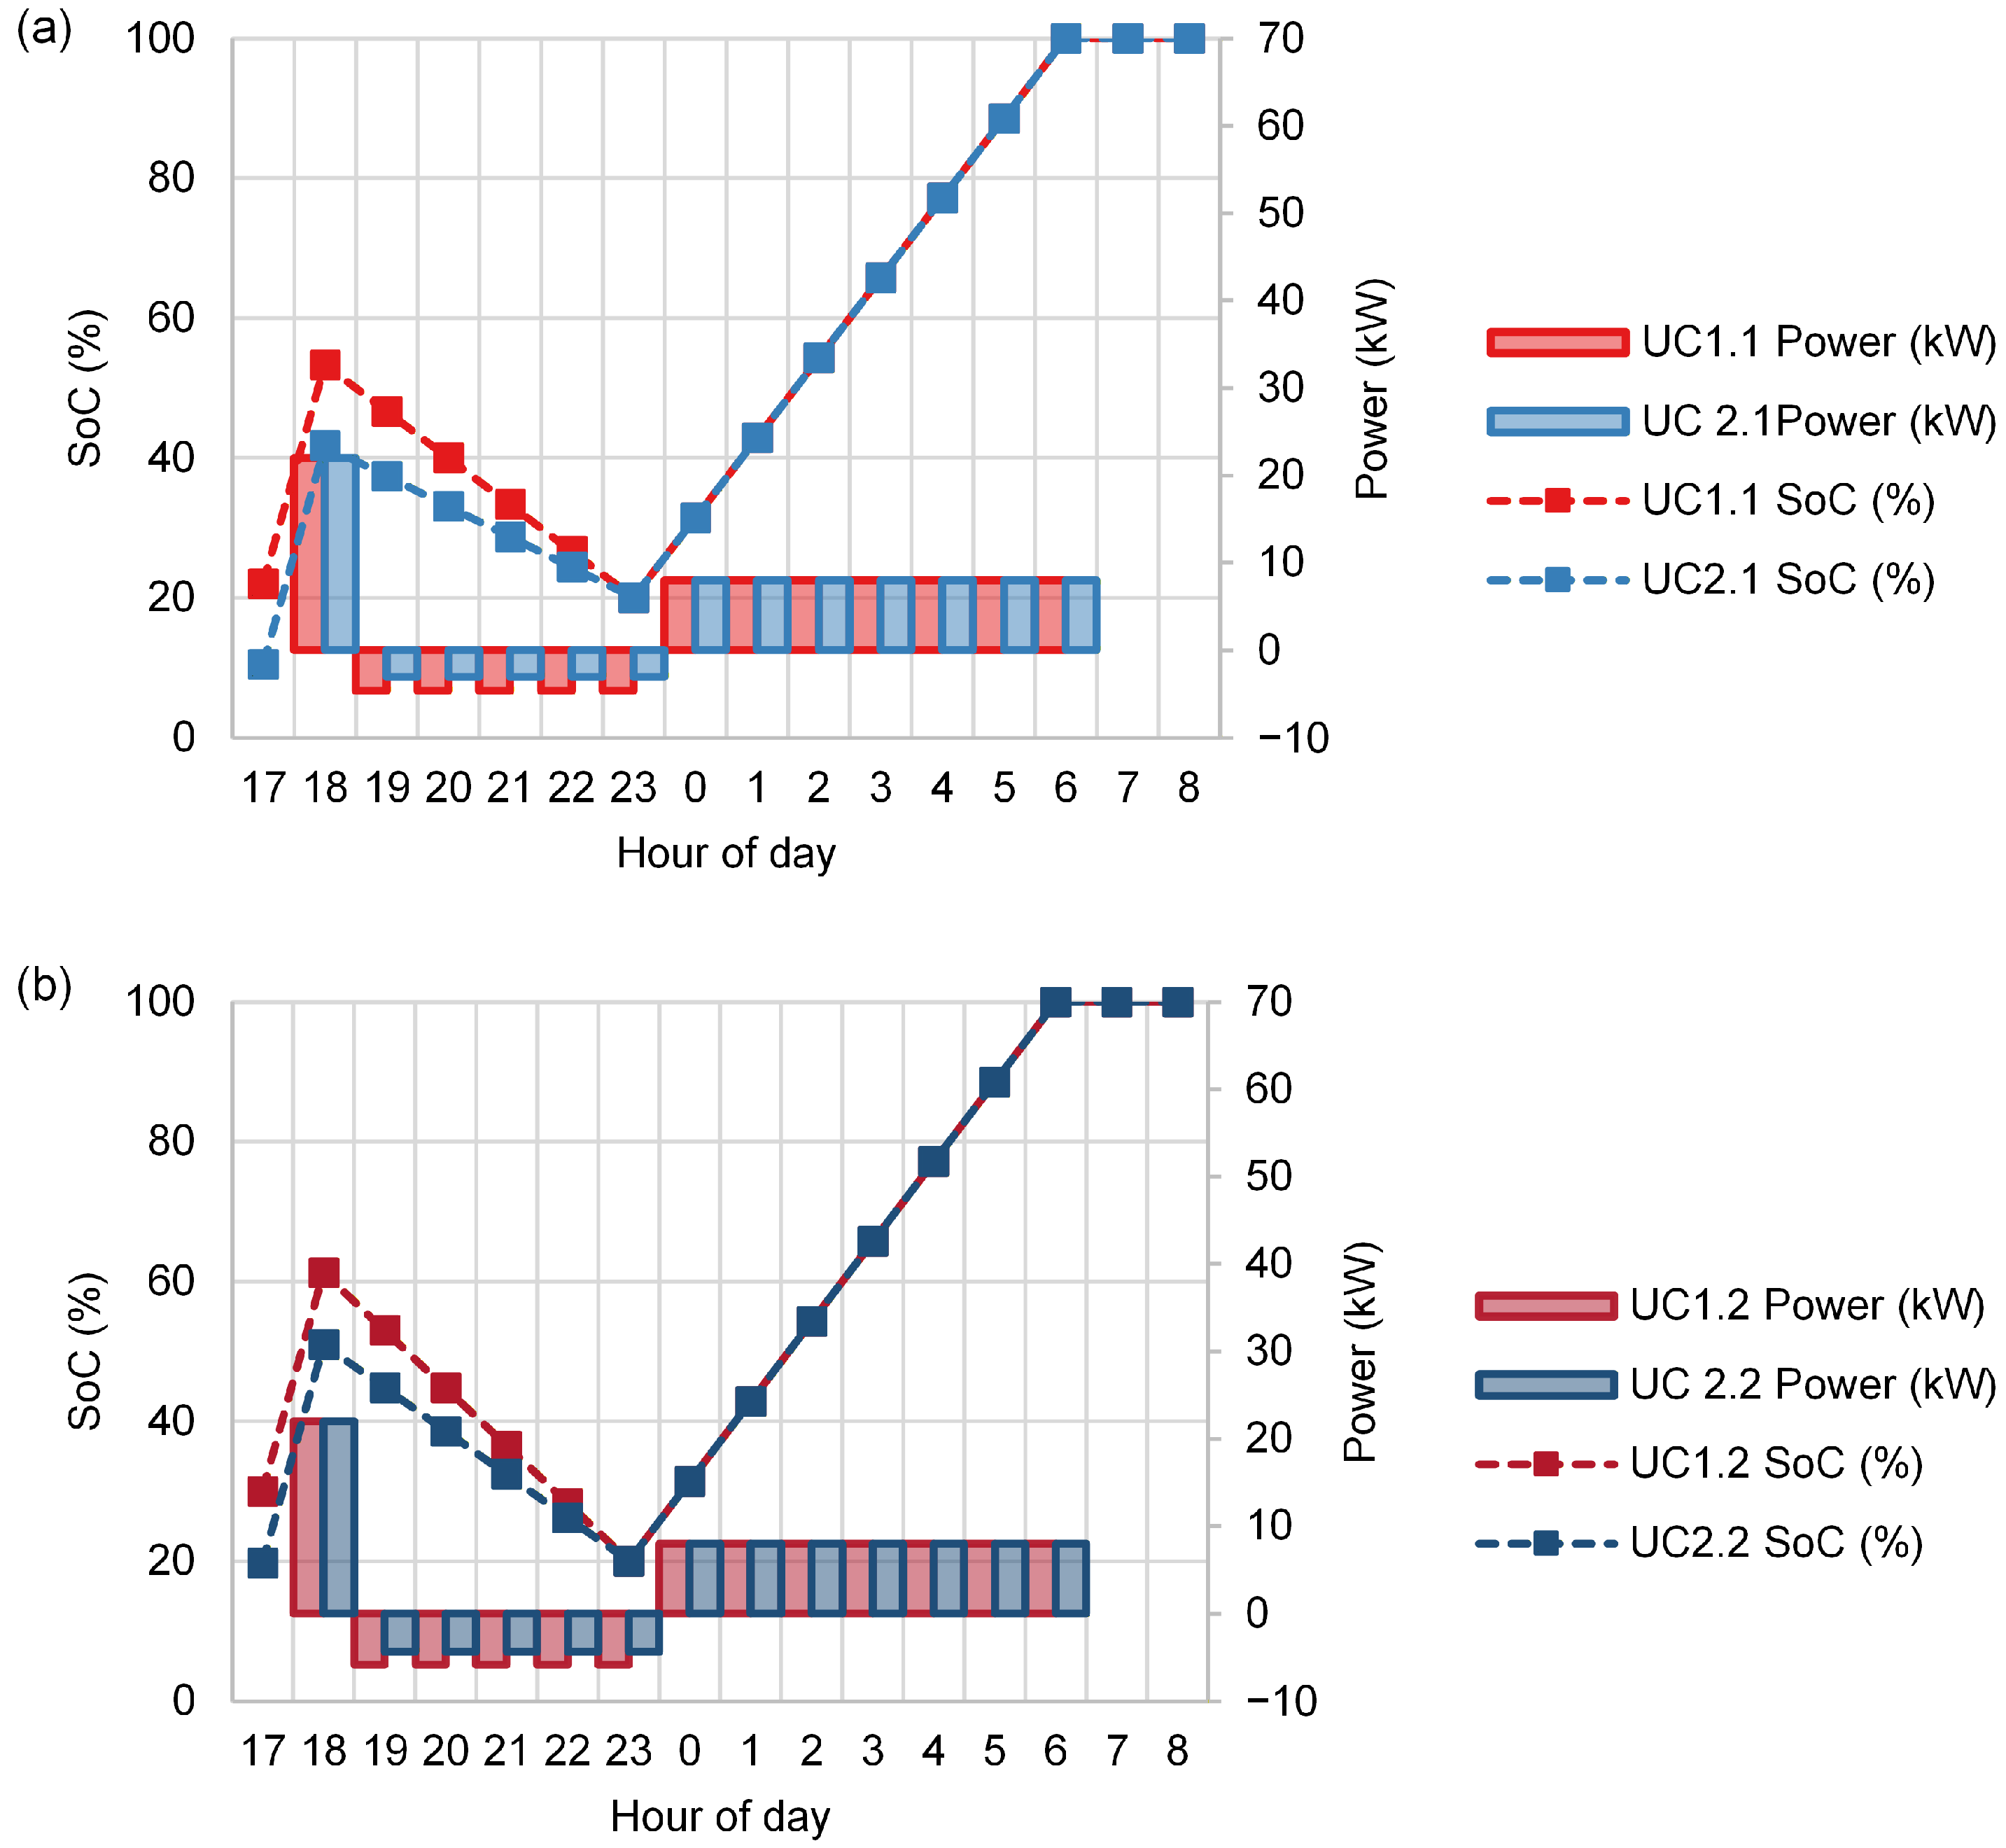
Figure 12 shows the eLCV charge and discharge profiles for the strategies in Table 9. All scenarios charge for one hour from 17:00 to 18:00 and then discharge during the first demand peak from 18:00 to 23:00 to a final SoC of 20%. The battery is subsequently recharged to full SoC by the end of the off-peak period.
Figure 12.
eLCV battery SoC and charging/discharging power during the overnight V2X phase for (a) the 50 kW DC + 22 kW AC and (b) the 80 kW DC + 22 kW AC lunch-break charging strategies under summer and winter conditions.
Charging strategy UC1.2 (80 kW DC + 22 kW AC during summer) in Figure 12b has the largest discharge power of 5.8 kW, while strategy UC2.1 (50 kW DC + 22 kW AC during winter) has the lowest at 3.1 kW. This difference shows how higher-power midday recharging and lower warm-weather driving demand preserve more post-route energy for V2X. Using the unrounded discharge powers, at least 24 eLCVs are needed for UC1.2 and 46 eLCVs for UC2.1 to meet the approximately 138.9 kW warehouse demand. Thus, charging strategy and seasonal energy consumption propagate directly to the fleet scale required to provide the same warehouse-support service.
From 23:00 to 6:00, the vehicle charges at approximately 8 kW to restore the battery to full charge by 6:00. Discharge during the second demand peak from 6:00 to 8:00 is excluded so that the vehicle starts the morning drive phase fully charged.
3.2.5. Impact of V2G on eLCV Battery Life
The 800-EFC EoL reference established in Section 3.1.5 is applied to all eLCV scenarios for a consistent comparison. Daily EFC rates with and without V2G are calculated for each scenario and used to estimate operating lifetime and cumulative avoided electricity purchase cost. The assumed 800-EFC lifetime does not affect the relative EFC throughput-rate increase reported in Table 10, which is determined from the ratio of the daily EFC rates with and without V2G. Rather, it determines the absolute estimated lifetime used in the cumulative economic calculation of Equation (8).
Table 10.
Battery throughput and economic effects of V2G for the eLCV scenarios.
Applying the same procedure as in Section 3.1.5, scenario UC1.1 is used to illustrate the eLCV calculation. Equation (2) gives a summer energy consumption of 47.9 kWh for each 150 km driving phase, equivalent to 31.9 kWh/100 km and approximately 95.7 kWh over the 300 km daily route. The corresponding SoC after the morning drive phase is 31.9%. Including the intermediate lunch-break charge gives /day or cycles/day without V2G. Adding the charge consumption of V2G using Equation (7), the total becomes cycles/day, corresponding to a 24.5% increase in daily EFC throughput. Under the adopted fixed-EFC EoL assumption, this corresponds to an equivalent reduction in cycling-based lifetime. The five-hour V2G period supplies 23.4 kWh. At the Belgian electricity price reference of 0.3571 EUR/kWh, this corresponds to a daily avoided electricity purchase cost of EUR 8.37 and an estimated summer cumulative avoided electricity purchase cost of EUR 1974.21 according to Equation (8).
Table 10 summarizes these calculations for UC1.1 and the corresponding results for UC2.1, UC1.2, and UC2.2. The combined summer–winter avoided electricity purchase cost for UC1.1 and UC2.1 is EUR 3228.00 (USD 3647.64), equivalent to 45.6% of the adopted battery cost reference based on the battery cost considered in Section 3.1.5. For the higher-power charging strategy, the combined avoided electricity purchase cost for UC1.2 and UC2.2 increases to EUR 4032.97 (USD 4557.26), equivalent to 57.0% of the adopted battery cost reference. These results show that the gross value of V2G-supplied energy can be substantial relative to the adopted battery cost reference under the investigated assumptions, but it remains a gross valuation rather than a net economic result. The magnitude of this gross value, however, depends on the assumed battery cycle life.
As a sensitivity check on the adopted cycle-life reference, the experimentally reported standard deviation of 377 cycles in the MIT-Stanford dataset was considered around its mean lifetime of 806 cycles, corresponding to an illustrative one-standard-deviation range of approximately 429–1183 cycles [24]. Because the relative EFC throughput-rate increase is independent of the assumed EoL cycle count, the percentages reported in Table 7 and Table 10 remain unchanged. The absolute lifetime and cumulative avoided electricity purchase cost, however, scale with the assumed cycle-life reference. Over this empirical sensitivity range, the cumulative avoided electricity purchase cost relative to the adopted battery cost reference varies from approximately 18.2–50.3% for the passenger EV, 24.5–67.4% for the 50 kW eLCV charging strategy, and 30.6–84.3% for the 80 kW strategy. These ranges illustrate the sensitivity of the gross economic valuation to battery lifetime while preserving the comparative EFC-based trends among the investigated scenarios.
The present EFC throughput results should be distinguished from direct degradation metrics reported in recent V2X studies. Sagaria et al. [13] reported an approximately 9–14% increase in modeled battery degradation over 10 years under the investigated V2G scenarios, whereas Gong et al. [9] observed only a 3.09 percentage-point SoH spread among the investigated V2X and reference strategies after 20 months. Zhang et al. [36] further showed that optimized V2G scheduling can reduce equivalent full-cycle count by 8.4% relative to conventional scheduling. These values are not direct numerical benchmarks for the present results because the vehicle duty cycles, battery models, tariffs, V2X services, and control objectives differ among the studies. They nevertheless reinforce that the battery impact of V2X is strongly strategy-dependent. Accordingly, the 13.2–30.3% values reported here quantify additional daily EFC throughput imposed by the investigated fixed use case schedules rather than directly predicted capacity fade. This distinction is also consistent with the physics-based analysis of Movahedi et al. [37], which shows that the V2G throughput-lifetime trade-off depends on the dominant degradation mechanism.
Taken together, the passenger EV and eLCV results indicate that V2X availability is an outcome of the complete daily energy schedule rather than a stand-alone battery constraint. In the passenger EV case, the dominant limitation is the timing of V2G relative to the next mobility requirement, whereas the eLCV case is more strongly constrained by its energy-intensive duty cycle and the charging power available during the operating day. A V2X-enabled BMS should therefore treat mobility reserve, the next charging opportunity, available charging power, ambient-condition-dependent energy demand, and the requested V2X service as coupled scheduling constraints rather than independent operating limits.
3.3. Limitations of the Analysis
The EFC-based assessment remains a first-order throughput comparison rather than a chemistry-specific degradation model. The experimental cycle-life reference incorporates substantial variability associated with fast-charging rate and charging policy, as well as the associated self-heating observed in the MIT-Stanford experiments. However, the source dataset uses a fixed LFP/graphite chemistry, controlled chamber temperature, and identical high-rate discharge conditions. Consequently, the present analysis does not explicitly resolve the independent effects of ambient temperature, discharge rate, depth of discharge, average SoC, calendar aging, or their interactions. Charger and converter losses are also not explicitly represented in the calculated energy exchanges and economic estimates. In addition, recharge electricity expenditure following V2G discharge is not deducted, and time-varying import tariffs, V2G export/remuneration tariffs, and explicit price arbitrage are outside the present scope. Consequently, the reported avoided electricity purchase cost is a gross valuation of V2G-supplied energy and should not be interpreted as net savings, revenue, or profit. The resulting lifetime estimates and gross economic values should therefore be interpreted as scenario-level comparative estimates rather than predictions of the exact service life of the investigated vehicle batteries or net V2G profitability.
4. Conclusions
Beyond the operational scenarios introduced in the preliminary EVS 38 study [15], the present work extends the framework with data-derived residential demand profiles, EFC-based battery-throughput analysis, and a coupled lifetime–economic evaluation of V2X operation. By avoiding the common simplifications of treating EVs as idealized storage systems and analyzing driving, charging, and V2X services separately, the proposed framework enables a more comprehensive evaluation of end-to-end system performance under practical constraints.
The results show clear operational differences between vehicle classes. Passenger EVs primarily rely on overnight charging strategies, whereas eLCVs require a combination of fast charging during operation and slow charging overnight to sustain their duty cycles. Ambient temperature also strongly influences energy consumption and driving range, particularly under cold conditions with increased auxiliary heating demand. From a V2X perspective, the analysis highlights a clear trade-off between gross economic value and additional battery throughput. In the passenger EV scenarios, V2G increases the estimated daily EFC throughput rate by 13.2–15.9%, whereas the eLCV scenarios show increases of 14.3–30.3%, depending on season and charging strategy. For the eLCV, the combined summer–winter avoided electricity purchase cost reaches approximately EUR 3228 for the 50 kW DC + 22 kW AC strategy and EUR 4033 for the 80 kW DC + 22 kW AC strategy, equivalent to 45.6% and 57.0% of the adopted battery cost reference, respectively. These results indicate that the gross value of V2G-supplied energy can be meaningful relative to the additional battery throughput under the investigated scenario assumptions. Net V2G profitability is not evaluated because recharge energy expenditure, tariff differentials, and charging/discharging conversion losses are outside the present model scope. The magnitude of the gross value remains dependent on the adopted operating, economic, and battery lifetime assumptions. A definitive assessment of the net economic degradation trade-off would require both a more detailed battery-aging model and explicit modeling of recharge costs, tariffs, and conversion losses.
Overall, the proposed framework provides a holistic and practically grounded basis for evaluating future-proof V2X use cases, supporting the design of advanced BMS strategies that balance mobility requirements, battery lifetime, and economic performance. The results confirm the potential of V2X-enabled EVs to act as flexible distributed energy resources, contributing to grid stability, renewable energy integration, and improved energy utilization in next-generation transportation systems.
Author Contributions
Conceptualization, C.-L.G., P.-N.G., L.C., S.C. and O.H.; methodology, R.A.S.P., O.-F.J., P.R., C.-L.G., P.-N.G., L.C. and S.C.; formal analysis, R.A.S.P., O.-F.J., P.R., C.-L.G., P.-N.G., L.C. and S.C.; investigation, R.A.S.P., O.-F.J., P.R., C.-L.G., P.-N.G. and L.C.; resources, R.A.S.P., O.-F.J., C.-L.G., P.-N.G. and L.C.; data curation, R.A.S.P., O.-F.J., P.R., C.-L.G., P.-N.G., L.C. and S.C.; writing—original draft preparation, R.A.S.P., O.-F.J. and P.R.; writing—review and editing, R.A.S.P., O.-F.J., P.R., C.-L.G., P.-N.G., L.C., S.C. and O.H.; visualization, R.A.S.P., O.-F.J., P.R., C.-L.G., P.-N.G. and L.C.; supervision, S.C. and O.H.; project administration, S.C. and O.H.; funding acquisition, S.C. and O.H. All authors have read and agreed to the published version of the manuscript.
Funding
This research received funding from the European Union’s Horizon Europe research and innovation program under grant number 101137975 (InnoBMS). The views and opinions expressed are, however, those of the authors only and do not necessarily reflect those of the European Union. Neither the European Union nor the granting authority can be held responsible for them. The authors also acknowledge Flanders Make for its support of the research group.
Institutional Review Board Statement
This article uses interview-derived data previously analyzed and reported in the publicly available InnoBMS Deliverable D1.2, V2X Capabilities, Bidirectional Interfaces and Related Critical Load Scenarios Including Cloud Connectivity. Under the Vrije Universiteit Brussel (VUB) Ethical Committee for Human Sciences (ECHW) Statement Regarding Ethical Review for Use of Existing Survey and Secondary Data, qualifying secondary-data research does not require submission for ethical review.
Informed Consent Statement
The interviews were conducted by Robert Bosch SRL with courier-company representatives acting in their professional capacity and concerned company-level eLCV operations and charging requirements. Participants were informed of the purpose of the interviews and provided verbal informed consent; no separate written consent form was used.
Data Availability Statement
The original contributions presented in this study are included in the article. Further inquiries can be directed to the corresponding author.
Acknowledgments
During the preparation of this manuscript, the authors used ChatGPT (GPT-5.6, OpenAI) for editorial assistance, recommendations regarding figure aesthetics and readability, and secondary cross-checking of selected calculations and manuscript consistency. The authors have reviewed and edited the output and take full responsibility for the content of this publication.
Conflicts of Interest
This research was funded by the European Union’s Horizon Europe through the InnoBMS project, as disclosed in the Funding section. Authors O.-F.J., C.-L.G., P.-N.G., and L.C. are employed by Robert Bosch SRL, an InnoBMS consortium partner. The remaining authors declare no other conflicts of interest. The funding agency had no role in the design of the study; in the collection, analyses, or interpretation of data; in the writing of the manuscript; or in the decision to publish the results.
References
- Guias, C.L.; Guta, P. V2X Capabilities, Bidirectional Interfaces and Related Critical Load Scenarios Including Cloud Connectivity. Report D1.2, InnoBMS. 2024. Available online: https://innobms.eu/deliverable-report-2-1/ (accessed on 10 August 2026).
- Rehman, M.A.; Numan, M.; Tahir, H.; Rahman, U.; Khan, M.W.; Iftikhar, M.Z. A comprehensive overview of vehicle to everything (V2X) technology for sustainable EV adoption. J. Energy Storage 2023, 74, 109304. [Google Scholar] [CrossRef] [Scilit]
- Amer, M.; Masri, J.; Dababat, A.; Sajjad, U.; Hamid, K. Electric vehicles: Battery technologies, charging standards, AI communications, challenges, and future directions. Energy Convers. Manag. X 2024, 24, 100751. [Google Scholar] [CrossRef] [Scilit]
- Saxena, S.; Farag, H.E.Z.; Hilaire, L.S.; Brookson, A. A techno-social approach to unlocking vehicle to everything (V2X) integration: A real-world demonstration. IEEE Access 2023, 11, 17085–17095. [Google Scholar] [CrossRef] [Scilit]
- Gschwendtner, C.; Sinsel, S.R.; Stephan, A. Vehicle-to-X (V2X) implementation: An overview of predominate trial configurations and technical, social and regulatory challenges. Renew. Sustain. Energy Rev. 2021, 145, 110977. [Google Scholar] [CrossRef] [Scilit]
- Güldorum, H.C.; Diaz-Cachinero, P.; Muñoz-Delgado, G.; Contreras, J. Unlocking the potential of battery charging and swapping stations: Achieving fully flexible operation via B2X and V2X integration. IEEE Trans. Transp. Electrif. 2025, 11, 11041–11053. [Google Scholar] [CrossRef] [Scilit]
- Talaat, F.M.; Shaban, W.M.; ZainEldin, H.; Badawy, M.; Elhosseini, M. Integrating V2X solutions in intelligent green cities: An AI-driven point exchange system approach. Neural Comput. Appl. 2025, 37, 15311–15343. [Google Scholar] [CrossRef] [Scilit]
- Maeng, J.; Min, D.; Kang, Y. Intelligent charging and discharging of electric vehicles in a vehicle-to-grid system using a reinforcement learning-based approach. Sustain. Energy Grids Netw. 2023, 36, 101224. [Google Scholar] [CrossRef] [Scilit]
- Gong, J.; Wasylowski, D.; Figgener, J.; Bihn, S.; Rücker, F.; Ringbeck, F.; Sauer, D.U. Quantifying the impact of V2X operation on electric vehicle battery degradation: An experimental evaluation. eTransportation 2024, 20, 100316. [Google Scholar] [CrossRef] [Scilit]
- Thompson, A.W.; Perez, Y. Vehicle-to-everything (V2X) energy services, value streams, and regulatory policy implications. Energy Policy 2020, 137, 111136. [Google Scholar] [CrossRef] [Scilit]
- Khezri, R.; Steen, D.; Wikner, E.; Tuan, L.A. Optimal V2G scheduling of an EV with calendar and cycle aging of battery: An MILP approach. IEEE Trans. Transp. Electrif. 2024, 10, 10497–10507. [Google Scholar] [CrossRef] [Scilit]
- Tao, Y.; Chen, Y.; Huang, M.; Yang, L.; Wei, C. Research on data-driven V2G charging and discharging strategy. J. Energy Storage 2026, 156, 121552. [Google Scholar] [CrossRef] [Scilit]
- Sagaria, S.; Van Der Kam, M.; Boström, T. Vehicle-to-grid impact on battery degradation and estimation of V2G economic compensation. Appl. Energy 2025, 377, 124546. [Google Scholar] [CrossRef] [Scilit]
- Leippi, A.; Fleschutz, M.; Davis, K.; Klingler, A.L.; Murphy, M.D. Optimizing electric vehicle fleet integration in industrial demand response: Maximizing vehicle-to-grid benefits while compensating vehicle owners for battery degradation. Appl. Energy 2024, 374, 123995. [Google Scholar] [CrossRef] [Scilit]
- Peña, R.A.S.; Guias, C.L.; Rahmani, P.; Guta, P.; Cretu, L.; Chakraborty, S.; Hegazy, O. V2X scenarios analysis for future-proof battery management systems. In Proceedings of the 38th International Electric Vehicle Symposium and Exhibition (EVS 38), Göteborg, Sweden, 15–18 June 2025; pp. 1–12. Available online: https://evs38-program.org/images/Proceedings/E%20Electric%20Storage%20Systems/359_V2X%20Scenarios%20Analysis%20for%20Future-Proof%20Battery.pdf (accessed on 10 August 2026).
- European Alternative Fuels Observatory. EU Classification of Vehicle Types. Available online: https://alternative-fuels-observatory.ec.europa.eu/general-information/vehicle-types (accessed on 10 August 2026).
- ECE/TRANS/180/Add.15/Amend.6; UN Global Technical Regulation No. 15: Worldwide Harmonized Light Vehicles Test Procedure (WLTP), Amendment 6; United Nations Economic Commission for Europe (UNECE): Geneva, Switzerland, 2021; Available online: https://unece.org/sites/default/files/2022-06/ECE-TRANS-180a15am6e.pdf (accessed on 10 August 2026).
- Anvari, M.; Proedrou, E.; Schäfer, B.; Beck, C.; Kantz, H.; Timme, M. Data-driven load profiles and the dynamics of residential electricity consumption. Nat. Commun. 2022, 13, 4593. [Google Scholar] [CrossRef] [Scilit]
- Schäfer, B.; Anvari, M.; Proedrou, E. Data-Driven Load Profiles and the Dynamics of Residential Electricity Consumption. 2023. Available online: https://osf.io/yu2dm (accessed on 10 August 2026).
- Eurostat. Electricity Price Statistics. Available online: https://ec.europa.eu/eurostat/statistics-explained/index.php?title=Electricity_price_statistics (accessed on 10 August 2026).
- Lechner, M.; Kollenda, A.; Bendzuck, K.; Burmeister, J.K.; Mahin, K.; Keilhofer, J.; Kemmer, L.; Blaschke, M.J.; Friedl, G.; Daub, R.; et al. Cost modeling for the GWh-scale production of modern lithium-ion battery cells. Commun. Eng. 2024, 3, 155. [Google Scholar] [CrossRef] [Scilit]
- Ang, E.Y.M.; Paw, Y.C. Efficient linear predictive model with short term features for lithium-ion batteries state of health estimation. J. Energy Storage 2021, 44, 103409. [Google Scholar] [CrossRef] [Scilit]
- Gong, D.; Gao, Y.; Kou, Y.; Wang, Y. State of health estimation for lithium-ion battery based on energy features. Energy 2022, 257, 124812. [Google Scholar] [CrossRef] [Scilit]
- Severson, K.A.; Attia, P.M.; Jin, N.; Perkins, N.; Jiang, B.; Yang, Z.; Chen, M.H.; Aykol, M.; Herring, P.K.; Fraggedakis, D.; et al. Data-driven prediction of battery cycle life before capacity degradation. Nat. Energy 2019, 4, 383–391. [Google Scholar] [CrossRef] [Scilit]
- Wang, F.; Zhai, Z.; Zhao, Z.; Di, Y.; Chen, X. Physics-informed neural network for lithium-ion battery degradation stable modeling and prognosis. Nat. Commun. 2024, 15, 4332. [Google Scholar] [CrossRef] [Scilit]
- Peng, S.; Sun, Y.; Liu, D.; Yu, Q.; Kan, J.; Pecht, M. State of health estimation of lithium-ion batteries based on multi-health features extraction and improved long short-term memory neural network. Energy 2023, 282, 128956. [Google Scholar] [CrossRef] [Scilit]
- Scheiwiller, M. Lappemic/Open-Source-Battery-Data. Available online: https://github.com/lappemic/open-source-battery-data (accessed on 10 August 2026).
- Data-Driven Prediction of Battery Cycle Life Before Capacity Degradation. 2019. Available online: https://data.matr.io/1/projects/5c48dd2bc625d700019f3204 (accessed on 10 August 2026).
- Center for Advanced Life Cycle Engineering (CALCE). Battery Data: Prismatic Cells. Available online: https://calce.umd.edu/battery-data#CS2 (accessed on 10 August 2026).
- He, W.; Williard, N.; Osterman, M.; Pecht, M. Prognostics of lithium-ion batteries based on Dempster–Shafer theory and the Bayesian Monte Carlo method. J. Power Sources 2011, 196, 10314–10321. [Google Scholar] [CrossRef] [Scilit]
- Xing, Y.; Ma, E.W.M.; Tsui, K.L.; Pecht, M. An ensemble model for predicting the remaining useful performance of lithium-ion batteries. Microelectron. Reliab. 2013, 53, 811–820. [Google Scholar] [CrossRef] [Scilit]
- Williard, N.; He, W.; Osterman, M.; Pecht, M. Comparative analysis of features for determining state of health in lithium-ion batteries. Int. J. Progn. Health Manag. 2013, 4, 1–7. [Google Scholar] [CrossRef] [Scilit]
- Bibak, B.; Tekiner-Moğulkoç, H. A comprehensive analysis of vehicle to grid (V2G) systems and scholarly literature on the application of such systems. Renew. Energy Focus 2021, 36, 1–20. [Google Scholar] [CrossRef] [Scilit]
- Hernández, J.C.; Ruiz-Rodriguez, F.J.; Jurado, F. Modelling and assessment of the combined technical impact of electric vehicles and photovoltaic generation in radial distribution systems. Energy 2017, 141, 316–332. [Google Scholar] [CrossRef] [Scilit]
- Bajolle, H.; Lagadic, M.; Louvet, N. The future of lithium-ion batteries: Exploring expert conceptions, market trends, and price scenarios. Energy Res. Soc. Sci. 2022, 93, 102850. [Google Scholar] [CrossRef] [Scilit]
- Zhang, Q.; Ikram, M.; Xu, K. Online optimization of vehicle-to-grid scheduling to mitigate battery aging. Energies 2024, 17, 1681. [Google Scholar] [CrossRef] [Scilit]
- Movahedi, H.; Pannala, S.; Siegel, J.; Harris, S.J.; Howey, D.; Stefanopoulou, A. Extra throughput versus days lost in V2G services: Influence of dominant degradation mechanism. J. Energy Storage 2024, 104, 114242. [Google Scholar] [CrossRef] [Scilit]





Disclaimer/Publisher’s Note: The statements, opinions and data contained in all publications are solely those of the individual author(s) and contributor(s) and not of MDPI and/or the editor(s). MDPI and/or the editor(s) disclaim responsibility for any injury to people or property resulting from any ideas, methods, instructions or products referred to in the content. |
© 2026 by the authors. Published by MDPI on behalf of the World Electric Vehicle Association. Licensee MDPI, Basel, Switzerland. This article is an open access article distributed under the terms and conditions of the Creative Commons Attribution (CC BY) license.